Highlights
- ore (Sn, gems) formation in Trans-Deposits TPD
- pegmatites LCT/NYF
- S- and A-type granites
- chemical evolution of pegmatites (polarizability)
Abstract
During the magmatic stage, base and rarer metals segregate from silicate melts to form ore deposits. The usual case is the porphyry (PD) type (Cu, Mo, and W) above subduction zones. The metal grade increases from some ppb or ppm up to percent levels. A new type of trans-porphyry (TPD) deposits (Sn, Ta, Nb, and gems) results from large-scale shear between cratons within continental plates, internal decoupling, and vertical motion. The bulk ore generation process develops along three stages: from magma generation, emplacement, and the formation of an immiscible magmatic phase (MIP), fluids, and melt. However, in TPD, metals segregate from the crust during melting below 800 °C, biotites break down, and the melt remains below the critical point (731 °C). Fluid advection competes with chemical diffusion, yielding the required enrichment. The subcritical MIP splits into a silicate-rich and an aqueous-rich phase, which are both incompatible with each other. Granite, pegmatites, and greisen coexist in the magma chamber. Their respective extraction from a composite mush involves electron exchanges between charges, or orbitals, yielding metal oxides through chemical diffusion. In contrast, in metals (Nb and Ta) observed in pegmatites, and also in gems, electrons rearrange their electronic cloud through their polarizability. Lastly, gems independently grow under the influence of the extremely hard fluids (Li, Be, and B). Magma generation, involving the lower crust (garnet and pyroxene), results in melts that form the two observed pegmatite groups (NYF and LCT), with each being associated with alkaline (A-type) or continental (S-type) granitic melts.
1. Introduction
1.1. Magma and Ore
Ore deposits of economic interest traditionally relate to magmatic activity depending on the tectonic settings, e.g., [1]. Initially, metals are present in the continental crust in proportions ranging from ppb to ppm. They are transported and concentrated into magmas during crustal melting due to thermal anomalies. This initial episode is a phase change and thus pertains to energy exchanges between its three components: temperature (T) and entropy (S); stress (σ) and strain (ε); and chemical potential (µ) and amount (N). All materials are considered viscous.
The conditions of metal transportation during melt emplacement and late individualisation are still partly debated. Ultimately, metals can enter crystalline phases into minerals or segregate to form specific ore minerals. The common ore grade may reach the percent level in some deposits of economic interest. The formation of magmatic ore, such as porphyry deposits (PDs), is equivalent to solving the enrichment of a specific element by a factor of four to six orders of magnitude. Three major hypotheses have been explored [2], which include source enrichment, chemical evolution of the magma, and late hydrothermal activity.
The first case relies on the observation of linear belts of such porphyries, suggesting an anomalous content in metals, either in the crust [3] or the mantle [4,5]. Nevertheless, enrichment rarely exceeds a maximum of one order of magnitude, far from the expected values.
The second model involves magmatic evolution through differentiation with magma specialization towards one metal, with eventual magma re-intrusion in a former body. This has been the preferred model for a long time [6,7], linked with the selective diffusion of elements.
The last model implies ultimate hydrothermal activity, illustrated by fluid inclusions in the rocks and alterations in the surroundings. It manifests through the exsolution of an immiscible fluid phase at the magmatic stage (MIP), followed by the brecciation of the surrounding rocks, vein formation, and hydrated mineral deposition [8,9].
1.1.1. Ore Formation in PD and MA
As a good example, in the continental crust, base (e.g., Cu, W, and Mo) and rare metals (Au and Ag) link with intermediate felsic magmas. They develop in linear belts of porphyry deposits (PDs), the heat source of which is provided by an underlying oceanic plate subduction (Sillitoe, [10]). This represents an infinite heat source at the scale of a magma chamber. Within plates, efficient heat sources may have a deeper origin, giving way to mafic intrusions (MAs) and sulfide metal assemblages (Ni and Cu), including platinum group elements (PGEs) [11]. Other tectonic settings need to benefit from a perennial heat source to drive magmatic activity. Such magmatic bodies have been grouped into trans-porphyry deposits (TPDs) since they develop in oblique plate convergence, yielding trans-pression/tension [12] with specific thermal conditions. They have consequences for the physical parameters of the magma (temperature, viscosity, and fluid content) and metal attractivity (chemical potential and diffusivity), whereas the ambient stress pattern may control partial melt extraction and interactions with the mobile fluid phases.
Briefly, ore formation in PDs or MAs can be summarized as melting, followed by the segregation, transport, and concentration of metals under one of the three phases (solid, melt, and fluid). The physical conditions of segregation and transport are addressed through viscosity, diffusivity, permeability, and the amount of fluid [13]. Furthermore, the metal attractivity for each phase pertains to chemistry.
1.1.2. The Specific Case of TPDs
TPDs also develop in linear belts due to the intense shearing between older and stiffer cratons. The differential motion between the cratons and the sheared crust represents a moderate heat source that may induce melting and magma chamber construction. This may vary with time according to the plate convergence, introducing rheological decoupling within the crust and vertical motion [14]. Heterogeneities within the sheared crust also modify the near-field stress pattern, leading to the formation of magmas, which are either derived from the crust or from the adjacent lower portion of cratons. Such melts liberate metals that are later incorporated into one of the three phases of presence (solid, melt or fluid), except that they all originate from the continental crust, and not from the mantle, as for PDs. Their segregation and transport develop as in the PD, with the restriction that the temperature remains moderate, below 731 °C, maintaining the fluids in a subcritical state [15]. Accordingly, the temperature does not enhance metal diffusion, nor does it promote fluidity in the melt.
As a result, the process of ore formation shifts from a chemical multiphase flow problem (T and m) in PD towards a mechanical problem (T, µ, and σ) in TPD.
Nevertheless, the problem increases in complexity since magma develops in a subcritical state [12]. The MIP splits into two incompatible phases (Figure 1), one silicate-rich and the other aqueous-rich [16]. In consequence, the bulk magma chamber incorporates three sub-chambers, which independently evolve. Ore formation results in common ore minerals in the form of pegmatites and greisen, which are coarse-grained, equivalent to granite, but located in individualized pockets, as well as gemstones that form from the MIP components.
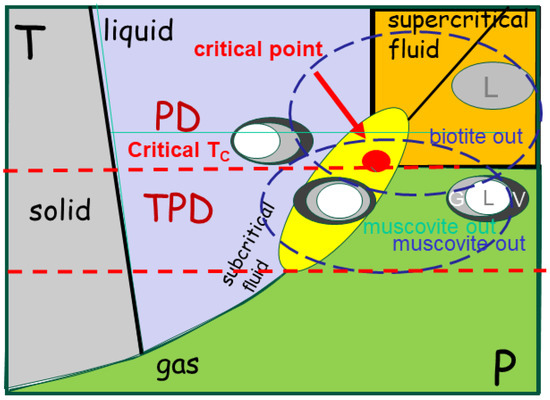
Figure 1.
Schematic representation of phase change mapping under subcritical conditions. The system passes through the solid, liquid, and fluid conditions, whereas the gas phase is reached at high pressure. Melting is scaled as minerals (muscovite, biotite and amphibole) are involved. At 731 °C, the critical temperature, the fluid phase splits in two MIPs (liquid, vapour, glass), as illustrated by the melt inclusions (MI). The system cools from the supercritical state, where solubility is quasi-infinite. MPIs become subcritical, splitting into a silicate-rich and a fluid-rich phase, as observed in the melt inclusions.
1.1.3. Previous Models
Basically, two types of models have been designed to simulate the formation of ore deposits: the Eulerian and Lagrangian approaches [17] In the first case, an analytical approach describes the bulk system using an external frame, whereas a description of a discrete element attached to the system characterizes the second method.
The Eulerian description requires fixed system parameters, such as magma composition, temperature, melt viscosity, and near-field stress conditions. Chemistry rules are used to partition elements between the different phases, quantifying enrichment. This is the most debated, and most uncompleted, data base [18] The latter values are used to fix the enrichment factors for metals. However, the description remains imprecise in face of the randomly distributed different phases, leaving the interaction between them and their instabilities unexplored.
In contrast, techniques using Lagrangian descriptions, such as lattice Boltzmann models (LBM), examine the interactions between neighbouring particles (gas, metal, melt). They provide estimates of shape evolution and metal enrichment, bracketed according to the ratio of partitioning between metals and MIP [19].
Both types of models provide solutions, which are unique in the direct problem and not too far from truth in the second but strongly dependent on the input conditions, that remain quite uncertain. See, for instance, the discussion about the amount and content of the additional elements (F, Li, Be) in the MIP, for which there is no direct constraint, since the MIP evaporates at the end of ore generation [11].
1.2. Energy Considerations
In consequence of the problems presented above, a different approach, including thermodynamics and energy considerations is suggested, which involves interactions and instabilities.
The origin of metal extraction, segregation, and transport before forming ore deposits is undoubtedly linked to magma production in the continental crust. Restricting their formation to particular continents does not modify these premises. However, addressing ore genesis from the perspective of a phase change supposes the energy budget is considered, and thus requires an examination of the different components of free energy, provided the system remains closed, avoiding the effects of dissipating components.
1.2.1. Energy and Melting
Magma melting is not simply an effect of temperature increases. Such an effect is primordial and produce mobile melting, but it also has consequences for the physico-chemical properties of the melt components. Temperature modifications generally enhance melt displacement. They also influence the exsolving of a composite fluid phase, which, in turn, has an effect on chemical attractivity for ionic metals. Finally, elements must adapt their structure, crystal lattice, or molecule formation, thus varying their entropy.
1.2.2. Energy Exchanges
A phase transition describes the energetic variations in a material involved in a reaction, for example, a transformation from solid to liquid [20]. Many textbooks on thermodynamics exist, mostly referencing solid, liquid, and gas states [21]. The reactions use pressure, temperature, and the amount of chemical element (T, P, Ni) in a function of time (reaction advance), (Figure 2a) with intensive variables such as entropy, volume, and chemical potential (S, V, µi)
dG = V dP − S dT + Si mi dNi
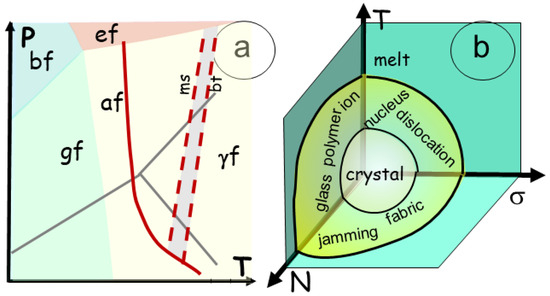
Figure 2.
Phase diagram presented for different situations. (a). Traditional 2D diagram of pression temperature (P, T) for solid/liquid/gas transition with the binary boundaries including a triple point with the three phases in contact and a critical point above which the material enters a supercritical fluid, with disappearance of the meniscus between them. The triple and critical points are specified using their respective pressure and temperature. (b) A 3D phase diagram for crystal/melt modified from a former version of [22]. The usual variables of the energy are used, such as T, S, or temperature and entropy; N, µ, or density and chemical potential; and σ, ε or stress and strain. The binary transition between crystal and melt gives place to a transitional stage, where ions, glass, and polymers develop, creating a fabric, and jamming, and proceeds through nucleation and dislocations. During the phase transition, which commonly involves energy, exchanges occur between the components (S, µ, ε), allowing for the energy variation to be readjusted.
A simple PT diagram is no longer explicit enough, and the system must be considered within a higher-variance diagram (Figure 2b). In igneous rocks, the solid and the liquid phases are both viscous. In a first approach, a compressible gas phase with a restricted amount can be considered soluble in the melt. Therefore, in melt and solids, the energy changes can be expressed in terms of strain (ε), whereas stress (σ) is the applied pressure instead of V and P. The entropy (S) of the system represents its order, which increases from the crystalline network, polymers, and melt. It should evolve to a maximum value [23]. An average chemical potential (µ) and the amount N of chemical elements, taken as the mean value of their composition, may be used as a proxy for the melt and the solid rocks [17]. Consequently, the phase transition should be described with a higher-variance approach, including, at least, T, σ and N, and thus examining the variations in bulk energy along each coordinate and their complex interactions (Figure 2). For instance, enhanced melting or recrystallization (entropy changes) should affect, or be affected by, the melt flow in its components.
dG = ε dσ − S dT + µN
The bulk Gibbs free energy variation resulting from a reaction can be expressed by the difference between the sum of Gibbs free energy of the reactants and the products of the reaction.
1.2.3. The Case of Complex Systems
The evolution of phase transitions during melting (or crystallization) is commonly described in P-T diagrams indicating the physical entropy of the system (liquid, solid) (Figure 3a). For example, melting reactions for hydrous metapelites have been extensively described [24,25].
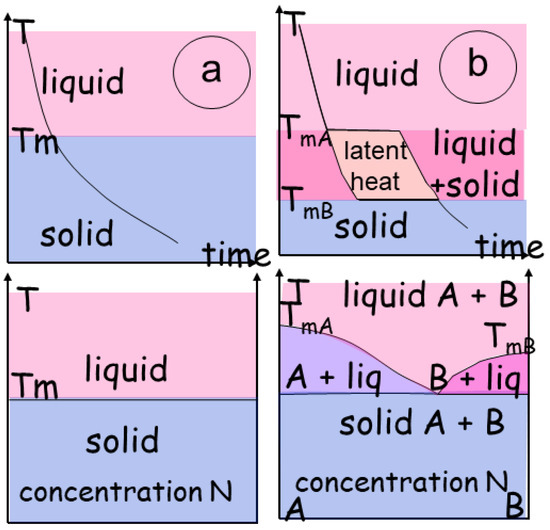
Figure 3.
Two phase transitions, described as T versus time (t) and T versus concentration (N). (a) In a binary transition, a melting temperature (Tm) determines the abrupt change from a solid to a liquid; the concentration, in terms of elements, is similar in both states. (b) Conversely, when the material has several components, the transition adopts the path of the two melting curves for materials TmA and TmB. The result is a domain in which the composition follows the melting curves. The transitional zone may be a single domain, or several coexisting domains with a eutectic point and a eutectic composition determining the lowest melting temperature of the mixture.
A thermodynamic review of metamorphic rocks’ conditions has recently been issued [26]. It extends the simple binary system with no intermediate phases (Figure 3a) so the liquid and the solid coexist in a specific P-T-N range.
When the material incorporates multiple phases (e.g., binary with A and B), the transition goes through a high-variance domain delineated by the melting curves of each material, with a melting temperature (TmA and TmB) that may differ within each individual end-member (Figure 3b). Consequently, a 2D P-T diagram is not sufficient, and a T-N diagram can be introduced to describe the complex system (Figure 3b). A higher-variance domain develops in which a mixture of the end-members co-exists. Depending on the chemical system considered and the number of phases present, the transitional zone may be bivariant or multivariant with a eutectic point. The composition of the solid phase is a function of the lowest melting temperature of the mixture. In this space, energy varies as a function of the amount of each phase depending on P-T or σ-T. The structural effects, imposing order on the crystalline assemblage, are not considered. Energy variations are present and linked to interactions between the other components (S, ε, µ) and (T, σ, N) (Figure 2b). They develop as instabilities and form feedback loops, often minor, during direct modeling of phase transition.
1.3. Establishing the Problem
The complex problem of ore formation in magmatic settings does not start from scratch. It is based on field observations, laboratory observations, and experiments, as well as physico-chemical concepts, including the properties magma components (solid, melt, fluids). Nevertheless, addressing a phase change for a complex multiphase system requires consideration of the free energy balance between the components.
First, the free energy (G) for the melt and matrix relies on three major internal and external forces (Figure 2). These are controlled by temperature (T) and entropy (S), stress (σ) and strain (ε), chemical potential (µi), and the number of reactants (Ni). Their interactions drive the whole system to evolve toward a state of equilibrium characterized by a minimum value of Gibbs free energy. This requires describing a model of probability distributions by selecting the macrostate with the highest entropy [23]. However, system perturbations introduce instabilities, which are mostly irreversible. In addition, the processes of melting, extraction, and crystallization point to an open-system description and non-equilibrium thermodynamics. Since the phase transition does not allow for the system components to escape, a description using a Gibbs free energy may apply.
More commonly, the descriptions of geological processes involve materials with contrasted properties. Those present variations in state or ordering (from a crystal to a liquid), rheology (from solid rocks to viscous lavas), or chemistry (from felsic to mafic). The coexistence of such contrasted properties is a natural factor in instabilities. In addition, earth materials are not binary, e.g., with a weak and strong end-member, but encompass several intermediate phases governing each phase transition. Understanding the processes controlling transitional states and their intertwined mechanical, chemical, and thermodynamical properties should provide insights into their evolution towards equilibrium, providing insights into their instabilities and eventually contributing to predicting the evolution of the entire complex system.
The final aspects of ore formation are also strongly controlled by field observations.
1.3.1. TPD in the Field
The TPDs are characterized by localized intrusions within a transpressional zone of intense shearing [27]. Mechanical decoupling within the crust induces instability in the crust and vertical motion, in addition to the horizontal shear (Figure 4). The magmas are mainly derived from melting of the continental crust, with few traces of mantle-derived magmas and fluids (mafic melts and S compounds). Such magmatic bodies mostly originate during continental shear or very oblique collision.
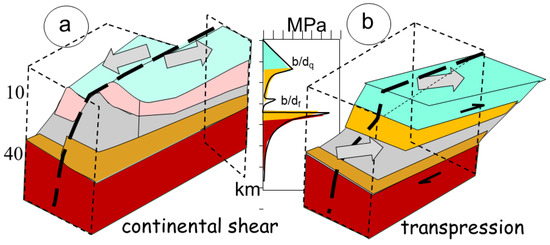
Figure 4.
Regime of continental crust deformation (a) illustrating continental shear, manifested by the horizontal displacement of blocs, without vertical motion, and (b) transpressional dextral shear. Decoupling occurs at the brittle/ductile transition of quartz (bdq) and brittle/ductile transition of feldspar (bdf), above a brittle Moho. The regime of stress is also indicated (the so-called fir-tree), which reflects the maximum stress of the material.
The width of the shear zone acts as a focusing effect on the magma production. Though there are numerous worldwide examples, we present three cases to document the relation between shear zone and magma. When the sheared zone is restricted in width between two adjacent cratons, the resulting granitic massifs develop in small stocks along linear structures such as the Kivu Belt, or Kibarides, Central Africa, along 1500 × 150 km [28,29].
The continuing oblique continent–continent collision between the Australian and Pacific plates resulted in the formation of the Southern Alps, and Fiordland in southern New Zealand, with granite and pegmatites from the Mataketake Range, and the Stewart Island in the southwest of this orogen [30,31,32]. The Mesozoic Median Batholith, a S-type granite, is now dissected by the Alpine fault, though it intrudes into a 400 × 75 km shear zone.
In the Hercynian granitic belt [33,34,35] (Figure 5), S-type granitic intrusions run along 2500 × 600 km, from South Mountain Batholith (SMB), Nova Scotia [36]; through Land’s End, Dartmoor (Cornwall), and Pontivy, Plouaret (Brittany); to Erzgebirge, Bohemia as Podlesi Cinovec (CI), Ehrensfriderdorf (EH) and Krusne Hory (KH) [37]. Globally, analyses of Bohemia have been issued in various specialized papers from the group of Rainer Thomas (GFZ, Potsdam) and Karel Breiter (Czech Geol Survey, Prague). These S-type granitic intrusions present root zones in the zone of local extension [38], but the bulk motion is shearing. In contrast, the banks of the shear zone give place to compression against the cratons, with subsequent relaxation of the crust. These occur in the place of so-called anorogenic pink alkali granites (A-type) or ferroan granites [39]. Examples (Figure 5) include Pleasant Ridge, New Brunswick [40]; Hensbarrow (HE) and St Austell, Cornwall [41]; northern Brittany (Aber-Ildut, Ploumanach (PL), Flamanville, Barfleur [42], and Vernéřov (VE) in Bohemia [43] (Figure 5). Transpressional zones are characterized by the coexistence of the two types of granitic magmas owing to heterogeneities in the crust. When the neighbouring craton is involved, the lower crust may undergo melting. Adopting a viscosity of 1017 Pa·s for the lower crust yields a delay of about 30 Ma between the S-type and the A-type granite emplacements.
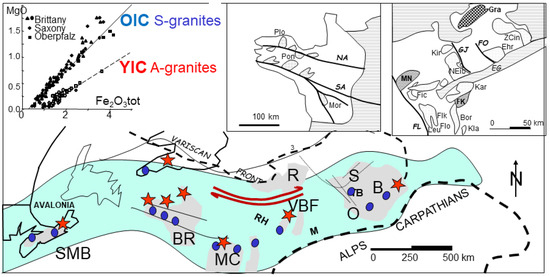
Figure 5.
Reconstructed map of the Variscan deformation belt from eastern Canada to Bohemia. The belt intrudes on several granitic massifs, shown as dots (S-type) and stars (A-type). The whole belt is submitted to a dextral shear, presented by y shear zones. The magma categories (A- and S-types) are identified by MgO and Fe2O3 (inset).
1.3.2. Model of Continental Shear Zone
A continental shear zone develops in response to an oblique to nearly parallel convergence of cratons (Figure 4a). The two cratons present an older ticker and stiffer crust, which commonly occur with a granulitic dry lower crust, establishing its structural stability. The rheological response of the crust to stress is like that of a layered crust in 1D. The uppermost crust is controlled by quartz up to about 300 °C, when it becomes ductile (Figure 4). It corresponds to the seismic active zone, which manifests through rupture when the stress becomes too important. Below 20–22 km in depth, more abundant and stiffer feldspars reinforce the crust, first using subgrain rotations yielding ductile feldspathic brittle/plastic transition at about 450 °C. This is the place in which ductile shear zones anastomose gneissic shear zones that progressively flatten before encountering Moho at about 750 °C, where olivine takes control of a stiffer upper mantle that can undergo brittle deformation, as observed in seismic sections, in cases of large strain.
The general equations that govern mineral deformation (ε°) are a power law with stress (σ) through a factor (n), with a pre-exponential factor E0, and an activation energy (Q) function of temperature [43].
e° = E0 sn dp exp (−Q/RT)
Depending on the minerals and experimental conditions, the grain size (d) may form an equation with a power law (p). The bulk trend is that reducing the grain size increases stiffness. The values of the most important minerals are summarized [44].
The bulk strength of the crust manifests in the so-called fir-tree aspect of the curve, with a linear strength increase up to ductile transition above a weaker layer (Figure 4b). Experimental deformation under varying ambient stress and a controlled shear rate have long been the basis of all models of crustal response to imposed stress field [43]. These are used to derive the values of the expected transitions in compression and simple shear experiments. In parallel, 2D and 3D numerical simulations of deformation reveal the importance of gravity in modifying the relief due to the compressional forces. However, they confirm the 1D layer model and can be used to investigate the non-linear aspects of the deformation behaviour in the case of rapid contrasts in rock properties or strain response to stress.
Such 1D models also serve to elucidate the geometric conditions internal to shear zones, identifying vorticity variations to take crustal heterogeneities into account [45].
The adopted geometry corresponds to a vertical shear zone within a weaker zone bracketed between adjacent cratons (Figure 4a). Owing to the 1D modelling, the vertical motion of the weaker central zone is not considered. The temperature profile with depth is controlled by the basal heat flow. Experimental conditions as well as field observations concluded that the basal friction induced by the heat flow remains unable to significantly alter the temperature profile with depth. Similarly, the friction of the shear planes, often manifest in local melt (tachylites), remains localized and has high strain rates, being rarely observed at usual tectonic rates (10−14 s−1).
1.3.3. Continental Transpression
In the case of oblique convergence and melting, the deformation switches from a simple 2D geometry, shown by strike-slip along the fracture plane (Figure 4a), deviating from simple shear by adding a pure shear component across the zone, resulting in transpression (shortening) or transtension (extension) (Figure 4b). The result is a large spectrum of 3D deformation with its own complex strain reactions, modifying fabric rotation (the simple shear component) [44]. Owing to this perpendicular combination of a pure shear and a simple shear, the resulting deformation path becomes much more complex than for a simple shear zone.
The major difference with a continental shear zone results from the partitioning of the deformation. In the former case, the high-strain zone is localized in a subvertical plane to accommodate, through brittle fractures, the horizontal displacement between the two adjacent craton roots (Figure 4a). In contrast, during transpression, the upper part of the crust, controlled by quartz and feldspars, also reacts in a brittle mode, inducing fracture zones. However, the lower part plastically deforms under pure shear, flowing horizontally (Figure 4b) according to the basal frictional drag with the upper mantle. The conjunction of both patterns of deformation results in complex geometries of flow, resulting in mineral fabrics [46].
1.3.4. Implications of a Basal Friction
Another important character of transpression results from its driving force (Figure 4). A common fracture results from the accumulation of stresses induced by an ambient convergent stress pattern, usually noted σ1 > σ2 > σ3. In a commonly stressed crust, when the major stress component is vertical, it gives place to extension. Depending on the relative intensity of the two horizontal components (i.e., when σ 1 is not the driving stress), deformation gives place to horizontal strike-slip or reverse faulting. In all cases, the stress intensity gradationally accumulates up to overcome the rock strength. The process is considered to be continuous and stationary during stress accumulation up to rupture.
Conversely, friction manifests in a discontinuous motion, known as stick-slip [47]. This manifests through alternate episodes of discrete slip, followed by an arrest, the stick phase. The interpretation of such transient effects relates to the simultaneous presence of a multiphase material that reacts individually to the applied stress. These are metal and air in the case of a common dry friction [48], or the melt and matrix in partially molten rocks [49].
A static coefficient of friction m0 relates the vertical force (gravity) to the external horizontal force F pulling the system [50]. In the dynamic case, an external force applied to a two-phase material partitions between the two phases. A second term should be added with a state variable q function [51,52,53].
The general flow pattern, as experimentally determined for dry friction, becomes a competition between velocity and its variations (acceleration or slowing down), i.e., successive episodes of flow (velocity) constrained by enhanced (acceleration) or restricted flux (slowing down). The flow during dry friction consists of motion, interrupted by stops—the so-called stick-slip motion [49,50,53,54]. A spike (Dm), often called stiction, develops when the slip condition (acceleration) varies (Figure 6). The evolution that follows to readjust the friction coefficient takes the shape of a diffusive process, with a quantity Dc [51,52].
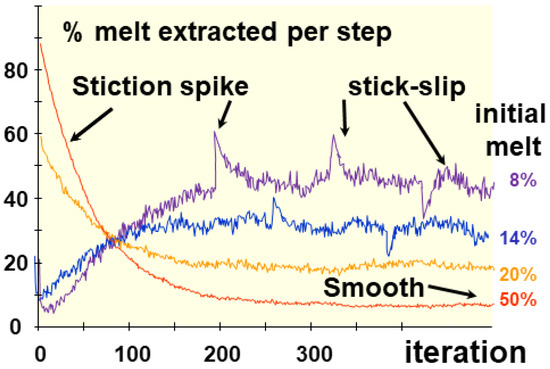
Figure 6.
Simulation of melt extraction [49] through a cellular automaton. The amount of melt extracted by the step depends on the initial melt percentage (f0), but produces a sporadic motion. When one parameter is changed during a run, a stiction spike appears, which rapidly returns to the stationary state. After normalization to the initial melt and the dimension of the cell network, values converge toward a coefficient of melt extraction (me). The spikes and the stick-slip like motion depend on the amount of flow (its content) and its accelerations. Two regimes, regular or stationary and transient, are observed depending on whether the initial conditions, especially permeability, vary during a run, inducing spikes (Dm) and stick-slip motion with amplitude (sm).
The underlying state function is a combination of first and second derivatives, and the energy is evacuated by phonons, such as the musical tones of a violin string or the squeal of chalk on a chalkboard. This defines a general law linking stress and strain with V the slip velocity over an asperity.
τ = σ [μ0 + α ln(V/V0) + θ] with dθ/dt = 1 − Vθ/Dc
1.3.5. A State Variable for Friction
The frictional experiments allowed for a dynamic friction coefficient (m), as well as the motion timing, to be quantified. A state variable q is coined that would correspond to the expression of the energy with respect to the variance in the transitional zone [52,53].
q = q0 + a ∂G(x)/∂x + b ∂2G(x)/∂x2
Coefficients a and b measure the velocity dependence of the friction [54]. Their difference (b-a) implies that velocity weakens when positive, i.e., when acceleration surpasses velocity. When the latter surpasses the former, instabilities develop. In other terms, advection takes over from diffusion. This eventually gives place to spinodal decomposition (Figure 7), thus partitioning the entropy between the components [55].
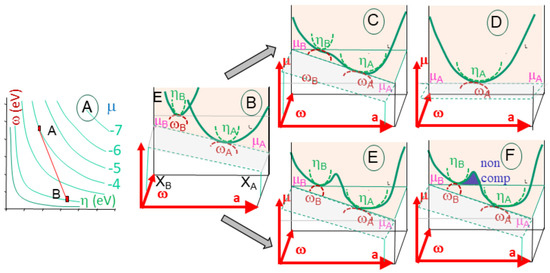
Figure 7.
Chemical reaction between A and B elements, represented within a [w-h] diagram, with a being the content in one element (A). The descriptors illustrate the energy parabola (E), with its point of tangency to the chemical potential (m) and radius of curvature (h) and osculating circle (w) in a normal plane. The reaction between elements A and B supposes the two energy curves mingle into a single (B). Two situations may develop. The energy curve is distorted, with two minima with two minima (C), and returns to a stable state operates with a newly formed element, and the energy curve is again a parabola (D). When the energy gap is too large, positive energy remains (E) and the reactions yield two incompatible elements that do not mix (F). The incompatible zone is also marked by higher polarizability.
Similar effects are observed during simulations of melt extraction, i.e., the segregation of a mobile melt from a viscous matrix. Numerical simulations used cellular automata to reproduce melt motion [54], whereas in this interpretation, the variations were induced by varying the amount of the weak phase [53] In both situations, a stop and go motion is observed, with sudden bursts related to an increase in or shortening of the weak phase, followed by a diffusive return to the previous state. It remains difficult to calibrate time in such numerical experiments, but the stick-slip motion allows for their non-periodic intervals to be estimated as about 0.3 to 0.5 ky [55].
1.3.6. A Competition Between Advection and Diffusion
The stick-slip motion is commonly separated into two patterns according to the frequency of the alternate stop-and-go-motion. In a quasi-steady state, the frequency is as function of the velocity of the flow. Its duration is of the order of the second or lower; nevertheless, it is not periodical, as some sinusoidal functions may be (Figure 6). The amplitude varies continuously. When superimposed on this signal with a short period and small amplitude, some burst occurs, marked by a larger amplitude and a return to the previous steady state, as would occur for diffusion. Such bursts have a larger pseudo-period than the stop-and-go motion by about one order of magnitude. The common interpretation is an increase, or shortening, in the amount of the mobile phase, as suggested by the diffusive return to initial conditions.
2. Chemical Aspects
Chemical reactions are commonly interpreted as the re-equilibration of the chemical potential difference between elements [56]. In the presence of oxygen, metallic ions combine into metal oxide for a greater stability, thus lowering their possibility of inducing new reactions. During this process, there is no noticeable change in the structure of the nucleus of both elements.
2.1. Chemical Descriptors
Elements are considered as electronic clouds that could share other electrons via exporting or importing. For this purpose, elements are classified as acid or base depending on whether they accept or provide electrons, and as hard and soft depending on their ability to share electrons. Such quantities are called descriptors, namely electronegativity (η) and hardness (h). Electronegativity (χ) is the chemical potential (µ) changed of sign [57]. It is the first derivative of the energy when one electron is added to the electron cloud (N) under constant external potential v(r). Chemical hardness (η) is the second derivative of the energy under the same conditions [58] (Figure 9).
dG(N) = −N χ + N2 h = N (∂G/∂N)v(r) +N2 (∂2G/∂N2)v(r)
Under such conditions, the chemical potential is tangential to the energy curve, whereas hardness is akin to the radius of the curvature circle at this point. A third descriptor, electrophilicity (ϖ), is akin to the osculating circle [58], being equivalent to the normal tangent and related to the lateral deviation in the energy curve. This attempts to laterally deviate the energy curve (Figure 7).
Furthermore, polarizability (α) characterizes how the electronic cloud distorts in response to an external electric field [59]. It is defined as follows:
where Fa, Fb, and Fc the components of the applied electric field. Values are commonly reported in atomic units (1 a.u. = 27.211 eV), and polarizability is often inversely related to the cube of electronegativity [60], meaning it can serve as a proxy for unidirectional electronic resistance, and α, its average on geometric axes, as an estimate of the bulk polarizability.
2.2. Reaction Control
In ionic states, atoms fill their available orbitals (s, p, d, etc.), establishing electronic structures that define their reactivity (Figure 8). The frontier molecular orbitals, the highest occupied molecular orbital (HOMO) and the lowest unoccupied molecular orbital (LUMO), are particularly significant in this context, as their energies correspond to the ionization potential (IP) and electron affinity (EA), respectively. From these quantities, electronegativity and chemical hardness can be derived through finite difference approximations (Figure 8). These descriptors serve as fundamental indicators of an atom’s chemical behaviour. Electronegativity, the negative of the chemical potential, governs an atom’s ability to attract electron density, playing a central role in determining the direction and feasibility of chemical interactions. Hardness, in contrast, reflects the resistance of an electron cloud to deformation, influencing how easily a species can adapt to external perturbations.
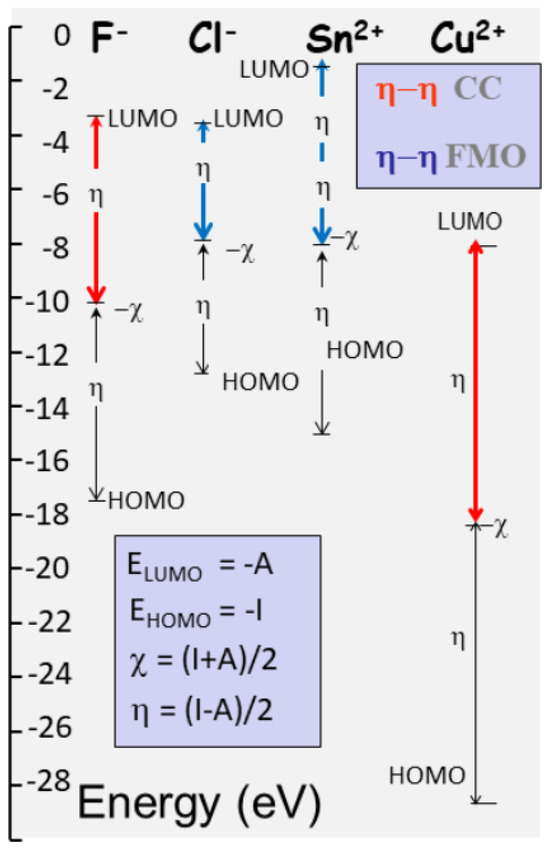
Figure 8.
HOMO-LUMO definition and illustration for two fluids (F, Cl) in ionic state, which are respectively classified as hard and soft. Two metallic ions (Sn2+ and Cu2+) are also represented, which are, respectively, soft and hard. From the energy level of the highest and lowest occupied/unoccupied molecular orbital (HOMO-LUMO), hardness and electronegativity are computed as the half sum and difference between ionization and electron affinity. Chemical hardness corresponds to the contrasted values of HOMO-LUMO, as evidenced for F− and Cu2+. The inset shows corresponding definition of the chemical descriptors, chemical potential (µ), and hardness (η), along with the major mechanisms, charge control (CC), and frontier molecular orbital (FMO) that control reactions.
Reactions involving small, highly charged ions (such as halogens) often proceed through charge-controlled (CC) mechanisms, where electron exchange occurs with minimal nuclear rearrangement. In such cases, the driving force of reactivity is dominated by the difference in chemical potential between species. Conversely, when polarizability is high, the electron cloud reorganizes, and orbital overlap and electrostatics start to dominate (Figure 8) ionic interactions (e.g., Cu2+). The nature of the interaction–hard–hard or soft–soft—determines whether reactivity is primarily electrostatic or orbital-driven [61].
The energy levels of HOMO and LUMO correlate with fundamental electronic properties: the ionization potential and electron affinity. These, in turn, relate to electronegativity and hardness, which represent the first and second derivatives of the total energy with respect to the electron number. Electronegativity captures the tendency of a species to attract electron density, while hardness quantifies its resistance to charge deformation. Together, they help characterize how a system will respond during interactions with other chemical species. In reactions where the HOMO–LUMO energy gap is substantial, and the elements involved are less polarizable, the mechanism typically falls under the charge-controlled (CC) regime (Figure 8). Electron transfer dominates such reactions without requiring significant structural rearrangement. However, when soft species interact—those with diffuse orbitals and higher polarizability—orbital overlap and covalent character become more influential, and frontier molecular orbital (FMO) mechanisms become prominent. In short, hard–hard interactions depend on CC, whereas soft–soft reactions are FMO (Figure 8).
A third mechanism may develop for larger molecules, which is directly related to the size of the electronic cloud and its polarizability [62]. The density polarization (DP) concept expresses the volumetric density of the electric dipole moments, describing how the material responds to an external electric field. Large molecules present large ionic radius, and often large charge. In the presence of an external shape, the electronic cloud deforms and polarizability enhances the formation of covalent bounds.
The three processes controlling chemical reactions determine the type of links between molecules, and thus their future ability to exchange with other elements, forming complex compounds.
2.3. Fitness Landscape Diagrams
Some simple principles rule these reactions. Three of them describe the bulk trend of the descriptors during a reaction. This represents a mapping of the chemical products.
First, the chemical potential should be similar in all components at equilibrium, justifying the use of geometrical averaging between descriptors for a molar amount of compounds or solvents. At equilibrium, the chemical potential tends to equalize among all constituents [63], supporting the use of geometric averaging for compounds:
χABC = (χAa +χBb + χCc)1/(a+b+c)
Second, hard molecules arrange themselves to be as hard as possible [64], leading to the maximum hardness principle (MHP).
Third, a minimum electrophilicity principle (mEP) states that reactions should evolve toward minimum electrophilicity [65].
Finally, a minimum polarizability principle (mPP) favours the formation of stable molecules in regions of lower polarizability, typically associated with higher charge localization [66].
Consequently, given an initial product, characterized by its descriptors, it should be possible to predict the more probable path during a reaction through examining the variations in the descriptors. This represent a new mapping, or fitting landscape diagram, on which the potential wells should attract the reaction [67].
Such a transformation, which is fact is an isomorphism, can be used to plot the 11 common oxides used in magmatic petrochemistry to a 2D diagram using, for instance, [c-h] or [w-h] as new coordinates for one oxide 11. As an illustration (Figure 9), the 11 oxides plot on such diagram forms a triangle of descriptors of SiO2, Fe2O3, and alkali (Na2O) using poles. This diagram straightforwardly indicates the three major poles, i.e., silica, oxidation, and alkalis, within chemical analyses. Superimposed on this triangle, other parameter, such as polarizability (a), can be used as a third dimension, yielding a mapping with values of equal polarizability and their trends (Figure 9).
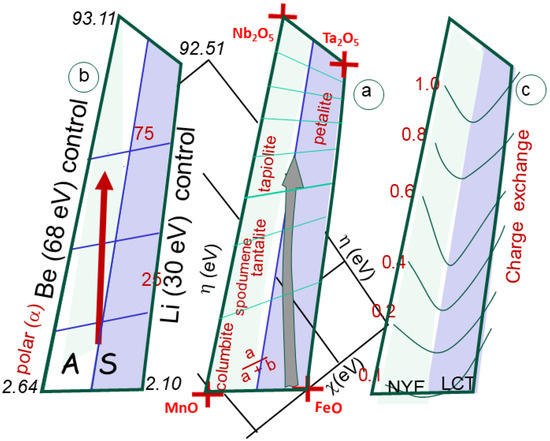
Figure 9.
(a) The box is calibrated in a/(a + b), indicating the respective ratio of Fe and Mn compared to Ta and Nb. The fields of A and S granites, corresponding to NYF and LCT pegmatites, are indicated. The fields of columbite, tantalite, tapiolite and petalite, spodumene, and beryl are indicated. (b) The same box, but calibrated in polarizability, showing the large difference between oxides (about 2 to 100). (c) Charge exchange computed between the poles of the pegmatite box. The change is always low (below one unit), increasing from Fe-Mn to Ta-Nb oxides.
2.4. Fitness Landscapes
Using such descriptors, chemical reactions are considered analogous to electron flux, with a bulk velocity ruled by the chemical potential difference and its variations, akin to acceleration (or slowing down) through hardness (Equation (6)).
The chemical reactions are not limited to a unique category, e.g., the formation of oxides or sulfides (Figure 9) depending on the reactants that are present. Disequilibrium may occur if the chemical potential involves several successive reactions. For instance, silicate lava, e.g., basaltic, combines about 11 major oxides and fluids (Cl, S, OH, etc.). During solidification, crystal precipitation modifies the composition of the melt, altering the chemical potential of the residual melt (Figure 10). This constitutes the so-called Bowen–Fenner trend [68,69]. Hence, the formation and precipitation of any phase is a disequilibrium process that follows a series of steps, also called the liquid line of descent, until a thermodynamically stable state, or equilibrium, is achieved [70]. The Bowen trend commonly evolves through successive steps (Figure 10), from ferro-magnesian minerals (olivine, pyroxene, amphiboles), to micas (biotite) and feldspars, and finally quartz. Known as fractional crystallization, it is a succession of forming crystals that are removed from the melt by setting according to successive potential lows.
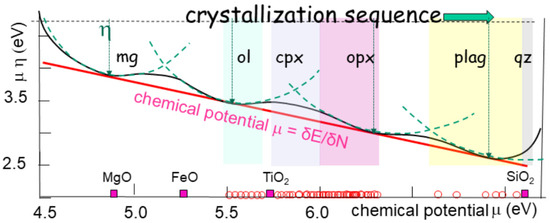
Figure 10.
Sequence of crystallization from olivine to quartz, extended from MgO to SiO2, according to Bowen’s trend, but using the chemical descriptors showing a linear decrease in chemical potential. The descriptors are the first derivative, electronegativity (µ), which is the chemical potential change in the sign, plus the chemical hardness (η) and electrophilicity (ϖ), which are second derivatives that are tangential and normal, of the Gibbs energy. All values are measured with the same units (eV). The intermediate points are experimentally derived points of the line of descent from olivine to quartz [71]. The range of major minerals (olivine, pyroxenes, plagioclases, and quartz) is indicated. The evolution follows a line of descent on which the chemical potentials are tangent. The aperture of the curve is the chemical hardness, akin to the radius of curvature.
The chemical descriptors and the principles that rule the reactions offer an elegant mode of describing elements’ evolution during chemical reactions [72]. In particular, descriptors pair allow for the reactions between multiple elements to be examined, namely, the 11 oxides used in geosciences within a 2D mapping, rather than a complex 11D space [11].
2.5. Cascading Energy
Reactions proceed through a charge exchange (dN), implying an energy exchange (dE).
and
The sign of dN indicates the direction of the electron flow, while dE is always negative, reflecting the energy stabilization upon charge redistribution.
The different crystallizing phases follow the order of their chemical potential, providing an analogy of a cascade of potential wells (Figure 11). Each mineral has a chemical potential value that progressively decreases (increasing the chemical electronegativity). The curve of the bulk free energy is tangential to each of these values, with a radius of curvature (akin to chemical hardness) that slightly increases (Figure 10). Since electrophilicity does not significantly vary, the lateral deviation (i.e., the radius of the osculating circle) does not vary, keeping the energy trend in a regular plane.
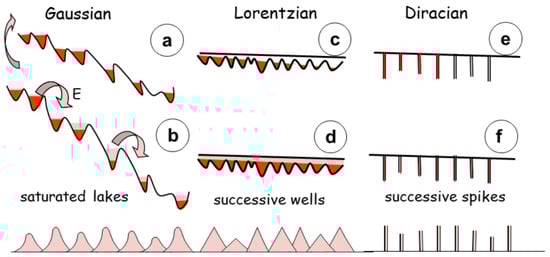
Figure 11.
Cascading energy in saturated lakes. (a) In case of low global slope, few cascades occur, whereas the saturated lakes flow between them in case of strong slope. The change in instability style is progressive. (b) The process occurs in successive steps, releasing energy, between potential wells. Avalanches describe the transition since the local energy release adds to neighbouring changes. The global process is a Gaussian distribution of matter. (c) In case of successive potential wells, each energy variation is an individual process, that does not relate to the previous history of the flow. (d) It occurs through a Lorentzian distribution, triangular in shape. (e) in contrast, in a Diracian distribution, the filling occurs on a discrete point and the rest of the system is free. (f) in total the Dirac distribution is a suite of values at each successive point, mimicking the Dirac comb. The successive distributions are respectively caused by diffusion, chemical potential values, and conjugate of chemical hardness and polarizability.
The proximity of the potential wells and their amplitude imply a quasi-continuous trend toward a potential low. The trend runs from Fe oxides toward silica, as described by [68,69]. mimicking a liquid line of descent that was experimentally observed [73]. Immiscibility between liquids occurs when the difference in hardness, i.e., in the second derivative of Gibbs free energy, is too large to allow fir a smooth transition.
The cascading variation in the chemical potential represents a natural evolution of the chemical system towards a zone of lower energy (Figure 11). Although the reactions rapidly develop and the atoms are rearranged, the reaction is accompanied by an energy change as the new system is generated. This is obviously accompanied by an exchange in temperature. For most reactions, the reaction rate determines the proportion of the concentration of the products and reactants by time unit. It can be very slow, such as the natural oxidation of iron in contact with air, or quite instantaneous, scaling in mol/m3/s.
Consequently, the chemical reactions behave identically to the stop-and-go motion of friction. Their rate depends on the available quantity of reactants, i.e., advection, and on the velocity at which new products are generated, i.e., diffusion.
2.6. Computational Aspects
We employed conceptual Density Functional Theory (cDFT) to calculate the chemical reactivity descriptors, in accordance with the foundational principles of the theory [74]. All computations were carried out using the code Multiwfn 3.8 [75,76], an open-source post-processing programme designed for the comprehensive analysis of molecular electronic structures.
The calculations are based on the B3LYP functional [77]. which incorporates the Lee–Yang–Parr correlation component. Geometry optimizations and property evaluations were performed at the B3LYP/6-311++G (2df,2p) level of theory. This level of theory was also used to calculate the external static potential (ESP), ensuring consistency across the dataset. The use of a uniform cDFT computational protocol allows for direct comparability of the derived descriptors across different systems and supports the assumption of data homogeneity.
3. The Temperature Aspects
Temperature is a major controlling parameter during magma production. It controls the onset of melting, but it also has an influence on many other physical parameters (diffusion, viscosity). It links with energy through a quantity that describes the disorder of the system, increasing from a regular distribution (e.g., crystalline ordering) to a random distribution (e.g., a liquid or a gas). In information theory, the entropy is computed as the sum of all possible probabilities (p(x) log p(x)) that can accommodate a given state [78,79]. In a chemical system, this probability is closely linked with the inverse of temperature.
3.1. Temperature and Entropy
The third component of the energy, temperature, could also be developed into a sum of the first and second derivative of the entropy, though it is less frequently determined as such. Hence, in the expression of the free energy dG (Equation (2)), the first derivative of the energy as a function of temperature is the entropy.
dG(T) = S0 + T−1 (∂G/∂S) + T−2 (∂2G/∂S2)
This mimics the development of the energy as formulated for stress/strain and chemical attractivity, emphasizing the relation between variations in temperature (e.g., melting under new magma batch) and back reactions due to restitic mineral formation (e.g., garnet). The idea is not new, but illustrates the concept of latent heat or specific heat capacity.
3.2. Physical Properties of the Magma
The fitness diagrams of the elements involved in the reactions (Figure 9 and Figure 12) tell a complex story regarding the chemical reactions, quite different from a simple, diffusion-controlled evolution. Hence, the chemical evolution of the magma appears as a continuum of melting or crystallization, controlled by the successive wells of chemical potential (the so-called lines of descent, Figure 10). The trend, in terms of chemical descriptors, follows a bulk decrease in chemical potential through successive cascades (Figure 11). In contrast, the trend for the pegmatites, as indicated within the box of [Fe-Mn] and the [Nb-Ta] oxides, is at odds with the granitic magma trend. Another, different, trend determines the evolution of ionic tin towards its oxidation state (cassiterite) (Figure 9) and subsequent precipitation as ore [11].
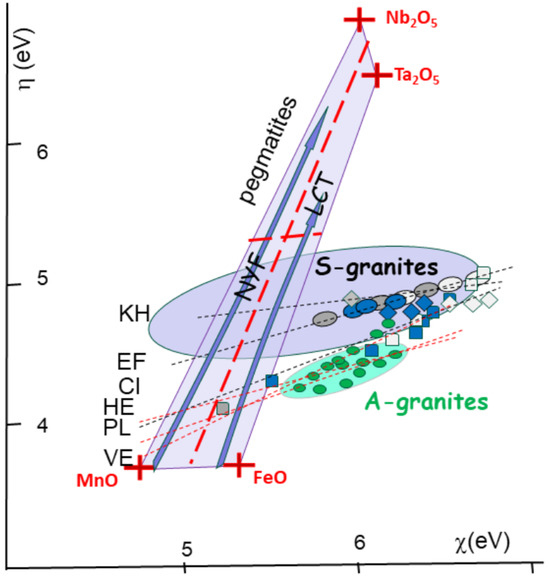
Figure 12.
Chemical descriptors [h-c] for granitic magmas (plain), pegmatites (light grey on the soft side), and greisens (dark black on the hard side). Values plot on the lines indicate ore deposits within S-granites of Cinovec (CI), Ehrensfriderdorf (EF), and Krusne Hory (KH) in Bohemia. Also indicated are trends for similar rock types associated with A-type magmas (in green) with HE (Hensbarrow; St Austell, Cornwall), PL (Ploumanach), and Vernéřov (VE) in Bohemia (see location in Figure 5). Also plotted is the field for pegmatites, shown within a Mn-Fe-Ta-Nb box, indicating the separation of NYF and LCT ore formations between columbite and tapiolite. The fields of the S-granites (in blue), as well as the A-granites (green stars) are indicated. Both trends are at odds with the pegmatite box ranging between the [Mn-F] oxides and the [Nb-Ta] oxides. The trends for Sn[II] towards Sn[IV] compounds are shown in the inset.
3.3. Interactions Between the Energy Components
The energy partitioning into three components, along with the variability of their influence with time (velocity and acceleration), has drastic consequences regarding the rate of chemical reaction and the ultimate products of such reactions. The effects are more marked in TPD compared to MA and PD because the heat source is subject to more variations, essentially due to the convergence rate of the plates in motion. In PD, the heat coming from the mantle can be considered stationary in a first approximation.
3.4. MIP Development
The initial melting temperature has drastic consequences for the later evolution of the fluid–melt system [80]. During their evolution, magmas liberate a magmatic igneous phase (MIP), mostly aqueous, during two episodes. The first occurs during ascent and decompression, affecting fluid solubility in the melt. The second episode develops during crystallization by shrinking the amount of melt when crystals form [81]. The fluids result from the melting of hydrous minerals (Figure 1), such as muscovites above 700 °C [82], biotites over 800 °C [83], and amphiboles (900 °C) [84]. These hydrous minerals liberate water, which is immediately reincorporated into the melt and enhances melt production. The restitic mineral assemblage forms granulites, as observed from their seismic velocity in the lower crustal sequences.
The MIP attracts and carries metals that are under their ionic shape. Indeed, the viscosity of a gaseous MIP is about six orders of magnitude less than the melt. Metal transport shifts from diffusion to advection, accelerating by several orders of magnitude. The attractivity of MIP for metals would result in a similar amount of metal segregation. The metal immiscibility is controlled by the Coulombic properties, namely the electric charge (Z) and electronic radius (r). These both determine the formation of an electronic dipole moment when an electric charge, such as another ion, applies [85]. Diffusivity measures the influence along which a molecule interacts with the surroundings.
3.5. Subcriticality
The MIP’s individualisation and its composition become more complex when considering temperature and pressure conditions. Indeed, at very high temperatures, the fluids are in a supercritical state. They may incorporate any quantity of matter. In intermediate felsic magmas, the temperature of the critical point is 731 ± 21 °C, which is valid for a pressure range from 1 to 5 kbar, and the critical water concentration is 26.5 ± 1.5% [86]. Below these conditions, the MIP splits into two incompatible phases (Figure 1): one silicate-rich and the second aqueous-rich [87]. In consequence, the bulk magma chamber incorporates three sub-chambers that independently evolve, yielding greisen, pegmatites, and granitic materials. Below the critical point, the system is subcritical, with properties of solubility.
Criticality controls the separation of the different phases within the magma. It traduces with an infinite solubility within the liquid [86], modifying the bulk density of the fluid phase (Figure 1). Below the temperature of the critical point, the solubility of the fluid is also enhanced, yielding a subcritical state (Figure 1).
4. The Effects on the Magma Chamber
4.1. Magmas
The initial melting of the continental crust produces silicate-rich melts (>65% SiO2). These hydrous minerals are mostly micas with volatiles (CO2, Li, Be, B). The liberated water is immediately reincorporated into the melt. The restitic mineral assemblage forms granulites, as observed from their seismic velocity in the lower crustal sequences.
Conversely, at similar temperatures, the fluid-assisted partial melting of lower crustal minerals (garnet, pyroxene) results in alkaline magmas, which are richer in rare earth elements (REE).
4.2. Transport Properties (Viscosity, Diffusion)
During melting, metals are liberated from crystalline networks, reach an ionic state, and are free to move according to the diffusion in the melt (Figure 13). Unfortunately, the temperatures do not allow for much displacement. Hence, given an average lifetime of 1 Ma for the magma chamber, between 700 and 750 °C, the melt viscosity for a crustal melt computed from a rock composition [88] scales between 10−4 and 10 12 Pa·s, without any possibility of differentiating between granite, pegmatites, and greisen [11]. At least 13% fluid is required to reach values allowing for lava flow. At the same temperature, diffusivity values for Sn range 10−17–10−19 m2/s, both equivalent to a characteristic length of less than 1 m for such a time interval [11].
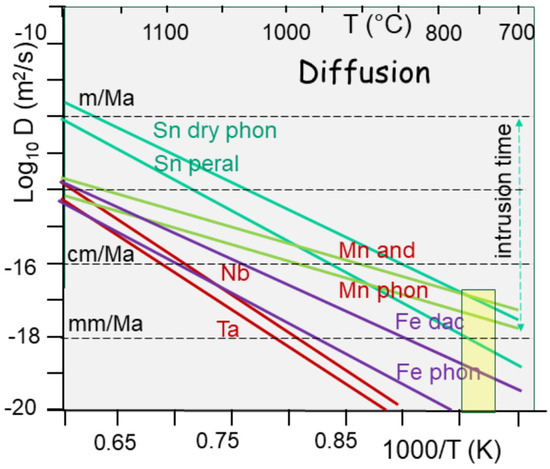
Figure 13.
Diffusivity values (in Log10 and units in m2/s) as a function of temperature curves [89] for Sn into wet trachyte (65% SiO2) and dry phonolite (55% SiO2). Complementing Sn, diffusivity values for Mn and Fe (dashes) in andesite and phonolite were extrapolated from experiments, since they are Arrhenian. Values for Nb and Ta are plotted on the same diagram. In an ore formation temperature range of around 750 °C, the diffusivity values for these metals range over four orders of magnitude. For comparison, the diffusivity of trace elements from Rb to Hf is indicated for wet trachyte [90], showing an inversion of values at about 1000 °C. The characteristic diffusion length that shows the diffusivity values in velocity is also indicated. The effect of this is quasi-ineffective at low temperatures, providing evidence that tin segregation is unrelated to simple chemical differentiation.
4.3. Ore Chemistry
The subcritical state of the MIP strongly affects the dissolution of granite into water from 300 °C to 450 °C [87]. Indeed, the supercritical water oxidation mechanism is commonly used to extract hazardous products from soils [91]. For pure water, the critical point is reached at 22.1 MPa and 374 °C, at which point ionic and polar species are extracted [92]. In addition, the natural system is buffered along hematite–magnetite (HM), and can reach nickel–nickel oxide (NNO) buffers. As a result, other metal compounds (Sn Nb, Ta) are found as oxides.
A specific molecular dynamic (CPMD, [93] that is applied to supercritical water (scH2O) shows that electrons cleave a cavity in the hydrogen bond network, and six H2O molecules form the solvation shell (Figure 5 in [94]). At subcritical conditions, the H-bond network is not continuous, allowing electrons to localize in preexisting cavities or solvation shells formed by four water molecules. The progressive extent of the H-bonds is marked by a decreasing density. The electrochemical properties decrease alongside the dipole moment, modifying its polarizability.
4.4. Pegmatites and Greisen
The extraction of metals from TPD magmas is hampered by two factors, namely the paucity of metals and the poor transport properties within the melt.
The number of metals is not the real problem. In fact, there are enough metals in the lower continental crust compared to the oceanic crust. When melting, they are liberated from their network, become ionic compounds, and are free to move. However, metals’ diffusivity towards the melt remains limited, not by their ionic radius (500–1100 pm) but by their poor activation energy (125–180 kmole/J). The low temperature imposed by the critical state (<730 °C) does not help. As a result, the characteristic diffusion velocities range from cm to dm per million years (Figure 13).
Their transport possibilities are linked with the low viscosity of the melt at such temperatures. The melts indicate viscosity values ranging from 107 to 1012 Pa·s, which should be compared to lavas flowing at viscosities of about 106 Pa·s. Even the 13% water and 3% F added during the computation result in such values [11].
In consequence, the magma splits into pegmatites and greisen, which are both associated with magmas from different sources. NYF pegmatites are associated with anorogenic A-type granites, rich in alkalis, Zr, Nb, Ga, and Y [94]. In contrast, LCT pegmatites link with peraluminous magmas, as observed in TPDs, which present a similar K/Rb ratio, but have a Ga content that is about one order of magnitude less than NYF [94]. A new classification is suggested that takes into account the importance of the initial melting temperature. Hence, TPDs are characterized by highly evolved magmas in the continental crust following the dehydration and melting of micas. They have a melting temperature of 700–800 °C.
The differentiation (K/Rb) plotted against the gallium (Ga) content in ppm shows a neat separation (Figure 14) that better illustrates the difference between the pegmatite types [94].
ln(K/Rb) = −0.6 ln(Ga) + 2.1
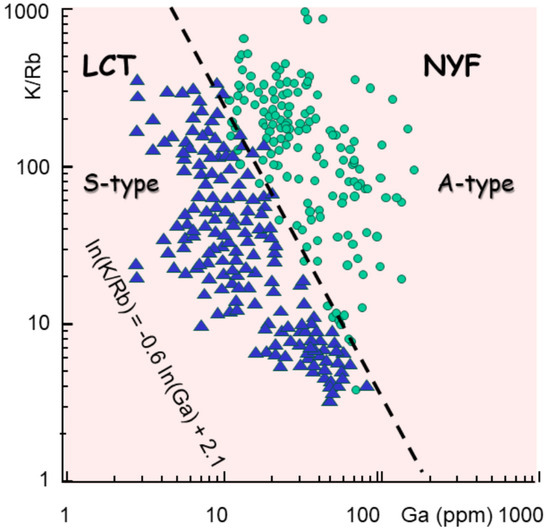
Figure 14.
Commonly used pegmatite classification, in LCT and NYF, or S-type and A-type granites, represented in a diagram of K/Rb (differentiation) versus Ga content. Data are redrawn from [94]. They show a separation between the two groups that may be approximated by ln(K/Rb) = −0.6 ln (Ga) + 2.1. This indicates the important enrichment (ppm) in gallium (Ga), probably generated by garnet or pyroxene melting in the lower continental crust.
This represents an enrichment in Ga by a factor of log 50, which may be explained by the selective melting of pyroxenes or garnets in the lower crust at about 550 °C [95].
4.5. Usual Metals (Sn, Nb, Ta)
Tin (Sn) is the most common ore mineral mined in TPD systems. It is exploited as cassiterite, a tin dioxide (SnO2). The electron configuration of tin orbitals is 5s2 4d10 5p2. This indicates that tin can lose two electrons from its 5p orbital to form a tin [II] ion (Sn2+), and it can lose two additional electrons from the 5s orbital to form a tin [IV] ion (Sn4+). Tin achieves a more stable electron configuration in both cases. Tin can form divalent compounds since its s subshell is more stable than its p subshell because of screening differences, and the s electrons do not bond. The tin [II] compounds are not as stable as tin [IV] compounds, in which all four outer electrons are involved in bonds. Consequently, Sn[II] acts as a reducing agent and may be converted into more stable Sn[IV] by losing two electrons.
Both tantalum (Ta) and niobium (Nb), first called columbium, are part of the refractor group of metals with a high melting point (close to 3000 °C). Their electronic configurations are 6s2 5d3 4f14 and 5s1 4d4, respectively. They both present several oxidation states, with the more common being +2 and +5, in which oxides such as TaO, and more often Ta2O5, are observed (Figure 9). Both are resistant to acid corrosion, although they dissolve in HF. As minerals, they are found close together in the high-oxidation state (V), as columbite (Fe, Mn)O Nb2O5) or columbite–tantalite (coltan) (Fe, Mn)O (Ta, Nb)2O5). As such, they are often represented in a box with poles [FeO—MnO] and [Ta2O5—Nb2O5], and alongside two trends (Figure 12), starting from the pole FeO-MnO, that are associated, respectively, with F-poor and F-rich fluids [96] (Table 1).

Table 1.
Chemical descriptors (eV) for Fe, Mn, Ta, and Nb oxides.
The bulk pegmatite-forming structure is commonly attributed to the progressive crystallization of a melt of granitic composition at a highly supersaturated level. During cooling, a boundary layer of the melt develops at the crystallization front. This may be the last liquid in the pegmatite body, accounting for the decreasing number of crystals and their increasing size. Mineral zonation manifests via plagioclase and a progressive increase in An content, from An10–20 in the outer ones. This is followed by K-feldspars and quartz. The highly contrasting diffusivities of alkalis (Na, K) compared to those of other metals (Hf, Zr, Ti, Nb, and Ta) result in their differential migration, giving place to boundary-layer pile-up with local saturation [97] his is not strange within a medium of high polarizability (Figure 9), extending from the positive ridge between FeO and MnO towards Ta and Nb oxides.
The decrease in chemical potential follows the habitual Bowen trend (Figure 10). With plagioclases’ crystallization, the other incompatible elements in major minerals concentrate, giving the appearance of normally rare minerals in the sum of the first-formed and last-formed mineral assemblages of the rare-element pegmatites [98]. The final mineral assemblages contain an abundance of boron as tourmaline, lithium in spodumene, petalite, and lepidolite. They represent the standard mode of solidification by decreasing the chemical potential of the system through the successive energy cascade between potential wells (Figure 10).
Those crystals are irregularly zoned, especially in Ti, Li, Al, and Ge [99]. The variations observed are irregular, with an apparent spacing (wavelength) of about 50 mm, corresponding to about 0.5 sec in terms of crystallization time. The amplitude is more difficult to estimate, varying on a scale of 10 ppm for Ge, about 0.9 orders of magnitude for Li and Al. Ti is obviously the more mobile element, with its departure leading to a global increase, with a doubling of the concentration. When superimposed on such a large wavelength trend, smaller variations mimic a stick-slip or sporadic variation in the flux of elements (Figure 6). Spikes with larger amplitudes are also observed (Figure 6).
Both scales of zoning mimic those observed during melt extraction [11], indicating instability in short wavelengths (the strike slip) and some burst, or stiction spikes when back reactions increase or decrease the local melt.
4.6. Gems
Water-rich melt inclusions in some TPDs show a critical water concentration of about 31.6%, [99] which is huge and becomes uninterpreted when such MIs decrepitate, liberating the fluids. Hence, phase separation into glass, liquid, and vapour (G, L, V) does not occur during the supercritical state (Figure 1), obscuring their relative proportion and further interpretation. Notably, the origins of the volatile components (e.g., F, Be) remain poorly traceable.
When associated with such water-rich MI, hard, volatile chemical elements (Li, Be, B) appear to segregate and be transported in these fast-moving components, and then are freed. Owing to their chemical hardness, they concentrate and form zoned bodies with a border granitic zone and albite, with a central mantle core formed by Kfeldspar around the real core (beryl, tourmaline, and spodumene). The whole mineral assemblage indicates a water-rich origin with low temperatures (below 600 °C) within high-crystalline mush (about 10% restitic melt).
Such MIPs are enriched in volatiles, and the MI often documents two generations, one with moderate Be content (some 100s ppm), which occurs close to an abnormal MI with a high Be content (up to 10,000 ppm). Other metals occur in trace amounts (V, Cr), providing the final colours of the gemstones.
Nevertheless, tin ore has been mined in Bohemia for a long time, providing metals for wars and wealth for the lords. Such mining also obtained gemstones, such as garnet and, more frequently, emerald and beryl. The Habachtal deposit of emeralds, north of Saltzburg, Austria, was first mined by the Celts. It has been a large source of gemstones, able to favourably compete with the Egyptian mines–for instance, Mount Smaragdus or emerald Mountain, located in Wadi Sikait in Egypt’s Eastern Desert, where mining probably began toward the end of the Ptolemaic period in the first century [100,101].
The emerald mineralization in the Habachtal is geologically and tectonically complex, and previous investigators identified fluid inclusion-based evidence for a hydrothermal/metamorphic origin for the emeralds. In this paper, we report the discovery of emeralds with a distinctly different inclusion population, including melt inclusions, which demonstrates that at least some, and probably most, of the emerald mineralization in the Habachtal occurred from an extremely fluid-rich pegmatite-like aluminosilicate melt under supercritical conditions, at high temperatures and under moderate pressures (~700 °C, 5 kbar).
5. Discussion
The present paper examines ore formation in a transpressional context, looking at the interactions between the energy components during the melting, segregation, and emplacement of a continental-derived magma, with inherently different viscous phases, including MIPs. The explanation for this is, apparently, at odds with the commonly formulated episodes of purely chemical evolution through differentiation. Hence, the latter is essentially controlled by diffusion.
Nevertheless, melting during transpression involves basal heat (strain imposed by the far-field external stress pattern). This indicates the first interaction between the energy components.
Second, magmatic evolution develops in a subcritical state, implying an oxidizing environment with drastic effects on the solubility of metals. This is an important aspect of the magmatism.
Third, the formed ores, which re often Sn derived from the continental crust, are observed in relation with pegmatites and greisens, specific water-rich magmas that remain within the magma chamber. This depends on the formation of volatile compounds, such as halogens or S-species.
Fourth, the evolution of such coarse-grain, aqueous magma, is specific and functions as a closed system.
Finally, the volatile elements (F, Li, Be, B) condensate as oxides, forming complex compounds of large molecules that aggregate to form gemstones. The most well-known formations are beryl and emerald. They segregate owing to their high polarizability and elevated chemical hardness, both serving as an antagonist to form complexes with other elements.
5.1. Caveat About Transpression
An important caveat should be noted for transpression and magmatism. All granitic intrusions (to be short) are not generated within transpressional zones. As an example, the magmas generated at the closure of a back arc are not considered to be purely derived from the shear of continental crust. They largely derive from mantle-derived sources, i.e., at the temperature of amphibole breakdown (900 °C).
Transpression is defined by the combination of horizontal convergence and vertical motion (Figure 5) due to the partitioning of the deformation [13].
The existence of a vertical motion within the plate is a consequence of oblique convergence. Hence, the parallel motion of plates is continental shear, whereas orthogonal convergence is pure shear. This represents the first interaction between tectonics and magmatism (Figure 2).
A direct consequence of this vertical motion is the inherent decompression of rocks, which controls the solubility of fluids upon their first boiling. Indeed, the vertical motion is controlled by convergence velocity, depicted as cm/yr, equivalent to a rate of 3.2·10−10 s−1. This should be compared to the tectonic rate, which is about 10−14 s−1. It also suggests that transpression itself is not sufficient to produce pegmatites and gems.
Depending on the convergence rate, the exsolution of MIPs is affected in the sense that the rapidly diffusing fluids (F, Li) are easily extracted from the melt, but other volatiles of a higher molar weight (Be, B) remain in the melt. This leads to the difference between TPD and the usual TP, in which it is the essentially the temperature that controls fluid exsolution.
5.2. Importance of a Subcritical State
In contrast with PDs, the heat source that generates, b, the plate subduction, and thus allows for the perennial melting of the mantle wedge and lower crust in TPDs strongly depends on the frictional stress generated by the oblique collision between continental plates. By nature, the oblique collision may vary in direction, thus modifying the transpressional character of the tectonics.
Nevertheless, the basal zone of friction remains close to the critical point, as attested by the lack of biotite breakdown involved, and the very low amount of mantle-derived components, especially S compounds. Consequently, the transport properties of the metals obtained through mobile MIP assist in the segregation of metals, in spite of their low diffusivity values (Figure 13).
The fact that the magma remains in a subcritical state also enhances metal segregation in the melt and MIPs [102]. The partition coefficients for metals into granitic melt and pegmatites is boosted by at least one order of magnitude.
5.3. Chemical Fate of the MIP Components
The fate of the magma mostly depends on the MIP conditions, since the silicate polymers that constitute melt are a function of the bulk temperature and metals are advected in such MIPs. However, the bulk evolution of these components, including oxidation, appears to be at odds with each other, for example, the melt, the fluids, ore formation, and pegmatites, as observed in the descriptors’ diagrams (Figure 9).
The latter trend (oxidation) is the easiest to explain, since a medium under a critical state is also a powerful oxidation medium. It controls the evolution of tin that rapidly passes to cassiterite (SnO2). In fact, recent studies demonstrate that Sn[IV] is already the dominant state in crustal rocks. Hence, Sn[II] compounds are not as stable as Sn[IV], which involves all four outer electrons in its bonding (see Section 4.5). The transition occurs just above the QFM buffer, with Sn[II] showing higher solubility than Sn[IV] (Figure 15). In consequence, two possibilities exist for tin ore formation, both under cassiterite. A fast cooling at a constant oxygen partial pressure (fO2) reaches the HM buffer, yielding the precipitation of cassiterite (Figure 15). In contrast, the common trend is to follow the QFM buffer during a slow cooling process, also involving the precipitation of cassiterite.
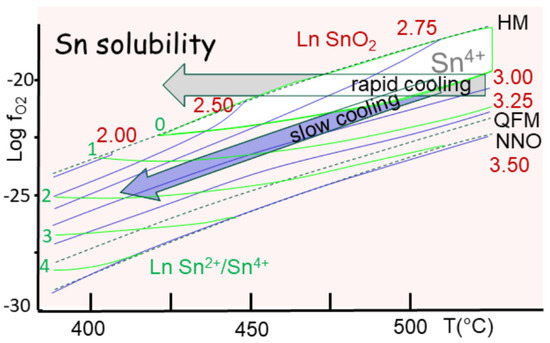
Figure 15.
Solubility of tin (in log ppm), showing two aspects—Sn[II] and Sn[IV] (redrawn from [97]. Tin is essentially sensible to redox between the nickel–nickel oxide (NNO), quartz–fayalite–magnetite (QFM) and hematite–magnetite (HM) buffers—all indicated by dashes. The field of Sn[IV] dominant is indicated, close to the HM trend. Two modes of cooling are superimposed on the buffers. One is rapid at constant fO2, and the second is slower, following the buffers; both are indicated from above 500 to about 420 °C.
5.3.1. The Origins of the MIP Components
This section focuses on the relationships between MIP and the genesis of pegmatites and gems.
The granitic melt by itself is the product of the melting of hydrous micas, muscovites, and biotites. The first are phyllosilicates with K and Al, whereas biotites are also phyllosilicates with Mg and Fe. These are the most important carriers of rare alkalis (Li, Rb, and Cs). Thus, mica breakdown liberates an important amount of Li, ranging from 5000 to 35,000 ppm.
The major elements enhancing the formation of pegmatites and gems are the volatile elements (F, Li, Be, B), which are also characterized by a large chemical hardness, making them unable to form compounds with other elements. They enter the composition of lepidolite and petalite (Li compounds), associated with A-granites. In contrast, S-granites link with B3 and BO3 compounds linked to six SiO3 rings, forming beryls and tourmalines. It is surprising, and paradoxical, that the light lithophile elements (Li, Be, B) also present the highest molar weight (6.941, 9.012 and 10.80 g/mole) and a similar covalent radius (84 to 90 pm), but that their silicate oxide compounds present the highest polarizability values (from 540 to 900 units) (Figure 16). Consequently, their light weight identifies them as volatile elements, whereas their polarizability makes them incompatible with fluid solvent (F, Cl, S). The result is the formation and individualization of gemstones, but with a large crystallin network that accommodates the trace elements (Cr, Fe, V) that give them their colours. Among the rock-forming minerals, cordierite, calcic oligoclase, and muscovite control the fate of Be in this order owing to the compatibility of Be in these phases, illustrating its affiliation with alkaline earth elements. Boron’s isotopic fractionation between modern biogenic carbonates and seawater was studied and found to be a function of pH. This reflects a major sink during the low-temperature alterations in the oceanic crust due to its adsorption on clay-rich sediments as the product of continental erosion rivers. Therefore, it seems normal to find volatiles that are associated with sediment-derived melt.
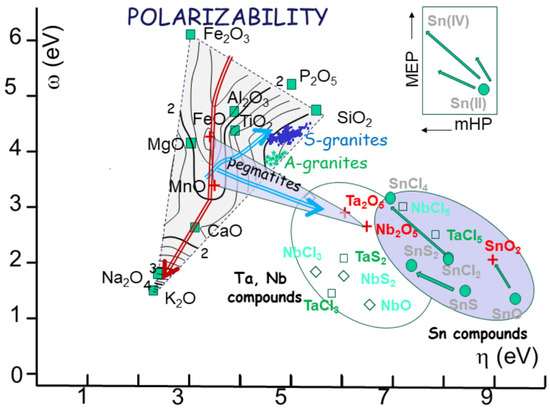
Figure 16.
Field of the pegmatites within a [c-h] coordinates (rotated: (a) the change in chemical composition between A-type and S-type granites; (b) change in hardness; (c) charge exchange from one pole to the other). (a) Box of the pegmatites within [c-h] coordinates (rotated for convenience). (a) The box is calibrated in a/(a + b), indicating the respective ratio of Fe and Mn compared to Ta and Nb. The fields of A and S granites, corresponding to NYF and LCT pegmatites, are indicated. The fields of columbite, tantalite, tapiolite and petalite, spodumene, and beryl are indicated. (b) The same box, but calibrated in terms of polarizability, showing the large difference between oxides (about 2 to 100). (c) Charge exchange computed between the poles of the pegmatite box. The change is always low (below 1 unit), increasing from Fe-Mn to Ta-Nb oxides.
The reaction mechanisms that are involved are also in question. The chemical evolution of the magma components is usually ruled by electron exchanges between components (Figure 8). The chemical descriptors determine the reactions according to their respective hardness. They lead to the charge-controlled (CC) and frontier molecular orbital (FMO) control (see Section 2.2). Apparently, this is not the case for the highly polarized molecules in pegmatites and gems. The evolution of volatiles within the MIP is also problematic.
5.3.2. MIP in Pegmatites
For simplicity, pegmatites are classified as LCT and NFY, although a better definition would consider the host magma from S-type and A-granites. The discussion also involves the Fe-Mn and Nb-Ta oxides box (Figure 16 and Figure 17). Within this box, trends are plotted reflecting the evolution of columbite, tantalite, and tapiolote on the side of A-granites, and petalite on the side of S-magmas (Figure 16). This is essentially based on the reactive content in each oxide.
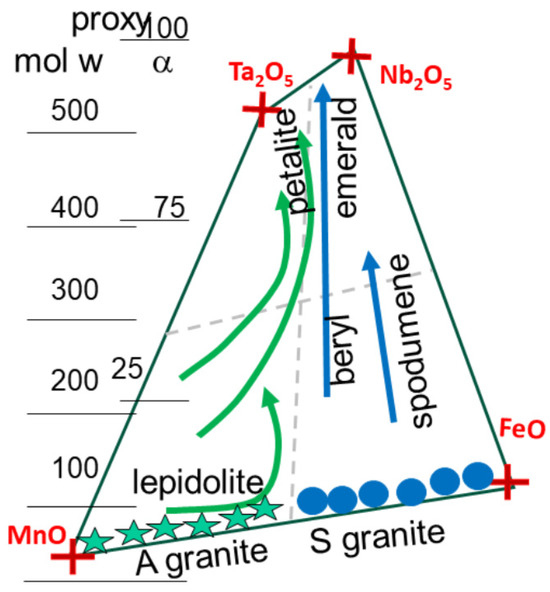
Figure 17.
Box of the pegmatites within [c-h] coordinates (rotated for convenience and enlarged for readability). Within the box, the trends in gems are indicated: lepidolite and petalite for A-granites; beryls, emeralds, and spodumene for S-granites. As proxies, the molecular weight in g/mole and the value of polarizability (a) in cm−3 are indicated.
Minerals yielding pegmatites present elevated polarizability (Figure 16b). For anions, polarizability is directly proportional to their charge and size. Polarizability increases as the volume occupied by electrons increases. This occurs because larger atoms have more loosely held electrons, in contrast to smaller atoms, with tightly bound electrons. Within halogens, F is the least polarizable, while Iodine is the most polarizable. Indeed, iodine has a larger and more diffuse electron cloud, allowing for electron movement within the electron cloud. Both Ta2O5 and Nb2O5 present heavy molecules, 442.9 and 265.8 g/Omole, respectively.
Of more interest, the charge exchange (Equation (9)) is computed from one pole (Fe O or MnO towards another place within the box (Figure 16c). The charges involved are not very large, hardly reaching 1 eV. This demonstrates that the evolution is nearly continuous between the elements constituting pegmatites, explaining the easy growth in crystals. No rate can be inferred from such diagrams.
The apparent symmetry between the sub-categories (NYF and LCT) also indicates that the process should occur via the same mechanism in both magma types. Nevertheless, the A-type seems controlled by Be, whereas Li should control the S-magma. This agrees with the deep origin within the crust of such fluids.
5.3.3. MIP in Gemstones
The situation becomes extreme when considering gemstones that are ubiquitously observed to be associated with LCT-type pegmatites (Figure 17). Such magmas present molar weight of around 50 g/mole with FeO and MnO, indicating 72 and 71 g/mole. In contrast, gems from the beryl (Be3Al2(SiO3)6 family show values between 276 and 538 g/mole, upward towards the extreme represented by emeralds (Be3Al2(SiO3), with values depending on the trace elements inducing the colours [14]. Gems from the boron series consist of tourmaline with the formula (NaMg3Al6(BO3) (SiO3)6 (OH) 6, and a molar mass of about 940 g/mole, correlated with polarizabilities. The latter values are difficult to estimate because of their low content in trace elements (V, Cr), providing their colour.
5.4. Contrasting Behaviour of Metals, Pegmatites, and Gems
The observations of melt inclusions in granites, ores, pegmatites, and gems tell a different story [11]. There, spatial distribution is non-random, corresponding to the different mechanisms ruling their intrinsic repartition.
Commonly, fluid and melt inclusions should be organized in a random or non-random manner. In the last case, three distributions are usually observed, revealing their mechanism of formation, following a Gauss, Lorentz, or Dirac pattern; each reflects the energy interaction between them. A randomly distributed pattern indicates no interaction, as expected. Conversely, a Gaussian distribution, in which each group of particles follows a normal shaped-bell distribution, indicates a diffusive interaction between particles. In a group, the density function of random variables presents an equal probability, with the expected value at the maximum of the curve, and its variance s2 controls the width of the curve at mid-height (Figure 11a). In a second group, or Lorentzian distribution, the density function takes the shape of a triangle, the summit angle of which is the expected value, but has no variance (Figure 11b). At last, the triangular shape shrinks again, forming a Dirac distribution (Figure 11c), which is represented by a segment of line with the maximum at the expected value and nil elsewhere.
In a pioneering study, the distribution of melt inclusions in pegmatites was characterized as Gaussian, whereas tin deposits present a Lorentzian distribution, with sharp peaks, indicating the distribution in which both the expected value and its variance are undefined [11]. This corresponds to spikes in the sudden release of tin. In contrast, the rare melt inclusions in gems indicate a Dirac distribution, with only local spikes (Figure 11c). Their low formation temperature (400–450 °C) indicates a late crystallization, i.e., a highly evolved, fluid, quasi-mono mineral.
The interpretation of the three distributions becomes evident when considering the interactions between melt inclusions during their formation. In the case of tin ore, melt and ore present similar values of chemical hardness and polarizability. Their interactions are akin to diffusion, resulting in melt inclusions that are equally affected by the interactions during cascading energy (Figure 11). Conversely, in pegmatites, the increase in polarizability contrast turns the bell-shaped curve into a Lorentzian triangle. This effect is still reinforced for gems, with the double effect of chemical hardness and polarizability contrasts. Their low formation temperature (400–450 °C) indicates a late crystallization, i.e., a highly evolved, fluid, quasi-mono mineral, justifying the Dirac distribution.
6. Conclusions
When initiating this paper, the idea was to identify the formation of Sn ore deposits within continental magmatism free of mantle-derived heat sources. A first approach, dealing with the physical conditions of the magma (viscosity, metal diffusivity, and MIP), was soon revealed to be at odds with many acknowledged concepts. For instance, the problem of fluids in a subcritical state was generally largely underestimated. The coeval formation of pegmatites, greisen, and gemstones was treated as a continuous chemical evolution throughout diffusion. Again, the parameters (temperature, viscosity, diffusion, and fluid amount) were set without a real quantified amount and values. The energy interactions were totally ignored. The suggested model was too close to that of a former study [11], and we were surprised to see that rejections were successively presented, mostly based on formal grounds, without any comment on the ideas. This last point motivated the adoption of a totally different point of view, which is still mostly at odds with a gentle chemical differentiation.
Funding
This research received no external funding.
Data Availability Statement
The original contributions for this paper are included in the article. Further inquiries can be directed to the corresponding author.
Acknowledgments
This paper has benefited from studies on pegmatites and greisen by the groups of Rainer Thomas (GFZ, Potsdam) and Karel Breiter (Czech Geol Survey, Prague) for Erzgebirge, Bohemia; and Barrie Clarke (Dalhousie Univ) and Daniel Kontak (Laurentian Univ, Sudbury) for Nova Scotia. They are warmly acknowledged. J.L.V. was later very impressed with the experimental studies on supercritical fluids at the lab of Tsuchiya Noriyoshu, Tohokudai University Sendai, while on sabbatical at the AIST, Tsukuba, invited by Sunsho Ishihara. J.L.V. was invited to the IIT Kharagpur, India, where he was introduced to the HSAB concepts. The funding by CREGU and GeoRessources and Nancy is also acknowledged.
Conflicts of Interest
The author declares the non-existence of any financial interests/personal relationships.
References
- Robb, L. Introduction to Ore-Forming Processes; John Wiley & Sons: Hoboken, NJ, USA, 2021. [Google Scholar]
- Gardien, V.; Thompson, A.B.; Grujic, D.; Ulmer, P. Experimental melting of biotite+ plagioclase+ quartz±muscovite assemblages and implications for crustal melting. J. Geophys. Res. Solid Earth 1995, 100, 15581–15591. [Google Scholar] [CrossRef]
- Arndt, N.T.; Lesher, C.M.; Czamanske, G.K. Mantle-derived magmas and magmatic Ni-Cu-(PGE) deposits. Econ. Geol. 2005, 5–24. [Google Scholar] [CrossRef]
- Richards, J.P. Porphyry copper deposit formation in arcs: What are the odds? Geosphere 2022, 18, 130–155. [Google Scholar] [CrossRef]
- Frost, C.D.; Frost, B.R. On ferroan (A-type) granitoids: Their compositional variability and modes of origin. J. Petrol. 2011, 52, 39–53. [Google Scholar] [CrossRef]
- Štemprok, M.; Novák, J.K.; David, J. The association between granites and tin-tungsten mineralization in the eastern Krušné hory (Erzgebirge), Czech Republic. Monograph. Ser. Miner. Depos. 1994, 31, 97–129. [Google Scholar]
- Sillitoe, R.H. Porphyry copper systems. Econ. Geol. 2010, 105, 3–41. [Google Scholar] [CrossRef]
- Williams-Jones, A.E.; Heinrich, C.A. 100th Anniversary special paper: Vapor transport of metals and the formation of magmatic-hydrothermal ore deposits. Econ. Geol. 2005, 100, 1287–1312. [Google Scholar] [CrossRef]
- Barnes, S.J.; Staude, S.; Le Vaillant, M.; Piña, R.; Lightfoot, P.C. Sulfide-silicate textures in magmatic Ni-Cu-PGE sulfide ore deposits: Massive, semi-massive and sulfide-matrix breccia ores. Ore Geol. Rev. 2018, 101, 629–651. [Google Scholar] [CrossRef]
- Spivack, A.J.; Palmer, M.R.; Edmond, J.M. The sedimentary cycle of the boron isotopes. Geochim. Cosmochim. Acta 1987, 51, 1939–1949. [Google Scholar] [CrossRef]
- Vigneresse, J.L.; Poddar, A.; Chattaraj, P.K. Felsic trans-porphyry deposits and associated ore (Sn, Ta, Nb, pegmatites) viewed from physics, chemistry (cDFT) and geologic contexts. Lithos 2025, 514–515, 108200. [Google Scholar] [CrossRef]
- de Saint Blanquat, M.; Tikoff, B.; Teyssier, C.; Vigneresse, J.L. Transpressional kinematics and magmatic arcs. Geol. Soc. Lond. Spec. Publ. 1998, 135, 327–340. [Google Scholar] [CrossRef]
- Thomas, R.; Davidson, P.; Appel, K. The enhanced element enrichment in the supercritical states of granite–pegmatite systems. Acta Geochim. 2019, 38, 335–349. [Google Scholar] [CrossRef]
- Vigneresse, J.L.; Truche, L.; Richard, A. How do metals escape from magmas to form porphyry-type ore deposits? Ore Geol. Rev. 2019, 105, 310–336. [Google Scholar] [CrossRef]
- Veksler, I.V.; Thomas, R.; Schmidt, C. Experimental evidence of three coexisting immiscible fluids in synthetic granitic pegmatite. Am. Mineral. 2002, 87, 775–779. [Google Scholar] [CrossRef]
- Vigneresse, J.L.; Truche, L. Modeling ore generation in a magmatic context. Ore Geol. Rev. 2020, 116, 103223. [Google Scholar] [CrossRef]
- Huber, C.; Bachmann, O.; Vigneresse, J.L.; Dufek, J.; Parmigiani, A. A physical model for metal extraction and transport in shallow magmatic systems. Cambridge University Press. Geochem. Geophys. Geosyst. 2012, 13, 8. [Google Scholar] [CrossRef]
- Yakymchuk, C.; Brown, M. Consequences of open-system melting in tectonics. J. Geol. Soc. 2014, 171, 21–40. [Google Scholar] [CrossRef]
- Ansermet, J.P.; Brechet, S.D. Principles of Thermodynamics; Cambridge University Press: Cambridge, UK, 2019. [Google Scholar]
- Gasparik, T. Phase Diagrams for Geoscientists; Springer: Berlin/Heidelberg, Germany, 2014. [Google Scholar] [CrossRef]
- Liu, A.J.; Nagel, S.R. Jamming is not just cool any more. Nature 1998, 396, 21–22. [Google Scholar] [CrossRef]
- Hobbs, B.E.; Ord, A. The mechanics of granitoid systems and maximum entropy production rates. Philos. Trans. R. Soc. A Math. Phys. Eng. Sci. 2010, 368, 53–93. [Google Scholar] [CrossRef] [PubMed]
- Vigneresse, J.L.; Truche, L. Chemical descriptors for describing physico-chemical properties with applications to geosciences. J. Mol. Model. 2018, 24, 231. [Google Scholar] [CrossRef]
- White, A.J.R. Water, restite and granite mineralisation. Aust. J. Earth Sci. 2001, 48, 551–555. [Google Scholar] [CrossRef]
- Vielzeuf, D.; Schmidt, M.W. Melting relations in hydrous systems revisited: Application to metapelites, metagreywackes and metabasalts. Contrib. Mineral. Petrol. 2001, 141, 251. [Google Scholar] [CrossRef]
- Johnson, T.I.M.; Brown, M. Quantitative constraints on metamorphism in the Variscides of Southern Brittany—A complementary pseudosection approach. J. Petrol. 2004, 45, 1237–1259. [Google Scholar] [CrossRef]
- Villeneuve, M.; Wazi, N.; Kalikone, C.; Gärtner, A. A review of the G4 “tin granites” and associated mineral occurrences in the Kivu Belt (Eastern Democratic Republic of the Congo) and their relationships with the last Kibaran tectono-thermal events. Minerals 2022, 12, 737. [Google Scholar] [CrossRef]
- Wulff, K.; Bolhar, R. Geochemistry of alteration and host rock lithologies to the Bisie tin deposit, North Kivu Province, DR Congo. Ore Geol. Rev. 2025, 178, 106469. [Google Scholar] [CrossRef]
- Batt, G.E.; Braun, J. The tectonic evolution of the Southern Alps, New Zealand: Insights from fully thermally coupled dynamical modelling. Geophys. J. Int. 1999, 136, 403–420. [Google Scholar] [CrossRef]
- King, D.S.; Klepeis, K.A.; Goldstein, A.G.; Gehrels, G.E.; Clarke, G.L. The initiation and evolution of the transpressional Straight River shear zone, central Fiordland, New Zealand. J. Struct. Geol. 2008, 30, 410–430. [Google Scholar] [CrossRef]
- Tulloch, A.J.; Ramezani, J.; Kimbrough, D.L.; Faure, K.; Allibone, A.H. U-Pb geochronology of mid-Paleozoic plutonism in western New Zealand: Implications for S-type granite generation and growth of the east Gondwana margin. Geol. Soc. Am. Bull. 2009, 121, 1236–1261. [Google Scholar] [CrossRef]
- Lehmann, B. Tin granites, geochemical heritage, magmatic differentiation. Geol. Rundsch. 1987, 76, 177–185. [Google Scholar] [CrossRef]
- Oncken, O. Transformation of a magmatic arc and an orogenic root during oblique collision and its consequences for the evolution of the European Variscides (Mid-German Crystalline Rise). Geol. Rundsch. 1997, 86, 2–20. [Google Scholar] [CrossRef]
- Edel, J.B. Le socle varisque de l’Europe moyenne. Apports du magnétisme et de la gravimétrie. Sci. Géologiques Bull. Mémoires 1982, 35, 207–224. [Google Scholar] [CrossRef]
- Kontak, D.J.; Ansdell, K.; Dostal, J.; Halter, W.; Martin, R.; Williams-Jones, A.E. The nature and origin of pegmatites in a fluorine-rich leucogranite, East Kemptville tin deposit, Nova Scotia, Canada. Earth Environ. Sci. Trans. R. Soc. Edinb. 2001, 92, 173–200. [Google Scholar] [CrossRef]
- Breiter, K.; Förster, H.J.; Seltmann, R. Variscan silicic magmatism and related tin-tungsten mineralization in the Erzgebirge-Slavkovský les metallogenic province. Miner. Depos. 1999, 34, 505–521. [Google Scholar] [CrossRef]
- Chauris, L. Pegmatites à allanite et molybdénite dans le granite de Ploumanac’h (Côtes-du-Nord). Bull. Minéralogie 1958, 81, 150–153. [Google Scholar] [CrossRef]
- Edel, J.B.; Schulmann, K.; Rotstein, Y. The Variscan tectonic inheritance of the Upper Rhine Graben: Evidence of reactivations in the Lias, Late Eocene–Oligocene up to the recent. Int. J. Earth Sci. 2007, 96, 305–325. [Google Scholar] [CrossRef]
- Ellis, S.; Fullsack, P.; Beaumont, C. Oblique convergence of the crust driven by basal forcing: Implications for length-scales of deformation and strain partitioning in orogens. Geophys. J. Int. 1995, 120, 24–44. [Google Scholar] [CrossRef]
- Williamson, B.J.; Stanley, C.J.; Wilkinson, J.J. Implications from inclusions in topaz for greisenisation and mineralisation in the Hensbarrow topaz granite, Cornwall, England. Contrib. Mineral. Petrol. 1997, 127, 119–128. [Google Scholar] [CrossRef]
- Breiter, K.; Müller, A.; Leichmann, J.; Gabašová, A. Textural and chemical evolution of a fractionated granitic system: The Podlesí stock, Czech Republic. Lithos 2005, 80, 323–345. [Google Scholar] [CrossRef]
- Heslot, F.; Baumberger, T.; Perrin, B.; Caroli, B.; Caroli, C. Creep, stick-slip, and dry-friction dynamics: Experiments and a heuristic model. Phys. Rev. E 1994, 49, 4973. [Google Scholar] [CrossRef]
- Bouchez, J.L.; Nicolas, A. Principles of Rock Deformation and Tectonics; Oxford University Press: Oxford, UK, 2021; ISBN 9780192843876. [Google Scholar]
- Fossen, H.; Tikoff, B. Extended models of transpression and transtension, and application to tectonic settings. Geol. Soc. Lond. Spec. Publ. 1998, 135, 15–33. [Google Scholar] [CrossRef]
- Fossen, H.; Tikoff, B.; Teyssier, C. Strain modeling of transpressional and transtensional deformation. Nor. Geol. Tidsskr. 1994, 74, 134–145. [Google Scholar]
- Fossen, H.; Cavalcante, G.C.G. Shear zones—A review. Earth-Sci. Rev. 2017, 171, 434–455. [Google Scholar] [CrossRef]
- Ruina, A.L. Unsteady motions between sliding surfaces. Wear 1986, 113, 83–86. [Google Scholar] [CrossRef]
- Byerlee, J.D. Friction of rocks. Pure Appl. Geophys. 1978, 116, 615–626. [Google Scholar] [CrossRef]
- Byerlee, J.D. The mechanics of stick-slip. Tectonophysics 1970, 9, 475–486. [Google Scholar] [CrossRef]
- Vigneresse, J.L.; Cenki, B. Multiphase rheology as a cause for stick-slip like melt extraction. Earth Planet. Sci. Lett. 2022, 577, 117269. [Google Scholar] [CrossRef]
- Ruina, A. Slip instability and state variable friction laws. J. Geophys. Res. 1983, 88, 10359–10370. [Google Scholar] [CrossRef]
- Dieterich, J.H. Modeling of rock friction: 1. Experimental results and constitutive equations. J. Geophys. Res. 1979, 84, 2161–2168. [Google Scholar] [CrossRef]
- Marone, C.; Cocco, M.; Richardson, E.; Tinti, E. The critical slip distance for seismic and aseismic fault zones of finite width. Int. Geophys. 2009, 94, 135–162. [Google Scholar] [CrossRef]
- Voisin, C.; Renard, F.; Grasso, J.R. Long term friction: From stick-slip to stable sliding. Geophys. Res. Lett. 2007, 34, L13301. [Google Scholar] [CrossRef]
- Wong, Y.Q.; Keller, T. A unified numerical model for two-phase porous, mush and suspension flow dynamics in magmatic systems. Geophys. J. Int. 2023, 233, 769–795. [Google Scholar] [CrossRef]
- Vigneresse, J.L.; Burg, J.P. Continuous vs. discontinuous melt segregation in migmatites: Insights from a cellular automaton model. Terra Nova 2000, 12, 188–192. [Google Scholar] [CrossRef]
- Myers, R. The Basics of Chemistry; Greenwood Publishing Group: Westport, CT, USA, 2009; p. 55. ISBN 978-0-313-31664-7. [Google Scholar]
- Vigneresse, J.L. Revisiting immiscibility through DFT chemical descriptors. Theor. Chem. Acc. 2020, 139, 142. [Google Scholar] [CrossRef]
- Ghanty, T.K.; Ghosh, S.K. Density functional study of the relationship between energy, hardness, and polarizability of molecules in nonequilibrium situations. Int. J. Quantum Chem. 1997, 63, 917–926. [Google Scholar] [CrossRef]
- Nagle, J.K. Atomic polarizability and electronegativity. J. Am. Chem. Soc. 1990, 112, 4741–4747. [Google Scholar] [CrossRef]
- Anderson, J.S.; Melin, J.; Ayers, P.W. Conceptual density-functional theory for general chemical reactions, including those that are neither charge-nor frontier-orbital-controlled. 1. Theory and derivation of a general-purpose reactivity indicator. J. Chem. Theory Comput. 2007, 3, 358–374. [Google Scholar] [CrossRef]
- Guégan, F.; Abid-Charef, Y.; Hoffmann, G.; Chermette, H.; Morell, C. Finishing (off) the Klopman–Salem model: The importance of density polarization energy. Theor. Chem. Acc. 2023, 142, 104. [Google Scholar] [CrossRef]
- Pearson, R.G. Absolute electronegativity and hardness: Application to inorganic chemistry. Inorg. Chem. 1988, 27, 734–740. [Google Scholar] [CrossRef]
- Parr, R.G.; Chattaraj, P.K. Principle of maximum hardness. J. Am. Chem. Soc. 1991, 113, 1854–1855. [Google Scholar] [CrossRef]
- Pan, S.; Sola, M.; Chattaraj, P.K. On the validity of the maximum hardness principle and the minimum electrophilicity principle during chemical reactions. J. Phys. Chem. A 2013, 117, 1843–1852. [Google Scholar] [CrossRef]
- Chattaraj, P.K.; Fuentealba, P.; Jaque, P.; Toro-Labbé, A. Validity of the minimum polarizability principle in molecular vibrations and internal rotations: An ab initio SCF study. J. Phys. Chem. A 1999, 103, 9307–9312. [Google Scholar] [CrossRef]
- Chattaraj, P.K.; Roy, D.R. Update 1 of: Electrophilicity index. Chem. Rev. 2007, 107, PR46–PR74. [Google Scholar] [CrossRef]
- Bowen, N.L. The order of crystallization in igneous rocks. J. Geol. 1912, 20, 457–468. [Google Scholar] [CrossRef]
- Fenner, C.N.; Piggot, C.S. The mass-spectrum of lead from bröggerite. Nature 1929, 123, 793–794. [Google Scholar] [CrossRef]
- Villiger, S.; Ulmer, P.; Müntener, O.; Thompson, A.B. The liquid line of descent of anhydrous, mantle-derived, tholeiitic liquids by fractional and equilibrium crystallization—An experimental study at 1· 0 GPa. J. Petrol. 2004, 45, 2369–2388. [Google Scholar] [CrossRef]
- Faure, F.; Tissandier, L. Contrasted liquid lines of descent revealed by olivine-hosted melt inclusions and the external magma. J. Petrol. 2014, 55, 1779–1798. [Google Scholar] [CrossRef]
- Lu, T.; Chen, F. Multiwfn: A multifunctional wavefunction analyzer. J. Comput. Chem. 2012, 33, 580–592. [Google Scholar] [CrossRef]
- Lu, T.; Chen, Q. Realization of conceptual density functional theory and information-theoretic approach in Multiwfn Program. Concept. Density Funct. Theory Towards A New Chem. React. Theory 2022, 2, 631–647. [Google Scholar] [CrossRef]
- Lee, A.L.; Lloyd, G.E.; Torvela, T.; Walker, A.M. Evolution of a shear zone before, during and after melting. J. Geol. Soc. 2020, 177, 738–751. [Google Scholar] [CrossRef]
- Shannon, C.E. A Mathematical Theory of Communication. Bell Syst. Tech. J. 1948, 27, 379–423. [Google Scholar] [CrossRef]
- Ellerman, D. An introduction to logical entropy and its relation to Shannon entropy. Int. J. Semant. Comput. 2013, 7, 121–145. [Google Scholar] [CrossRef]
- Heřmanská, M.; Kleine, B.I.; Stefánsson, A. Supercritical fluid geochemistry in geothermal systems. Geofluids 2019, 2019, 6023534. [Google Scholar] [CrossRef]
- Breton, N.L.; Thompson, A.B. Fluid-absent (dehydration) melting of biotite in metapelites in the early stages of crustal anatexis. Contrib. Mineral. Petrol. 1988, 99, 226–237. [Google Scholar] [CrossRef]
- Thomas, R.; Davidson, P. Revisiting complete miscibility between silicate melts and hydrous fluids, and the extreme enrichment of some elements in the supercritical state—Consequences for the formation of pegmatites and ore deposits. Ore Geol. Rev. 2016, 72, 1088–1101. [Google Scholar] [CrossRef]
- Tsuchiya, N.; Hirano, N. Chemical reaction diversity of geofluids revealed by hydrothermal experiments under sub-and supercritical states. Isl. Arc 2007, 16, 6–15. [Google Scholar] [CrossRef]
- Boero, M.; Parrinello, M.; Terakura, K.; Ikeshoji, T.; Liew, C.C. First-principles molecular-dynamics simulations of a hydrated electron in normal and supercritical water. Phys. Rev. Lett. 2003, 90, 226403. [Google Scholar] [CrossRef]
- London, D. Granitic pegmatites: An assessment of current concepts and directions for the future. Lithos 2005, 80, 281–303. [Google Scholar] [CrossRef]
- Candela, P.A.; Piccoli, P.M. Magmatic processes in the development of porphyry-type ore systems. Econ. Geol. 2005, 25–37. [Google Scholar] [CrossRef]
- Barner, H.E.; Huang, C.Y.; Johnson, T.; Jacobs, G.; Martch, M.A.; Killilea, W.R. Supercritical water oxidation: An emerging technology. J. Hazard. Mater. 1992, 31, 1–17. [Google Scholar] [CrossRef]
- Giordano, D.; Russell, J.K.; Dingwell, D.B. Viscosity of magmatic liquids: A model. Earth Planet. Sci. Lett. 2008, 271, 123–134. [Google Scholar] [CrossRef]
- Brunner, G. Near and supercritical water. Part II: Oxidative processes. J. Supercrit. Fluids 2009, 47, 382–390. [Google Scholar] [CrossRef]
- Zhang, Y.; Ni, H.; Chen, Y. Diffusion data in silicate melts. Rev. Mineral. Geochem. 2010, 72, 311–408. [Google Scholar] [CrossRef]
- Kühne, T.D. Second generation Car–Parrinello molecular dynamics. Wiley Interdiscip. Rev. Comput. Mol. Sci. 2014, 4, 391–406. [Google Scholar] [CrossRef]
- Breiter, K.; Hložková, M.; Korbelová, Z.; Galiová, M.V. Diversity of lithium mica compositions in mineralized granite–greisen system: Cínovec Li-Sn-W deposit, Erzgebirge. Ore Geol. Rev. 2019, 106, 12–27. [Google Scholar] [CrossRef]
- Sanyal, A.; Bijma, J. A comparative study of the northwest Africa and eastern equatorial Pacific upwelling zones as sources of CO2 during glacial periods based on boron isotope paleo-pH estimation. Paleoceanography 1999, 14, 753–759. [Google Scholar] [CrossRef]
- Handy, M.R.; Mulch, A.; Rosenau, M.; Rosenberg, C.L. The role of fault zones and melts as agents of weakening, hardening and differentiation of the continental crust: A synthesis. In The Nature and Tectonic Significance of Fault Zone Weakening; Geological Society of London: London, UK, 2001; Volume 186, p. 305. [Google Scholar] [CrossRef]
- Phelps, P.R.; Lee, C.T.A.; Morton, D.M. Episodes of fast crystal growth in pegmatites. Nat. Commun. 2020, 11, 4986. [Google Scholar] [CrossRef]
- Giuliani, G.; Groat, L.A.; Marshall, D.; Fallick, A.E.; Branquet, Y. Emerald deposits: A review and enhanced classification. Minerals 2019, 9, 105. [Google Scholar] [CrossRef]
- Michaud, J.A.S.; Schmidt, C.; Naumova, M.A. Revisiting redox-driven pathways of tin cycle from source to economic deposit. Sci. Rep. 2025, 15, 34476. [Google Scholar] [CrossRef]
- Gao, X.; Michaud, J.A.S.; Koch, L.; Zhou, Z.; Zhang, C.; Horn, I.; Allmeev, R.R.; Weer, S.; Holtz, F. Lithium isotope fractionation between mica, quartz, amphibole, feldspars, and granitic melt: Experimental approach and implications for natural granitic systems. Geochim. Cosmochim. Acta 2025, 407, 12–31. [Google Scholar] [CrossRef]
- Simon, L.; Lécuyer, C.; Maréchal, C.; Coltice, N. Modelling the geochemical cycle of boron: Implications for the long-term δ11B evolution of seawater and oceanic crust. Chem. Geol. 2006, 225, 61–76. [Google Scholar] [CrossRef]
- Liu, X.; Yu, P.; Xiao, C. Tin transport and cassiterite precipitation from hydrothermal fluids. Geosci. Front. 2023, 14, 101624. [Google Scholar] [CrossRef]
- Lécuyer, C.; Grandjean, P.; Reynard, B.; Albarède, F.; Telouk, P. 11B/10B analysis of geological materials by ICP–MS Plasma 54: Application to the boron fractionation between brachiopod calcite and seawater. Chem. Geol. 2002, 186, 45–55. [Google Scholar] [CrossRef]
- Černý, P.; Ercit, T.S. The classification of granitic pegmatites revisited. Can. Mineral. 2005, 43, 2005–2026. [Google Scholar] [CrossRef]
- London, D. A petrologic assessment of internal zonation in granitic pegmatites. Lithos 2014, 184, 74–104. [Google Scholar] [CrossRef]
- Giuliani, G.; Chaussidon, M.; Schubnel, H.J.; Piat, D.H.; Rollion-Bard, C.; France-Lanord, C.; Giard, D.; de Narvaaez, D.; Rondeau, B. Oxygen isotopes and emerald trade routes since antiquity. Science 2000, 287, 631–633. [Google Scholar] [CrossRef]
- Thomas, R.; Rericha, A. Extreme element enrichment by the interaction of supercritical fluids from the mantle with crustal rocks. Minerals 2024, 15, 33. [Google Scholar] [CrossRef]


Disclaimer/Publisher’s Note: The statements, opinions and data contained in all publications are solely those of the individual author(s) and contributor(s) and not of MDPI and/or the editor(s). MDPI and/or the editor(s) disclaim responsibility for any injury to people or property resulting from any ideas, methods, instructions or products referred to in the content. |
© 2026 by the author. Licensee MDPI, Basel, Switzerland. This article is an open access article distributed under the terms and conditions of the Creative Commons Attribution (CC BY) license.