


Abstract
Near-surface air temperature is the main atmospheric forcing of frozen-ground systems in maritime Antarctica, yet most studies have emphasized mean annual or seasonal trends rather than thermal-regime evolution. This study analyzes hourly air-temperature records from eight PERMATHERMAL monitoring stations on Livingston and Deception Islands (South Shetland Islands, Antarctica) for 2000–2022 to evaluate changes in mean conditions, daily thermal regimes, degree-day forcing, and their implications for frozen ground. Hourly data were aggregated to daily, monthly, annual, and thermal-year scales, and valid days were classified into six thermal regimes (F1, F2, IS, FT, T2, and T1). FDD, TDD, annual degree-day balance (BDD), and freezing and thawing season duration were also calculated. Recent warming is expressed not only as higher mean annual air temperature, but also as a reorganization of the annual thermal regime, with fewer cold days, more thaw-related conditions, and less negative BDD values at most stations. These changes are consistent with previously reported GST evolution and indicate a shift in atmospheric forcing toward weaker freezing dominance and more thaw-favorable conditions. However, their implications for active-layer thickness and permafrost stability should be interpreted as climatic indications rather than as the direct evidence of ground thermal change.
1. Introduction
The Antarctic Peninsula and the South Shetland Islands are among the most climatically dynamic sectors of Antarctica. Strong warming during the second half of the twentieth century made this region a key reference for rapid polar environmental change, although subsequent decades showed that this signal was neither spatially uniform nor temporally monotonic [1,2,3,4,5,6]. Within this broader context, the South Shetland Islands are especially sensitive because they lie close to the annual migration of the 0 °C isotherm and host some of the warmest and most thermally marginal permafrost environments in Antarctica [7,8,9,10,11].
This sensitivity is particularly relevant for Livingston and Deception islands, where frozen ground is widespread but commonly close to its climatic limit [9]. Previous studies have shown that permafrost occurrence in these islands is highly heterogeneous, strongly controlled by local conditions, and absent or marginal at low elevations, while remaining probable or confirmed at colder high-elevation sites and in parts of Deception Island [10,12,13,14]. In such settings, relatively small shifts in atmospheric forcing may have disproportionate consequences for active-layer thickness, top-of-permafrost temperature, and long-term frozen-ground stability [11,15,16].
Most atmospheric studies from the Antarctic Peninsula sector have focused on annual or seasonal temperature trends, or on broad climatological descriptions of individual stations and regions [1,2,3,5,17,18,19]. These approaches are essential, but they do not fully resolve how warming is distributed within the year, nor whether it is expressed mainly through milder winters, stronger summer warmth, more frequent freeze–thaw transitions, or changes in the annual balance between freezing and thawing conditions. In particular, the intra-annual organization of daily near-surface air-temperature regimes remains poorly documented for the South Shetland Islands, especially in terms of the relative frequency of persistently freezing, near-zero, freeze–thaw, and thawing conditions. This gap is important because changes in the number, timing, and duration of these daily regimes may modify the atmospheric boundary conditions under which seasonal thaw and frozen-ground stability occur. This distinction is important for frozen-ground studies because different expressions of warming are not thermally equivalent from the perspective of seasonal thaw and permafrost existence and stability [8,20].
In Livingston and Deception, increasing air temperature is already evident [e.g., [21,22,23]], and recent analyses of ground surface temperature (GST) from the permanent frozen-ground monitoring stations of the PERMATHERMAL network have shown that climatic change is expressed not only through shifts in mean values, but also through a reorganization of daily thermal regimes, reduced freezing dominance, altered degree-day forcing, and strong modulation by snow cover [e.g., [14,24]]. At the same time, recent atmospheric analyses of Livingston and Deception revealed marked local contrasts in air temperature and wind regime despite the limited spatial extent of the area, highlighting the importance of local orography and mesoscale effects, particularly during winter [6]. Together, these studies indicate that a multi-station network in the western South Shetland Islands provides an excellent opportunity to examine not only whether the atmosphere is warming, but also how that warming is being reorganized seasonally and spatially. The distinctive contribution of the present study is that it combines long-term hourly near-surface air-temperature records from several PERMATHERMAL stations with a daily thermal-regime classification, degree-day indices, season-duration metrics, and the air frost number within a single analytical framework. This allows the atmospheric warming signal to be interpreted not only in terms of mean annual change, but also in terms of its functional expression within the annual thermal calendar and its relevance as climatic forcing for frozen-ground systems.
This issue is especially important because air temperature is the primary external forcing of the ground thermal regime [7,8]. In first-order permafrost formulations, freezing and thawing degree days provide a quantitative link between climate and frozen-ground conditions, and simplified Stefan- or TTOP-type models relate atmospheric thermal forcing to active-layer thickness and top-of-permafrost temperature [8,10,11,16]. In addition, climate-based indices derived from freezing and thawing degree-day sums, such as the air frost number, provide a simple way to assess the climatic favorability for permafrost occurrence and its temporal evolution at station scale, although they do not explicitly account for snow or local ground properties [25]. In the South Shetland Islands, where near-surface permafrost temperatures commonly lie close to 0 °C [11], changes in the annual balance between winter cooling and summer thawing are therefore likely to be especially consequential [16,24]. A broader regional comparison reinforces this point: on King George Island, recent work has shown strong active-layer thickening and permafrost warming under changing degree-day forcing, whereas James Ross Island, east of the Antarctic Peninsula barrier, remains substantially colder and therefore less immediately vulnerable to atmospheric changes of similar magnitude [16,26,27,28].
Against this background, the present study analyzes hourly near-surface air-temperature records from eight PERMATHERMAL stations on Livingston and Deception Islands for the period 2000–2022. This study is guided by three specific research questions: (1) How has air temperature evolved across the network in terms of mean annual conditions, interannual variability, and spatial differences among stations? (2) How are these changes expressed through daily thermal regimes, thermal domains, freezing and thawing degree-day forcing, and the annual structure of the thermal calendar? (3) What do these atmospheric changes, including the evolution of the air frost number, imply for frozen-ground conditions in a region characterized by thermally marginal permafrost environments? The main aim of this study is therefore to characterize how recent warming has altered the annual air-temperature regime of Livingston and Deception Islands and to assess the implications of this reorganization for frozen-ground conditions in maritime Antarctica. In this sense, the contribution of this work is not only to document changes in near-surface air temperature, but also to show how those changes are expressed in thermal-regime terms and how they provide climatic context for interpreting active-layer and permafrost evolution in the South Shetland Islands.
2. Materials and Methods
2.1. Study Sites
The study was conducted using autonomous near-surface air-temperature sensors at eight sites within the PERMATHERMAL monitoring network [e.g., [29]], located on Livingston and Deception Islands, South Shetland Islands, north-western Antarctic Peninsula (Figure 1; Table 1).
Figure 1.
Location of the PERMATHERMAL monitoring stations in Livingston and Deception Islands, South Shetland Islands, maritime Antarctica. (a) Location of the study area in Antarctica. (b) Regional setting of Livingston and Deception Islands within the South Shetland Archipelago, showing CL station on Deception Island and LL on the Byers Peninsula of Livingston Island. (c) Detailed distribution of the JC, NI, IN, CR, MO, and SO stations on Hurd Peninsula of Livingston Island (modified from [23]).
Table 1.
Main characteristics and site descriptors of the PERMATHERMAL monitoring stations used in this study for the 2000–2022 analysis period.
Six stations are distributed along an altitudinal gradient on Hurd Peninsula, Livingston Island; one is on Byers Peninsula, Livingston Island; and the last is located on Deception Island. This spatial distribution is therefore unbalanced, and the results should be interpreted as representative of the monitored PERMATHERMAL sites rather than as a complete spatial characterization of all ice-free areas of Livingston and Deception Islands. Consequently, any regional interpretation derived from these records is restricted to the climatic and geomorphological range represented by the monitored sites and should not be interpreted as a spatial extrapolation to all ice-free terrain in the South Shetland Islands. The network covers an elevation range from 10 to 274 m a.s.l. and includes coastal, low-elevation, and higher inland or open sites in ice-free terrain. The masts were installed on flat or gently sloping ground wherever possible, to minimize local slope-orientation effects on near-surface air-temperature measurements. The sites differ in distance from the coast, qualitative wind exposure, and geomorphological setting and substrate, including raised beaches, slope-foot areas, rock steps, interfluves, morainic deposits, summit areas, and pyroclastic deposits (Table 1). Together, these sites represent contrasting environmental settings within the main ice-free areas monitored by the PERMATHERMAL network in Livingston and Deception Islands [10,14,24]. These descriptors are used to provide environmental context for comparison among stations, but they are not treated as independent quantitative predictors in the present analysis.
The monitoring sites are located in a cold maritime Antarctic climate, characterized by relatively mild but highly variable air temperatures and frequent precipitation, mostly as snow, strong winds, and persistent snow cover during much of the year. Regional observations indicate mean annual air temperatures of approximately −2 to −1 °C at low elevations, with colder conditions at higher sites, although local topography, exposure, and wind regime can generate marked spatial differences over short distances. Snow cover is also highly heterogeneous and strongly affected by wind redistribution, local terrain conditions, and exposure, leading to marked differences in snow depth even between nearby stations [6,23,30,31]. Snow cover is also highly heterogeneous across the PERMATHERMAL sites and is strongly affected by wind redistribution, local terrain conditions, and exposure, producing marked differences in snow depth even between nearby stations [31]. Previous studies have shown that frozen ground in Livingston and Deception is widespread but thermally marginal, with permafrost absent at the lowest sites, close to the threshold of occurrence at intermediate elevations, and probable or confirmed at the colder high-elevation sites and on Deception Island [9,10,12,13,24].
2.2. Instrumentation and Data
This study analyzes near-surface air-temperature records from the eight PERMATHERMAL stations for the 2000–2022 period. Calendar-year analyses were restricted to complete years from 2000 to 2022, whereas records from January–February 2023 were used only where necessary to complete the 2022 thermal year, defined from March 2022 to February 2023. Air temperature was measured using Gemini TinyTag Plus 2 data loggers (from Gemini Data Logger Ltd., Chichester, West Sussex, UK) connected to an external PT100 temperature probe placed inside a radiation shield. Following the WMO methods [32], the probes were mounted on open masts at a nominal height of 160 cm above the ground surface, on flat or gently sloping terrain and away from immediate obstacles (as much as possible under field conditions). The probes were mounted on open masts at a nominal height of 160 cm above the snow-free ground surface, in flat or gently sloping terrain and away from immediate obstacles (as much as possible under field conditions). This configuration was designed to record near-surface atmospheric forcing at frozen-ground monitoring sites rather than to operate as complete meteorological stations. Because the sensors were fixed to the masts, their height relative to the ground remained constant, except in cases of mast damage or maintenance-related repositioning. However, the effective height above the snow surface could vary seasonally due to snow accumulation, ablation, and wind redistribution. Therefore, the records are interpreted as near-surface air temperature measured at a fixed height above the ground, not at a constant height above the instantaneous snow surface.
According to the manufacturer’s specifications, the logger has a reading resolution of 0.02 °C or better, a memory capacity of 32,000 readings, and user-defined logging intervals from 1 s to 10 days [33]; in this study, all stations were operated at an hourly logging interval. The instrumentation and field configuration follow the same general monitoring framework previously used in the PERMATHERMAL network (e.g., [29]). Data were downloaded during the annual field campaigns, when batteries were also replaced and the installations were inspected.
Not all stations covered the full 2000–2022 period, and some records contain gaps caused by sensor malfunction, battery failure, mast damage caused by severe Antarctic environmental conditions, or logistical limitations affecting annual maintenance and data recovery [14,24,29]. No gap-filling procedures were applied. Data coverage was assessed separately for each station to identify gaps, quantify record completeness, and define the valid time units used in the subsequent analyses (Table 1; Figure 2). The records differ in both length and completeness. JC, MO, and SO span 22.85–22.89 years, whereas LL and CL span 13.88–13.92 years. Overall data availability ranges from 60.62% at MO to 94.95% at IN. Stations with lower completeness were retained because the analyses were performed only on valid time units according to the completeness criteria described below, and because these records still provide important spatial, altitudinal, and geomorphological coverage of the monitoring network. This is particularly relevant for MO, which has lower overall data availability but one of the longest records in the dataset and represents an intermediate- to-high elevation moraine site on Hurd Peninsula. Nevertheless, station means and trends should be interpreted as summaries of the available valid records within the 2000–2022 period, rather than as strictly synchronous climatological normals over identical time spans. Comparisons involving stations with shorter or less complete records, especially MO, should therefore be interpreted with caution.
Figure 2.
Data coverage at monitoring stations throughout the 2000–2022 period.
2.3. Data Processing and Quality Control
All data processing and graphical analyses were carried out in R (v4.4.3) within the RStudio (v2024.12.1) environment using custom scripts developed for this study [34,35]. The custom R scripts used for figure generation were developed by the authors, with iterative coding support from ChatGPT 5.5 Thinking [36]. All scripts and graphical outputs were reviewed, tested, and validated by the authors. Final graphical adjustments to figure layout and style were performed manually using Inkscape 1.4.3 [37]. The workflow included the quality control of the raw hourly records; derivation of daily, monthly, annual, and thermal-year summaries; calculation of thermal indices; classification of daily thermal regimes; estimation of freezing and thawing season duration; and spatial analysis of mean-state and trend variables. The study period was restricted to the period from 1 January 2000 to 31 December 2022. Thermal-year analyses were based on a March–February calendar; therefore, records from January–February 2023 were used only where necessary to complete the 2022 thermal year.
Before aggregation, the raw hourly series underwent a quality-control procedure. Time stamps were checked for chronological consistency, duplicated records were removed, and missing or non-numeric values were flagged. Values clearly outside the plausible range of Antarctic near-surface air-temperature conditions, unrealistic isolated spikes, abrupt offsets, and step changes were inspected and removed when they were associated with sensor malfunction, battery failure, mast damage, maintenance operations, or equipment repositioning. These checks were based on a visual inspection of the time series and field-maintenance records. No gap-filling was applied; missing or removed values were retained as gaps and were handled only through the completeness thresholds defined below for valid days, months, calendar years, and thermal years.
For the aggregation procedure, data completeness was evaluated at four temporal levels: day, month, calendar year, and thermal year. A day was considered valid when at least 75% of the expected hourly records were available, corresponding to a minimum of 18 valid observations out of 24. Daily statistics were calculated only for valid days. Monthly, calendar-year, and thermal-year metrics were then derived from valid daily values, not directly from all available hourly records. A month was considered valid when at least 80% of its calendar days were valid; partial months at the beginning or end of a station record were therefore retained only if they met this completeness threshold. Calendar years were considered valid when at least 80% of the expected daily values within the January–December period were available.
In addition to the calendar year, a thermal year was defined as the 12-month period from March of one year to February of the following year. This fixed annual window is used to represent the austral thermal cycle, avoiding the artificial split of the main summer thawing period between two calendar years and allowing FDD, TDD, BDD, and FNa to be compared using a common annual unit. This definition does not assume that freezing or thawing starts in March at every station or year; actual freezing and thawing season onset and end dates were estimated separately from the daily temperature series. This approach follows the same rationale used in previous GST analyses for the PERMATHERMAL network [14,24] and by other Antarctic frozen-ground studies (e.g., [26,28,38,39]). Thermal years were considered valid when at least 80% of the expected daily values within the March–February period were available.
Differences in record completeness among stations were taken into account by calculating all daily, monthly, annual, and thermal-year metrics only from valid time units. As a result, stations with lower data availability contributed fewer valid years to the analysis, but missing values were not reconstructed or interpolated. Multi-year means and trends should therefore be interpreted as summaries of the valid records available at each station within the 2000–2022 period, rather than as strictly synchronous climatological normals based on identical temporal coverage. This is particularly relevant for stations with lower completeness, such as MO, and comparisons involving these records were interpreted with caution.
2.4. Thermal-Regime Analysis
To characterize atmospheric behavior beyond mean temperature, each valid day was assigned to one of six daily thermal regimes according to the position of daily minimum and maximum air temperatures relative to the thresholds of ±0.5 °C. The same threshold-based structure used in previous GST studies was deliberately retained here to provide a common classification framework for air and ground thermal regimes [24,38,40]. This does not imply that air temperature and GST have the same physical behavior or thermal inertia. Rather, the air-temperature classes are interpreted as daily atmospheric thermal regimes, defined by the position of daily minimum and maximum air temperatures relative to the freezing point. Retaining all classes, including the near-zero class, makes it possible to evaluate whether such conditions are frequent or rare in air-temperature records and facilitates future comparison with GST regimes and snow-cover effects. The ±0.5 °C interval was used as a conservative buffer around 0 °C to avoid overinterpreting marginal fluctuations close to the freezing point. The six regimes were defined as follows: F1 (fully freezing), when both daily minimum and maximum air temperatures remained below −0.5 °C; F2 (freezing with excursions), when the daily minimum air temperature remained below −0.5 °C but the maximum fell within the interval between −0.5 °C and +0.5 °C; IS (operational near-zero/isothermal), when both daily minimum and maximum air temperatures remained within the interval from −0.5 °C to +0.5 °C—this class does not imply strict thermodynamic isothermy, but identifies days with very limited air-temperature variability around the freezing point; FT (freeze–thaw), when the daily minimum was below −0.5 °C and the daily maximum exceeded +0.5 °C; T2 (thawing with excursions), when the daily minimum fell within the interval between −0.5 °C and +0.5 °C but the maximum exceeded +0.5 °C; and T1 (fully thawing), when both daily minimum and maximum temperatures remained above +0.5 °C. Monthly and thermal-year percentages of each regime were calculated, and the six classes were additionally grouped into three broader domains: Cold (F1 + F2), Transitional (IS + FT), and Warm (T1 + T2).
Freezing degree days (FDD) and thawing degree days (TDD) were calculated from mean daily air temperature as the cumulative sums of negative and positive daily mean temperatures, respectively [41,42]. Annual degree-day balance (BDD) was calculated as the sum of FDD and TDD, so that more negative values indicate stronger freezing influence and less negative values indicate a relative increase in thawing influence [24]. These three indices were calculated by thermal year.
In addition to the cumulative degree-day indices, the air frost number (FNa, dimensionless) was calculated for each valid thermal year as a climate-based index of atmospheric favorability for permafrost occurrence [25]:
Calculations were performed by thermal year (March–February), using only complete thermal years that satisfied the same validity criteria applied to FDD and TDD. Higher FNa values indicate greater atmospheric climatic favorability for permafrost, whereas lower values indicate stronger thawing influence. Values above 0.5 were interpreted as climatically favorable for permafrost occurrence [25], while thresholds of 0.6 and 0.67 were used as broad reference levels for sporadic, discontinuous, and continuous permafrost favorability, following previous applications of the index (e.g., [41,42,43,44,45]). As with other climate-based frost-number approaches, this index does not explicitly account for snow insulation or local ground conditions and is therefore interpreted here as a climatic indicator rather than as direct proof of permafrost presence.
Finally, the duration of the main freezing and thawing seasons was estimated from the daily mean air-temperature series. For each thermal year, the freezing season was defined as the longest continuous sequence of valid days with mean daily air temperature below 0 °C, whereas the thawing season was defined as the longest continuous sequence of valid days with mean daily air temperature above 0 °C. A minimum duration threshold of 5 consecutive days was applied to avoid identifying short-lived temperature fluctuations as seasonal periods. For each season, start date, end date, duration, and day-of-year position were then derived. These season-duration metrics are therefore based on continuous daily-mean temperature spells, not on the cumulative number of days assigned to each thermal-regime class.
Linear trends were estimated for the main calendar-year or thermal-year variables, including MAAT, FDD, TDD, BDD, FNa, and freezing- and thawing-season duration, using ordinary least-squares regressions of valid yearly values against year. Slopes were expressed per decade, and standard errors, 95% confidence intervals, p-values, and R2 values were derived from the corresponding regression models. Mean-state and trend variables were also related to elevation in order to evaluate the first-order altitudinal pattern, whereas other local controls are discussed qualitatively but not explicitly quantified in this study. and trend statistics for MAAT; means and annual extrema for thermal-domain composition, degree-day indices, and season-duration metrics; and mean values, annual extrema, and trend statistics for FNa (Supplementary Table S1).
3. Results
3.1. Mean Annual Temperature and Temporal Trends
Mean annual air temperature (MAAT) shows substantial spatial variability across the network (Figure 3; Table 2). The lowest mean value is recorded at SO, the highest site in the study area (274 m a.s.l.), where MAAT is −3.69 °C. The highest mean temperatures occur at the low-elevation stations IN (34 m a.s.l.; −1.33 °C) and NI (19 m a.s.l.; −1.37 °C), whereas JC records an intermediate value (10 m a.s.l.; −1.67 °C). Stations located between 80 and 145 m a.s.l. show intermediate to low MAAT values, ranging from −2.17 °C at LL to −2.53 °C at MO, with CL and CR both recording −2.50 °C. For each station, the statistical summary includes interannual MAAT variability, annual extrema, trend standard errors, 95% confidence intervals, p-values, and R2 values (Supplementary Table S1). MAAT trends are positive at all stations during the study period, ranging from 0.64 °C decade−1 at MO to 1.83 °C decade−1 at CL. The strongest increases occur at CL (1.83 °C decade−1) and SO (1.55 °C decade−1), followed by CR (1.26 °C decade−1), LL (1.24 °C decade−1), NI (1.08 °C decade−1), IN (1.07 °C decade−1), and JC (1.00 °C decade−1). These trends are statistically significant at all stations except MO, where the positive slope is weaker and statistically non-significant. The annual series also show that the warmest years are concentrated in the later part of the records, especially after 2018, whereas lower MAAT values are more frequent during the earliest years.
Figure 3.
MAAT (black dots) evolution and linear trends (black lines) at the eight PERMATHERMAL stations during 2000–2022. The dashed line at −2 °C marks an approximate regional reference for marginal permafrost conditions in the maritime Antarctic/South Shetland Islands [10,13]. Each plot correspond to a monitoring station (see Table 1).
Table 2.
Main thermal characteristics of the near-surface air-temperature series at the eight PERMATHERMAL stations, including MAAT, thermal-domain composition, degree-day indices, FNa, and freezing- and thawing-season duration. A full station-by-station summary of annual thermal metrics is provided in Supplementary Table S1.
3.2. Monthly Distribution of Daily Thermal Regimes
The month-by-month distribution of daily thermal regimes shows a clear seasonal structure, with differences among stations in the relative frequency of the main regimes (Figure 4a). During the core winter months, F1 is the dominant regime at all sites. From June to August, mean monthly F1 frequencies range from 80.6% to 95.4% at SO, MO, CR, LL, and CL, with values above 90% in at least one winter month at SO, MO, CR, and LL. The low-elevation Hurd Peninsula stations JC, NI, and IN, all located below 35 m a.s.l., are also F1-dominated in winter, but with lower mean monthly frequencies, ranging from 66.4% to 82.4% during June–August. The summer distribution is more heterogeneous. At JC, NI, and IN, T1 becomes the dominant regime during January and February, with mean monthly frequencies between 64.6% and 73.7%. At the remaining stations, January–February T1 frequencies are lower, ranging from 23.0% at SO to 48.3% at CL, both in February. FT reaches its highest monthly frequencies during spring and early summer. Between October and December, FT accounts for 33.7–53.1% of days at JC, NI, and IN, with the highest monthly value at IN in November. At SO, MO, CR, LL, and CL, FT frequencies over the same months range from 14.5% to 54.3%, although the highest value occurs at MO in December. During the autumn transition (March–May), FT frequencies range from 12.5% to 37.7%, whereas T1 remains frequent in March at JC, NI, and IN, with values of 45.5%, 50.5%, and 50.7%, respectively. The IS class is rare in the air-temperature records, with mean monthly values near 0% in most months, and a maximum monthly frequency of 0.7% at NI in September and November. T2 is also less frequent than F1, FT, and T1, but it becomes more frequent during the warmest months, reaching maximum monthly values of 21.7% at CL in January and approximately 18–20% at CR, LL, and MO during January–February. Overall, the monthly distribution is characterized by F1 dominance in winter, higher FT frequencies in spring–early summer, and higher T1 frequencies in summer, particularly at JC, NI, and IN. Overall, the monthly distribution is characterized by F1 dominance in winter, higher FT frequencies in spring–early summer, and higher T1 frequencies in summer, particularly at JC, NI, and IN.
Figure 4.
Temporal evolution of daily air-temperature thermal regimes at the eight PERMATHERMAL monitoring stations in Livingston and Deception Islands during 2000–2022. (a) Monthly regime composition, expressed as the percentage of valid days in each month. (b) Annual regime composition by thermal year (March–February), expressed as the percentage of valid days in each thermal year. F1: fully freezing; F2: freezing with excursions; IS: operational near-zero/isothermal; FT: freeze–thaw; T2: thawing with excursions; T1: fully thawing. Each pair of plots corresponds to a monitoring station (see Table 1).
3.3. Interannual Changes in Thermal Regimes
Daily thermal regimes were aggregated for each thermal year and grouped into three broader domains: Cold (F1 + F2), Transitional (IS + FT), and Warm (T2 + T1). This annual grouping shows that the Cold domain is the largest component at all stations during the study period, although its relative contribution varies among stations and years (Figure 4b). On average, Cold-domain days range from 42.6% at NI and 43.2% at IN to 70.1% at SO. Warm-domain days show the reverse pattern, ranging from 9.7% at SO to 30.8% at NI, whereas Transitional-domain days vary within a narrower range, from 19.6% to 27.4%.
The mean domain composition distinguishes the low-elevation Hurd Peninsula stations JC, NI, and IN, in which Warm-domain frequencies reach 26.7–30.8%, from stations where Cold-domain conditions account for more than 60% of valid days, including SO, MO, CR, LL, and CL. Interannual variability is superimposed on this mean pattern.
Transitional-domain values show a wider year-to-year distribution and a less synchronized timing of station-level maxima than the Cold- and Warm-domain extremes, with annual values ranging from 10.9% at SO in 2007 to 32.6% at SO in 2014, and with station-level maxima occurring in different years rather than being concentrated in the 2020–2021 interval. The lowest Cold-domain percentages and the highest Warm-domain percentages occur in the later part of the records at several stations, including SO, IN, NI, JC, and LL in 2020–2021, and CL in 2018. Maximum Warm-domain values reach 45.3% at NI and 45.2% at JC in 2021, 42.2% at IN in 2021, 35.6% at LL in 2021, and 35.6% at SO in 2020 (Supplementary Table S1).
3.4. Freezing/Thawing Indices and Season Duration
The thermal-year indices show a coherent spatial pattern across the network during the study period (Figure 5; Table 2). Mean FDD has its largest absolute magnitude at SO (−1400.6 °C·day), whereas the lowest absolute magnitudes occur at NI (−748.9 °C·day), IN (−761.9 °C·day), and JC (−847.4 °C·day). TDD shows the reverse pattern, with the largest mean values at NI (256.9 °C·day), IN (240.6 °C·day), and JC (207.9 °C·day), and the lowest values at SO (93.6 °C·day), MO (94.7 °C·day), and CR (95.9 °C·day). CL and LL show intermediate values, with TDD values of 119.1 and 120.4 °C·day, respectively. This contrast is also reflected in mean BDD. The least negative mean BDD values occur at NI (−492.0 °C·day), IN (−521.3 °C·day), and JC (−639.5 °C·day), whereas the most negative value is recorded at SO (−1306.9 °C·day). The remaining stations show intermediate to strongly negative annual balances, ranging from −811.2 °C·day at LL to −956.6 °C·day at CR. Overall, the degree-day indices describe a consistent spatial structure: lower FDD magnitude and higher TDD at the low-elevation Hurd Peninsula stations, and stronger freezing dominance at SO and at the intermediate-to-high elevation stations.
Figure 5.
FDD, TDD and BDD (in °C·day) during the study period at the eight monitoring stations. Dashline represent the limit of FDD and TDD, and the reference value of BDD, i.e., 0 °C·day. Plots in the same column correspond to a selected station.
Mean BDD remains negative at all stations, ranging from −1306.9 °C·day at SO to −492.0 °C·day at NI. The least negative mean BDD values occur at NI, IN, and JC, whereas the most negative values occur at SO, CR, CL, and MO. Over time, BDD shifts toward less negative values at all stations, although the magnitude of this change differs markedly among them. The largest positive BDD trends are observed at CL (+631.6 °C·day decade−1), SO (+431.3 °C·day decade−1), CR (+349.5 °C·day decade−1), LL (+339.1 °C·day decade−1), IN (+312.0 °C·day decade−1), and JC (+307.7 °C·day decade−1), whereas NI shows a weaker positive trend (+263.4 °C·day decade−1) and MO the weakest positive trend (+139.7 °C·day decade−1). The comparatively large BDD trend at CL was verified against the annual FDD and TDD series and reflects the combined effect of decreasing FDD magnitude and increasing TDD over its shorter record, which begins in 2009; this estimate should therefore be interpreted together with its confidence interval and significance statistics. Annual extrema and their corresponding years for the degree-day indices and season-duration metrics are provided in Supplementary Table S1.
Freezing- and thawing-season durations provide complementary information on the annual thermal structure because they describe the length of the main continuous freezing and thawing periods, whereas FDD and TDD integrate both duration and temperature intensity (Figure 6; Table 2). Mean freezing-season duration ranges from 58.7 days at NI and 61.5 days at IN to 179.6 days at SO, with intermediate values at JC (77.2 days), LL (115.8 days), CR (121.2 days), CL (123.8 days), and MO (136.1 days). Mean thawing-season duration shows the reverse pattern, with the longest thawing seasons at NI (59.0 days), IN (52.9 days), and JC (46.4 days), and the shortest at SO (17.8 days), MO (19.7 days), and CR (20.9 days). Station-level extremes show that the shortest freezing seasons occur mainly during recent years, especially 2020–2021, at SO, NI, IN, JC, and LL, whereas the longest freezing seasons occur mostly earlier in the records. Maximum thawing-season duration also occurs in 2020–2021 at SO, MO, IN, JC, and LL, although other stations show maxima in earlier years (Supplementary Table S1). Freezing-season duration shows the clearest decreases at JC and IN, whereas thawing-season duration is more variable but shows longer recent seasons at the low-elevation Hurd Peninsula stations.
Figure 6.
Duration of the air temperatures freezing and thawing seasons, in days, during the 2000–2022 period at the eight monitoring stations in Livingston and Deception Islands, Antarctica. Each plot corresponds to a monitoring station.
3.5. Air Frost Number
Mean FNa values range from 0.629 at NI and 0.639 at IN to 0.812 at SO, with intermediate values at JC (0.668), LL (0.736), CL (0.750), and CR and MO (0.768) (Figure 7; Table 2). The three lowest mean FNa values correspond to NI, IN, and JC, whereas the highest values occur at SO, CR, and MO. All annual FNa values remain above 0.5 during the valid thermal years. Annual values exceed 0.67 in 14 of 16 valid thermal years at SO, 11 of 11 years at MO, 12 of 13 years at CR, 11 of 12 years at LL, and 9 of 10 years at CL. By contrast, FNa values at NI, IN, and JC are within the 0.5–0.67 interval in 8 of 10, 9 of 12, and 10 of 18 valid thermal years, respectively. Minimum annual FNa values occur in 2021 at NI (0.547), IN (0.554), JC (0.542), LL (0.627), and MO (0.700), in 2020 at SO (0.627), in 2018 at CL (0.625), and in 2008 at CR (0.664).
Figure 7.
Temporal evolution of the air frost number (FNa) over the 2000–2022 period, with linear trends for the eight monitoring stations on Livingston and Deception Islands, Antarctica, shown relative to climate-based FNa reference thresholds commonly associated with seasonally frozen ground and sporadic, discontinuous, and continuous permafrost favorability.
FNa trends are negative at all stations, but statistically significant decreases are restricted to CL (−0.142 decade−1; 95% CI: −0.274 to −0.011; p = 0.037), IN (−0.076 decade−1; 95% CI: −0.139 to −0.013; p = 0.022), and JC (−0.069 decade−1; 95% CI: −0.107 to −0.030; p = 0.0017). The remaining stations show negative but statistically non-significant trends, with the weakest decrease at MO (−0.007 decade−1; p = 0.779). The station-level summary includes the corresponding standard errors, confidence intervals, p-values, and R2 values for all stations (Supplementary Table S1). The comparatively large negative trend at CL should be interpreted in relation to the smaller number of valid thermal years available for this station (n = 10), the high initial FNa value in 2009 (0.880), and the lower annual values recorded later in the series, including the minimum value in 2018 (0.625).
4. Discussion
4.1. Thermal Reorganization
A first point emerging from this study is that recent warming in near-surface air temperature is expressed not only as an increase in MAAT (Figure 3), but also as a reorganization of the daily thermal regime throughout the year (Figure 4 and Figure 5). More specifically, in the analyzed records, the warming signal appears to be more closely associated with a weakening of freezing conditions than with a pronounced intensification of summer warmth. In other words, the rise in MAAT (Figure 3) is associated primarily with a reduction in the frequency and severity of cold conditions during the freezing season rather than a strong increase in fully thawing summer conditions. This interpretation is supported by the degree-day indices, which show a progressive reduction in the magnitude of FDD, less negative BDD values, and more moderate increases in TDD (Figure 5). This interpretation is also in line with previous studies of the Antarctic Peninsula region that reported marked seasonality in air-temperature trends, including strong winter warming and winter thermal variability [1,3], and with the recent climatological analysis of Livingston and Deception Islands, which documented marked spatial heterogeneity and local controls on air temperature and wind regime within the same study area [6].
This distinction is important because MAAT alone does not resolve how warming is distributed within the year. By classifying days into thermal regimes, the present analysis shows whether change is expressed through fewer persistently freezing days, more freeze–thaw days, or more days remaining entirely above 0 °C (Figure 4). Thus, the regime-based approach adds a functional perspective to the interpretation of atmospheric warming that is not captured by annual means alone. The results presented here indicate that the most robust long-term signal is a reduction in cold-dominated conditions and a parallel increase in thaw-related ones, whereas transitional conditions remain comparatively more stable. This pattern is consistent with the direction of ground-surface thermal-regime changes previously described for Livingston and Deception Islands, although air temperature and GST represent different components of the air–snow–ground system and are controlled by different thermal inertia, snow-cover conditions, surface properties, and local energy-balance processes [24]. In this respect, the present study complements the broader climatological analysis of the same air-temperature network, which has focused on mean temperatures, extremes, and long-term trends, by examining how warming alters the structure of daily thermal behavior through the year [6]. Rather than duplicating that climatological perspective, it addresses the seasonal and functional reorganization of the atmospheric thermal regime. This is especially relevant at the monitored sites because several records show a combination of decreasing Cold-domain percentages, increasing Warm-domain percentages, less negative BDD values, and lower FNa values in the later part of the series. These changes indicate a shift in atmospheric forcing toward weaker freezing dominance and more frequent thaw-favorable conditions, particularly at stations that remain close to the approximate −2 °C regional climatic reference for thermally marginal permafrost conditions in the maritime Antarctic/South Shetland sector (Figure 3) [10,13]. However, this atmospheric signal should be interpreted as a climatic context for frozen-ground conditions, not as a direct diagnosis of ground thermal change, because snow cover, soil moisture, substrate, and local topography can strongly modulate the transfer of heat between atmosphere and ground [9,11,24].
4.2. Local Controls
Spatial contrasts among stations indicate that the thermal evolution of the network cannot be interpreted solely in terms of regional warming but also reflects strong site-specific controls. Elevation explains an important part of the mean thermal pattern. Mean MAAT decreases almost linearly with elevation (Figure 8a), with an elevation gradient of ~0.95 °C per 100 m, whereas mean BDD becomes progressively more negative with elevation (Figure 8c), at a rate of ~333 °C·day per 100 m. The same structure is visible in the mean thermal-domain composition (Figure 9): the proportion of cold days increases with altitude, whereas warm days become more important at the lower stations.
By contrast, the rates of change do not define a robust altitudinal pattern across the full eight-station dataset. An exploratory sensitivity fit excluding MO and CL suggest that MAAT trends increase with elevation at a rate of ~0.21 °C decade−1 per 100 m (Figure 8b), and that BDD trends increase by ~59.5 °C·day decade−1 per 100 m (Figure 8d). However, because this relationship only appears after excluding two stations, it should not be interpreted as a robust characteristic of the whole network. Instead, it indicates that a possible elevation-related tendency in the rates of change may be masked or modified by station-specific effects. Although elevation-dependent warming has been reported more broadly in Antarctica and linked mainly to longwave radiation changes associated with humidity, cloud cover, and cloud-base height rather than to snow-albedo feedback [46], the present dataset does not provide sufficient evidence to infer a general elevation-dependent warming pattern for Livingston and Deception Islands.
Figure 8.
Distribution with elevation of MAAT (a), MAAT trend (b), mean BDD (c), BDD trend (d), mean FNa (e), and FNa trend (f), together with their linear fits and statistical parameters. For MAAT trend (b), BDD trend (d), and FNa trend (f), the fitted lines excluding MO and CL are shown only as an exploratory sensitivity assessment, because these two stations deviate strongly from the pattern shown by the remaining sites.
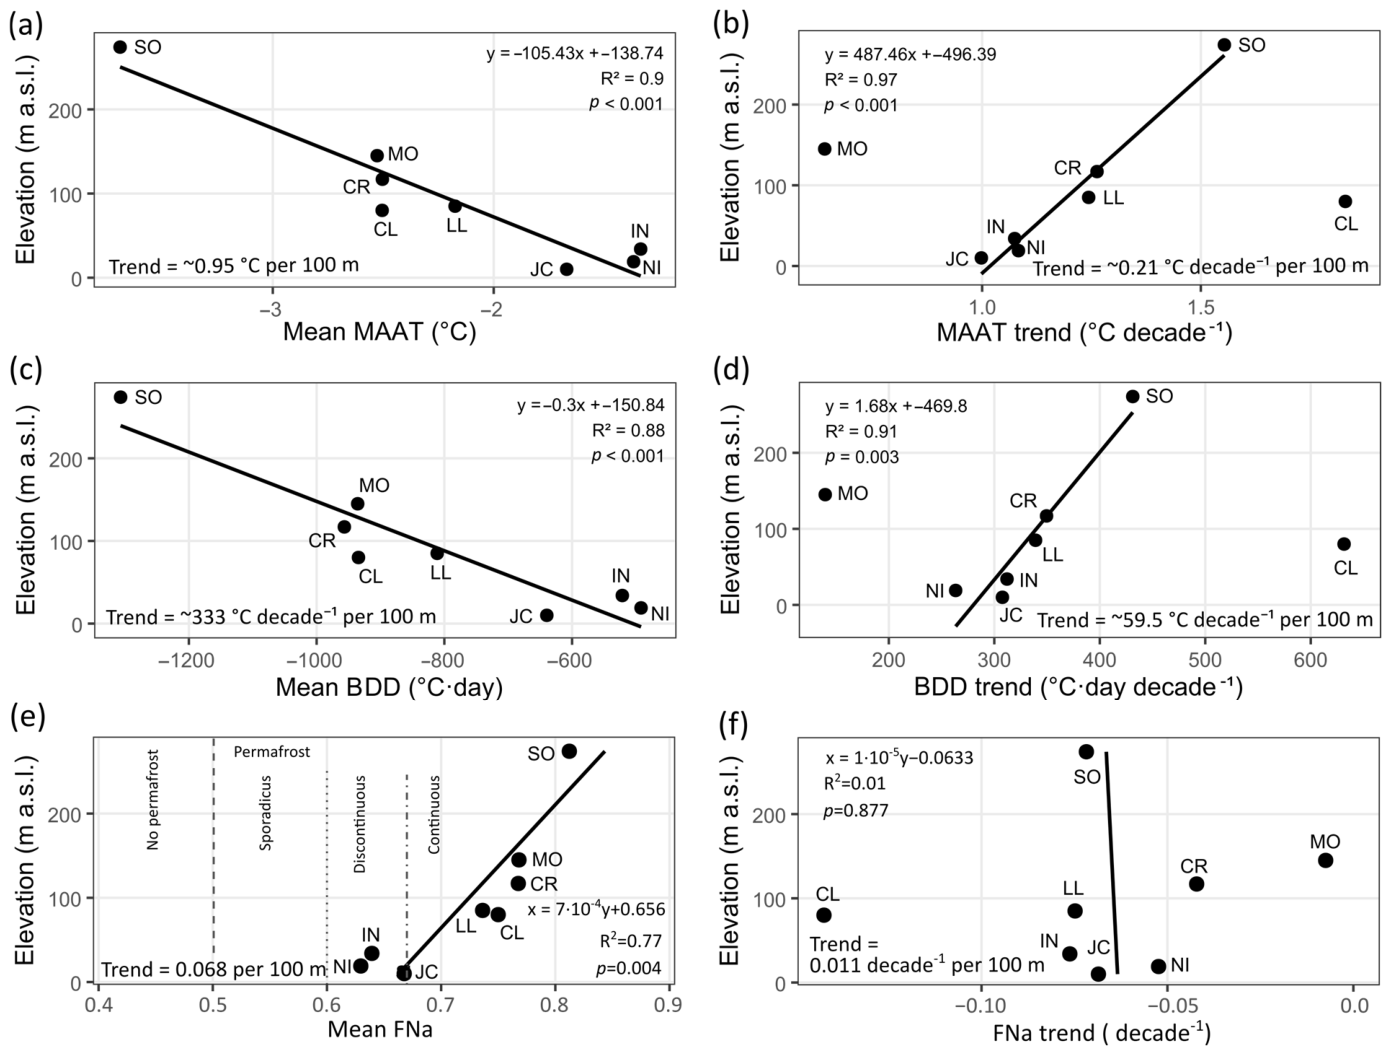
At the same time, MO and CL show that local context can produce marked departures from a simple elevation-related tendency. These departures are consistent with the fact that the stations differ not only in elevation, but also in wind exposure, distance from the coast, and geomorphological and substrate setting, which are used here as contextual descriptors rather than as quantitative predictors (Table 1). Both stations are broadly consistent with the overall mean-state gradient defined by MAAT and BDD (Figure 8a,c), but they deviate strongly from the relationships shown by the other stations in MAAT trend and BDD trend (Figure 8b,d). This contrast suggests that mean thermal conditions are more tightly constrained by altitude than their temporal evolution. Recent climatological work on Livingston and Deception Islands supports this interpretation, showing that local orography, mesoscale wind effects, and winter cold-air pooling can strongly modulate the thermal signal, especially at Deception Island and at sites affected by föhn-like warming or orographic shelter on Livingston [6]. In particular, the Deception caldera may favor winter cold-air stagnation, whereas Livingston stations can experience strongly contrasting wind exposure and adiabatic warming depending on their position relative to local relief.
The thermal-domain composition (Figure 9) reinforces this interpretation. SO, MO, and CR, all above 100 m a.s.l., are clearly cold-dominated, whereas NI, IN, and JC, all below 35 m a.s.l., show much larger proportions of warm days. LL and CL occupy an intermediate position, with a lower proportion of cold days than MO and CR despite being colder in mean-state terms than the low-elevation Hurd Peninsula stations. This indicates that the mean thermal regime is broadly structured by elevation, but not in a strictly monotonic way, and again points to an important role of local exposure and geomorphological setting. Comparable departures from purely altitudinal control have also been described in other parts of maritime Antarctica, where local relief and microclimatic forcing generate strong thermal contrasts over short distances [10,24].
Figure 9.
Mean thermal domain (left) and air frost number (FNa) (right) for each station throughout the study period.
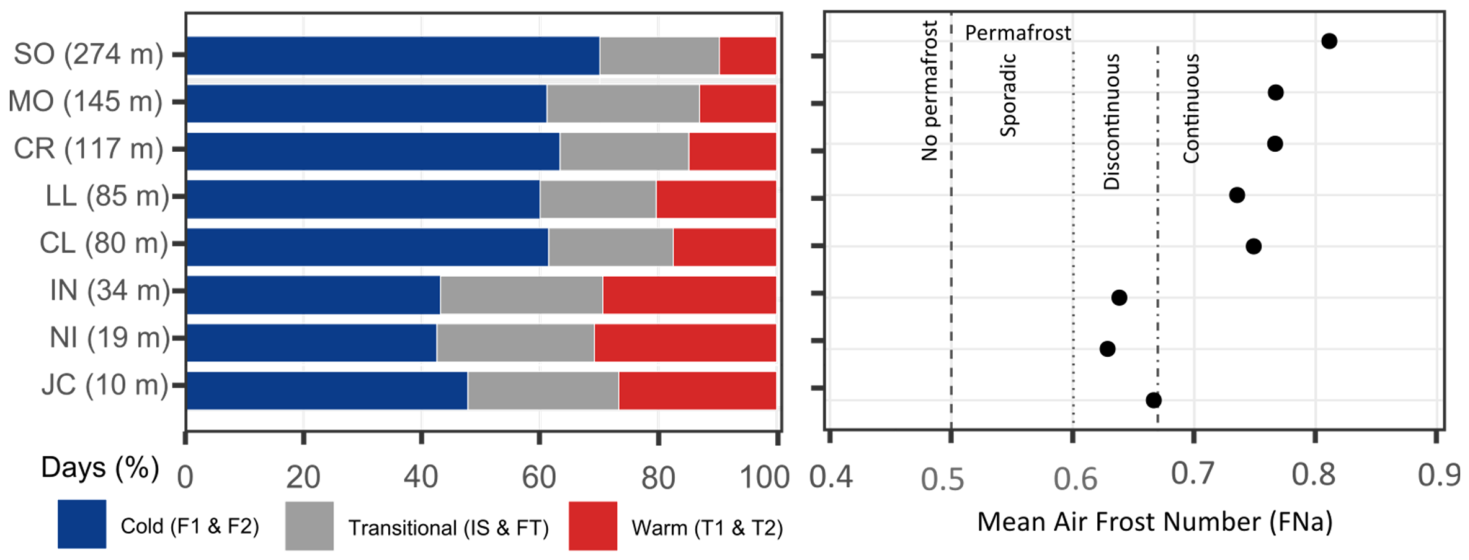
The air frost number (FNa) provides a useful synthetic expression of this same spatial structure because it integrates the balance between freezing and thawing influence into a single climatic metric. Mean FNa increases clearly with elevation (Figure 8e), at a rate of about 0.068 per 100 m, and closely mirrors the distribution of thermal domains (Figure 9). SO shows the largest mean FNa, whereas NI and IN display the lowest values, with JC also remaining within the low-FNa group. LL and CL occupy an intermediate position, again indicating that the mean climatic regime is broadly organized by elevation but modulated by local setting. In this sense, FNa reinforces the interpretation derived from MAAT, BDD, and the thermal-domain composition: elevation provides a first-order control on the average atmospheric thermal regime across the network.
By contrast, the temporal evolution of FNa (Figure 8f) does not follow a simple altitudinal pattern. Although most stations show negative FNa trends over time (Figure 7), indicating a progressive reduction in freezing dominance relative to thawing influence, the magnitude and significance of these trends vary strongly from site to site. The strongest declines are observed at CL, IN and JC, whereas MO shows almost no change and NI, CR and LL display weaker or statistically less robust trends. This spatial heterogeneity is also reflected in the absence of a meaningful relationship between FNa trend and elevation (Figure 8f). Thus, as already seen for MAAT and BDD trends (Figure 8b,d), mean-state conditions are more coherently structured by elevation than their recent evolution. The latter appears to depend more strongly on local controls such as exposure, wind regime, cold-air pooling and mesoscale topographic effects.
Taken together, these results suggest that elevation provides a first-order framework for the mean thermal regime, whereas the magnitude and functional expression of recent change are less consistently related to elevation and appear more sensitive to local settings. The relatively coherent altitudinal patterns shown by MAAT, BDD, mean thermal-domain composition and mean FNa (Figure 8a,c,e and Figure 9) contrast with the much more scattered behavior of MAAT, BDD and FNa trends (Figure 7 and Figure 8b,d,f). This indicates that local wind regime, exposure, and geomorphological context play an important role in shaping the atmospheric thermal regime at station scale.
4.3. Ground Relevance
The changes identified in the air-temperature regime are important because they alter the thermal forcing under which the ground system operates. In the present dataset, warming is expressed not only as higher MAAT values (Figure 3), but also as fewer cold days, more thaw-related days (Figure 4), less negative annual BDD values (Figure 5), and, at several stations, shorter freezing seasons and longer thawing seasons (Figure 6). In this context, FNa is especially valuable because it condenses the balance between freezing and thawing influence into a single air-temperature-based climatic indicator of atmospheric favorability for permafrost conditions, although it should not be interpreted as a direct measure of ground thermal state. The downward FNa trends observed at several stations therefore do not indicate only generic warming, but a weakening of freezing dominance relative to thawing influence; in climatic terms, this suggests a shift in atmospheric forcing towards conditions less favorable for permafrost persistence, although the actual ground response depends on snow cover, soil moisture, substrate, ground ice, and local heat-transferconditions. This general evolution is consistent with the GST evolution previously reported for the same PERMATHERMAL network. In the GST study of Livingston and Deception, FDD decreased, TDD increased, the annual GST balance became positive at the lower-elevation sites, daily freeze–thaw cycles became rare and disappeared after 2014, and the dominant GST regimes shifted from stronger freezing conditions towards a larger contribution of IS and T1 over 2007–2021 [14,24].
What gives the present air-temperature signal geomorphological significance is that it affects the terms that control seasonal thaw. Under Stefan-type formulations [47]), active-layer thickness is commonly expressed as proportional to the square root of air-temperature thawing degree days, for example as ALT = E·√TDD, where E is an edaphic factor integrating the effects of soil properties, moisture, and ground-ice conditions (e.g., [25,42,48,49,50]). Under otherwise comparable ground conditions, an increase in thawing degree-day forcing would favor deeper seasonal thaw, but this relationship can be strongly modified by snow insulation, soil moisture, texture, ground ice, and surface properties. This Stefan-type framework is one of the standard first-order approaches for linking atmospheric forcing and active-layer thickness in permafrost studies, including recent Antarctic and global applications (e.g., [8,16,51]).
In this context, the station-by-station trends obtained here are especially relevant. Air-temperature TDD shows the strongest increaseat CL (+126.9 °C·day decade−1), followed by IN (+85.7), JC (+67.3), SO (+63.2) and LL (+57.4), whereas it is much weaker at NI (+37.3) and CR (+16.8), and effectively absent at MO (−3.3). At the same time, FDD magnitude decreases at all stations, with the strongest changes at CL (+504.7 °C·day decade−1), SO (+368.1) and CR (+332.7), and still substantial reductions at LL, JC, IN and NI. Consequently, BDD becomes less negative at all stations, with the largest positive trends at CL (+631.6 °C·day decade−1), SO (+431.3), CR (+349.5), LL (+339.1), IN (+312.0) and JC (+307.7) (Figure 5). These values show that the present signal is not only a slight increase in summer warmth, but a combined shift involving both stronger thaw forcing and reduced winter cooling. Under a Stefan-type interpretation, that combination is consistent with atmospheric forcing that would favor deeper seasonal thaw where ground properties, moisture conditions, and snow cover do not offset the thermal signal. This becomes especially significant when placed in the regional permafrost context. In the South Shetland Islands, permafrost is already warm and thermally marginal. A recent work [11] estimated that near-surface permafrost temperatures in the western Antarctic Peninsula sector are among the warmest in Antarctica, and that in much of the South Shetlands the TTOP lies between about −2 and 0 °C, while modelled MAGT at low elevations is often warmer than −1 °C. Recent modelling for King George Island reached a similar conclusion, showing that permafrost temperatures are already close to the melting point and that active-layer thickness has increased strongly in recent decades, reaching values of around 3.5 m by 2022 at King Sejong Station, compared with about 1.5 m in 1950 [11,16]. This regional context is important for interpreting MAAT evolution (Figure 2), because in MAAT-based permafrost zonation schemes [8], mean annual air temperatures around −2 °C are commonly associated with the transition between warm discontinuous and sporadic or marginal permafrost in low-lying maritime environments (e.g., [52,53]), whereas values approaching 0 °C imply very low climatic suitability for permafrost persistence [8,10,13]. The fact that MAAT at several stations oscillates around the −2 °C reference value or exceeds it in recent years (Figure 3), indicates that these sites are already operating very close to the climatic range of thermally marginal of permafrost stability.
Within that framework, the FNa results add an especially useful dimension because they do not only indicate that conditions are warming but also show how several stations are shifting across climatic fields traditionally associated with different degrees of permafrost favorability. Using the climatic reference thresholds commonly applied to FNa, the mean values of the coldest stations fall within the range associated with continuous-permafrost favorability, but JC, with a mean value very close to 0.67, lies essentially at the boundary between the continuous and discontinuous fields, while NI and IN fall within the discontinuous favorability range. More importantly, the annual series indicates that several stations have moved downward through time towards less favorable categories. JC provides the clearest example: its earlier values are consistent with the climatic range commonly associated with continuous-permafrost favorability, whereas the later part of the record falls predominantly within the discontinuous favorability range and in some years approaches the sporadic threshold (Figure 7). IN shows a comparable trajectory, evolving from values close to the continuous/discontinuous transition towards clearly lower values. CL is also particularly significant: although its mean FNa remains within the continuous field, it shows the strongest negative FNa trend, which indicates a marked reduction in freezing dominance over time. LL and SO show a similar direction of change, although with weaker statistical support, whereas MO appears comparatively stable. Taken together, these trajectories point to a progressive reduction in atmospheric climatic favorability for permafrost persistence at several sites, as inferred from this indirect air-temperature-based indicator.
The agreement between FNa and the mean thermal-domain composition (Figure 9) strengthens this interpretation. These are not equivalent metrics, because FNa expresses the balance between freezing and thawing influence, whereas the thermal-domain classification is based on the annual distribution of daily regimes. Even so, both metrics show a similar pattern. Stations with high FNa are also those dominated by the Cold domain, whereas stations with lower FNa show a reduced weight of Cold conditions and a larger contribution from Transitional and Warm domains. JC is again particularly illustrative. Its mean FNa lies near the climatic boundary between the continuous and discontinuous fields, and its thermal-domain composition shows that cold days account for only about half of the annual total, with the remainder already distributed between transitional and warm conditions. In other words, even if one does not use FNa itself, the regime-based classification leads to the same conclusion: JC is no characterized by a strongly freezing-dominated atmospheric regime, but by a mixed annual regime in which thaw-related conditions already occupy a large fraction of the year. NI and IN show the same general tendency, reinforcing the idea that the low-elevation sites are becoming increasingly marginal from the point of view of frozen-ground stability.
This point is important because, in maritime Antarctica, where permafrost is already warm and thermally marginal [9,11,13], a downward displacement across FNa reference ranges associated with continuous, discontinuous, or sporadic permafrost favorability is not a trivial statistical change. It implies a reduction in the relative importance of freezing conditions and, therefore, a weaker atmospheric climatic framework for the maintenance of frozen ground. From the standpoint of potential ground response, this means less favorable atmospheric forcing for preserving a cold permafrost table and more favorable conditions for seasonal thaw deepening, especially where these FNa declines are accompanied by increasing TDD, less negative BDD and a growing contribution of thaw-related thermal domains. For that reason, the FNa results are not merely complementary to the MAAT and degree-day analyses, but also provide one of the clearest indications in this study that several of the monitored environments are moving towards greater permafrost marginality and lower long-term thermal stability.
The comparison with James Ross Island helps to clarify why the same type of atmospheric change may have different implications across the Antarctic Peninsula domain. James Ross belongs to the Antarctic Peninsula sector but lies east of the main orographic barrier and therefore experiences colder and drier conditions than the South Shetlands. There, mean annual air temperature at AWS-JGM is about −6.6 to −6.9 °C, reconstructed top-of-permafrost temperature is around −5.8 °C, and typical active-layer thickness is on the order of 0.6 m, far colder and thinner than in the maritime South Shetlands [11,26,39]. This does not mean that James Ross Island is insensitive to atmospheric forcing, but it does mean that an increase in TDD or a reduction in FDD is more critical in Livingston, Deception, or King George Islands, where the thermal state of permafrost is already much closer to 0 °C. The broader Antarctic Peninsula climate literature also supports the interpretation that the present signal is not an isolated peculiarity of this network. Turner et al. showed that the Antarctic Peninsula region experienced one of the strongest warming signals in Antarctica during the second half of the twentieth century, with especially strong seasonal and spatial variability, and later assessments confirmed that the peninsula remains one of the most climatically variable sectors of the continent even when warming is spatially heterogeneous [1,3].
Overall, the present results indicate that the atmospheric boundary conditions of the PERMATHERMAL sites are shifting toward weaker freezing dominance and greater thawing-degree-day forcing. This shift is consistent with atmospheric conditions that may favor deeper seasonal thaw and warmer near-surface ground where snow cover, soil moisture, texture, ground ice, and local surface properties allow the efficient transfer of atmospheric forcing to the ground. However, the air-temperature record alone cannot diagnose changes in ALT, TTOP, or long-term permafrost stability. These implications should therefore be interpreted as climatic indications that complement, rather than replace, direct GST, ALT, snow-cover, and soil observations. This does not imply a direct one-to-one response of ALT or TTOP, because snow insulation, soil texture, moisture and ground ice still exert strong local control, as the GST studies clearly showed [14,24]. However, the combination of increasing thaw-related air regimes, increasing TDD at several stations, reduced winter cooling, less negative BDD, and downward FNa trajectories across climatic permafrost fields provides a physically grounded atmospheric explanation for why the active layer should tend to deepen, and why the warmest and most marginal permafrost sites of the maritime Antarctic are likely to be especially vulnerable to ongoing warming.
4.4. Limitations and Future Research
This study has some limitations that should be considered when interpreting the results. First, the monitoring network is spatially unbalanced, because six of the eight stations are located on Hurd Peninsula, whereas Byers Peninsula and Deception Island are represented by only one station each. Therefore, the results should be interpreted as representative of the monitored sites rather than as a complete spatial representation of all ice-free areas of Livingston and Deception Islands. Second, record length and completeness differ among stations, which may influence inter-station comparisons and trend estimates, especially for stations with shorter or less complete time series. Third, the analysis is based on near-surface air temperature and therefore describes atmospheric thermal forcing, rather than the direct thermal response of the ground. The implications for permafrost and active-layer conditions should therefore be interpreted as climatic indications rather than direct evidence of ground change. Finally, snow cover, soil moisture, texture, ground-ice content, surface material, and local topographic exposure were not explicitly modelled in this study, although they can strongly modulate the transfer of atmospheric forcing to the ground.
Despite these limitations, this study provides a detailed characterization of the near-surface air-temperature regime across a long-term monitoring network in maritime Antarctica. By combining mean annual conditions, daily thermal regimes, degree-day indices, season duration, and the air frost number, the results provide a consistent framework for understanding how atmospheric thermal forcing evolved during 2000–2022. This framework is particularly useful for contextualizing the ground-surface-temperature changes previously reported for Livingston and Deception Islands, where reduced freezing dominance, altered degree-day forcing, and snow-cover modulation have been shown to affect the ground thermal regime [14,24]. Future work should integrate air temperature, ground surface temperature, active-layer thickness, snow-cover dynamics, and site-scale terrain attributes to quantify more directly how changes in atmospheric thermal regimes propagate into the frozen ground.
5. Conclusions
This study shows that the recent air-temperature change across Livingston and Deception Islands is expressed not only as increased MAAT values, but also as a reorganization of the annual thermal regime, with fewer cold days, more thaw-related conditions, less negative annual BDD values, and, at several stations, shorter freezing seasons. Mean thermal conditions are broadly structured by elevation, whereas the rates of change are less consistently related to elevation, indicating that elevation provides only a first-order framework and that local factors modulate the atmospheric response at station scale.
The results further show that FNa is a useful air-temperature-based indicator of changes in freezing and thawing dominance. Its consistency with the thermal-domain composition indicates that stations with lower FNa are also those with a smaller contribution from cold regimes and a greater weight of transitional and warm conditions. The downward FNa trends observed at several sites suggest a shift in atmospheric climatic favorability toward conditions more commonly associated with greater permafrost marginality, although they should not be interpreted as direct evidence of changes in permafrost state or distribution. From a frozen-ground perspective, the combined increase in thawing influence and reduction in freezing dominance indicate a change in atmospheric forcing that may favor deeper seasonal thaw at sites where the air-temperature signal is efficiently transferred into the ground. These implications are likely to be most relevant at the low- and intermediate-elevation sites, where MAAT and FNa values indicate comparatively marginal atmospheric favorability for permafrost persistence.
However, this atmospheric signal should not be interpreted as direct evidence of active-layer deepening or reduced long-term frozen-ground stability. The ground response depends on snow-cover duration and thickness, wind-driven snow redistribution, soil moisture, grain size, substrate, surface material, ground-ice content, exposure, and local heat-transfer conditions. A direct assessment of frozen-ground change therefore requires integrating these air-temperature results with GST, ALT, snow-cover, and ground-property observations.
Supplementary Materials
The following supporting information can be downloaded at: https://www.mdpi.com/article/10.3390/atmos17060555/s1. Table S1: Station-by-station summary of the eight PERMATHERMAL near-surface air-temperature series, including MAAT mean values, interannual variability, annual extrema, and trend statistics; mean thermal-domain composition and annual extrema; mean degree-day indices and annual extrema; mean freezing- and thawing-season duration and annual extrema; numbers of valid calendar and thermal years; and FNa mean values, annual extrema, and trend statistics.
Author Contributions
Conceptualization, M.Á.d.P.; methodology, M.Á.d.P. and G.G.; validation, G.G.; formal analysis, M.Á.d.P.; investigation, M.Á.d.P. and G.G.; data curation, M.Á.d.P.; writing—original draft preparation, M.Á.d.P.; writing—review and editing, M.Á.d.P. and G.G.; project administration, M.Á.d.P.; funding acquisition, M.Á.d.P. All authors have read and agreed to the published version of the manuscript.
Funding
This research was supported by the Spanish Polar Research Program through the projects RADIANTAR (ANT98-057 and REN2001-5082-E/ANT), PERMAMODEL (POL2006-01918), PERMAPLANET (CTM2009-10165), ANTARPERMA (CTM2011-15565-E), and PERMASNOW (CTM2014-52021-R), and through the PERMATHERMAL contracts established between UAH and IGME (2015–2020, under LOU Article 83) and between UAH and UTM (2021–2025, under LOSU Article 60).
Institutional Review Board Statement
Not applicable.
Informed Consent Statement
Not applicable.
Data Availability Statement
The raw air-temperature data supporting the results of this study will are deposited in a Zenodo repository: https://doi.org/10.5281/zenodo.20423487 and can be downloaded upon request to the authors.
Acknowledgments
The authors thank the station leaders and staff of the Spanish Antarctic stations Juan Carlos I (Livingston Island) and Gabriel de Castilla (Deception Island) for their support during fieldwork and their assistance with instrument maintenance throughout the 2000–2022 period. The authors also thank the personnel of the Spanish Polar Committee and the crews of the Spanish research vessels Las Palmas, Hespérides, and Sarmiento de Gamboa for logistical support during Antarctic operations. In addition, the authors thank the Spanish and Portuguese colleagues who contributed to station maintenance and data downloading during the monitoring period. During the preparation of this manuscript, the authors used OpenAI ChatGPT 5.5. Thinking model for assistance with translation from Spanish into English and with language revision, including grammar and spelling correction. After using this tool, the authors carefully reviewed and edited the text as needed and take full responsibility for the content of the publication. We also thank the reviewers for their detailed and constructive comments, which helped to improve the clarity, methodological robustness, and overall presentation of the manuscript.
Conflicts of Interest
The authors declare no conflicts of interest. The funders had no role in the design of the study; in the collection, analyses, or interpretation of data; in the writing of the manuscript; or in the decision to publish the results.
Abbreviations
The following abbreviations are used in this manuscript:
| MAAT | Mean Annual Air Temperature (°C) |
| TDD | Thawing Degree Days (°C·day) |
| FDD | Freezing Degree Days (°C·day) |
| BDD | Balance Degree Days (°C·day) |
| GST | Ground Surface Temperature (°C) |
| TTOP | Temperature at the Top of the Permafrost (°C) |
| ALT | Active Layer Thickness (cm) |
References
- Turner, J.; Colwell, S.R.; Marshall, G.J.; Lachlan-Cope, T.A.; Carleton, A.M.; Jones, P.D.; Lagun, V.; Reid, P.A.; Iagovkina, S. Antarctic climate change during the last 50 years. Int. J. Climatol. 2005, 25, 279–294. [Google Scholar] [CrossRef] [Scilit]
- Turner, J.; Lu, H.; White, I.; King, J.C.; Phillips, T.; Hosking, J.S.; Bracegirdle, T.J.; Marshall, G.J.; Mulvaney, R.; Deb, P. Absence of 21st century warming on Antarctic Peninsula consistent with natural variability. Nature 2016, 535, 411–415. [Google Scholar] [CrossRef] [Scilit]
- Turner, J.; Marshall, G.J.; Clem, K.; Colwell, S.; Phillips, T.; Lu, H. Antarctic temperature variability and change from station data. Int. J. Climatol. 2020, 40, 2986–3007. [Google Scholar] [CrossRef] [Scilit]
- Oliva, M.; Navarro, F.; Hrbáček, F.; Hernández, A.; Nývlt, D.; Pereira, P.; Ruiz-Fernández, J.; Trigo, R. Recent regional climate cooling on the Antarctic Peninsula and associated impacts on the cryosphere. Sci. Total Environ. 2017, 580, 210–223. [Google Scholar] [CrossRef] [Scilit]
- Carrasco, J.F.; Bozkurt, D.; Cordero, R.R. A review of the observed air temperature in the Antarctic Peninsula: Did the warming trend come back after the early 21st hiatus? Polar Sci. 2021, 28, 100653. [Google Scholar] [CrossRef] [Scilit]
- González-Herrero, S.; González-Espejo, I.; Jiménez-Cavero, C.M.; Albero-Molina, C.M.; Navarro, F.; Bañón, M.; Vázquez, M.; Ruiz-Bellet, J.L.; Lehning, M. Thirty-five years of Spanish atmospheric observations at Livingston and Deception islands, South Shetland Islands, Antarctica. Antarct. Sci. 2026, 38, 57–72. [Google Scholar] [CrossRef] [Scilit]
- French, H.M.; Slaymaker, O. Canada’s cold land mass. In Canada’s Cold Environments; French, H.M., Slaymaker, O., Eds.; McGill-Queen’s University Press: Montreal, QC, Canada, 1993; pp. 3–28. [Google Scholar]
- Smith, M.W.; Riseborough, D.W. Climate and the limits of permafrost: A zonal analysis. Permafr. Periglac. Process. 2002, 13, 1–15. [Google Scholar] [CrossRef] [Scilit]
- Bockheim, J.; Vieira, G.; Ramos, M.; López-Martínez, J.; Serrano, E.; Guglielmin, M.; Wilhelm, K.; Nieuwendam, A. Climate warming and permafrost dynamics in the Antarctic Peninsula region. Glob. Planet. Change 2013, 100, 215–223. [Google Scholar] [CrossRef] [Scilit]
- Ferreira, A.; Vieira, G.; Ramos, M.; Nieuwendam, A. Ground temperature and permafrost distribution in Hurd Peninsula (Livingston Island, Maritime Antarctic): An assessment using freezing indexes and TTOP modelling. Catena 2017, 149, 560–571. [Google Scholar] [CrossRef] [Scilit]
- Obu, J.; Westermann, S.; Vieira, G.; Abramov, A.; Balks, M.R.; Bartsch, A.; Hrbáček, F.; Kääb, A.; Ramos, M.; Rocha, T.; et al. Pan-Antarctic map of near-surface permafrost temperatures at 1 km2 scale. Cryosphere 2020, 14, 497–519. [Google Scholar] [CrossRef] [Scilit]
- Vieira, G.; Ramos, M.; Batista, V.; Caselli, A.; Correia, A.; Fragoso, M.; Gruber, S.; Hauck, C.; Kenderova, R.; Lopez-Martinez, J.; et al. Permafrost and active layer monitoring in the Maritime Antarctic: A contribution to TSP and ANTPAS projects. In Proceedings of the American Geophysical Union Fall Meeting, San Francisco, CA, USA, 15–19 December 2008; Abstract C11C-0519; American Geophysical Union: Washington, DC, USA, 2008. [Google Scholar]
- Vieira, G.; Bockheim, J.; Guglielmin, M.; Balks, M.; Abramov, A.; Boelhouwers, J.; Cannone, N.; Ganzert, L.; Gilichinsky, D.; Goryachkin, S.; et al. Thermal state of permafrost and active-layer monitoring in the Antarctic: Advances during the International Polar Year 2007–2009. Permafr. Periglac. Process. 2010, 21, 182–197. [Google Scholar] [CrossRef] [Scilit]
- de Pablo, M.Á.; Ramos, M.; Vieira, G.; Molina, A.; Ruiz-Fernández, J. Thermal regimes and phases of surface temperature in Livingston and Deception islands, Antarctica, 2007–2021: Influence of snow cover and implications for frozen ground. Antarct. Sci. 2025, 37, 413–426. [Google Scholar] [CrossRef] [Scilit]
- Ramos, M.; Vieira, G.; de Pablo, M.Á.; Molina, A.; Abramov, A.; Goyanes, G.; Jiménez, J.J.; Hidalgo, M.A.; Prieto, M.; Pina, P.; et al. Transition from a subaerial to a subnival permafrost temperature regime following increased snow cover (Livingston Island, Maritime Antarctic). Atmosphere 2020, 11, 1332. [Google Scholar] [CrossRef] [Scilit]
- Baptista, J.P.; Vieira, G.B.G.T.; Correia, A.M.D.C.S.; Lee, H.; Westermann, S. Modelling the evolution of permafrost temperatures and active layer thickness in King George Island, Antarctica, since 1950. Cryosphere 2025, 19, 3459–3476. [Google Scholar] [CrossRef] [Scilit]
- Bañón, M.; Justel, A.; Velázquez, D.; Quesada, A. Regional weather survey on Byers Peninsula, Livingston Island, South Shetland Islands, Antarctica. Antarct. Sci. 2013, 25, 146–156. [Google Scholar] [CrossRef] [Scilit]
- Kejna, M.; Araźny, A.; Sobota, I. The climatic change on King George Island (South Shetland Islands, Antarctica) in the years of 1948–2011. Pol. Polar Res. 2013, 34, 213–235. [Google Scholar] [CrossRef] [Scilit]
- Balay, F.; Renom, M. Characterization of extreme warm temperature events (1998–2016) on King George Island, Antarctic Peninsula. Antarct. Sci. 2026, 38, 146–160. [Google Scholar] [CrossRef] [Scilit]
- Ishikawa, M. Thermal regimes at the snow-ground interface and their implications for permafrost investigation. Geomorphology 2003, 52, 105–120. [Google Scholar] [CrossRef] [Scilit]
- Jones, P.D. Recent variations in mean temperature and the diurnal temperature range in the Antarctic. Geophys. Res. Lett. 1995, 22, 1345–1348. [Google Scholar] [CrossRef] [Scilit]
- IPCC. Climate Change 2023: Synthesis Report. Contribution of Working Groups I, II and III to the Sixth Assessment Report of the Intergovernmental Panel on Climate Change; IPCC: Geneva, Switzerland, 2023. [Google Scholar]
- Pedrero, A.; de Pablo, M.A.; Goyanes, G. Near-surface air temperature trends (2006–2021) on Livingston and Deception Islands, maritime Antarctica, and implications for permafrost under observed and IPCC-based projections. Antarct. Sci. 2026. submitted. [Google Scholar]
- de Pablo, M.A.; Ramos, M.; Vieira, G.; Molina, A.; Ramos, R.; Maior, C.N.; Prieto, M.; Ruiz-Fernández, J. Interannual variability of ground surface thermal regimes in Livingston and Deception islands, Antarctica (2007–2021). Land Degrad. Dev. 2024, 35, 378–393. [Google Scholar] [CrossRef] [Scilit]
- Nelson, F.E.; Outcalt, S.I. A computational method for prediction and regionalization of permafrost. Arct. Alp. Res. 1987, 19, 279–288. [Google Scholar]
- Hrbáček, F.; Láska, K.; Engel, Z. Effect of snow cover on active-layer thermal regime—A case study from James Ross Island, Antarctic Peninsula. Permafr. Periglac. Process. 2016, 27, 307–315. [Google Scholar] [CrossRef] [Scilit]
- Hrbáček, F.; Nývlt, D.; Láska, K. Permafrost and active layer research on James Ross Island: An overview. Czech Polar Rep. 2019, 9, 20–36. [Google Scholar] [CrossRef] [Scilit]
- Pastíriková, L.K.; Hrbáček, F.; Uxa, T.; Láska, K. Permafrost table temperature and active layer thickness variability on James Ross Island, Antarctic Peninsula, in 2004–2021. Sci. Total Environ. 2023, 869, 161690. [Google Scholar] [CrossRef] [Scilit]
- de Pablo, M.A. Maintenance of TSP and CALM Stations for Permafrost and Active Layer Monitoring on Livingston and Deception Islands, Antarctica. 2020–2021 Campaign Report; ACMA-Universidad de Alcalá: Alcalá de Henares, Spain, 2021; 46p, (In Spanish). [Google Scholar] [CrossRef]
- Bañón, M.; Vasallo, F. AEMET en la Antártida: Climatología y Meteorología Sinóptica en las Estaciones Meteorológicas Españolas en la Antártida; Agencia Estatal de Meteorología: Madrid, Spain, 2015; 152p. [Google Scholar]
- de Pablo, M.A.; Rosado, B. Testing a low-cost ultrasonic sensor to monitor snow depth under harsh Antarctic weather conditions in the South Shetland Islands. Antarct. Sci. 2026, 37, 580–597. [Google Scholar] [CrossRef] [Scilit]
- World Meteorological Organization (WMO). Guide to Instruments and Methods of Observation (WMO-No. 8); World Meteorological Organisation: Geneva, Switzerland, 2024; Volume I. [Google Scholar]
- Gemini Data Loggers. Tinytag Plus 2 TGP-4104 Data Logger Specifications; Gemini Data Loggers: Chichester, UK, 2018. [Google Scholar]
- R Core Team. R: A Language and Environment for Statistical Computing; R Foundation for Statistical Computing: Vienna, Austria, 2025. [Google Scholar]
- Posit Team. RStudio: Integrated Development Environment for R; Posit Software, PBC: Boston, MA, USA, 2025. [Google Scholar]
- OpenAI. ChatGPT (GPT-5.5 Thinking) [Large Language Model]. Available online: https://chatgpt.com/ (accessed on 19 May 2026).
- Inkscape Project. Inkscape (Version 1.4.3) [Computer Software]. Available online: https://inkscape.org/release/inkscape-1.4.3/ (accessed on 19 May 2026).
- de Pablo, M.A.; Ramos, M.; Molina, A. Thermal characterization of the active layer at the Limnopolar Lake CALM-S site on Byers Peninsula (Livingston Island), Antarctica. Solid Earth 2014, 5, 721–739. [Google Scholar] [CrossRef] [Scilit]
- Hrbáček, F.; Uxa, T. The evolution of a near-surface ground thermal regime and modeled active-layer thickness on James Ross Island, eastern Antarctic Peninsula, in 2006–2016. Permafr. Periglac. Process. 2020, 31, 141–155. [Google Scholar] [CrossRef] [Scilit]
- Guglielmin, M.; Evans, C.J.E.; Cannone, N. Active layer thermal regime under different vegetation conditions in permafrost areas. A case study at Signy Island (Maritime Antarctica). Geoderma 2008, 144, 73–85. [Google Scholar] [CrossRef] [Scilit]
- Houghton, D.D. Handbook of Applied Meteorology; Wiley: New York, NY, USA, 1985; 1461p. [Google Scholar]
- Klene, A.E.; Nelson, F.E.; Shiklomanov, N.I.; Hinkel, K.M. The N-factor in natural landscapes: Variability of air and soil-surface temperatures, Kuparuk River Basin, Alaska, USA. Arct. Antarct. Alp. Res. 2001, 33, 140–148. [Google Scholar] [CrossRef]
- Klene, A.E. The N-Factor in Natural Landscapes: Relations between Air and Soil-Surface Temperatures in the Kuparuk River Basin, Alaska; Publications in Climatology 53; C.W. Thornthwaite Associates: Elmer, NJ, USA, 2000; 77p. [Google Scholar]
- Christensen, J.H.; Kuhry, P. High-resolution regional climate model validation and permafrost simulation for the East European Russian Arctic. J. Geophys. Res. 2000, 105, 29647–29658. [Google Scholar] [CrossRef] [Scilit]
- Stendel, M.; Christensen, J.H. Impact of global warming on permafrost conditions in a coupled GCM. Geophys. Res. Lett. 2002, 29, 1632. [Google Scholar] [CrossRef] [Scilit]
- Xie, A.; Zhu, J.; Qin, X.; Wang, S.; Xu, B.; Wang, Y. Surface warming from altitudinal and latitudinal amplification over Antarctica since the International Geophysical Year. Sci. Rep. 2023, 13, 9536. [Google Scholar] [CrossRef] [Scilit]
- Stefan, J. Über die Theorie der Eisbildung, insbesondere über die Eisbildung im Polarmeere. Ann. Phys. 1891, 42, 269–286. [Google Scholar] [CrossRef] [Scilit]
- Hinkel, K.M.; Nicholas, J.R.J. Active layer thaw rate at a boreal forest site in central Alaska, USA. Arct. Alp. Res. 1995, 27, 72–80. [Google Scholar] [CrossRef] [Scilit]
- Nelson, F.E.; Shiklomanov, N.I.; Mueller, G.; Hinkel, K.M.; Walker, D.A.; Bockheim, J.G. Estimating active-layer thickness over a large region: Kuparuk River Basin, Alaska, USA. Arct. Antarct. Alp. Res. 1997, 29, 367–378. [Google Scholar] [CrossRef] [Scilit]
- Hinkel, K.M.; Nelson, F.E. Spatial and temporal patterns of active layer thickness at Circumpolar Active Layer Monitoring (CALM) sites in northern Alaska, 1995–2000. J. Geophys. Res. 2003, 108, 8168. [Google Scholar] [CrossRef] [Scilit]
- Peng, X.; Zhang, T.; Frauenfeld, O.W.; Mu, C.; Wang, K.; Wu, X.; Guo, D.; Luo, J.; Hjort, J.; Aalto, J.; et al. Active layer thickness and permafrost area projections for the 21st century. Earth’s Future 2023, 11, e2023EF003573. [Google Scholar] [CrossRef] [Scilit]
- Brown, R.J.E. Permafrost in Canada: Its Influence on Northern Development; University of Toronto Press: Toronto, ON, Canada, 1970. [Google Scholar]
- Brown, J.; Ferrians, O.; Heginbottom, J.A.; Melnikov, E.S. Circum-Arctic Map of Permafrost and Ground-Ice Conditions; U.S. Geological Survey: Reston, VA, USA, 1997.
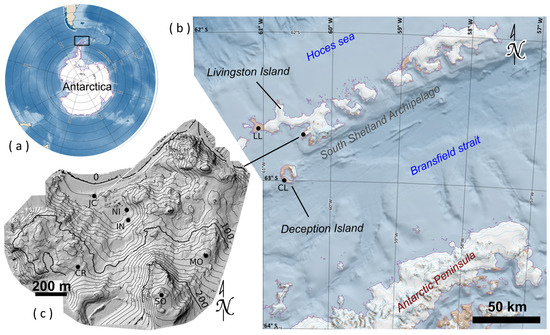
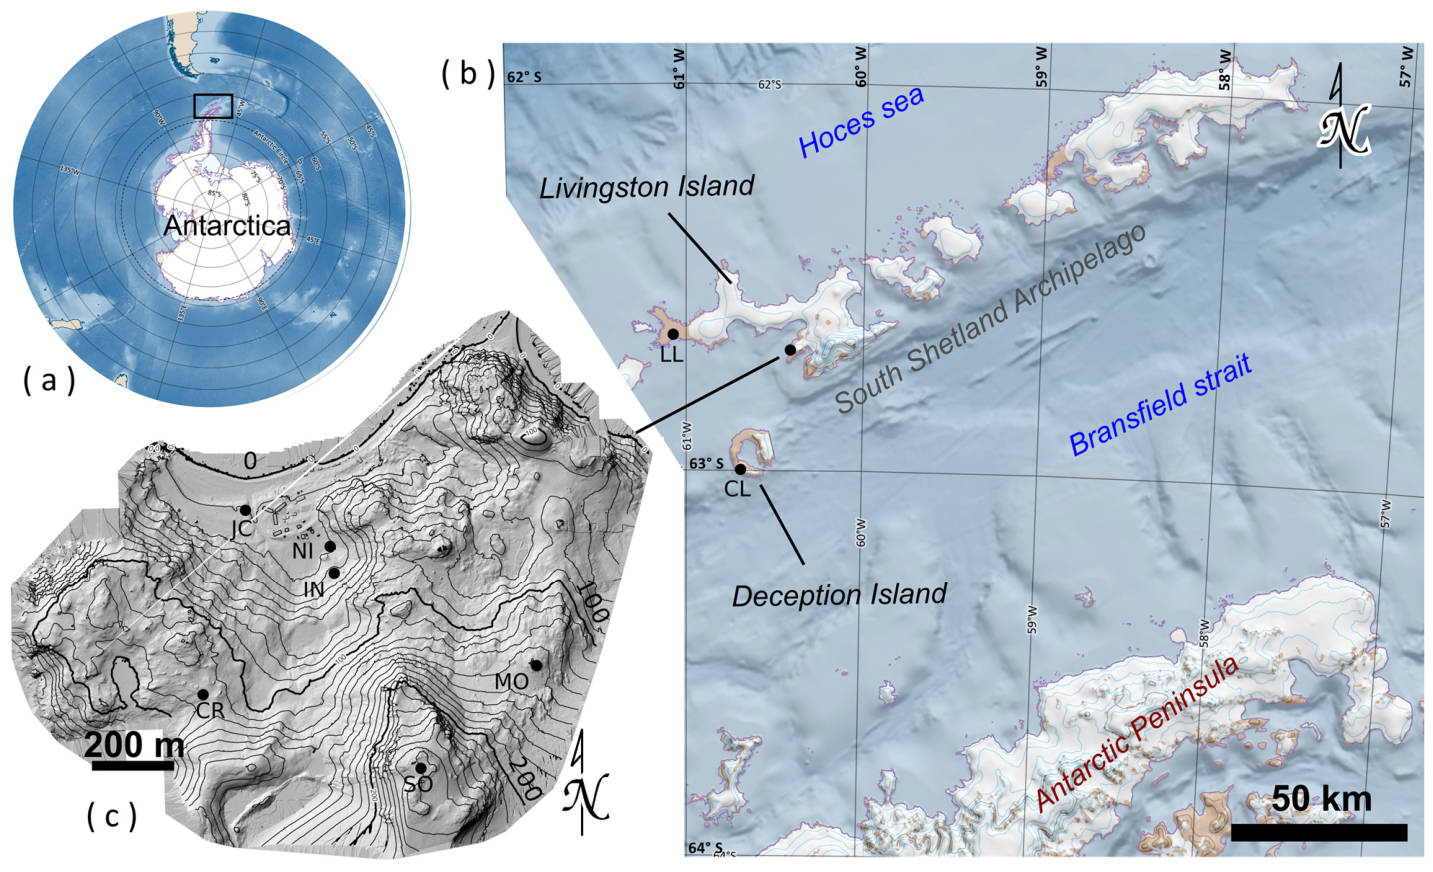
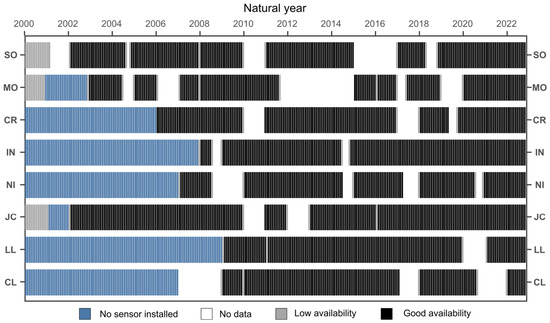
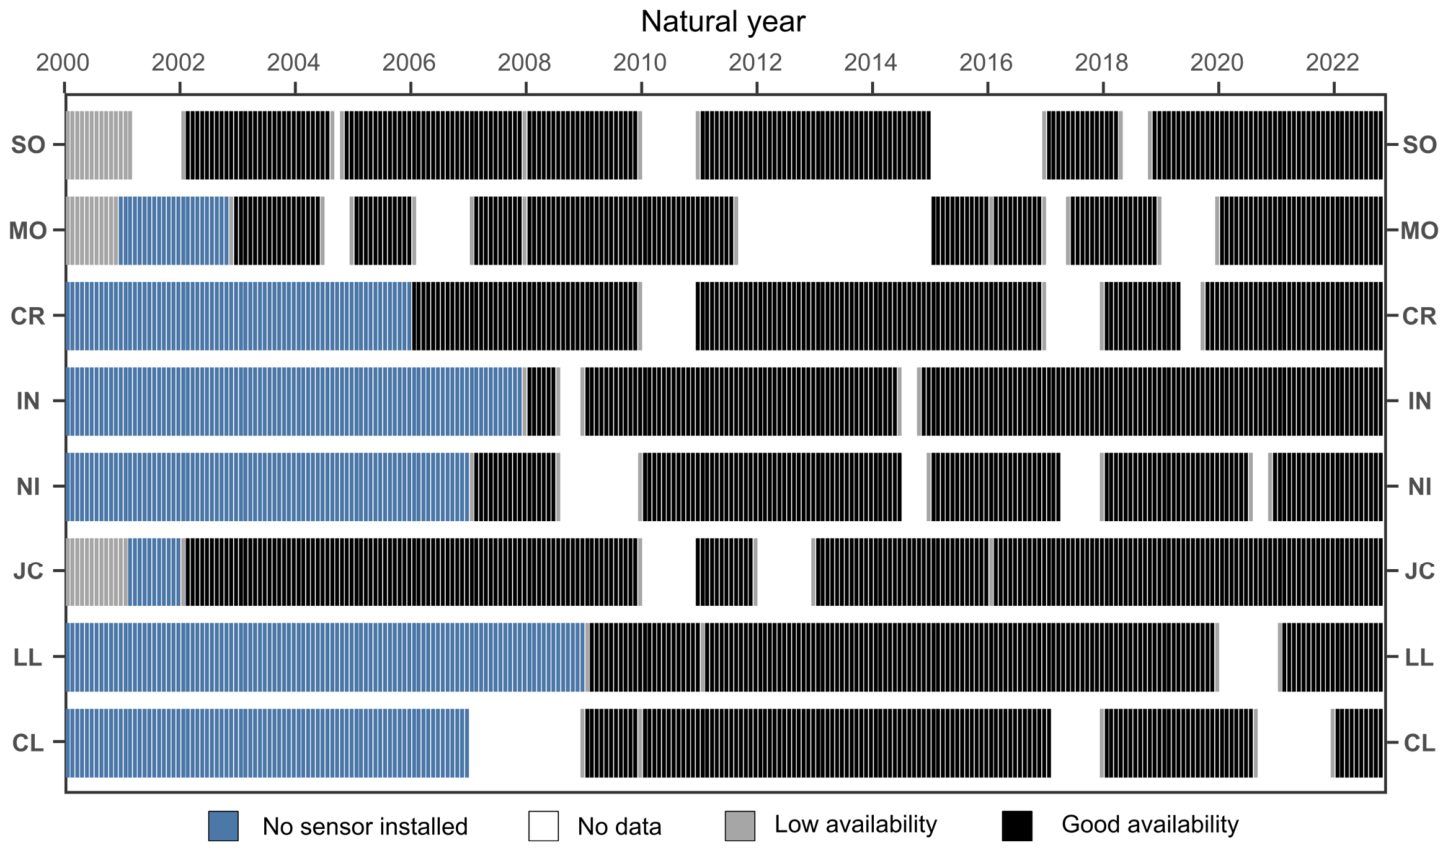
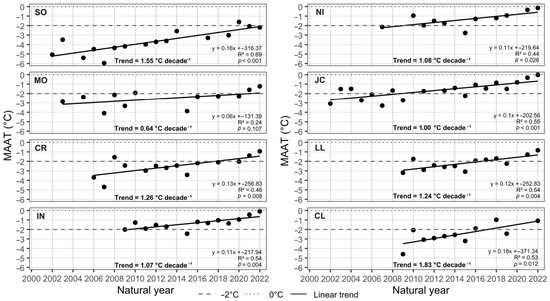
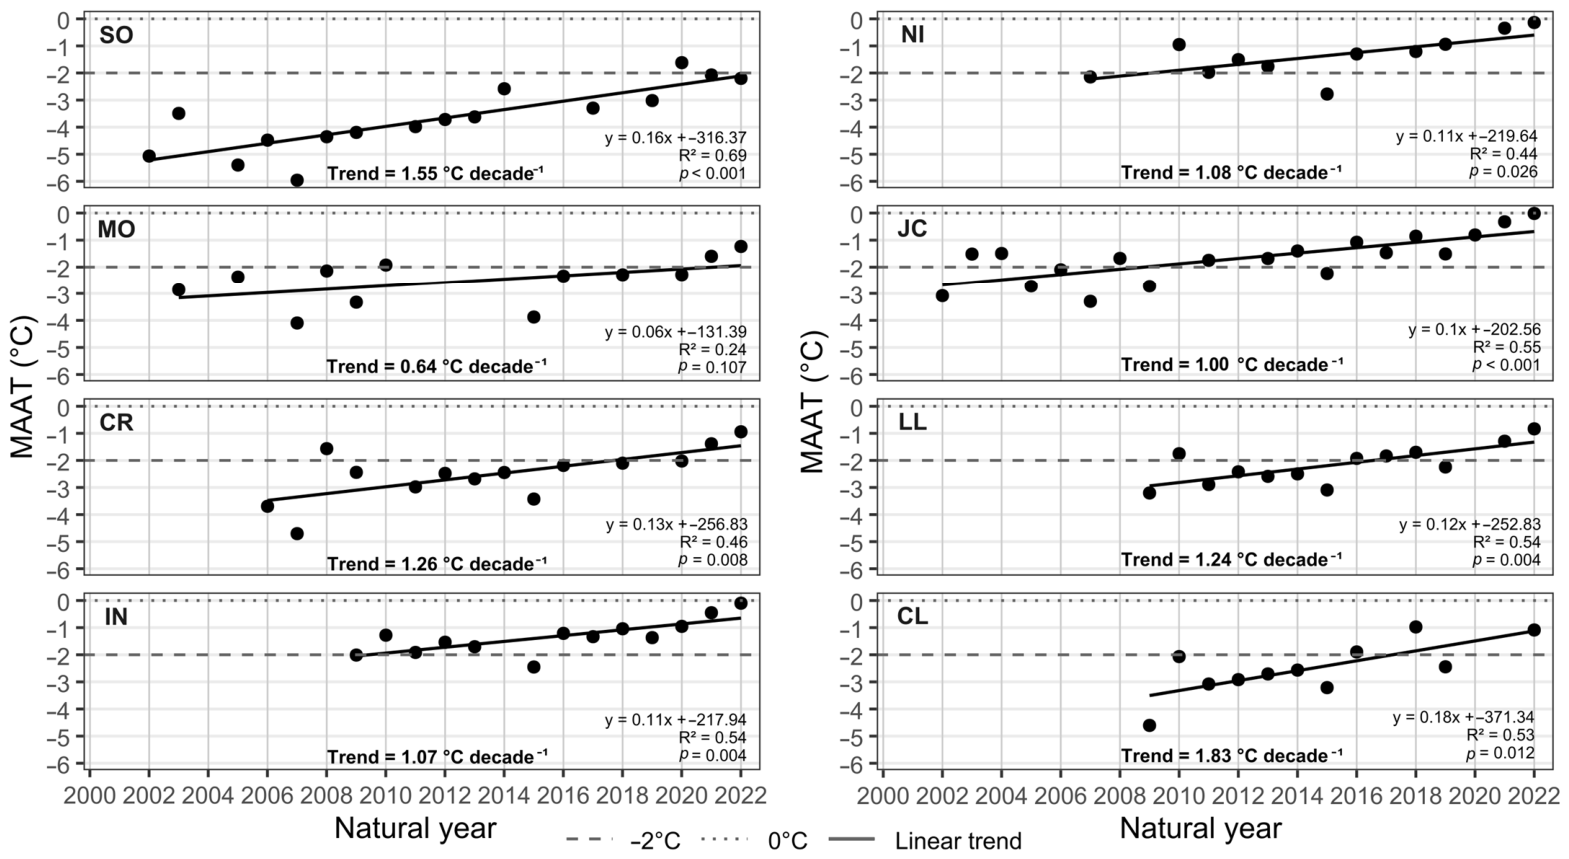
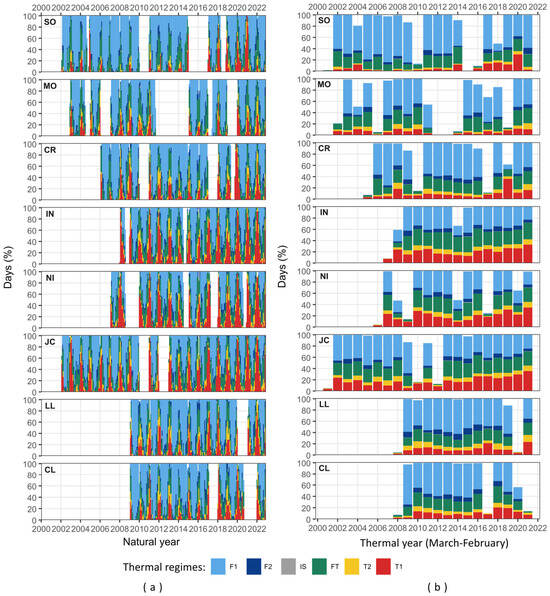
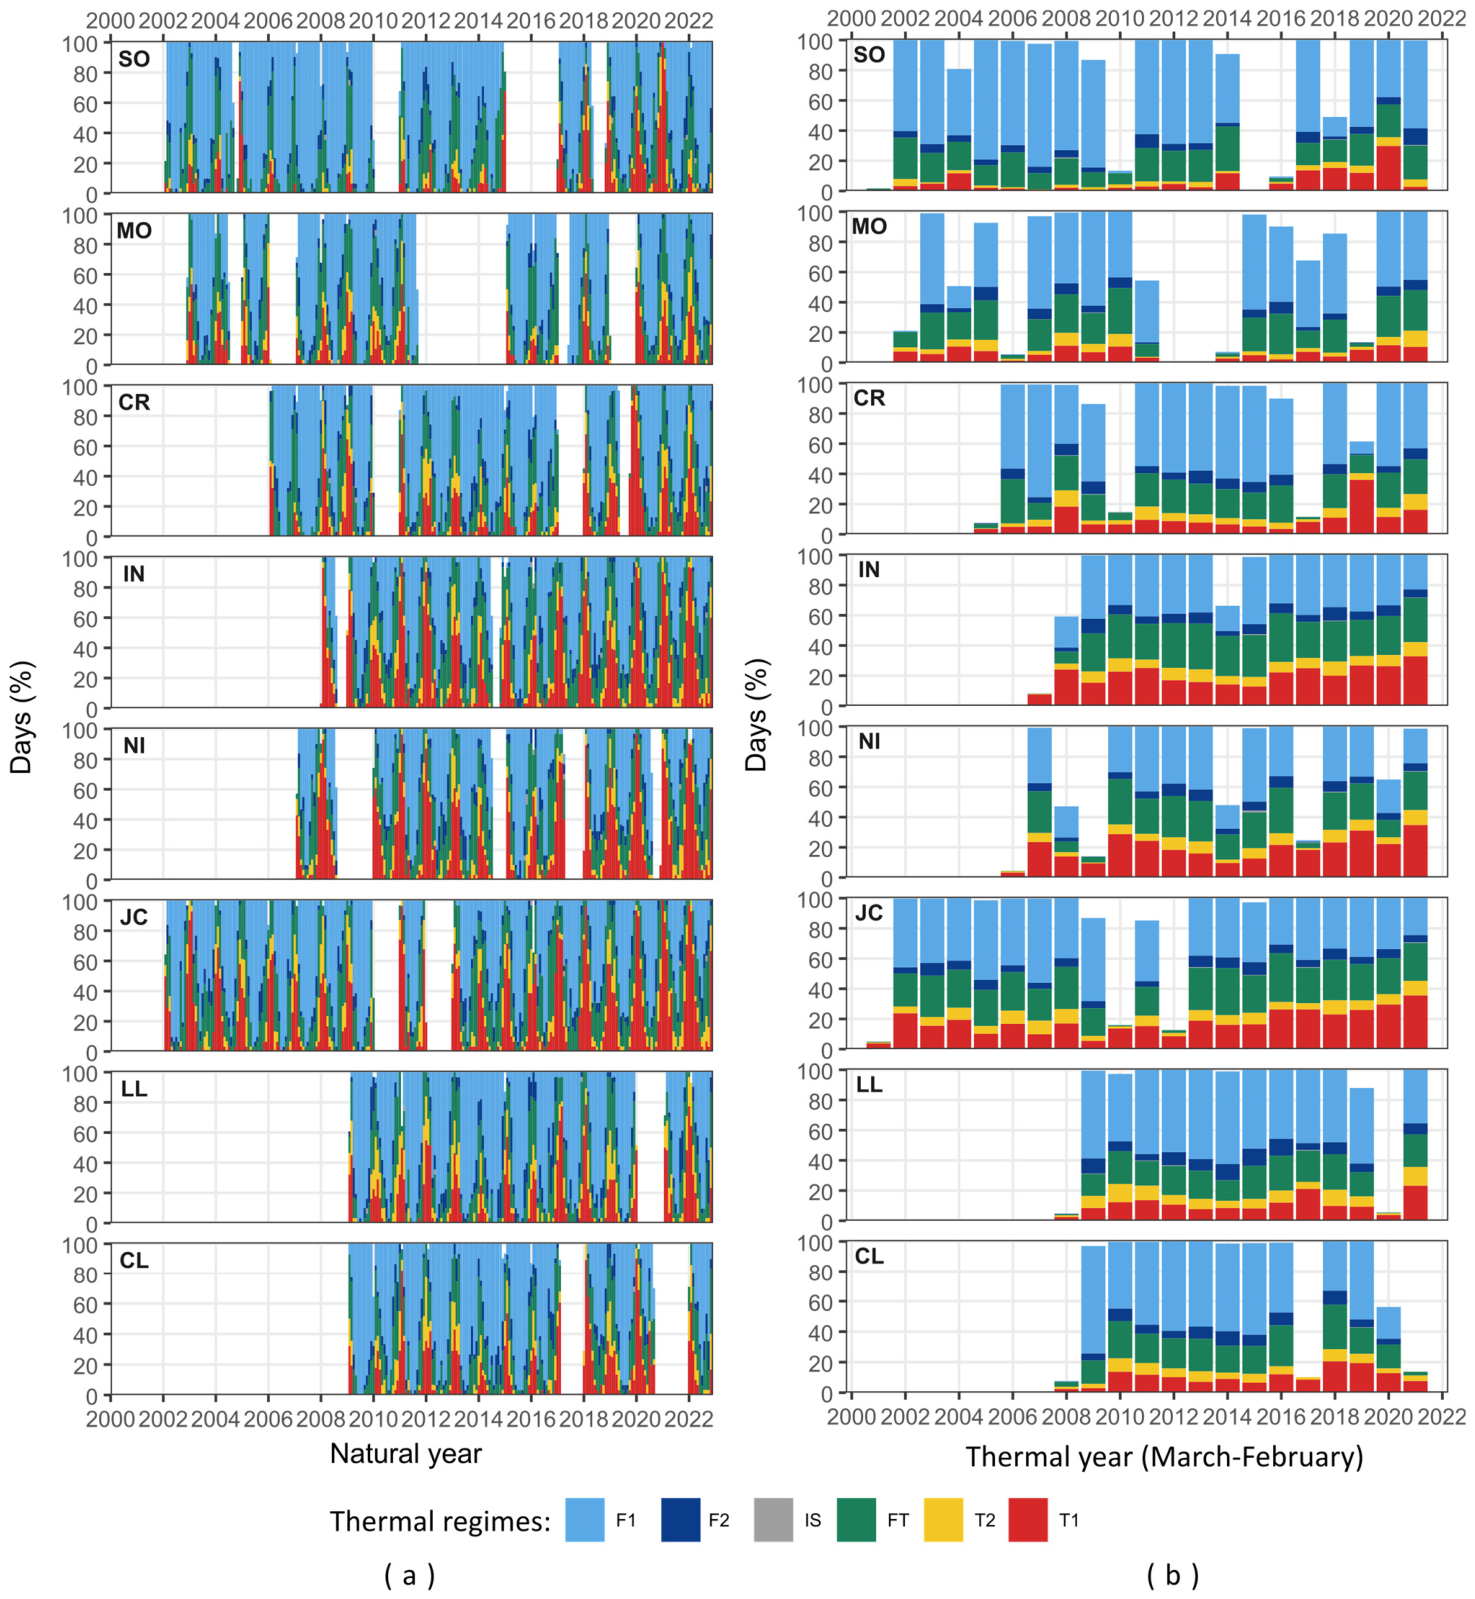
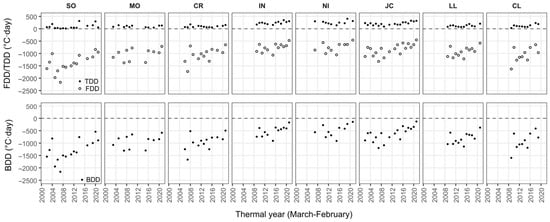
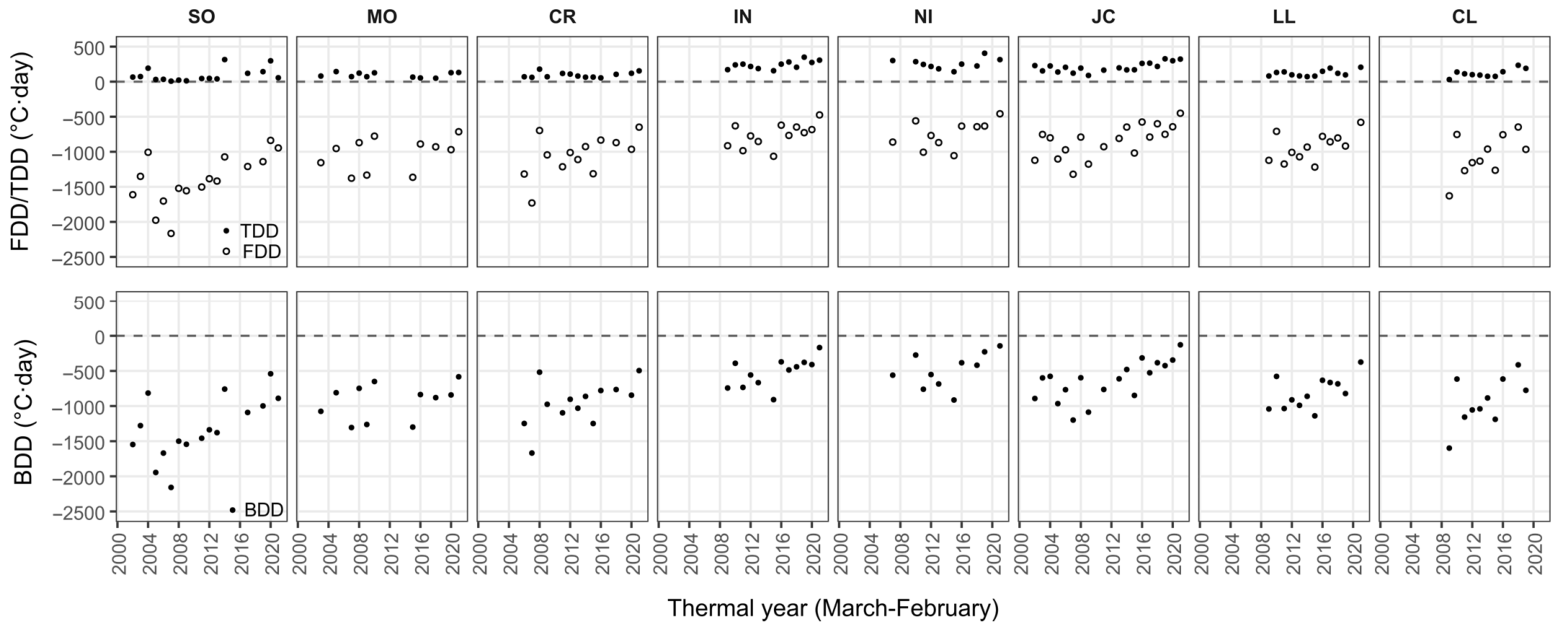
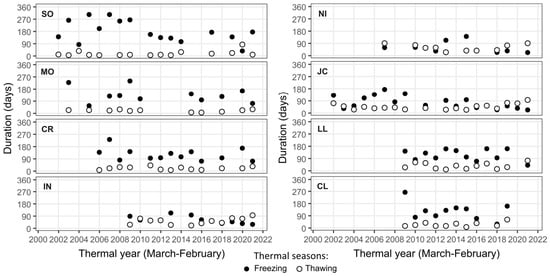
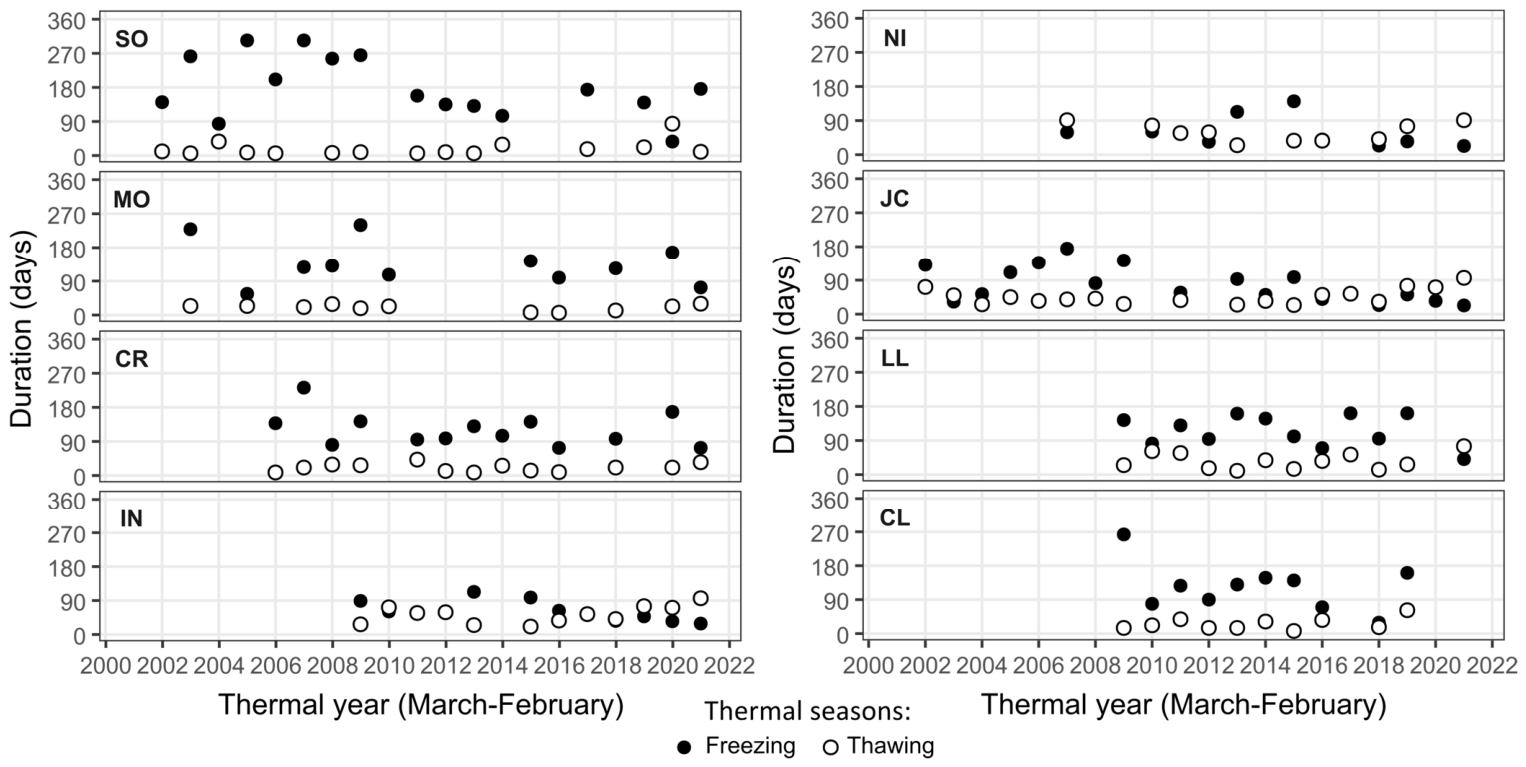
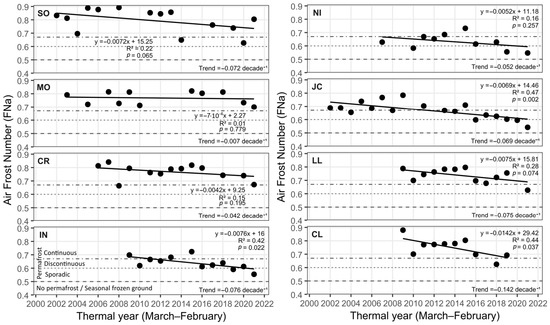
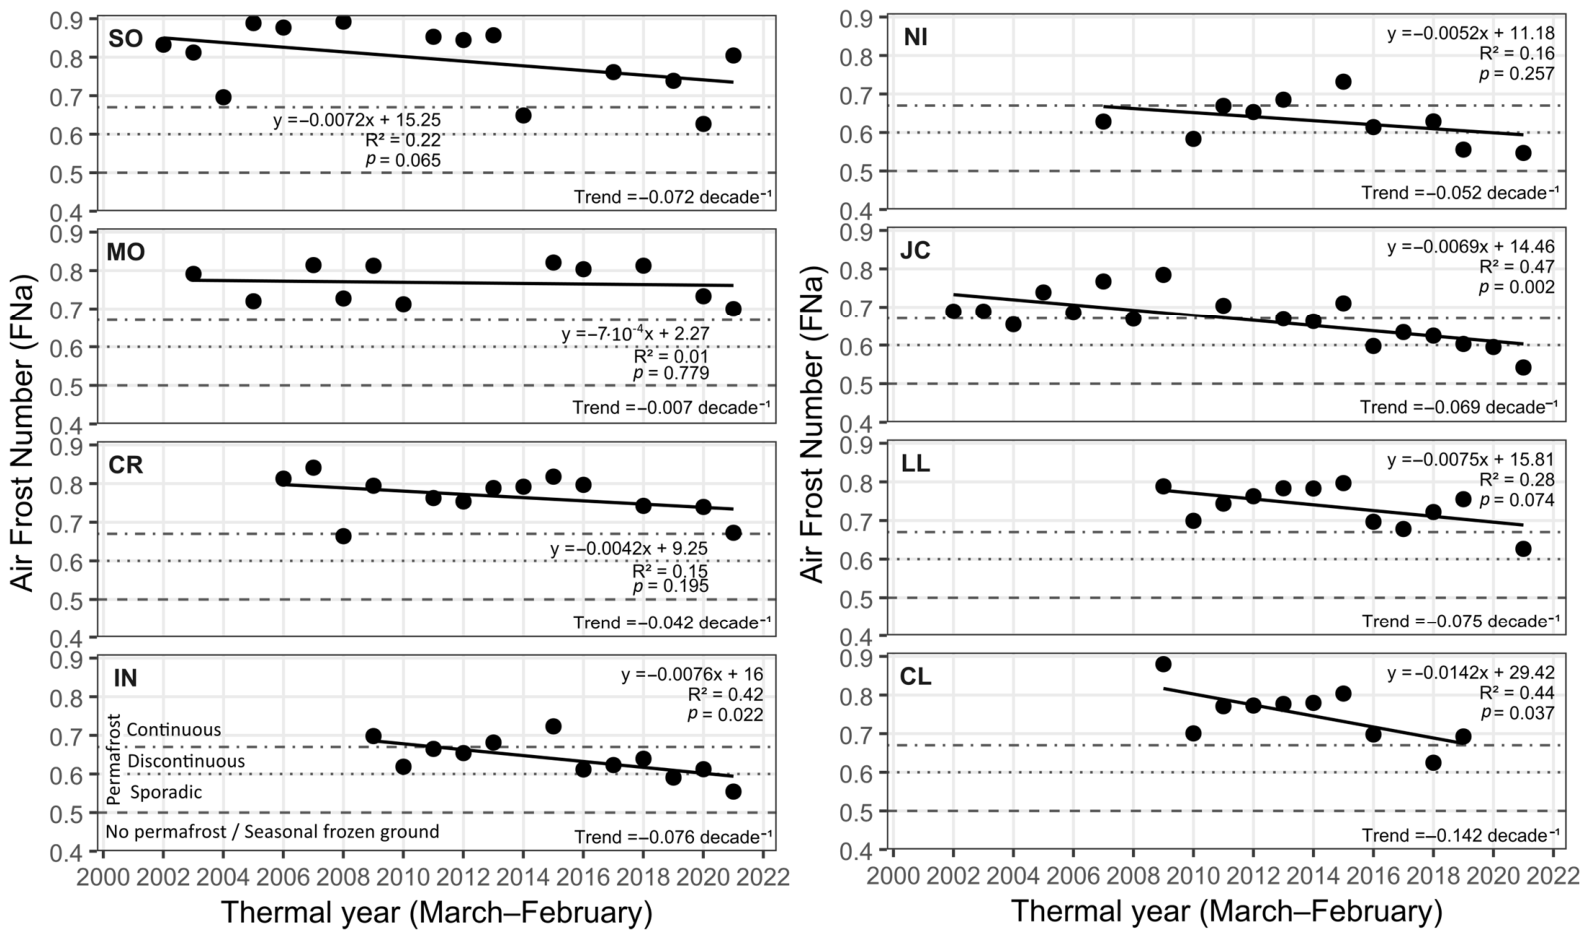

Disclaimer/Publisher’s Note: The statements, opinions and data contained in all publications are solely those of the individual author(s) and contributor(s) and not of MDPI and/or the editor(s). MDPI and/or the editor(s) disclaim responsibility for any injury to people or property resulting from any ideas, methods, instructions or products referred to in the content. |
© 2026 by the authors. Licensee MDPI, Basel, Switzerland. This article is an open access article distributed under the terms and conditions of the Creative Commons Attribution (CC BY) license.