Article

Estimating Effect of Sheltering on Horizontal Measurement of Global Solar Radiation Using a Pyranometer


Department of Aeronautics and Astronautics, National Cheng Kung University, 1 University Road, Tainan City 70101, Taiwan
*
Author to whom correspondence should be addressed.
Atmosphere 2026, 17(6), 556; https://doi.org/10.3390/atmos17060556 (registering DOI)
Submission received: 15 April 2026 / Revised: 22 May 2026 / Accepted: 24 May 2026 / Published: 28 May 2026
(This article belongs to the Section Atmospheric Techniques, Instruments, and Modeling)

Abstract

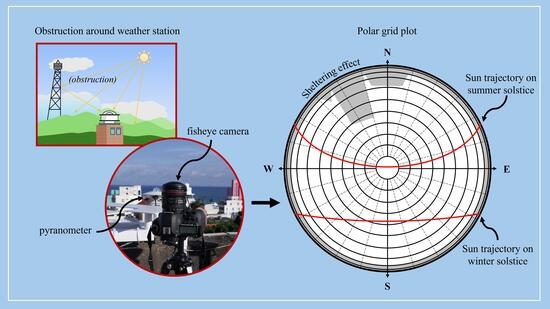
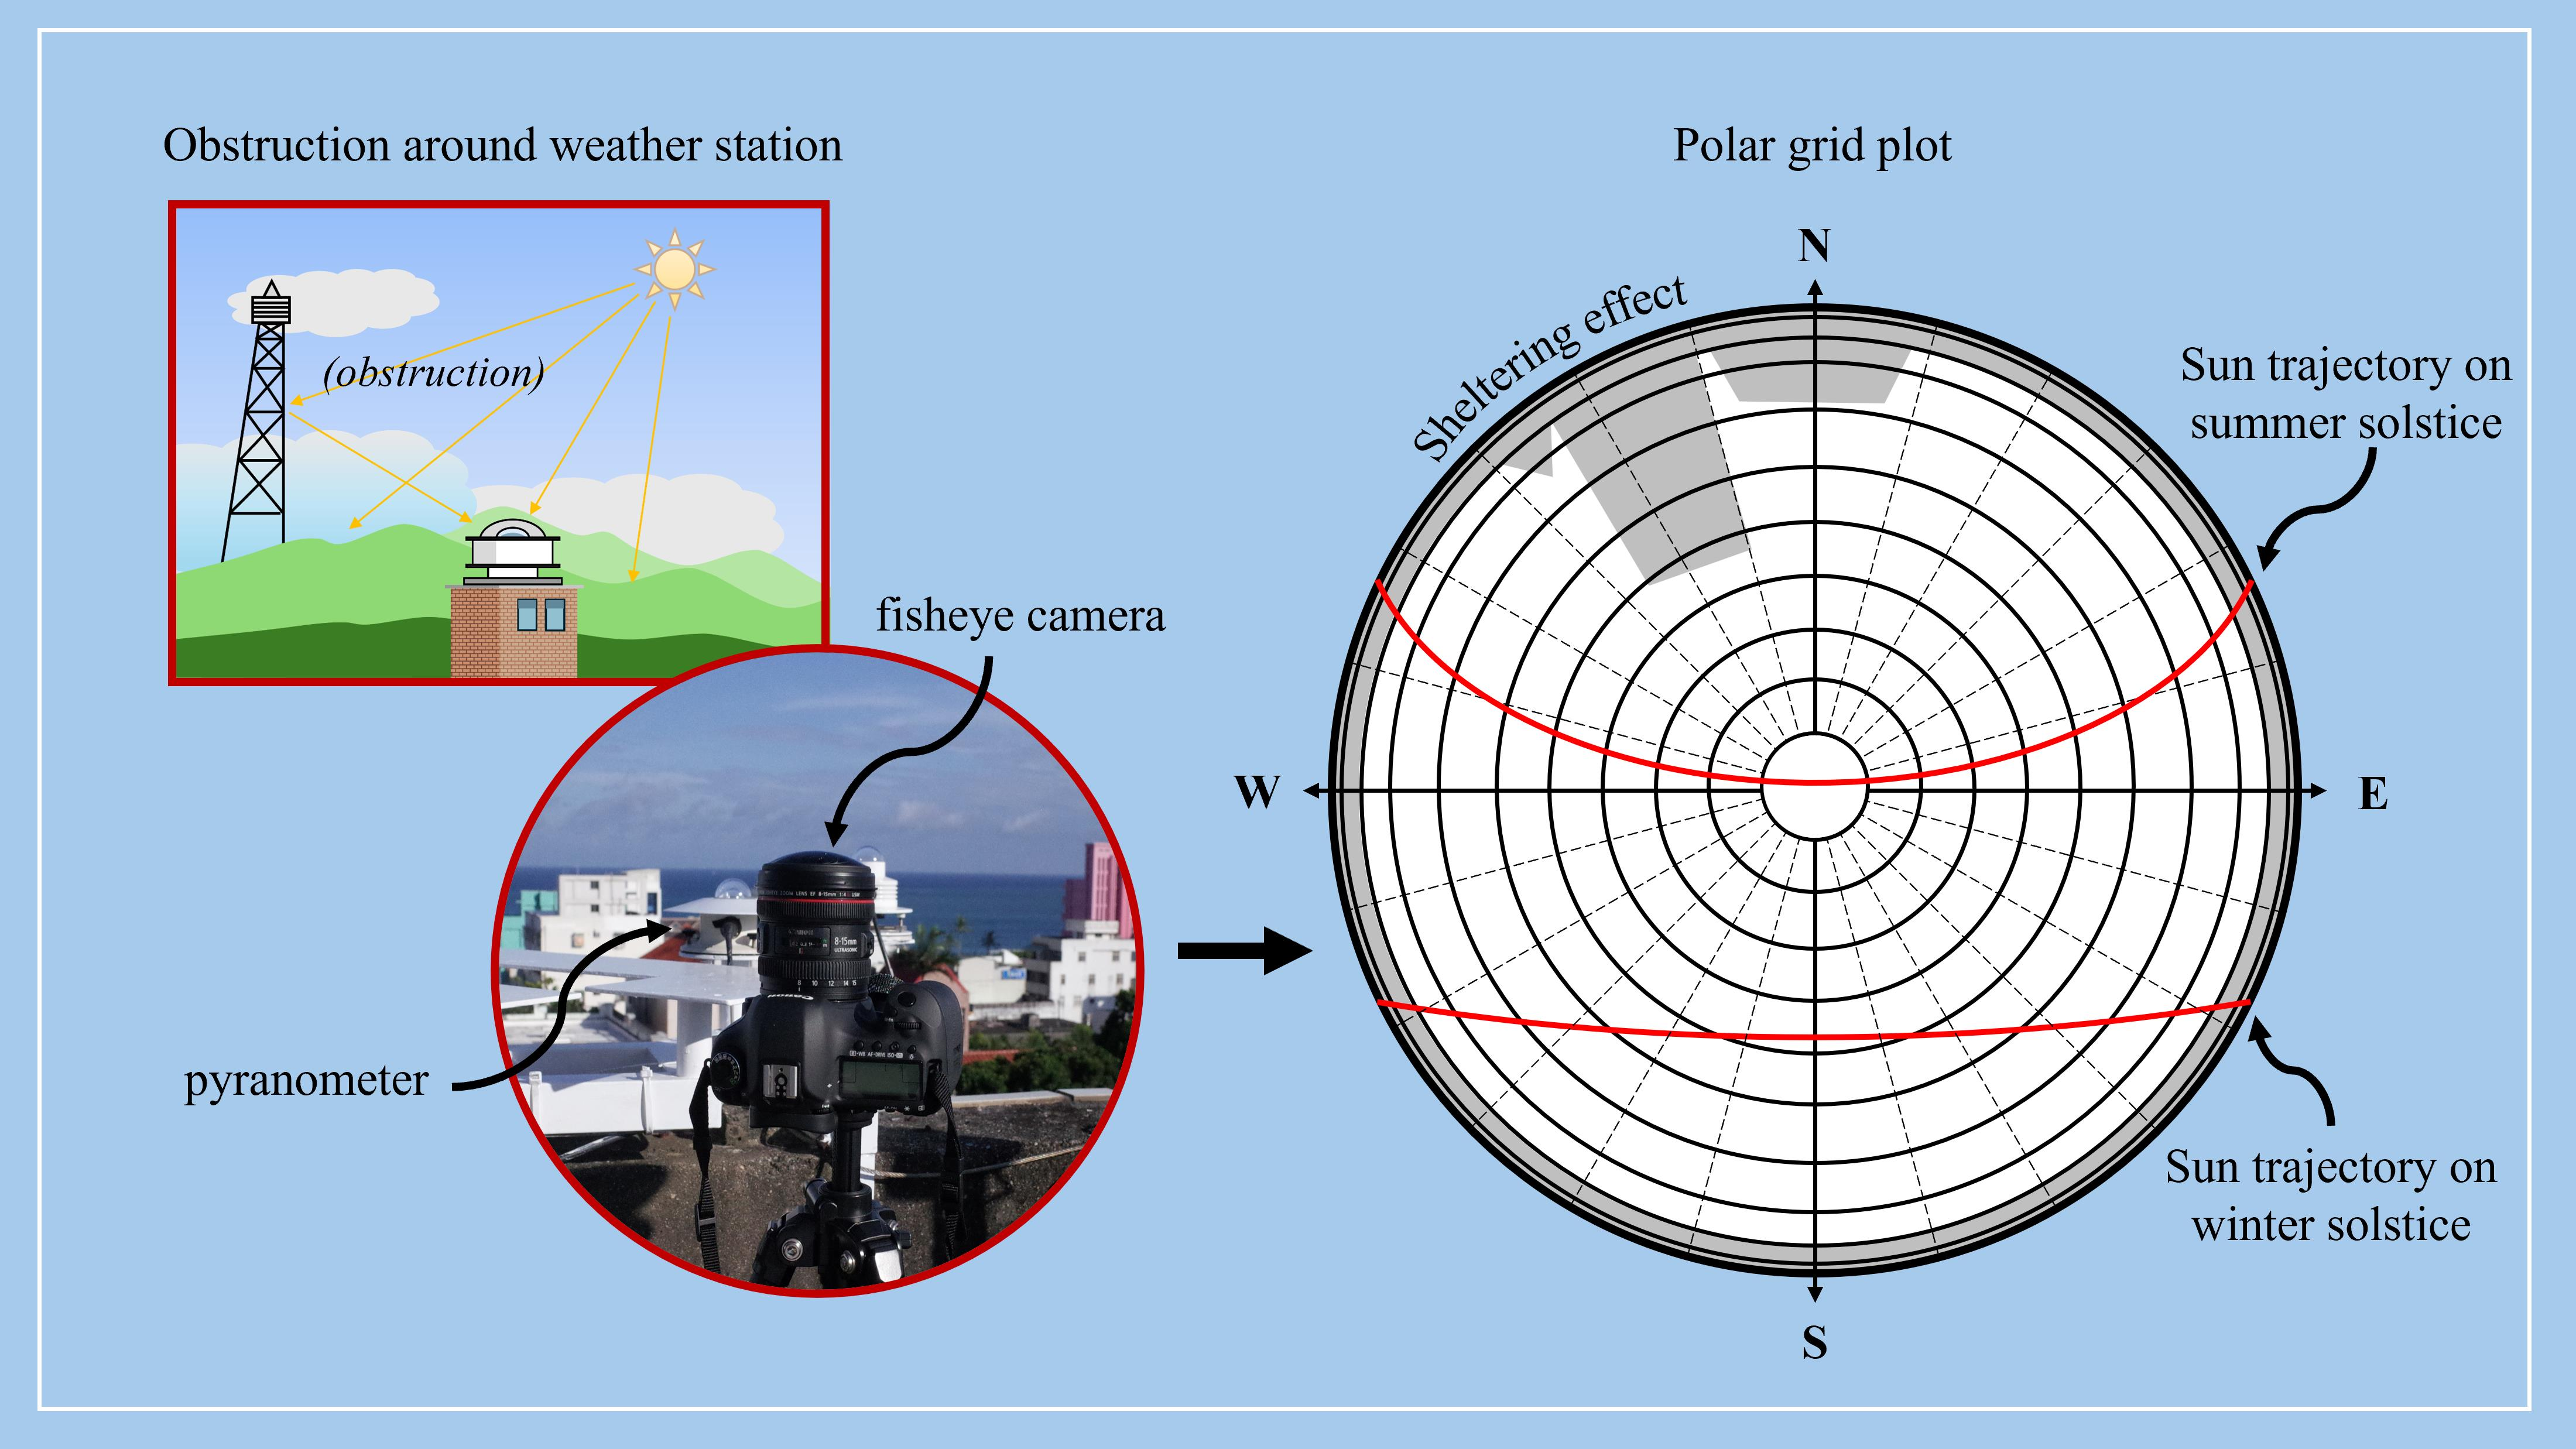
Horizontal measurement of global radiation on the rooftop of a weather station is generally hindered by the presence of obstructions surrounding the pyranometer. To investigate the sheltering effect, measured data from two weather stations in Taiwan, namely the Taitung (TWS) and Penghu (PWS) weather stations, were compared with corresponding in situ data measured under zero-shelter environments at nearby locations: the Taitung Center of National Open University (TCNOU) and the Penghu University of Science and Technology (PUST). The shelter view factor around the installed pyranometer was determined using a fisheye-lens image together with a calculation method based on a polar grid representation with sufficiently fine annuli. The shelter view factors for TWS and PWS were 11.8% and 5.0%, respectively. Comparisons of the monthly global radiation data measured at TWS and TCNOU and at PWS and PUST showed that underestimations of global radiation ranged from 1.8 to 9.1% (2016–2017) at TWS and from 1.3 to 4.2% (May 2015–December 2017) at PWS. These underestimations were primarily attributed to the magnitude of the shelter view factor for all obstructions around the pyranometer but were also dependent on the local pattern of global radiation (that is, beam and diffuse radiation), which is a climatological factor.

Graphical Abstract

1. Introduction

Solar radiation is the most abundant renewable energy source and the primary energy source for supporting animal and plant life on Earth [1]. Recent years have seen significant advancements in harnessing solar energy. These advancements go beyond improvements in solar panel efficiency and energy storage technologies, encompassing innovations in analyzing and utilizing solar radiation data. Credible, up-to-date solar radiation data are essential for performing energy assessments of all solar energy applications, whether for photovoltaic or thermal use.
The most critical input parameter employed for solar energy applications at a specific location is global solar radiation on a horizontal surface [2]. There are three methods of measuring this parameter: ground measurements, satellite measurements and estimation using empirical models. Accurate estimation of global solar radiation at a specific time and location is critical for a variety of solar applications. Ground measurements provide the most accurate and reliable data on global solar radiation, and instruments such as the pyranometer are used for continuous, long-term operations at meteorological stations. However, compared to the other two methods, ground measurement is expensive and is not feasible in all locations, particularly in marine environments. In addition, ground measurements for global solar radiation in homogeneous, low-lying landscapes are generally reliable when taken within a few tens of kilometers. In areas near the sea, urban centers, or rapidly changing landscapes such as mountains, their reliability may be restricted to just a few kilometers.
Satellite-derived global solar radiation data are instantaneous spatial averages from remote images taken several kilometers from the ground by geostationary and polar-orbiting satellites. The derived global solar radiation data are not as precise as ground measurement data since they require atmospheric models to estimate the corresponding data at ground level. Although satellite measurements of global solar radiation are not as accurate as ground measurements at meteorological stations, satellite measurements may generate more accurate estimates outside the vicinity of a meteorological station when using classical interpolation methods based on the available ground measurements.
Although ground or satellite measurements of global solar energy are preferable, the high cost of measuring devices and the requirement for specific and constant calibrations can make them unaffordable, especially in developing countries. There are two alternative methods of obtaining global solar radiation data in addition to direct (ground) and indirect (satellite) measurement. The first uses an empirical approach where meteorological data are analyzed with the regression technique. The second determines the solar constant by considering the loss of insolation due to atmospheric clearness variation in terms of cloud coverage extent, and is less popular than the first class. In developing countries, as the measurement of global solar radiation is only feasible in a few places, sunshine hours are generally measured using relatively easily operated and inexpensive devices such as a Campbell–Stokes recorder. The most commonly used parameter in empirical models for estimating global solar radiation is sunshine duration, because such data are widely available around the world [2,3,4]. In particular, Kambezidis [4] established spherical trigonometric formulas to estimate the sunshine and sunset hours for locations on flat and complex terrain.
Among the three abovementioned methods of measuring global solar radiation, ground measurement data play a fundamental role and are frequently used to validate the accuracy of data provided by satellites or an empirical model. Precise ground measurement is, therefore, essential for establishing an accurate database of global solar radiation, in order to validate data obtained using the other two methods; in addition, the data can be used to create a map of a specified region, which can serve as a reliable scientific reference for assessing the performance of solar energy systems.
A series of applications for obtaining sky fisheye imagery has been used to assess cloud coverage [5,6,7,8] or to nowcast global horizontal irradiance [9,10]. The effect of tree shading on horizontal global radiation in an urban district was assessed using either the fisheye imagery in [11] or a set of aligned orthographical cameras in [12]. In addition, Kejna et al. [13] used fisheye photographs, taken using a camera equipped with a fisheye lens, to interpret the variations in global radiation between urban and suburban areas in a city in central Poland. However, they used the result shown in the fisheye photograph to qualitatively estimate the obscuration of the horizon.

2. Analysis and Conditions for Horizontal Measurement of Global Radiation

2.1. Total Radiation Measured by a Horizontally Placed Pyranometer

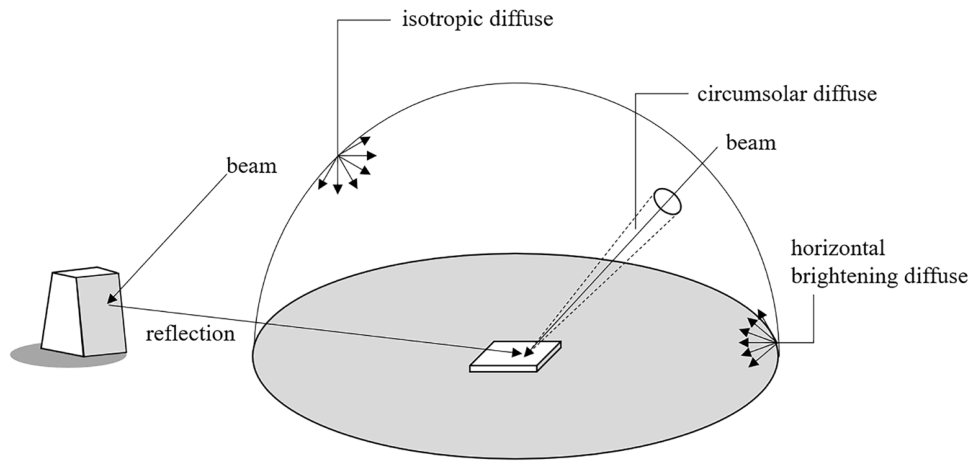
Ground measurements of global solar radiation, which serve as the database, are performed on a horizontal plane. Accurate measurements are dependent not only on regular calibration of the pyranometer, but also on the extent of sheltering in the vicinity of the installed pyranometer. Global solar radiation is composed of beam and diffuse radiation from the sky dome. However, the total radiation incident on a sensor installed on a horizontal surface, such as a pyranometer (which is schematically shown in Figure 1), is composed of the following basic components: beam and diffuse radiation, in addition to the reflected radiation caused by obstructions (shelters) in the vicinity of the pyranometer. Diffuse radiation can be further split into three parts: isotropic, circumsolar and horizon brightening. Circumsolar diffuse radiation results from the forward scattering of solar radiation and is concentrated around the sun (beam) ray. Diffuse radiation caused by horizon brightening results from the refraction processes of solar rays in air and is concentrated near the horizon; however, it contributes little weighting (<1%) to the total diffuse radiation, except at sunrise and sunset. The total hourly radiation incident on the sensor (shown in Figure 1), that is, the measured total radiation ( I T ) , is expressed as
I T = I b + I d , c s + I d , i s o F c s + I d , h z F c h z + n I n ρ n F c n
In Equation (1), I b , I d , c s , I d , i s o and I d , h z represent the beam, circumsolar diffuse, isotropic diffuse and horizontal brightening diffuse radiation, respectively; I n and ρ n , respectively, represent the solar radiation incident on the n -th obstruction but reflected toward the sensor, and the obstruction’s reflectivity; F c s , F c h z and F c n are the view factors from the sensor to the sun, to the horizon and to the obstruction, respectively. Direct irradiance on a plane normal to the solar ray is called direct normal irradiance (DNI). The recommendation of the World Meteorological Organization (WMO) for the half-angle aperture of pyrheliometer is 2.5° [14]. Considering the visible diameter of the sun (1.392 ×   10 6 km) and the variation in sun–Earth distance throughout a year (1.496 ×   10 8 km ± 1.7%), the half-angle of the sun disk is equal to 0.2666 ° ± 1.7 % . The pyrheliometer-measured DNI on the surface of Earth therefore includes circumsolar diffuse radiation [14]. Diffuse irradiance on the ground is usually measured using a pyranometer equipped with a shadow-band stand. For instance, the Eppley Laboratory shadow-band stand (Model SBS) uses a 76.2 mm band width with a 635 mm diameter to shade the sensing element of the pyranometer from the DNI. The half-angle of the shadow band is t a n 1 76.2 / 2 635 = 3.43° > 2.5°. Thus, the DNI that is blocked by the shadow band includes circumsolar diffuse radiation too.
According to the WMO guidelines for installing a pyranometer [14], the site selected to install a pyranometer should be free of obstructions above the plane of the sensing element. If this is impracticable, a site should be chosen where there are no obstructions within the azimuth range of sunrise and sunset throughout the year, having an elevation exceeding 5°. From this point of view, the contribution of the diffuse radiation caused by horizontal brightening is not considered in the measurement of global radiation using a pyranometer. Other obstructions should not reduce the total solid angle by more than 0.5 steradian ( s r ). In addition, the pyranometer should not be close to light-colored walls or other objects likely to reflect solar radiation onto it. Sun elevations less than 5° occur at the time very close to the sunrise or sunset moment. The beam radiation is negligibly small at these moments. Thus, their reflective radiation from a light-colored obstruction with the elevations less than 5° can be reasonably neglected in determining I T . Based on the above, I T in Equation (1) can be rewritten in the form of the following three terms: (1) total DNI, which includes both beam and circumsolar diffuse radiation, but will still be referred to as beam radiation hereafter; (2) isotropic diffuse radiation; and (3) reflected radiation.
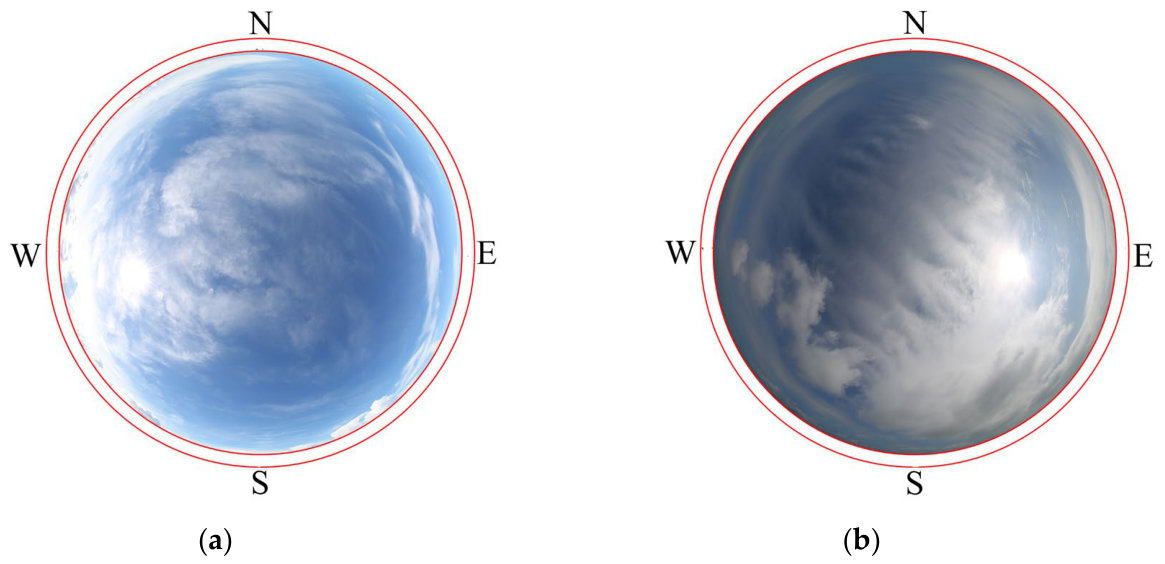
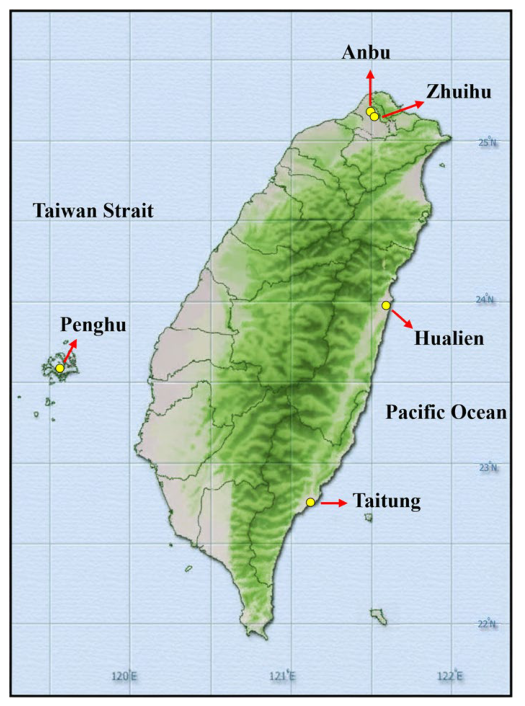
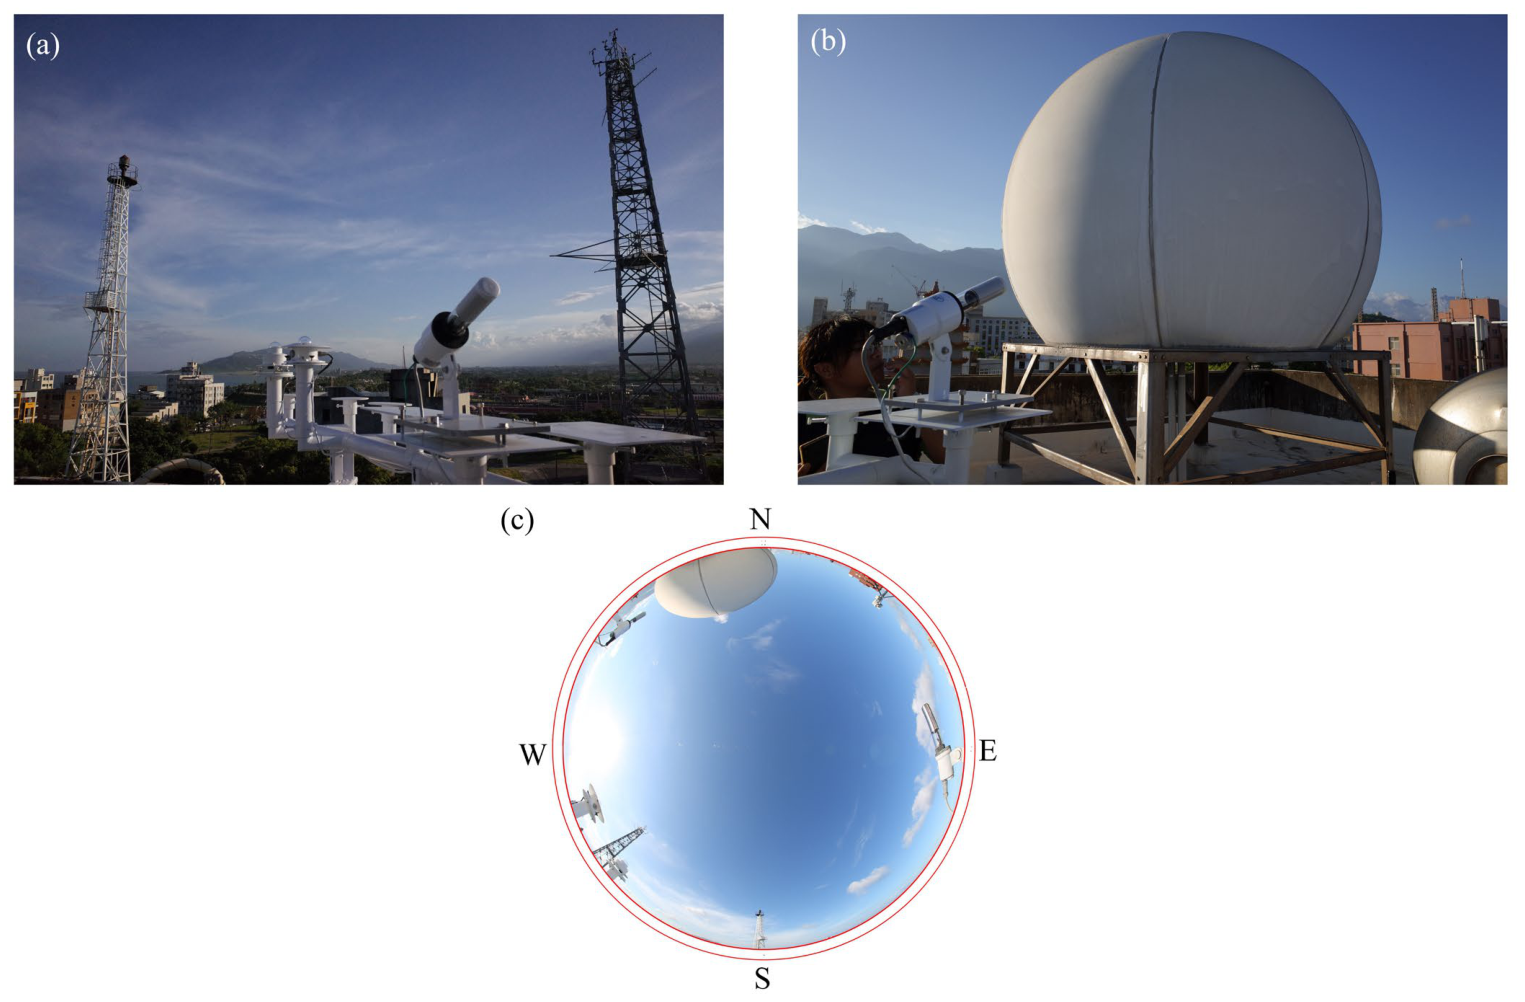
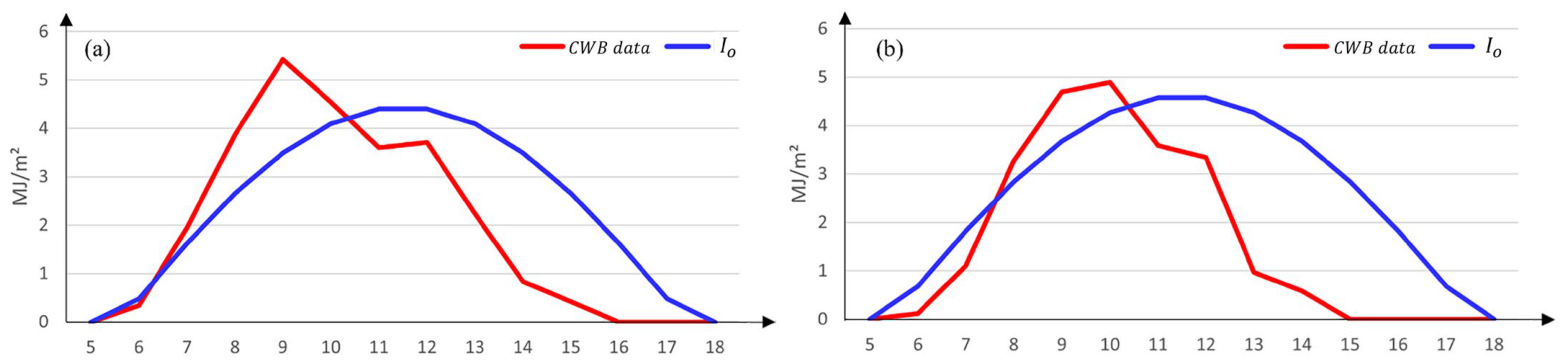
The Hualien weather station (121.61° E, 23.98° N, 16.1 m) is located in an urban area of Hualien County in the narrow eastern coastal plains of the Taiwanese mainland (see Figure 2). Figure 3a,b present photographs of the southward and northward of the pyranometer, taken from the rooftop of the Hualien weather station. They show two short meteorological towers, a radome and some other meteorological devices, including the pyranometer, on the small rooftop. Figure 3c shows a fisheye photograph with markers to indicate orientation, taken at the same rooftop position using a camera equipped with a fisheye lens. The narrow outer ring indicates the zone with elevation from the horizon of less than 5°. Figure 4 compares the hourly global solar radiation distribution measured at Hualien weather station by the CWB [15] and the corresponding extraterrestrial radiation distributions; they were calculated using Formula [16] below on 12 March 2018 and 27 March 2020, respectively.
I 0 = 12 × 3600 π G s c 1 + 0.033   c o s 360   D 365 c o s ϕ   c o s δ s i n ω 2 s i n ω 1 + π ( ω 2 ω 1 ) 180 s i n ϕ   s i n δ
In Equation (2), ( G s c = 1.3611 ×   10 3 MW/ m 2 [17]) is the solar constant, D is the day of the year, ϕ is the latitude, δ is the solar declination angle and ω 1   ,   ω 2 , respectively, are the beginning and ending hour angles (in degrees) for a specified hour. The extraterrestrial radiation on a horizontal plane theoretically defines the upper limit of global radiation that is incident on the ground at any hour. However, as shown in Figure 4, the measured data for global radiation is higher than I 0 during some hours on the two specified days, which is physically unrealistic. At the Hualien weather station, the radome is located on the northern side of the pyranometer; its elevation angle obviously exceeds 5° on the horizon (see Figure 3c), which is situated in the northern hemisphere; and the sun almost lies above the southern horizon in the daytime in March. Therefore, the comparison results shown in Figure 4 indicate that some radiation incident on the pyranometer is contributed by the reflected beam radiation from the radome, as schematically demonstrated in Figure 1, so the total radiation measured at that moment is higher than the corresponding I 0 value.
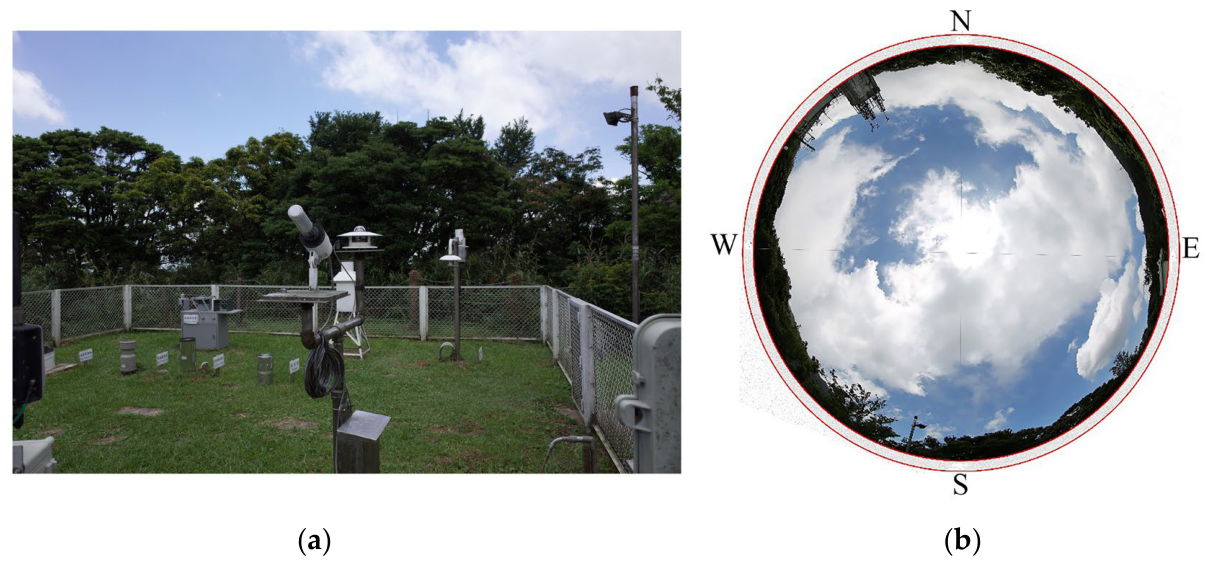
The Anbu (121.53° E, 25.18° N, 837.6 m) and Zhuzihu (121.54° E, 25.16° N, 607.1 m) weather stations are located in a volcanic mountainous area of the northern Taiwanese mainland. Figure 2 shows that the horizontal distance between these two stations is short, but their elevations are noticeably different. The extent of interference by air in the atmosphere with solar radiation is dependent on the air density. Air becomes more dilute in the atmosphere as the altitude increases, leading to reduced interference. According to Becker and Boyd [18], solar radiation at a site decreases with increasing altitude for altitudes higher than 304.8 m above sea level, but no definite relationship exists between atmospheric radiation transmission and altitudes below 304.8 m. There are six weather stations whose altitudes are higher than 304.8 m in Taiwan [19]. With the exception of the Anbu and Zhuzihu stations, the estimated values for global radiation in a typical meteorological year (TMY) between 2004 and 2018 at these high-altitude stations do exhibit the trend of increasing radiation with respect to altitude, in agreement with Becker and Boyd [18]. Hsieh et al. [19] reported that the annual global radiation at the Anbu (at higher altitude) and Zhuzihu (at lower altitude) stations are 3268.7 and 3421.8 M J m 2 , respectively. According to the increment curve tuned by Becker and Boyd (see Figure 8 in [18]), the percentage increase in global radiation from the Anbu station to the Zhuzihu station should be around 2.2%. Nevertheless, the annual global radiation measured at the Anbu station is 3.9% less than that measured at the Zhuzihu station which does not align the established patterns. Figure 5 and Figure 6 present fisheye photographs centered next to the installed pyranometer in the yard of the Anbu station and on the rooftop of the Zhuzihu station, respectively. The pyranometers installed at these stations do not meet the WMO requirement stating that no obstruction should possesses an elevation exceeding 5°. Moreover, sheltering is present in the whole area (360°) surrounding the Anbu station (Figure 5) in contrast to about 2/3 of the area surrounding the Zhuzihu station (Figure 6). This shows that the sheltering effect of obstructions at the Anbu station is more serious than that at the Zhuzihu station; thus, annual global radiation at the Anbu station was underestimated to a greater extent than at the Zhuzihu station, which aligns with the TMY data reported by Hsieh et al. [19].

2.2. Objectives

The above observations indicate that interference with horizontally placed pyranometers from nearby obstructions cannot be avoided in many practical situations. This study aims to (1) quantitively evaluate the extent of sheltering in terms of view factor and (2) investigate the sheltering effect by comparing the global radiation measured at two selected CWB stations with the corresponding in situ data under zero-shelter environments, which were measured at locations close to each CWB station.

3. Experimental Method

3.1. Testing Sites

Two CWS weather stations were selected as testing sites. The first is the Taitung weather station (TWS; 121.15° E, 22.75° N, 9.0 m) which is in an urban area of Taitung County in the narrow eastern coastal plains of the Taiwanese mainland (see Figure 2). The in situ measurements of global radiation under zero-shelter environment were conducted in 2016–2017 at the Taitung Center of the National Open University (TCNOU; 121.12° E, 22.76° N), located 1.63 km away from TWS. The second is the Penghu weather station (PWS; 119.56° E, 23.56° N, 10.7 m), which is in an urban area of Magong city on an island of the Penghu archipelago in the Taiwan Strait (see Figure 2). The in situ measurements of global radiation under zero-shelter environment were conducted from May 2015 to December 2017 at the Penghu University of Science and Technology (PUST; at 119.58° E, 23.58° N), located 1.24 km away from PWS.

3.2. Set up for Measuring Global Radiation

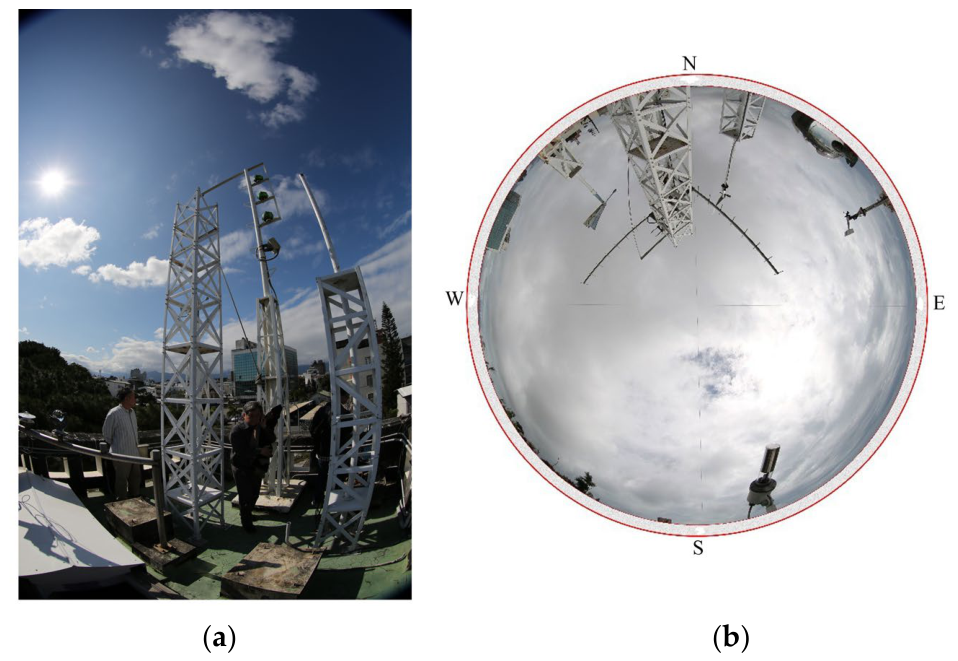
Two monitoring stations were set up for measuring global radiation under conditions of zero shelter, namely one at TCNOU and one at PUST, as shown in Figure 7a,b, respectively. Each monitoring station was equipped with a horizontally installed Kipp and Zonen pyranometer (Model SPM10), which is classified as a Class A standard pyranometer (achievable accuracy = ± 2 % ) [20]). According to Lin and Chang [21], the relative errors before and after calibration for the SMP10 pyranometers installed at TCNOU and PUST were ± 0.34 % and ± 0.40 % , respectively, during the testing periods. The sampling rate was 1 Hz, which was same as the response time of SPM10. In contrast to the pyranometers employed in the study, TWS and PWS were each equipped with an Eppley pyranometer (Model PSP), which is classified as a Case B standard pyranometer (achievable accuracy = ± 5 % ) and is less accurate than the model used in Case A [20]). The sampling rate for measuring global radiation at TWS and PWS was 6 Hz, although the response time of the PSP model was 3 Hz.
Missing global radiation data as a result of extreme events (e.g., typhoon), or due to malfunctions or regular maintenance of the pyranometers, were recreated by applying the cubic spline interpolation method described in the study of Hsieh et al. [19] for both our dataset and that retrieved from the CWB database. Hsieh et al. [19] reported that cubic spline interpolation was sufficiently accurate (≤5%) for hourly global radiation if the number of consecutive points was less than four. Based on their findings, the maximum number of consecutive missing data points that can be interpolated in a day was set to three. When a day had more than 3 h of consecutive missing points, the entire day was considered to be missing and was interpolated using the cubic spline method. Similarly, no interpolation was performed when data for more than three consecutive days was missing in one month. For months with more than three consecutive days of missing data but less than 10 in total, the daily data for the month were retained for calculation. No more than three consecutive missing data points for monthly global radiation were observed for any of the four stations (TNS, PNS, TCNOU and PUST).

3.3. Fisheye Images and Evaluation of View Factors

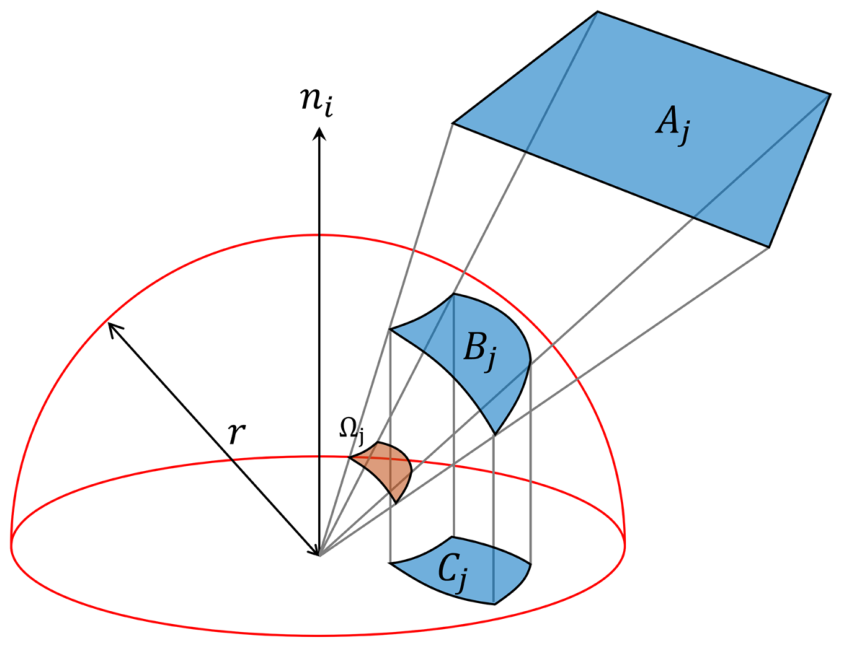
The fisheye images next to the pyranometers were taken with a digital camera (EOS 5D Mark III, Canon Inc, Tokyo, Japan) equipped with a Fisheye lens (EF 8-15 mm f/4L Fisheye USM, Canon Inc., Tokyo, Japan) The lens generated images with 180° fields of view. Combining two 180°-field-of-view images formed a complete 360°-field-of-view image such as the one shown in Figure 3c. As demonstrated in Figure 8, the conical projection of an obstacle with surface A j on the hemisphere is B j , and its normal projection on the base plane, that is, this fisheye’s plane, is C j . The solid angle ( Ω j ) defined by B j is B j r 2 , where r is the radius of the hemisphere. The view factor for the obstacle is defined as Ω j 2 π , which is equivalent to the fraction of the area occupied by C j in a planar circle with radius r, that is, = C j π r 2 [22]. The view factor resulting from a surrounding shelter was termed the area view factor by Gangwisch et al. [12], but is referred to as the shelter view factor in this study to better align with the physical circumstances in this work. Evaluation of the view factor resulting from a surrounding shelter (hereafter referred to as the shelter view factor) was implemented following the technique developed by Steyn and Hay [23] and is outlined below.
The printed images, such as the one shown in Figure 3c, were digitized and then analyzed to distinguish between “sky” and “shelter” pixels. The view factors for individual shelters (Figure 3c) were calculated using the analytical method of Steyn [24]. First, the circular fisheye image print was overlaid with a 37-annulus polar grid with a constant angular width; then, the view factor was calculated for the azimuthal angular extent of each annulus with a resolution of ≤0.5% in the view factor, which is sufficiently accurate for this study. Summing up the view factors for each individual shelter in the printed image yielded the overall shelter view factor.

3.4. Determination of the Sun’s Trajectory on the Fisheye Image

Deformation extent of the distance from the origin in a fisheye image (R, in pixels) for an obstruction (see Figure 8) distorts more with increasing elevation angle (α). For the employed camera equipped with a fisheye lens, the correlation between R and α was tuned with a cubic polynomial relationship as follows:
R   =   1876.6     18.642   α   +   0.091   α 2     0.0013   α 3
The solar path throughout a day can be estimated based on the printed image using Equation (3) by providing the α values for that day of the year.

4. Results and Discussion

4.1. Sheltering Effect for the Pyranometer Installed at TWS

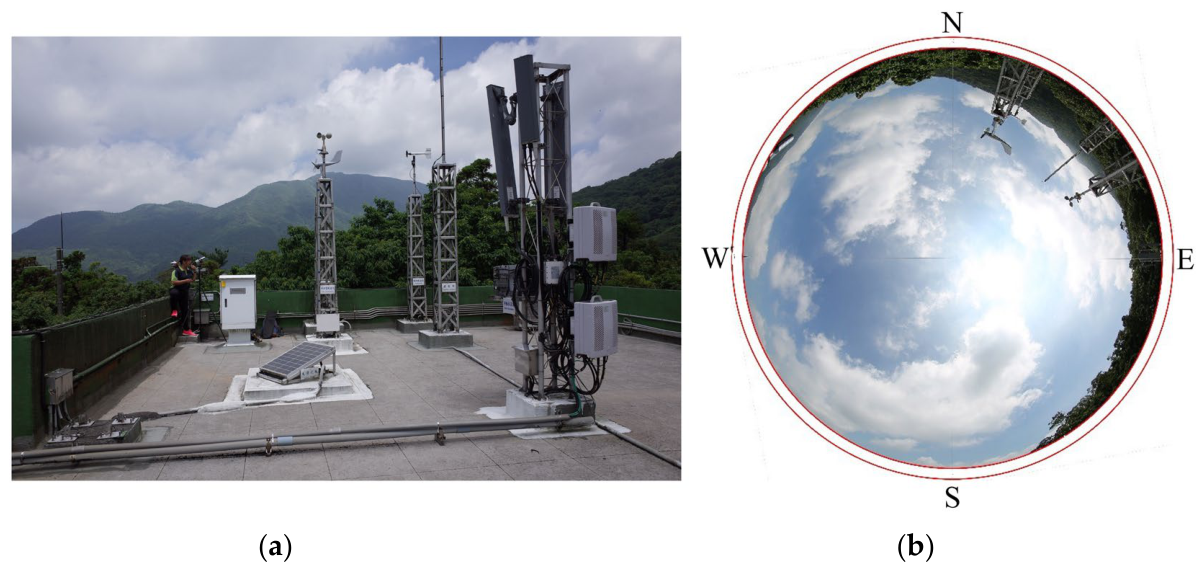
Figure 9a and Figure 9b show regular and fisheye photographs, respectively, with markers to indicate orientation, both taken at a position next to the pyranometer on the rooftop of TWS, with three short meteorological towers clearly visible around the pyranometer. The major obstruction sheltering the pyranometer was the brandreth (with a height of 4.88 m and a distance of 2.37 m from the pyranometer) which was used to install wind anemometers. The calculated shelter view factor for the pyranometer installed at TWS was 11.8%, in contrast to 0% for the one installed at TCNOU (see Figure 7a).
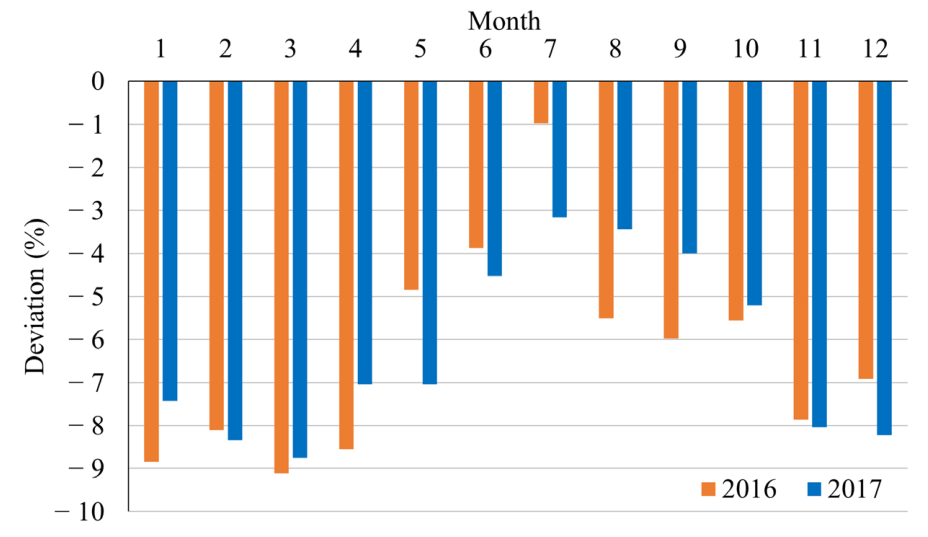
Table 1 summarizes the TCNOU’s monthly global radiation ( G T C N O U ) data for each month in 2016–2017, which serve as the baseline for comparison to the TWS ( G T W S ) data obtained from the Central Weather Bureau (CWB) of Taiwan [15]. The monthly deviations in global radiation between the in situ data measured at TCNOU and the data retrieved from the CWB for TWS for each month in 2016 and 2017 are also recorded in Table 1 and plotted in Figure 10. Here, the monthly deviation in global radiation is calculated using the equation
Δ G = G T W S G T C N O U G T C N O U   × 100 %
The annual deviation is calculated as follows:
< Δ G >   =   i = 1 12 Δ G i × G T C N O U , i i = 1 12 G T C N O U , i   ×   100 %
The annual deviations in global radiation for 2016 and 2017 are calculated using Equation (4) with the data listed in Table 1 and are equal to −5.66% and −5.68%, respectively. Figure 10 shows that the monthly deviation in global radiation is dependent on the month and year. To further analyze these monthly deviation variations, the hourly solar altitude angles during the summer and winter solstices at the latitude of TWS (i.e., 22.75° N) are calculated using the following formula [16]:
sin α s = cos 22.75 ° cos δ c o s ω + sin 22.75 ° s i n ω
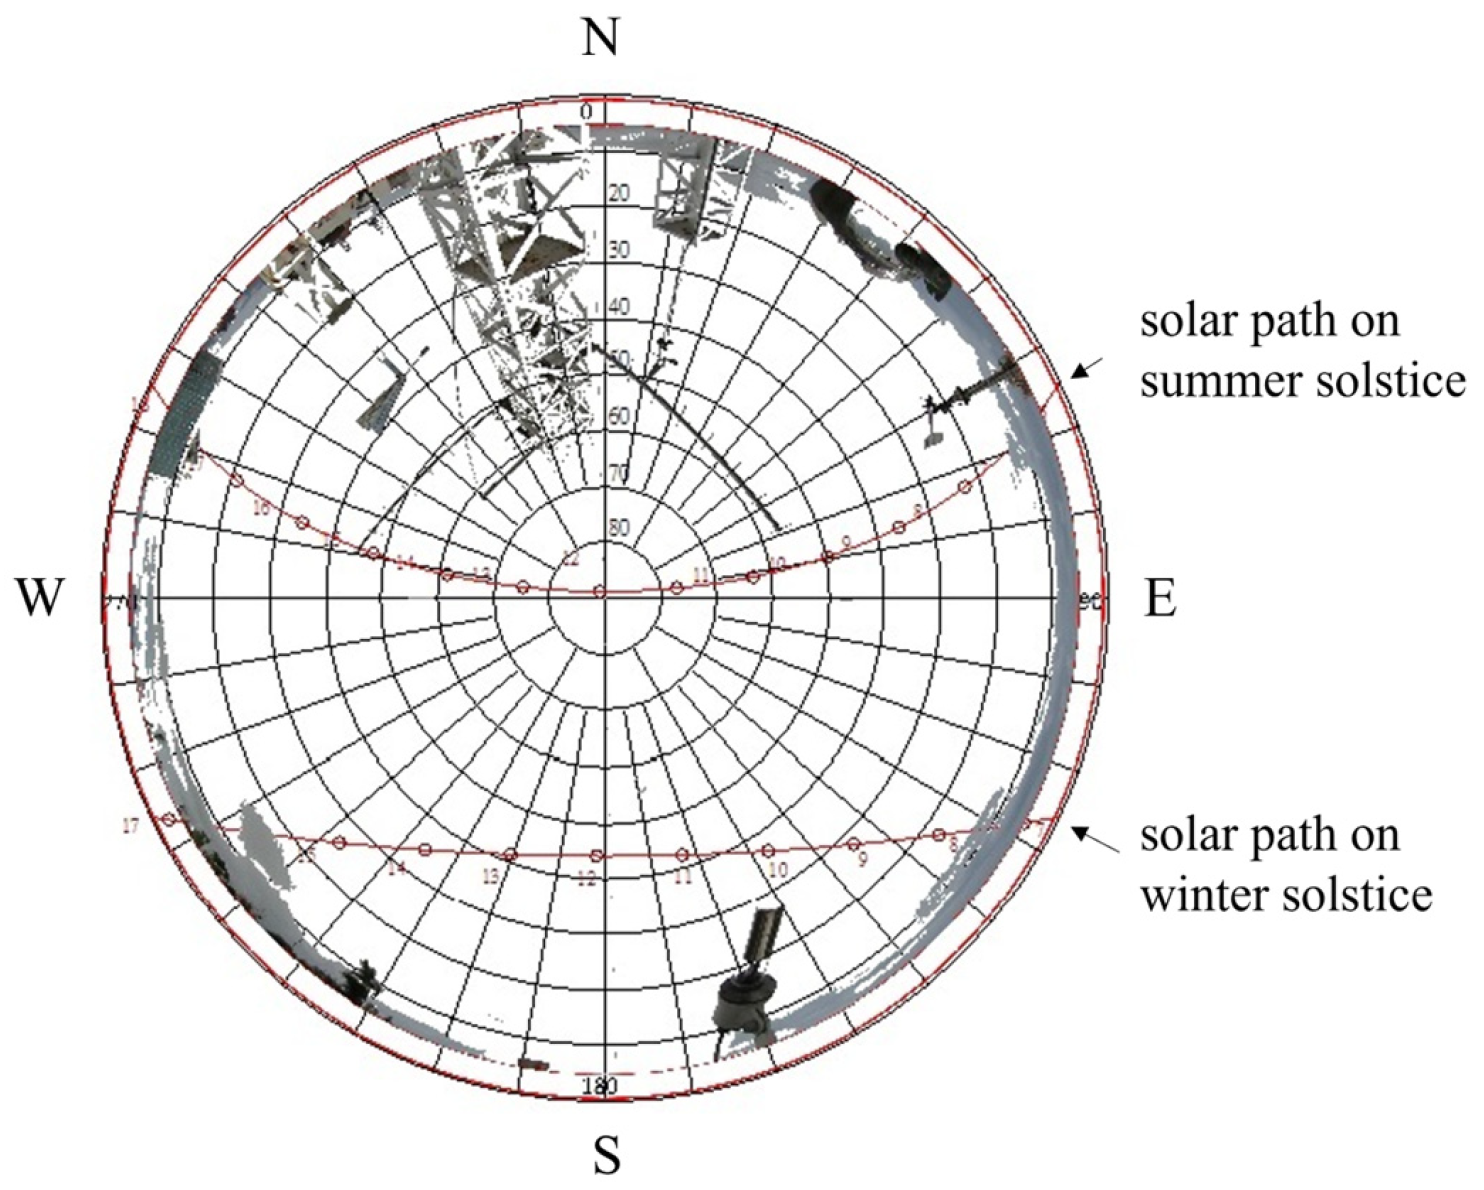
where ω is the hour angle and δ is the declination angle, which is equal to −23.45° and 23.45° during the winter and summer solstices, respectively. The sun is located at the highest and lowest positions in the sky (in other words, it exhibits the largest and smallest solar elevation angles) during the summer and winter solstices, respectively. Having determined the hourly solar altitude, i.e., the elevation angle, the solar paths at TWS on these two days can be determined using Equation (2) and are plotted in the polar grid representation of the fisheye picture (Figure 11). Figure 11 shows that almost all the obstructions are located outside the zone bound by the two solar paths during the summer and winter solstices. This indicates that the effect of blocking on beam radiation due to the presence of existing obstructions on TWS’s rooftop could be negligible. Nevertheless, the obstructions located above the solar path during the summer solstice could cause the beam radiation to reflect from the obstructions to the pyranometer for part of the year.
The sheltering effect on isotropic diffuse radiation is proportional to the shelter view factor, which is 11.8% for the TWS. Figure 10 shows that the monthly deviations between the global radiation at TCNOU and TWS range between 9.112% (in March 2016) and 0.976% (in July 2016). The ratios of beam radiation to global radiation for every month in a typical meteorological year (TMY, in 2004–2018) for TWS, with the data for both types of radiation obtained from the study of Hsieh and Chang [25], are listed in Table 2. Since global radiation is the sum of beam and diffuse radiation, the ratio of diffuse radiation to global radiation can be readily extracted from Table 2. It is evident that beam radiation contributes more to global radiation in the summertime (from May to October) in Taitung County but less at other times, particularly in November–March during the Northeast Monsoon. In addition, typhoons are typical weather phenomena in this region (usually occurring between June and October). These climatological effects influence the variations in the ratio of beam radiation to global radiation at TWS, as shown in Table 2. As diffuse radiation’s contribution to global radiation increases, the sheltering effect escalates, as shown in Figure 10.

4.2. Sheltering Effect on the Pyranometer Installed at PWS

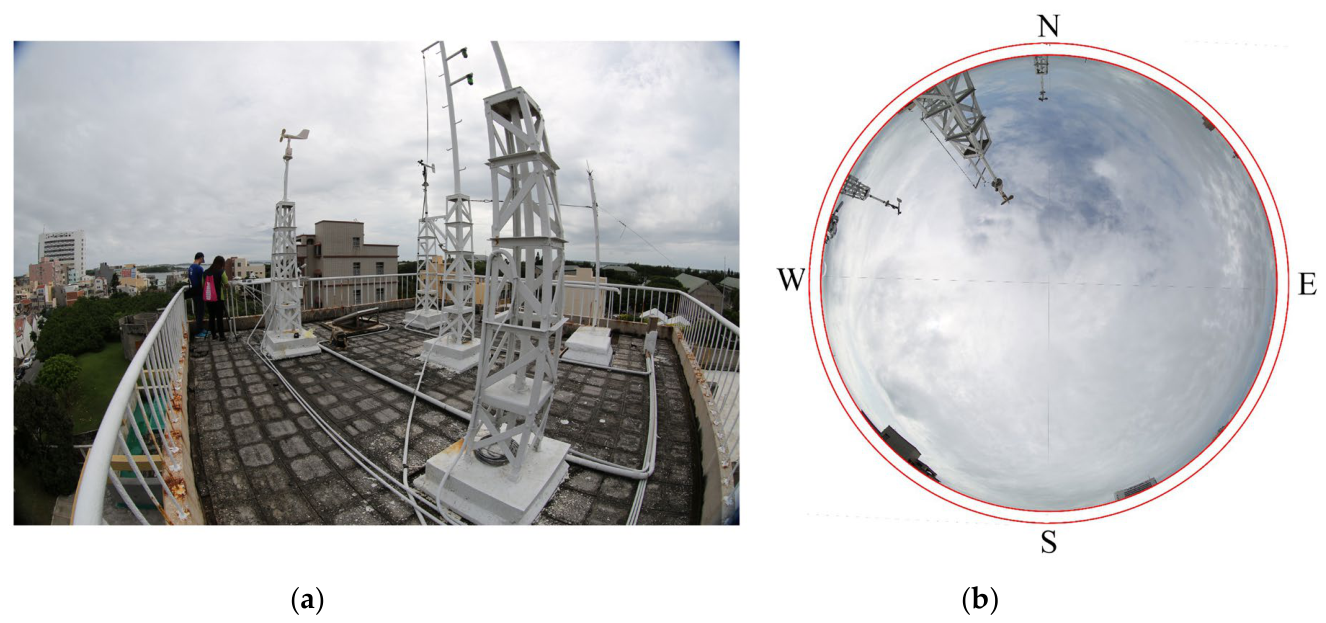
Figure 12a and Figure 12b show regular and fisheye photographs, respectively, with markers to indicate orientation, both taken at a position next to the pyranometer on the rooftop of PWS. As shown in Figure 12a, there were five short meteorological towers on the rooftop, but only three of them can be seen in the fisheye photograph (Figure 12b). The calculated shelter view factor for the pyranometer installed at PWS was 5.0%, in contrast to 0% for the one installed at PUST (see Figure 7b).
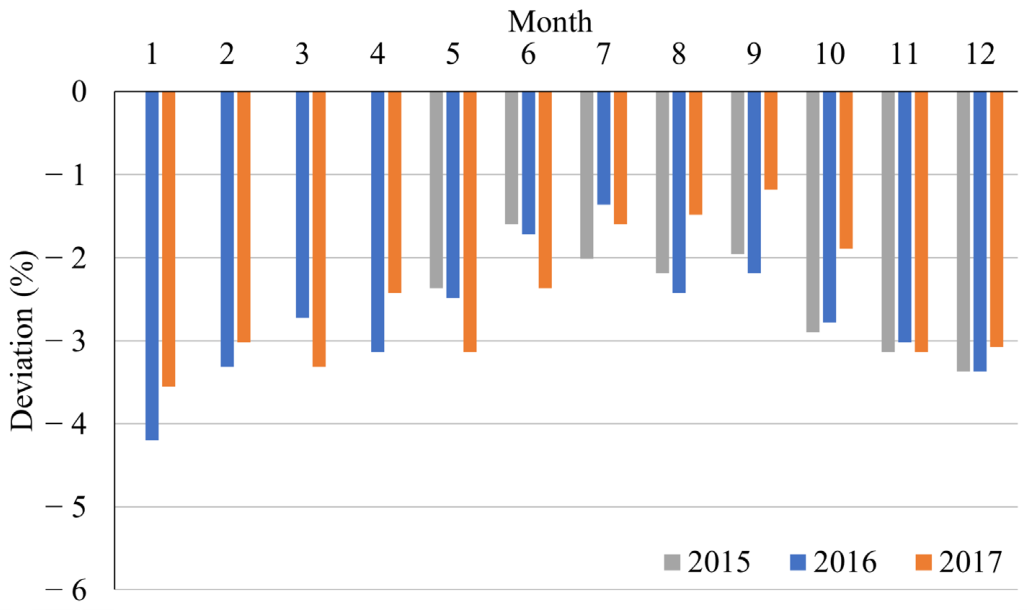
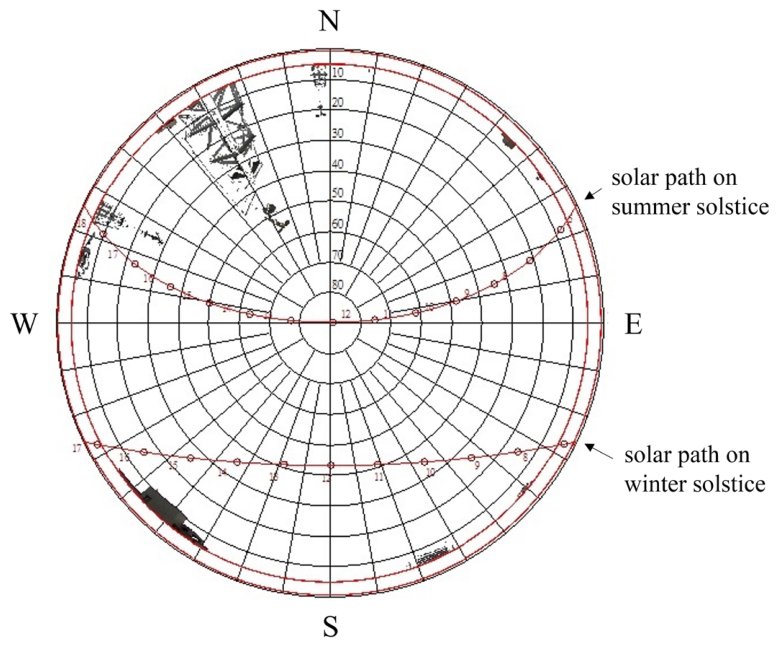
Table 3 summarizes the monthly global radiation ( G P U S T ) at PUST for each month from May 2015 to December 2017, which serves as the baseline for comparison to the PWS ( G P W S ) data retrieved from the CWB [15]. The monthly deviations in global radiation between the in situ data measured at PUST and the PWS data retrieved from the CWB for each month from May 2015 to December 2017 are also recorded in Table 3 and plotted in Figure 13. Here, the monthly deviation in global radiation is defined in Equation (4), but with G T C N O U and G T W S replaced with   G P U S T and G P W S , respectively. The annual deviations in the global radiation for 2016 and 2017 are calculated using Equation (5), but with G T C N O U , i replaced with G P W S , i , using the data listed in Table 3. They are equal to −2.51% and −2.32%, respectively. The hourly solar altitude angles during the summer and winter solstices at the latitude of PWS (i.e., 23.58° N) are calculated using Equation (6). The solar paths on these two days can be determined for PWS using Equation (3) and are plotted in the polar grid representation of the fisheye picture (Figure 14). Like at TWS (Figure 11), almost all the obstructions are located outside the zone bounded by the two solar paths on the summer and winter solstices. This indicates a negligible blocking effect of the existing obstructions on beam radiation on PWS’s rooftop. Nevertheless, the obstructions located behind the solar path during the summer solstice could reflect the beam radiation from the obstructions to the pyranometer for part of the year. Figure 13 shows that the monthly deviations in global radiation, which were measured, respectively, at PUST and PWS, range between 4.201% (in January 2016) and 1.183% (in September 2017). The variations in monthly deviations presented in Figure 13 and Table 3 are attributed to climatological effects, as shown in Table 2. Diffuse radiation contributes more to global radiation during the Northeast Monsoon season (November–March) on Penghu Island, located in the Taiwan Strait. This causes the ratio of beam radiation to global radiation to drop as low as 0.256 in January, compared to 0.448 in September (in the summertime).
Figure 3, Figure 5, Figure 6, Figure 9 and Figure 12 indicate that none of the five CWB weather stations in Taiwan meet the WMO’s pyranometer installation requirement stating that obstructions should not reduce the total solid angle by more than 0.5 sr. This usually happens due to the need to install various meteorological devices on a small weather station rooftop. Although these meteorological devices were installed on the northern side of the rooftops where possible to prevent the blockage of beam radiation coming from the southern horizon, they still blocked the incidence of diffuse radiation on the pyranometers, and the sheltering effect is proportional to the shelter view factor. In addition, as demonstrated in Figure 4, the beam radiation reflected by the obstructions and incident on the pyranometer needs to be considered to correctly estimate the total global radiation. The comparison between the TWS and PWS beam radiation-to-global radiation ratios in Table 2 shows that beam radiation contributes less to global radiation at PWS than at TWS in every month of the TMY. This is attributed to the constant moist sea air over the remote island where PWS (as well as PUST) is located [25], and it reveals that the reduction in the global radiation caused by diffuse radiation is more considerable at PWS than at TWS, which is on the Taiwanese mainland.

5. Conclusions

The effects of sheltering on the horizontal measurement of global radiation using a pyranometer was investigated by comparing data retrieved from the CWB of Taiwan for two weather stations (TWS and PWS) with the corresponding in situ data measured under zero-shelter environments located close to each CWB weather station. The shelter view factor around the installed pyranometer was determined using a fisheye-lens image together with the calculation method of Steyn and co-worker [23,24]. The shelter view factors determined for TWS and PWS were 11.8% and 5.0%, respectively. Comparison of the monthly data for global radiation at TWS and TCNOU showed that the monthly global radiation underestimations at TWS were in the range of 0.8–9.1% in 2016–2017. In contrast, comparison of the monthly data for global radiation at PWS and at PUST showed that the monthly global radiation underestimations at PWS were in the range of 1.3–4.2% from May 2015 to December 2017. This was primarily attributed to the magnitude of the shelter view factor for all obstructions around a pyranometer; however, they were also dependent on the local pattern of global radiation, which is a climatological factor. In contrast to the global radiation underestimations induced by the blockage of diffuse radiation by obstructions, possible global radiation overestimations induced by the reflection of beam radiation by obstructions, as shown in Figure 3 and Figure 4, should also be considered. The sheltering effect on global radiation measurements using a pyranometer needs to be addressed, and the solution can be divided into two parts. The first relates to the blockage of isotropic diffuse radiation by obstructions, which is proportional to the shelter view factor and results in the underestimation of global radiation, while the second relates to the reflection of beam radiation by obstructions with light-colored surfaces and results in the overestimation of global radiation. Moreover, the degree of beam radiation reflection depends on whether the surface exhibits specular or diffuse reflectivity. In particular, for a specular reflection, in addition to surface reflectivity, detailed geometric information on the orientation and distance of the obstruction in relation to the sensing element, as well as its size and shape, must be provided prior to calculating beam radiation reflection. A study investigating solutions to the sheltering effect will be conducted in the future.

Author Contributions

Conceptualization, H.-H.C. and K.-C.C.; methodology, Y.-D.C. and K.-C.C.; validation, Y.-D.C.; formal analysis, Y.-D.C. and H.-H.C.; investigation, H.-H.C.; resources, H.-H.C.; data curation, H.-H.C.; writing—original draft preparation, Y.-D.C.; writing—review and editing, K.-C.C.; supervision, K.-C.C. All authors have read and agreed to the published version of the manuscript.

Funding

This research received no external funding.

Institutional Review Board Statement

Not applicable.

Informed Consent Statement

Not applicable.

Data Availability Statement

The original hourly global radiation data measured from TCNOU and PUST are openly available at https://github.com/p47061105/TCNOU (accessed on 23 May 2026) and https://github.com/p47061105/PUST (accessed on 23 May 2026), respectively.

Acknowledgments

The photographs used in this study (Figure 3, Figure 5, Figure 6, Figure 9 and Figure 12) were taken with permission from the staff at the weather stations of Hualien, Anbu, Zhuzihu, Taitung and Penghu.

Conflicts of Interest

The authors declare no conflicts of interest.

References

  1. Bojinski, S.; Verstraete, M.; Peterson, T.C.; Richter, C.; Simmons, A.; Zemp, M. The concept of essential climate variables in support of climate research, applications, and policy. Bull. Am. Meteorol. Soc. 2014, 95, 1431–1443. [Google Scholar] [CrossRef]
  2. Despotovic, M.; Nedic, V.; Despotovic, D.; Cvetanovic, S. Review and statistical analysis of different global solar radiation sunshine models. Renew. Sustain. Energy Rev. 2015, 52, 1869–1880. [Google Scholar] [CrossRef]
  3. Ya’u, M.J.; Gele, M.A.; Ali, Y.Y.; Alhaji, A.M. Global solar radiation models: A review. J. Photonic Mater. Technol. 2018, 4, 26–31. [Google Scholar] [CrossRef]
  4. Kambezidis, H.D. Estimation of sunrise and sunset hours for locations on flat and complex terrain: Review and advancement. Renew. Energy 1997, 11, 485–494. [Google Scholar] [CrossRef]
  5. Hasenbalg, M.; Kuhn, P.; Wilbert, S.; Nouri, B.; Kazantzidis, A. Benchmarking of six cloud segmentation algorithms for ground-based all-sky imagers. Sol. Energy 2020, 201, 596–614. [Google Scholar] [CrossRef]
  6. Shaffery, P.; Habte, A.; Netto, M.; Andreas, A.; Krishnan, V. Automated construction of clear-sky dictionary from all-sky imager data. Sol. Energy 2020, 212, 73–83. [Google Scholar] [CrossRef]
  7. Heinle, A.; Macke, A.; Srivastav, A. Automatic cloud classification of whole sky images. Atmos. Meas. Tech. 2010, 3, 557–567. [Google Scholar] [CrossRef]
  8. Dev, S.; Lee, Y.H.; Winkler, S. Color-based segmentation of sky/cloud images from ground-based cameras. IEEE J. Sel. Top. Appl. Earth Obs. Remote Sens. 2017, 10, 231–242. [Google Scholar] [CrossRef]
  9. Dev, S.; Savoy, F.M.; Lee, Y.H.; Winkler, S. Estimating solar irradiance using sky imagers. Atmos. Meas. Tech. 2019, 12, 5417–5429. [Google Scholar] [CrossRef]
  10. Zuo, H.-M.; Qiu, J.; Li, F.-F. Ultra-short-term forecasting of global horizontal irradiance (GHI) integrating all-sky images and historical sequences. J. Renew. Sustain. Energy 2023, 15, 053701. [Google Scholar] [CrossRef]
  11. Tian, B.; Loonen, R.C.G.M.; Hensen, J.L.M. Combining point cloud and surface methods for modeling partial shading impacts of trees on urban solar irradiance. Energy Build. 2023, 298, 113420. [Google Scholar] [CrossRef]
  12. Gangwisch, M.; Fröhlich, D.; Christen, A.; Matzarakis, A. Geometrical assessment of sunlit and shaded area of urban trees based on aligned orthographic views. Atmosphere 2021, 12, 968. [Google Scholar] [CrossRef]
  13. Kejna, M.; Uscka-Kowalkowska, J.; Araźny, A.; Kunz, M.; Maszewski, R.; Przybylak, R. Spatial differentiation of global solar radiation in Toruń and its suburban area (central Poland) in 2012. Bull. Geogr. Phys. Geogr. Ser. 2014, 7, 27–56. [Google Scholar] [CrossRef]
  14. World Meteorological Organization. Measurement of radiation. In Guide to Instruments and Methods of Observation, 7th ed.; WMO: Geneva, Switzerland, 2024; Volume 1, pp. 280–297. Available online: https://community.wmo.int/site/knowledge-hub/programmes-and-initiatives/instruments-and-methods-of-observation-programme-imop/guide-instruments-and-methods-of-observation-wmo-no-8 (accessed on 23 May 2026).
  15. Central Weather Administration, Ministry of Transportation and Communications, Taiwan. Available online: https://www.cwa.gov.tw/eng/ (accessed on 15 April 2026).
  16. Duffie, J.A.; Beckman, W.A. Solar Engineering of Thermal Processes, 4th ed.; Wiley: Hoboken, NJ, USA, 2013; pp. 15, 41. [Google Scholar] [CrossRef]
  17. Gueymard, C.A. A reevaluation of the solar constant value based on a 42-year total solar irradiance time series and a reconciliation of spaceborne observations. Sol. Energy 2018, 168, 2–9. [Google Scholar] [CrossRef]
  18. Becker, C.F.; Boyd, J.S. Solar radiation availability on surfaces in the United States as affected by season, orientation, latitude, altitude and cloudiness. Sol. Energy 1957, 1, 13–21. [Google Scholar] [CrossRef]
  19. Hsieh, T.E.; Fraincas, B.; Chang, K.C. Generation of a typical meteorological year for global solar radiation in Taiwan. Energies 2023, 16, 2986. [Google Scholar] [CrossRef]
  20. International Organization for Standardization. Specification and Classification of Instruments for Measuring Hemispherical Solar and Direct Solar Radiation (ISO Standard No. 9060). Available online: https://www.iso.org/obp/ui/en/#iso:std:iso:9060:ed-2:v1:en (accessed on 15 April 2026).
  21. Lin, C.T.; Chang, K.C. Validation of global radiation measured by domestic weather stations—Cases of Penghu and Taitung weather stations. Meteor. Bull. 2021, 56, 25–39. (In Chinese) [Google Scholar]
  22. Howell, J.R. A Catalogue of Radiation Configuration Factors; McGraw-Hill: New York, NY, USA, 1982. [Google Scholar]
  23. Steyn, D.G.; Hay, J.E. The determination of sky-factors in urban environments using video imagery. J. Atmos. Ocean. Technol. 1986, 3, 759–764. [Google Scholar] [CrossRef]
  24. Steyn, D.G. The calculation of view factors from fisheye-lens photographs. Atmos.-Ocean 1980, 18, 254–258. [Google Scholar] [CrossRef]
  25. Hsieh, T.E.; Chang, K.C. Mapping solar global radiation and beam radiation in Taiwan. Energies 2024, 17, 5874. [Google Scholar] [CrossRef]
Figure 1. Schematic of the distribution of the various components of global solar radiation received by a horizontally placed sensor from a sky dome.
Atmosphere 17 00556 g001
Figure 2. Map of Taiwan.
Atmosphere 17 00556 g002
Figure 3. Views from the (a) south and (b) north of the pyranometer. (c) Fisheye photograph centered next to the pyranometer on the rooftop of Hualien weather station.
Atmosphere 17 00556 g003
Figure 4. Comparison of the measured global radiation and extraterrestrial solar radiation at Hualien weather station on (a) 12 March 2018 and (b) 27 March 2020.
Atmosphere 17 00556 g004
Figure 5. (a) Regular and (b) fisheye photographs centered next to the pyranometer in the yard of the Anbu weather station.
Atmosphere 17 00556 g005
Figure 6. (a) Regular and (b) fisheye photographs centered next to the pyranometer on the rooftop of the Zhuzihu weather station.
Atmosphere 17 00556 g006
Figure 7. Fisheye photographs centered next to each pyranometer under zero-shelter environments on the rooftops of (a) TCNOU and (b) PUST stations.
Atmosphere 17 00556 g007
Figure 8. Conical projection ( C j ) of an obstruction with area A j on the fisheye plane.
Atmosphere 17 00556 g008
Figure 9. (a) Regular and (b) fisheye photographs centered next to the pyranometer on the rooftop of Taitung weather station.
Atmosphere 17 00556 g009
Figure 10. Comparison of the deviations between the TCNOU and TWS global radiation data for each month in 2016–2017.
Atmosphere 17 00556 g010
Figure 11. Polar grid plot of the fisheye picture taken at TWS with the solar paths shown for the summer and winter solstices.
Atmosphere 17 00556 g011
Figure 12. (a) Regular and (b) fisheye photographs centered next to the pyranometer on the rooftop of Penghu weather station.
Atmosphere 17 00556 g012
Figure 13. Comparison of the deviations between PUST and PWS global radiation data for each month from May 2015 to December 2017.
Atmosphere 17 00556 g013
Figure 14. Polar grid plot of the fisheye picture taken at PWS with the solar paths shown for the summer and winter solstices.
Atmosphere 17 00556 g014
Table 1. Monthly global radiation measured at G T C N O U and the deviation between G T C N O U and G T W S for each month in 2016–2017.
Year Jan.Feb.Mar.Apr.MayJuneJulyAug.Sep.Oct.Nov.Dec.
2016 G T C N O U   M J m 2 240.99294.97294.23378.95464.08634.19582.49570.92296.45379.35292.63320.07
G ( % ) −8.846−8.107−9.112−8.550−4.852−3.876−0.976−5.503−5.976−5.562−7.870−6.923
2017 G T C N O U   M J m 2 315.44271.38305.49441.04503.86621.05669.26684.99619.41433.64335.74300.60
G ( % ) −7.426−8.343−8.757−7.041−7.041−4.527−3.166−3.432−3.994−5.207−8.047−8.225
Table 2. Ratio of beam radiation to global radiation (TMY, 2004–2018) in each month for TWS and PWS.
StationJan.Feb.Mar.Apr.MayJuneJulyAug.Sep.Oct.Nov.Dec.
TWS0.4130.3880.3680.4990.5050.4700.5430.5480.5630.5280.4360.418
PWS0.2560.3350.2290.2650.3120.3250.4000.3920.4480.3140.3200.237
Table 3. Monthly global radiation measured at G P U S T and the deviation between G P U S T and G P W S for each month from May 2015 to December 2017.
Year Jan.Feb.Mar.Apr.MayJuneJulyAug.Sep.Oct.Nov.Dec.
2015 G P U S T   M J m 2 565.63742.87644.31482.40555.39465.23383.84271.87
G ( % ) −2.367−1.598−2.012−2.189−1.953−2.899−3.136−3.373
2016 G P U S T   M J m 2 212.83292.10369.47493.15627.08670.50684.94615.31336.64406.61342.67287.89
G ( % ) −4.201−3.314−2.722−3.136−2.485−1.716−1.361−2.426−2.189−2.781−3.018−3.373
2017 G P U S T   M J m 2 303.05317.59411.23558.25595.94597.17691.62709.39629.08435.12248.54274.52
G ( % ) −3.550−3.018−3.314−2.426−3.136−2.367−1.598−1.479−1.183−1.893−3.136−3.077
Disclaimer/Publisher’s Note: The statements, opinions and data contained in all publications are solely those of the individual author(s) and contributor(s) and not of MDPI and/or the editor(s). MDPI and/or the editor(s) disclaim responsibility for any injury to people or property resulting from any ideas, methods, instructions or products referred to in the content.