


Abstract
Understanding the mechanisms by which sand and dust particles detach from the land surface has always been one of the most fundamental and critical issues in aeolian physics and dust-storm forecasting. In this study, large-eddy simulation (LES) was employed to resolve the near-wall turbulence structures. Turbulent bursting events were identified using the second-quadrant method, and a force-balance equation for dust-particle entrainment was formulated at burst locations to numerically simulate the entrainment process of particles of different sizes under bursting conditions. By integrating the latest observational data on near-wall turbulent coherent structures during dust storms both the accuracy of flow-field simulations and the physical consistency of particle force analyses were enhanced. The results suggest that, within the present idealized force-balance framework, near-wall turbulent bursting can provide aerodynamic forcing that contributes to the entrainment of sand and dust particles over the simulated parameter range. Under the same friction velocity, the mean number of lifted particles first increases and then decreases with particle size, exhibiting a parabolic trend. For particles of the same size, the number of lifted particles increases significantly with friction velocity. Under identical incoming wind speeds, the number flux of lifted particles decreases nonlinearly with increasing particle size, whereas the mass flux continues to rise with both friction velocity and particle size. These findings further confirm the critical contribution of aerodynamic entrainment to aeolian transport and provide numerical support for refining the dual-mechanism theory of sand entrainment.
1. Introduction
Wind-driven detachment and transport of sand and dust particles contribute to land degradation, desertification, and atmospheric particulate pollution, with consequences for infrastructure, regional climate, and human health. In aeolian physics, one of the key unresolved questions is how particles are initially released from the surface. The energy required for lift-off is supplied by the near-wall airflow, but whether a particle leaves the bed depends on local turbulent motion, particle size, and surface resistance.
Bagnold [1] described aeolian entrainment in terms of two mechanisms, namely aerodynamic (fluid) entrainment and impact entrainment. In that framework, bombardment by saltating grains is regarded as the main source of new particle release, whereas direct lifting by the airflow plays only a secondary role. This view has strongly influenced later descriptions of aeolian transport and underlies many near-surface parameterizations and numerical models. However, recent experimental and theoretical investigations have questioned whether impact entrainment consistently dominates. Using particle image velocimetry in a wind tunnel, Yang et al. [2] showed that impact velocities within saltation clouds can be lower than commonly assumed. They also found that frequent mid-air collisions near the bed dissipate momentum and may reduce the ability of saltating grains to eject new particles from the surface. Subsequent studies have argued that aerodynamic entrainment and impact entrainment should be treated as distinct components of the entrainment process in aeolian transport [3]. Taken together, these studies suggest that aerodynamic entrainment may play a more important role than previously assumed, especially under highly intermittent near-wall turbulence. One possible source of such intermittency is turbulent bursting in the near-wall region. Ejection events are closely associated with near-wall momentum exchange and sediment transport [4]. During a burst, strong instantaneous fluctuations in horizontal and vertical velocity can temporarily increase the upward force acting on surface particles. Field observations from the Qingtu Lake observation array during dust storms showed a clear coherence between near-surface PM10 concentration and wall-attached eddies, and the wall-normal organization of these eddies was closely related to particle entrainment and transport [5]. Wind-tunnel studies have also shown that turbulence affects the initiation of particle motion [6,7]. These results point to a direct connection between turbulent bursting and aerodynamic entrainment. Even so, the influence of burst-scale flow structures on size-dependent particle lift-off has not been quantified sufficiently under purely aerodynamic conditions. Most previous studies have focused either on bulk transport or on situations in which aerodynamic and impact mechanisms act together, making it difficult to isolate the role of turbulent bursting itself in particle detachment.
In this study, large-eddy simulation (LES) is used to resolve the near-wall flow field, and burst events are identified with the second-quadrant criterion. A force-balance model is then evaluated at burst locations without including impact-induced forcing, so that the capacity of turbulent bursting alone to detach particles of different sizes can be examined. The analysis focuses on how friction velocity and particle diameter affect the mean number of lifted particles and the corresponding number-based and mass-based uplift fluxes. In this way, the study provides a numerical assessment of the contribution of turbulent bursting to aerodynamic entrainment and helps clarify the flow-driven component of aeolian entrainment.
2. Materials and Methods
2.1. Governing Equations for Flow-Field Calculation
The near-wall flow field was resolved by large-eddy simulation (LES) using the Advanced Regional Prediction System (ARPS, version 4.5.2) [8]. No data-driven SGS closure was implemented in this study; the unresolved stress was represented using the conventional Smagorinsky closure in ARPS—a non-hydrostatic three-dimensional prediction model. In the present LES framework, the governing equations are written as:
where is the velocity component, is the pressure, is the air density, is the kinematic viscosity, and is the subgrid scale (SGS) stress tensor. The anisotropic part of the SGS stress is modeled as:
where
Here, is the subgrid scale turbulent viscosity, is the filter width, and is the Smagorinsky coefficient. The standard Smagorinsky SGS model was adopted in this study. The Smagorinsky coefficient was set to . The filter width was defined as , where Δz denotes the local vertical grid spacing of the non-uniform vertical mesh. No dynamic SGS model was used in this study, nor was any additional wall-damping function introduced. The near-wall region was treated through the no-slip boundary condition, vertical grid refinement, and the SGS model.
Based on the resolved near-wall flow field, turbulent bursting was identified using the second-quadrant criterion. In this study, bursting refers to ejection type events in the near-wall region, and a burst is recorded when
where and are the streamwise and vertical fluctuating velocities, respectively, and and are their root-mean-square values:
where is the number of samples used in the calculation. When a sample satisfies Equation (6), turbulent bursting is considered to occur at that location and time.
2.2. Particle Entrainment Mechanism Under Turbulent Bursting
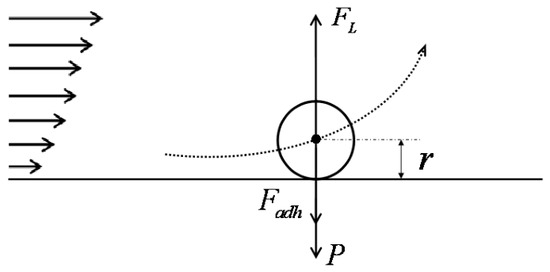
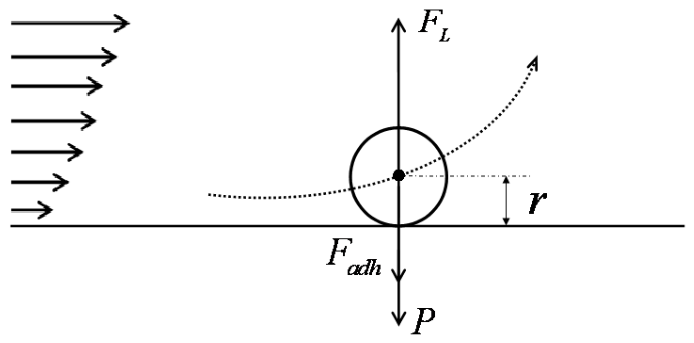
Particle entrainment under turbulent bursting is evaluated using a force-balance model. Particles are assumed to be uniformly distributed over the bed surface, and interparticle interaction is represented by an effective adhesive/viscous force. This treatment represents an idealized bed condition designed to isolate the aerodynamic contribution of turbulent bursting. It does not explicitly resolve surface heterogeneity, moisture-induced capillary forces, particle-shape effects, or natural particle-size distributions. Figure 1 schematically shows the forces acting on a particle.
Figure 1.
Schematic of the forces acting on a particle.
At the threshold of lift-off, the forces acting on a particle include aerodynamic drag and lift, submerged particle weight, and interparticle adhesive/viscous resistance. Because the present entrainment criterion is formulated as a wall-normal force balance, the threshold condition is expressed as:
When Equation (9) is satisfied, the particle is assumed to overcome the resisting forces and become entrained into the airflow. The aerodynamic lift is calculated using the expression proposed by Mollinger et al. [9]. To better represent the local velocity environment associated with turbulent bursting [5], the instantaneous velocity at the particle location is used in the lift calculation:
where denotes the particle position at time , and and are the instantaneous streamwise and vertical wind velocities at that location.
The submerged particle weight is given by:
Following Phillips [10], the resisting effect of interparticle adhesion/viscous interaction is written as
where is an empirical coefficient representing the effective adhesive/viscous resistance between neighboring particles. Consistent with the dual-mechanism framework of aeolian entrainment [3], no impact-induced force is introduced in the present model; only the fluid-dynamic effect of turbulent bursting is considered. Equation (9) therefore defines the critical entrainment condition for particles under burst-induced aerodynamic lifting.
2.3. Initial Conditions for the Calculations
The computational domain was discretized using a 144 × 31 × 32 structured grid. The grid spacing in the x- and y-directions was 0.1 m. A stretched grid was used in the vertical direction, with Δzmin = 2.5 × 10⁻⁴ m near the lower wall and Δzmax = 0.1 m away from the wall. For the inflow wind speeds of 8–12 m/s, the corresponding friction velocities were 0.38–0.56 m/s, giving a first grid point z+ of approximately 6.3–9.3. The LES therefore resolves the larger near-wall ejection motions relevant to particle entrainment, while sub-filter-scale motions are parameterized by the SGS model. In the z direction, the mesh was refined near the wall to resolve the near-wall flow structures; the first grid point was placed sufficiently close to the wall to satisfy the near-wall resolution requirement.
The time step for the flow-field calculation was s, and the total simulation time was 2 s. The inlet boundary was prescribed using a logarithmic wind-speed profile as the incoming flow condition. The lower boundary was treated as a no-slip wall. The upper boundary was specified as an open/zero-gradient boundary condition, while an outflow boundary condition was applied at the outlet. The flow field was first advanced until a statistically stationary state was reached. A subsequent 2 s period of velocity-field data was then extracted and used for the identification of turbulent bursting events and the analysis of particle entrainment.
The time step used for burst detection should be consistent with the characteristic bursting period. Luchik and Tiederman [11], using conditional sampling, showed that the mean bursting period in inner scaling can be expressed as
where is the dimensionless mean bursting period, is the friction velocity, is the actual bursting period, and is the kinematic viscosity of the fluid. For the wind-speed range considered here, a time step of 0.005 s was used for burst detection. This value is of the same order as the characteristic bursting period estimated from Equation (13) and is much larger than the flow-field computation time step; therefore, the temporal resolution is adequate for burst identification.
To compare cases with different friction velocities and particle diameters, two dimensionless parameters are introduced:
where is the kinematic viscosity of air, is the particle density, and is the air density. These parameters are used to analyze the effects of friction velocity and particle diameter on particle entrainment under turbulent bursting.
The dimensional particle diameter considered in this study ranges from dp = 1 μm to 295 μm. Thus, the simulated particles cover a size range from dust/silt to fine sand. The smaller particles mainly represent dust or silt-sized particles that are either suspendable or strongly affected by turbulent motions, whereas the larger particles correspond to fine sand. To avoid ambiguity, the corresponding dimensional particle-size range has been added when the dimensionless particle diameter is reported.
3. Results
3.1. Spatiotemporal Characteristics of Turbulent Bursting
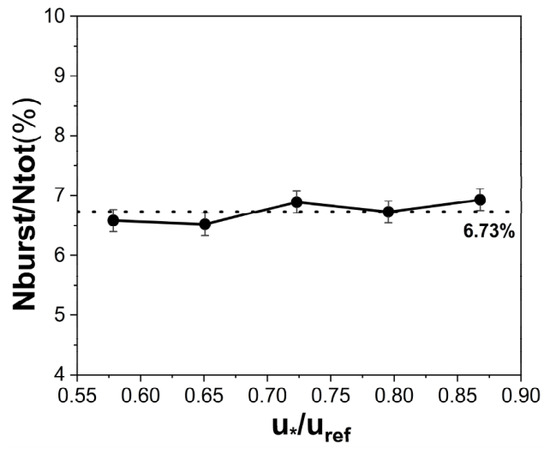
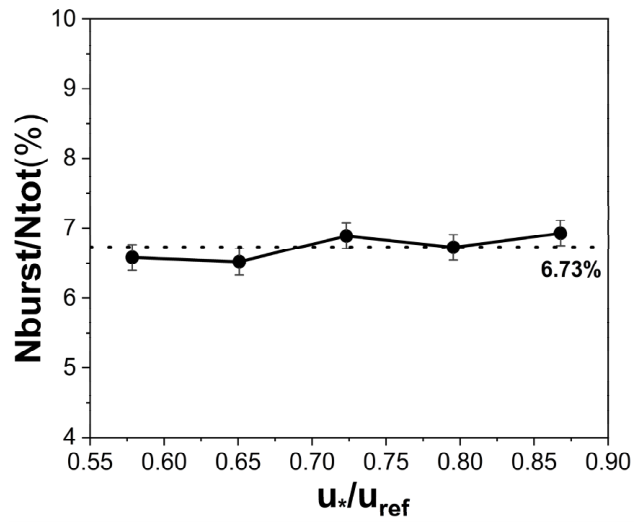
Figure 2 shows the variation in the turbulent-burst occurrence ratio, , with dimensionless friction velocity , where is the number of bursting events detected during a unit time interval and is the total number of sampled grid points in the same interval. The burst occurrence ratio showed only weak variation with friction velocity. The error bars in Figure 2 indicate the variability among independent sampling intervals, and the differences among cases were within the estimated uncertainty range. This suggests that the occurrence frequency of ejection-type bursting was not strongly controlled by friction velocity over the simulated range. This behavior is consistent with the classical view of bursting as a recurrent near-wall turbulent process and agrees with the high frequency observed characteristics of near-wall turbulent bursting during dust storms [5]. The agreement supports the physical plausibility of the simulated near-wall flow field.
Figure 2.
Variation in the turbulent-burst occurrence ratio with dimensionless friction velocity. Error bars represent the 95% confidence intervals estimated by bootstrap resampling.
The spatial distribution of bursting was further analyzed on a fixed horizontal plane. By calculating the ratio of burst-affected grid area to the total area of that plane, the mean bursting-area ratio was found to be 6.73%, denoted hereafter by . This result indicates that turbulent bursting is a strongly localized event in the near-wall region. Its spatial intermittency provides a plausible explanation for the non-uniform entrainment of sand and dust particles and is consistent with the localized coherent characteristics of wall-attached eddies reported in field observations [5]. The burst occurrence ratio varied weakly with friction velocity, and the differences among cases were not statistically significant within the sampling uncertainty.
3.2. Dependence of the Mean Number of Lifted Particles on Particle Diameter
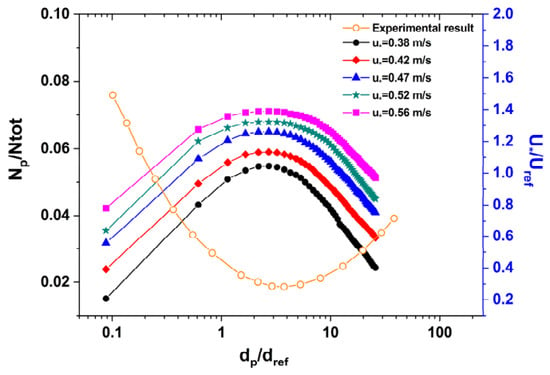
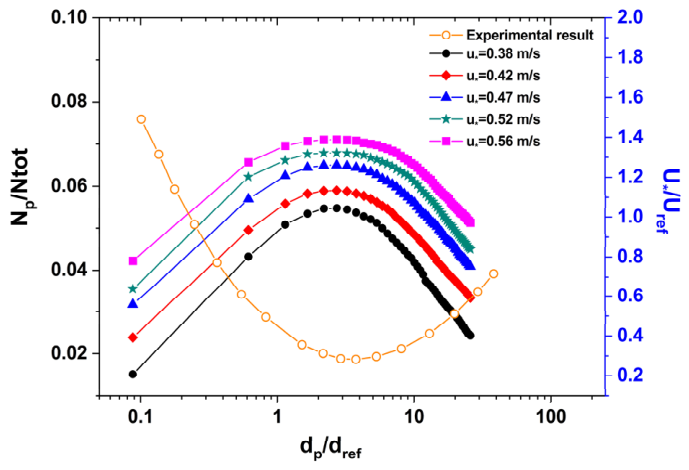
Figure 3 shows, for the same number of sampling nodes, the variation in the mean number of lifted particles with particle diameter under different friction velocities within the turbulent-burst detection period, together with a comparison with the experimental results of Foucaut and Stanislas [12]. For a given particle diameter, the mean number of lifted particles increases markedly with friction velocity. A higher friction velocity enhances near-wall turbulent kinetic energy and strengthens the aerodynamic effect of turbulent bursting, making it easier for particles to overcome gravitational and adhesive/viscous resistance.
Figure 3.
Variation in the normalized mean number of lifted particles with dimensionless particle diameter under different friction velocities, compared with the nondimensionalized experimental trend of Foucaut and Stanislas [12].
Both simulated and experimental data were normalized by their respective maximum values. For a given friction velocity, the mean number of lifted particles first increases and then decreases with particle diameter, showing a clear unimodal dependence that is consistent with the inverted parabolic trend reported by Foucaut and Stanislas [12]. This behavior implies the existence of an intermediate particle size that is most readily entrained. For finer particles, adhesive/viscous resistance remains dominant, whereas for coarser particles, the rapidly increasing particle weight requires stronger burst-induced lifting. Between these two limits, the combined resistance to lift-off is minimized, and the entrainment efficiency of turbulent bursting reaches a maximum. For comparison with Foucaut and Stanislas [12], the experimental particle diameters were converted into the same dimensionless form as used in the present study, . Because the absolute number of lifted particles depends on the sampling area and experimental counting method, both the simulated and experimental values were normalized by their respective maximum values before comparison. The comparison therefore focuses on the variation trend and peak response of particle entrainment with dimensionless particle diameter rather than the absolute magnitude of uplift events.
3.3. Variation in the Uplift Flux of Sand and Dust Particles
Aeolian entrainment involves both aerodynamic entrainment and impact entrainment. In the present study, however, the uplift flux refers only to the number or mass of particles entrained from the bed per unit area and per unit time by turbulent bursting. Using the mean bursting-area ratio obtained above, the total number of particles per unit bed area can be written as [13]:
where is the limiting volumetric concentration. It is assumed that turbulent bursting occurs at the positions of all dust particles distributed within the mean bursting area. From the results in Figure 3, the relationship between the number of entrained particles and the mean number of bursting events for different particle diameters can be written as:
where is the mean number of dust particles lifted within one bursting period , and is the number of turbulent-bursting events. The corresponding particle number flux is then
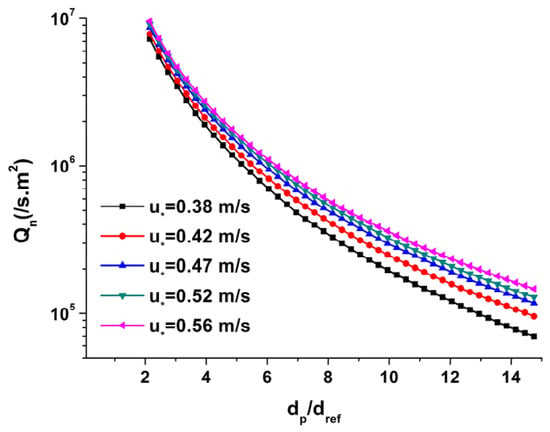
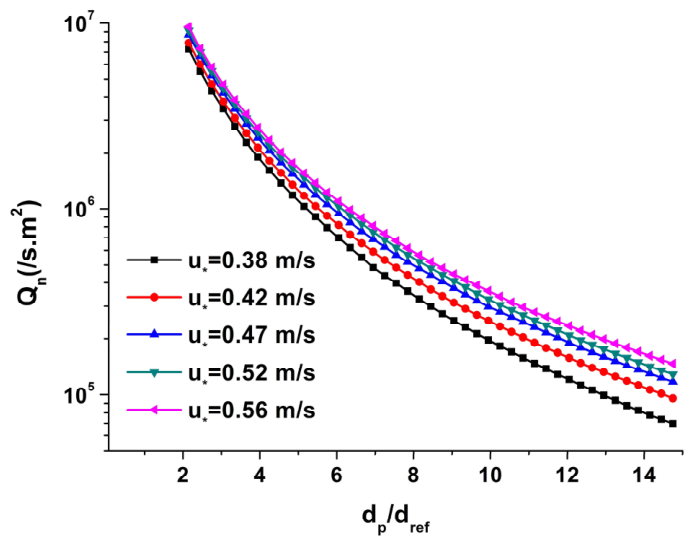
Figure 4 shows the variation in particle number flux with dimensionless particle diameter under different friction velocities. For a given friction velocity, the number flux decreases nonlinearly as particle diameter increases. This trend differs from the behavior in Figure 3 because the number of particles available per unit area decreases with particle diameter according to Equation (17). Thus, although particles of intermediate size are most readily lifted by an individual burst, the overall number flux decreases as particle size increases. For a given particle size, the number flux increases with friction velocity, consistent with the stronger lifting capacity of more energetic burst events.
Figure 4.
Variation in particle number flux with particle diameter under different friction velocities.
It should be noted that part of the particle-size dependence of the uplift flux arises directly from the geometric scaling embedded in the flux formulation. Specifically, the decrease in number-based uplift flux with increasing particle diameter is partly controlled by the reduction in the available particle number per unit bed area, which scales as under the present monodisperse bed assumption. Similarly, the particle-size dependence of the mass-based uplift flux is affected by the combined scaling of the available particle number and the individual particle mass, with and . Therefore, these flux trends should not be interpreted solely as independent numerical discoveries from LES. The LES-resolved burst dynamics mainly determine the burst occurrence, the spatial intermittency of entrainment, the burst-affected area, and the size-dependent lift-off response shown in Figure 3.
The increase in mass-based uplift flux with particle diameter should be interpreted only within the simulated particle-size range of μm. In the present force-balance model, gravitational resistance is included through the particle weight term, which increases with dp3. Therefore, for particles larger than the simulated range, gravitational resistance and threshold effects may become increasingly important and may eventually reduce the entrainment probability and the corresponding mass-based uplift flux. Since particles larger than μm were not considered in the present simulations, no extrapolation is made for coarser particles.
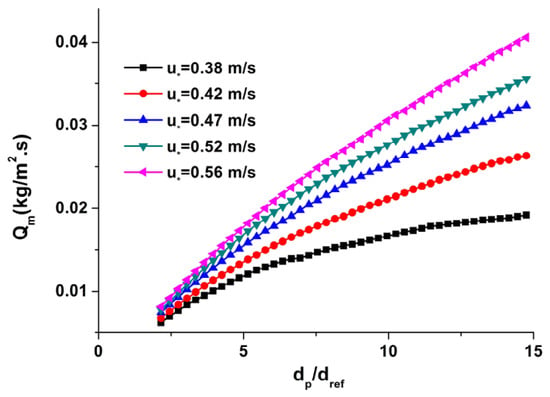
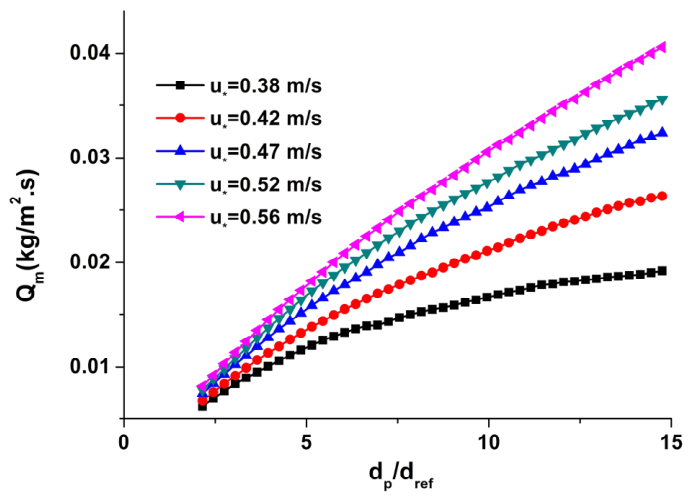
Figure 5 shows the corresponding variation in particle mass flux under different friction velocities. For a given particle diameter, the mass flux increases with friction velocity. Under the same friction velocity, the mass flux also increases with particle diameter over the range considered. This behavior contrasts with the number-flux trend because the mass of an individual particle scales with the cube of particle diameter. As a result, even though coarse particles are entrained in smaller numbers, their larger individual mass causes them to contribute substantially to the total transported mass once they are lifted.
Figure 5.
Variation in particle mass flux with particle diameter under different friction velocities.
3.4. Comparison with Previous Studies
A useful point of comparison is the field-based machine-learning analysis of Li et al. [14], which provides independent evidence that burst-related coherent structures are important for the initiation of aeolian transport. In the present LES, ejection-type bursts generated sufficient instantaneous aerodynamic forcing to lift particles from the surface. By contrast, the SHAP analysis in Li et al. [14] identified sweep events as the quadrant feature most closely associated with saltation onset in field observations. This difference is not necessarily contradictory. Rather, it suggests that different phases of the bursting cycle may become more prominent depending on whether the process is examined at the instantaneous scale or through field-scale diagnostics. Our simulations resolved triggering at the millisecond scale, whereas Li et al. [14] found that streamwise velocity averaged over a 30 s moving window was the most effective predictor at the field scale. Taken together, the two studies suggest that short-lived burst events provide the immediate physical trigger for entrainment, while near-surface streamwise velocity and sweep activity provide measurable signatures of this process under field conditions. The consistent positive role of friction velocity and the nonlinear influence of turbulence intensity in both studies further support this interpretation.
A second useful comparison is the indoor resuspension model of You and Wan [15], which places the present results in a broader particle-detachment framework. Both studies identified turbulent bursting as an important mechanism of particle release, but the controlling factors differed substantially between the two settings. The present LES focused on aerodynamic entrainment of sand particles in the atmospheric boundary layer and emphasized the combined effects of friction velocity and particle size. By contrast, You and Wan [15] incorporated adhesion-force distributions and relative humidity and reported that the threshold free-stream velocity for resuspension increased by about a factor of two to three as relative humidity rose from 36% to 67%. This result points to a strong contribution from humidity-enhanced capillary adhesion and suggests that even small changes in surface moisture may modify the threshold for aeolian entrainment in arid and semi-arid environments. Their reported decrease in threshold with increasing particle size is consistent with the increase in lifting efficiency from fine to intermediate particles found here, although our LES further indicated that entrainment efficiency declined again for larger particles once gravitational resistance became dominant. This comparison suggests that future parameterizations of aeolian entrainment should account more explicitly for variability in surface adhesion and moisture, especially when predicting fine-particle emissions.
The conclusion that burst-induced aerodynamic forcing can contribute to particle entrainment should be interpreted within the assumptions of the present model. The entrainment prediction depends on the selected lift-force parameterization, the idealized representation of the bed surface, the empirical adhesive/viscous resistance, and the threshold used to identify bursting events. Therefore, the present results should be regarded as model-based estimates under idealized aerodynamic conditions rather than direct evidence that turbulent bursting alone dominates natural aeolian entrainment.
3.5. Model Assumptions and Limitations
The present entrainment model relies on several simplifying assumptions. First, particles were assumed to be uniformly distributed over an idealized bed surface, whereas natural aeolian surfaces commonly exhibit spatial heterogeneity in roughness, packing structure, crusting, and microtopography. Second, interparticle resistance was represented by an effective adhesive/viscous force. This simplified treatment does not explicitly account for moisture-induced capillary forces, electrostatic effects, particle angularity, mineralogical variability, or contact-area distributions. Third, the simulations considered representative particle diameters rather than a full natural particle-size distribution. These assumptions allow the aerodynamic effect of turbulent bursting to be isolated, but they also limit the direct extrapolation of the simulated uplift fluxes to complex field conditions. Therefore, the present results should be interpreted as model-based estimates under idealized bed conditions. Future work should incorporate surface moisture, heterogeneous roughness, adhesion-force distributions, and measured particle-size distributions to improve the applicability of the model to natural dust-emission and aeolian-transport environments.
4. Conclusions
This study used large-eddy simulation (LES) to resolve the near-wall flow field, identified turbulent bursting using the second-quadrant criterion, and evaluated dust-particle entrainment at burst locations with a force-balance model. Within the ranges of friction velocity and particle diameter considered here, the main conclusions are as follows:
(1) The LES results reproduced the main spatiotemporal features of near-wall turbulent bursting. The burst occurrence ratio showed only weak variation with friction velocity. Bursting was spatially intermittent and localized near the wall, with a mean burst-affected area ratio of 6.73%.
(2) Under the present idealized modeling framework, burst-induced aerodynamic forcing was estimated to reach the level required for particle entrainment over part of the simulated particle-size range, indicating that burst-induced aerodynamic entrainment can make a direct contribution to the initiation of aeolian particle motion within the parameter range considered in this study.
(3) For a given friction velocity, the mean number of lifted particles first increased and then decreased with particle diameter, indicating the existence of an intermediate particle size for which entrainment was most efficient. For a given particle diameter, the mean number of lifted particles increased with friction velocity.
(4) Over the simulated particle-size range, the number-based uplift flux decreased with particle diameter, whereas the mass-based uplift flux increased with particle diameter. These trends reflect both the LES-derived size-dependent entrainment response and the algebraic scaling embedded in the flux formulation, including the dependence of available particle number and the dependence of individual particle mass. Over the simulated particle-size range of μm, the number-based uplift flux decreased with particle diameter, whereas the mass-based uplift flux increased with particle diameter. This trend should not be extrapolated to larger particles, for which gravitational resistance and threshold effects may eventually reduce the entrainment probability and the mass-based uplift flux.
Overall, the results provide a numerical assessment of how near-wall turbulent bursting influences the aerodynamic entrainment of sand and dust particles under purely aerodynamic conditions. The findings suggest that burst-induced aerodynamic entrainment should be considered explicitly in aeolian particle-initiation models, while recognizing that the present estimates are based on idealized bed conditions and a simplified treatment of adhesion. Future work should incorporate additional surface controls, including roughness effects and particle-size distributions, and should compare the simulations more directly with field or wind-tunnel observations.
Author Contributions
Conceptualization, Z.J. and Z.W.; methodology, W.W.; software, D.W.; validation, D.T.; formal analysis, Z.J.; investigation, Z.J.; writing—original draft preparation, J.Z.; writing—review and editing, J.Z.; visualization, J.Z.; supervision, Z.W.; funding acquisition, Z.W. All authors have read and agreed to the published version of the manuscript.
Funding
This research was funded by the China Three Gorges Corporation Research Project (grant number 202403191) and the National Natural Science Foundation of China (grant number 42376232).
Institutional Review Board Statement
Not applicable.
Informed Consent Statement
Not applicable.
Data Availability Statement
The original contributions presented in this study are included in the article. Further inquiries can be directed to the corresponding author.
Acknowledgments
The authors would like to thank the Supercomputing Center of Lanzhou University for providing computational support for the numerical simulations in this study.
Conflicts of Interest
Zewen Ju, Zhiyuan Wang, Wei Wang and Dan Wang were employed by China Three Gorges Corporation. Zewen Ju and Dan Wang were employed by Shanghai Investigation, Design & Research Institute Co., Ltd. The authors state that they have no known financial conflicts of interest or personal relationships that may have affected the work presented in this paper.
References
- Bagnold, R.A. The Physics of Blown Sand and Desert Dunes; Methuen: London, UK, 1941. [Google Scholar]
- Yang, P.; Dong, Z.; Qian, G.; Luo, W.; Wang, H. Height profile of the mean velocity of an aeolian saltating cloud: Wind tunnel measurements by Particle Image Velocimetry. Geomorphology 2007, 89, 320–334. [Google Scholar] [CrossRef] [Scilit]
- Sun, X.; Zhang, X. Cracking the root of the two theory systems on eolian sand movement mechanism from an innovative perspective. Acta Geogr. Sin. 2015, 70, 73–84. [Google Scholar]
- Gyr, A.; Schmid, A. Turbulent flows over smooth erodible sand beds in flumes. J. Hydraul. Res. 1997, 35, 525–544. [Google Scholar] [CrossRef] [Scilit]
- Li, X.; Hu, L.; Hu, X.; Liu, W. Scaling of vertical coherence and logarithmic energy profile for wall-attached eddies during sand and dust storms. J. Fluid Mech. 2024, 996, A7. [Google Scholar] [CrossRef] [Scilit]
- Li, G.; Zhang, J.; Herrmann, H.J.; Shao, Y.; Huang, N. Study of aerodynamic grain entrainment in aeolian transport. Geophys. Res. Lett. 2020, 47, e2019GL086574. [Google Scholar] [CrossRef] [Scilit]
- Zhang, J.; Li, G.; Shi, L.; Huang, N.; Shao, Y. Impact of turbulence on aeolian particle entrainment: Results from wind-tunnel experiments. Atmos. Chem. Phys. 2022, 22, 9525–9535. [Google Scholar] [CrossRef] [Scilit]
- Xue, M.; Droegemeier, K.K.; Wong, V. The advanced regional prediction system (ARPS)—A multiscale nonhydrostatic atmospheric simulation and prediction model. Part I: Model dynamics and verification. Meteorol. Atmos. Phys. 2000, 75, 161–193. [Google Scholar] [CrossRef] [Scilit]
- Mollinger, A.M.; Nieuwstadt, F.T.M. Measurement of the lift force on a particle fixed to the wall in the viscous sublayer of a fully developed turbulent boundary layer. J. Fluid Mech. 1996, 316, 285–306. [Google Scholar] [CrossRef] [Scilit]
- Phillips, M. A force balance model for particle entrainment into a fluid stream. J. Phys. D Appl. Phys. 1980, 33, 221–233. [Google Scholar] [CrossRef] [Scilit]
- Luchik, T.S.; Tiederman, W.G. Time scale and structure of ejections and bursts in turbulent channel flows. J. Fluid Mech. 1987, 174, 529–552. [Google Scholar] [CrossRef] [Scilit]
- Foucaut, J.-M.; Stanislas, M. Take-off threshold velocity of solid particles lying under a turbulent boundary layer. Exp. Fluids 1996, 20, 377–382. [Google Scholar] [CrossRef] [Scilit]
- Shen, H.; Ackermann, N.L. Constitutive relationship for fluid–solid mixtures. J. Eng. Mech. Div. 1982, 108, 748–763. [Google Scholar] [CrossRef] [Scilit]
- Li, S.; Ma, W.; Ma, J.; Zhang, Z.; Yang, K. Feature contributions and predictive modeling of aeolian sand transport detection in the atmospheric surface layer. Aeolian Res. 2026, 75, 101037. [Google Scholar] [CrossRef] [Scilit]
- You, S.; Wan, M.P. A new turbulent-burst-based model for particle resuspension from rough surfaces in turbulent flow. Aerosol Sci. Technol. 2014, 48, 1031–1042. [Google Scholar] [CrossRef] [Scilit]
Disclaimer/Publisher’s Note: The statements, opinions and data contained in all publications are solely those of the individual author(s) and contributor(s) and not of MDPI and/or the editor(s). MDPI and/or the editor(s) disclaim responsibility for any injury to people or property resulting from any ideas, methods, instructions or products referred to in the content. |
© 2026 by the authors. Licensee MDPI, Basel, Switzerland. This article is an open access article distributed under the terms and conditions of the Creative Commons Attribution (CC BY) license.