


Highlights
What are the main findings?
- SBAS-InSAR combined with MLP classification identified five deformation patterns (rapid subsidence, minor subsidence, fluctuating, periodic, uplift) across Shanghai during 2015–2024.
- Stratified subsidence control policy shows clear spatial differentiation: major prevention zones have 72.03% benign deformation patterns, versus only 29.73% in general prevention zones.
What is the implication of the main finding?
- Deformation patterns are strongly linked to land use history, e.g., rapid subsidence clusters in historic reclamation areas and uplift aligns with active interventions, highlighting the role of “land use background” and “development stage” in control effectiveness.
- Findings support precision governance optimization for Shanghai and offer a transferable framework for coastal megacities worldwide facing land subsidence challenges.
Abstract
Since 2006, Shanghai has implemented a comprehensive subsidence control system, which aimed at groundwater extraction restrictions, artificial recharge, and the control of engineering-based settlement. While significant results have been achieved, a systematic scientific evaluation of its specific effectiveness remains unclear. This study utilizes Sentinel-1 SAR data from 2015–2024 and employs SBAS-InSAR technology to obtain high-precision ground deformation fields across Shanghai. A Multilayer Perceptron (MLP) model was introduced to intelligently classify time-series deformation data, through which we identified five typical patterns: rapid subsidence, minor subsidence, fluctuating deformation, periodic deformation, and uplift. Building upon this foundation, the research integrates Shanghai’s subsidence control zoning data and four-phase land use data (1990, 2000, 2015, 2022) to systematically evaluate the regional effectiveness of subsidence control policies and reveal the driving mechanisms of different deformation patterns from a land use transition perspective. Results demonstrate that the stratified subsidence control policy has achieved significant results with distinct spatial differentiation characteristics: major prevention zones exhibit stable deformation (benign patterns reaching 72.03%), while general prevention zones display high-risk, highly dynamic characteristics (benign patterns accounting for only 29.73%). Further analysis reveals strong coupling between the five deformation patterns and land use history: rapid subsidence concentrates in historical reclamation areas, and uplift correlates with active intervention measures. These findings confirm that subsidence control effectiveness is closely associated with regional “land use background” and “development stage.” This study provides a scientific basis for optimizing precision governance strategies in Shanghai and offers a valuable reference framework and methodology for other coastal megacities worldwide facing similar challenges.
1. Introduction
Land subsidence has persisted as a long-term challenge in Shanghai since the last century, primarily driven by excessive groundwater extraction, large-scale engineering projects, and heavy structural loading [1,2,3,4]. As China’s most densely populated and economically dynamic megacity, failure to effectively control deformation patterns would directly threaten urban infrastructure security [5], exacerbate flood and seawater intrusion risks [6], and trigger substantial economic losses [7]. This risk has been quantitatively validated through coastal scenario simulations: if current subsidence rates persist until 2050, compared to baseline scenarios considering only climate change, the land area, population, and assets exposed to 100-year coastal flooding events would increase by 20–39%, 17–37%, and 18–39%, respectively [7]. However, effective subsidence control measures could mitigate up to two-thirds of these additional risks [7]. Since 2006, the Shanghai Municipal Government has progressively established a comprehensive land subsidence control system incorporating groundwater extraction restrictions (including complete bans in designated zones), artificial aquifer recharge, and engineering-based settlement reduction technologies [3,8,9]. These efforts have yielded significant results [3]. Nevertheless, a systematic and comprehensive scientific evaluation of their specific effectiveness remains lacking. Establishing an accurate assessment mechanism is crucial not only for Shanghai’s urban safety and sustainable development but also for providing valuable insights to other coastal cities worldwide facing similar challenges, thereby supporting the formulation and optimization of future subsidence control policies [6,10,11,12].
Current methods for precise land subsidence monitoring primarily rely on in situ techniques, including leveling, total stations, and Global Navigation Satellite System (GNSS). While these approaches deliver high measurement accuracy, they are generally constrained by sparse spatial coverage and substantial operational costs [1,2,13]. In comparison, remote sensing technologies such as Interferometric Synthetic Aperture Radar (InSAR) provide a revolutionary alternative, enabling millimeter-scale deformation monitoring with all-weather, large-area, and high-resolution capabilities [2,14,15,16,17]. Currently, time-series InSAR approaches include Permanent Scatterer InSAR (PS-InSAR) and Small Baseline Subset InSAR (SBAS-InSAR) [18]. SBAS-InSAR is particularly notable for its ability to minimize temporal-spatial decorrelation and atmospheric delay errors through optimized interferometric pair selection, greatly enhancing data reliability and accuracy [19]. Thus, it has been extensively used to examine large-scale, gradual ground deformation such as urban subsidence, mining-induced settlement, and aquifer-system compaction due to groundwater extraction [10,20,21,22]. Representative applications include regions such as China’s Pearl River Delta [20], Shanghai [10], and Tehran Plain, Iran [23].
While existing SBAS-InSAR studies provide valuable insights into land subsidence in Shanghai, there remains a gap in long-term (e.g., decadal-scale) analyses that can critically assess the effectiveness of subsidence control strategies over time [10,24,25]. Especially, key management questions remain elusive, such as the actual effectiveness of control measures on long-term deformation patterns, the spatial consistency between subsidence control areas and policy planning, as well as persistent vulnerable zones within the current governance framework [8,22,26]. To address these gaps, this study establishes a multidimensional evidence analysis framework. Utilizing Sentinel-1 radar time-series data from 2015 to 2024, we generated high-precision subsidence rate maps and introduced a Multilayer Perceptron (MLP) model to achieve efficient and intelligent classification of ground deformation time series [27,28]. Based on this approach, the study systematically identified five typical deformation patterns: rapid subsidence, minor subsidence, fluctuating deformation, periodic deformation, and uplift, overcoming the limitations of traditional single-rate characterization and revealing the dynamic evolution patterns of land subsidence [21,29]. Furthermore, by integrating multi-temporal land use data (1990, 2000, 2015, and 2022) with the classified deformation patterns through spatiotemporal correlation analysis, we elucidate the response mechanism of deformation to land use changes, with special emphasis on the lagged effects of historical human activities on subsidence processes [30]. This provides a quantitative basis for precise attribution of subsidence causes and the development of differentiated zoning-based control strategies [3,31,32].
Building upon the aforementioned research background and innovative methodologies, this study aims to establish a multidimensional and temporally resolved scientific evidence framework to systematically evaluate the effectiveness of land subsidence control in Shanghai over the past decade. The paper is structured as follows: Section 2 introduces the study area and multi-source datasets; Section 3 elaborates on the research methods, including SBAS-InSAR deformation monitoring, MLP-based deformation pattern classification, and processing of multi-temporal land use data; Section 4 systematically presents the time-series ground deformation results, deformation pattern classification maps, and reclassified land use outcomes; Section 5 provides a comprehensive discussion integrating policy control zones and land use evolution to assess overall subsidence control effectiveness, potential influencing factors, and targeted governance strategies; Section 6 summarizes the main research conclusions.
2. Study Area and Data
2.1. Study Area
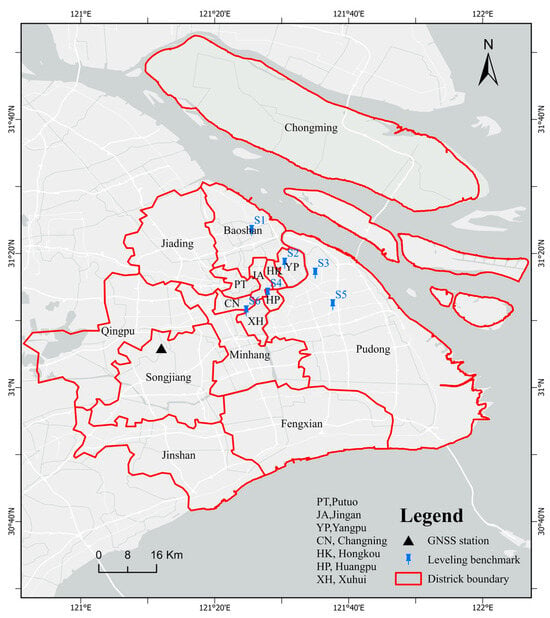
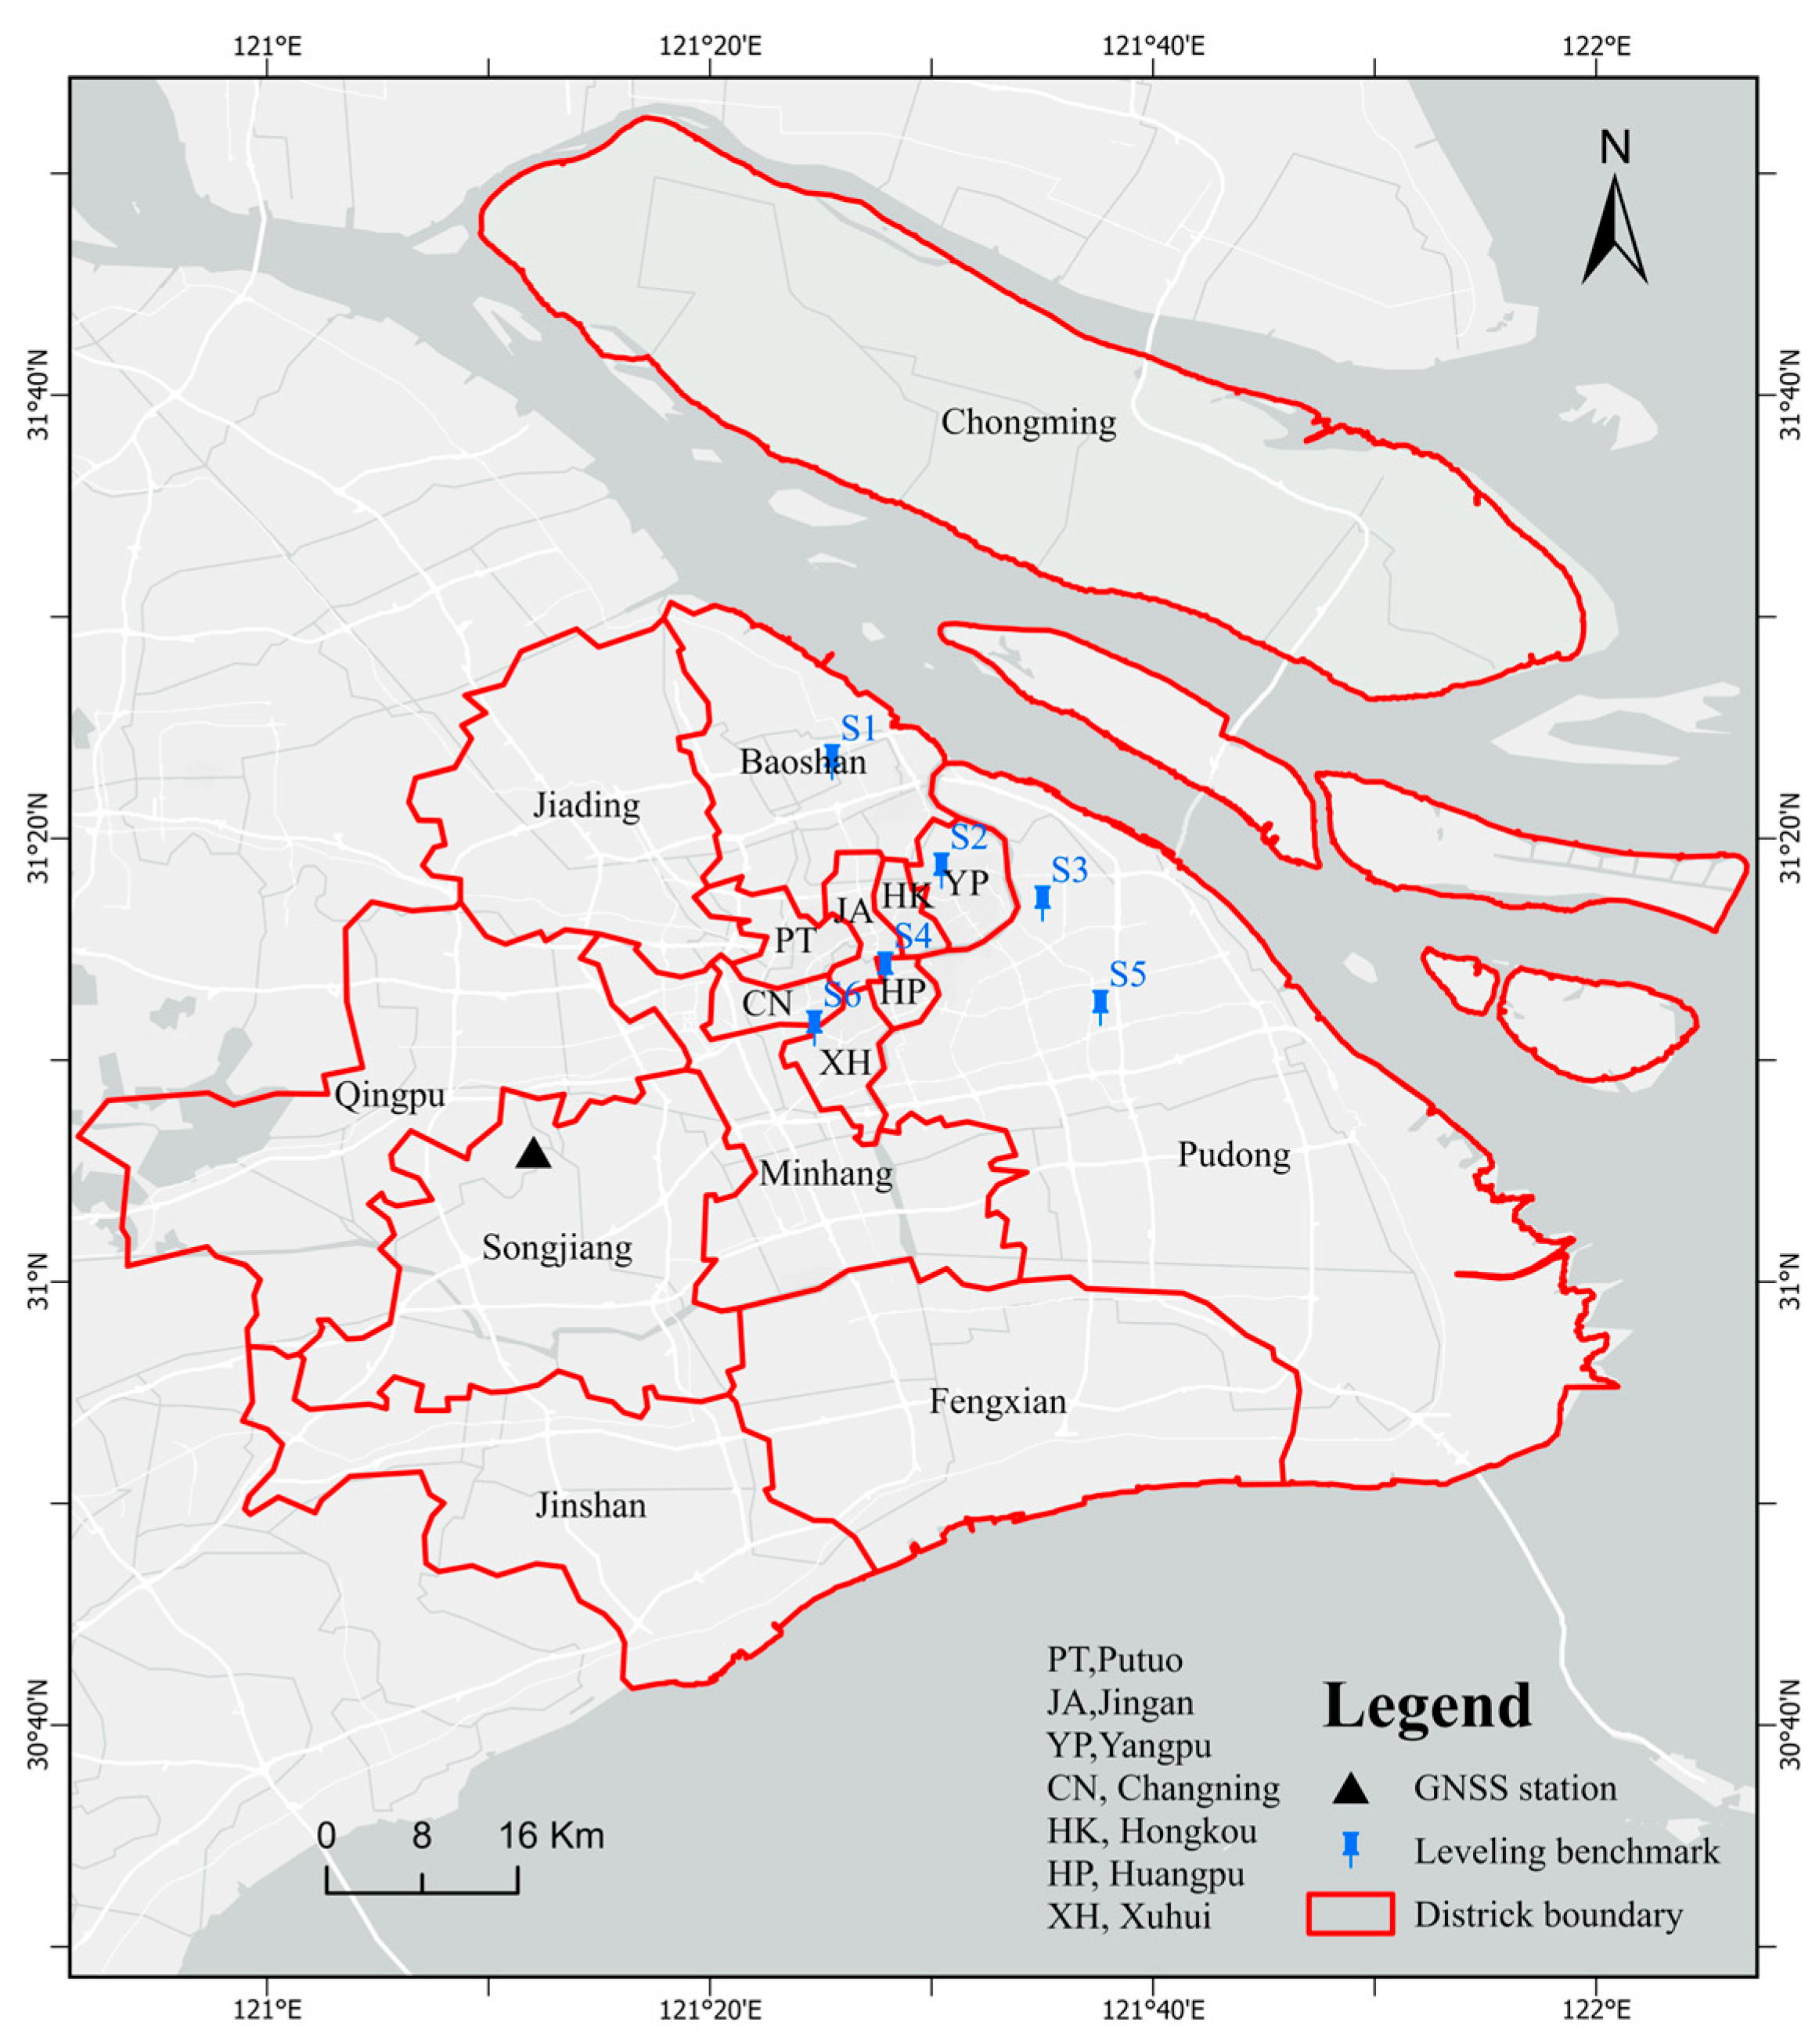
Shanghai, situated on the eastern front of the Yangtze River Delta (120°51′–122°12′E, 30°40′–31°53′N), constitutes a critical alluvial plain at the Yangtze River estuary (Figure 1). Bordered by the East China Sea to the east, the municipality spans a total area of 6340.5 km2 with predominantly low-lying topography averaging 4 m in elevation, while most areas range between 2–6 m above sea level. The region exhibits a subtropical monsoon climate characterized by four distinct seasons and synchronous rain-heat patterns during the growing season, with a mean annual temperature of 15 °C and annual precipitation averaging 1262.1 mm. The regional geological structure is predominantly characterized by thick Quaternary sediments, with alternating clay and sand layers forming a depositional sequence reaching 200–300 m in thickness, which constitutes a typical multi-layer aquifer system [33]. The groundwater regime primarily consists of phreatic aquifers and confined aquifers, whose spatial distribution and evolutionary processes are collectively controlled by depositional age, genetic mechanisms, and hydrochemical characteristics [34].
Figure 1.
Geographical location of the study area, including district boundaries (Red lines), GNSS stations (Triangles), and leveling benchmarks (Pins).
2.2. Datasets
This study employs a multi-source data integration approach to analyze land subsidence in Shanghai. The core analysis is based on time-series Sentinel-1A SAR imagery processed using SBAS-InSAR technology to derive ground deformation information. The deformation results were validated through GNSS and leveling measurements. Although GNSS data availability was limited to a single public station in the study area, we secured leveling data from six benchmarks to ensure robust validation. Additionally, we incorporate land cover classification products and official subsidence control zoning data to analyze driving factors and prevention policy effectiveness. Detailed specifications and sources of all datasets are provided in Table 1.
Table 1.
Data Sources and Description.
3. Methodology
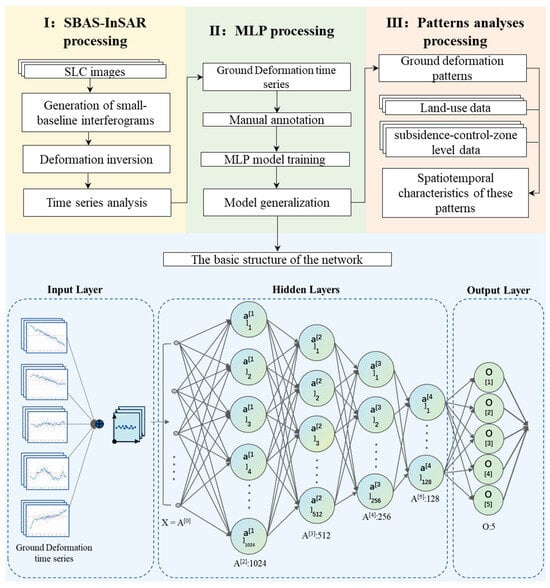
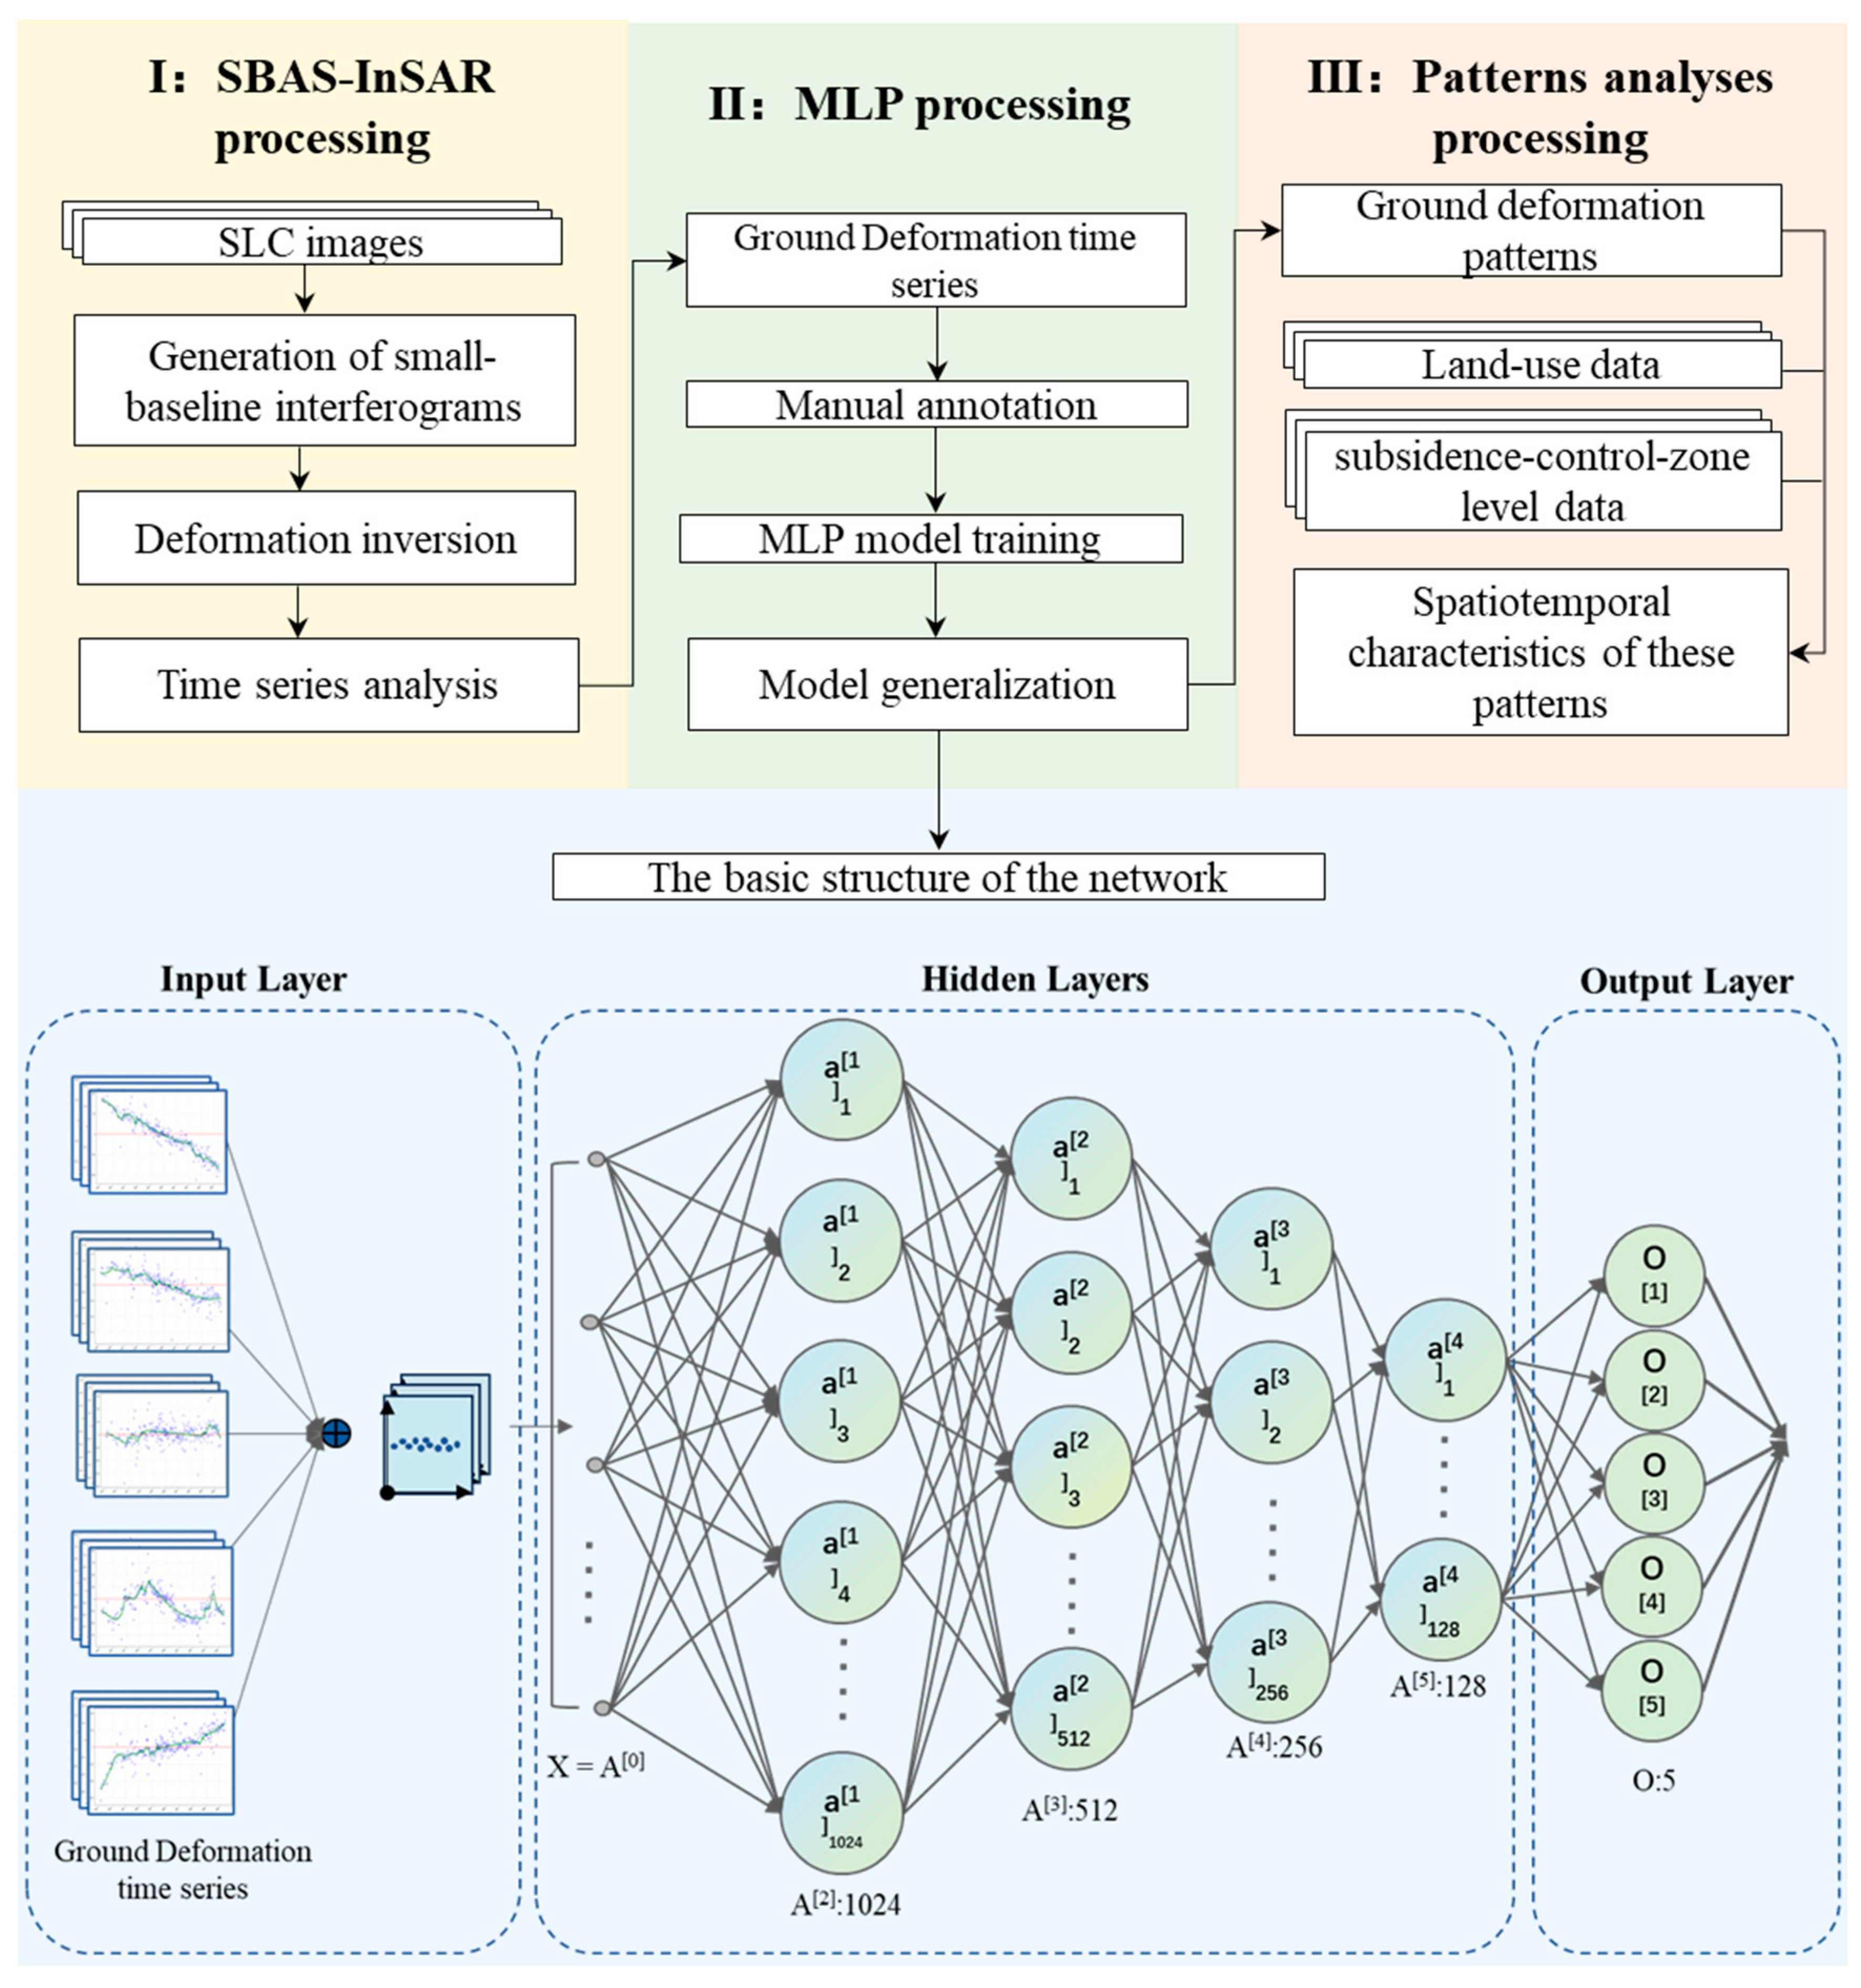
This study utilizes land subsidence rates obtained through SBAS-InSAR technology, couples a Multilayer Perceptron (MLP) for intelligent classification of deformation patterns, and simultaneously performs extraction and reclassification of multi-temporal land use information to reveal the coupling mechanisms between human activities and deformation patterns. The data processing workflow and key methodological steps are presented in Figure 2.
Figure 2.
Flowchart of data processing.
3.1. InSAR Time Series Analysis
Owing to its high-precision monitoring capability for large-scale ground deformation, SBAS-InSAR technology has been extensively employed in land subsidence monitoring [10,20,37,38]. By selecting interferometric pairs with short spatiotemporal baselines, this technique effectively mitigates spatiotemporal decorrelation effects while reducing atmospheric phase delay through temporal averaging and redundant interferometric measurements [19,38]. Building on these advantages, this study utilizes SBAS-InSAR technology to process Sentinel-1 datasets for deriving ground deformation characteristics across the study area.
The processing workflow comprises three main stages [39]. First, SAR data preprocessing is performed, involving the importation of SLC data and precise co-registration of images using the SRTM DEM, followed by uniform cropping to the study area extent [40]. Subsequently, an interferometric pair network is constructed by applying thresholds of 300 m for spatial baselines and 60 days for temporal baselines. Interferograms are generated using a 20 × 8 multi-looking window, filtered for noise reduction, and phase-unwrapped via the minimum cost flow algorithm [41]. Finally, time-series deformation is inverted based on a linear deformation model, incorporating simulated atmospheric phase screens for atmospheric delay correction and polynomial fitting for orbital error removal, ultimately yielding deformation velocity fields and time-series results in a geographic coordinate system.
This study focuses on regional land subsidence driven by anthropogenic activities such as groundwater extraction and construction. In this context, ground deformation is predominantly characterized by the vertical compression of soft soil layers. Consequently, although localized horizontal deformation may be present, the vertical component constitutes the most critical signal for revealing large-scale deformation patterns [42,43]. We therefore convert LOS deformation velocity () to vertical deformation velocity () using the following formula:
where β is the incidence angle of the satellite LOS.
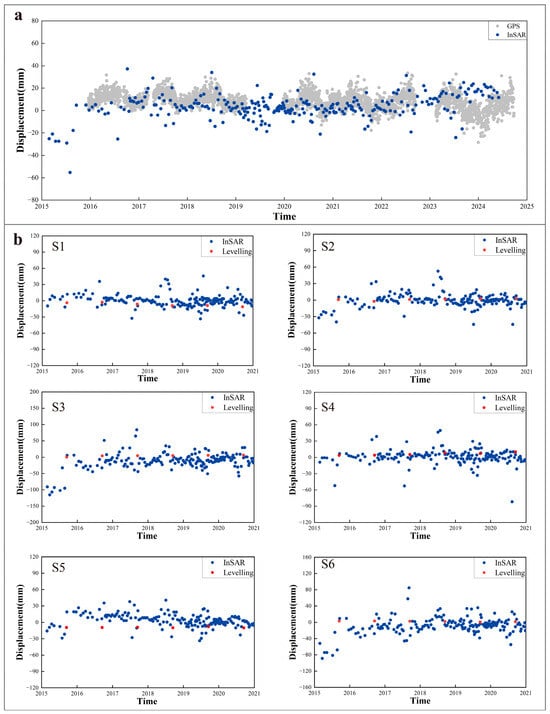
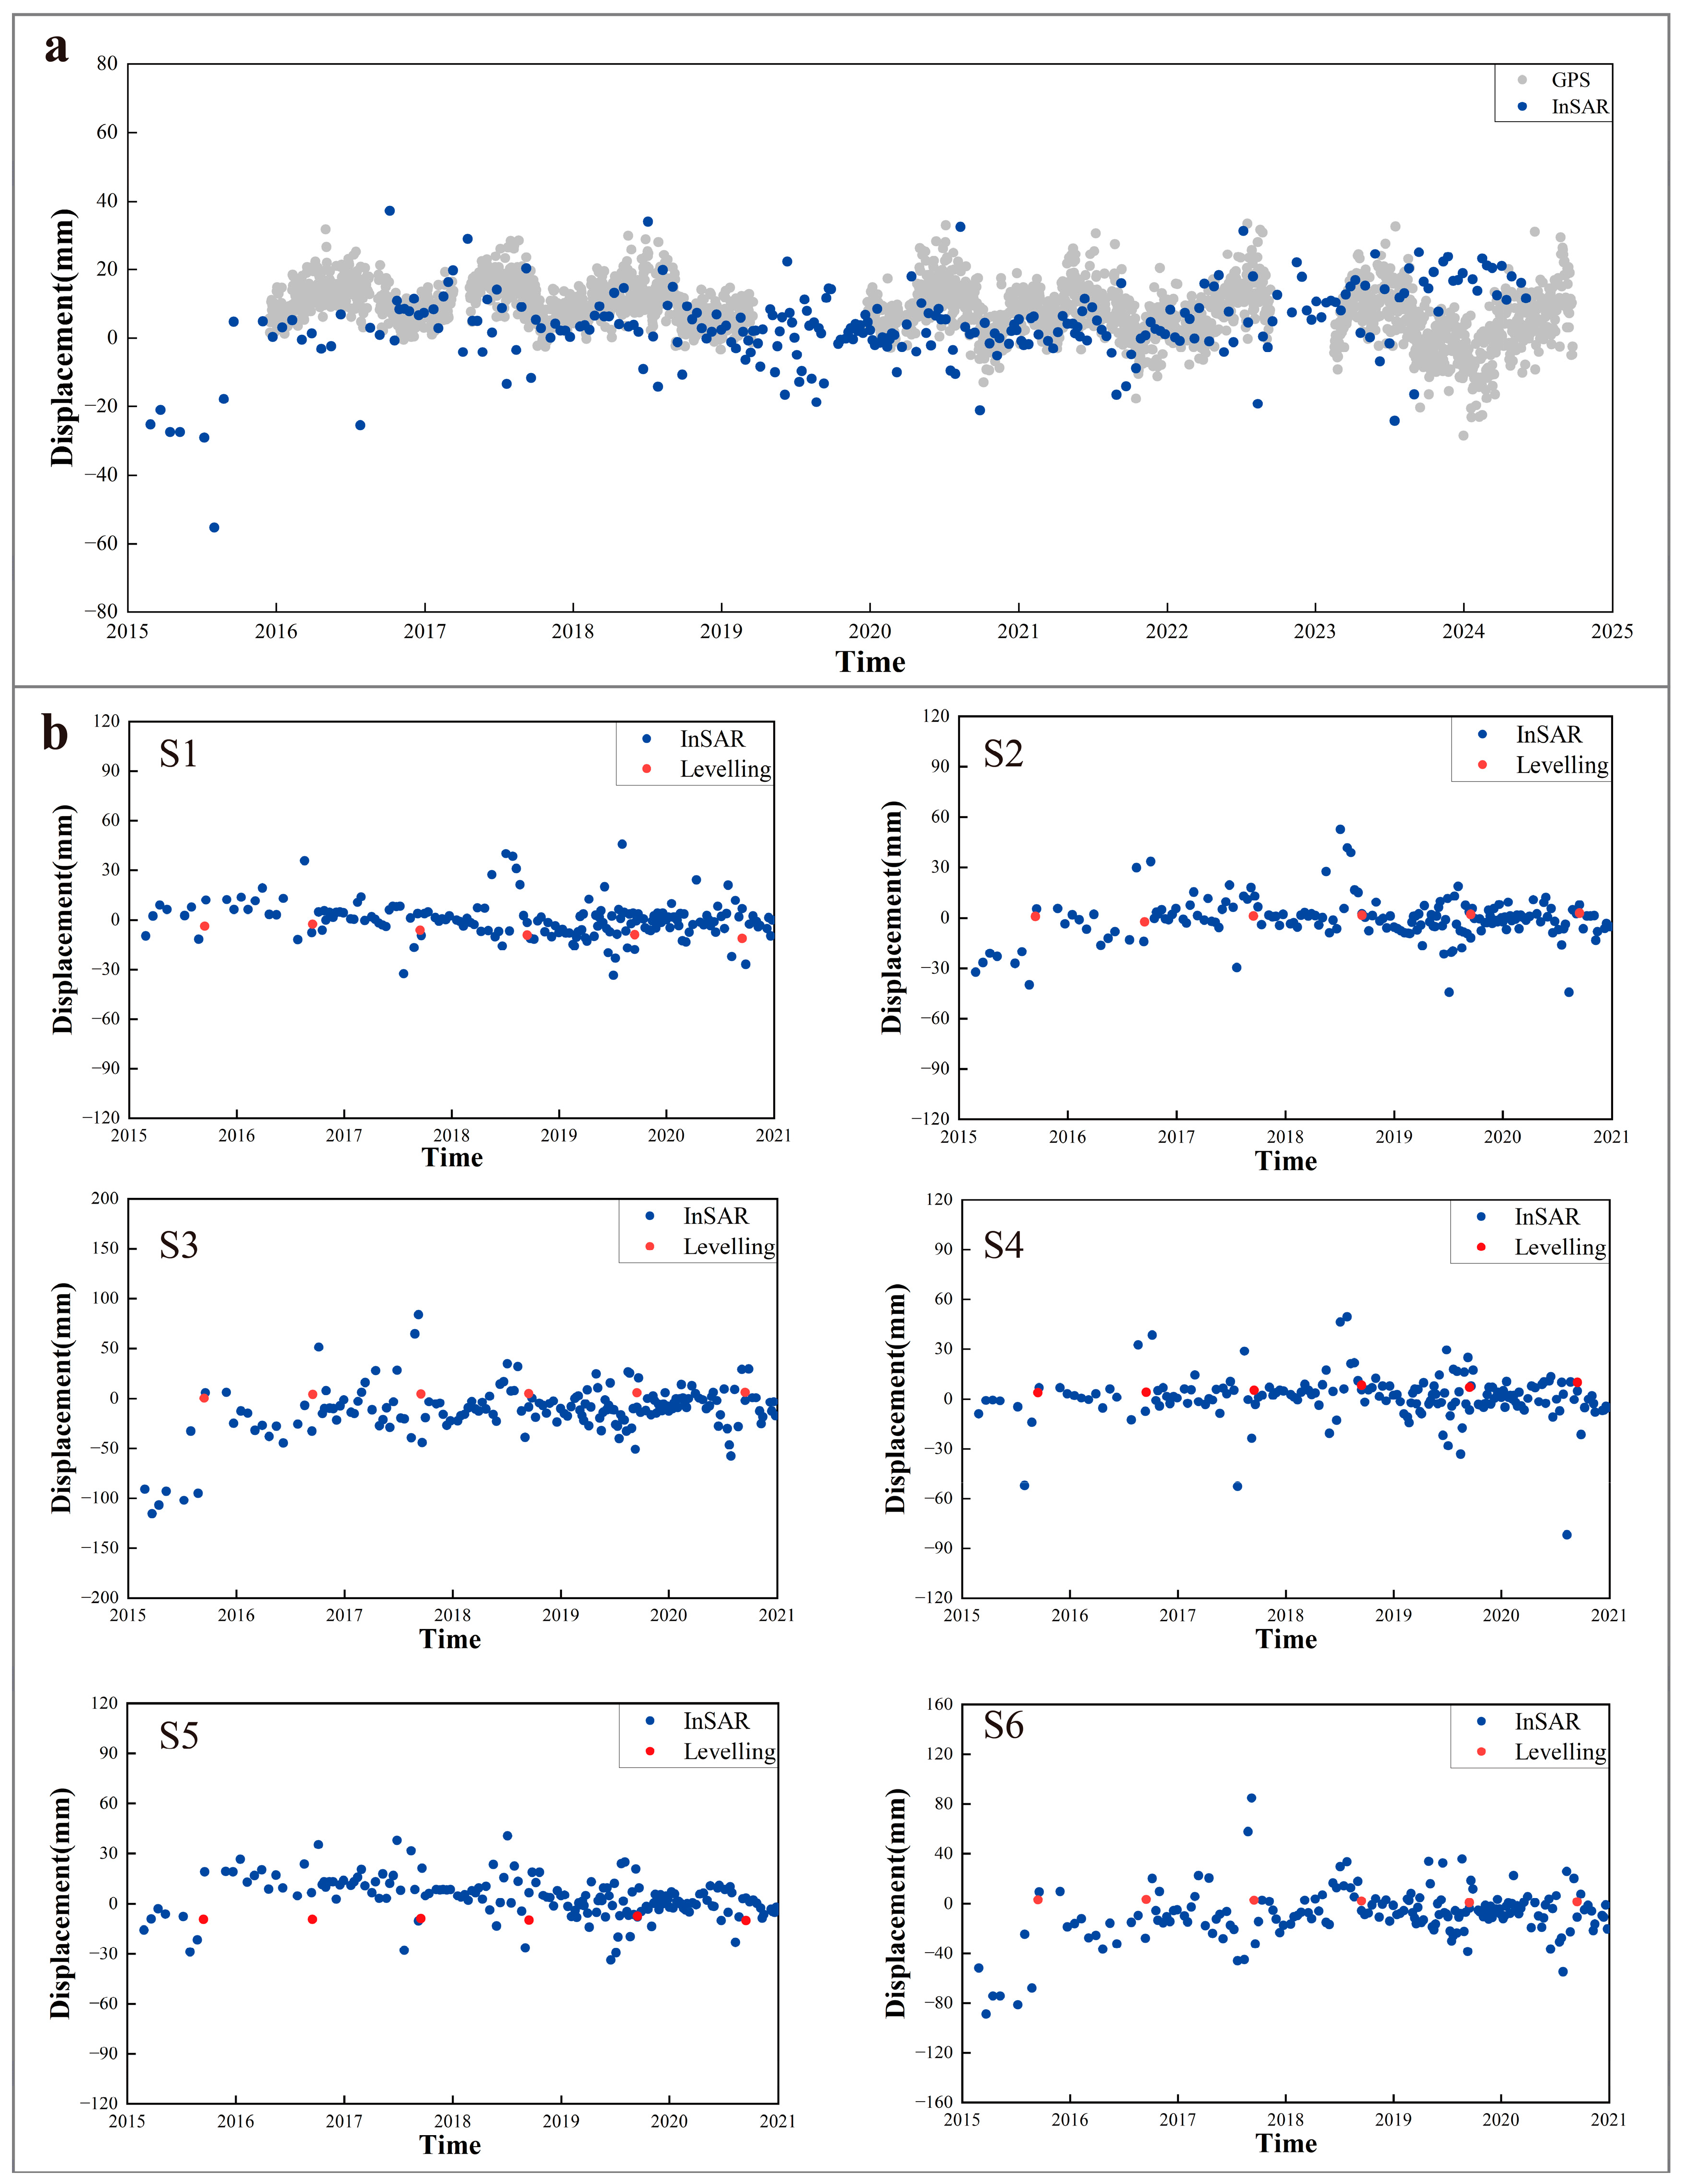
To validate the reliability of SBAS-InSAR results, this study conducted a comparative analysis with independent observational data from one continuous GNSS station and six leveling benchmarks (Figure 3) [44]. After manual outlier removal, the RMSE between the GNSS and SBAS-InSAR measurements was 5.2 mm. This result provides reliable validation for regional subsidence monitoring, as the research objective is centered on resolving deformation trends rather than quantifying absolute displacements at the millimeter scale. The results demonstrate that the time-series deformation trajectories obtained by InSAR show high consistency with GNSS measurements, while the leveling results further confirm the accuracy of InSAR-derived subsidence rates.
Figure 3.
Comparative validation of time-series vertical deformation between SBAS-InSAR and GNSS /leveling benchmarks ((a) GNSS station; (b) six leveling points, locations shown in Figure 1).
3.2. The Multilayer Perceptron (MLP) Model
After obtaining long-term deformation data across the study area using SBAS-InSAR technology, a Multilayer Perceptron (MLP) model based on a feedforward neural network architecture is employed to systematically analyze regional land subsidence deformation patterns through intelligent classification [28]. As a supervised learning model, the MLP employs nonlinear activation functions and error backpropagation mechanisms to progressively extract features from raw time-series deformation data, enabling end-to-end automatic identification of subsidence patterns. This approach not only efficiently processes massive monitoring datasets but also autonomously uncovers complex deformation patterns.
This study developed a time-series-based MLP classification model (Figure 2), which utilizes standardized deformation sequences as input. Feature extraction is performed through four fully connected hidden layers (1024-512-256-128 neurons), each incorporating batch normalization, GELU activation functions, and dropout layers. The final output layer employs five neurons with a Softmax function to generate probability distributions for the five deformation trend categories. During the training phase, the dataset was partitioned into training, validation, and test sets at a 7:1.5:1.5 ratio. Model optimization employed a batch size of 32 and a maximum of 300 training epochs using the AdamW optimizer (initial learning rate 1 × 10⁻⁴, weight decay 1 × 10⁻⁴). The training process incorporated learning rate warmup and cosine annealing strategies, combined with early stopping mechanisms to enhance training efficiency and prevent overfitting.
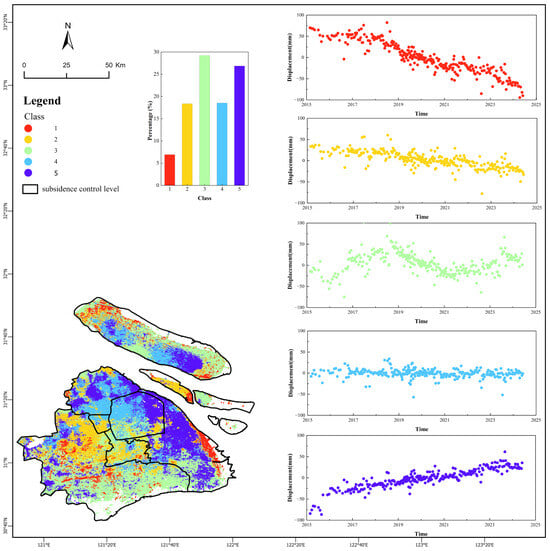
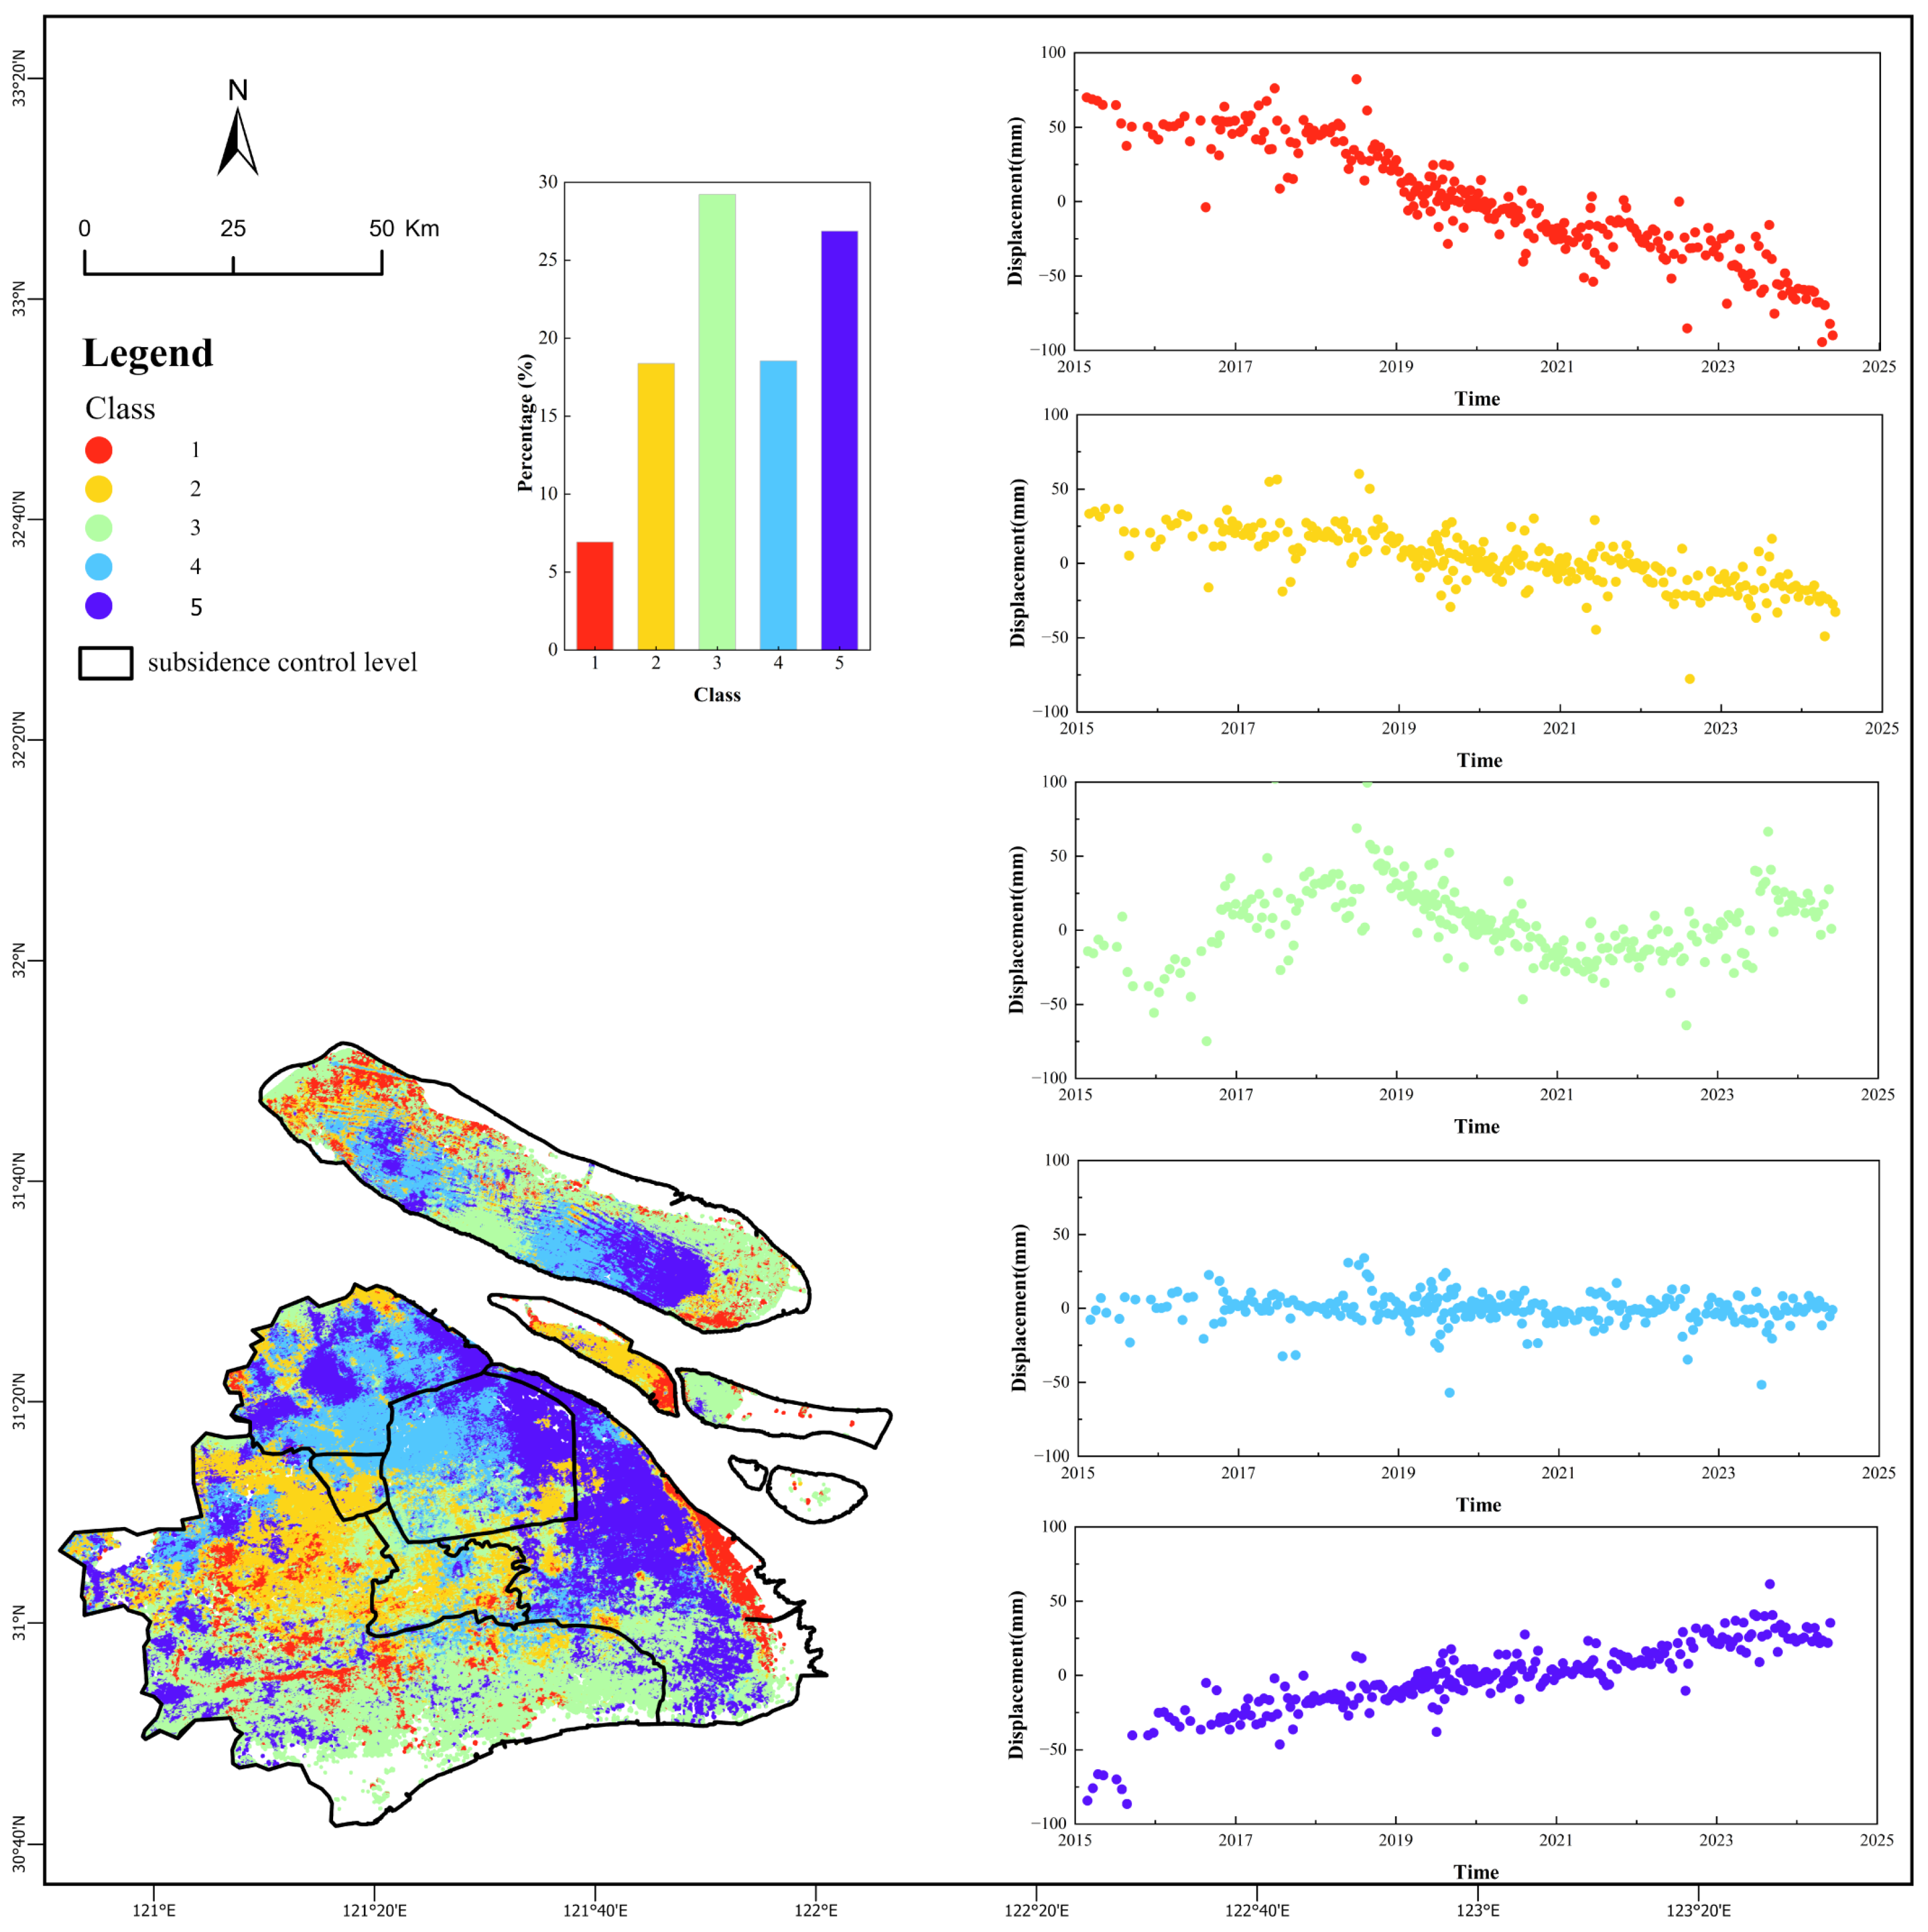
Based on the aforementioned theoretical framework, this study first conducted data preparation procedures. We involved a total of 761,109 land subsidence monitoring points. As MLP constitutes a supervised learning model, it was necessary to construct a high-quality labeled training dataset through the following implementation process: First, quantitative classification criteria for five deformation patterns were explicitly defined to systematically categorize deformation patterns. A hybrid scheme was adopted: for trend-dominated classes (Rapid Subsidence, Minor Subsidence, and Uplift), approximate quantitative thresholds were used; for pattern-dominated classes (Fluctuating and Periodic Deformation), discrimination was primarily based on the temporal morphology of the series, supplemented by quantitative indicators. The specific criteria were as follows: Class 1 (Rapid Subsidence) demonstrates near-linear decline with large absolute slope values (typically < −6 mm/year) and significant cumulative settlement (typically < −80 mm); Class 2 (Minor Subsidence) exhibits similar linear downward trends but with smaller absolute slope values (typically between −6 and 0 mm/year) and limited cumulative settlement (typically between −80 mm and −10 mm); Class 3 (Fluctuating Deformation) is characterized by the absence of stable linear trends, distinct alternating phases of uplift and subsidence, and large-amplitude fluctuations in deformation patterns; Class 4 (Periodic Deformation) manifests as oscillations around the zero-reference value (typically between −1 and 1 mm/year) without pronounced uplift or deformation patterns, showing clear periodicity; Class 5 (Uplift) displays either distinct linear or nonlinear upward deformation patterns (typically with a rate >1 mm/year and positive cumulative displacement). The five scatter subplots in Figure 4 show representative manually labeled time-series examples corresponding to these five deformation patterns. Based on these criteria, which were informed by an initial visual examination of a large subset of the time-series plots, 5000 representative sample points for each deformation class were manually annotated. The decision to employ manual labeling was necessitated by an initial exploration of ~470,000 time-series plots, which revealed distinct, semantically meaningful deformation patterns that were not adequately captured by purely quantitative thresholds or unsupervised clustering (as evidenced by the suboptimal performance of our K-means baseline). The final labeled samples were selected to ensure balanced and spatially representative coverage of these identified patterns across the entire study area. Ultimately, this process established a balanced dataset comprising 25,000 labeled samples.
Figure 4.
Spatial distribution of MLP-based deformation trend classes in the study area (2015–2024). The main map illustrates five distinct deformation patterns displayed in color-coded patterns: rapid subsidence in red, minor subsidence in orange, fluctuating deformation in green, periodic deformation in light blue, and uplift in dark blue, with black boundaries delineating subsidence control zones. Two insets are included: a histogram quantifying the proportional distribution of each deformation class, and five scatter plots showing representative manually labeled time-series examples corresponding to the five deformation patterns.
To further validate the classification approach and address potential concerns of subjectivity, we compared the MLP model against an unsupervised baseline. A K-means clustering algorithm (k = 5) was applied to the standardized 25,000 labeled samples using six key time-series features: linear trend (slope), cumulative displacement, standard deviation (volatility), range (max–min amplitude), trend strength (R2 of linear fit), and a periodicity index. The agreement between the K-means clusters and our manual labels was 73.04%. This result is substantial, confirming that the fundamental deformation patterns possess distinct characteristics in the feature space. However, the significant performance gap with the MLP model (97.17% accuracy) highlights the limitation of linear separation in this feature space for capturing the full complexity of the temporal patterns. It demonstrates the superior capability of the MLP model to learn nuanced, non-linear decision boundaries directly from the raw time-series data, thereby justifying its use for this sophisticated classification task.
Finally, this study conducted a comprehensive evaluation and application of the model performance. Quantitative assessment on the test set demonstrated an overall accuracy of 97.17%, with class-specific precision rates as follows: Rapid Subsidence 95%, Minor Subsidence 97%, Fluctuating Deformation 97%, Periodic Deformation 98%, and Uplift 99%. These results indicate the MLP model’s excellent classification capability for all five deformation classes. Using the optimally performing MLP model, generalized inference was performed on the remaining 736,109 unlabeled subsidence data points, achieving comprehensive classification of deformation patterns across the entire study area and providing a reliable data foundation for subsequent spatiotemporal analysis.
3.3. Extraction and Reclassification of Multi-Period Land Use Data
To analyze the relationship between land use changes and ground deformation, this study selected four-phase land use data from 1990, 2000, 2015, and 2022, conducting unified processing and reclassification. First, to standardize the spatial extent and reflect updated coastline changes, multi-temporal Landsat imagery was used to generate cloud-free composite data. An improved AWEI water index combined with Otsu threshold segmentation was employed for preliminary water body identification, followed by morphological filtering and connected component analysis to optimize boundaries, resulting in a 2024 Shanghai coastline vector dataset. This dataset was integrated with Shanghai’s administrative boundaries to form the 2024 jurisdictional scope, which served as the basis for cropping historical land use data, ensuring consistent analysis extent and temporal relevance. The original land use data contained 35 categories, some with minimal coverage in the study area. To highlight the relationship between major land class conversions and deformation, the original categories were consolidated into seven broad classes: Cropland, Forest, Grassland, Wetland, Impervious, Water, and Unused Land. In subsequent analyses, the “Unused Land” category was excluded from Sankey diagrams and land use transition analyses due to its negligible areal proportion. Through this processing, the impact of major land class conversions (such as transitions from Cropland to Impervious surfaces) on ground deformation could be more clearly revealed.
4. Result
4.1. Spatial Pattern of Time-Series Results
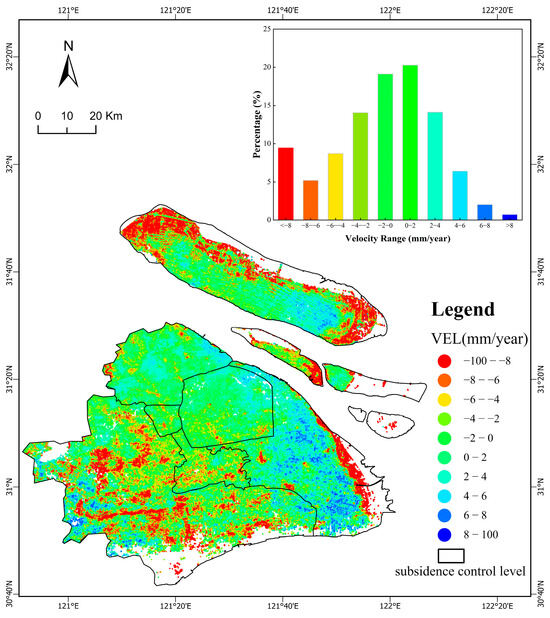
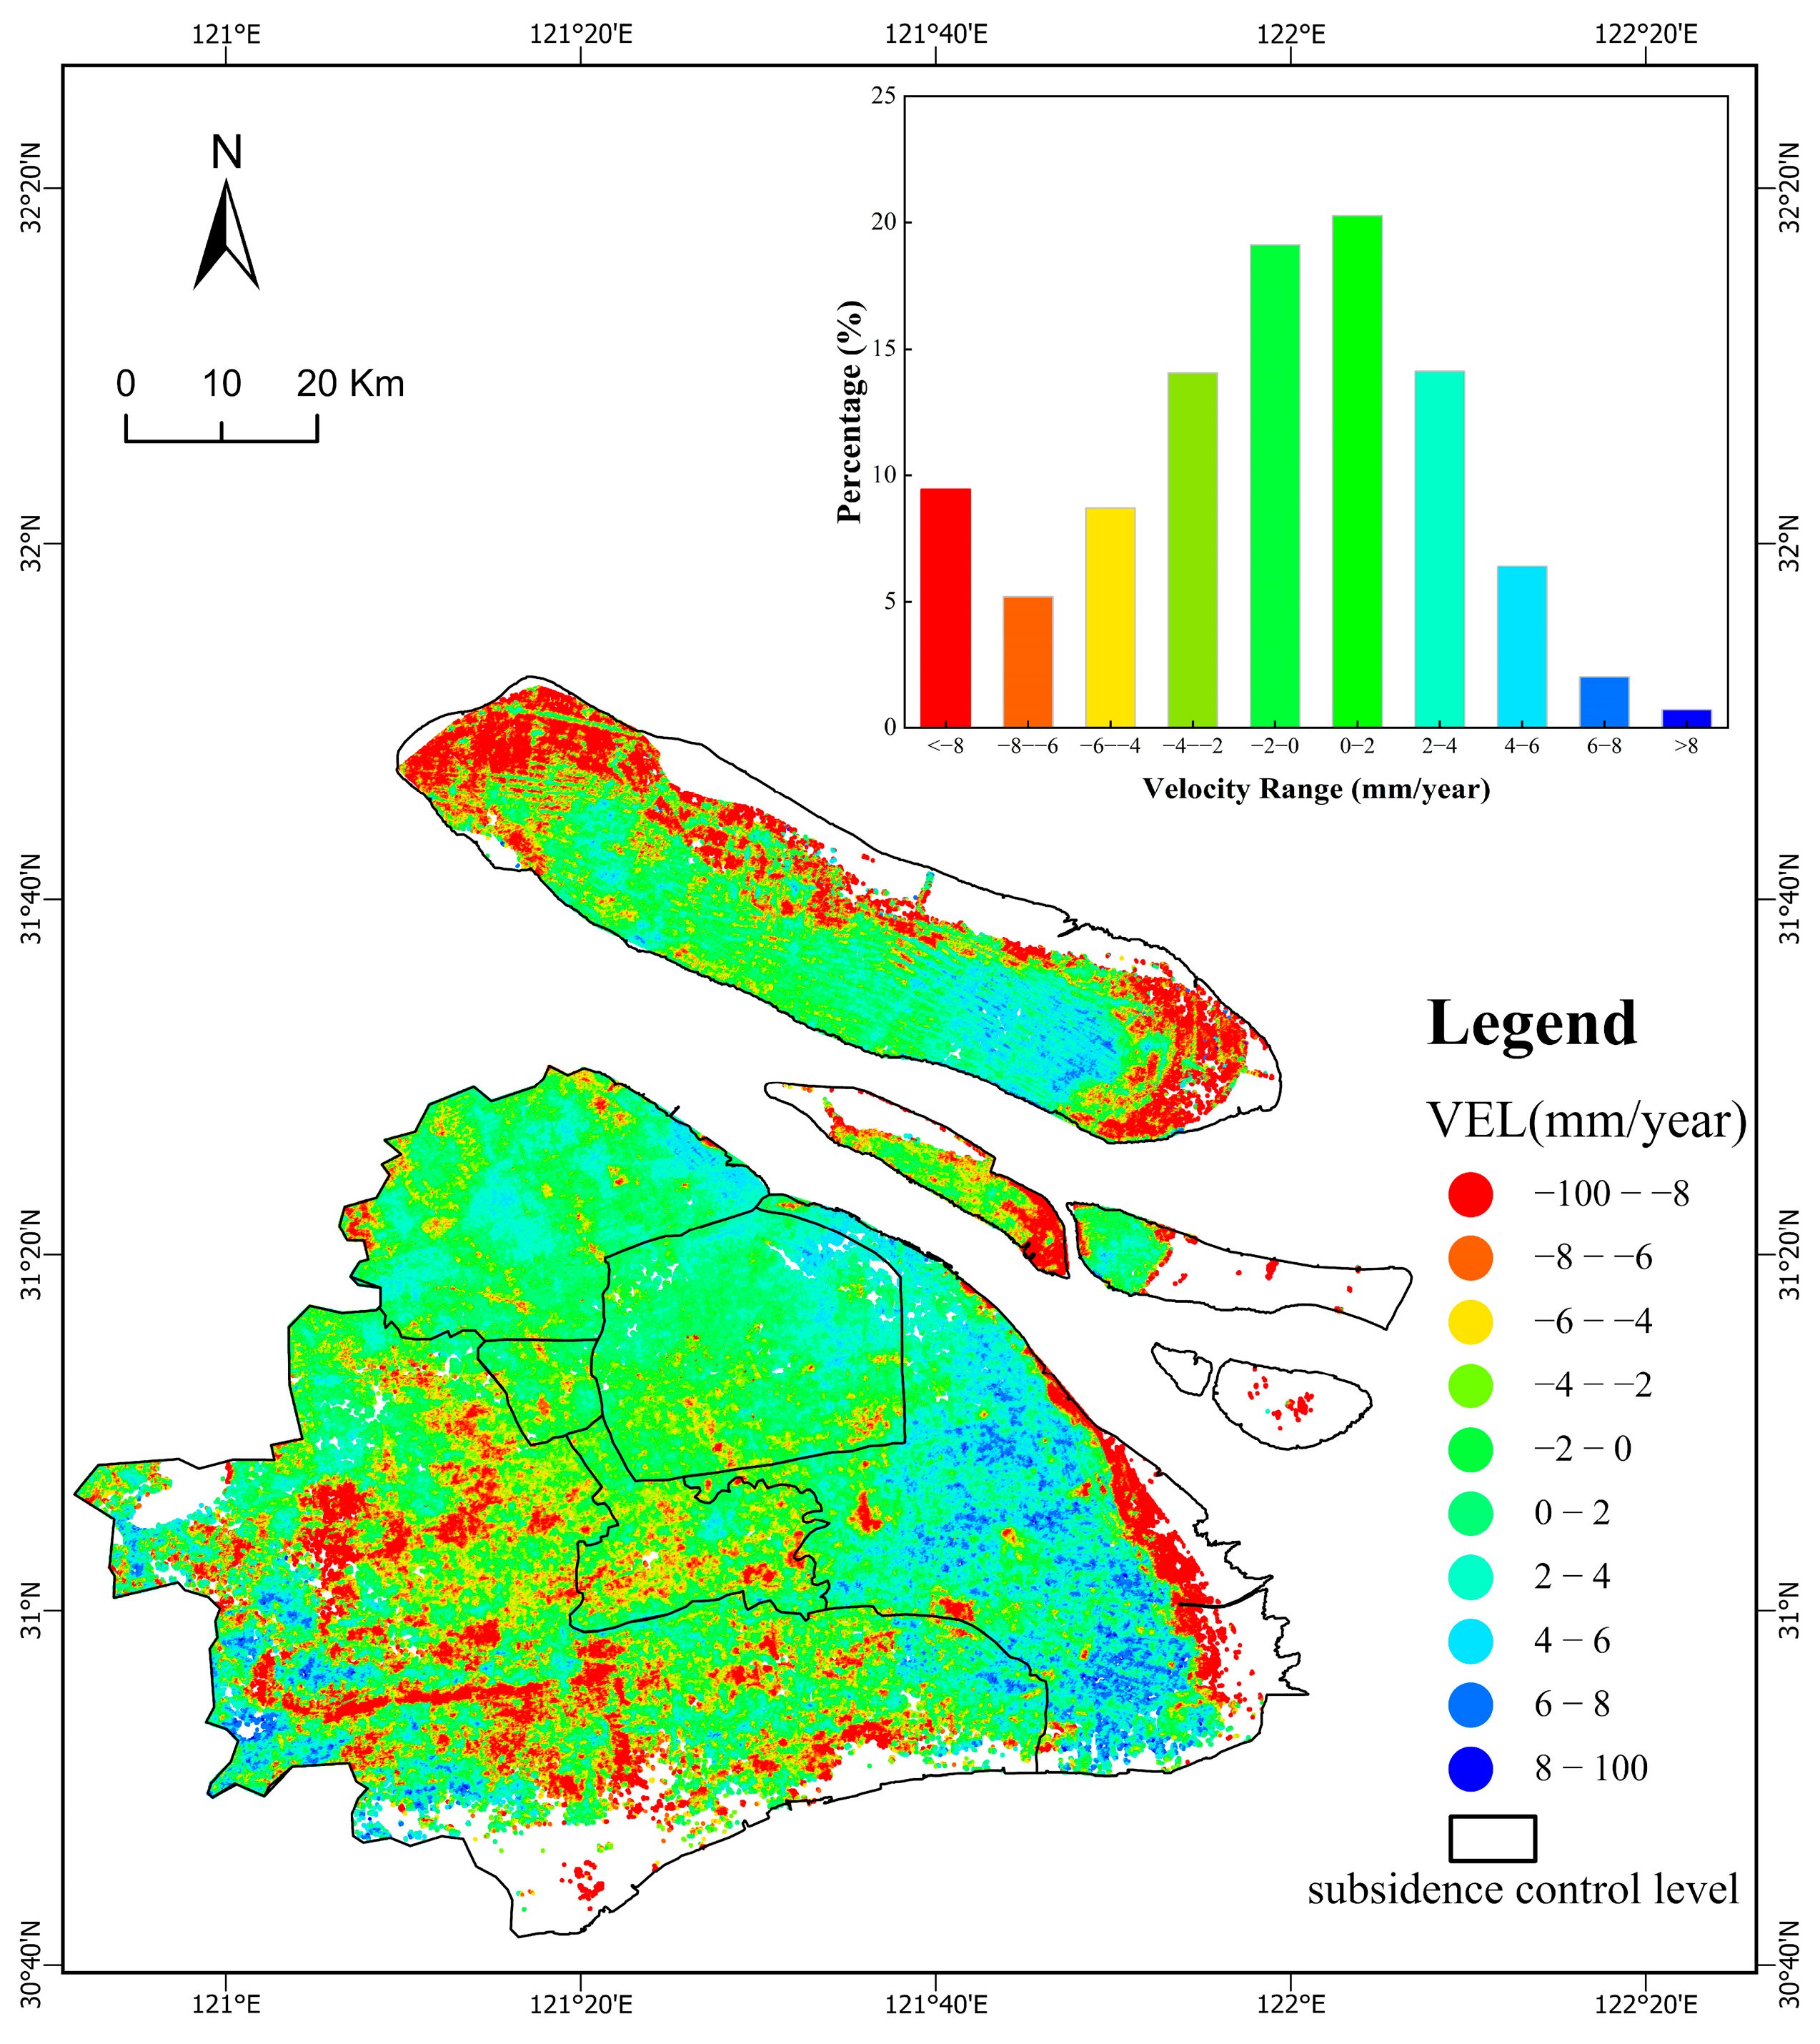
As shown in Figure 5, the rates of vertical land deformation across Shanghai reveal a clearly distinct spatial pattern. Specifically, deformation rates in the central urban districts range from −4 to 4 mm/year, indicating overall stability with only sporadic occurrences of localized subsidence funnels (<−4 mm/year). Pudong New Area exhibits an overall stable trend, with six significant uplift zones (>4 mm/year) identified, and a belt-shaped severe subsidence area (<−4 mm/year) is distributed along the coastal zone. In the suburban areas, the northeastern sector (Baoshan, Jiading) is dominated by stable deformation, while the southwestern sector (Minhang, Songjiang) shows a high proportion of stable deformation and an increased number of subsidence funnels. The exurban areas are similarly dominated by stable deformation and also contain multiple subsidence funnels.
Figure 5.
Vertical land subsidence rate in the study area (2015–2024). The main map shows the spatial distribution of ground deformation, with black boundaries marking subsidence control zones. The inset in the upper-right corner provides statistics on the areal proportion of different deformation rate intervals. Colors indicate uplift (positive deformation rates, in blue) and subsidence (negative deformation rates, in red).
The inset plot in Figure 5 displays the areal proportion statistics for different deformation rate intervals. The results demonstrate that Shanghai’s ground deformation overall exhibits a characteristic of “general stability with localized subsidence”: Areas with deformation rates within the −4 to 4 mm/year range collectively account for 67.53% of the total, indicating relatively moderate deformation across most regions. Conversely, subsidence areas with deformation rates below −4 mm/year represent a combined 23.35%, with particularly severe subsidence (<−8 mm/year) comprising approximately 9.46%. These intense subsidence zones require prioritized monitoring. Overall, Shanghai exhibits favorable ground stability, but several localized subsidence hotspots warrant continued attention.
4.2. Classification Results of Deformation Patterns
We identify five patterns with the MLP method, namely, rapid subsidence, minor subsidence, fluctuating deformation, periodic deformation, and uplift (Figure 4). Central urban districts are predominantly characterized by periodic deformation and uplift, with minimal distribution of fluctuating deformation. Pudong New Area exhibits an overall uplift trend but contains a ribbon-shaped rapid subsidence zone along its coastline. In suburban regions, the northeastern sector (Baoshan, Jiading) is dominated by periodic deformation and uplift, while the southwestern sector (Minhang, Songjiang) displays complex patterns with minor subsidence as the primary trend alongside coexisting rapid subsidence and uplift areas. Among exurban regions, the southern coastal belt (Jinshan, Fengxian) is mainly characterized by fluctuating deformation; Qingpu District primarily exhibits minor subsidence accompanied by periodic deformation and uplift; Chongming Island demonstrates diverse deformation types dominated by fluctuating deformation, periodic deformation, and uplift, with localized rapid subsidence distributed along its southeastern coastline.
To quantitatively reveal the overall pattern of deformation patterns, statistical analysis was conducted on the proportional distribution of the five categories (The bar chart in Figure 4). The results show that periodic deformation accounts for 18.56% and trend-based uplift for 26.88%, collectively reaching 45.44%, indicating nearly half of the area experiences stable or benign deformation patterns. Minor subsidence represents 18.39%, serving as the primary local deformation mode whose potential cumulative effects require continued monitoring. Fluctuating deformation shows the highest proportion at 29.23%, reflecting significant nonlinear fluctuation characteristics across nearly one-third of the region. Rapid subsidence accounts for the lowest proportion at merely 6.93%, demonstrating that severe subsidence areas have been effectively controlled.
4.3. Reclassified Land Use Maps
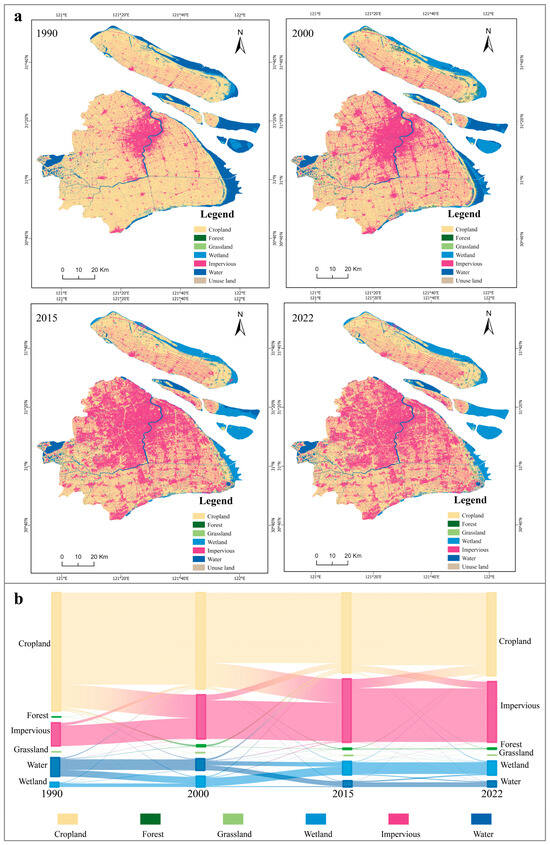
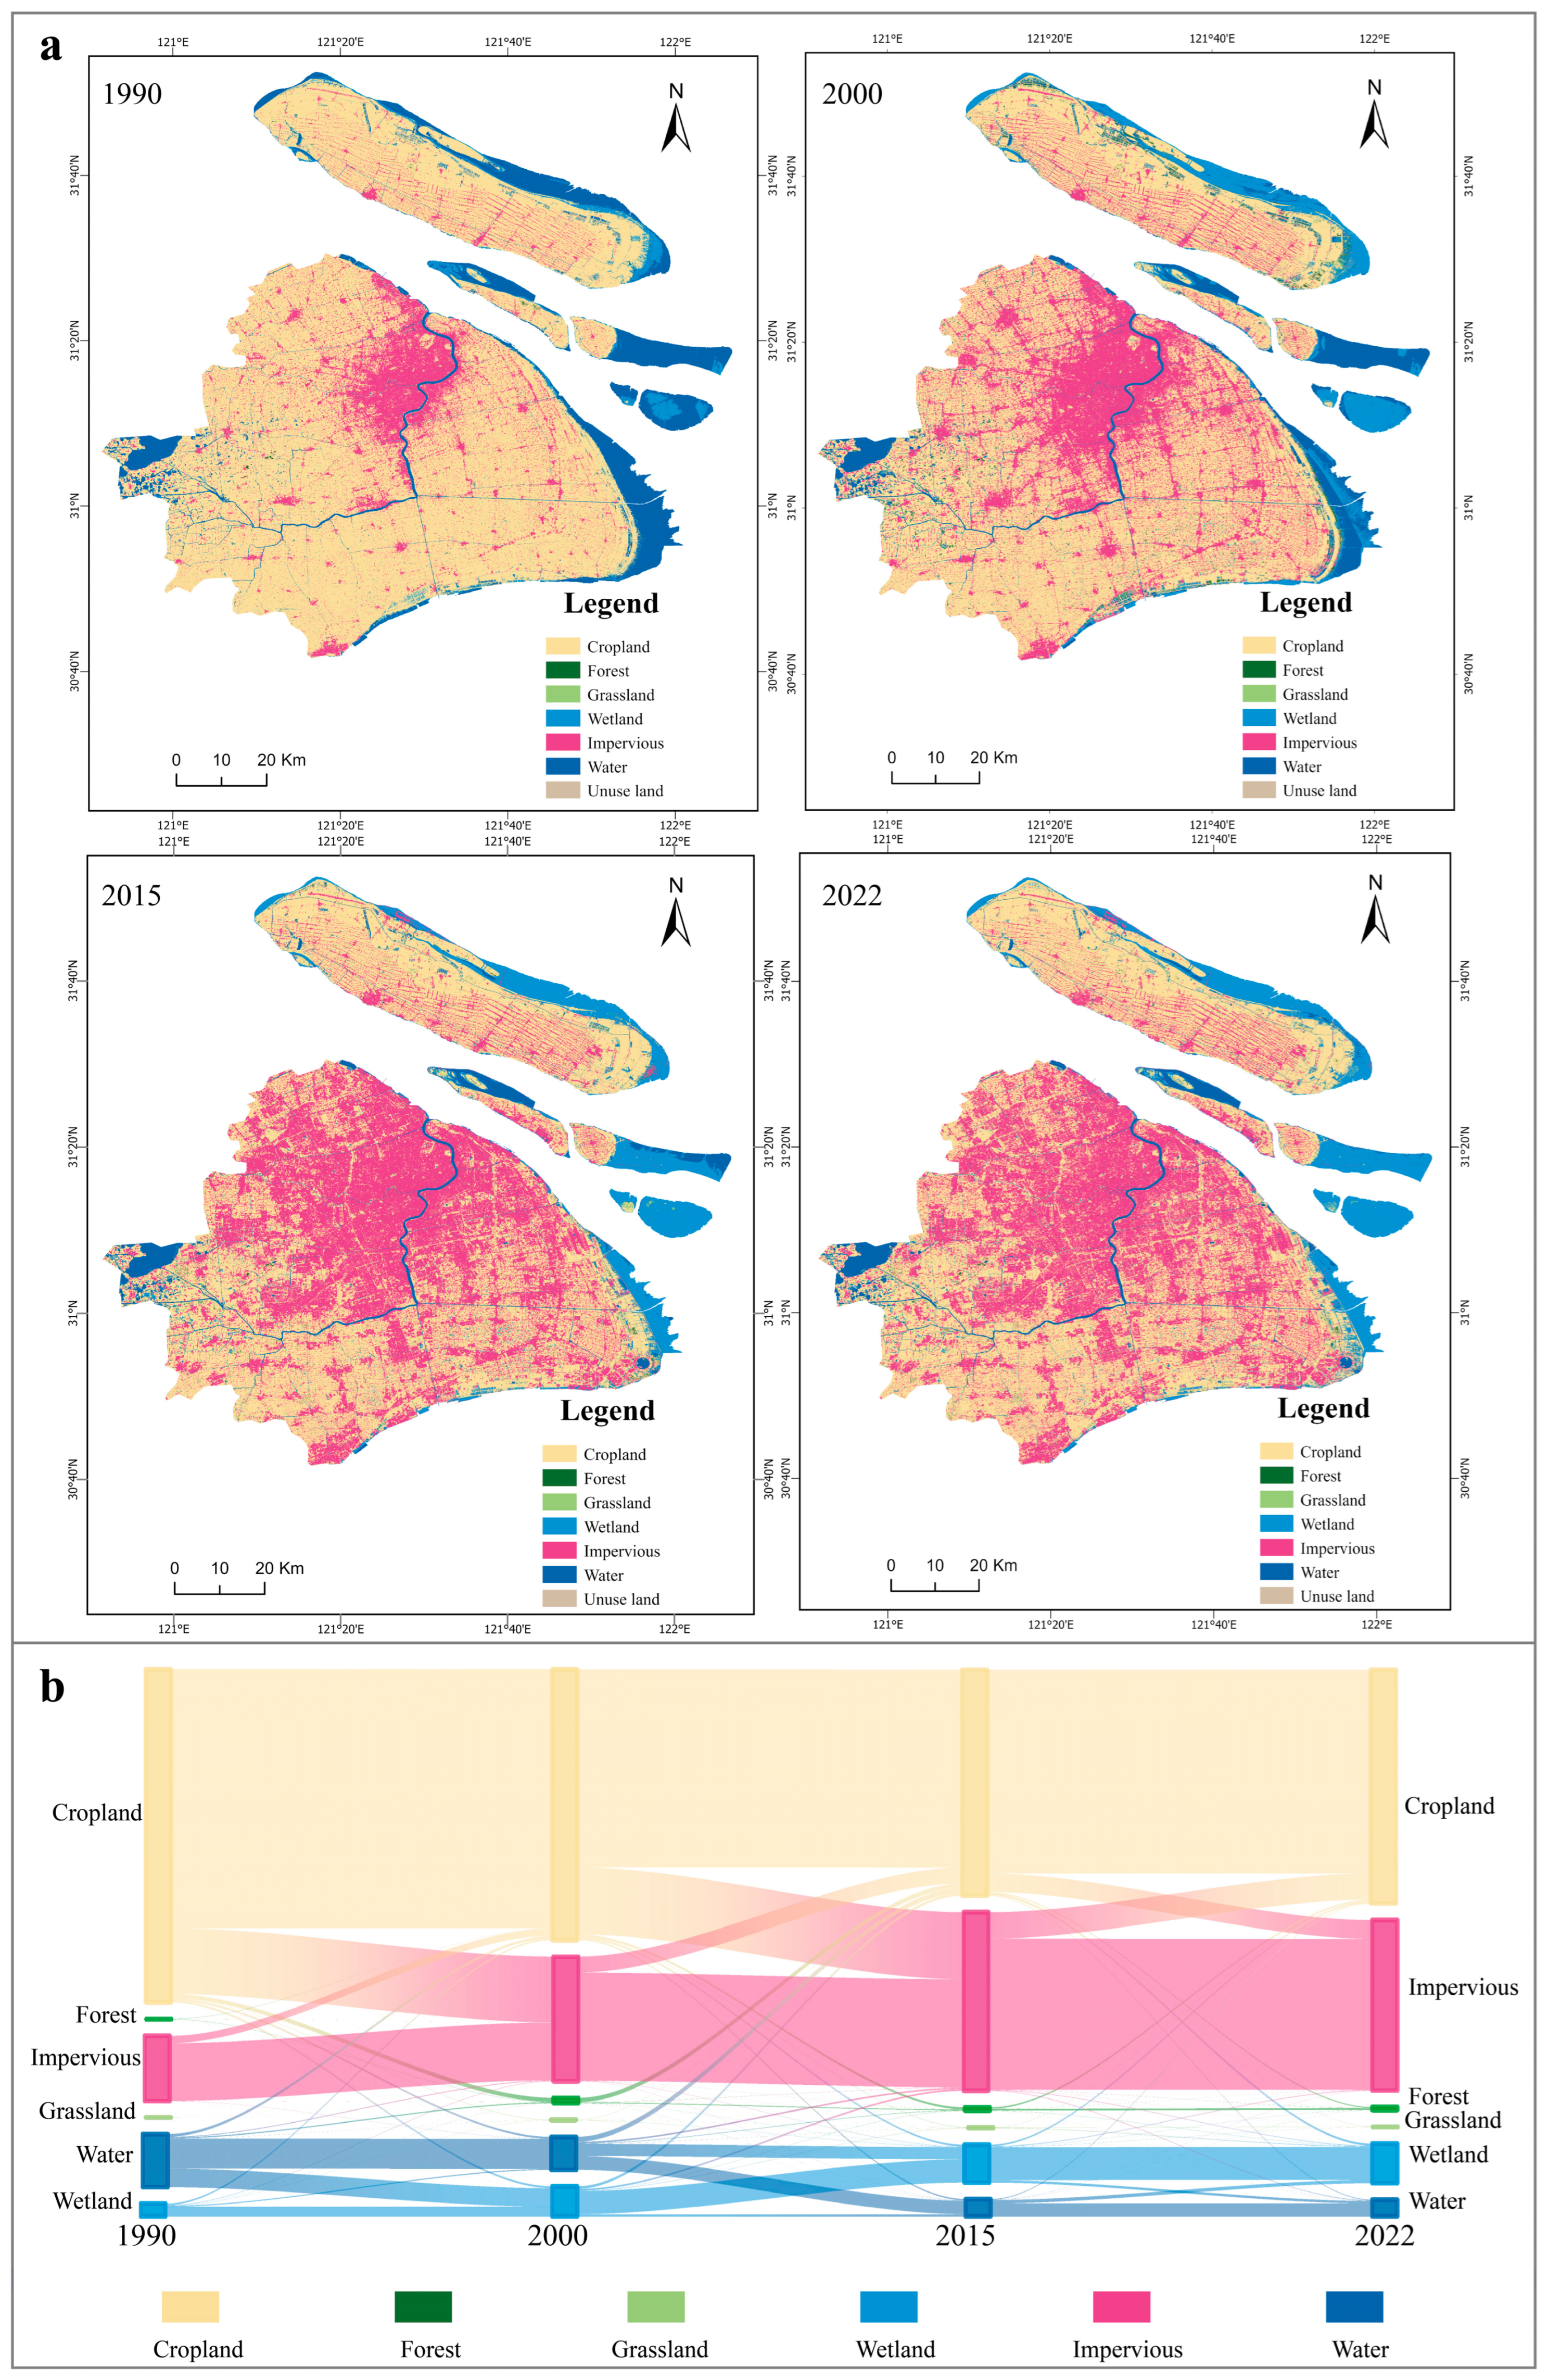
We investigate the spatial distribution of land use types in typical years, i.e., 1990, 2000, 2015, and 2022, which provide critical insights into land use transitions, as illustrated by a Sankey diagram based on multi-temporal data (Figure 6). The figure visually reveals fundamental transformations in Shanghai’s land use structure during this period, characterized most notably by large-scale reductions in cropland and wetland areas, accompanied by sustained rapid expansion of impervious surfaces. The evolution of land use can be deconstructed into three distinct phases, corresponding to shifts in urban development policies:
Figure 6.
(a) Land use distribution in Shanghai for 1990, 2000, 2015, and 2022; (b) Sankey diagram illustrating four-phase land type transitions.
1990–2000 (Initial Urbanization Phase): The early urbanization stage was predominantly marked by substantial conversion of cropland, with 123,526.7 hectares transformed into impervious surfaces, representing the dominant portion of cropland loss during this period. Simultaneously, significant transitions occurred between water bodies and wetlands, with 35,025.9 hectares of water converting to wetlands and 1906.4 hectares of wetlands transitioning to water bodies, reflecting interactive influences between human activities and natural hydrological processes.
2000–2015 (Urban Expansion Acceleration Phase): The rapid urbanization phase witnessed intensified transition trends, peaking at 125,038.9 hectares of cropland converted to impervious surfaces. Concurrently, 29,940.7 hectares of impervious surfaces were converted back to cropland, while 22,827.1 hectares of water bodies transitioned to wetlands, indicating a complex process combining urban renewal and ecological restoration. By the end of this phase, the impervious surface matrix had become largely consolidated, demonstrating high temporal stability with 203,245.7 hectares remaining unchanged.
2015–2022 (Intensive Development and Ecological Conservation Phase): A significant paradigm shift emerged, with cropland-to-impervious conversions substantially declining to 34,645.3 hectares, reflecting the effectiveness of the “negative growth of construction land” policy. Meanwhile, 49,015.8 hectares of impervious surfaces were converted to cropland, indicating enhanced urban renewal and ecological restoration efforts. Ecological land stability markedly improved, with 62,040.9 hectares of wetlands remaining unchanged. Particularly noteworthy is that the total impervious surface area reached 283,335.5 hectares in 2022, showing a slight decrease compared to 2015 while maintaining overall stability, demonstrating a historic transition from expansion to stabilization of developed land.
Overall, Shanghai’s land use changes exhibit distinct phased characteristics, transitioning from rapid urban expansion to intensive development and ecological conservation, reflecting significant achievements in urban development policies.
5. Discussion
To systematically evaluate the actual effectiveness of Shanghai’s land subsidence control policies and conduct an in-depth analysis of ground deformation driving mechanisms, this section adopts an analytical perspective focusing on the interactive effects between “policy control efficacy” and “land use transitions.” It assesses control effectiveness across different zoning areas and reveals the causative factors underlying deformation patterns. Through case-by-case analysis of four subsidence control zones, the study provides critical evidence and strategic insights for precision subsidence governance in megacities.
5.1. Policy Effectiveness: Long-Term Stability in Mature Urban Zones
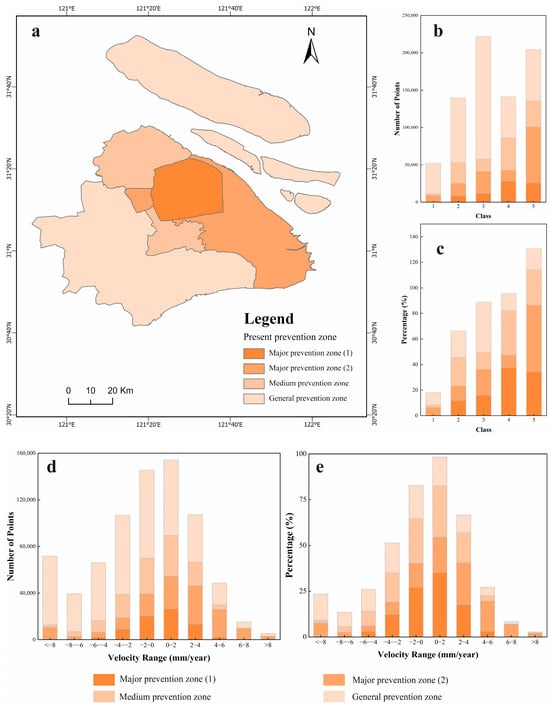
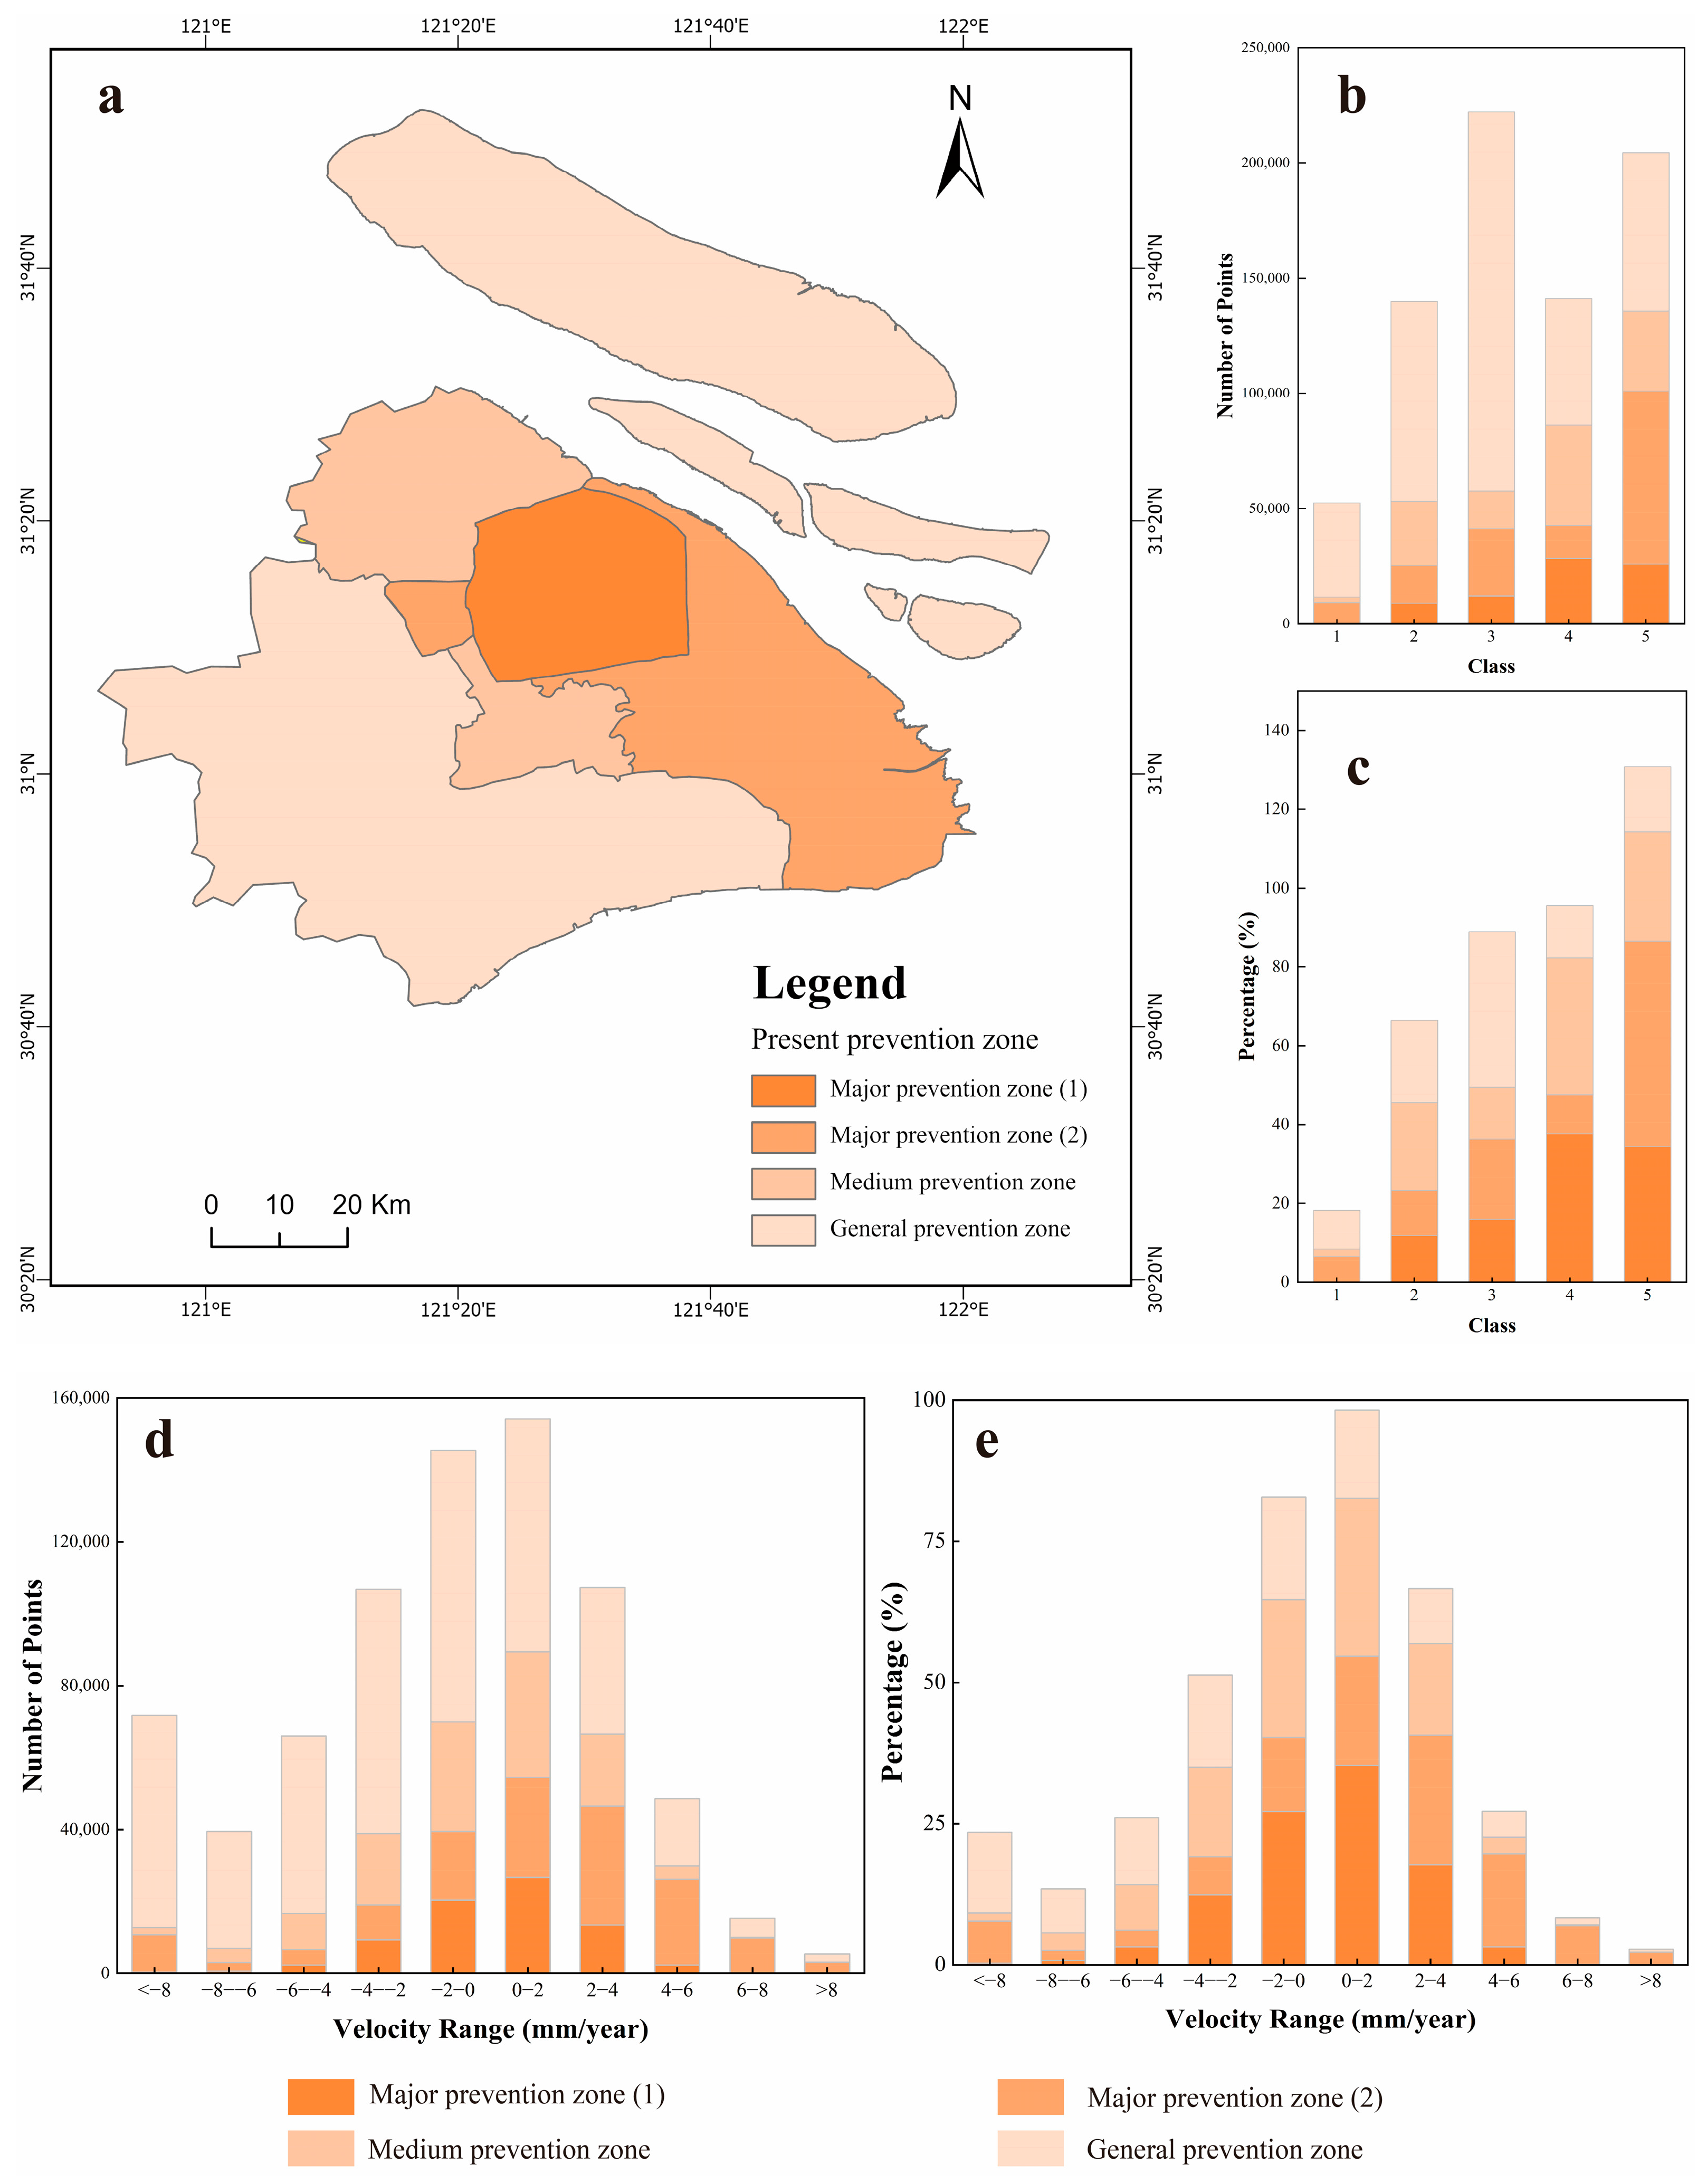
As the core of Shanghai’s subsidence control system, Major Prevention Zone (1) (covering central urban districts including Huangpu, Jing’an, and Xuhui) implements the most stringent groundwater extraction restrictions and engineering load management, providing an ideal benchmark for evaluating policy effectiveness. The deformation pattern in this zone features “extremely low magnitude with stable patterns.” Regarding deformation magnitude, the stable deformation range (−2 to 2 mm/year) accounts for 62.39% of the area, while the cumulative proportion within −4 to 4 mm/year reaches 79.26%, indicating effective control of deformation within minimal ranges across most areas (Figure 7d,e). In terms of deformation trend stability, benign patterns (periodic deformation and uplift) collectively account for 72.03%, while rapid subsidence patterns are negligible (0.01%), demonstrating the exceptional effectiveness of high-intensity comprehensive measures in suppressing historical deformation patterns and maintaining long-term surface stability.
Figure 7.
Analysis of land subsidence control zoning and deformation patterns in Shanghai: (a) Spatial distribution of subsidence control levels in the study area; (b,c) Quantitative and Proportional distribution of five deformation trend categories across different control levels; (d,e) Quantitative and Proportional distribution of ten deformation rate intervals across different control levels; Orange color gradients from dark to light represent Major Prevention Zone (1), Major Prevention Zone (2), Medium Prevention Zone, and General Prevention Zone, respectively.
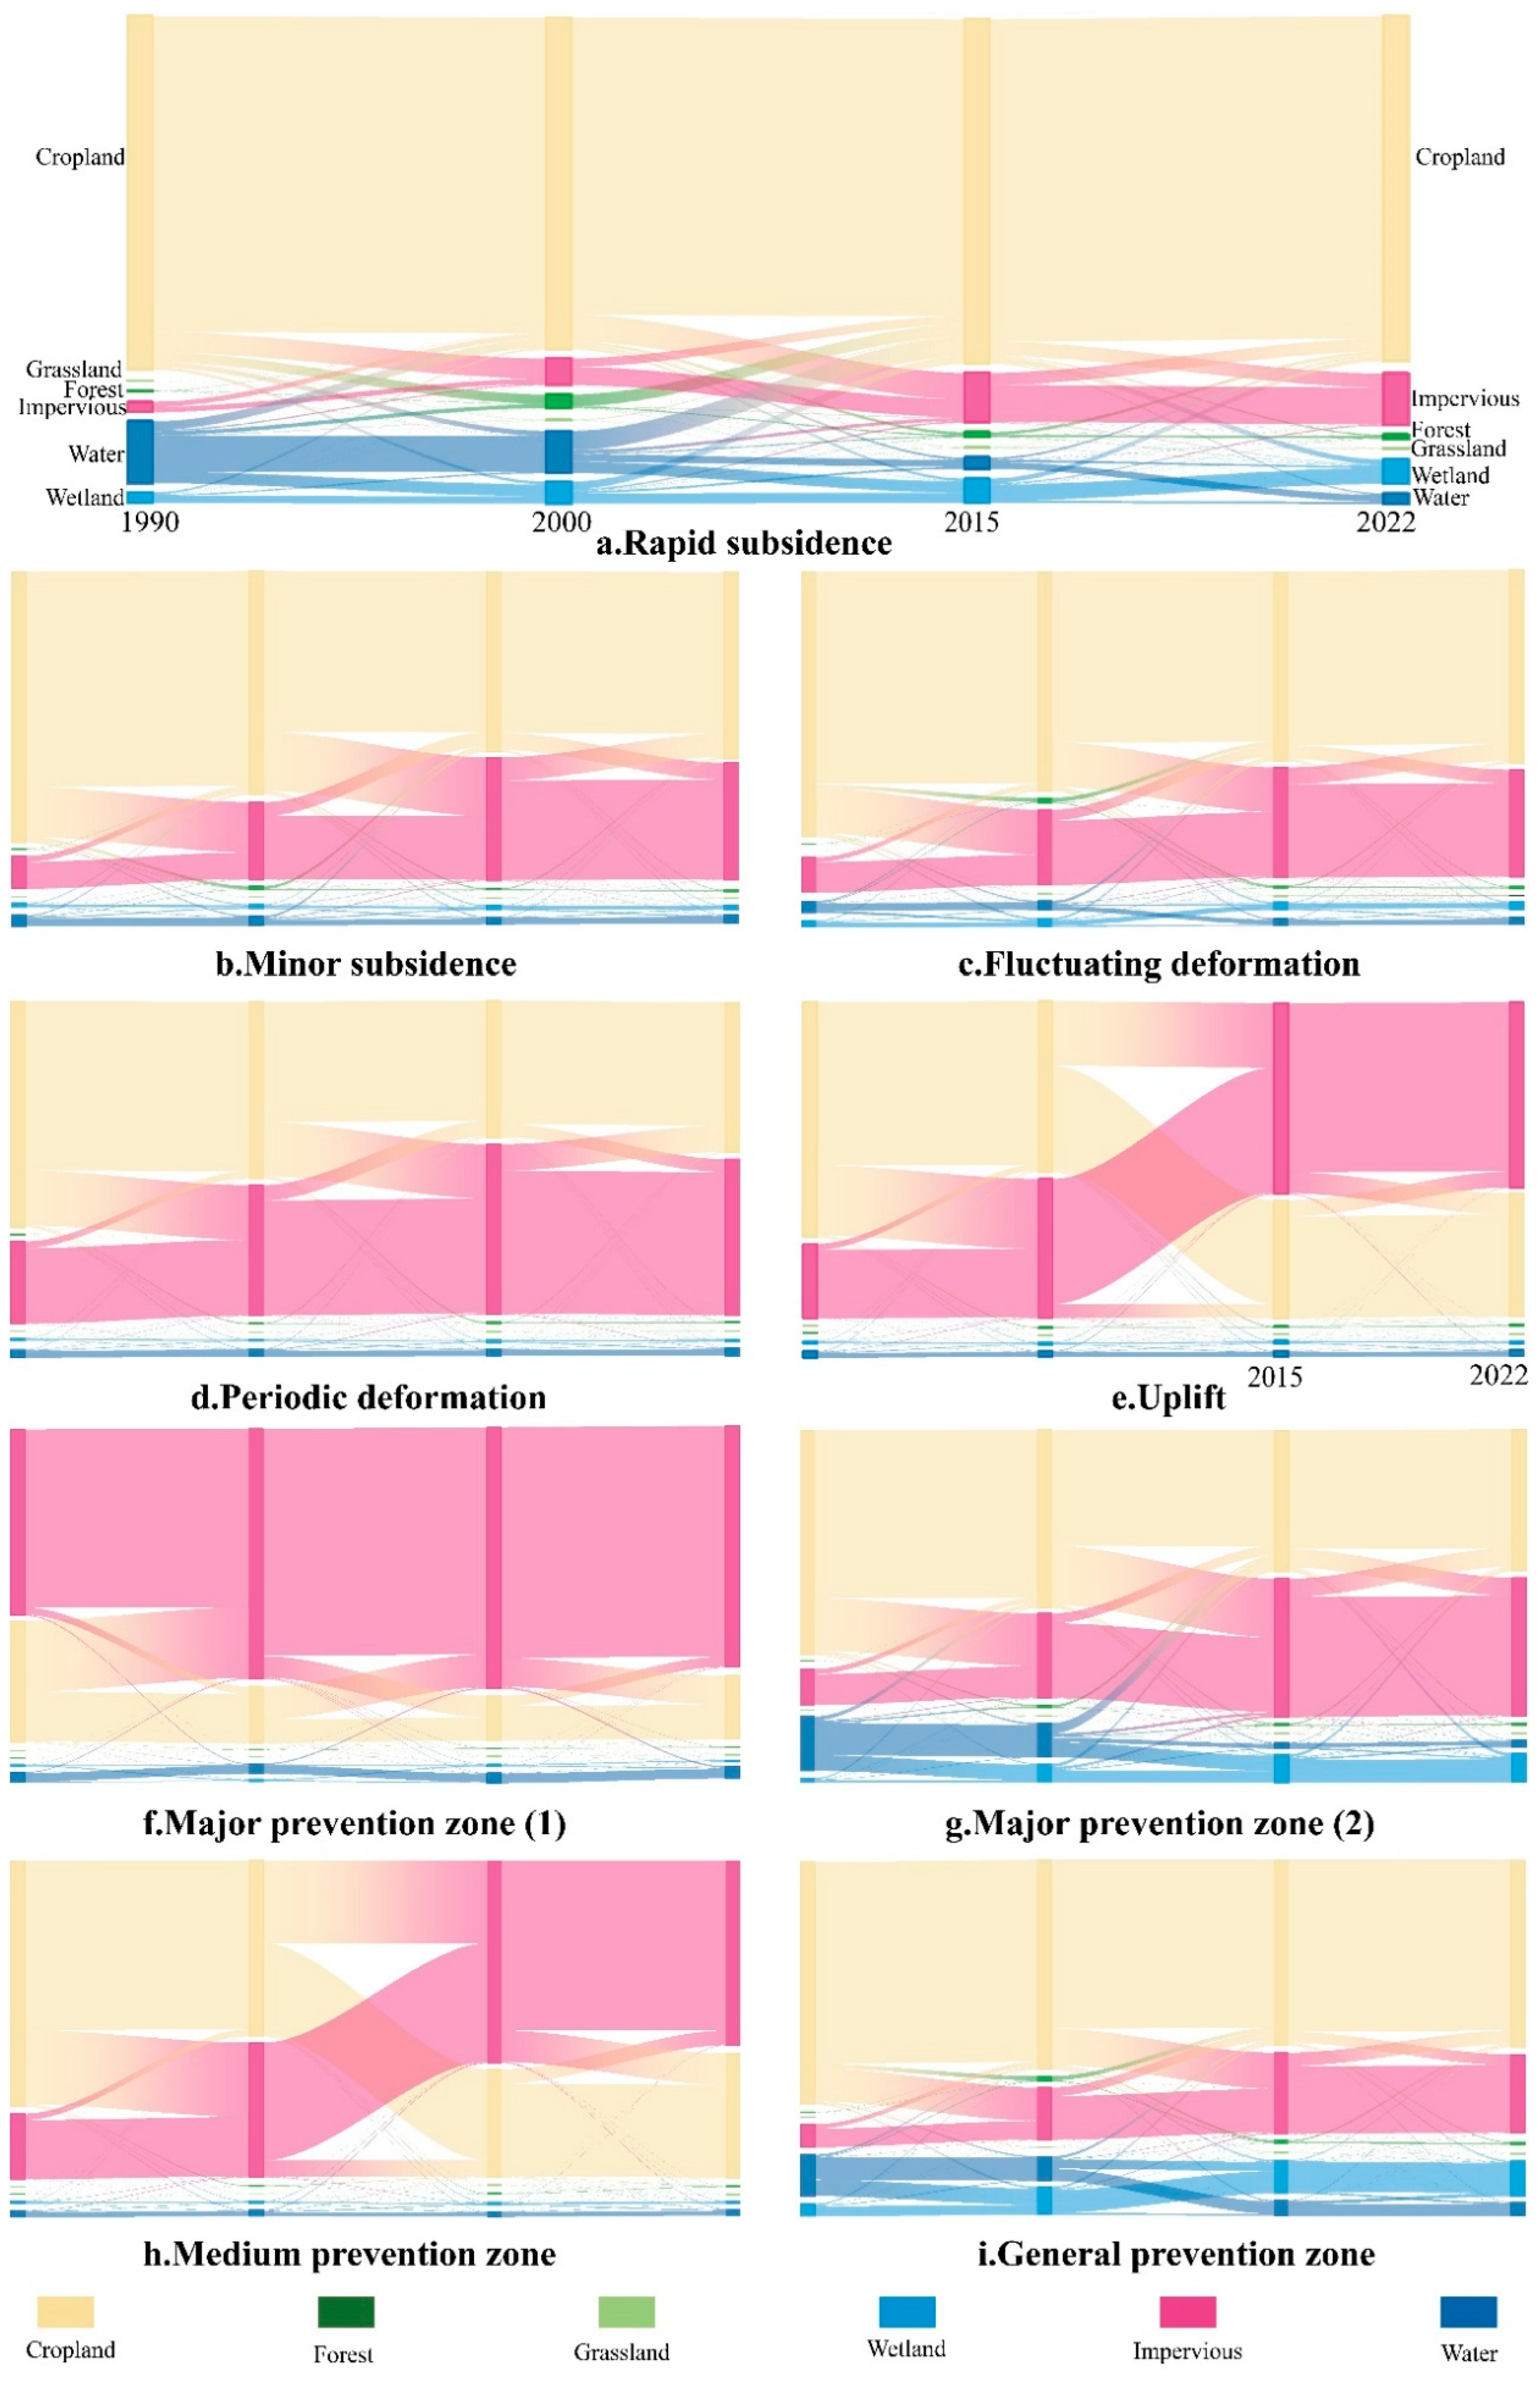
This optimal subsidence control achievement stems not only from top-down strict regulations but also integrates with the zone’s bottom-up, highly mature, and stable land use background. Macroscopically, Major Prevention Zone (1) exhibits extreme stability in its built environment (Figure 8f). During 2000–2015 and 2015–2022, unchanged impervious surface areas reached 41,582.47 and 53,833.66 hectares, respectively, indicating complete consolidation of the urban fabric and the virtual elimination of large-scale new loading disturbances. Concurrently, cropland-to-impervious conversions plummeted from 16,567.81 hectares (1990–2000) to 2411.15 hectares (2015–2022), marking a definitive transition from expansion-driven development to a stock optimization model characterized by conversions from impervious surfaces to green spaces/cropland.
Figure 8.
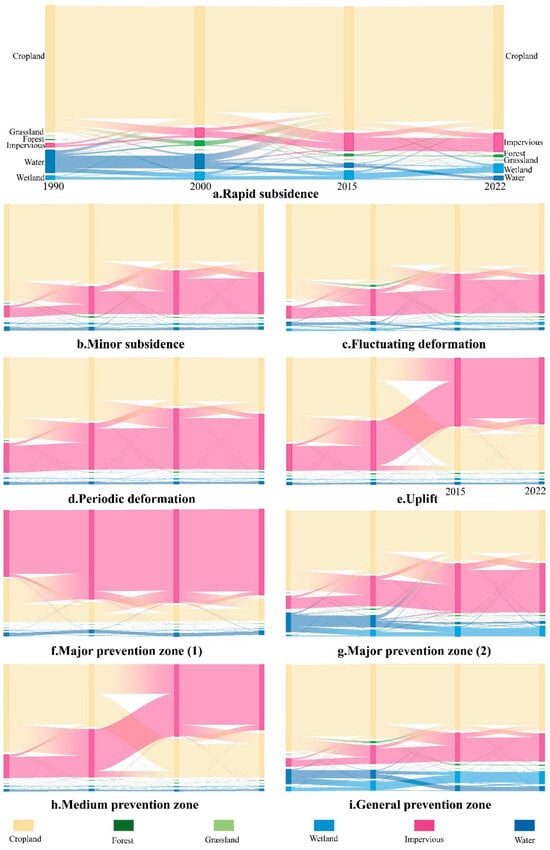
Sankey diagrams illustrating land-use transitions across four phases (1990, 2000, 2015, 2022) for areas corresponding to the five deformation trend patterns (a–e) and the four present prevention zones (f–i).
This highly stable macro-environment creates ideal conditions for subsidence control policies. Periodic deformation, as the predominant trend, reveals the source of stability through its corresponding land use transitions (Figure 8d) at the micro-mechanism level. This pattern is fundamentally characterized by high internal stability of impervious surfaces coupled with minor adjustments in ecological land, reflecting the region’s transition from large-scale development to mild disturbance processes such as hydrological regulation, ecological restoration, and landscape optimization.
Therefore, the stability of Major Prevention Zone (1) can be interpreted as “the synergistic effect produced by implementing the strictest subsidence control policies within the most mature urban built environment.” Stringent engineering controls and groundwater restrictions achieve maximum effectiveness in an area where land use patterns are already highly stable and large-scale construction activities have essentially ceased.
5.2. Policy Intervention: Uplift-Dominant Response in Expansion Zones
As a key region for Shanghai’s urban spatial expansion and strategic functional development, Major Prevention Zone (2) (covering northern Minhang District and Pudong New Area) exhibits complex deformation characteristics characterized by “coexisting uplift and subsidence with high overall activity.” Deformation monitoring data reveal significantly weaker stability compared to Major Prevention Zone (1), with the cumulative proportion within −4 to 4 mm/year reaching 62.67% (Figure 7d,e). Regarding deformation patterns, benign patterns account for 62.08%, but are dominated by uplift patterns (52.18%), which we interpret as a direct result of proactive subsidence control measures (e.g., artificial recharge), while rapid deformation patterns represent 6.39% (primarily concentrated along riverine and coastal zones) (Figure 4 and Figure 7b,c). The reasons for this complex pattern, particularly the dominant uplift, are elaborated below.
This complex pattern of “uplift dominance alongside subsidence hotspots” directly results from the combined effects of high-intensity, unconventional land development associated with Shanghai’s strategic expansion zone and proactive, large-scale subsidence control measures. From a land use perspective (Figure 8g), the area underwent sustained, massive urbanization expansion during 1990–2015: cropland-to-impervious surface conversions reached 25,495.19 hectares (1990–2000) and further increased to 28,495.51 hectares (2000–2015), establishing the physical foundation for Pudong’s rapid development. Simultaneously, large-scale transformations between water bodies and wetlands (e.g., 1990 Water→2000 Wetland reaching 7576 hectares) reflect extensive tidal flat reclamation and land creation activities.
Against this high-intensity development background, land use transitions corresponding to uplift patterns (Figure 8e) reveal the key mechanism whereby “active intervention counteracts natural subsidence.” The land cover associated with this deformation trend demonstrated significantly enhanced stability within existing impervious surfaces alongside active ecological land conversions during 2015–2022, indicating a transition toward “stock optimization and ecological enhancement.” Throughout this land use transformation, targeted proactive subsidence control measures (e.g., large-scale groundwater recharge, land reclamation with foundation stabilization) were implemented simultaneously. These measures effectively increased aquifer pressure and improved foundation soil properties, thereby not only offsetting potential natural subsidence from historical intensive development but also actively shaping an uplift-dominated deformation pattern overall.
Therefore, the unique deformation pattern in Major Prevention Zone (2) can be precisely interpreted as “the outcome of interplay between high-intensity development loading effects and stronger artificial uplift intervention.” Widespread uplift is not a natural phenomenon but a direct manifestation of active, large-scale subsidence control engineering; meanwhile, the localized rapid subsidence patches reveal disparities in engineering activities during intensive development and limitations of local control measures. This confirms the significant effectiveness of proactive subsidence control policies in strategic new areas, while also highlighting that deformation management in rapidly transforming regions requires particular attention to the cumulative impacts and long-term effects of diverse engineering activities to achieve more refined control.
5.3. Partial Policy Efficacy: Equilibrium and Residual Risks in Medium Prevention Zones
Functioning as a transitional zone connecting core and peripheral areas, the Medium Prevention Zone (covering southern Minhang District, Baoshan District, and Jiading District) exhibits intermediate levels of development intensity and management control. The subsidence pattern features “overall stability with localized pressure.” The stable deformation range (−2 to 2 mm/year) accounts for 52.37% of the area, and the cumulative proportion within −4 to 4 mm/year reaches 79.26% (Figure 7d,e). Rapid subsidence (<−8 mm/year) represents only 1.56%, and benign patterns (periodic deformation + uplift) account for 62.57% (Figure 7b,c), reflecting the overall effectiveness of medium-intensity control at the regional scale.
The formation of this pattern is closely related to the zone’s functional role as a primary reception area for population and industrial decentralization from the central urban core, along with its specific land use background. From a land use transition perspective (Figure 8h), the area maintained consistently high cropland-to-impervious conversions during 1990–2015 (1990–2000: 26,030.13 hectares; 2000–2015: 29,057.20 hectares), indicating sustained urbanization activity. Concurrently, internal stability of impervious surfaces improved, with unchanged areas increasing from 20,819.83 hectares (1990–2000) to 59,458.00 hectares (2015–2022), demonstrating progressive consolidation of urban fabric. This coexistence of “continuous expansion” and “basal solidification” directly shapes the dual subsidence characteristics: medium-intensity control effectively suppresses severe subsidence but struggles to completely eliminate chronic deformation risks accumulated from low-speed urbanization.
Internal variations within this macro-context are further elucidated by comparing two dominant deformation patterns: Deformation patterns in Baoshan and Jiading Districts closely resemble those in Major Prevention Zone (1), dominated by periodic deformation, with extremely high impervious surface stability (Figure 8d), indicating entry into a “stock optimization” phase. In contrast, the southern Minhang District, as an urban expansion frontier, is primarily characterized by minor subsidence. Corresponding land use transitions (Figure 8b) exhibit “persistent but non-intensive” development features: cropland-to-impervious conversions continued during 2015–2022, while internal impervious stability remained significantly lower than in Baoshan and Jiading. This indicates that ongoing low-intensity development activities are the dominant factor driving chronic subsidence in this subzone.
Therefore, the deformation pattern in the Medium Prevention Zone can be interpreted as “the outcome of combined effects between medium-intensity control policies and differentiated development stages.” Current policies demonstrate significant effectiveness in relatively mature areas like Baoshan and Jiading, but prove insufficient in rapidly developing the southern Minhang District.
5.4. Policy Inadequacy: High-Risk Deformation in Peripheral Areas
The General Prevention Zone is the peripheral component of Shanghai’s subsidence control system. It encompasses Qingpu, Songjiang, Jinshan, Fengxian, and Chongming Island, and features an unstable state of “high risk and high dynamism.” This zone has the most significant deformation, complex patterns, and prominent risks in Shanghai. Monitoring data reveal highly active surface movement with weak stability: the cumulative proportion within the −4 to 4 mm/year range is 49.65%, significantly lower than other control zones (Figure 7d,e). Two issues are clear. First, rapid subsidence occurs in historical agricultural pumping areas, new industrial parks, and coastal zones, with <−8 mm/year accounting for 14.18% and −8 to −4 mm/year reaching 33.88%. Second, localized ecological restoration and groundwater recharge projects cause uplift, with >2 mm/year representing 15.10%. Regarding deformation trend stability, benign patterns account for merely 29.73%, while rapid deformation patterns reach 9.84% and fluctuating deformation patterns dominate at 39.57% (Figure 7b,c), highlighting the high dynamism and unpredictability of deformation patterns.
This high-risk pattern stems from the zone’s multifunctional role as Shanghai’s future strategic space. This role, encompassing ecological conservation, agriculture, and new town construction, results in intensive and diversified land use activities. From a land use perspective (Figure 8i), the most distinctive characteristic of the General Prevention Zone is the coexistence of continuous large-scale land development and intense ecological disturbances. During 1990–2015, cropland-to-impervious surface conversions remained consistently high (1990–2000: 54,705.41 hectares; 2000–2015: 59,047.36 hectares), while large-scale transformations occurred between water bodies and wetlands (e.g., 1990 Water→ 2000 Wetland reaching 26,890.88 hectares), reflecting intense interactions between human activities (e.g., reclamation, tidal flat modifications) and natural processes. This “radical restructuring” land use model is the fundamental cause of the overall activity and instability in regional deformation.
Against this macro-background, the multiple rapid subsidence funnels observed within the General Prevention Zone (Figure 4 and Figure 5) correspond to land use patterns (Figure 8a) with distinct characteristics. This pattern features “sustained high-intensity conversion of cropland to impervious surfaces.” Throughout the study period, cropland remained the dominant land use type while continuously being transformed into impervious surfaces. Concurrently, large-scale conversions from water bodies to wetlands and cropland reclamation activities were highly active. Analysis indicates that the formation of rapid subsidence funnels results from the combined effects of foundational instability legacy from early extensive reclamation and ongoing low-to-medium intensity urban development.
Dominant deformation patterns across subregions further reveal risk diversity. Areas such as Qingpu and Songjiang are primarily characterized by minor subsidence, resembling patterns observed in the southern Minhang District, manifesting as continuous but low-speed urban expansion—a typical response to functional decentralization from the central urban core. Coastal areas like Jinshan and Fengxian are dominated by fluctuating deformation, emerging as the most prominent characteristic within this zone. Their land use transitions (Figure 8c) exhibit extreme dynamism, incorporating both large-scale urbanization and recent ecological restoration initiatives, including “impervious surface reduction.” This “intense and recurrent” land use disturbance, encompassing engineering-related loading/unloading, deep foundation pit dewatering/recharge, and water level adjustments during ecological restoration, directly causes nonlinear, highly fluctuating ground deformation, significantly complicating subsidence prediction and control. Chongming Island presents particularly complex conditions with notable internal differentiation. Its central region exhibits predominantly benign deformation patterns with relatively stable land use, whereas the southeastern coastal belt is densely concentrated with fluctuating deformation and rapid subsidence. This profoundly demonstrates that in ecologically sensitive areas, large-scale coastal engineering, reclamation activities, and ecological restoration projects exert strong and differentiated disturbances on subsurface strata, making local deformation risks particularly prominent.
Therefore, the deformation crisis in the General Prevention Zone can be interpreted as “systemic instability caused by limited control capacity struggling to cope with complex, intensive, and diversified land use impacts.” Facing multiple stressors, including historical legacy issues, new development pressures, and ecological conservation/restoration demands, conventional homogeneous control strategies have proven clearly inadequate [32].
5.5. Policy Optimization: Strategic Implications for Precision Governance
Based on the systematic analysis of four subsidence control zones presented earlier, this study reveals the core mechanism underlying the effectiveness of Shanghai’s subsidence control measures: policy effectiveness highly depends on precise alignment with regional “land use background” and “development stage.” However, current static control models have demonstrated limitations when addressing complex urban systems, necessitating a transition toward a new paradigm of dynamic and precision-oriented governance [45].
The case of Major Prevention Zone (1) (core area) demonstrates that while high-intensity control achieves significant results in mature built-up areas, its particularity lies in the fact that even minor subsidence magnitudes can produce amplified effects in densely populated and economically intensive zones. Therefore, satisfaction with current “overall stability” is insufficient; future strategies should upgrade from “preventing noticeable subsidence” to “pursuing ultimate stability.” We recommend establishing a linkage approval mechanism between subsidence risk early warning and urban renewal projects, integrating micro-deformation monitoring data as a prerequisite for major project planning. Simultaneously, optimizing the spatiotemporal distribution of groundwater recharge engineering can proactively maintain and consolidate the stability of deep strata. In contrast, the unique deformation pattern in Major Prevention Zone (2) (strategic expansion zone) reveals that although proactive interventions can shape uplift patterns, they may also mask long-term risks associated with special geological units such as land reclamation areas. Subsidence in these areas exhibits concealment and hysteresis, requiring enhanced long-term specialized monitoring and mechanistic research to avoid overlooking local instability risks due to favorable overall patterns.
Further analysis indicates that beneath the “overall stability” appearance of the Medium Prevention Zone, significant internal differentiation exists. The distinct characteristics between relatively mature areas (e.g., Baoshan, Jiading) and actively developing areas (e.g., southern Minhang) necessitate the implementation of precision control based on subzoning and classification. Strengthening subsidence monitoring during transition processes in stock optimization areas, while improving prevention standards in newly developed areas in continuously expanding regions, enables differentiated management. The “high-risk, high-dynamism” situation in the General Prevention Zone (peripheral area) indicates that homogeneous control yields limited effectiveness in this region. Facing superimposed multiple disturbances, adopting differentiated strategies guided by causation is essential, prioritizing the improvement of monitoring networks and formulating targeted measures for various disturbance sources such as historical pumping zones, new development areas, and ecological restoration sites [46,47].
In summary, Shanghai’s subsidence governance requires breaking through traditional “zonal control” thinking to establish a precision governance system based on risk levels. The core of this system lies in: accurately identifying the dominant subsidence mechanisms in each region through multi-source data integration [48]; formulating differentiated prevention standards according to risk levels; and establishing dynamic adjustment mechanisms to transition from passive response to active prevention and control [31,32].
6. Conclusions
Based on Sentinel-1 SAR satellite observations from 2015–2024, this study employed the Small Baseline Subset Interferometric Synthetic Aperture Radar (SBAS-InSAR) technique to derive high-precision, long-term ground deformation fields across Shanghai. A Multilayer Perceptron (MLP) model was subsequently implemented to achieve intelligent classification of complex deformation patterns. By further integrating multi-temporal land use data, we systematically analyzed the spatiotemporal coupling relationships between land cover changes and subsidence patterns, thereby constructing a multidimensional evidence framework to comprehensively evaluate the effectiveness of Shanghai’s land subsidence control policies over the past decade.
The results demonstrate that the stratified subsidence control policy has achieved significant outcomes, exhibiting spatial differentiation characteristics consistent with varying management intensities. Specifically, Major Prevention Zone (1) (central urban area) showed the most prominent performance, with 79.26% of the area within the stable deformation range (±4 mm/year) and 72.03% exhibiting benign patterns (periodic fluctuation and uplift). Major Prevention Zone (2) (Pudong New Area) had 62.67% stable deformation and 62.08% benign patterns, characterized by a response dominated by large-scale uplift. The Medium Prevention Zone achieved 79.26% stable deformation and 62.57% benign patterns, indicating overall stable characteristics. In contrast, the General Prevention Zone displayed only 49.65% stable deformation and 29.73% benign patterns, highlighting significant subsidence risks and underscoring the need for enhanced targeted management.
Further analysis revealed significant spatial coupling between the five deformation trend categories and specific historical land use transitions. Rapid subsidence areas were predominantly concentrated in historical reclamation zones and regions experiencing intensive conversion from cropland to impervious surfaces. Minor subsidence areas were closely associated with urban expansion belts undergoing continuous, low-to-medium intensity development. Fluctuating deformation areas primarily responded to the alternating effects of intensive engineering disturbances and ecological restoration efforts. Periodic deformation was consistently observed in highly mature built-up areas with stabilized impervious surfaces. Uplift patterns were mainly distributed in strategic new zones where active regulatory measures, such as groundwater recharge, were implemented.
Methodologically, to overcome the limitations of conventional InSAR monitoring, which primarily focuses on deformation velocity and often fails to capture nonlinear temporal characteristics, the introduced MLP deep learning model facilitated a paradigm shift from “velocity observation” to “pattern recognition.” The model efficiently processed massive time-series deformation data, automatically identifying five characteristic deformation patterns with an overall classification accuracy of 97.17%, thereby providing a robust methodological foundation for the precise identification of complex deformation patterns.
In summary, this study, through a multidimensional evidence framework, not only provides comprehensive scientific validation for the effectiveness of Shanghai’s subsidence control policies but also systematically elucidates the intrinsic relationships between ground deformation and land use evolution. The findings offer valuable insights for enhancing urban safety management in Shanghai, while the established research framework and methodology can serve as a valuable reference for other coastal megacities worldwide confronting similar subsidence challenges. It should be noted that the analysis of driving mechanisms in this study is primarily based on spatiotemporal correlations; future integration of detailed hydrogeological field measurements will further strengthen causal inferences.
Author Contributions
Conceptualization, W.L. and C.W.; methodology, W.L., H.H. and X.Z.; validation, S.W., C.Z., H.H., M.L. and J.W.; formal analysis, W.L., S.W., C.Z., H.H., M.L. and J.W.; investigation, W.L., S.W., C.Z., H.H., X.Z., M.L. and J.W.; resources, C.W.; data curation, W.L.; writing—original draft preparation, W.L., S.W., C.Z., H.H. and C.W.; writing—review and editing, S.W., C.Z., H.H., X.Z. and C.W.; visualization, W.L., S.W., C.Z., H.H., M.L. and J.W.; supervision, X.Z.; project administration, C.W.; funding acquisition, C.W. All authors have read and agreed to the published version of the manuscript.
Funding
This research was funded by the National Natural Science Foundation of China [42374018; 42304012; W2521147], the Guangdong Basic and Applied Basic Research Foundation [2025B1515020092], the Shenzhen Science and Technology Program [KCXFZ20240903093000002].
Data Availability Statement
The original contributions presented in the study are included in the article; further inquiries can be directed to the corresponding author.
Acknowledgments
The authors gratefully acknowledge the support from the Ministry of Natural Resources (MNR) Key Laboratory for Geo-Environmental Monitoring of Great Bay Area and the Guangdong Key Laboratory of Urban Informatics at Shenzhen University. We also extend our sincere thanks to the editors and anonymous reviewers for their constructive comments, which greatly helped in improving the manuscript. Additionally, we thank our colleagues for their insightful discussions and technical assistance throughout this research.
Conflicts of Interest
Meng Lian and Jian Wang were employed by the Shenzhen Expway Co., Ltd. The remaining authors—Wanting Li, Shuaiying Wu, Chuanhua Zhu, Huawei Hou, Xu Zhang and Chisheng Wang—declare that the research was conducted in the absence of any commercial or financial relationships that could be construed as a potential conflict of interest.
References
- Bagheri-Gavkosh, M.; Hosseini, S.M.; Ataie-Ashtiani, B.; Sohani, Y.; Ebrahimian, H.; Morovat, F.; Ashrafi, S. Land subsidence: A global challenge. Sci. Total. Environ. 2021, 778, 146193. [Google Scholar] [CrossRef] [Scilit] [PubMed]
- Shirzaei, M.; Freymueller, J.; Törnqvist, T.E.; Galloway, D.L.; Dura, T.; Minderhoud, P.S.J. Measuring, modelling and projecting coastal land subsidence. Nat. Rev. Earth Environ. 2021, 2, 40–58. [Google Scholar] [CrossRef] [Scilit]
- Ye, S.; Xue, Y.; Wu, J.; Yan, X.; Yu, J. Progression and mitigation of land subsidence in China. Hydrogeol. J. 2016, 24, 685–693. [Google Scholar] [CrossRef] [Scilit]
- Xu, Y.-S.; Shen, S.-L.; Ren, D.-J.; Wu, H.-N. Analysis of Factors in Land Subsidence in Shanghai: A View Based on a Strategic Environmental Assessment. Sustainability 2016, 8, 573. [Google Scholar] [CrossRef] [Scilit]
- Hauer, M.E.; Hardy, D.; Kulp, S.A.; Mueller, V.; Wrathall, D.J.; Clark, P.U. Assessing population exposure to coastal flooding due to sea level rise. Nat. Commun. 2021, 12, 6900. [Google Scholar] [CrossRef] [Scilit]
- Zhan, Y.; Zhang, Y.; Zhang, J.; Xu, J.; Chen, H.; Liu, G.; Wan, Z. Risk assessment of land subsidence in Shanghai municipality based on AHP and EWM. Sci. Rep. 2025, 15, 7339. [Google Scholar] [CrossRef] [Scilit]
- Fang, J.; Nicholls, R.J.; Brown, S.; Lincke, D.; Hinkel, J.; Vafeidis, A.T.; Du, S.; Zhao, Q.; Liu, M.; Shi, P. Benefits of subsidence control for coastal flooding in China. Nat. Commun. 2022, 13, 6946. [Google Scholar] [CrossRef] [Scilit]
- Lu, C.; Xu, H.; Yao, Q.; Liu, Q.; Bricker, J.D.; Jonkman, S.N.; Yin, J.; Wang, J. Tracking 30-year evolution of subsidence in Shanghai utilizing multi-sensor InSAR and random forest modelling. Int. J. Appl. Earth Obs. Geoinf. 2025, 140, 104606. [Google Scholar] [CrossRef] [Scilit]
- Xie, Z.-F.; Shen, S.-L.; Arulrajah, A.; Horpibulsuk, S. Environmentally sustainable groundwater control during dewatering with barriers: A case study in Shanghai. Undergr. Space 2021, 6, 12–23. [Google Scholar] [CrossRef] [Scilit]
- Tay, C.; Lindsey, E.O.; Chin, S.T.; McCaughey, J.W.; Bekaert, D.; Nguyen, M.; Hua, H.; Manipon, G.; Karim, M.; Horton, B.P.; et al. Sea-level rise from land subsidence in major coastal cities. Nat. Sustain. 2022, 5, 1049–1057. [Google Scholar] [CrossRef] [Scilit]
- Ohenhen, L.O.; Shirzaei, M.; Ojha, C.; Sherpa, S.F.; Nicholls, R.J. Disappearing cities on US coasts. Nature 2024, 627, 108–115. [Google Scholar] [CrossRef] [Scilit]
- Shan, X.; Aerts, J.C.J.H.; Wang, J.; Yin, J.; Lin, N.; Wright, N.; Li, M.; Yang, Y.; Wen, J.; Qiu, F.; et al. Dynamic flood adaptation pathways for Shanghai under deep uncertainty. npj Nat. Hazards 2025, 2, 21. [Google Scholar] [CrossRef] [Scilit]
- Gregory, J.M.; Griffies, S.M.; Hughes, C.W.; Lowe, J.A.; Church, J.A.; Fukimori, I.; Gomez, N.; Kopp, R.E.; Landerer, F.; Le Cozannet, G.; et al. Concepts and Terminology for Sea Level: Mean, Variability and Change, Both Local and Global. Surv. Geophys. 2019, 40, 1251–1289. [Google Scholar] [CrossRef] [Scilit]
- Qu, F.; Lu, Z.; Kim, J.; Turco, M.J. Mapping and characterizing land deformation during 2007–2011 over the Gulf Coast by L-band InSAR. Remote Sens. Environ. 2023, 284, 113342. [Google Scholar] [CrossRef] [Scilit]
- Chaussard, E.; Wdowinski, S.; Cabral-Cano, E.; Amelung, F. Land subsidence in central Mexico detected by ALOS InSAR time-series. Remote Sens. Environ. 2014, 140, 94–106. [Google Scholar] [CrossRef] [Scilit]
- Wang, C.; Chang, L.; Wang, X.S.; Zhang, B.; Stein, A. Interferometric Synthetic Aperture Radar Statistical Inference in Deformation Measurement and Geophysical Inversion: A review. IEEE Geosci. Remote Sens. Mag. 2024, 12, 8–35. [Google Scholar] [CrossRef] [Scilit]
- Wang, C.; Wei, M.; Qin, X.; Li, T.; Chen, S.; Zhu, C.; Liu, P.; Chang, L. Three-dimensional lookup table for more precise SAR scatterers positioning in urban scenarios. ISPRS J. Photogramm. Remote Sens. 2024, 209, 133–149. [Google Scholar] [CrossRef] [Scilit]
- Hooper, A.; Bekaert, D.; Spaans, K.; Arıkan, M. Recent advances in SAR interferometry time series analysis for measuring crustal deformation. Tectonophysics 2012, 514, 1–13. [Google Scholar] [CrossRef] [Scilit]
- Berardino, P.; Fornaro, G.; Lanari, R.; Sansosti, E. A new algorithm for surface deformation monitoring based on small baseline differential SAR interferograms. IEEE Trans. Geosci. Remote Sens. 2002, 40, 2375–2383. [Google Scholar] [CrossRef] [Scilit]
- Ren, T.; Gong, W.; Gao, L.; Zhao, F. Understanding land subsidence in the Pearl River Delta region of China based on InSAR observations. Eng. Geol. 2024, 339, 107646. [Google Scholar] [CrossRef] [Scilit]
- Wu, P.; Wei, M.; D’Hondt, S. Subsidence in Coastal Cities Throughout the World Observed by InSAR. Geophys. Res. Lett. 2022, 49, e2022GL098477. [Google Scholar] [CrossRef] [Scilit]
- Cigna, F.; Tapete, D. Present-day land subsidence rates, surface faulting hazard and risk in Mexico City with 2014–2020 Sentinel-1 IW InSAR. Remote Sens. Environ. 2021, 253, 112161. [Google Scholar] [CrossRef] [Scilit]
- Haghighi, M.H.; Motagh, M. Ground surface response to continuous compaction of aquifer system in Tehran, Iran: Results from a long-term multi-sensor InSAR analysis. Remote Sens. Environ. 2019, 221, 534–550. [Google Scholar] [CrossRef] [Scilit]
- Herrera-García, G.; Ezquerro, P.; Tomás, R.; Béjar-Pizarro, M.; López-Vinielles, J.; Rossi, M.; Mateos, R.M.; Carreón-Freyre, D.; Lambert, J.; Teatini, P.; et al. Mapping the global threat of land subsidence. Science 2021, 371, 34–36. [Google Scholar] [CrossRef] [Scilit] [PubMed]
- Brown, S.; Nicholls, R. Subsidence and human influences in mega deltas: The case of the Ganges–Brahmaputra–Meghna. Sci. Total. Environ. 2015, 527, 362–374. [Google Scholar] [CrossRef] [Scilit]
- Ao, Z.; Hu, X.; Tao, S.; Hu, X.; Wang, G.; Li, M.; Wang, F.; Hu, L.; Liang, X.; Xiao, J.; et al. A national-scale assessment of land subsidence in China’s major cities. Science 2024, 384, 301–306. [Google Scholar] [CrossRef] [Scilit] [PubMed]
- Chen, G.; Lu, H.; Di, D.; Li, L.; Emam, M.; Jing, W. StfMLP: Spatiotemporal Fusion Multilayer Perceptron for Remote-Sensing Images. IEEE Geosci. Remote Sens. Lett. 2022, 20, 1–5. [Google Scholar] [CrossRef] [Scilit]
- Gardner, M.W.; Dorling, S.R. Artificial neural networks (the multilayer perceptron)—A review of applications in the atmospheric sciences. Atmos. Environ. 1998, 32, 2627–2636. [Google Scholar] [CrossRef] [Scilit]
- Lai, S.; Lin, J.; Dong, J.; Wu, J.; Huang, X.; Liao, M. Investigating overlapping deformation patterns of the Beijing Plain by independent component analysis of InSAR observations. Int. J. Appl. Earth Obs. Geoinf. 2024, 135, 104279. [Google Scholar] [CrossRef] [Scilit]
- Zhong, W.; Chu, T.; Tissot, P.; Wu, Z.; Chen, J.; Zhang, H. Integrated coastal subsidence analysis using InSAR, LiDAR, and land cover data. Remote Sens. Environ. 2022, 282, 113297. [Google Scholar] [CrossRef] [Scilit]
- Magnan, A.K.; Bell, R.; Duvat, V.K.E.; Ford, J.D.; Garschagen, M.; Haasnoot, M.; Lacambra, C.; Losada, I.J.; Mach, K.J.; Noblet, M.; et al. Status of global coastal adaptation. Nat. Clim. Change 2023, 13, 1213–1221. [Google Scholar] [CrossRef] [Scilit]
- IPCC. Climate Change 2022: Mitigation of Climate Change; Contribution of Working Group III to the Sixth Assessment Report of the Intergovernmental Panel on Climate Change: Cambridge, UK; New York, NY, USA, 2022. [Google Scholar]
- Peng, M.; Lu, Z.; Zhao, C.; Motagh, M.; Bai, L.; Conway, B.D.; Chen, H. Mapping land subsidence and aquifer system properties of the Willcox Basin, Arizona, from InSAR observations and independent component analysis. Remote Sens. Environ. 2022, 271, 112894. [Google Scholar] [CrossRef] [Scilit]
- Li, M.-G.; Chen, J.-J.; Xu, Y.-S.; Tong, D.-G.; Cao, W.-W.; Shi, Y.-J. Effects of groundwater exploitation and recharge on land subsidence and infrastructure settlement patterns in Shanghai. Eng. Geol. 2021, 282, 105995. [Google Scholar] [CrossRef] [Scilit]
- Zhang, J.; Ke, C.; Shen, X.; Lin, J.; Wang, R. Monitoring Land Subsidence along the Subways in Shanghai on the Basis of Time-Series InSAR. Remote Sens. 2023, 15, 908. [Google Scholar] [CrossRef] [Scilit]
- Zhang, X.; Liu, L.; Chen, X.; Gao, Y.; Xie, S.; Mi, J. GLC_FCS30: Global land-cover product with fine classification system at 30 m using time-series Landsat imagery. Earth Syst. Sci. Data 2021, 13, 2753–2776. [Google Scholar] [CrossRef] [Scilit]
- Li, S.; Xu, W.; Li, Z. Review of the SBAS InSAR Time-series algorithms, applications, and challenges. Geodesy Geodyn. 2022, 13, 114–126. [Google Scholar] [CrossRef] [Scilit]
- Wang, C.; Zhu, C.; Wang, X.S.; Tu, W.; Li, Q.Q. A New Object-Oriented SAR Interferometry Framework for Monitoring Urban Deformation. IEEE Trans. Geosci. Remote Sens. 2024, 62, 5227011. [Google Scholar] [CrossRef] [Scilit]
- Cigna, F.; Tapete, D. Satellite InSAR survey of structurally-controlled land subsidence due to groundwater exploitation in the Aguascalientes Valley, Mexico. Remote Sens. Environ. 2021, 254, 112254. [Google Scholar] [CrossRef] [Scilit]
- Farr, T.G.; Rosen, P.A.; Caro, E.; Crippen, R.; Duren, R.; Hensley, S.; Kobrick, M.; Paller, M.; Rodriguez, E.; Roth, L.; et al. The Shuttle Radar Topography Mission. Rev. Geophys. 2007, 45, RG2004. [Google Scholar] [CrossRef] [Scilit]
- Costantini, M. A novel phase unwrapping method based on network programming. IEEE Trans. Geosci. Remote Sens. 1998, 36, 813–821. [Google Scholar] [CrossRef] [Scilit]
- Wang, R.; Yang, M.; Yang, T.; Lin, J.; Liao, M. Decomposing and mapping different scales of land subsidence over Shanghai with X- and C-Band SAR data stacks. Int. J. Digit. Earth 2022, 15, 478–502. [Google Scholar] [CrossRef] [Scilit]
- Calais, E.; Dong, L.; Wang, M.; Shen, Z.; Vergnolle, M. Continental deformation in Asia from a combined GPS solution. Geophys. Res. Lett. 2006, 33, L24319. [Google Scholar] [CrossRef] [Scilit]
- Zhang, B.; Liao, X.; Zhang, J.; Xiong, S.; Wang, C.; Wu, S.; Zhu, C.; Zhu, J.; Qin, X.; Li, Q. Megalopolitan-scale ground deformation along metro lines in the Guangdong-Hong Kong-Macao Greater Bay Area, China, revealed by MT-InSAR. Int. J. Appl. Earth Obs. Geoinf. 2023, 122, 103432. [Google Scholar] [CrossRef] [Scilit]
- Brown, S.; Nicholls, R.J.; Hanson, S.; Brundrit, G.; Dearing, J.A.; Dickson, M.E.; Gallop, S.L.; Gao, S.; Haigh, I.D.; Hinkel, J.; et al. Shifting perspectives on coastal impacts and adaptation. Nat. Clim. Change 2014, 4, 752–755. [Google Scholar] [CrossRef] [Scilit]
- Phi, H.L.; Hermans, L.M.; Douven, W.J.; Van Halsema, G.E.; Khan, M.F. A framework to assess plan implementation maturity with an application to flood management in Vietnam. Water Int. 2015, 40, 984–1003. [Google Scholar] [CrossRef] [Scilit]
- Islam, F.; Middelkoop, H.; Schot, P.P.; Dekker, S.C.; Griffioen, J. Enhancing effectiveness of tidal river management in southwest Bangladesh polders by improving sedimentation and shortening inundation time. J. Hydrol. 2020, 590, 125228. [Google Scholar] [CrossRef] [Scilit]
- Teng, M.; Zhang, F.; Gong, Z.; Park, J.H. Evaluating climate adaptation strategies for coastal resilience using multi-criteria decision-making framework. Mar. Pollut. Bull. 2025, 217, 118060. [Google Scholar] [CrossRef] [Scilit]

Disclaimer/Publisher’s Note: The statements, opinions and data contained in all publications are solely those of the individual author(s) and contributor(s) and not of MDPI and/or the editor(s). MDPI and/or the editor(s) disclaim responsibility for any injury to people or property resulting from any ideas, methods, instructions or products referred to in the content. |
© 2025 by the authors. Licensee MDPI, Basel, Switzerland. This article is an open access article distributed under the terms and conditions of the Creative Commons Attribution (CC BY) license (https://creativecommons.org/licenses/by/4.0/).