


Highlights
What are the main findings?
- We propose a novel approach for the rapid identification of mining subsidence basins by integrating Deformable DETR with InSAR technology, substantially improving monitoring efficiency and detection accuracy.
- A hybrid training dataset is developed to markedly reduce the model’s dependence on extensive real-world labeled samples. The resulting model demonstrates high accuracy and strong robustness in practical subsidence detection tasks within the Huainan mining area.
What are the implications of the main findings?
- This method offers an efficient and low-cost technical solution for large-scale monitoring of geological hazards such as mining-induced subsidence.
- The proposed hybrid sample construction strategy provides a valuable reference for addressing insufficient training data in deep learning-based remote sensing and geoscience applications.
Abstract
Underground coal mines are widely distributed across China, and underground mining is highly concealed. The rapid and accurate identification of the spatial distribution of coal mining subsidence over large areas is of significant importance for the reuse of land resources in mining areas and the detection of illegal mining activities. The traditional method of monitoring subsidence basins has limitations in terms of monitoring range and timeliness. The development of synthetic aperture radar (InSAR) technology has provided a valuable tool for monitoring mining subsidence areas. However, this method faces challenges in quickly and effectively monitoring subsidence basins using wide-swath SAR images. With the rapid development of deep learning and computer vision technologies, leveraging advanced deep learning models in combination with InSAR technology has become a crucial research direction to enhance the monitoring efficiency of surface subsidence in mining areas. Therefore, this paper proposes a new method for the rapid identification of mining subsidence basins in mining areas, which integrates Deformable Detection Transformer (Deformable DETR) and InSAR technology. First, the real deformation sample set of the mining area, obtained through interference processing, is combined with simulated deformation samples generated using the dynamic probability integral method, elastic transformation, and various noise synthesis techniques to construct a mixed InSAR sample set. This mixed sample set is then used to train the Deformable DETR model and compared with common deep learning methods. The experimental results show that the monitoring accuracy is significantly improved, with the model achieving a Precision of 0.926, Recall of 0.886, F1-score of 0.905, and mean Intersection over Union (mIoU) of 0.828. The detection model was applied to monitor the dynamically updated mining subsidence in the Huainan mining area from 2023 to 2024, detecting 402 subsidence basins. Further training demonstrates that the model exhibits strong robustness. Therefore, this method reduces the construction cost of the target detection training set and holds significant application potential for monitoring geological disasters in large-scale mining areas.
1. Introduction
Coal serves as a fundamental energy source and industrial raw material in China and has long played an important role in supporting economic and social development and in maintaining a secure and stable national energy supply [1,2]. However, the goaf left behind after underground coal mining is prone to causing a series of disasters and accidents [3]. For instance, after the coal seam is mined, the stress balance within each rock layer in the overlying strata is disrupted, leading to geological disasters such as surface subsidence and infrastructure damage. Once the overlying rock mass is destroyed, surface or groundwater can easily flow into the abandoned goaf through cracks. If these flows inadvertently connect under unknown conditions, they may lead to major safety accidents, such as mine water inrush and secondary surface subsidence. On the other hand, the abandoned goaf not only offers significant available space but also contains abundant resources, including water, coalbed methane, and residual coal pillars. Constructing buildings and structures atop the goaf can, to some extent, alleviate land utilization pressure. Therefore, accurately detecting the location of abandoned goafs is crucial for reducing the occurrence of related disasters and facilitating the reuse of land resources [4,5].
Due to significant differences in coal mining technology levels and the structure and properties of the overlying rock strata, the stress and damage conditions of the roof and the rock layers above are highly complex. Traditional goaf detection methods are mostly based on contact techniques, such as geophysical exploration [6,7]. Although these methods are highly accurate, their working range is limited, and they are time-consuming and labor-intensive. After a mine is closed, the absence of the coal mine management body, combined with the long closure time of some mines and the earlier extensive management model, often leads to the loss or damage of mining historical data (especially paper records), which presents significant challenges for goaf surveys. This issue is a bottleneck that hinders the reuse of abandoned goafs. Mining activities are the direct cause of surface deformation, so the distribution of surface deformation areas is closely linked to the distribution of underground goafs. If earth observation technology can be employed to accurately monitor surface deformation range information, the positional information of the goaf could, in theory, be identified.
InSAR technology is not affected by light or weather conditions and can provide all-day, all-weather Earth observation. It has been widely used in monitoring mine subsidence, landslide deformation, and earthquakes due to its low cost, high precision, and large coverage [8,9,10]. Thanks to the European Space Agency’s Sentinel-1 data collection capabilities and data openness policy, InSAR has entered the era of big data, with massive amounts of SAR data being continuously collected and archived. However, the challenge remains in quickly identifying coal mining subsidence areas from SAR images covering millions of square kilometers.
At present, there are two main methods for wide-area goaf detection. The first is the threshold segmentation method, which relies on the difference between the target and background to determine one or more thresholds for separating the two. Common methods include the coherence threshold segmentation method [11,12] and the deformation rate threshold segmentation method [13,14,15]. If the deformation gradient is large during the two imaging periods of SAR in a mining area, the coherence coefficient obtained is generally small or close to zero. Therefore, the distribution of the goaf can be identified by the coherence coefficient image. This method avoids the need for high-quality SAR data processing to some extent. However, due to the influence of rivers and other factors, continuous low-coherence regions may form in the InSAR interferogram. These low-coherence regions may not have a clear correlation with mining activities. On the other hand, mining areas experience rapid surface deformation, with deformation occurring over a relatively short time span. As a result, significant deformation areas can be clustered and identified by setting a deformation rate threshold. The threshold segmentation method often requires different thresholds for different regions due to the randomness of threshold selection. This process generally requires complete time-series InSAR processing, which is energy-intensive and usually needs to be combined with other methods for comprehensive judgment. The second method is based on machine learning. Mining subsidence typically undergoes large deformation within a short period, and its deformation shows clear temporal variation. In the InSAR interference results, a series of regular concentric circle or concentric ellipse fringes can be observed, exhibiting distinct visual characteristics. Deep learning methods can automatically learn and extract these features from a wide range of SAR images. The extracted features not only include the shape of the target but also cover more abstract and advanced information, such as color, size, position, and texture. Using this technology to achieve accurate, efficient, and automated mining subsidence identification and extraction is an important research direction, and relevant studies have been conducted in the field of coal mining subsidence detection [16,17,18,19]. However, there are still many challenges in fully exploiting the advantages of InSAR for fine-grained surface deformation monitoring and integrating these with deep learning models. For example, developing a mining subsidence basin dataset with richer morphological features remains challenging, and further improving the detection performance of deep learning models on SAR images requires in-depth research.
Therefore, this paper proposes a new method for the automatic detection of large-scale coal mining subsidence areas using deep learning and InSAR technology. First, the real deformation samples from the mining area are combined with the simulated deformation samples constructed in this paper to create a mixed InSAR sample dataset. Then, the Deformable DETR model, known for its strong small target recognition performance, is introduced to enable the rapid detection of mining subsidence basins from wide-format SAR images.
2. Recognition Model Construction
2.1. Deformable DETR
Compared to traditional target detection algorithms, deep learning demonstrates distinct advantages in detection efficiency, accuracy, and robustness [20,21]. For a long time, target detection algorithms based on CNNs have dominated the field. However, they can only capture local information from the image and cannot account for the different positional relationships across the entire image. In 2017, Vaswani et al. [22] first proposed the Transformer deep learning framework. By introducing the self-attention mechanism, the Transformer flexibly focuses on different parts of the input sample, greatly improving the model’s performance and computational efficiency. In 2020, the Facebook AI Research team proposed the DETR [23], which replaces the traditional CNN network combination by using the transformer encoder–decoder architecture and employs direct matching between the predicted and true bounding boxes to optimize the target detection process. DETR applies the Transformer to the field of target detection, becoming the first real end-to-end target detection network. However, due to its slow processing efficiency, DETR has certain limitations in practical use. In 2021, Zhu et al. [24] proposed Deformable DETR, whose attention mechanism focuses only on a small number of key detection points around the target, significantly improving the model’s target detection accuracy and training efficiency. However, in specific application scenarios, such as the target detection task for mining subsidence basins, the accuracy of the model requires further verification and improvement. The basic structure of Deformable DETR includes a backbone network, a transformer encoder, a transformer decoder, and a prediction module. The process is as follows: First, the sample data is input into the backbone network for feature extraction and the creation of multi-scale feature maps. These feature maps are then sent to the transformer encoder, along with position encoding, to obtain new feature vectors. Finally, the feature vectors are processed by the transformer decoder, and the final target category and bounding box are obtained through the prediction module.
In contrast to DETR, Deformable DETR replaces the multi-head attention module in the transformer encoder with a multi-scale deformable attention module. Additionally, it substitutes the cross-attention module in the transformer decoder with a multi-scale deformable cross-attention module, while leaving the self-attention module in the transformer decoder unchanged.
The deformable attention module uses dynamic spatial sparse sampling, focusing solely on key points near the reference point, regardless of the feature map’s spatial dimensions. Given an input feature map xl ∈ RC×H×W (where C is the number of color channels, H is the height, and W is the width of the image), which contains the query element of the content feature zq and the two-dimensional reference point pq, the calculation method for the deformable attention feature is shown in the following formula:
where m represents the index of the attention head, M denotes the total number of attention heads, k stands for the index of the sampling point, and K signifies the total number of sampling points (K ≪ H × W). Wm is the number of sampling points for each attention head, W′m is the projection matrix associated with the m-th attention head, Amqk refers to the attention weight of the k-th sampling point within the m-th attention head, and ∆pmqk is the corresponding sampling offset.
In mining subsidence identification, subsidence basins show varied shapes regarding fringe clarity, deformation gradient, and boundary regularity. The deformable attention mechanism learns the sampling parameters ∆pmqk and adaptively selects a set of key sampling locations around each reference point pq. When deformation fringes are clear with steep gradients, sampling points cluster at edges and the center; if fringes blur and boundaries are irregular, points spread over slow-deformation zones. This sparse, targeted sampling boosts responses to weak deformations and fine boundaries.
Given the input multi-feature map {xl, where xl ∈ RC×H×W, and ∈ [0, 1]2 is the normalized coordinates of the reference point, the multi-scale deformable attention feature is calculated as follows:
Here, l represents the input feature level, L denotes the total number of feature layers, Amlqk signifies the attention weight of the k-th sampling point of the m-th attention head at the l-th feature level, and ∆pmlqk is the sampling offset for the l-th feature level, the k-th sampling point, and the m-th attention head. The function ϕl () rescales the normalized coordinates and projects them onto the space of the input feature map at the l-th layer, providing accurate coordinates for subsequent sampling and calculation.
Multi-scale deformable attention relies on multi-scale feature maps, improving its capacity to handle the varied shapes of mining subsidence basins across different spatial scales. Low-resolution maps, with wide receptive fields, are good at capturing the basin’s overall concentric fringe patterns, while high-resolution maps focus on local details like blurred fringes and irregular basin edges. By adaptively adjusting attention and sampling point distributions, the model achieves a multi-scale feature representation of mining subsidence samples.
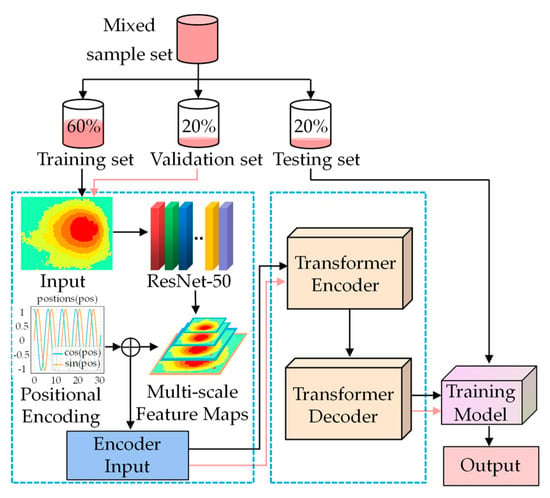
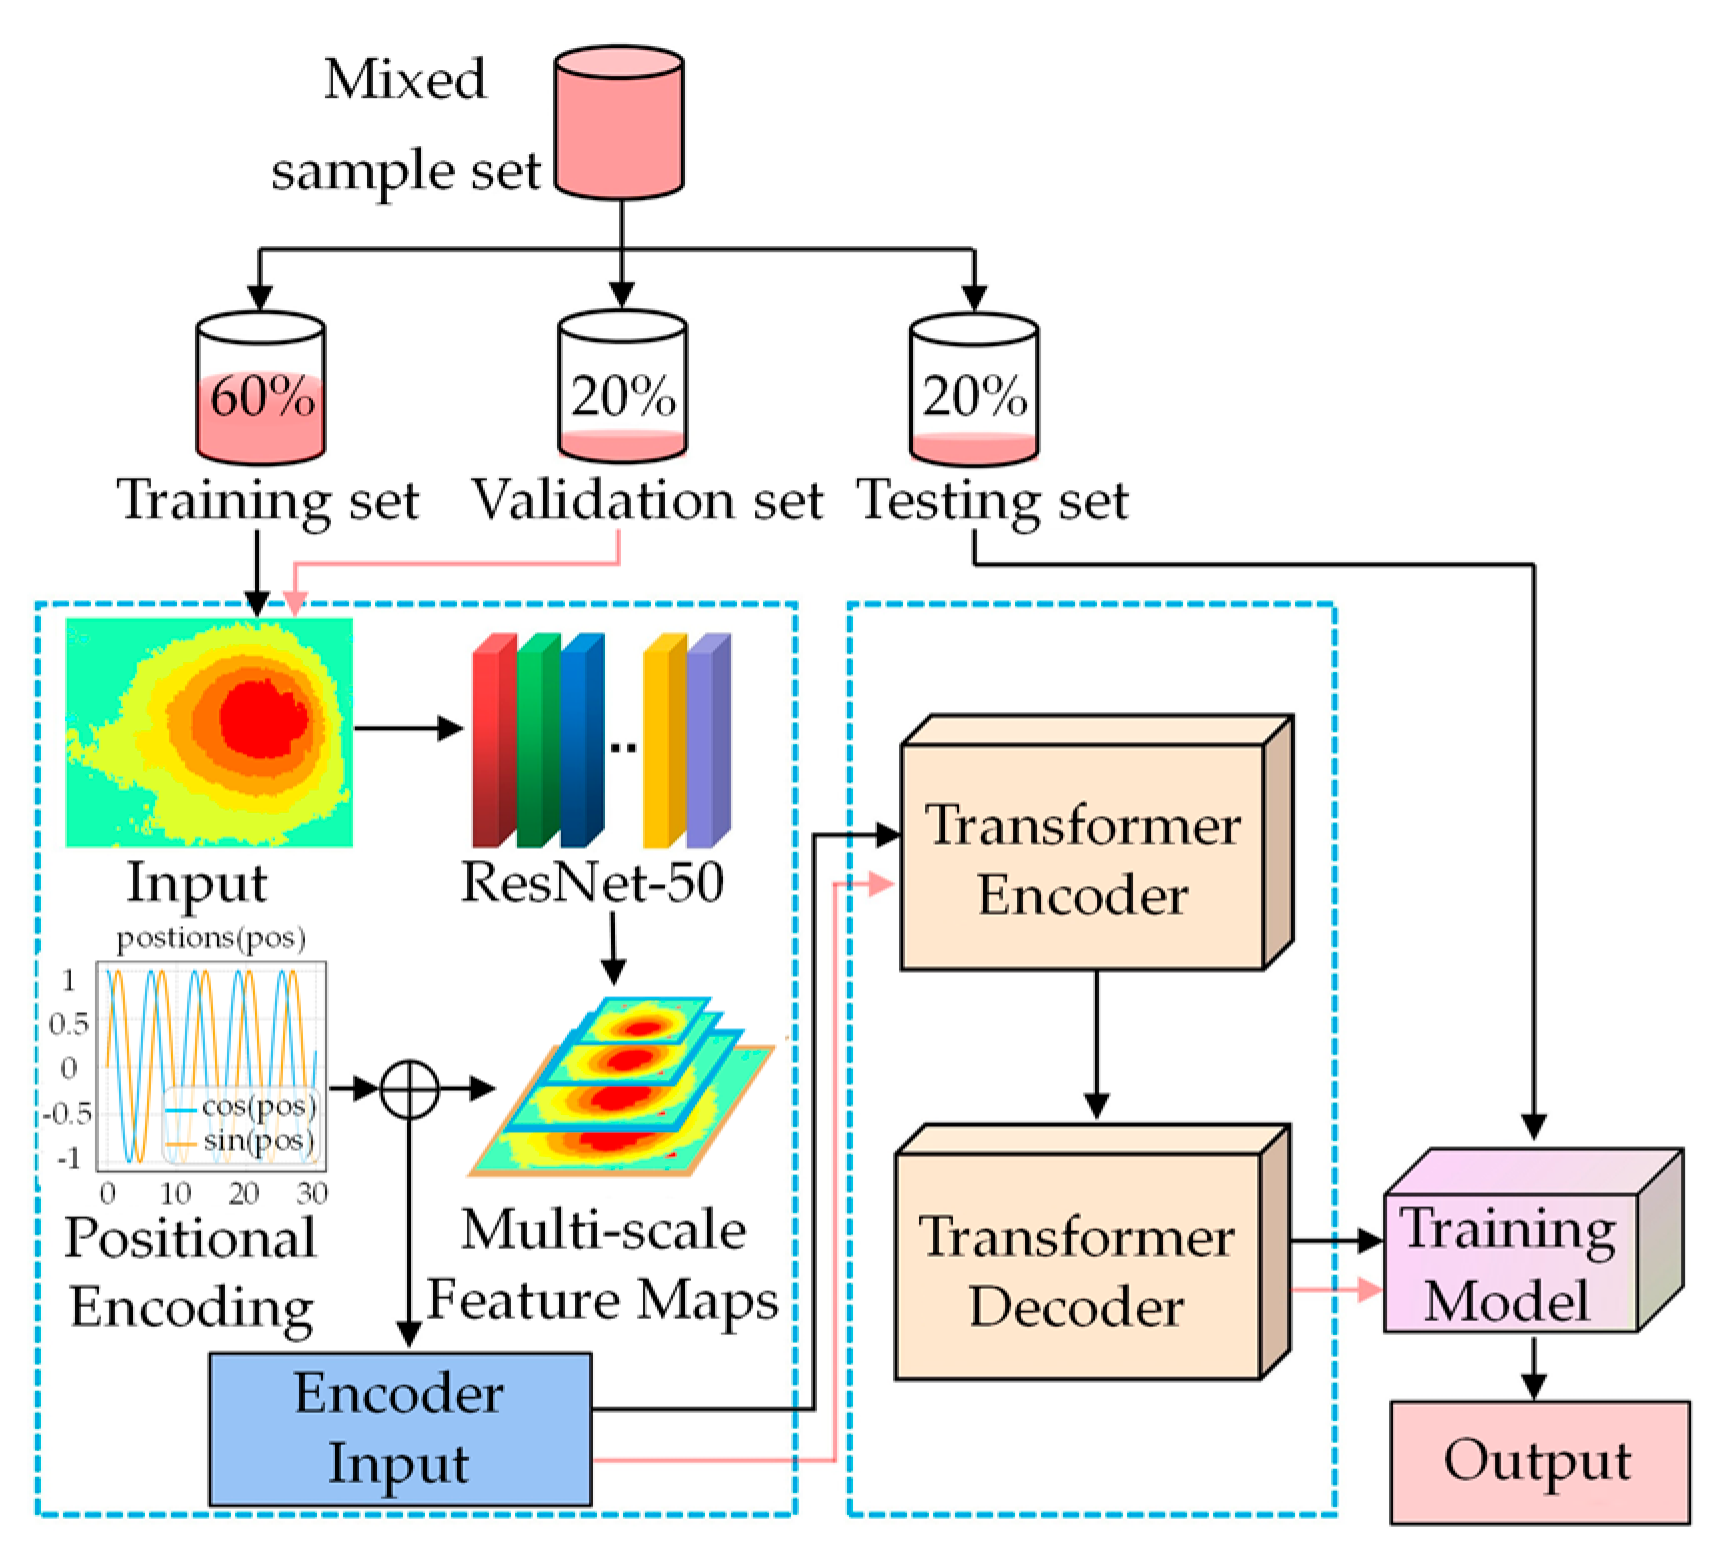
To enhance the precision in identifying and detecting mining subsidence basins, this paper constructs a large-area mining subsidence basin identification model based on Deformable DETR. The primary procedure is illustrated in Figure 1. First, the simulated and real samples are preprocessed and cropped to generate a mixed sample set, which is then divided into a training set, a validation set, and a test set in a 6:2:2 ratio. After that, the Deformable DETR model is trained. Finally, its performance is evaluated using the test set data.
Figure 1.
Mining subsidence detection technology framework based on Deformable DETR.
2.2. Dataset Construction
Deep learning is a data-driven machine learning method, and its performance and generalization ability depend largely on the dataset used. A diverse set of sample datasets can effectively enhance the model’s prediction accuracy for unknown data. In this study, the real sample set is created by manually labeling the InSAR interference results of the existing mining area. The simulation sample set is then constructed by combining the theory of mining subsidence prediction, enabling effective data expansion and preventing model overfitting. The methods for constructing the real and simulated sample sets are as follows.
2.2.1. Real Deformation Samples
Since there is currently no publicly available sample set for InSAR subsidence basins, this paper selects Sentinel-1A images of the Huainan mining area from 6 November 2019, to 1 February 2024, as the data source and manually creates the required sample set for the model. First, using the D-InSAR technique for interferometric processing, 72 deformation maps with a temporal baseline range of 12–36 days were obtained. Then, considering that pixels in coal mining subsidence areas account for a relatively small proportion of the total image, directly using the entire images may result in most of the data in the training set being irrelevant to coal mining subsidence, leading to data imbalance and affecting model training efficiency. Therefore, this paper crops the images. When the image pixel size is 512 × 512, more mining subsidence basins are fully included. Finally, we select image patches with a relatively high number of mining subsidence basins from 9810 images of size 512 × 512, resulting in a total of 2879 real data samples.
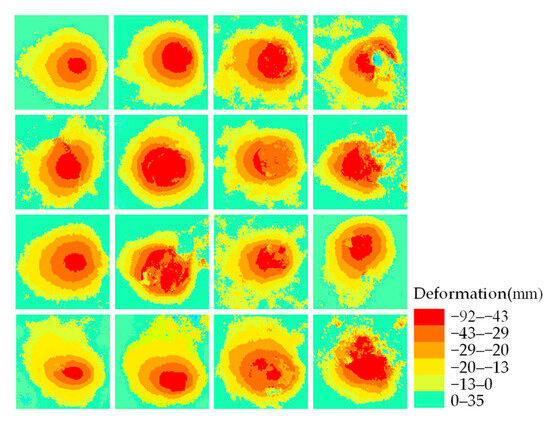
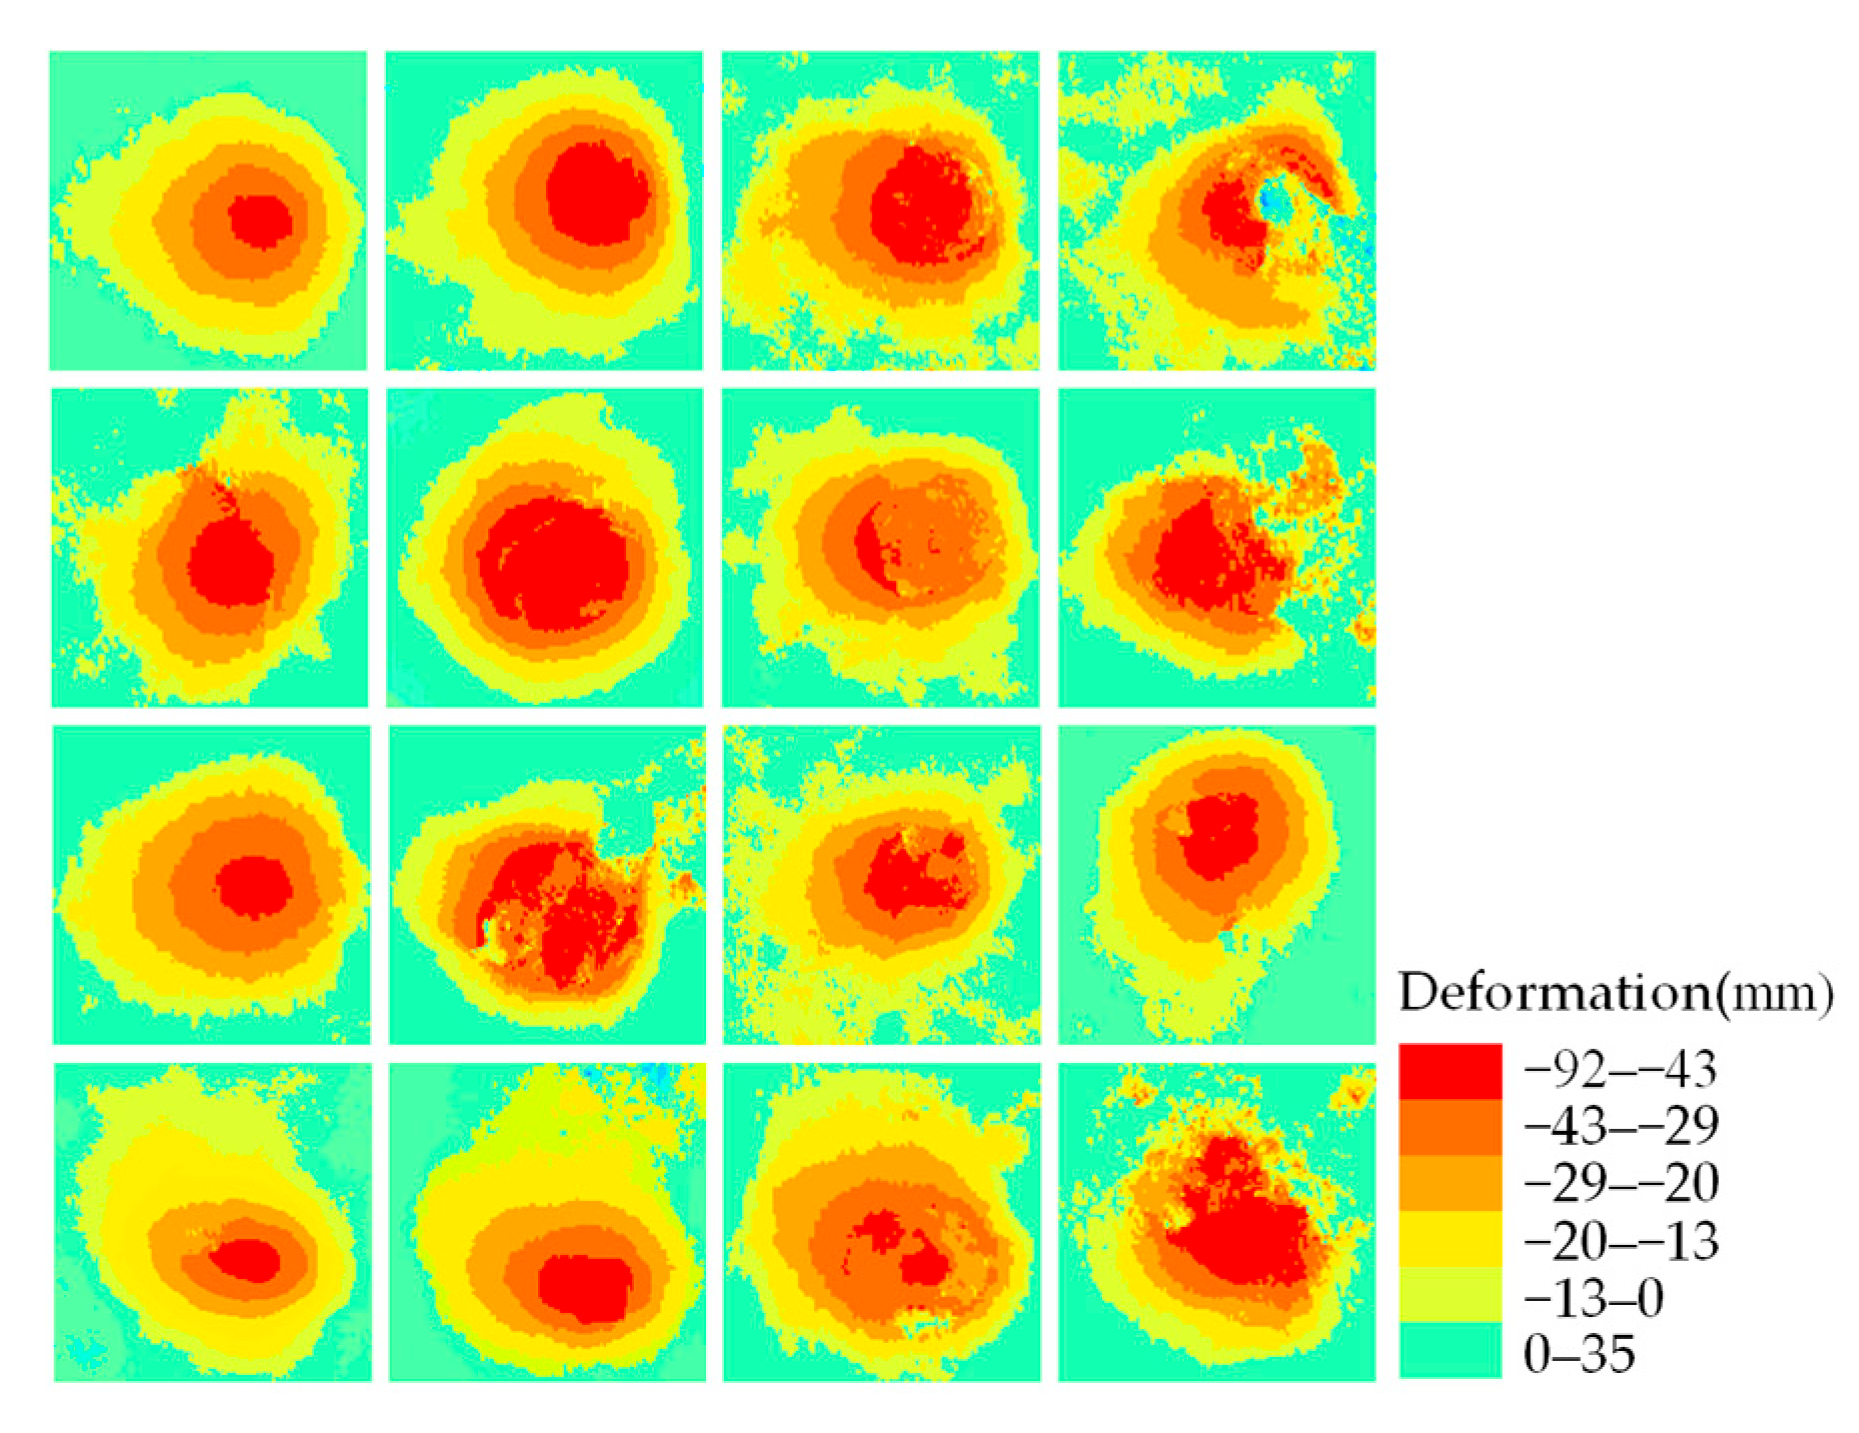
To better distinguish target features from background information and improve network accuracy, the experiment uses a threshold of the InSAR results to extract subsidence. Generally, the optimal recognition threshold depends on expert experience, but this method introduces some subjectivity. In this study, the Jenks Natural Breaks Classification method is employed for threshold categorization, with 0 added as the discontinuity point. Using candidate categories and separately computing the goodness-of-fit variance and the total within-class variance, K = 10 is ultimately selected as the optimal number of classes. Subsequently, ArcGIS 10.8 is employed to generate a colored RGB classification map, facilitating intuitive visualization of the morphology and spatial distribution of mining subsidence basins (Figure 2). Green represents non-subsidence areas, while the gradient from yellow to red indicates subsidence, with deeper colors representing larger subsidence amounts. The ground truth of the samples consists of InSAR mining subsidence basins and a small amount of background values, with sample labels set to 1. The dataset is organized and stored in the JSON format of the COCO dataset.
Figure 2.
Partial real sample set.
2.2.2. Simulated Deformation Samples
To enhance the consistency between the simulated data and the real data, the simulated dataset is divided into three stages: deformation simulation, elastic transformation, and the application of atmospheric effects and noise.
(1) Simulation of Deformation
Because the temporal baseline of InSAR interferometry in the real sample set is 12, 24, or 36 days during the training process, commonly used deformation simulation methods—such as the Gaussian function method [25] and the conventional probability integration method—are insufficient to accurately simulate the real deformation. Therefore, this study proposes a probability-integration-based dynamic prediction model with parameter variation to better simulate real deformation.
After analyzing measured data from a large number of mining areas, Dai et al. [26] proposed that the Boltzmann function can be used to describe the proportional relationship between the subsidence rate q′ and the subsidence coefficient q in cases of insufficient mining:
where A1, A2, A3, and A4 are Boltzmann coefficients, D represents the length of the strike direction of the mining working face, and H denotes the depth of the mined working face.
Theoretically, when no mining has occurred, the surface deformation caused by underground mining should be zero; that is, q′ = 0 and A1 should also be zero. When underground mining reaches full extraction, the subsidence rate should equal the subsidence coefficient; that is, q′ = q, so the maximum value of parameter A2 should be 1. In view of this, and to better describe the variation process of the subsidence rate, the above formula is simplified as follows:
Literature research indicates [27,28,29,30] that the subsidence coefficient is the key parameter of the probability integral method for predicting surface subsidence. By calculating the key metrics of the probability integral method during mining activities, it has been observed that the parameters vary irregularly in the early stages of mining. Once the working face advances a certain distance, some parameters gradually converge and eventually stabilize. In the probability integral method, the subsidence coefficient is related only to the maximum surface subsidence value Wmax under full mining conditions. The mathematical expression for Wmax is as follows:
where m is the mined thickness, and φ is the coal seam dip angle. In this paper, only the variability of the subsidence coefficient is considered. Thus, q′ in Formula (4) is replaced with q in Formula (5), and Wmax is then introduced into the prediction formula of the probability integral method. At this point, the parameters of the probability integral method increase from eight to ten, expressed as PPIM = (q, b, tan β, θ0, s1, s2, s3, s4, A3, A4). This allows for the calculation of the subsidence value Wz at any surface point under different mining degrees (or at a given time). Here, b is the horizontal displacement coefficient, tan β is the tangent of the key influence angle, θ0 is the propagation angle of mining influence, and s1, s2, s3, s4 are the inflection point offsets in the strike and dip directions.
The steps for simulating deformation are as follows: For a nearly horizontal working face, at any time t1, the corresponding strike length of the working face is denoted as Dt1. At this point, based on the probability integral prediction model with the given parameters, the subsidence value for any surface point can be calculated as Wt1. After the satellite completes a revisit period T, the strike length becomes Dt1+T. Assuming the propulsion speed of the working face is V m/d, Dt1+T can be expressed as shown in Formula (6):
During the mining process, φ, H, and m remain unchanged. The expected subsidence value at any point is Wt1+T, and the subsidence value Wz during the satellite revisit period can be expressed by Formula (7):
Ignoring the contribution of horizontal movement to the LOS direction, the subsidence value Wz is converted into deformation in the LOS direction using Equation (8):
where dLOS is the LOS deformation, and θ is the satellite incidence angle.
Considering the diversity of working surface shapes, and based on the long-term accumulated geological and measured data from the Huainan mining area, this study determines the reasonable variation range for the parameters of the probability integral method and mining conditions (such as mining depth, mining height, working surface dimensions, inclination, etc.). During the simulation, different working surfaces are modeled by adjusting the parameters.
(2) Elastic Transformation
The elastic transformation algorithm is a data augmentation method for character samples proposed by Simard et al. [31]. In this study, elastic transformation is used to modify the simulated deformation map, making its shape more closely resemble the real scene. The specific steps are as follows:
Firstly, two random numbers between −1 and 1 are generated for each pixel point (x, y) in the deformation map, denoted as Δx(x, y) and Δy(x, y), which represent the random translation of the pixel point along the x and y-directions, respectively. The random translation can be calculated using Equation (9):
To smooth the image, a convolution kernel g(x, y) with a mean of 0 and a standard deviation of σ is generated to perform a convolution operation on Δx and Δy, and the result is applied to the original image, as shown in Equation (10):
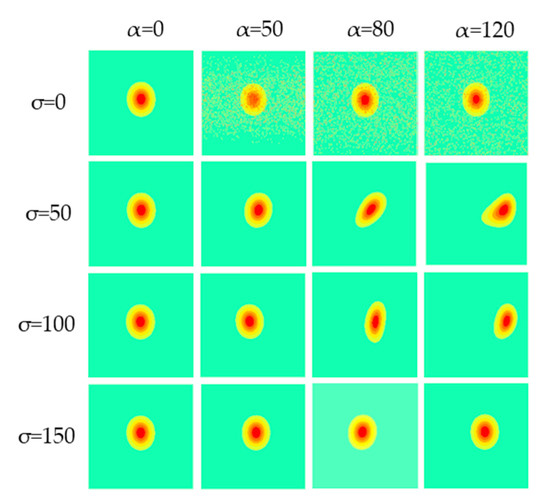
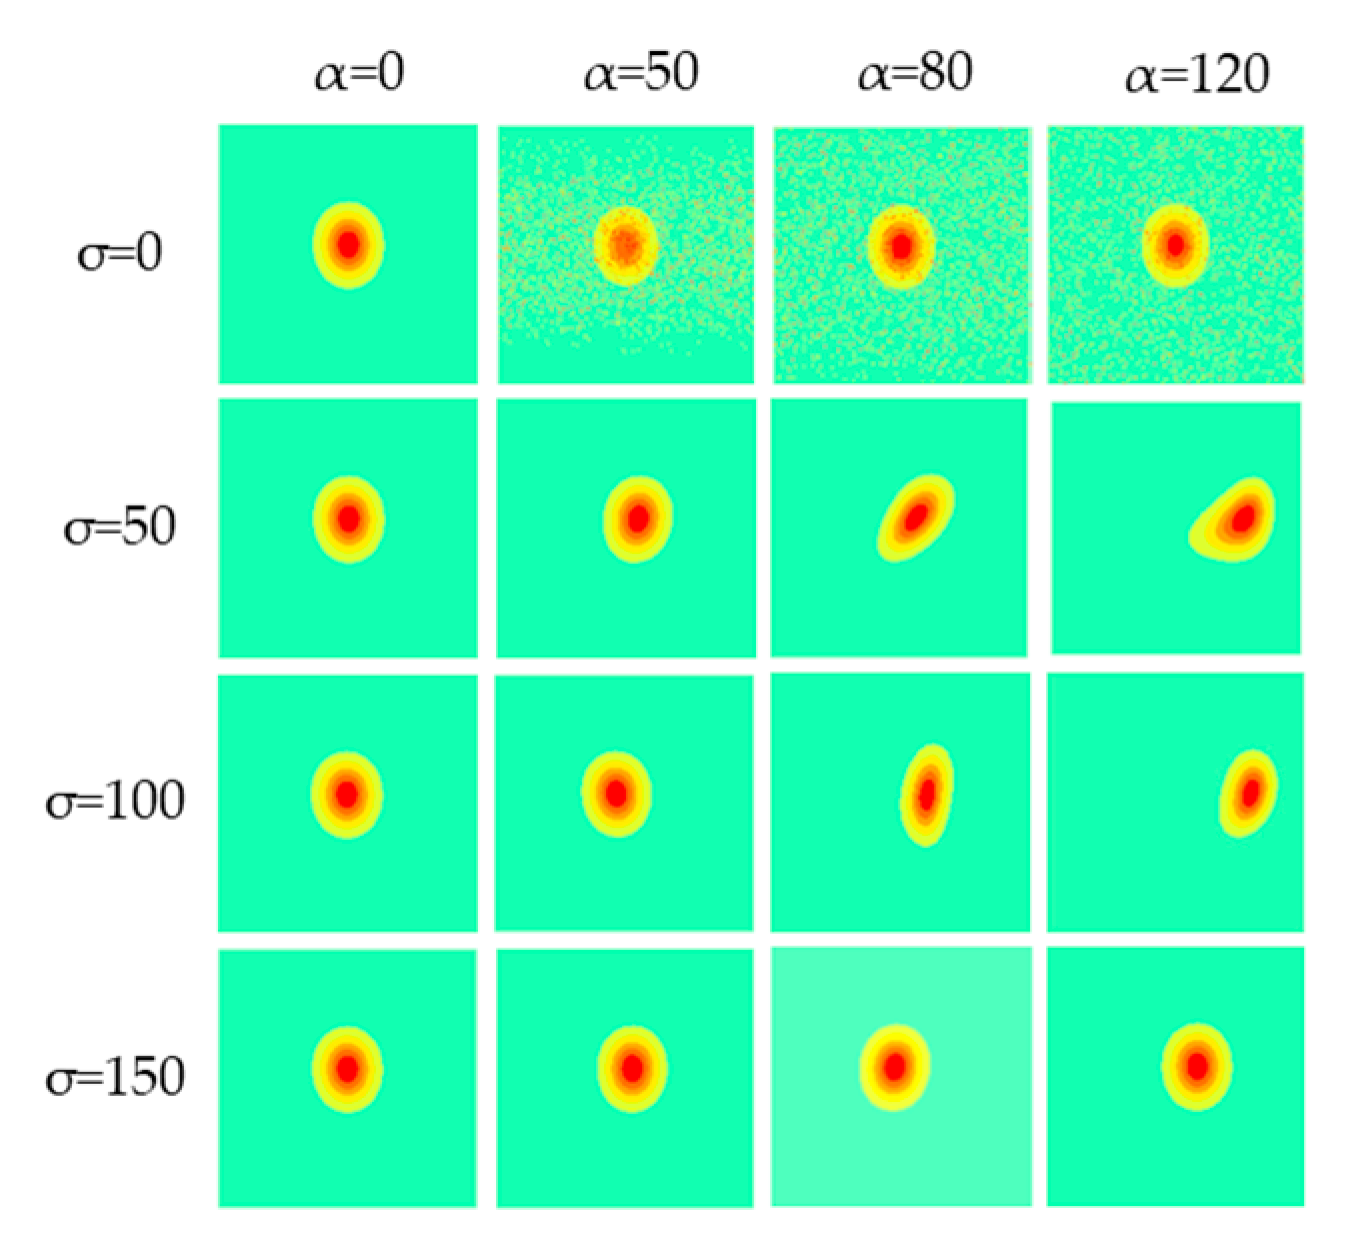
In the formula, α is the scale coefficient, which controls the intensity of the deformation; the larger α is, the more significant the deformation becomes. σ is the smoothing parameter; the larger σ is, the smoother the deformation field becomes (Figure 3). When α is relatively small, the overall morphology of the subsidence basin remains nearly unchanged, with only slight perturbations occurring near the boundaries and in local regions. As α increases, the deformation intensity grows significantly, and the irregularity of the subsidence basin becomes more pronounced. For the smoothing parameter σ, smaller values preserve more local detail, whereas larger σ values smooth the deformation over a broader spatial range, resulting in smoother patterns for the same α. By selecting different combinations of α and σ, the sample data can be effectively expanded, making the generated samples more closely approximate the actual deformation.
Figure 3.
The influence of the change of α and σ on the parameters.
(3) Atmosphere and Noise
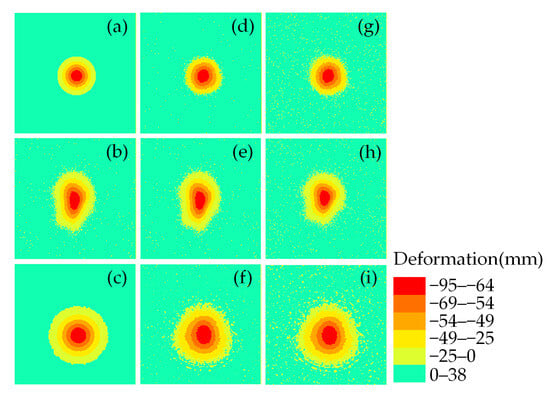
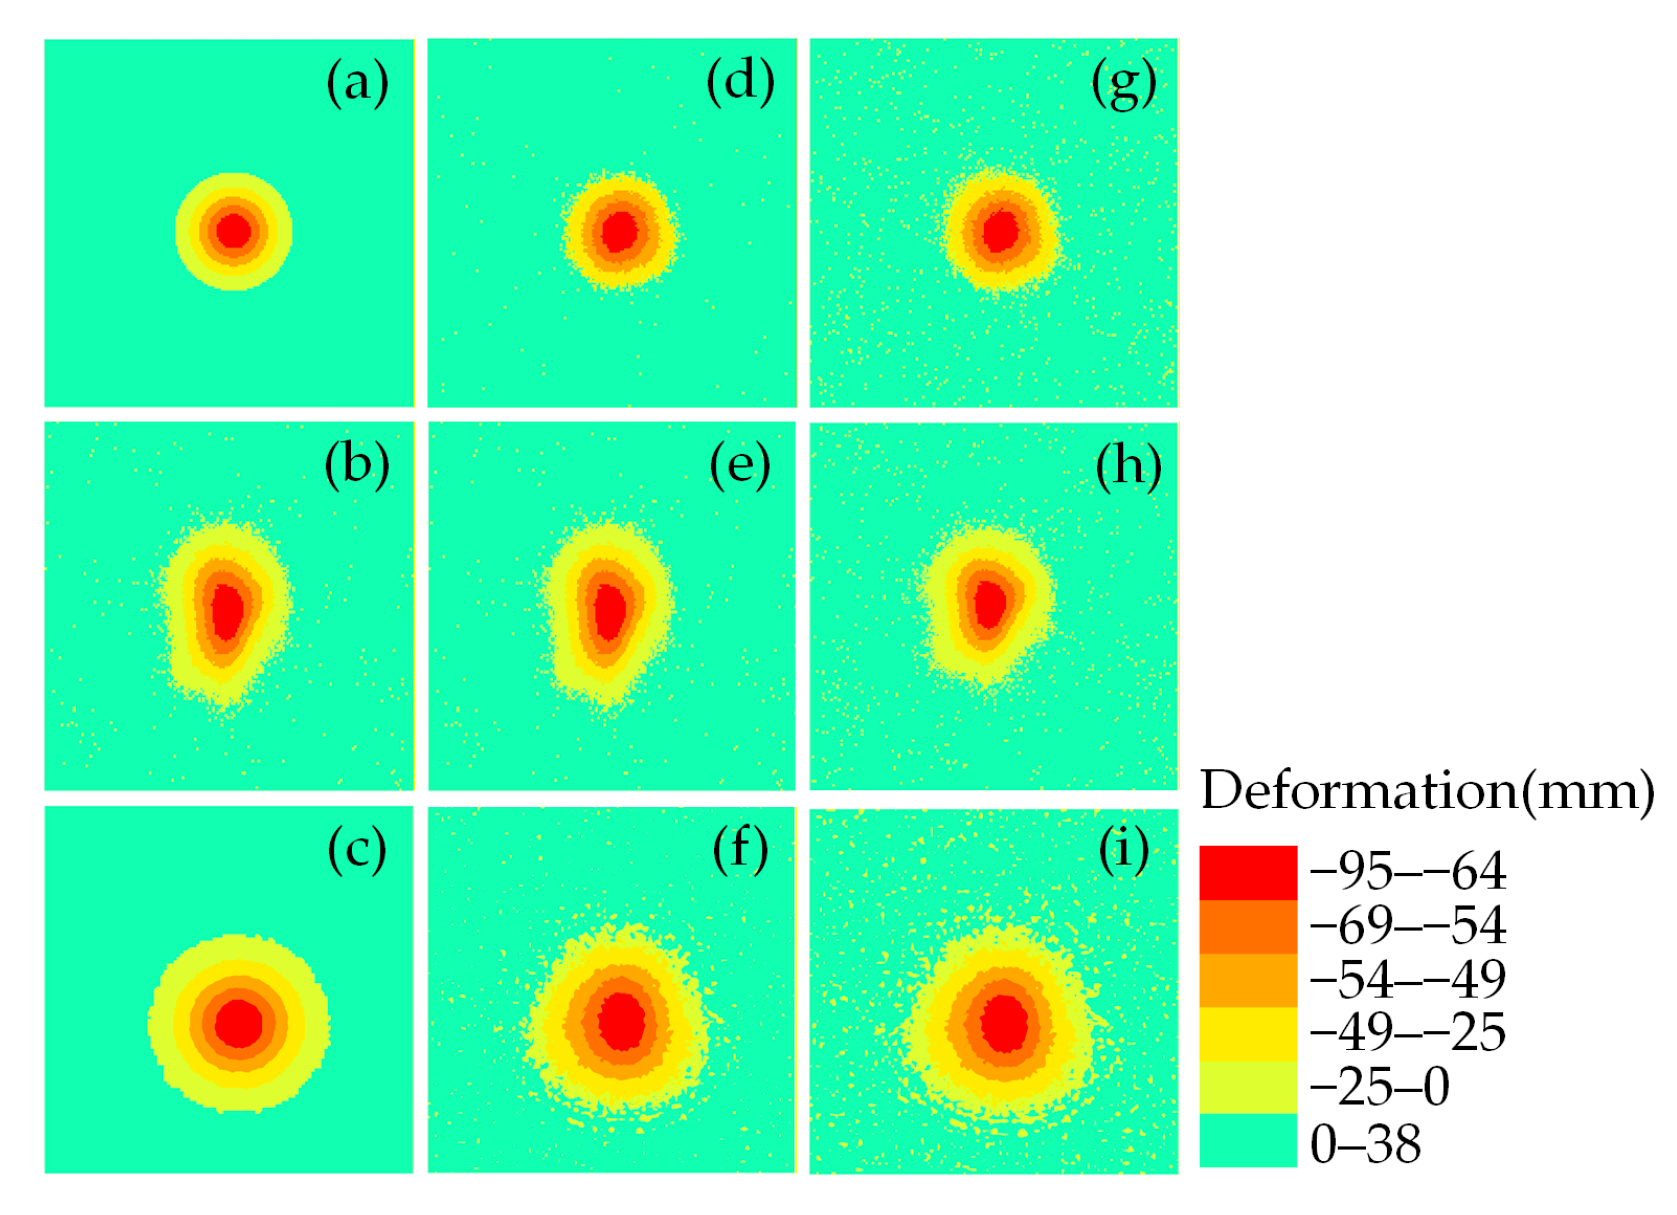
This paper simulates the turbulent atmosphere by superimposing fractal Perlin noise at different frequencies and amplitudes and introduces a Gaussian noise model to simulate the decorrelation effect in SAR images (Figure 4).
Figure 4.
Simulation dataset construction process: (a–c) for different deformation simulation stages, (d–f) for elastic transformation stage, (g–i) for atmospheric and noise addition stage.
A total of 2000 simulated deformation maps, each with a size of 512 × 512 pixels, were generated using the method described above, and the Jenks Natural Breaks Classification method was applied for classification. The mixed dataset was then constructed by combining the 2000 simulated deformation maps with the 2879 real deformation maps. For the real data, the samples were randomly split into 60% for training, 20% for validation, and 20% for testing. To enhance model training, 2000 simulated deformation samples were added to the training set based on the initial partitioning. To ensure fairness and accuracy in model evaluation, the validation and test sets remained unchanged.
2.3. Environment and Evaluation Metrics
2.3.1. Experimental Environment
PyTorch (GPU) is used as the deep learning framework to build the experimental environment for training and testing. The CPU is a 12th Gen Intel® Core™ i5-12400F, the GPU is an NVIDIA GeForce RTX 4060 Ti, and the memory size is 16 GB. The deep learning framework is PyTorch 2.0, and the programming language is Python 3.9. The batch size is 2, and the number of epochs is 300. The initial learning rate is 0.0001, which decreases continuously during subsequent training. The Adam optimizer is used to optimize and adjust the network parameters, and performance evaluation on the validation set is conducted every 10 epochs. To confirm the identification capability of the Deformable DETR network model in wide-area subsidence detection, the widely used Faster R-CNN and DETR models are selected for comparison.
2.3.2. Evaluation Metrics
To evaluate the performance of the model, mean Average Precision (mAP), Precision, Recall, F1-score, and mIoU are used as evaluation metrics. Since there is only one target category, ‘mining subsidence basin,’ in the mining area, mAP is equivalent to AP in this study. The specific calculation formulas for each evaluation metric are as follows:
where TP, FP and FN are the correct detection number, the false detection number and the missed detection number, respectively.
The F1-score combines the results of Precision and Recall, measuring the model’s ability to capture more positive examples while maintaining high accuracy. mIoU calculates the Intersection over Union (IoU) for all categories and takes the average. AP is a function of Precision and Recall, determined by the IoU. It is used to quantify the model’s detection performance under different thresholds.
3. Results and Analysis
3.1. Study Area
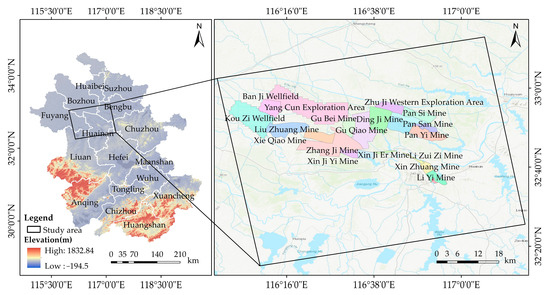
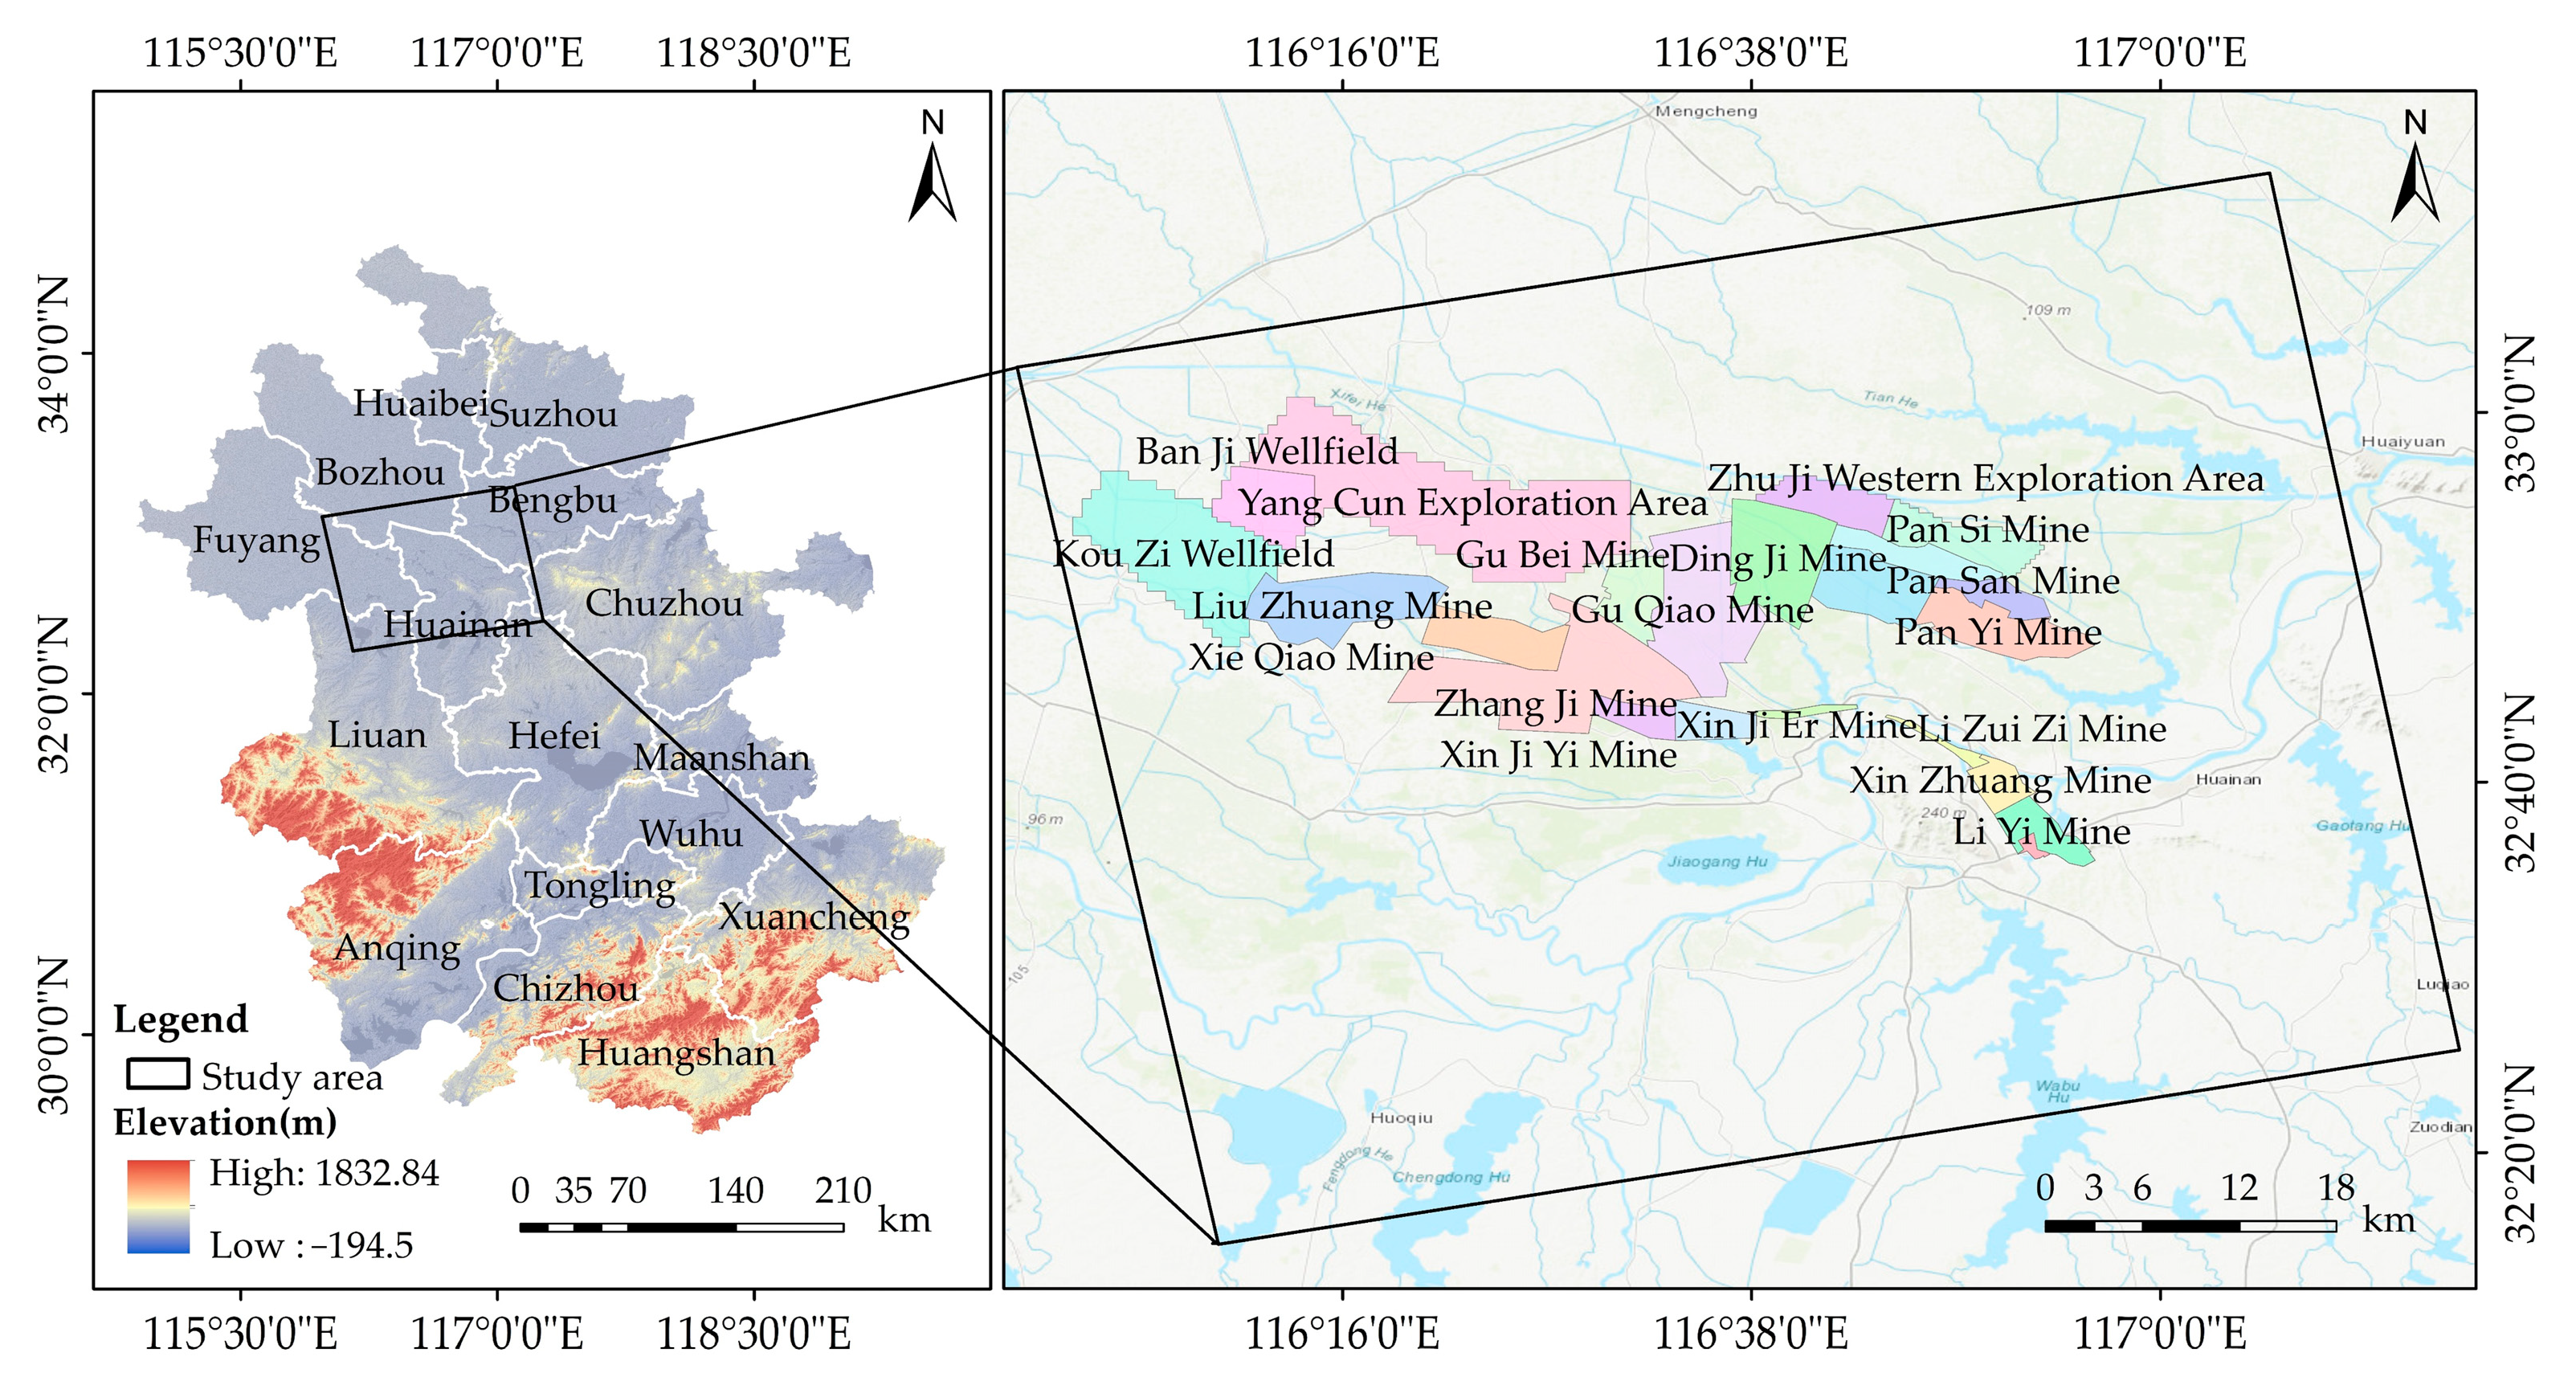
The Huainan mining area is located on both sides of the Huai River in the northern part of Anhui Province. The mining area spans 180 km from east to west and 15 to 25 km from north to south, covering an area of approximately 3600 km2, with geographical coordinates ranging from 115°50′E to 117°45′E and from 32°25′N to 33°10′N. This region is primarily situated on the Huaihe alluvial plain, with some areas consisting of hills and uplands. The surface elevation generally ranges from +20 m to +30 m. The Huainan mining area has a long mining history, abundant mineral resources, numerous mining subsidence areas, and significant subsidence. Therefore, it has been selected as the experimental area for this study. The distribution of mines in the Huainan mining area is illustrated in Figure 5.
Figure 5.
Geographical location of the study area.
3.2. Model Performance of Mining Subsidence Areas
3.2.1. Validation of the Testing Dataset
In this paper, a total of 8 scenes of Sentinel-1A IW mode images covering the Huainan mining area from 9 November 2023, to 1 February 2024, are selected to form 18 interferometric pairs for the construction of the test set (Table 1).
Table 1.
Sentine-1A image parameters.
The experiment uses the converted RGB image and the method established in this paper to identify the mining subsidence basins. Before model prediction, each image must be cropped. The crop size is 512 × 512 pixels, with no overlap, and the edge parts are not processed. The strategy of dividing the image into blocks for prediction and then stitching them back together to restore the entire image is adopted.
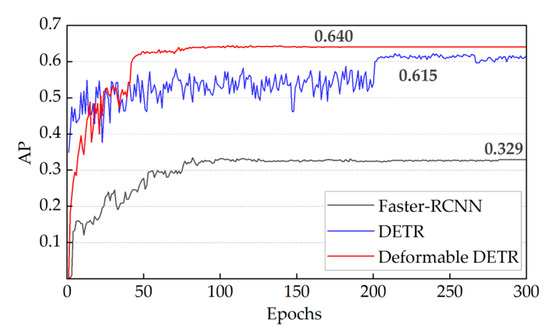
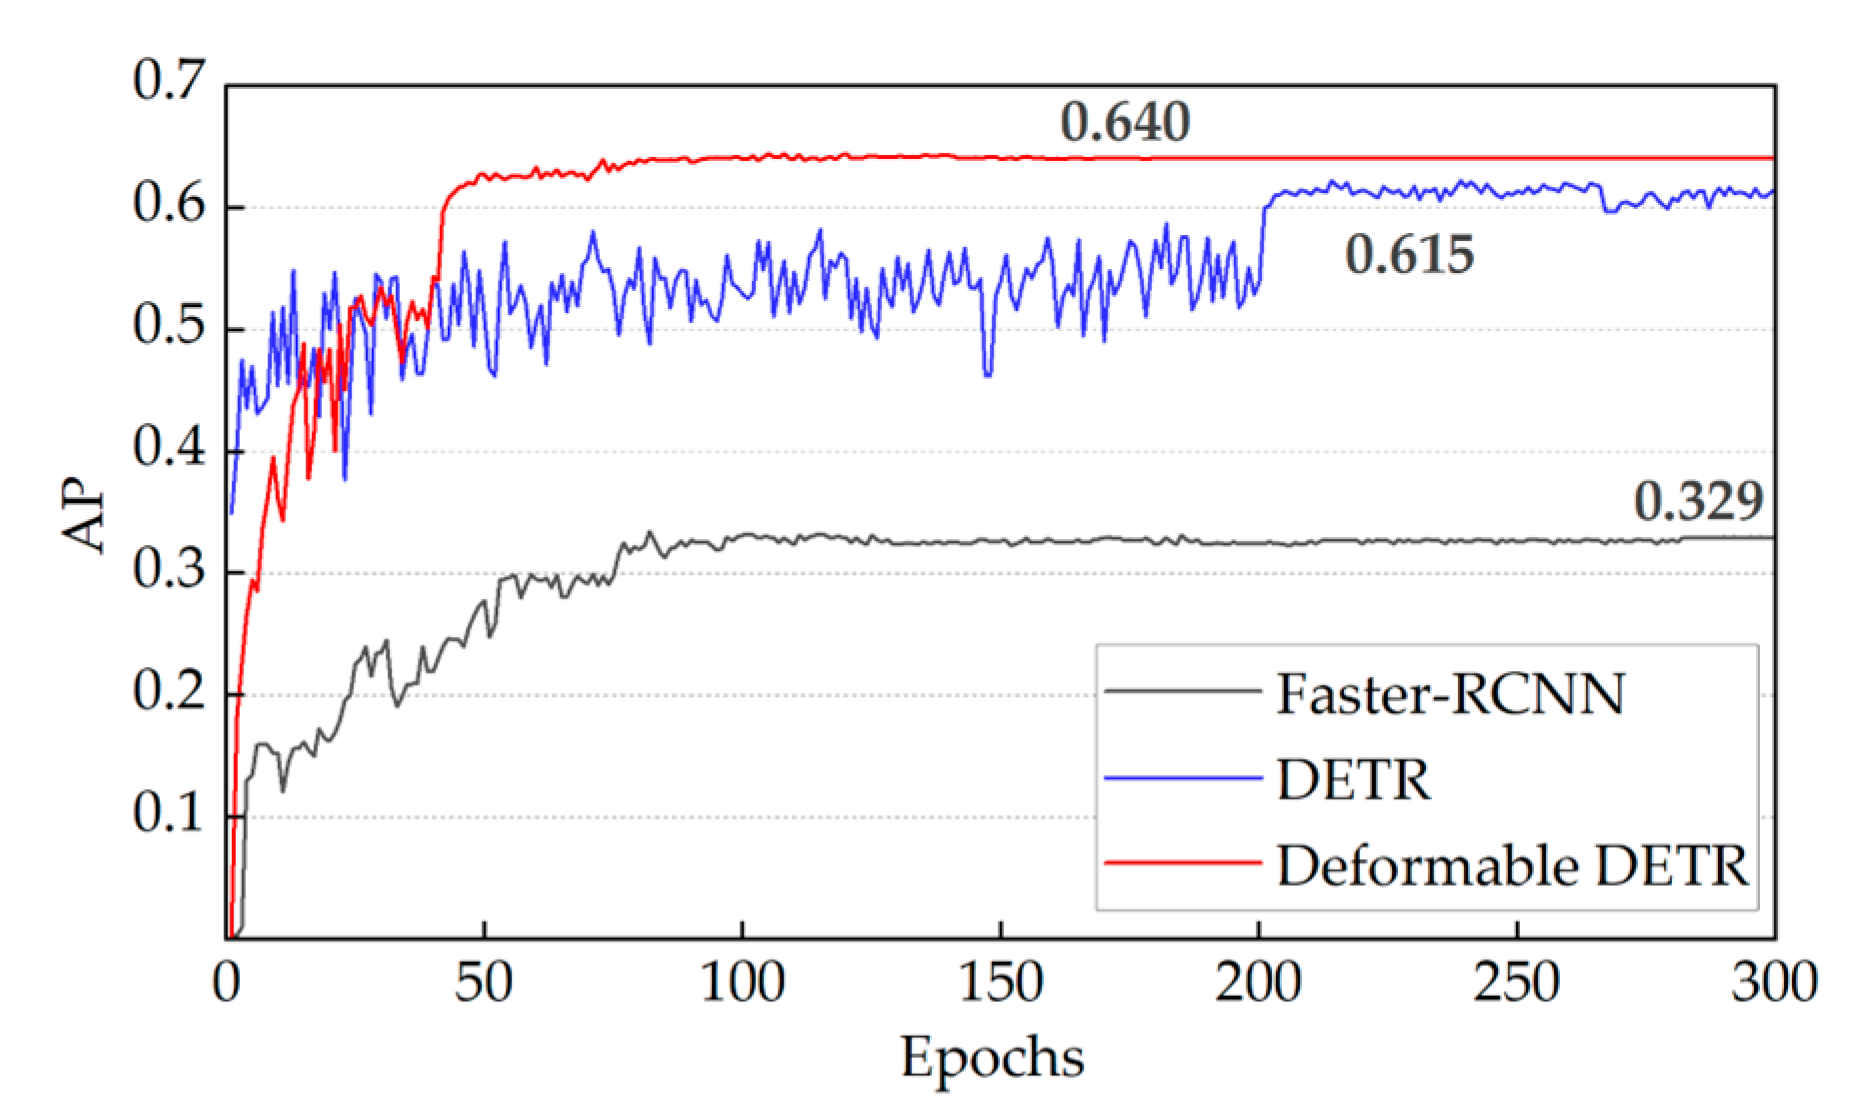
Faster R-CNN is a deep learning model for object detection that achieves a good balance between accuracy and speed. The model was proposed by Girshick et al. [32] in 2015 and is an important improvement of the R-CNN series (including Fast R-CNN). The network features a deeper architecture and can be applied to various application scenarios. To validate the performance impact of Deformable DETR in identifying subsidence basins, this study uses Deformable DETR, DETR, and Faster R-CNN to detect mining subsidence basins based on training samples. During training, the Deformable DETR model shows a rapid increase in AP, reaching 0.62 within the first 50 epochs and stabilizing at 0.64 after approximately 40 more epochs. In contrast, the DETR model experiences sustained fluctuations in AP, ranging between 0.45 and 0.55, with gradual convergence to 0.615 in the later stages. The Faster R-CNN model demonstrates slow AP growth, with performance stagnating around 100 epochs and ultimately reaching 0.329. Figure 6 shows the AP curve with the number of iterations during the training process for all three models. Table 2 further presents the detection performance of each model after training.
Figure 6.
Comparison of the AP among different object detection models.
Table 2.
Comparison of detection accuracy of three models on test sets.
As shown in Table 2, Deformable DETR surpasses both DETR and Faster R-CNN in overall detection performance, achieving Precision, Recall, F1-score, and mIoU values of 0.926, 0.886, 0.905, and 0.828, respectively. The model not only demonstrates balanced performance in terms of Precision and Recall but also achieves a significant advantage in mIoU, highlighting its superior ability to position and accurately identify targets of different sizes. Figure 6 illustrates the model’s training process, showing that Deformable DETR exhibits faster convergence and smaller AP fluctuations, reflecting its superior convergence speed and generalization performance, and indicating its robustness in complex and variable object detection tasks.
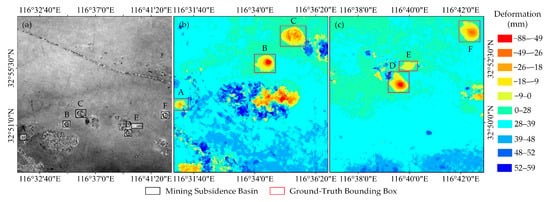
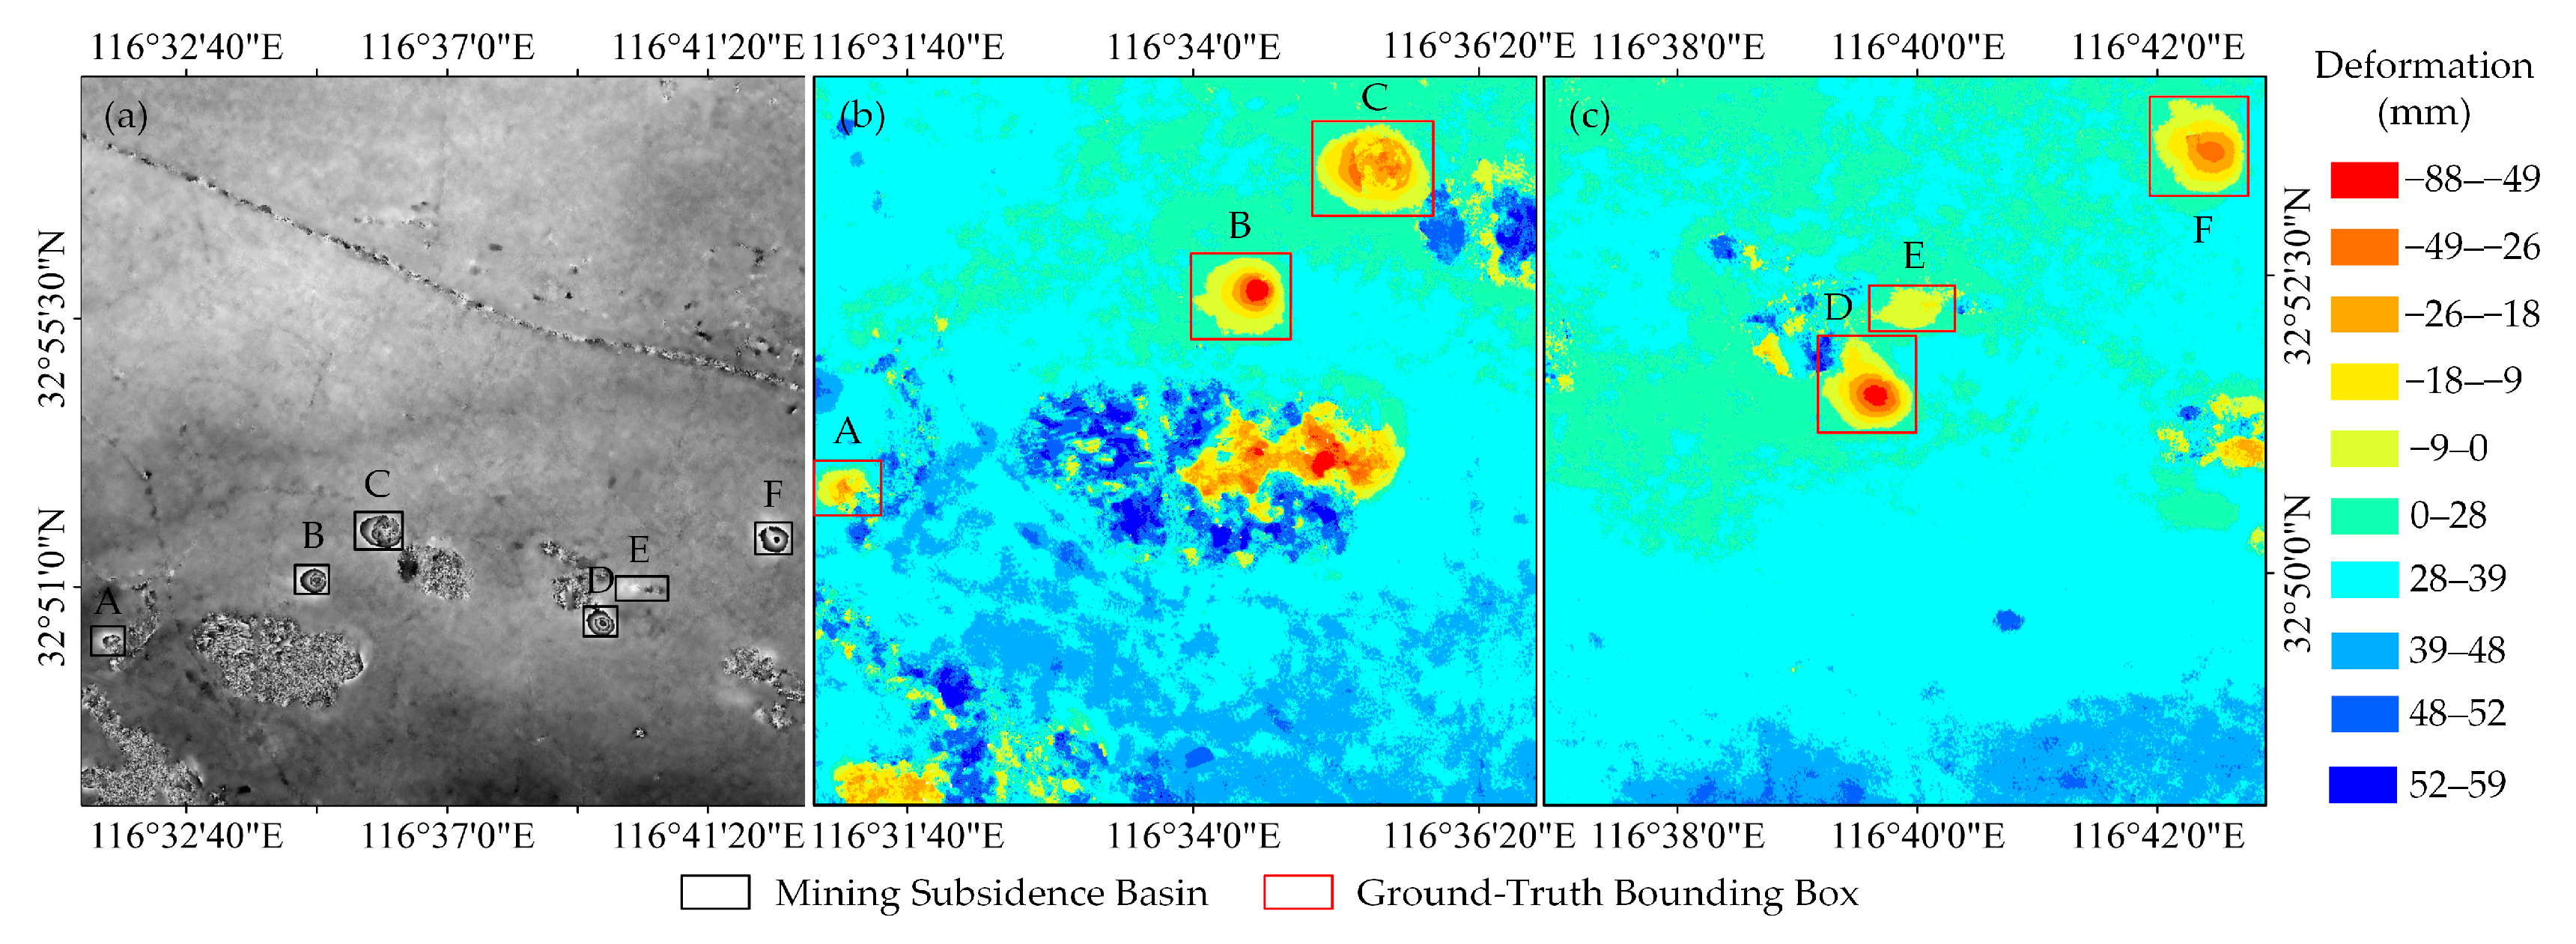
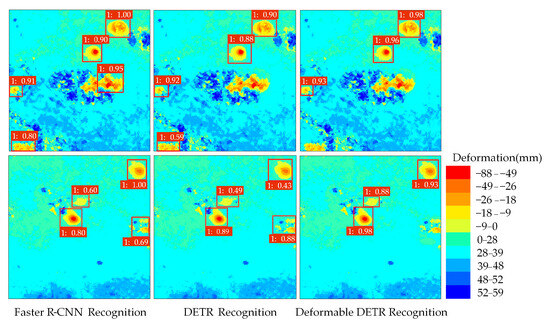
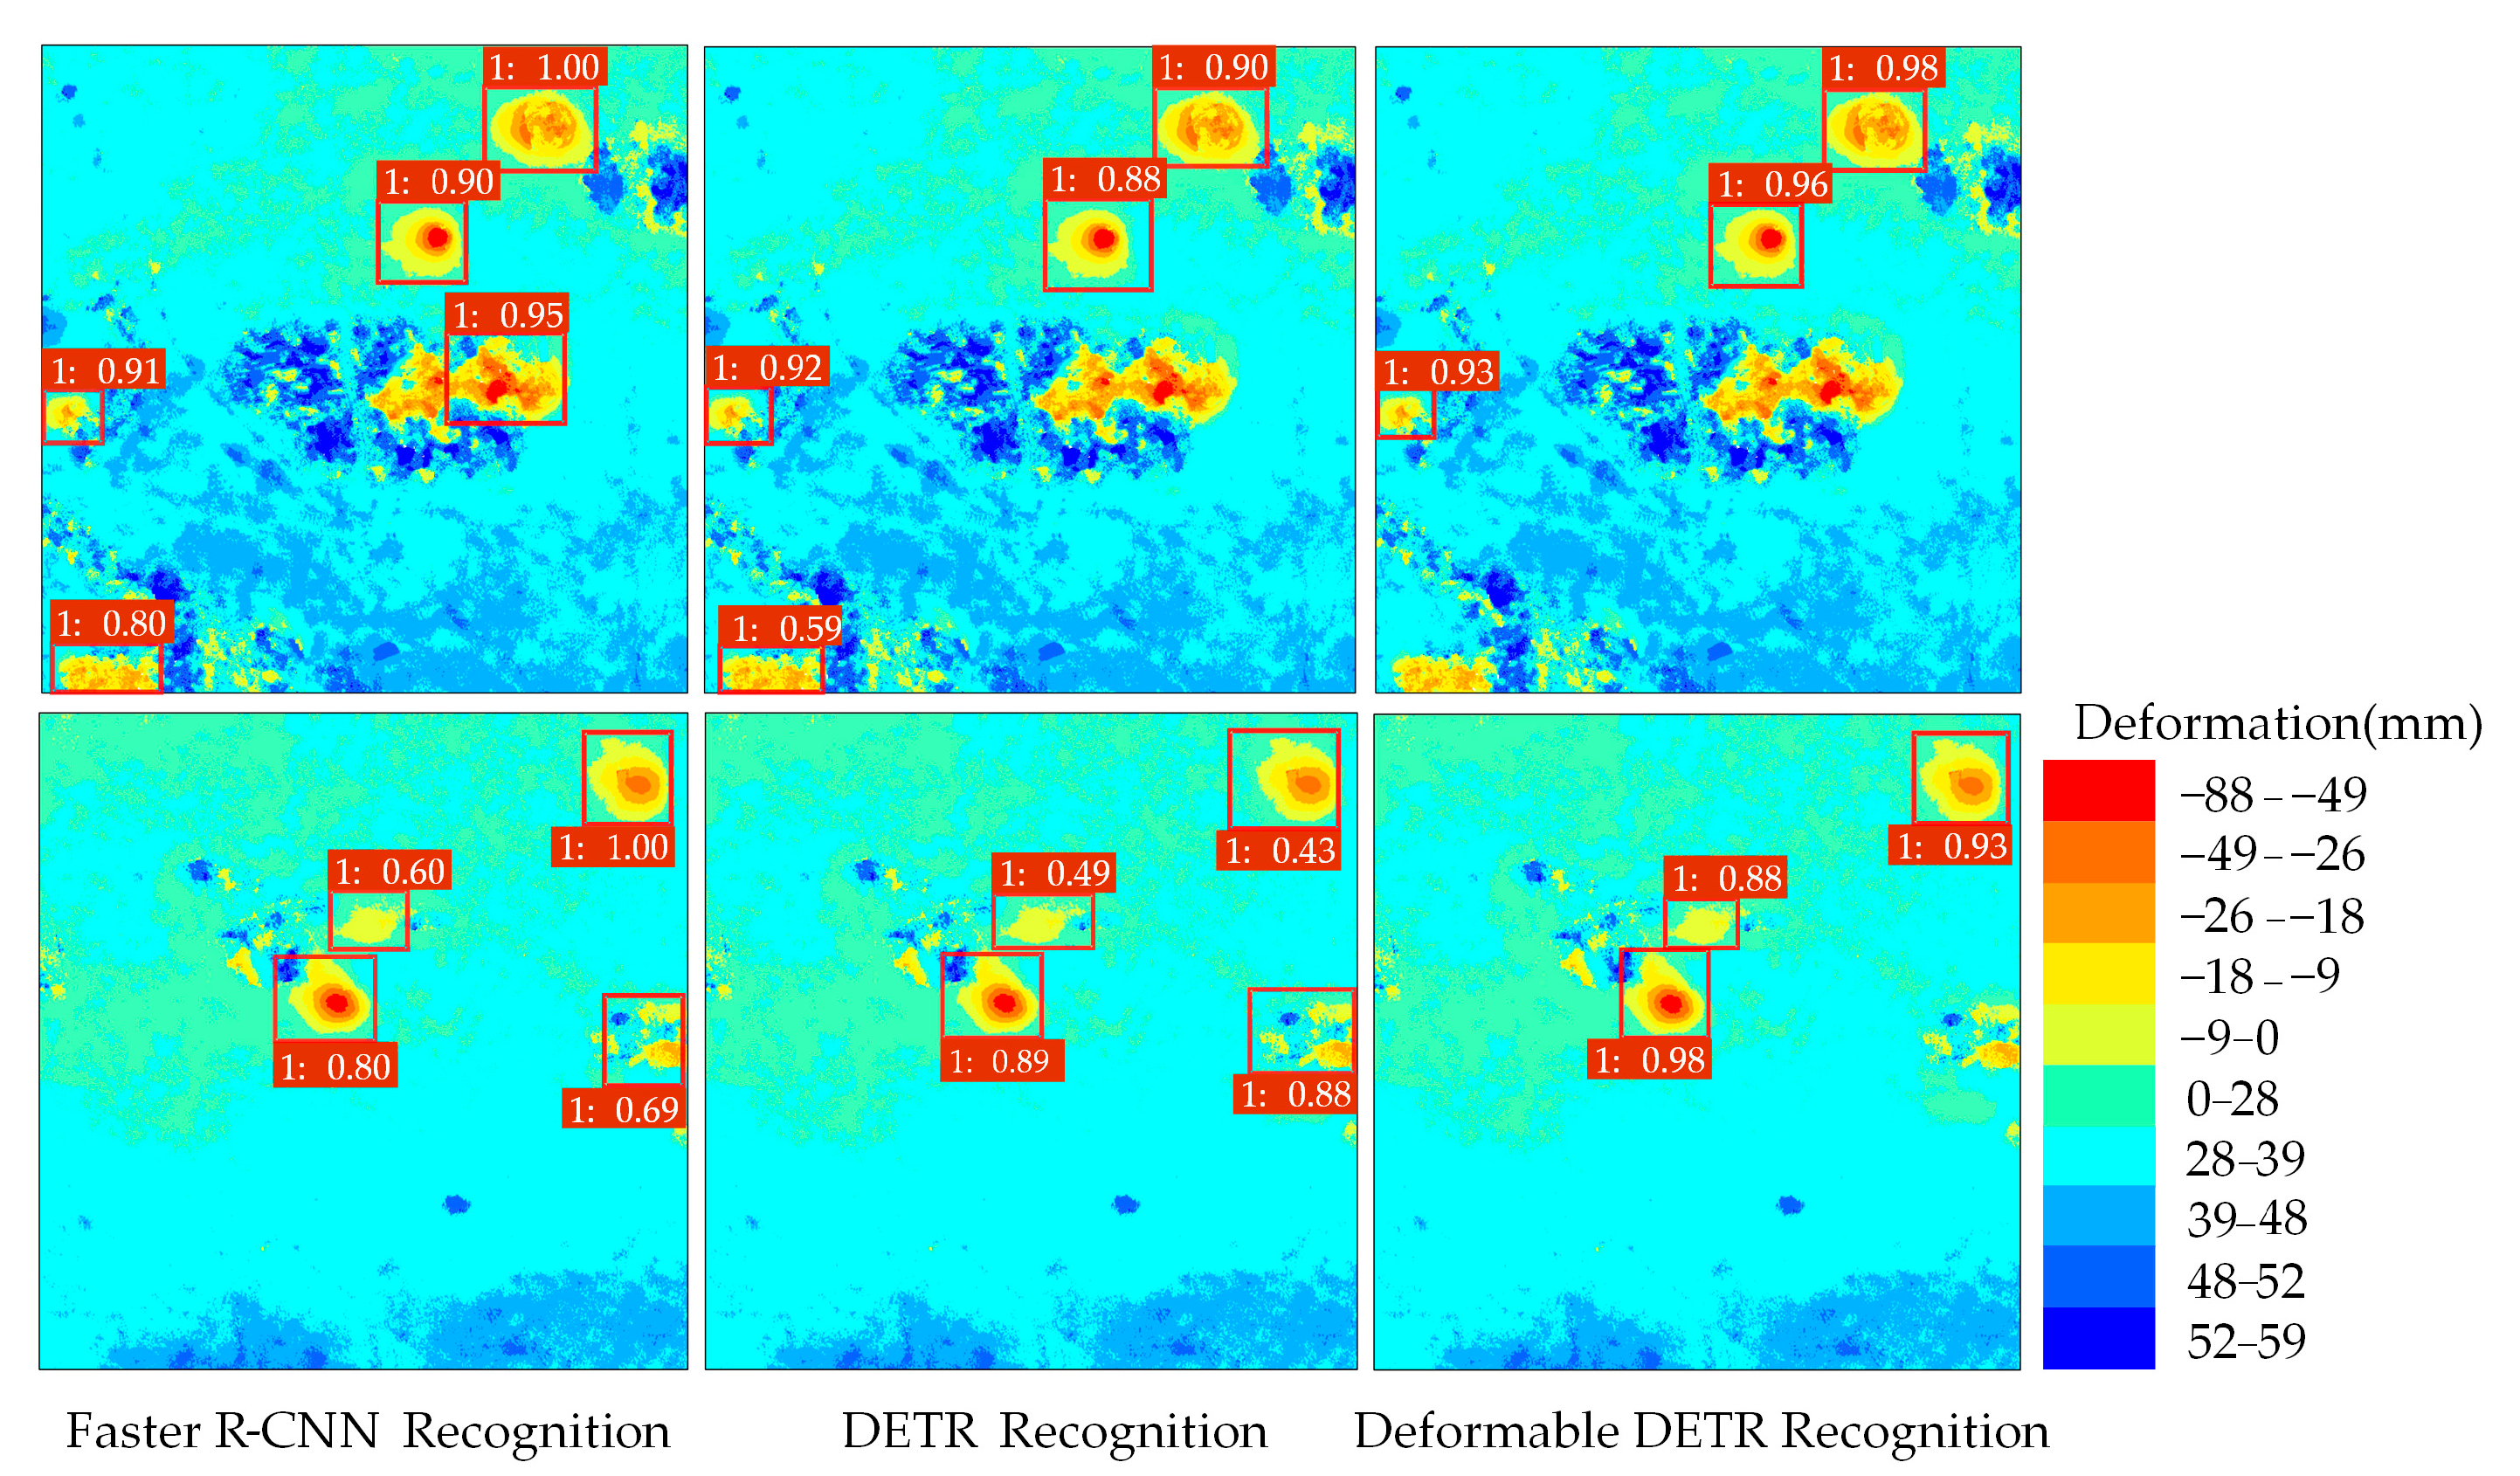
Figure 7 shows the distribution of mining subsidence locations in the mining area. The figure includes six mining subsidence areas: A, B, C, D, E, and F. Color classification is used to visually display the subsidence differences in each area. Three models are used to identify the six subsidence areas, with the recognition results presented in the form of ‘label: confidence’ (Figure 8). Faster R-CNN achieves high detection accuracy for individual targets but exhibits lower overall recognition accuracy, mistakenly detecting three targets. The fitting effect of the region proposals identified by DETR is unstable, leading to the mistaken detection of two targets and low recognition accuracy for target E, which has a small subsidence area. Overall, the number of region proposals identified by Faster R-CNN and DETR exceeds the true count, resulting in a higher false positive detection rate. However, the boundary delineated by Deformable DETR closely matches the ground truth, with lower false positive rates compared to the other two models. For mining subsidence targets with regular shapes, recognition is better, and the confidence can exceed 90%. The recognition confidence for small deformation target E, with settlement between 0 mm and 9 mm and fewer than 90 pixels, reaches 88%. This demonstrates that the Deformable DETR model exhibits strong resistance to interference and is highly capable of precisely identifying the location of mining subsidence areas within complex backgrounds.
Figure 7.
Locations of mining subsidence basins in the test set: (a) Original interferogram (b,c) Corresponding RGB image.
Figure 8.
Detection results of different models in mining subsidence basins.
The experiment conducted a detailed statistical analysis of all detected subsidence basins with varying subsidence ranges, finding that the model’s minimum detectable deformation ranged from less than 1 mm to greater than 100 mm. The performance of the three models was also compared across different deformation areas. In cases of significant deformation, Deformable DETR surpasses DETR in recognition accuracy, although it exhibits slightly lower performance than Faster R-CNN for individual targets. When the deformation is small and the visual recognition effect is not apparent, Deformable DETR successfully identifies the target with high confidence, achieving higher recognition accuracy than the DETR model. In contrast, Faster R-CNN fails to detect the target. This result further demonstrates that Deformable DETR can detect a wide range of deformation variables and shows excellent adaptability when handling complex image features. This advantage may be due to its flexible feature extraction and dynamic adjustment capabilities, which maintain high detection accuracy even when dealing with mining subsidence basins of varying shapes and sizes.
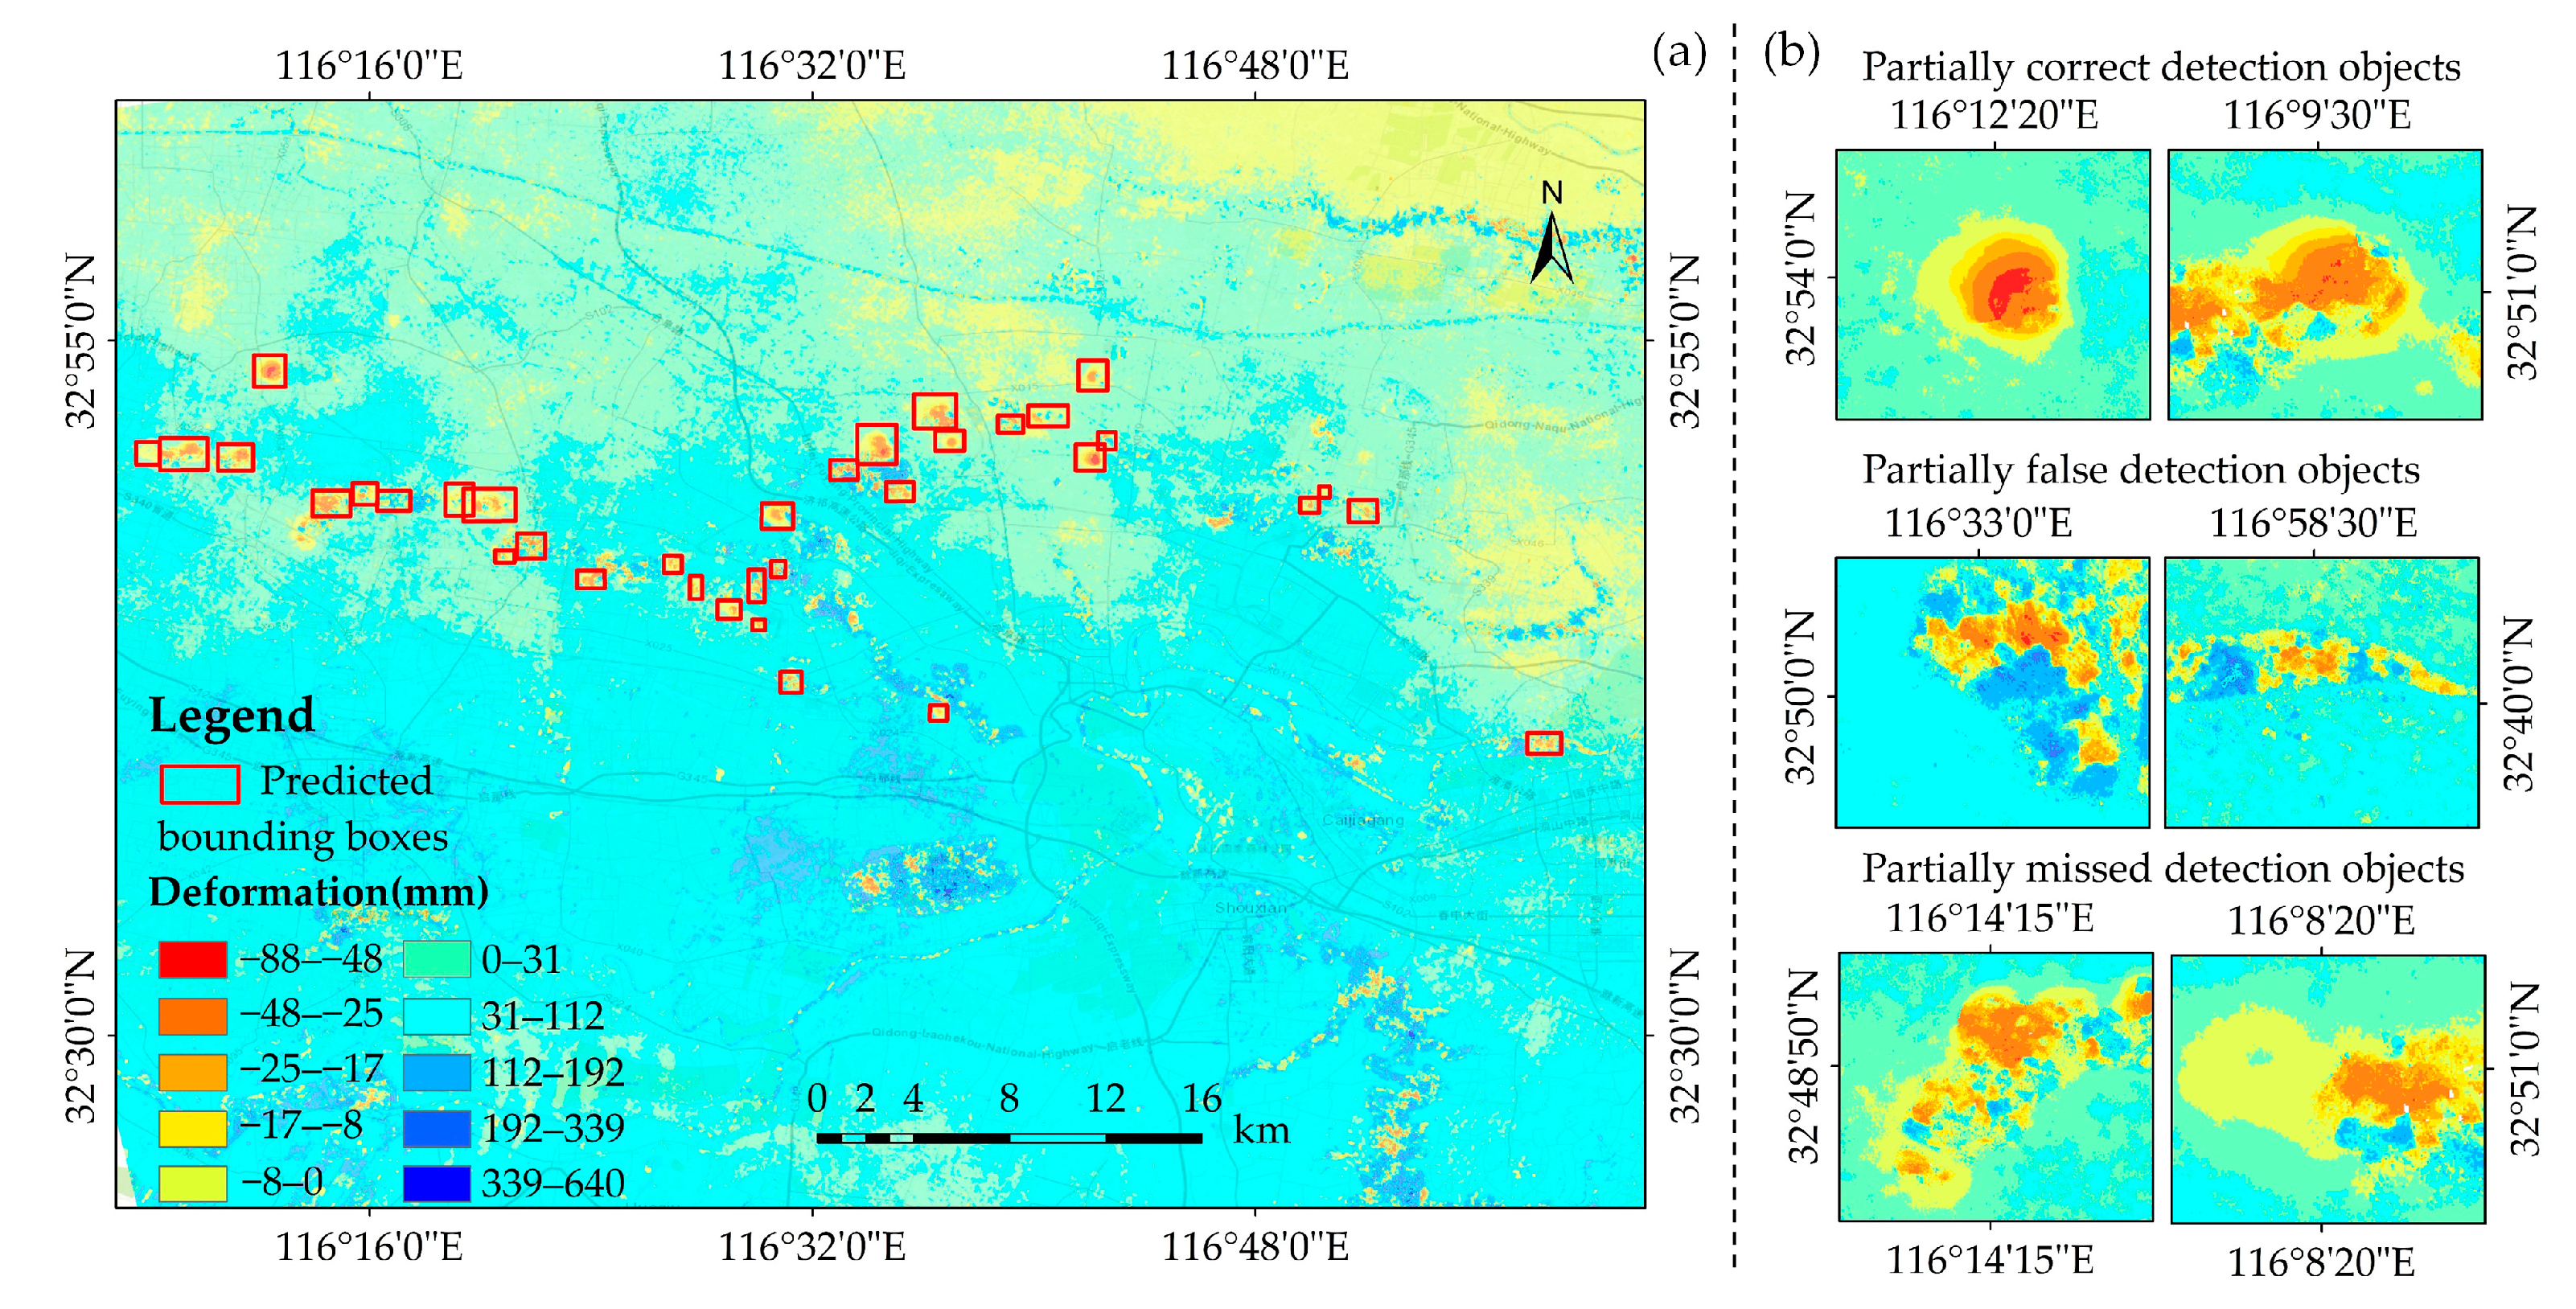
Overall, from November 2023 to 1 February 2024, a total of 451 mining subsidence areas were detected. These subsidence basins were primarily located in northeastern Yingshang County, central Fengtai County, and Panji District. Ground subsidence caused by mining was primarily observed in Liuzhuang, Xieqiao, Zhangji, and Guqiao Coal Mines. The subsidence areas detected by Deformable DETR align with the distribution of major mines. The recognition results for the test set are presented in Figure 9.
Figure 9.
Detection results of Deformable DETR: (a) Single image detection results, (b) Partial target detection results.
3.2.2. Verification of Model Transferability
To verify the migration ability of Deformable DETR in mining subsidence recognition at a wide-area scale, the optimal model trained on the mixed dataset is applied to the dynamically updated dataset to evaluate the real-time performance of the model. Based on data from 9 November 2023, to 1 February 2024, 22 scenes of Sentinel-1 satellite data from 13 February 2024, to 22 October 2024, were added. The interference results with a temporal baseline of 24 days were selected for continuous monitoring of the Huainan mining area, resulting in a total of 20 deformation maps. When newly acquired data becomes available, the same operation as for the historical images is performed in the experiment.
A total of 454 subsidence areas were interpreted through manual visual interpretation, and 402 were detected by Deformable DETR. The accuracy evaluation is shown in Table 3.
Table 3.
Dynamically updated data detection accuracy evaluation metrics.
As shown in Table 3, Deformable DETR achieves an accuracy of 0.884 on the dynamically updated dataset, indicating that the model has superior recognition ability and fewer false detections. The F1-score reaches 0.825, reflecting that the model maintains a good balance between Precision and Recall and can effectively identify most of the subsidence areas. In terms of inference efficiency, the average inference time per image is 0.2 s, with a peak GPU memory footprint of 0.39 GB and a CPU memory increment of 0.37 GB. This performance meets the rapid response requirements for real-time subsidence recognition. These results demonstrate that Deformable DETR exhibits strong robustness with time-varying data, allowing it to quickly adapt to new datasets and provide accurate recognition results.
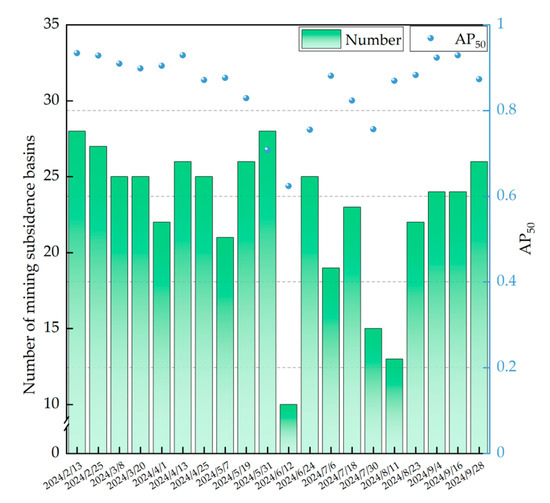
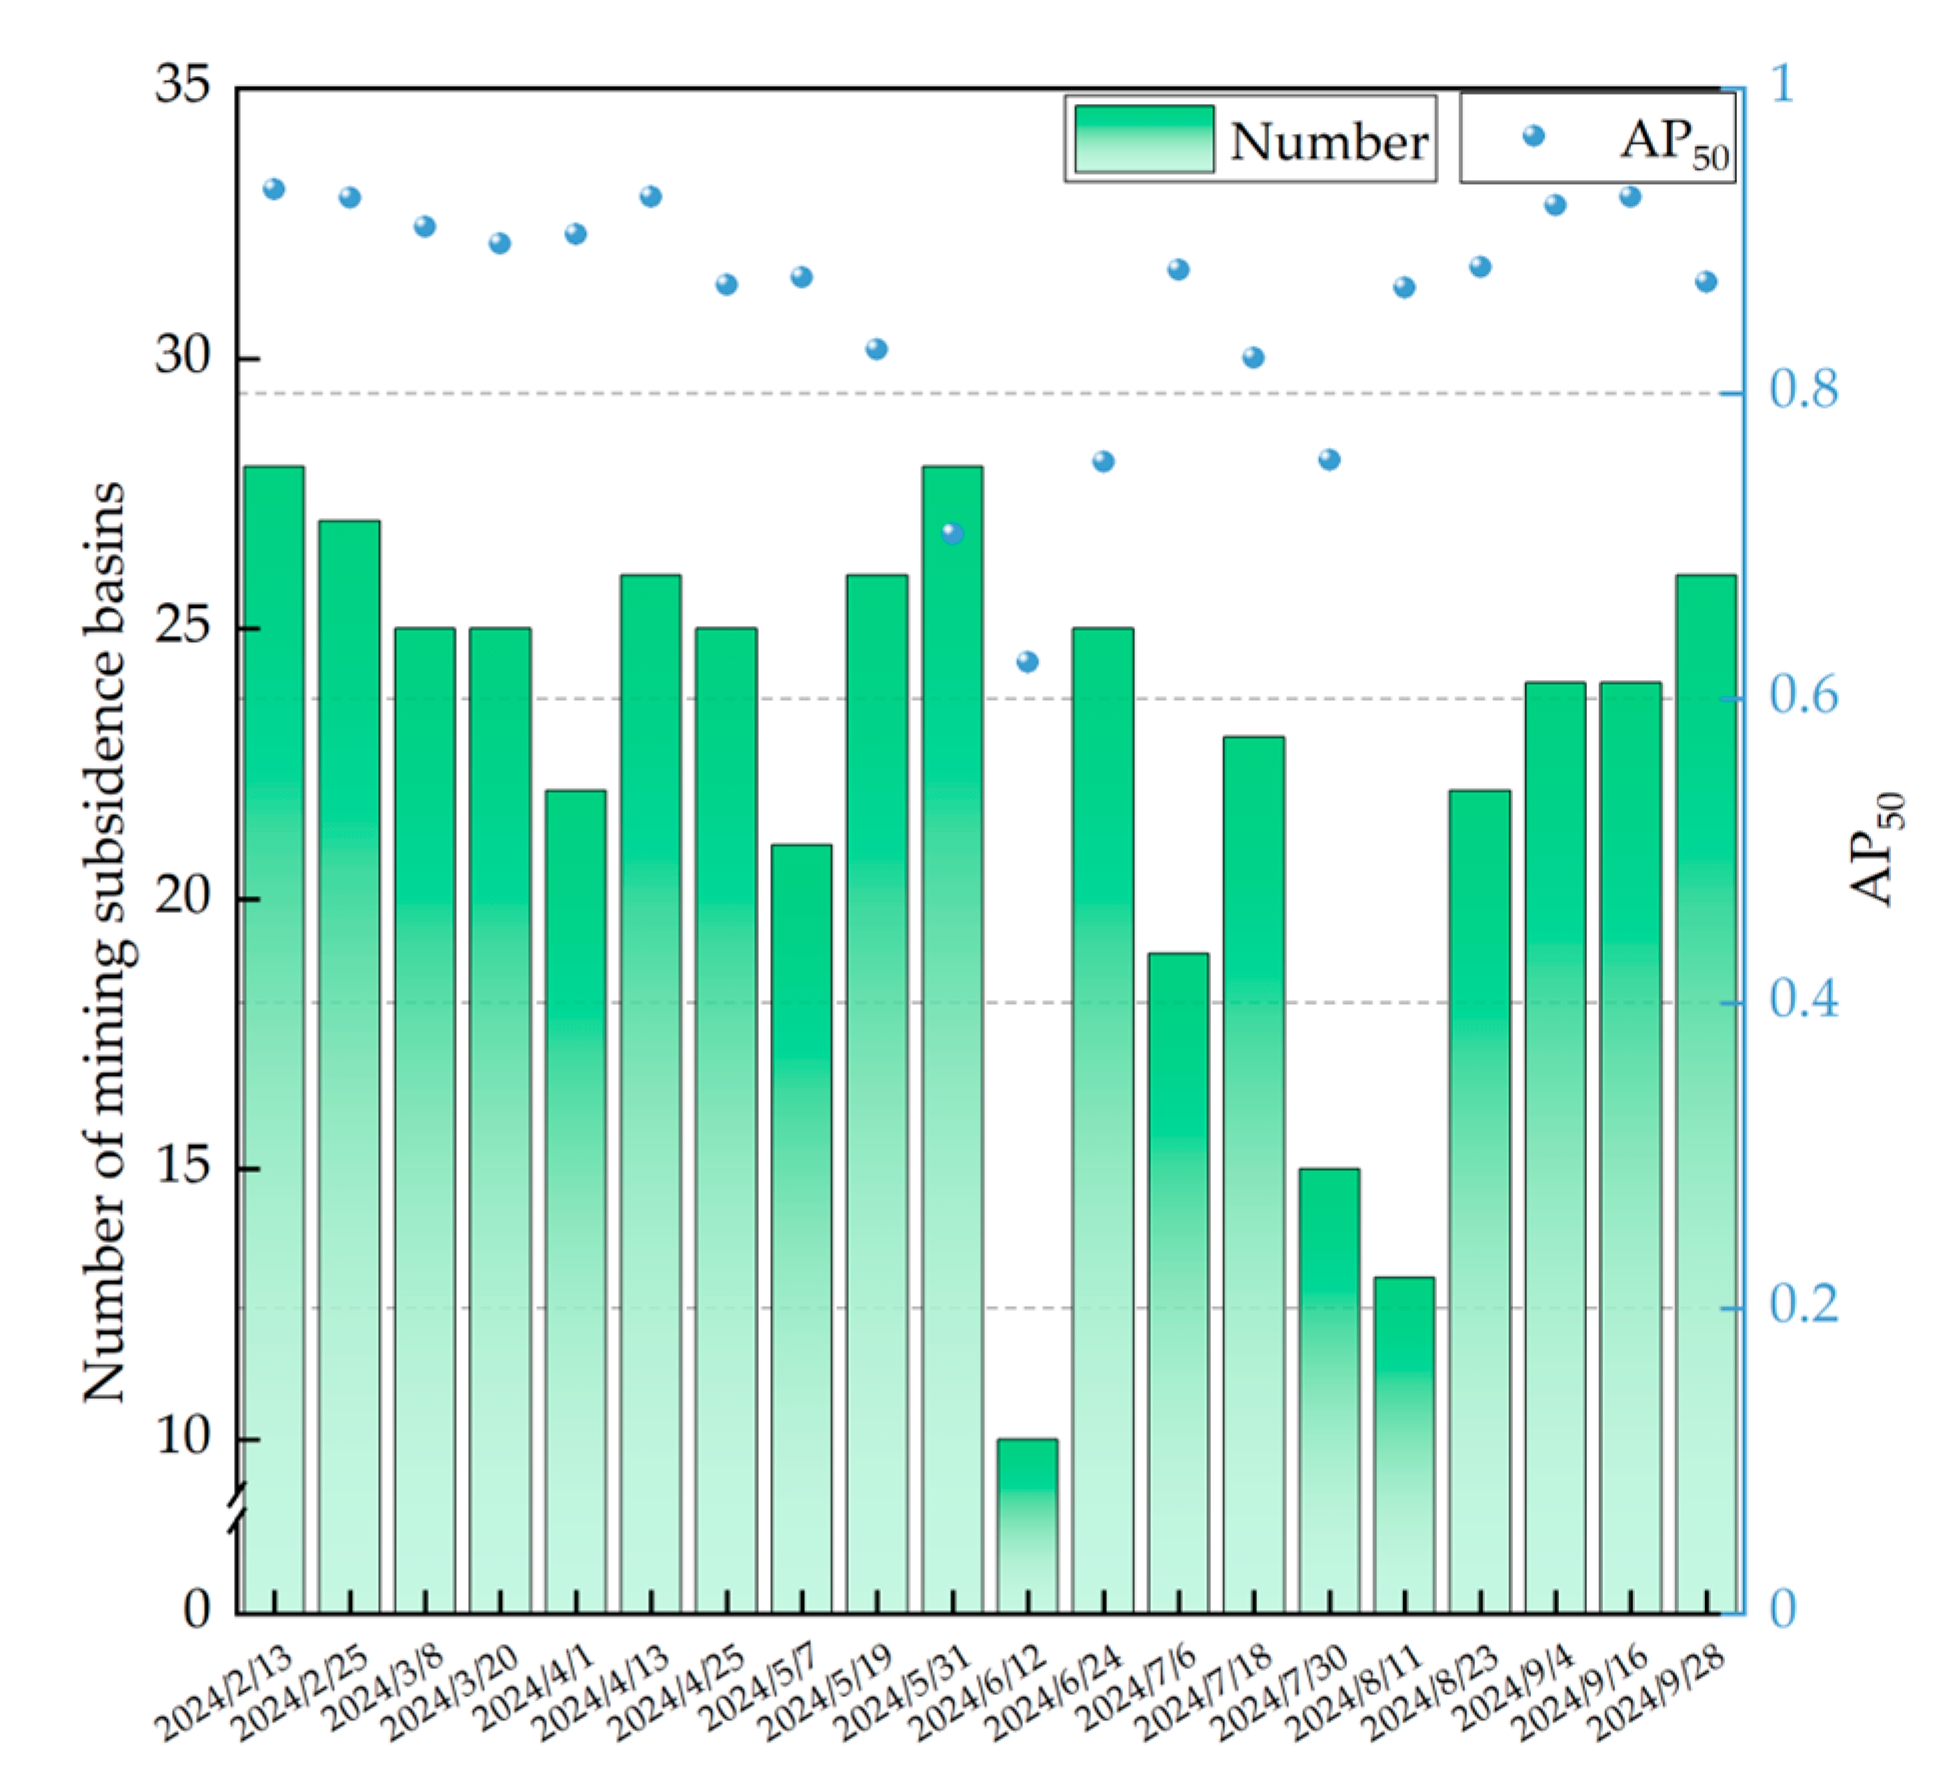
Although Deformable DETR performed well on the initial test set, its Recall and mIoU were lower than Precision on the new dataset. This phenomenon suggests that the number of missed detections in the dynamically updated dataset increased, and the overlap between the predicted results and the true labels decreased. The reason for this change may be related to differences in data quality. To further evaluate how Deformable DETR performs on dynamic datasets, this study compared and analyzed the count of mining subsidence areas identified in different time periods and their corresponding AP50, The results are shown in Figure 10. During the period from February to May 2024, the model consistently detected a stable number of subsidence areas, with the AP50 remaining at a high level, indicating high detection accuracy during this period. However, during the period from June to July, both the number of subsidence areas and the AP50 decreased significantly, indicating an increase in missed detections and a decrease in detection performance. This phenomenon may be related to the dense coverage of vegetation in the summer, which may cause the signal to be absorbed or scattered, making the concentric circles or elliptical fringes in the interference results blurred or missing, thus increasing the difficulty of model identification and positioning of mining subsidence.
Figure 10.
Number of detected mining subsidence areas and AP50.
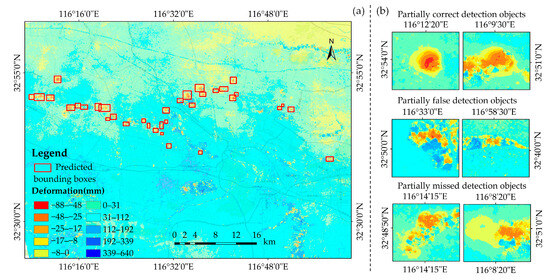
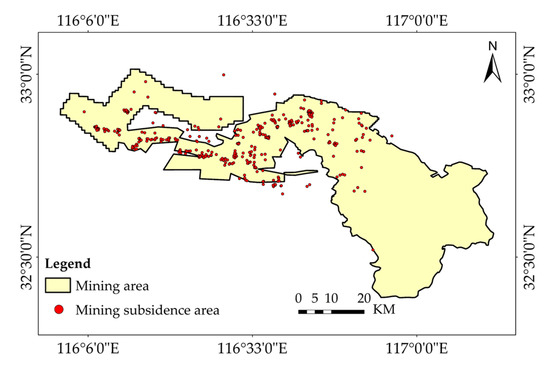
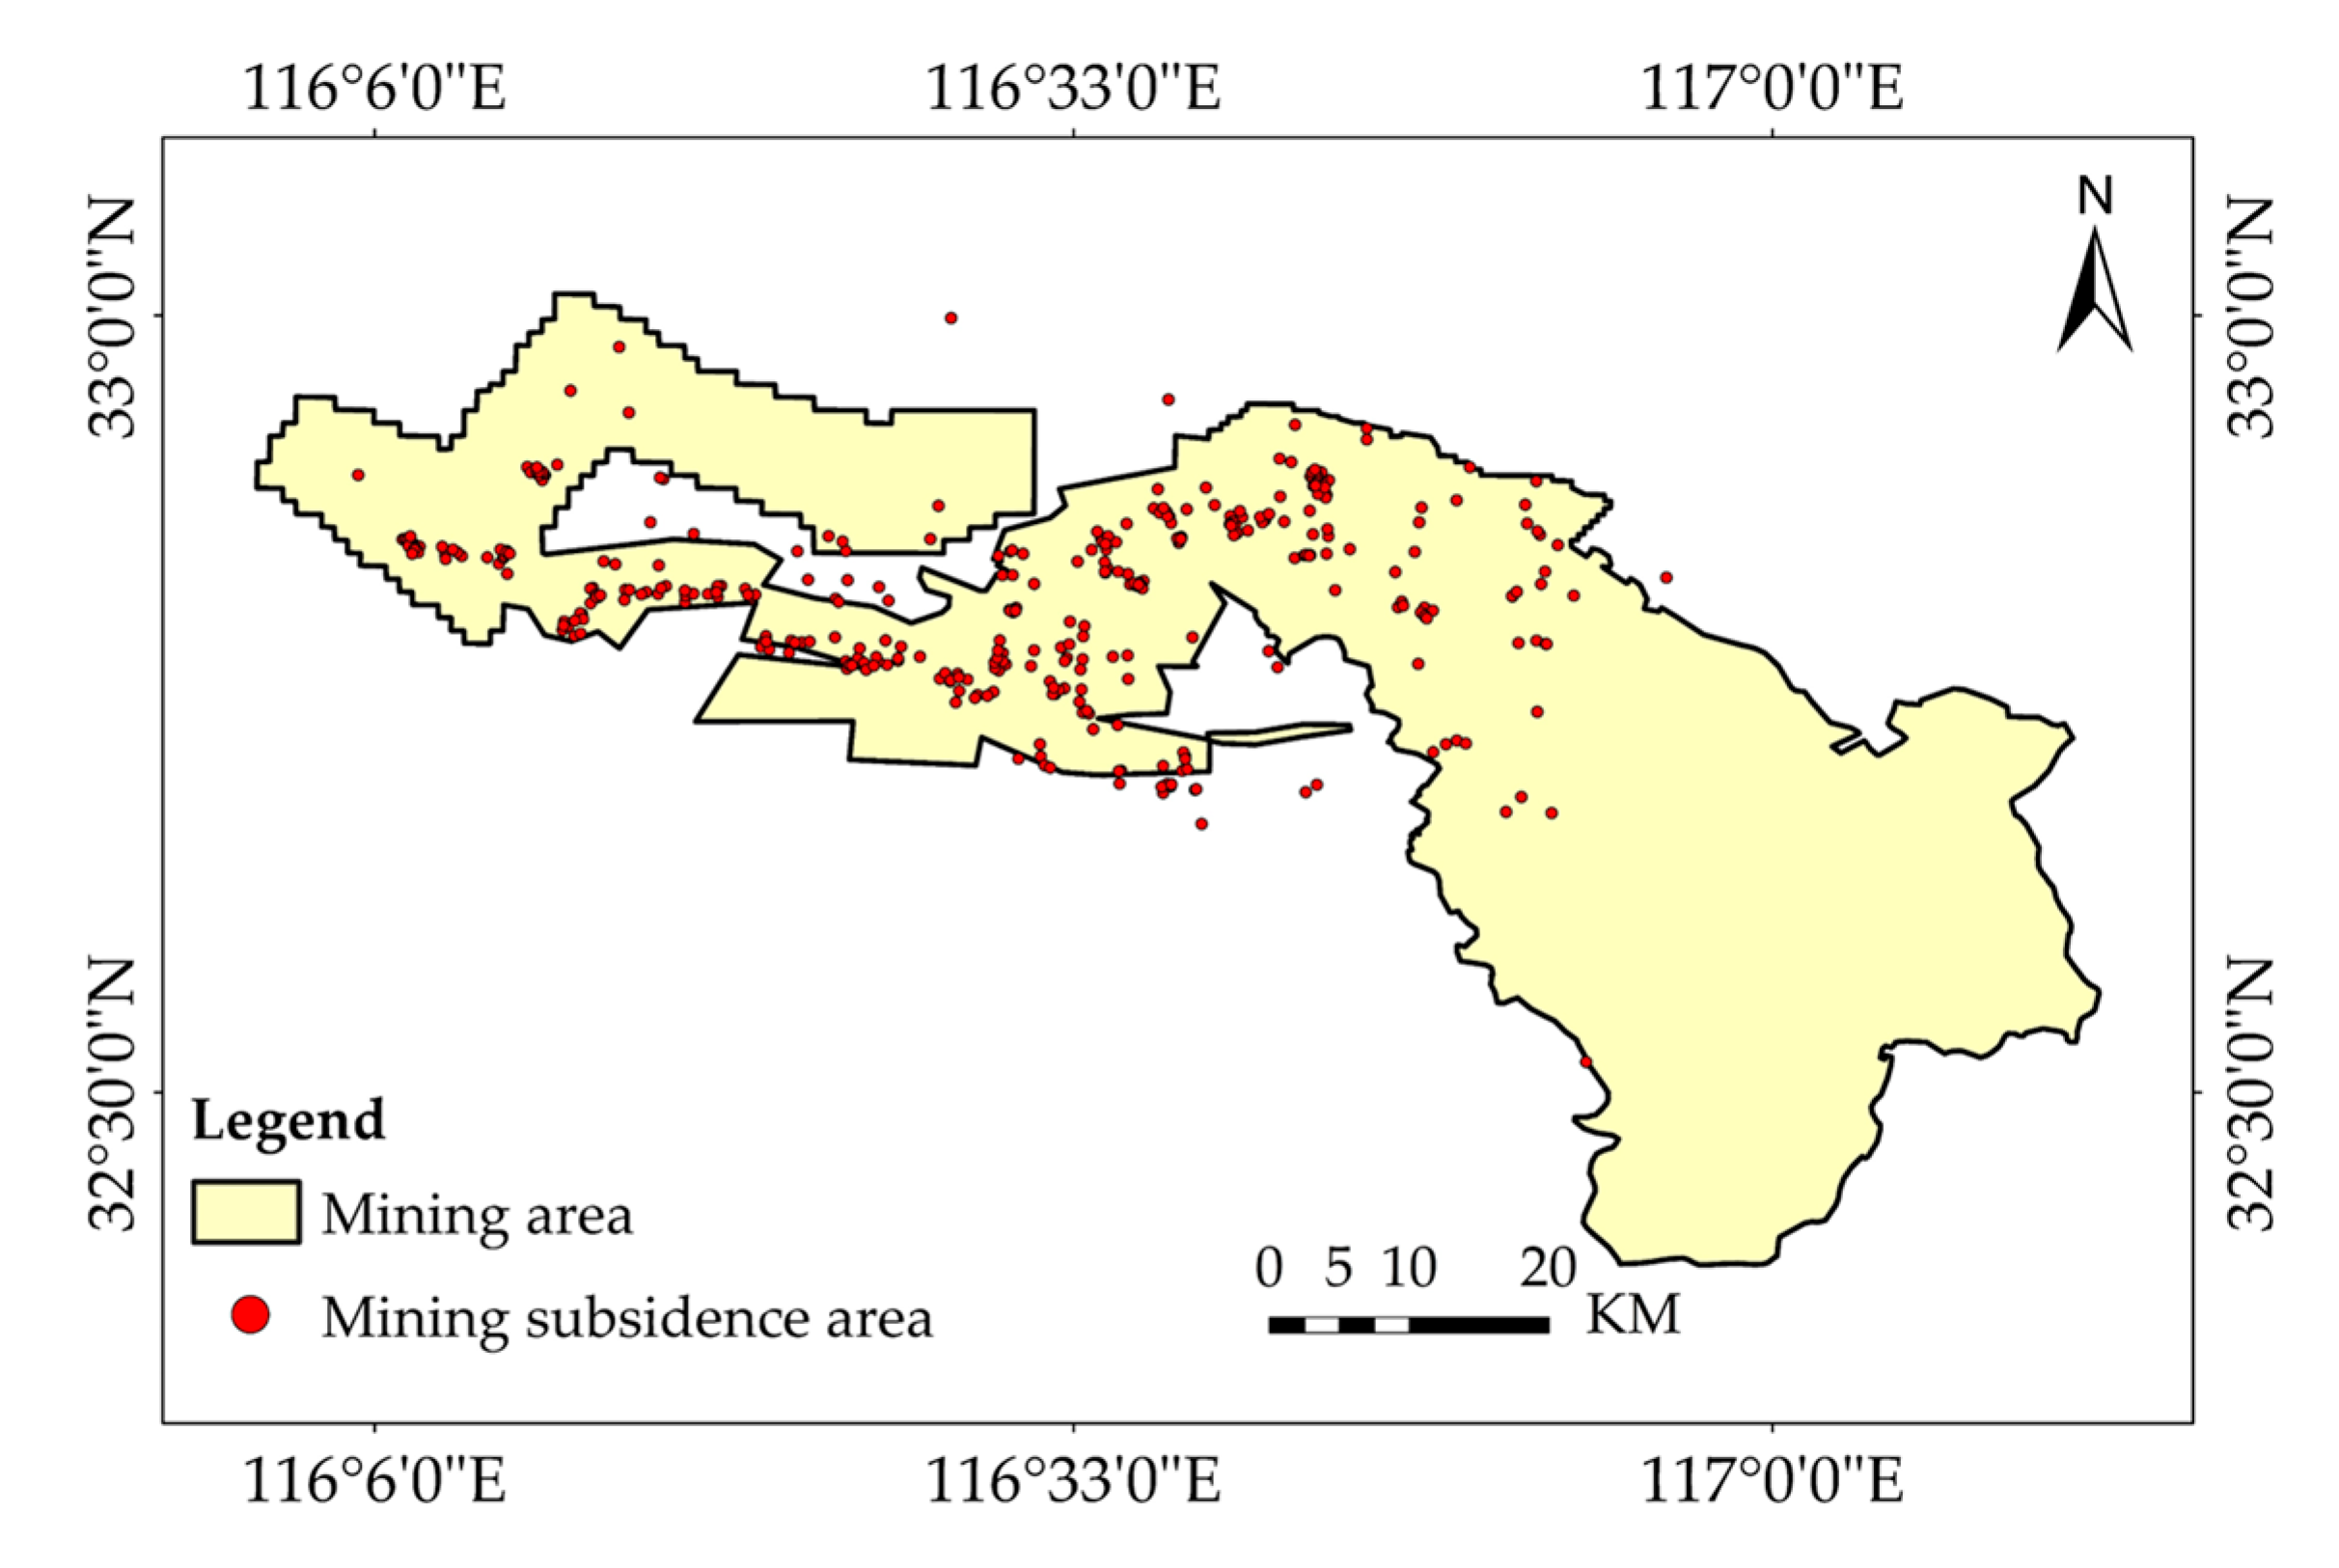
From 13 February 2024, to 22 October 2024, Deformable DETR detected the spatial distribution of mining subsidence basins, as shown in Figure 11. The yellow area in the figure represents the scope of the mining area, and the red points indicate the mining subsidence areas identified by the model. Excluding the influence of summer vegetation, the subsidence areas are primarily concentrated in the central and eastern regions, with the number of subsidence areas being relatively uniform and showing no abrupt fluctuations.
Figure 11.
Mining subsidence detection locations in Huainan. Red dots indicate the detected mining subsidence areas.
This study also observed that a small number of false detection areas in the model’s recognition results are located near water bodies, and these areas resemble the morphological characteristics of the mining area in the deformation map. For example, the shoal area near the tributary of the Huaihe River exhibits subsidence and distinct boundaries during the imaging period, which makes it difficult for the model to interpret accurately. Additionally, an analysis of typical missed detections reveals that the detection performance is unsatisfactory when the target is obscured by significant noise, when the interference condition is poor, or when the settlement range is too small.
4. Discussions
4.1. Optimized Dataset Comparison
To comprehensively evaluate the scale distribution of the targets, this study conducted statistics on the number of targets across different scales. By incorporating simulated data and making its quantity at each scale approximately consistent with that of the real samples, a mixed dataset was constructed. The specific label annotation details are presented in Table 4. Small (objects with an area smaller than 32 × 32 pixels); Medium (objects with an area between 32 × 32 and 96 × 96 pixels); Large (objects larger than 96 × 96 pixels).
Table 4.
Target Counts by Scale in Real and Simulated Datasets.
In the real dataset the Small, Medium, and Large targets account for 33.9%, 29.3%, and 36.8% of the total number of targets, respectively, indicating a relatively balanced scale distribution without an obvious scarcity of small targets. After incorporating the simulated dataset, the number of targets at each scale is further increased overall, while the counts of the three scales remain on the same order of magnitude.
To test the advantages of the proposed mixed sample set in monitoring mining subsidence basins, the real dataset is used for training, and the mixed dataset is used for retraining. The detection accuracy of the three models under different datasets is compared, as shown in Table 5. APL represents the large object recognition accuracy; APM represents the average precision for medium objects; and APS represents the average precision for small objects. The average detection accuracy at IoU thresholds of 50 and 75 is used as the evaluation metric (AP50 and AP75).
Table 5.
Comparison of detection accuracy of three models on test sets from different datasets.
Experimental results show that all three models achieve improved mAP on the mixed dataset compared to training with only the real dataset. Specifically, Faster R-CNN’s mAP improves by 0.7%, DETR by 1.5%, and Deformable DETR by 1.6%.
At different IoU thresholds (AP50 and AP75), Faster R-CNN shows improvements across all metrics on the mixed dataset, although the gains are smaller. DETR and Deformable DETR experience a slight decrease in AP50 but still maintain high detection accuracy. For the more stringent AP75 metric, all models show improvements. Among them, Deformable DETR demonstrates the most significant improvement in AP75 on the mixed dataset, reaching 6.3%. Despite some performance degradation at lower IoU thresholds, it still achieves significant improvements in high-precision detection tasks. Furthermore, an analysis of performance across different object scales reveals that Deformable DETR demonstrates higher accuracy in small object detection tasks, with its APS increasing from 0.550 to 0.600, a 0.5% improvement.
In summary, the adoption of mixed datasets has a beneficial impact on model performance. It effectively enhances the model’s learning ability and improves its recognition performance of mining subsidence areas at different scales, thereby increasing the efficiency of the overall detection task.
4.2. The Impact of the Quantity of Dataset
In the field of automatic detection of mining subsidence basins, Deformable DETR has garnered significant attention due to its outstanding capability in handling complex scenes and detecting objects at different scales. However, the performance of the model depends largely on the quality and quantity of the training data. To evaluate the generalization ability and detection performance, the experiment investigates the influence of the quantity of training datasets on Deformable DETR. The original training set was augmented by adding 20% real data and 20% simulated data, and training was performed based on the existing training weight files. The results are shown in Table 6.
Table 6.
Deformable DETR detection results with datasets added.
It can be seen from Table 5 that, when 20% real data is added, the model’s mAP increases to 0.593, and APL reaches 0.539. The other metrics remain almost the same as those with the original data, and the overall performance shows a slight improvement. This indicates that the increase in real samples has a positive but limited effect on the model’s performance. When 20% simulated data is added, APL increases by 13.4%, while mAP decreases slightly, suggesting that simulated data has targeted optimization capabilities in specific scenarios. However, simply adding real or simulated data has a relatively minor impact on the overall detection accuracy of the Deformable DETR model. When 20% real data and 20% simulated data are added simultaneously, the model demonstrates better generalization and adaptation abilities, with mAP rising to 0.596, which is higher than that with the original mixed dataset. This shows that the introduction of a mixed dataset has a favorable impact on the detection effectiveness of the Deformable DETR model for detecting mining subsidence basins.
4.3. Robustness Analysis of the Model
4.3.1. Model Analysis Under Different Noise Combinations
In the detection of mining subsidence at a wide-area scale, the images obtained through D-InSAR technology are often accompanied by various noise signals, such as atmospheric delay, orbit errors, and decoherence signals. The intensity and spatial distribution differences of these noise signals can lead to artifacts or errors in the deformation results, presenting significant challenges to the recognition and extraction of information.
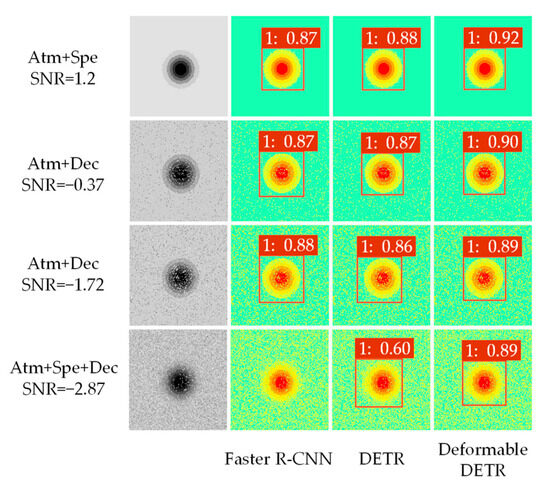
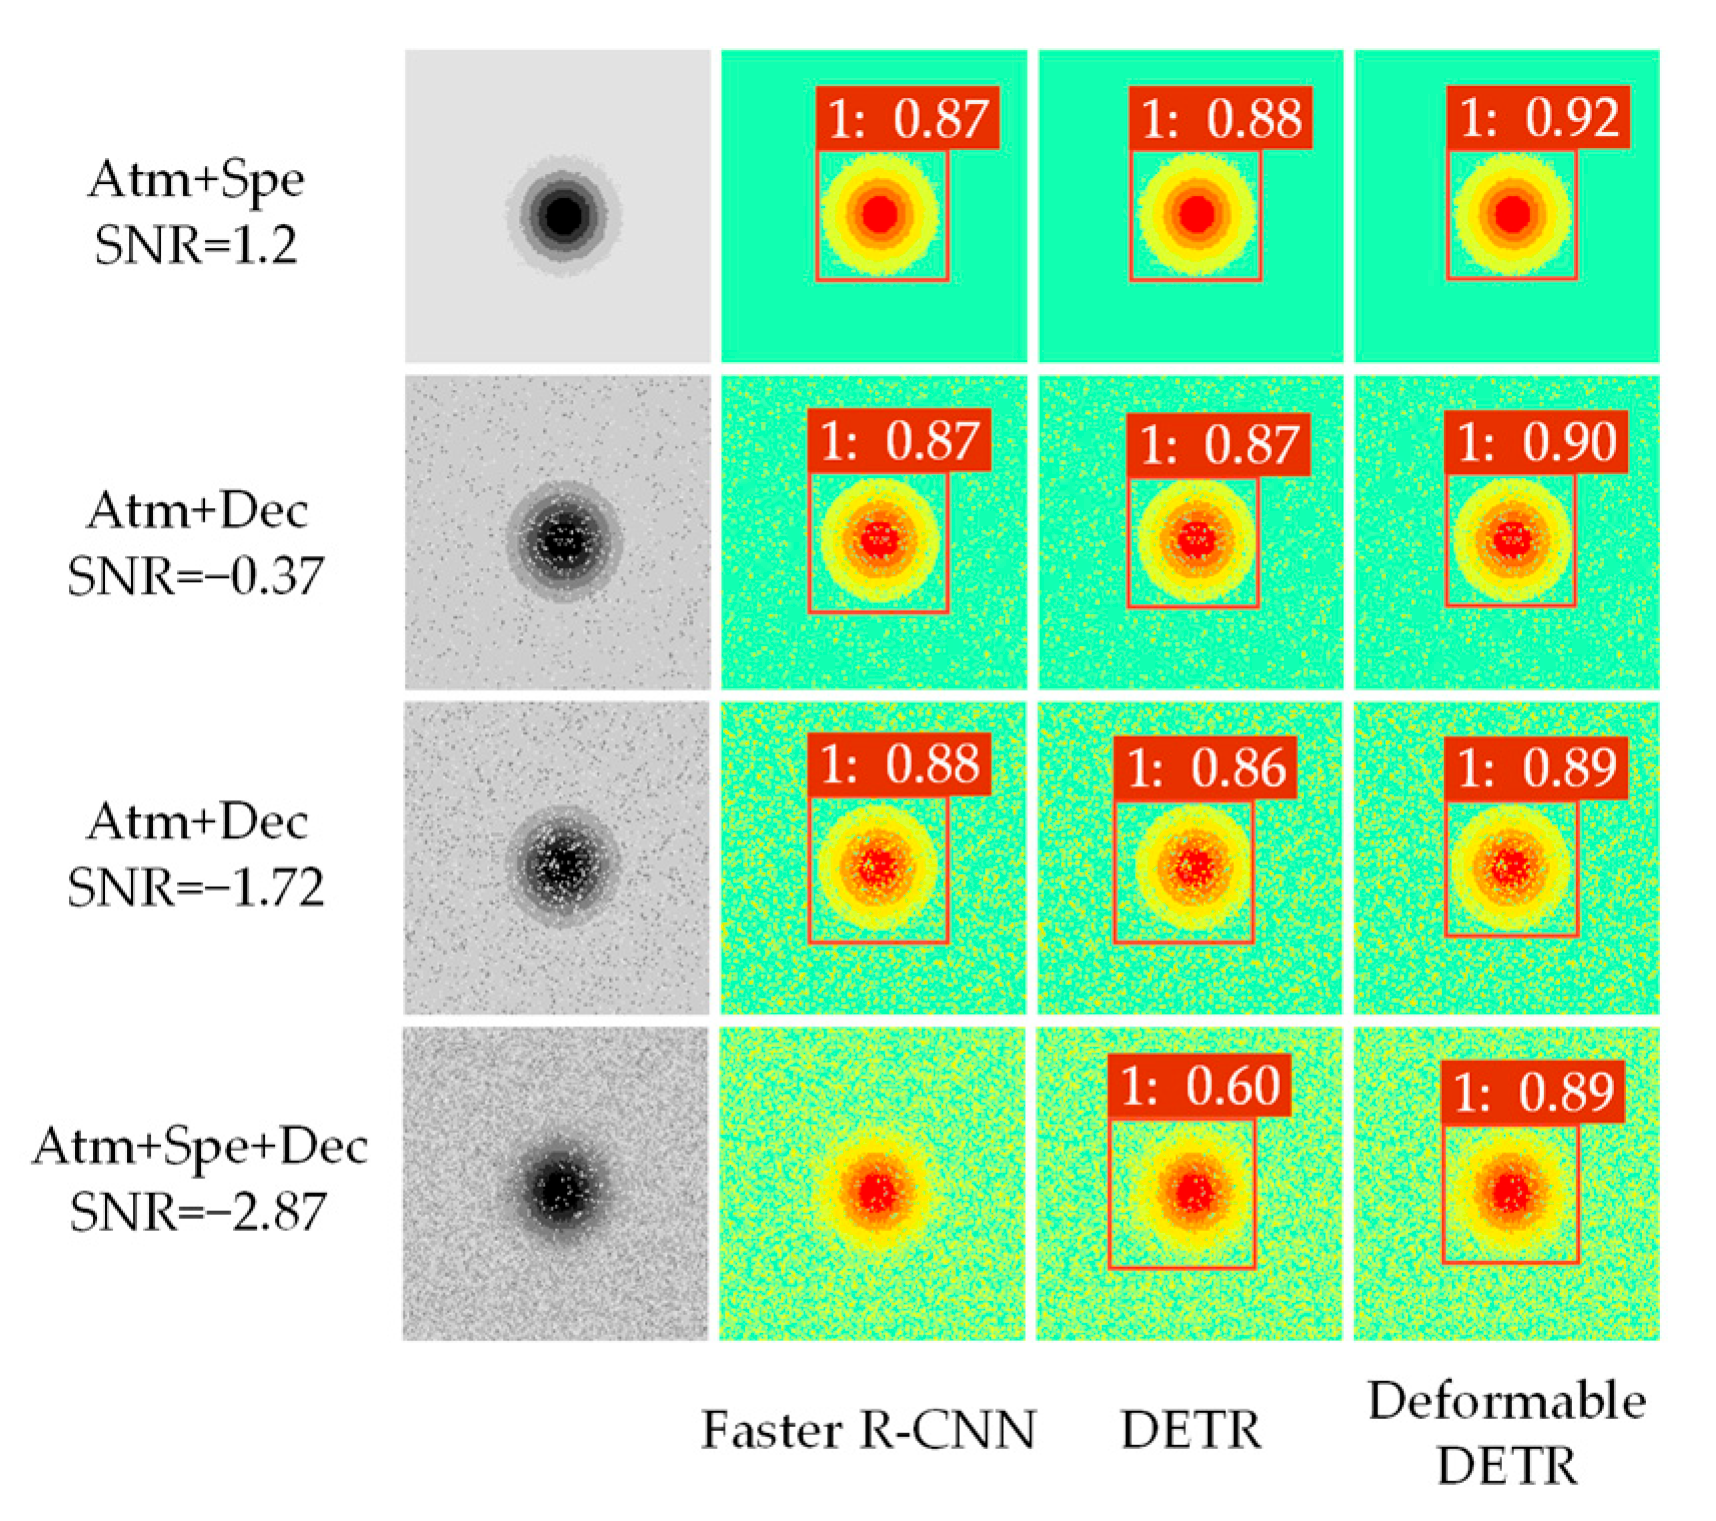
To quantify the influence of these noise signals on the performance of subsidence detection, three typical noise types—atmospheric delay noise (Atm), speckle noise (Spe), and decoherence noise (Dec)—are simulated experimentally. Four different signal combinations—Atm + Spe, Atm + Dec, Spe + Dec, and Atm + Spe + Dec—are constructed. These combinations are designed to reflect the noise conditions that could occur in practical scenarios. Table 7 presents the signal-to-noise ratio (SNR) under various noise combinations. Specifically, the SNR for the Atm + Spe combination is 1.2 dB, the SNR for the Atm + Dec combination is −0.37 dB, the SNR for the Spe + Dec combination is −1.72 dB, and the SNR for the Atm + Spe + Dec combination is −2.87 dB. Observations reveal that as the number of noise types increases, the SNR continuously declines, progressively degrading signal quality.
Table 7.
SNR for different noise combinations.
After simulating different noise combinations, the experiment superimposes these noises onto the original deformation map to further assess the recognition performance of the three models across various noise scenarios. Figure 12 presents the recognition results of different models for mining subsidence basins. The results indicate that the impact on model performance gradually increases with the superposition of noise. The combination of Atm and Spe noise has a relatively small impact on the model, while Dec has a greater effect on model performance when combined with other signals. In the case of two-noise combinations, all three models can identify the mining subsidence area, but the confidence levels differ. For example, when Atm + Spe, Atm + Dec, and Spe + Dec are superimposed, the confidence of the Faster R-CNN and DETR models remains stable at 0.87, while Deformable DETR achieves a higher confidence, stabilizing at 0.9. Particularly when the Spe + Dec noise signal is combined, and the SNR is reduced to −1.72 dB, Deformable DETR exhibits higher positional accuracy and recognition accuracy than the other two models.
Figure 12.
Model recognition results under different noise combinations.
When all three types of noise are present, Faster R-CNN fails to detect the target, and the confidence of DETR decreases significantly. In contrast, the detection accuracy of Deformable DETR remains stable and high. These results demonstrate that Deformable DETR can withstand a certain intensity of noise signals and exhibits strong robustness.
4.3.2. Hyperparameter Analysis
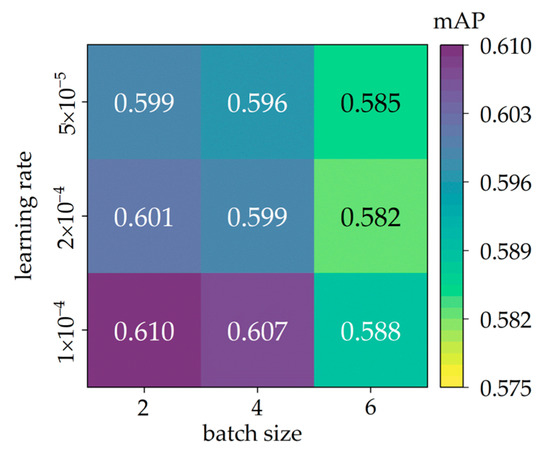
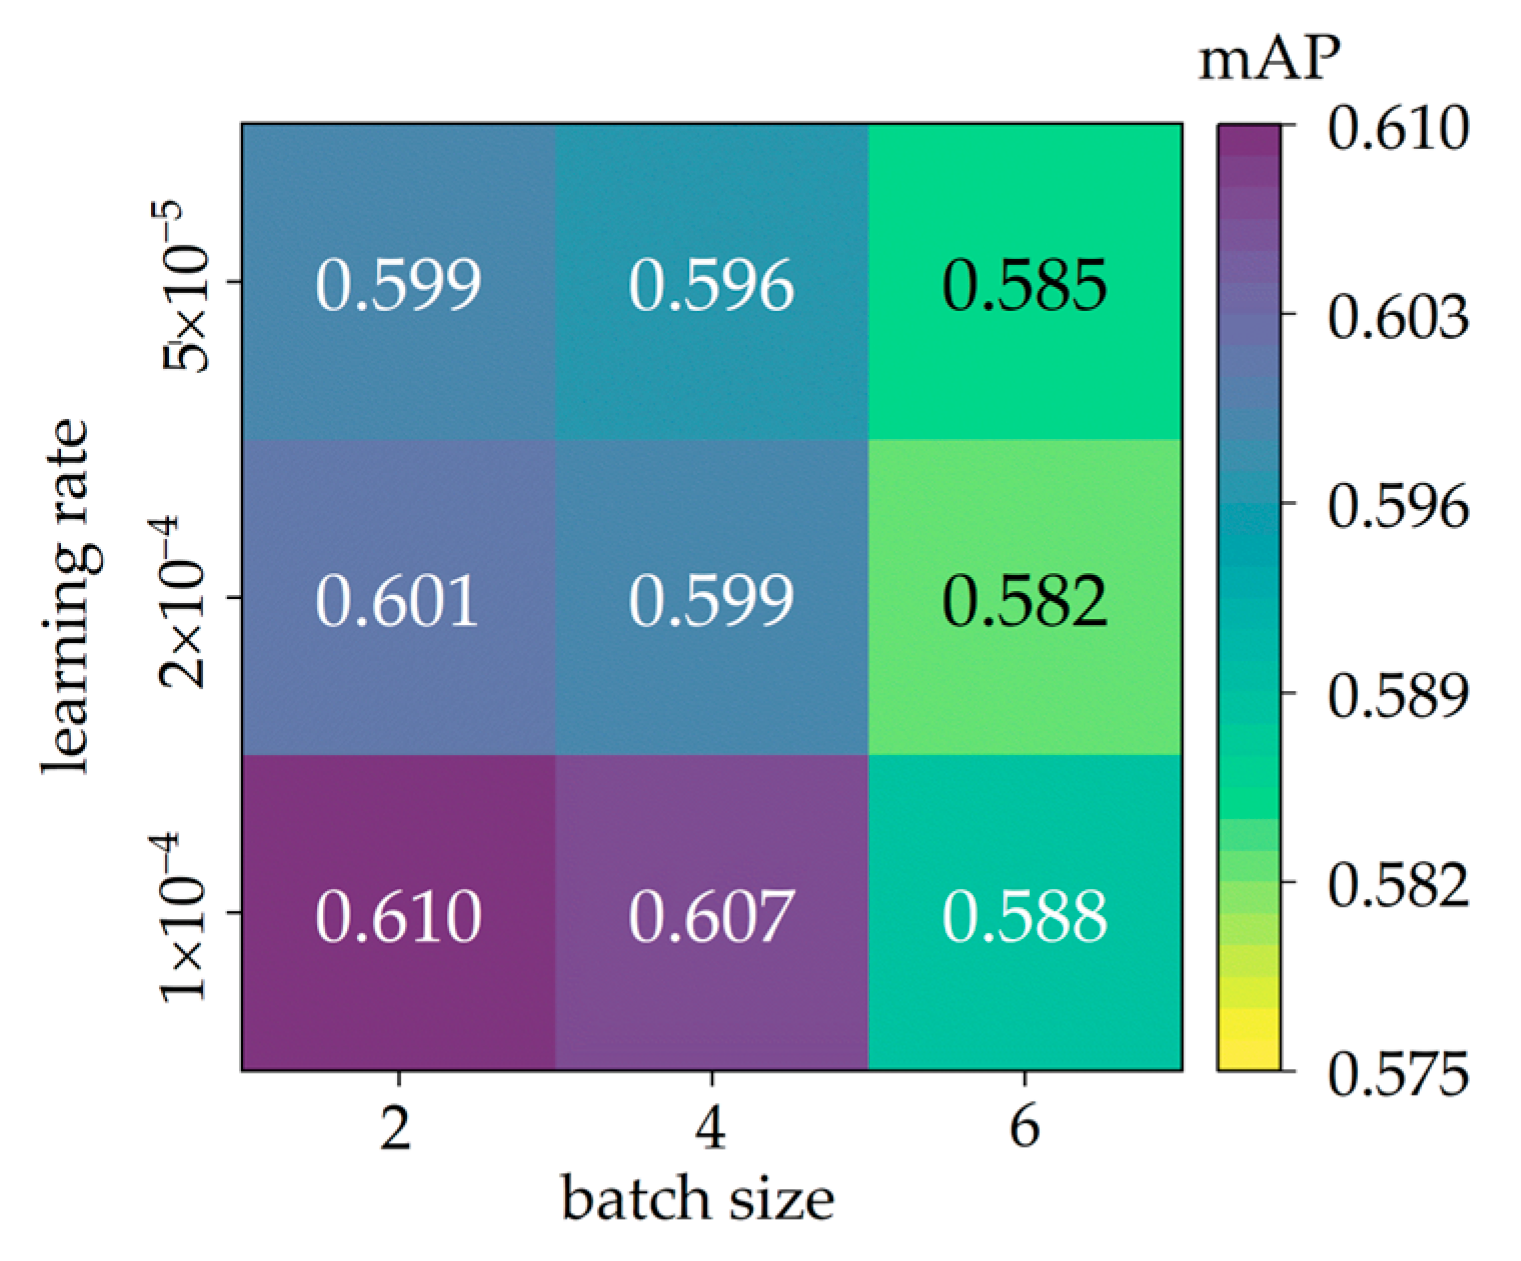
To evaluate the impact of batch size and learning rate on Deformable DETR, we conduct a hyperparameter sensitivity analysis on the mixed dataset. The parameter configurations and comparative results are shown in Figure 13.
Figure 13.
Parameter sensitivity analysis of Deformable DETR on the mixed dataset.
The results show that, within the considered parameter range, the model exhibits stable performance, with mAP ranging from 0.582 to 0.610 and a maximum variation of approximately 0.028. As the batch size increases from 2 to 6, the mAP decreases gradually. Across different batch size settings, a learning rate of 1 × 10⁻⁴ yields the relatively optimal performance. These observations indicate that the model performs reliably within this key hyperparameter range and supports the choice of the current configuration as a reasonable default.
4.4. Sensitivity Analysis of Different Temporal Baselines
During interferometric processing, selecting an appropriate temporal baseline is crucial for obtaining high-precision subsidence information. With a short baseline, surface changes are relatively small, which effectively captures minor surface changes and is suitable for early settlement monitoring. However, subsidence in some mining areas may not be easily detected visually. As the temporal baseline lengthens, cumulative subsidence within the same mining subsidence area increases, and deformation becomes more pronounced, providing opportunities for further deformation analysis. However, as time passes, factors such as time decorrelation, atmospheric delay, and surface activity lead to instability in the phase relationship of the interference signal, which blurs the characteristics of the mining subsidence basin. Therefore, when selecting the temporal baseline, it is necessary to balance the relationship between the quality of the interference and the time span.
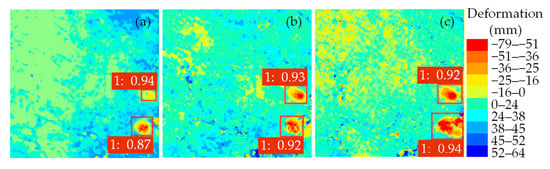
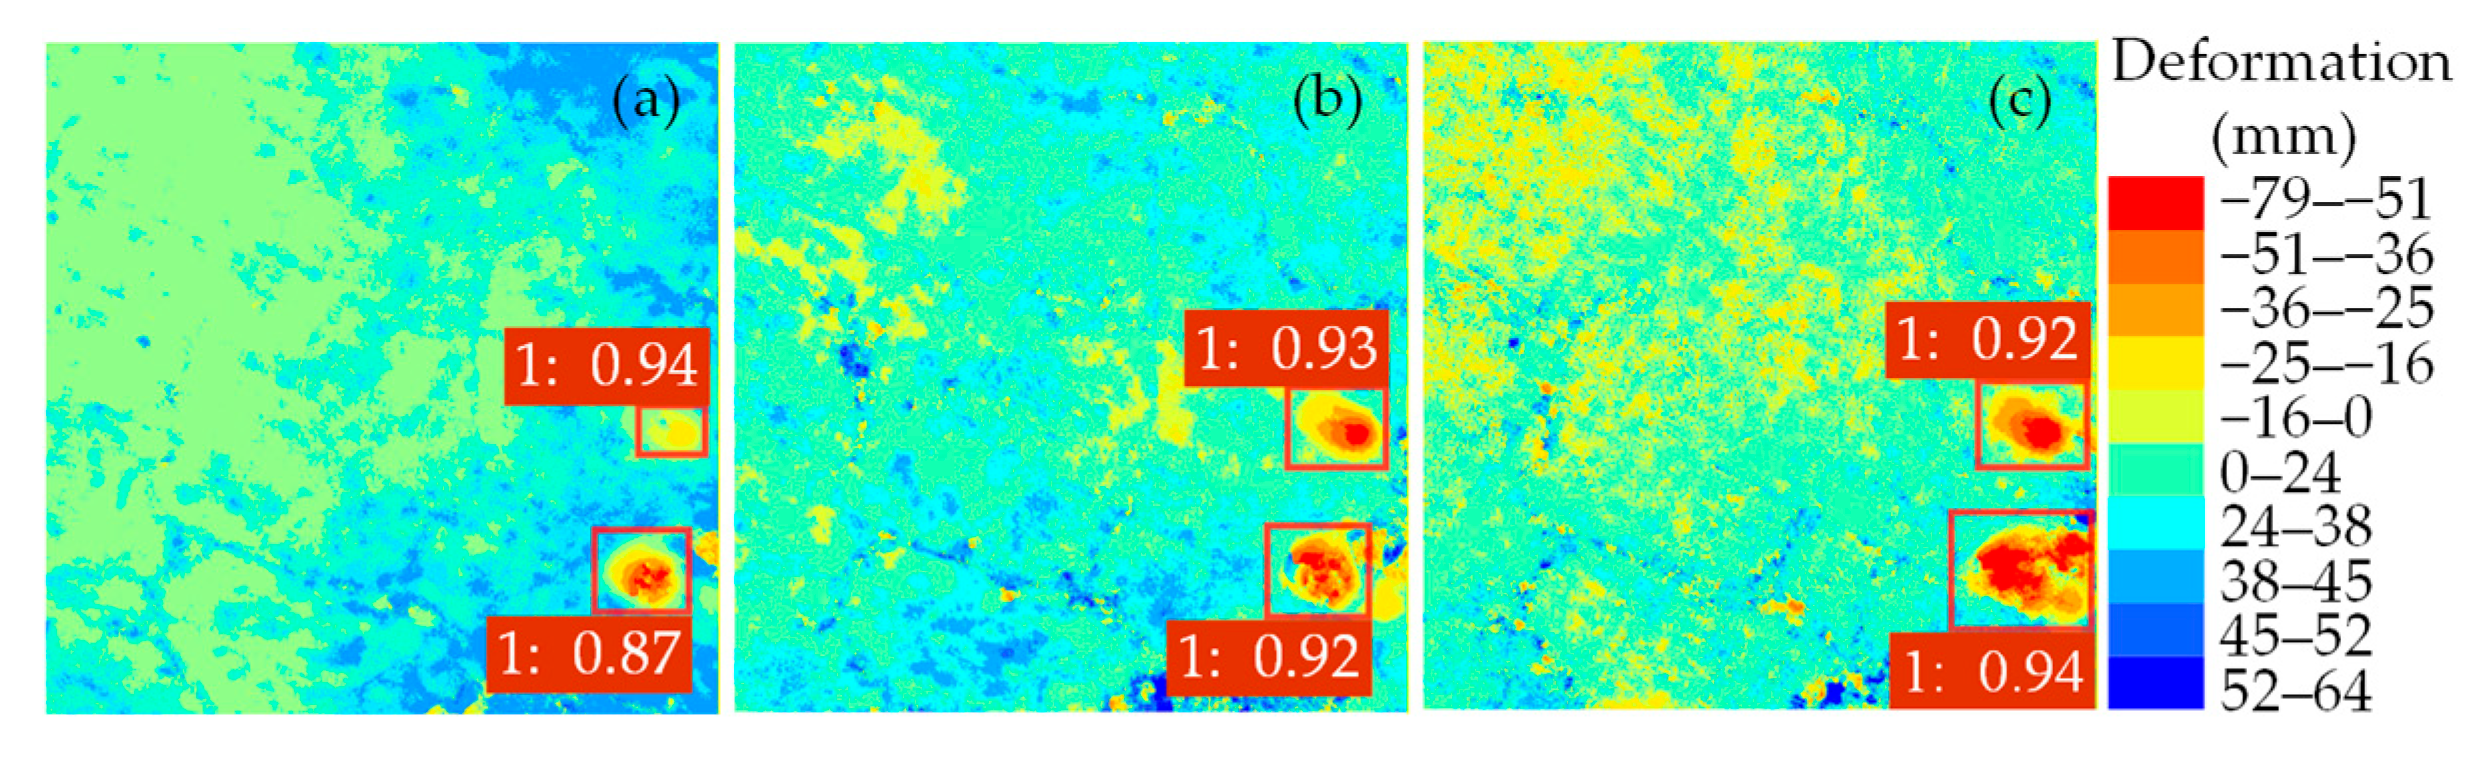
The experiment uses a 12-day increment to explore the impact of different baselines on detection accuracy. Figure 14 selects two mining subsidence targets, A and B, for model performance analysis. When the temporal baseline is 12 days, the deformation area of target A is small, with an incomplete shape, no obvious center subsidence, and a maximum cumulative deformation of 18 mm. At 24 days, the maximum cumulative deformation increases to 29 mm, appearing as an irregular elliptical shape in the RGB images. At 36 days, the maximum subsidence reaches 47 mm, and the elliptical shape gradually stabilizes. Under different temporal baselines, the model demonstrates relatively good detection performance in area A, with the confidence level remaining stable at around 0.93. For the significant deformation area B, as the temporal baseline extends, the extent of the mining subsidence basin begins to expand, its boundary shifts, and the edge region exhibits a complex and irregular shape, with the maximum cumulative deformation reaching 79 mm. At this time, the model still maintains high detection accuracy, up to 0.94, for the significant deformation region B.
Figure 14.
Deformable DETR detection results under different temporal baselines: (a) 12 days, (b) 24 days, (c) 36 days.
Table 8 presents an overall analysis of detection performance for different temporal baselines in the test set. As the temporal baseline increases from 12 to 24 days, accuracy in detecting mining subsidence basins improves: mAP increases by 1.2%, and AP by 1.3%. After further extension to 36 days, the target detection accuracy fluctuates slightly but not significantly. This suggests that appropriately extending the temporal baseline helps the model capture more deformation information and improves its detection ability for mining subsidence basins. Therefore, when implementing mining subsidence basin detection, it is recommended to select a temporal baseline of 24 or 36 days, depending on the specific situation, to achieve the best detection results.
Table 8.
Performance of the model over temporal baselines.
4.5. Differences Between Simulated Data and Real Data
This study employs a probability-integration-based dynamic prediction model with parameter variation to simulate surface deformation. The parameter ranges are constrained by integrating geological information and monitoring data from the mining area, ensuring a physically plausible deformation gradient at the overall scale. The simulated deformation dataset exhibits a subsidence range of 0–190 mm, consistent in magnitude with real subsidence observed by D-InSAR over temporal baselines of 12–36 days. Within this range, the deformation gradients and temporal trends of the simulated samples closely resemble those of the observed data. However, real deformation scenarios are far more complex than idealized models: irregular and asymmetric patterns frequently emerge, and parametric approaches struggle to reproduce such intricate features. To bridge this gap, elastic transformation is introduced to enrich boundary shapes and internal deformation structures, thereby better approximating the irregular morphology of actual deformation fields.
In terms of noise distribution, different types of atmospheric turbulence and noise are simulated by superimposing fractal Perlin noise with varying frequencies and amplitudes and introducing a Gaussian noise model. By varying the noise components and their combination patterns, a series of scenarios ranging from medium to low signal-to-noise ratios is constructed, so that the deformation fringes, speckle textures, and other features exhibit variation trends similar to those observed in D-InSAR.
Simulated samples are essentially approximations of real samples, which can expand sample diversity and enable the model to adapt to complex noise signals. Future work will further refine the characterization of noise properties and the deformation process, so as to gradually reduce the disparity between simulated and real data.
5. Conclusions
This paper proposes an automatic mining subsidence identification method that integrates InSAR and Deformable DETR for large-scale mining subsidence detection. The real and simulated deformation maps obtained by D-InSAR are used to form a mixed dataset for training, and the following conclusions are drawn:
(1) The integration of mixed datasets significantly enhances the detection accuracy of Faster R-CNN, DETR, and Deformable DETR. After adding the simulation dataset, the mAP, AP50, and AP75 for Deformable DETR reached 0.592, 0.899, and 0.695, respectively, outperforming the other two models. This result demonstrates the effectiveness of mixed datasets in improving model performance.
(2) Deformable DETR detected 451 mining subsidence areas in 18 Sentinel images covering the Huainan mining area, with an accuracy of 0.926, achieving a good recognition effect. Furthermore, when validated on a dynamically updated dataset, the model quickly identified 402 mining subsidence areas with an accuracy of 0.884, demonstrating the transferability of Deformable DETR to time-varying data.
(3) The proposed method for automatic mining subsidence identification, integrating InSAR and Deformable DETR, is an effective technical tool that can provide strong support for detecting large-scale mining subsidence areas. Future work will further improve the diversity of samples and extend the method to a wider range of application scenarios.
Author Contributions
Methodology, S.C., S.D. and J.Y.; Software, D.A.; Formal analysis, L.W. and M.Z.; Investigation, Q.G.; Resources, L.W.; Data curation, S.C. and Q.G.; Writing—original draft, D.A.; Writing—review & editing, S.C.; Visualization, S.D., J.Y. and M.Z.; Supervision, S.D.; Project administration, S.C.; Funding acquisition, S.C. and L.W. All authors have read and agreed to the published version of the manuscript.
Funding
This work was supported by the National Natural Science Foundation of China (Grant Nos. 52504186, 52074010, and 52504185), the Key Laboratory of Aviation-Aerospace-Ground Cooperative Monitoring and Early Warning of Coal Mining-induced Disasters of Anhui Higher Education Institutes (Grant No. KLAHEI202303), the Coal Industry Engineering Research Center of Mining Area Environmental and Disaster Cooperative Monitoring (Grant No. KSXTJC202201), and the Introduction of Talent Research Start-up Fund of Anhui University of Science and Technology (Grant No. 2021yjrc43).
Data Availability Statement
The original contributions presented in this study are included in the article. Further inquiries can be directed to the corresponding author.
Acknowledgments
The authors gratefully acknowledge the many important contributions from the researchers of all the reports cited in this paper.
Conflicts of Interest
The authors declare no conflicts of interest.
References
- Wang, S.; Li, B.; Zhao, X.; Hu, Q.; Liu, D. Assessing fossil energy supply security in China using ecological network analysis from a supply chain perspective. Energy 2024, 288, 129772. [Google Scholar] [CrossRef] [Scilit]
- Hower, J.C.; Finkelman, R.B.; Eble, C.F.; Arnold, B.J. Understanding coal quality and the critical importance of comprehensive coal analyses. Int. J. Coal Geol. 2022, 263, 104120. [Google Scholar] [CrossRef] [Scilit]
- Tian, X.; Yao, X.; Zhou, Z.; Tao, T. Surface Multi-Hazard Effects of Underground Coal Mining in Mountainous Regions. Remote Sens. 2025, 17, 122. [Google Scholar] [CrossRef] [Scilit]
- Fan, H.; Li, T.; Gao, Y.; Deng, K.; Wu, H. Characteristics inversion of underground goaf based on InSAR techniques and PIM. Int. J. Appl. Earth Obs. Geoinf. 2021, 103, 102526. [Google Scholar] [CrossRef] [Scilit]
- Xu, Z.; Xu, W.; Zhu, Z.; Zhao, J. Research on monitoring and stability evaluation of ground subsidence in gypsum mine goaf. Front. Environ. Sci. 2023, 10, 1097874. [Google Scholar] [CrossRef] [Scilit]
- Bharti, A.K.; Singh, K.K.K.; Ghosh, C.N.; Mishra, K. Detection of subsurface cavity due to old mine workings using electrical resistivity tomography: A case study. J. Earth Syst. Sci. 2022, 131, 39. [Google Scholar] [CrossRef] [Scilit]
- Jia, N. Structural detection of goaf based on three-dimensional ERT technology. Syst. Soft Comput. 2025, 7, 200179. [Google Scholar] [CrossRef] [Scilit]
- Xu, J.; Yan, C.; Boota, M.; Chen, X.; Li, Z.; Liu, W.; Yan, X. Research on automatic identification of coal mining subsidence area based on InSAR and time series classification. J. Clean. Prod. 2024, 470, 143293. [Google Scholar] [CrossRef] [Scilit]
- Marmoni, G.M.; Antonielli, B.; Caprari, P.; Di Renzo, M.E.; Marini, R.; Mastrantoni, G.; Mazzanti, P.; Patelli, P.; Bozzano, F. Semi-automatic ranking of landslide candidate areas at a regional scale using EGMS InSAR data for territorial planning and risk management. Landslides 2025, 22, 4077–4095. [Google Scholar] [CrossRef] [Scilit]
- Guo, R.; Zhang, W.; Tang, X.; Dai, K.; Li, Y.; Liu, D.; Zheng, Y.; Zeng, S.; Zhou, J.; Xu, J.; et al. Bridging fault kinematics before, during, and after the 2022 Menyuan earthquake. Earth Planet. Sci. Lett. 2025, 666, 119510. [Google Scholar] [CrossRef] [Scilit]
- Chike, I.; Balz, T. Detecting and Monitoring Artisanal Mining Operations in Semi-Arid Terrain Using Multitemporal SAR Data for InSAR Coherence Estimation and Unsupervised Classification. In Proceedings of the International Archives of the Photogrammetry, Remote Sensing and Spatial Information Sciences, Changsha, China, 13–17 May 2024; pp. 105–110. [Google Scholar]
- Wang, L.; Yang, L.; Wang, W.; Chen, B.; Sun, X. Monitoring mining activities using Sentinel-1A InSAR coherence in open-pit coal mines. Remote Sens. 2021, 13, 4485. [Google Scholar] [CrossRef] [Scilit]
- Tomás, R.; Pagán, J.I.; Navarro, J.A.; Cano, M.; Pastor, J.L.; Riquelme, A.; Cuevas-González, M.; Crosetto, M.; Barra, A.; Monserrat, O.; et al. Semi-automatic identification and pre-screening of geological–geotechnical deformational processes using persistent scatterer interferometry datasets. Remote Sens. 2019, 11, 1675. [Google Scholar] [CrossRef] [Scilit]
- Wang, M.; Cai, M.; Maloney, S.; Dunn, M. Determination of mine-wide in-situ stress using numerical back analysis: A case study of Jwaneng mine. Int. J. Rock Mech. Min. Sci. 2025, 194, 106235. [Google Scholar] [CrossRef] [Scilit]
- Gao, H.; Luo, X.; Lin, H.; Feng, G.; Wang, L. Observation and evaluation of surface and underground space changes in well salt mining based on InSAR: A case study of Qingjiang salt mine, Zhangshu, China. Int. J. Digit. Earth 2025, 18, 2458683. [Google Scholar] [CrossRef] [Scilit]
- He, K.; Zhang, X.; Li, Z.; Jiang, W.; Zhou, J.; Han, B. A Mask R-CNN Network for wide-area mining subsidence automatic detection with InSAR observations. IEEE Trans. Geosci. Remote Sens. 2024, 62, 4502716. [Google Scholar] [CrossRef] [Scilit]
- Wang, T.; Zhang, Q.; Wu, Z. A Deep-Learning-Facilitated, Detection-First Strategy for Operationally Monitoring Localized Deformation with Large-Scale InSAR. Remote Sens. 2023, 15, 2310. [Google Scholar] [CrossRef] [Scilit]
- Guo, J.; Zhang, Z.; Wang, M.; Ma, P.; Gao, W.; Liu, X. Automatic Detection of Subsidence Funnels in Large-Scale SAR Interferograms Based on an Improved-YOLOv8 Model. IEEE Trans. Geosci. Remote Sens. 2024, 62, 6200117. [Google Scholar] [CrossRef] [Scilit]
- Yu, Y.; Wang, Z.; Li, Z.; Ye, K.; Li, H.; Wang, Z. A Lightweight Anchor-Free Subsidence Basin Detection Model with Adaptive Sample Assignment in Interferometric Synthetic Aperture Radar Interferogram. Front. Ecol. Evol. 2022, 10, 840464. [Google Scholar] [CrossRef] [Scilit]
- Ali, M.L.; Thakur, K.; Schmeelk, S.; Debello, J.; Dragos, D. Deep Learning vs. Machine Learning for Intrusion Detection in Computer Networks: A Comparative Study. Appl. Sci. 2025, 15, 1903. [Google Scholar] [CrossRef] [Scilit]
- Chen, Y. Road target detection method based on improved YOLOv8. In Proceedings of the 2024 IEEE 4th International Conference on Power, Electronics and Computer Applications, Shenyang, China, 26–28 January 2024; pp. 949–955. [Google Scholar]
- Vaswani, A.; Shazeer, N.; Parmar, N.; Uszkoreit, J.; Jones, L.; Gomez, A.N.; Kaiser, Ł.; Polosukhin, I. Attention is all you need. In Proceedings of the 31st International Conference on Neural Information Processing Systems, Long Beach, CA, USA, 4–9 December 2017; Volume 30. [Google Scholar]
- Carion, N.; Massa, F.; Synnaeve, G.; Usunier, N.; Kirillov, A.; Zagoruyko, S. End-to-end object detection with transformers. In Proceedings of the ECCV 2020, Cham, Switzerland, 23–28 August 2020; pp. 213–229. [Google Scholar]
- Zhu, X.; Su, W.; Lu, L.; Li, B.; Wang, X.; Dai, J. sDeformable detr: Deformable transformers for end-to-end object detection. arXiv 2020, arXiv:2010.04159. [Google Scholar]
- Wu, Z.; Wang, T.; Wang, Y.; Wang, R.; Ge, D. Deep learning for the detection and phase unwrapping of mining-induced deformation in large-scale interferograms. IEEE Trans. Geosci. Remote Sens. 2021, 60, 5216318. [Google Scholar] [CrossRef] [Scilit]
- Dai, H.; Wang, J. Prediction model for surface movement and deformation induced by sub-critical extraction. J. China Coal Soc. 2023, 28, 583–587. [Google Scholar]
- Chen, J.; Zou, Y.; Guo, W. Study on the relationship between subsidence coefficient and mining degree under a thick alluvium stratum. J. Min. Saf. Eng. 2012, 29, 250–254. [Google Scholar]
- Zou, Y. Study on Calculation Method of Ground Subsidence Coefficient. Chin. J. Geotech. Eng. 1997, 3, 112–115. [Google Scholar]
- Wang, L.; Jiang, K.; Wei, T. Development of a new inversion method for detecting spatiotemporal characteristics of coal mines based on earth observation technology. Int. J. Appl. Earth Obs. Geoinf. 2021, 100, 102346. [Google Scholar] [CrossRef] [Scilit]
- Guo, J.; Zhang, Z.; Ma, P.; Wang, M.; Zhang, X.; Li, D.; Sui, B. SFD-YOLO: A Novel Framework for Subsidence Funnels Detection in China Based on Large-Scale SAR Interferograms. Int. J. Appl. Earth Obs. Geoinf. 2025, 140, 104605. [Google Scholar] [CrossRef] [Scilit]
- Simard, P.Y.; Steinkraus, D.; Platt, J.C. Best practices for convolutional neural networks applied to visual document analysis. In Proceedings of the Seventh International Conference on Document Analysis and Recognition, Edinburgh, UK, 6 August 2003; pp. 958–963. [Google Scholar]
- Girshick, R.; Iandola, F.; Darrell, T.; Malik, J. Deformable part models are convolutional neural networks. In Proceedings of the 2015 IEEE Conference on Computer Vision and Pattern Recognition, Boston, MA, USA, 7–12 June 2015; pp. 437–446. [Google Scholar]

Disclaimer/Publisher’s Note: The statements, opinions and data contained in all publications are solely those of the individual author(s) and contributor(s) and not of MDPI and/or the editor(s). MDPI and/or the editor(s) disclaim responsibility for any injury to people or property resulting from any ideas, methods, instructions or products referred to in the content. |
© 2025 by the authors. Licensee MDPI, Basel, Switzerland. This article is an open access article distributed under the terms and conditions of the Creative Commons Attribution (CC BY) license (https://creativecommons.org/licenses/by/4.0/).