


Abstract
Saudi Arabia’s transition towards electric mobility requires scalable charging infrastructure that can reduce dependence on grid-supplied energy and support national sustainability objectives. This study presents a preliminary planning assessment of petrol-station rooftops in Riyadh and Jeddah for photovoltaic (PV)-supported electric vehicle charging. Gross rooftop areas were measured for an exploratory, non-probability sample of 30 petrol stations—20 in Riyadh and 10 in Jeddah—using Google Earth Pro. A retained aggregate PVsyst output was used as a historical technical reference, while HelioScope was used only for preliminary layout visualisation. The retained 5.968 GWh/year PVsyst result cannot be independently reproduced from the materials currently available to the authors because the complete station-level project files and meteorological inputs were not preserved. A low–central–high scenario framework accounts for usable rooftop fractions of 70–90%, irradiance multipliers and combined operational-retention assumptions. The assumption-based scenarios produce 3.572–5.640 GWh/year, with a central value of 4.536 GWh/year. The 25, 40, and 60 kWh charging cases are defined as battery-side energy delivered per session and, after applying a 95% charging efficiency, correspond to approximately 71,800–172,400 energy-equivalent sessions annually under the central scenario. The PV-only economic screening gives an LCOE of USD 0.053–0.113/kWh and a simple payback period of 6.8–19.0 years under a full-self-consumption assumption; it excludes chargers, battery storage, structural reinforcement, and grid upgrades. The findings support further field investigation but do not establish complete EV-charging-infrastructure feasibility, national potential, or grid-independent operation.
1. Introduction
Electric vehicle (EV) deployment is motivated by environmental, energy and mobility considerations, but its benefits depend on the source of charging electricity and the adequacy of charging infrastructure. Earlier studies assessed the environmental and economic implications of charging energy [1], reviewed EV-technology challenges [2], and examined adoption barriers globally [3] and in Saudi Arabia [4]. The Saudi transition is supported by domestic initiatives including CEER and Lucid manufacturing [5,6]. Power-system research further shows that EV-related emissions depend on the electricity-generation mix [7], while Saudi PV-grid economics [8] and integrated solar-charging research [9] highlight the need for coordinated renewable charging.
The wider literature establishes the technical basis for PV-supported charging. Global solar-resource prospects have been reviewed in [10], while techno-commercial solar-charging analysis [11] and comparative charger-topology studies [12] describe key system choices. Demand-side management [13] and intelligent solar-parking energy management [14] address operational coordination. Planning studies cover charger location and sizing [15], dynamic pricing [16], probabilistic fast-charging demand [17], driving-range behaviour [18], GIS-assisted renewable charging [19], solar-charging-site selection [20], electrical safety [21], and EV-adoption opportunities [22]. Within this body of work, the use of existing fuel-station infrastructure for solar charging provides the closest precedent for the present study [23].
The methodological framework is supported by studies addressing the principal modelling decisions adopted in this work. Solar site selection under Saudi conditions was examined in [24] while coordinated energy sharing among charging stations was investigated in [25]. The effects of high temperature and solar irradiance on PV performance were evaluated in [26,27,28], and the Sakaka PV project provided the contextual basis for selecting the PV module considered in this study [29]. Inverter sizing and the effects of the DC/AC ratio, azimuth angle, and tilt angle were addressed in [30,31,32,33]. PVsyst [34] was used to simulate the energy performance of the proposed PV systems, while HelioScope [35] was employed to assess rooftop layouts and verify the physical accommodation of the proposed module configurations.
Charging-demand estimation requires behavioural as well as vehicle-level evidence. Relevant studies have examined user charging preferences [36], renewable residential charging [37], Lucid vehicle specifications [38], observed EV charging behaviour [39], battery-health recommendations [40], daily driving-distance distributions [41], barriers to Saudi EV adoption [42], analysis of real-time charging datasets [43], fast-charging specifications [44], and the planning of EV parking facilities under high PV penetration [45]. These sources inform the scenario boundaries, but they do not remove the need for Saudi station-level charging data.
National-scale context is informed by petrol-station data from NAFT, SASCO, and Al-Drees [46,47,48], together with evidence on emissions from fossil-fuel-based electricity generation [49]. The analysis is further contextualised through Malaysian studies on solar-energy applications and petrol-station-based PV deployment [50,51,52,53], Saudi electricity-generation data [54], urban redevelopment constraints in Jeddah [55], PV-integrated charging-schedule optimisation [56], and Saudi research on charging infrastructure, pricing, and consumer behaviour [57]. Any scaling beyond the 30-site sample is presented only as an illustrative arithmetic exercise in the Discussion and is not treated as a principal quantitative result or an estimate of actual national potential.
The assessment is further supported by studies addressing PV soiling under Saudi conditions [58], international guidance on soiling-related energy losses [59], renewable energy cost benchmarks [60], PV-powered highway charging in Saudi Arabia [61], commercial electricity tariffs [62], developments in conventional and vehicle-integrated photovoltaics [63], harmonised life-cycle greenhouse-gas emissions from PV systems [64], and the economics of DC fast-charging installations [65]. Collectively, these sources provide the basis for evaluating PV losses, economic feasibility, storage requirements, life-cycle emissions, and the uncertainties associated with large-scale deployment.
Despite this body of work, the available evidence remains fragmented across rooftop PV potential, EV charging demand, station siting, and techno-economic assessment. Existing studies generally examine these elements separately, while limited research has evaluated the reuse of operating petrol-station rooftops in Saudi Arabia through an integrated framework that accounts for usable rather than merely geometric rooftop area, temperature and soiling losses, fleet-dependent charging demand, temporal mismatch between PV generation and charging activity, life-cycle emissions, and investment uncertainty. Consequently, the extent to which rooftop PV at petrol stations can support fast-charging demand in Riyadh and Jeddah, together with the range of outcomes associated with wider deployment, remains insufficiently quantified. The absence of a representative national station database and publicly accessible Saudi charging-session data also requires large-scale estimates to be interpreted as planning scenarios rather than deterministic forecasts.
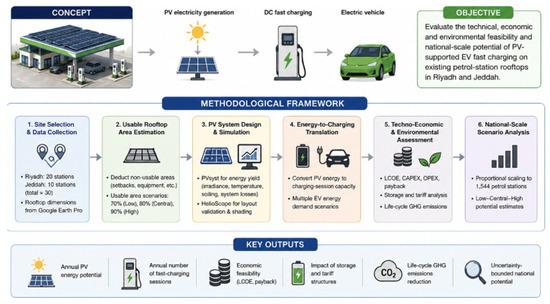
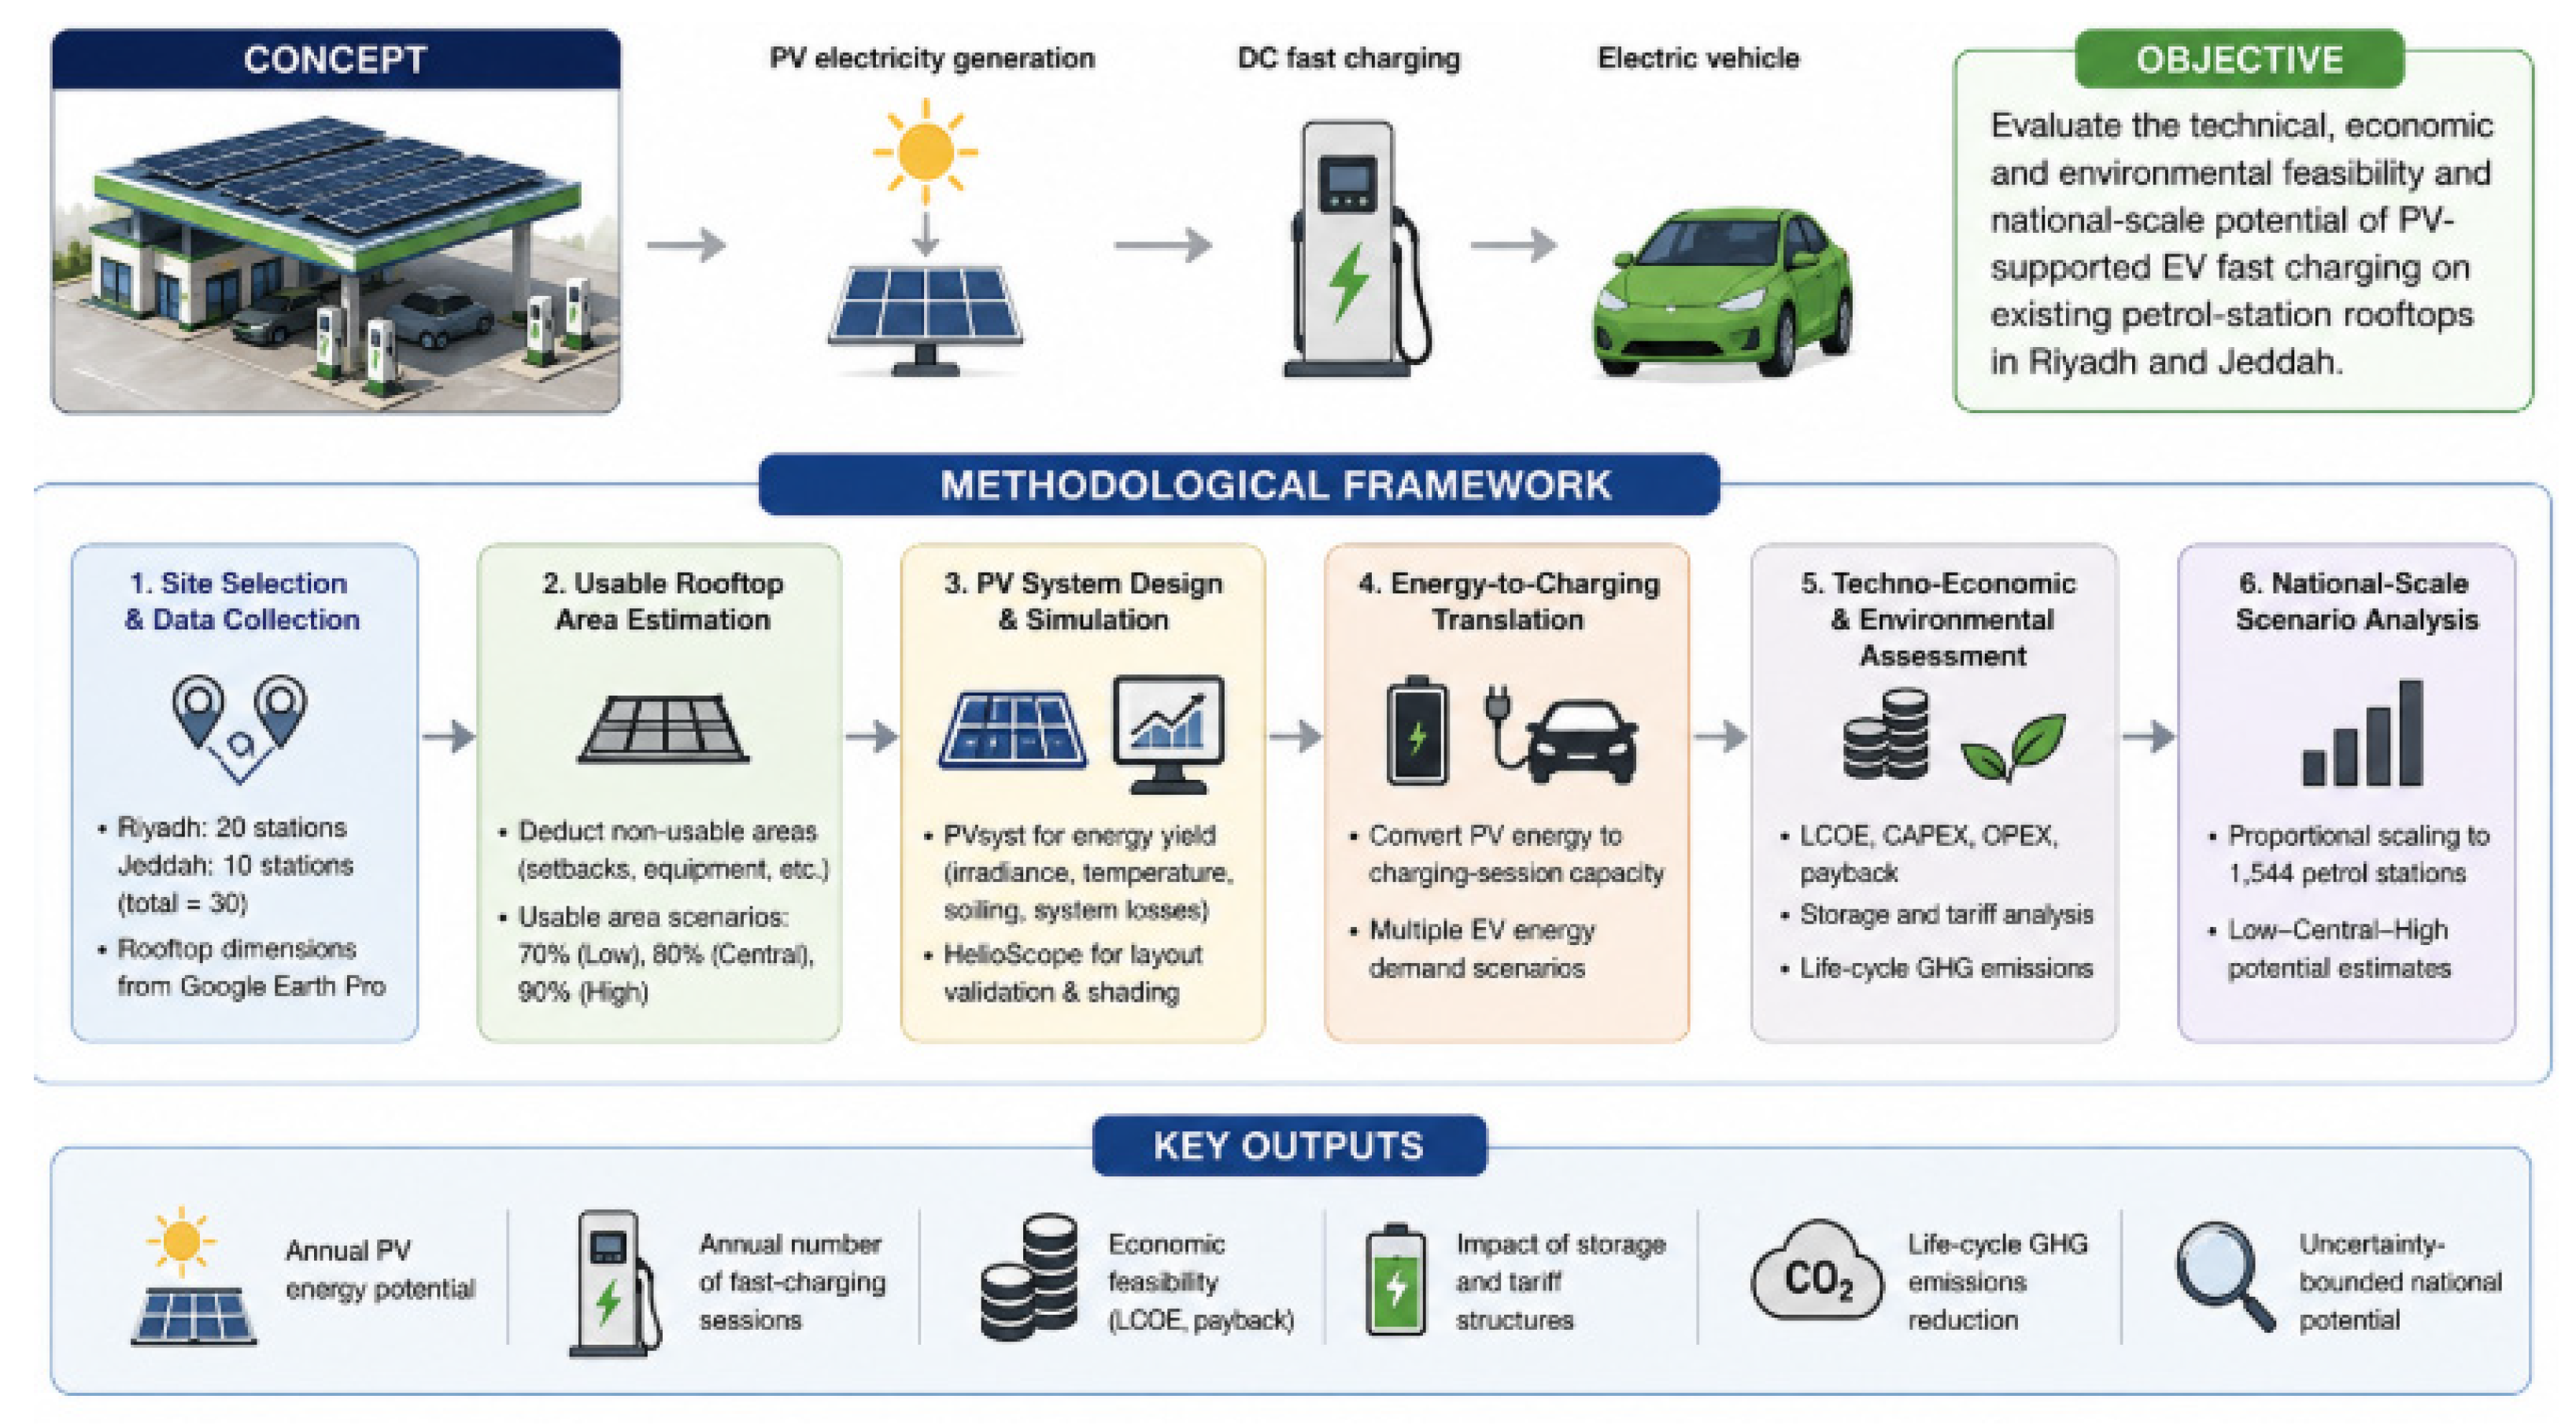
To address this research gap, this study applies an integrated, planning-oriented assessment framework that combines established methods for rooftop-area measurement, PV-energy estimation, charging-session conversion, PV-only economic screening, life-cycle-adjusted emissions estimation, and arithmetic scaling. The objectives are to estimate rooftop PV generation for an exploratory sample of 30 stations using explicit usable-area and system-loss assumptions, translate the available PV energy into charging-session capacity under clearly defined battery-side energy scenarios; examine storage, electricity-tariff, PV-cost, self-consumption, and emissions sensitivities; and illustrate the consequences of proportional scaling to a three-operator station count. The contribution is application-specific and geographically focused rather than a new theoretical PV–EV charging methodology. The integrated assessment workflow is summarised in Figure 1.
Figure 1.
Conceptual framework and methodological workflow for assessing PV-supported electric-vehicle fast charging on petrol-station rooftops in Riyadh and Jeddah.
2. Materials and Methods
2.1. Study Scope and Station Selection
The study uses an exploratory, non-probability sample of 30 petrol stations identified through manual inspection of Google Earth Pro imagery version 7.3, comprising 20 sites in Riyadh and 10 in Jeddah. The available project records indicate purposive selection based on the visibility of petrol-station rooftop or canopy geometry and the ability to obtain plan-view dimensions from the imagery. A complete candidate-station list, search boundary, operator quota, and formal inclusion–exclusion log were not preserved. Consequently, the selection procedure cannot be independently reconstructed and should not be regarded as a reproducible sampling protocol. The sample is best characterised as a combination of purposive selection based on visible rooftop characteristics and convenience selection based on image availability and measurability.
The allocation of 20 stations in Riyadh and 10 in Jeddah reflects the larger urban extent examined in Riyadh and is not weighted according to verified station population, traffic volume, EV demand, or operator distribution. Accordingly, the results are interpreted as site-specific feasibility estimates rather than city-wide performance indicators. A more comprehensive national assessment would require a geocoded station database and stratification according to operator, traffic class, roof type, usable rooftop area, structural condition, shading, grid capacity, and surrounding EV-charging demand.
Rooftop dimensions measured using Google Earth Pro represent gross plan-view area and do not account for structural loading capacity, fire-access requirements, wind-uplift resistance, drainage provisions, parapet setbacks, equipment obstructions, or maintenance corridors. The retained aggregate gross rooftop area is 19,071 m2, but the original measurement sheets, site coordinates, repeated-measurement records, and analyst cross-checks are not available. A quantitative re-measurement uncertainty analysis therefore cannot be reconstructed from the retained materials. The value 19,071 m2 should be interpreted as a historical aggregate measurement used in the calculations, not as evidence of metre-level area accuracy where approximately 19,100 m2 is the appropriate precision for descriptive interpretation. The usable rooftop fractions of 70%, 80%, and 90% represent engineering and layout assumptions only and do not compensate for Google Earth Pro measurement error. Site-specific structural, electrical, safety, and geometric verification remains necessary before design or investment decisions can be finalised.
2.2. PV-System Model and Loss Framework
The PV assessment uses a retained aggregate PVsyst output associated with the JKM320P model from JinkoSolar rated at 320 W polycrystalline module, with preliminary rooftop layouts previously examined using HelioScope [34,35]. The available records indicate nominal tilt angles of 29° for Riyadh and 24° for Jeddah, an azimuth of 0° for both cities, and a planning DC/AC ratio in the range 1.10–1.30. The retained aggregate gross rooftop area is 19,071 m2, comprising 12,595 m2 in Riyadh and 6476 m2 in Jeddah. The corresponding 5.968 GWh/year annual AC energy value is a historical aggregate simulation output and cannot be independently reproduced from the information currently available because the complete station-level PVsyst projects, meteorological files, module counts, inverter assignments, string layouts, shading scenes, and detailed loss outputs were not preserved. It is therefore used only as a restricted technical reference for the subsequent assumption-based calculations, rather than as an independently verified simulation result. Shading effects were excluded and are not separately quantified in the scenario calculations. HelioScope is described only as having supported preliminary rooftop-layout visualisation. It is not treated as structural validation or quantitative cross-validation of PVsyst.
Annual AC energy generation is represented using an explicit multiplicative loss framework:
where is the annual AC energy generation (kWh/year); is the measured gross rooftop area (m2); is the usable-area fraction; is the annual plane-of-array irradiation (kWh/m2/year); is the module efficiency under standard test conditions and PR is the performance ratio. The performance ratio is consequently expressed as the product of the non-irradiance retention factors:
where , , , and are the retention factors associated with temperature, soiling, mismatch, and DC wiring losses, respectively; is the inverter efficiency; and represents system availability after accounting for downtime and other balance-of-system losses.
Temperature and soiling are particularly important under Saudi operating conditions. Although higher irradiance can increase instantaneous PV output, an increase in cell temperature at a given irradiance generally reduces module voltage and conversion efficiency. Soiling introduces additional optical losses, may accumulate unevenly across module surfaces, and affects the required cleaning frequency and associated operating cost [58,59]. Because station-specific temperature and soiling time series were unavailable, these effects are incorporated into the scenario analysis through documented retention factors together with other operational losses, rather than being treated as site-calibrated values. The principal site characteristics, PV-system parameters, and scenario assumptions adopted in the rooftop PV energy assessment are summarised in Table 1.
Table 1.
Principal site characteristics, PV-system parameters and scenario assumptions used in this study.
Modern mono-PERC, TOPCon, HJT and bifacial modules may provide more installed capacity where roof area is constrained. A simple roof-limited efficiency sensitivity indicates that replacing the 16.49-class baseline module with 20%, 22% or 23% modules could increase nominal roof-limited capacity by approximately 21%, 33% or 39% respectively, before temperature, layout, bifacial rear-side irradiance and inverter constraints. This is a screening comparison, not a redesign or vendor recommendation. Current PV markets have largely shifted from multicrystalline to higher-efficiency monocrystalline and bifacial products [63].
2.3. Charging-Session Dataset and Demand Model
In the absence of a publicly accessible Saudi fast-charging dataset, anonymised session-level state-of-charge (SOC) data from a Malaysian charge-point operator were used to establish a reference charging-demand profile. The data were collected at a highway-adjacent charging station and comprised 2999 sessions with complete starting and ending SOC values. Only records containing both SOC measurements were included, and no additional exclusion threshold was applied.
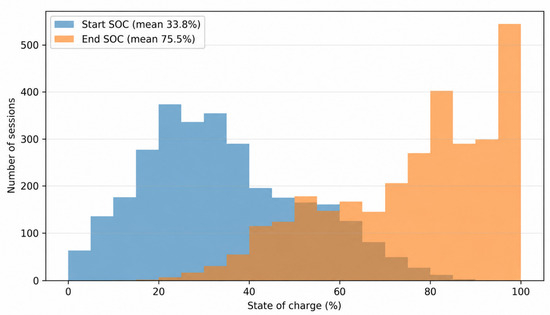
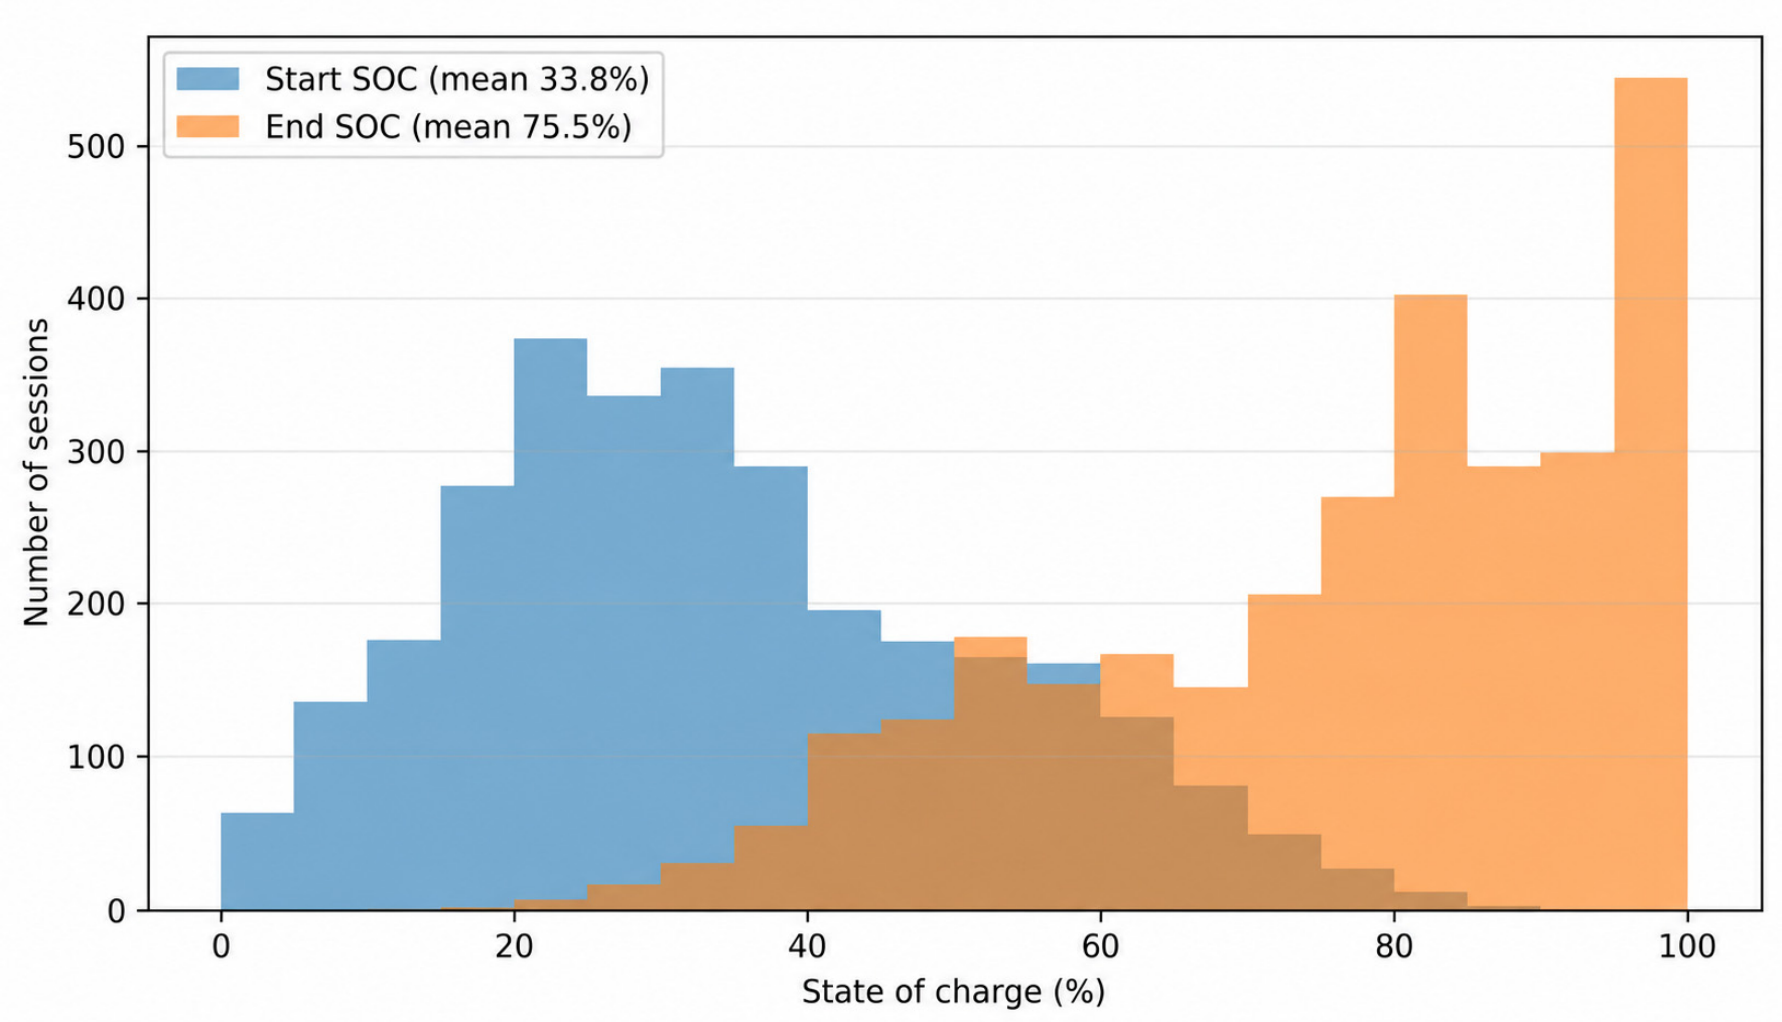
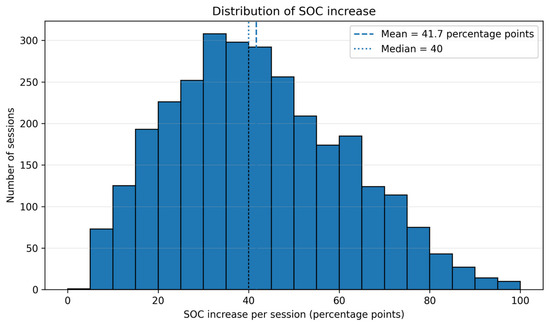
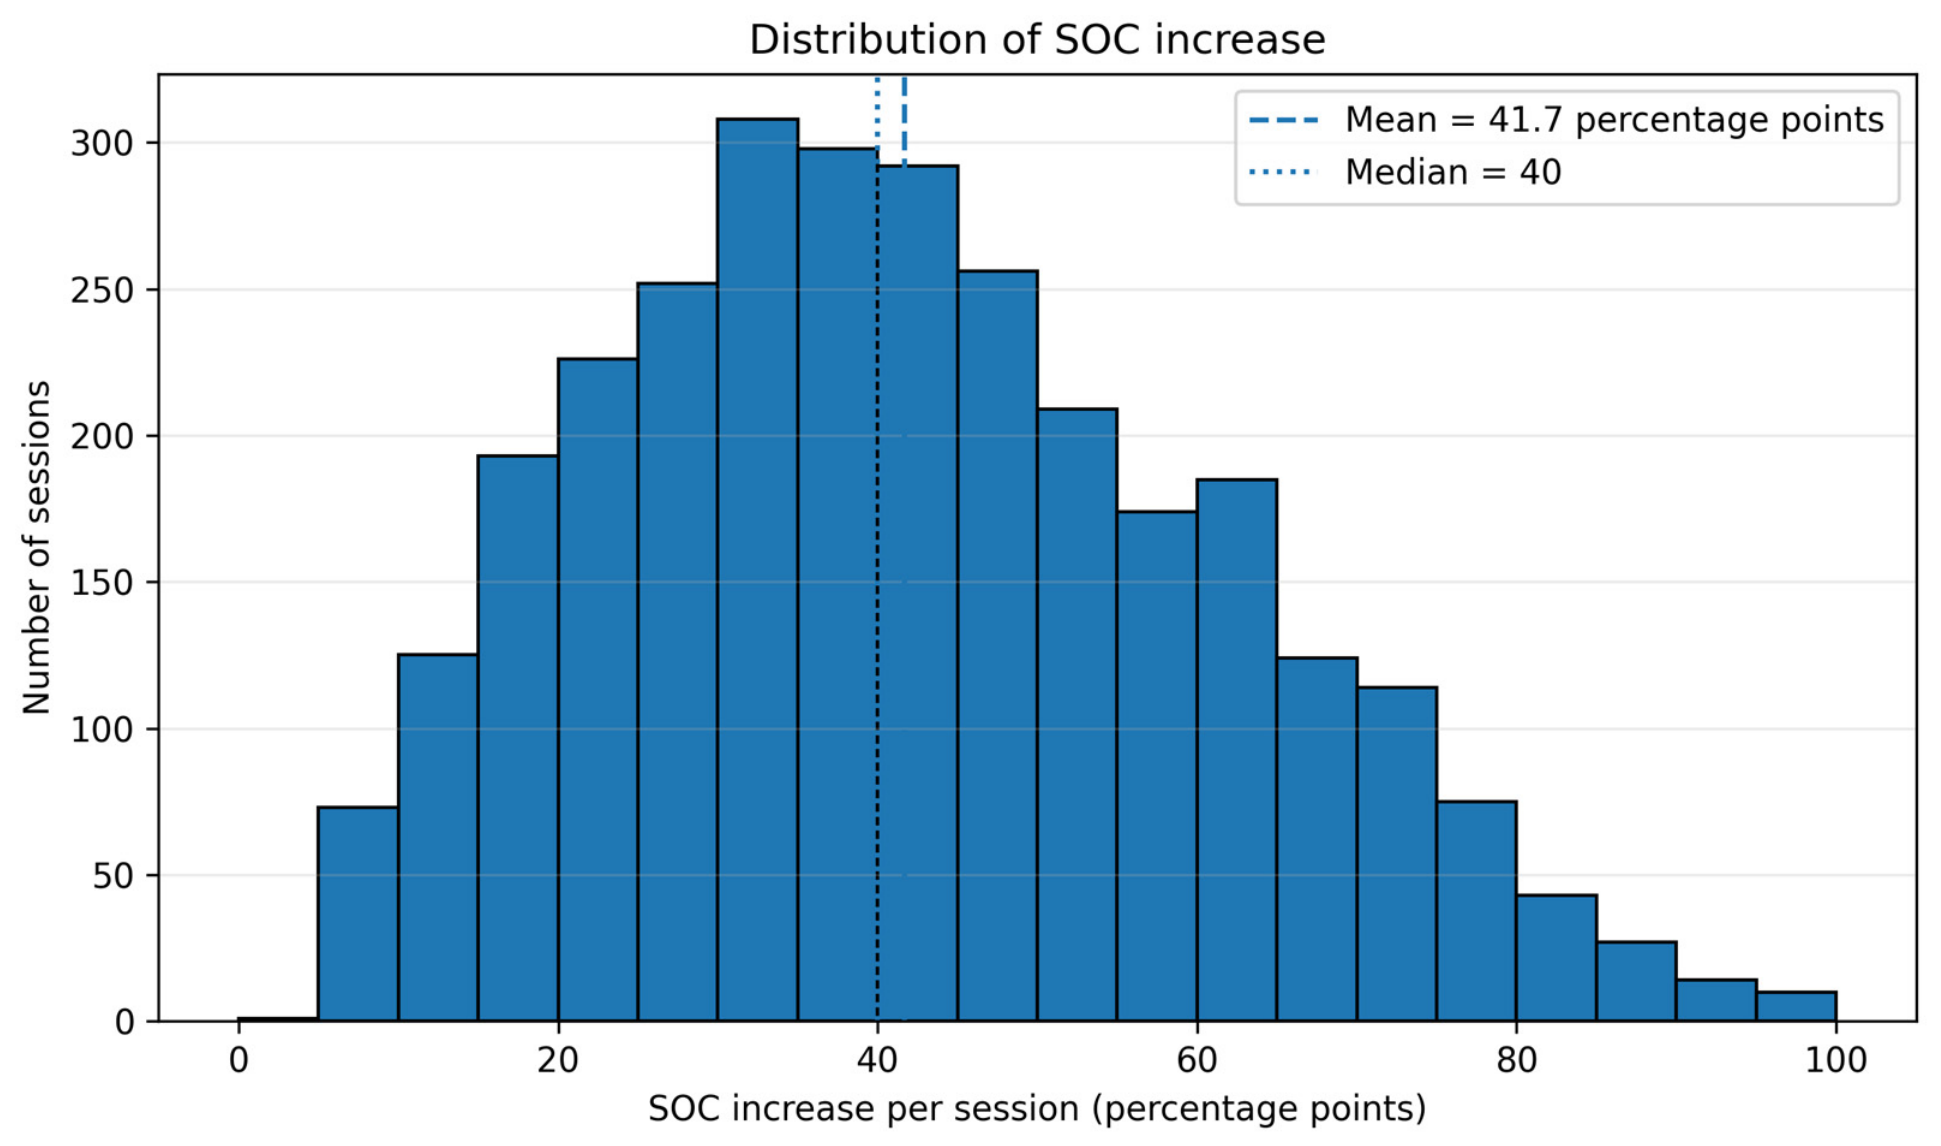
The distributions of the starting and ending SOC values are presented in Figure 2. The mean starting SOC was 33.84%, while the mean ending SOC was 75.50%, indicating a general shift towards higher battery SOC after charging. Figure 3 presents the distribution of the session-level SOC increase. The mean SOC increase was 41.66 percentage points, while the median was 40 percentage points, with an interquartile range of 27–55 percentage points and a sample standard deviation of 19.16 percentage points. The corresponding descriptive statistics are summarised in Table 2.
Figure 2.
Start and end SOC distributions for 2999 complete charging sessions.
Figure 3.
Distribution of SOC increase per charging session with the mean and median indicated.
Table 2.
Descriptive statistics of the retained charging-session dataset.
The Malaysian observations are used only to define an illustrative SOC-increase distribution. The fleet-diversity scenarios are separately defined as battery-side energy delivered to the vehicle of 25, 40, and 60 kWh per session. These values are not inferred from the Malaysian vehicle fleet and are included to represent a broad range of charging requirements. All subsequent calculations distinguish battery-side delivered energy from station-side electricity consumption.
For an EV with usable battery capacity and charging efficiency , the station-side energy delivered per charging session is calculated as:
where is the station-side energy delivered per session (kWh), is the fractional increase in battery state of charge expressed in percentage points, is the usable battery capacity (kWh), and is the charging efficiency. The large-battery illustrative case uses 82.5 kWh as the battery-side energy associated with an 80% SOC increase, corresponding to an implied usable capacity of 103.1 kWh. With the observed mean SOC increase of 0.4166 and charging efficiency of 0.95, the station-side requirement as per Equation (3) is 45.23 kWh/session. This vehicle-scale case is retained only as an illustrative large-battery reference and is not presented as representative of the future Saudi EV fleet.
2.4. Energy-to-Session Conversion and Annual Matching
For the fleet-diversity cases, the 25, 40, and 60 kWh assumptions denote battery-side energy delivered per session. The number of annual energy-equivalent charging sessions is calculated as:
where EPV is annual station-side PV energy generation in (kWh/year), charging efficiency is taken as 0.95 and Ebattery,session is battery-side energy delivered per session (kWh). For the large-battery reference, 45.23 kWh/session is already a station-side value, so Nsession = EPV/45.23. This is an annual energy-equivalence metric, not an hourly dispatch simulation. It does not prove that PV output and charger demand coincide, that the station is islanded, or that grid reinforcement is unnecessary. Daytime direct charging, export, curtailment, grid import and battery operation require time-series demand and generation data.
2.5. Uncertainty and National-Scaling Scenarios
Three combined assumption-based scenarios are applied to the retained aggregate PV output of 5.968 GWh. The low scenario assumes a 70% usable rooftop fraction, a 0.95 irradiance multiplier, and a 0.90 operational-retention factor. The central scenario applies an 80% usable rooftop fraction, a 1.00 irradiance multiplier, and a 0.95 operational-retention factor, while the high scenario assumes a 90% usable rooftop fraction, a 1.05 irradiance multiplier, and full operational retention. The 5.968 GWh value is treated as an unadjusted technical reference rather than an expected operating result. These parameters are varied together to define a planning scenario range and do not constitute statistical uncertainty quantification or confidence intervals. A one-at-a-time elasticity check around the central case shows that a ±10% relative change in usable area changes annual energy by ±10%, a ±5% change in the irradiance multiplier changes energy by ±5%, and a ±5% relative change in operational retention changes energy by ±5%. The multiplicative model is therefore most sensitive, within the selected ranges, to the usable-area assumption.
For illustration only, an arithmetic extrapolation using the factor 1544/30 is retained in the Discussion to show how strongly a simple scaling assumption influences apparent national totals. This calculation assumes that the sample-average output applies to the three-operator station count and does not model regional irradiance, station-size distributions, structural suitability, operator practices, urban–rural differences, or grid constraints. A defensible national assessment would require a GIS-based station inventory and stratified regional, operator, station-size, structural-suitability, and grid-capacity data.
2.6. Illustrative Techno-Economic and Environmental Boundaries
A PV-only economic screening was conducted for the central physical case of 2.64 MWp and 4.536 GWh/year over 25 years. The favourable, central, and conservative cases use PV CAPEX of USD 900, 1100, and 1300/kWp; discount rates of 6%, 8%, and 10%; annual O&M of 1.5%, 2.0%, and 2.5% of initial CAPEX; annual degradation of 0.5%, 0.75%, and 1.0%; and inverter replacement in year 13 equal to 8%, 10%, and 12% of initial CAPEX, respectively. Electricity is valued at SAR 0.32, 0.27, and 0.22/kWh [62]. These values are intended for screening purposes and do not represent supplier quotations or site-specific procurement costs.
The LCOE is the ratio of discounted lifetime PV costs to discounted lifetime PV generation. Simple payback is initial PV CAPEX divided by first-year net electricity savings after annual O&M. The base payback cases assume 100% self-consumption of PV generation at the applicable commercial tariff, with no curtailment and no separate export compensation. This assumption is favourable and does not demonstrate that charging demand can absorb all PV generation. For the central financial case, reducing the self-consumption ratio from 100% to 75% and 50% increases simple payback from 10.8 years to approximately 15.5 and 27.6 years, respectively.
The economic boundary includes only the rooftop PV system. DC fast chargers, battery storage, structural reinforcement, transformers, switchgear, protection, grid connection, permitting, and other station-specific implementation costs are excluded and must be assessed separately. The reported payback therefore applies to a PV retrofit under the stated electricity-value and self-consumption assumptions, not to a complete EV-charging-infrastructure project [60,65].
Carbon benefits are calculated using grid-emission factors of 0.50–0.568 tCO2 e/MWh and a crystalline-silicon PV life-cycle factor of 0.045 tCO2 e/MWh [64]. Each energy scenario is therefore reported as a lower–upper avoided-emissions range rather than as a single deterministic value:
where is the avoided greenhouse-gas emission, is the grid-emission factor, is the PV life-cycle emission factor, and is the annual PV electricity generation. This remains an average-factor assessment and does not account for hourly marginal emissions, future grid decarbonisation, or the life-cycle impacts of chargers and battery storage.
The levelised cost of electricity is determined using:
where is the total cost incurred in year , is the electricity generated in year , is the discount rate, and is the project lifetime. Costs and energy are discounted from the end of each operating year, while initial CAPEX occurs at t = 0.
3. Results and Discussion
3.1. Monthly PV Energy Output
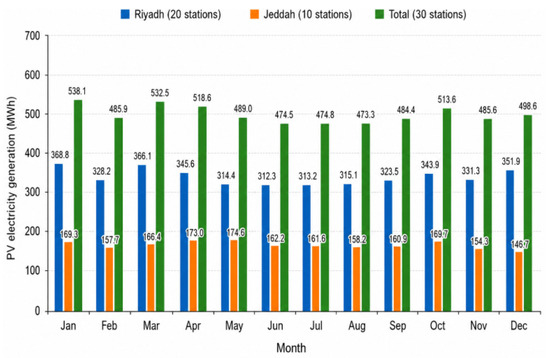
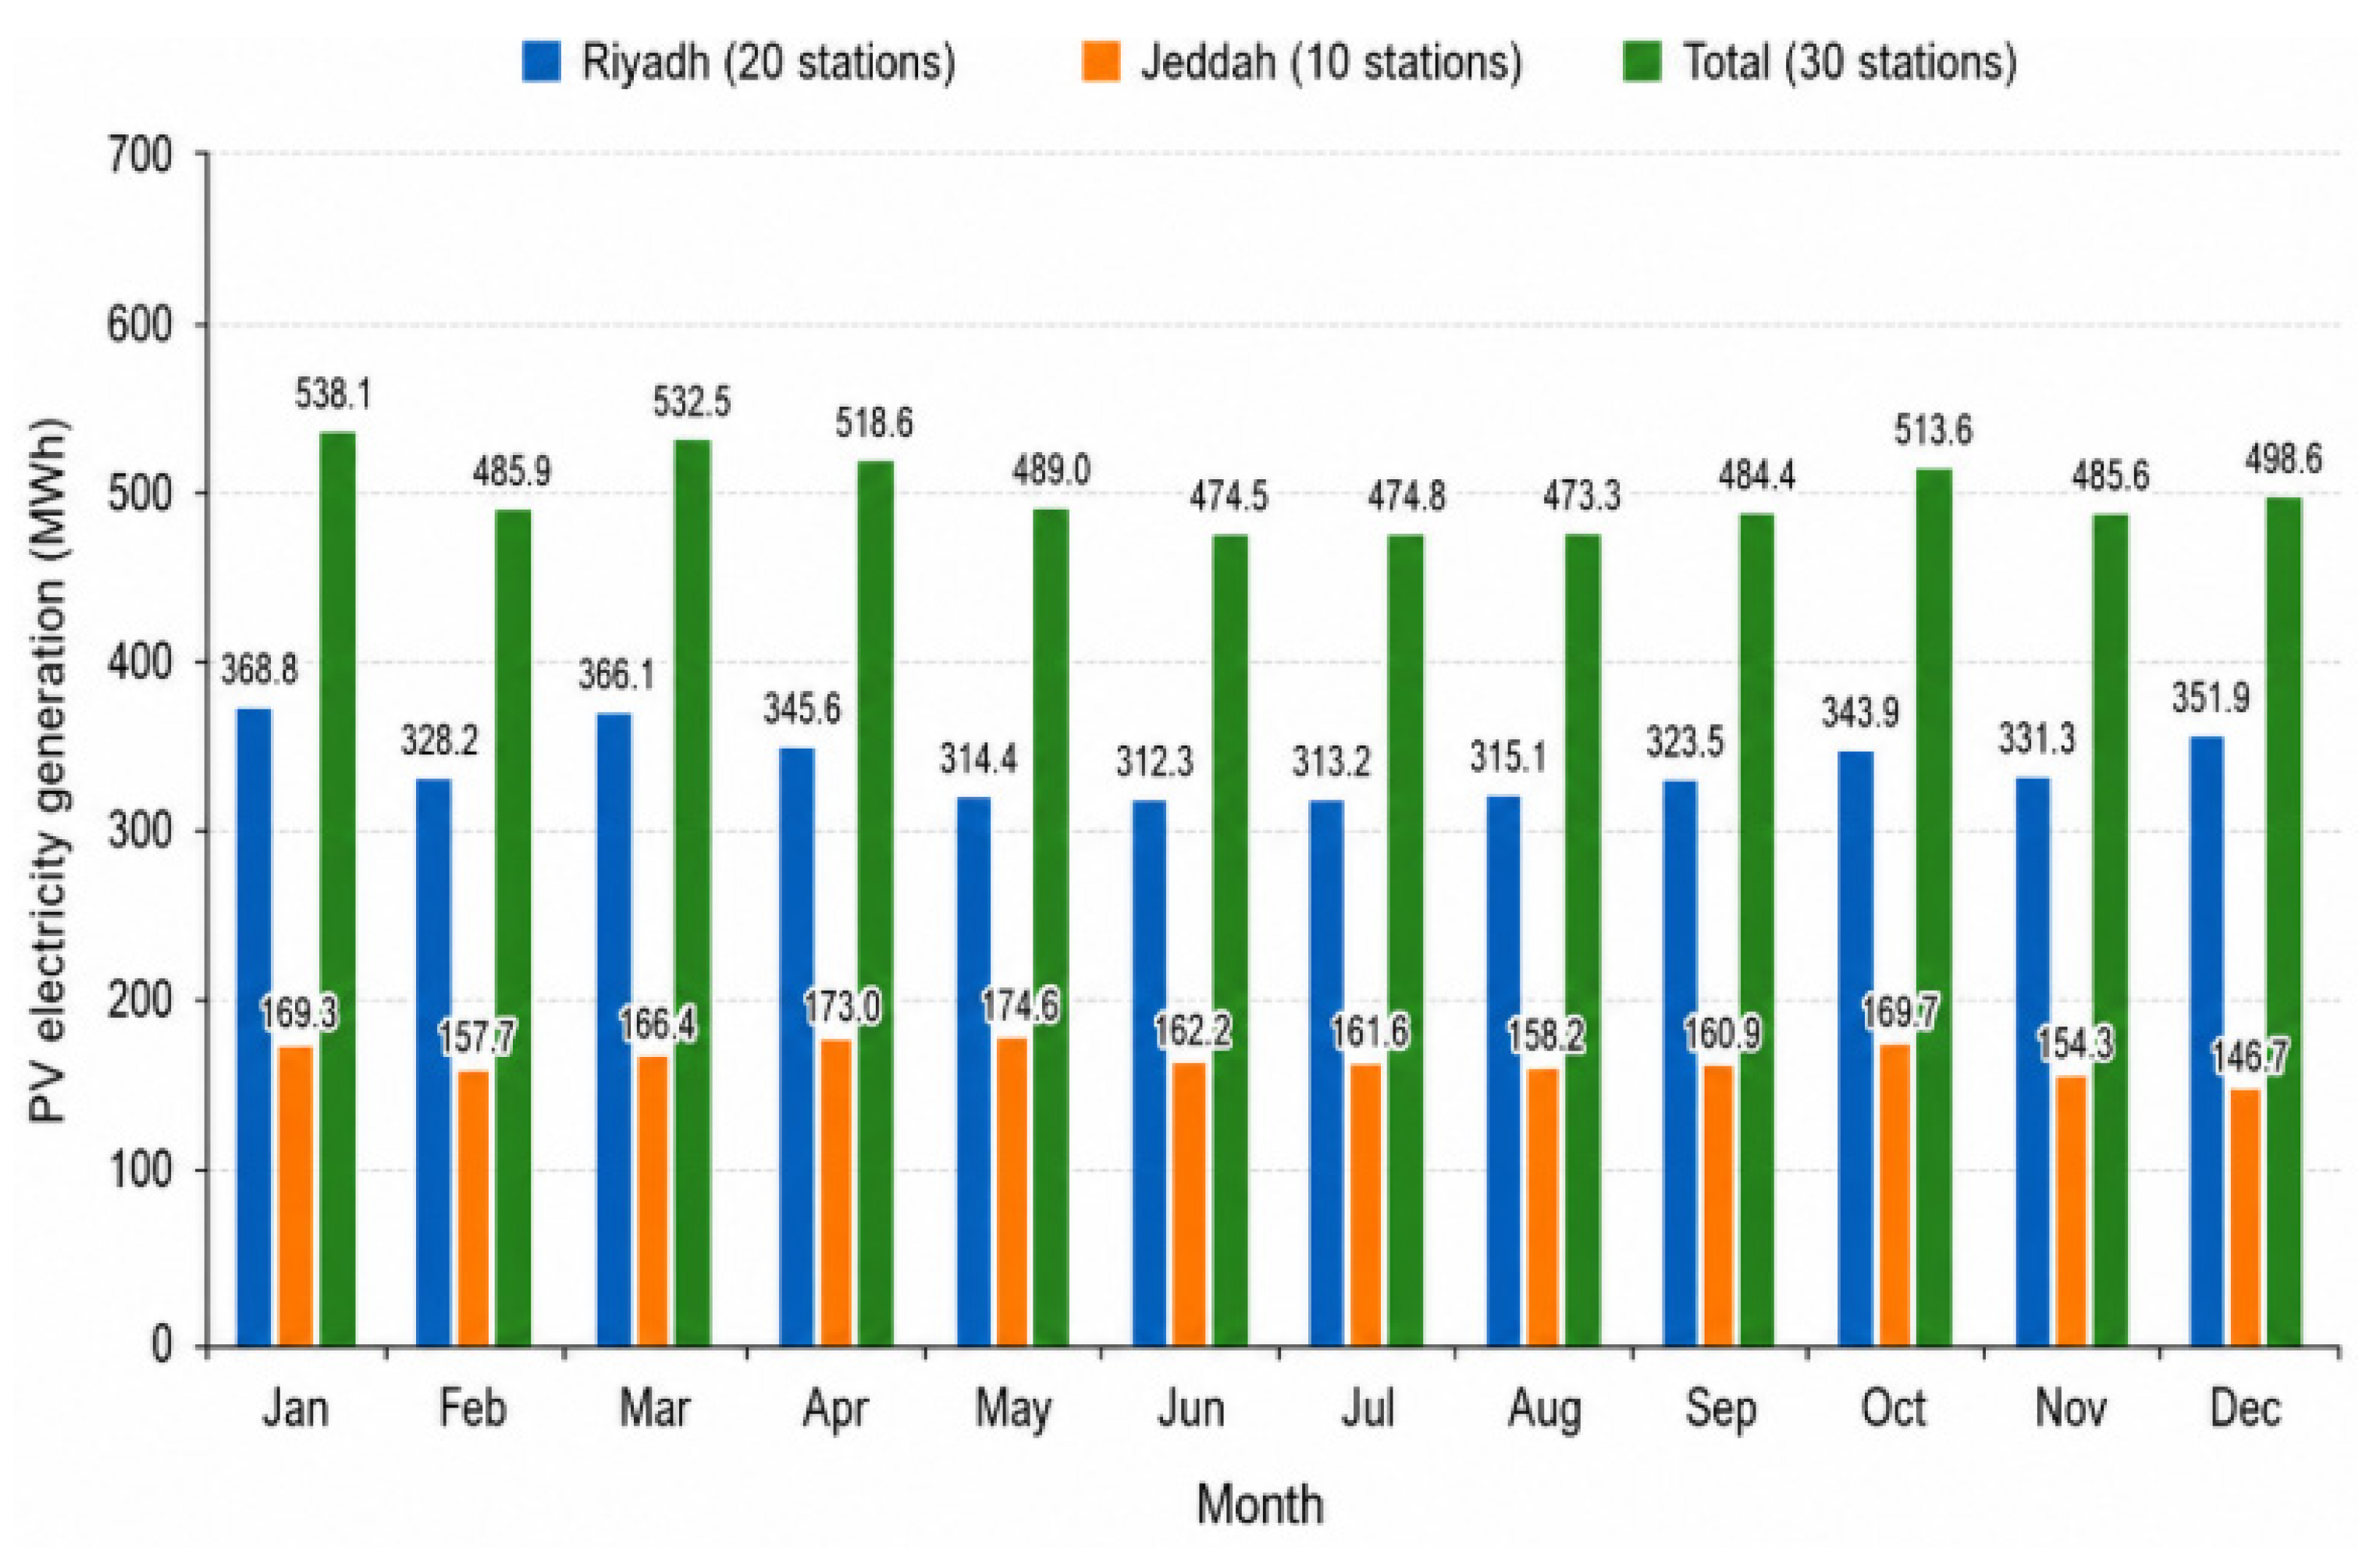
The retained PVsyst records report a combined annual AC energy output of 5968 MWh for the 30-station sample, comprising 4013.6 MWh for the 20 Riyadh stations and 1954.4 MWh for the 10 Jeddah stations. As shown in Figure 4, monthly energy generation in Riyadh ranges from 312.3 MWh to 368.8 MWh, while the corresponding output in Jeddah ranges from 146.7 MWh to 174.6 MWh. The higher aggregate output for Riyadh primarily reflects the larger number of sampled stations and greater total rooftop area rather than a controlled comparison of solar resource between the two cities. These values are retained historical simulation outputs because the complete PVsyst project files and meteorological inputs are unavailable and they cannot be independently reproduced or verified from the present manuscript alone.
Figure 4.
Monthly PVsyst AC energy generation for the sampled petrol stations in Riyadh and Jeddah.
The retained aggregate rooftop areas and annual PV energy values are summarised in Table 3. The analytical energy checks are 4063.1 MWh/year for Riyadh, 1982.2 MWh/year for Jeddah, and 6045.3 MWh/year for the full sample, while the corresponding retained PVsyst outputs are 4013.6 MWh/year, 1954.4 MWh/year, and 5968 MWh/year. The differences of 1.22%, 1.40%, and 1.28%, respectively, are reported only as an internal aggregate consistency check. They do not constitute independent model validation and may reflect shared area or modelling assumptions. A reproducible validation would require complete station-level measurements, meteorological datasets, system configurations, and simulation outputs.
Table 3.
Aggregate rooftop areas and annual PV energy estimates for the sampled petrol stations.
3.2. Scenario-Adjusted PV Energy
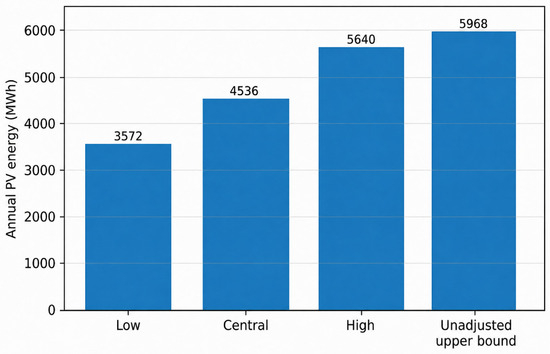
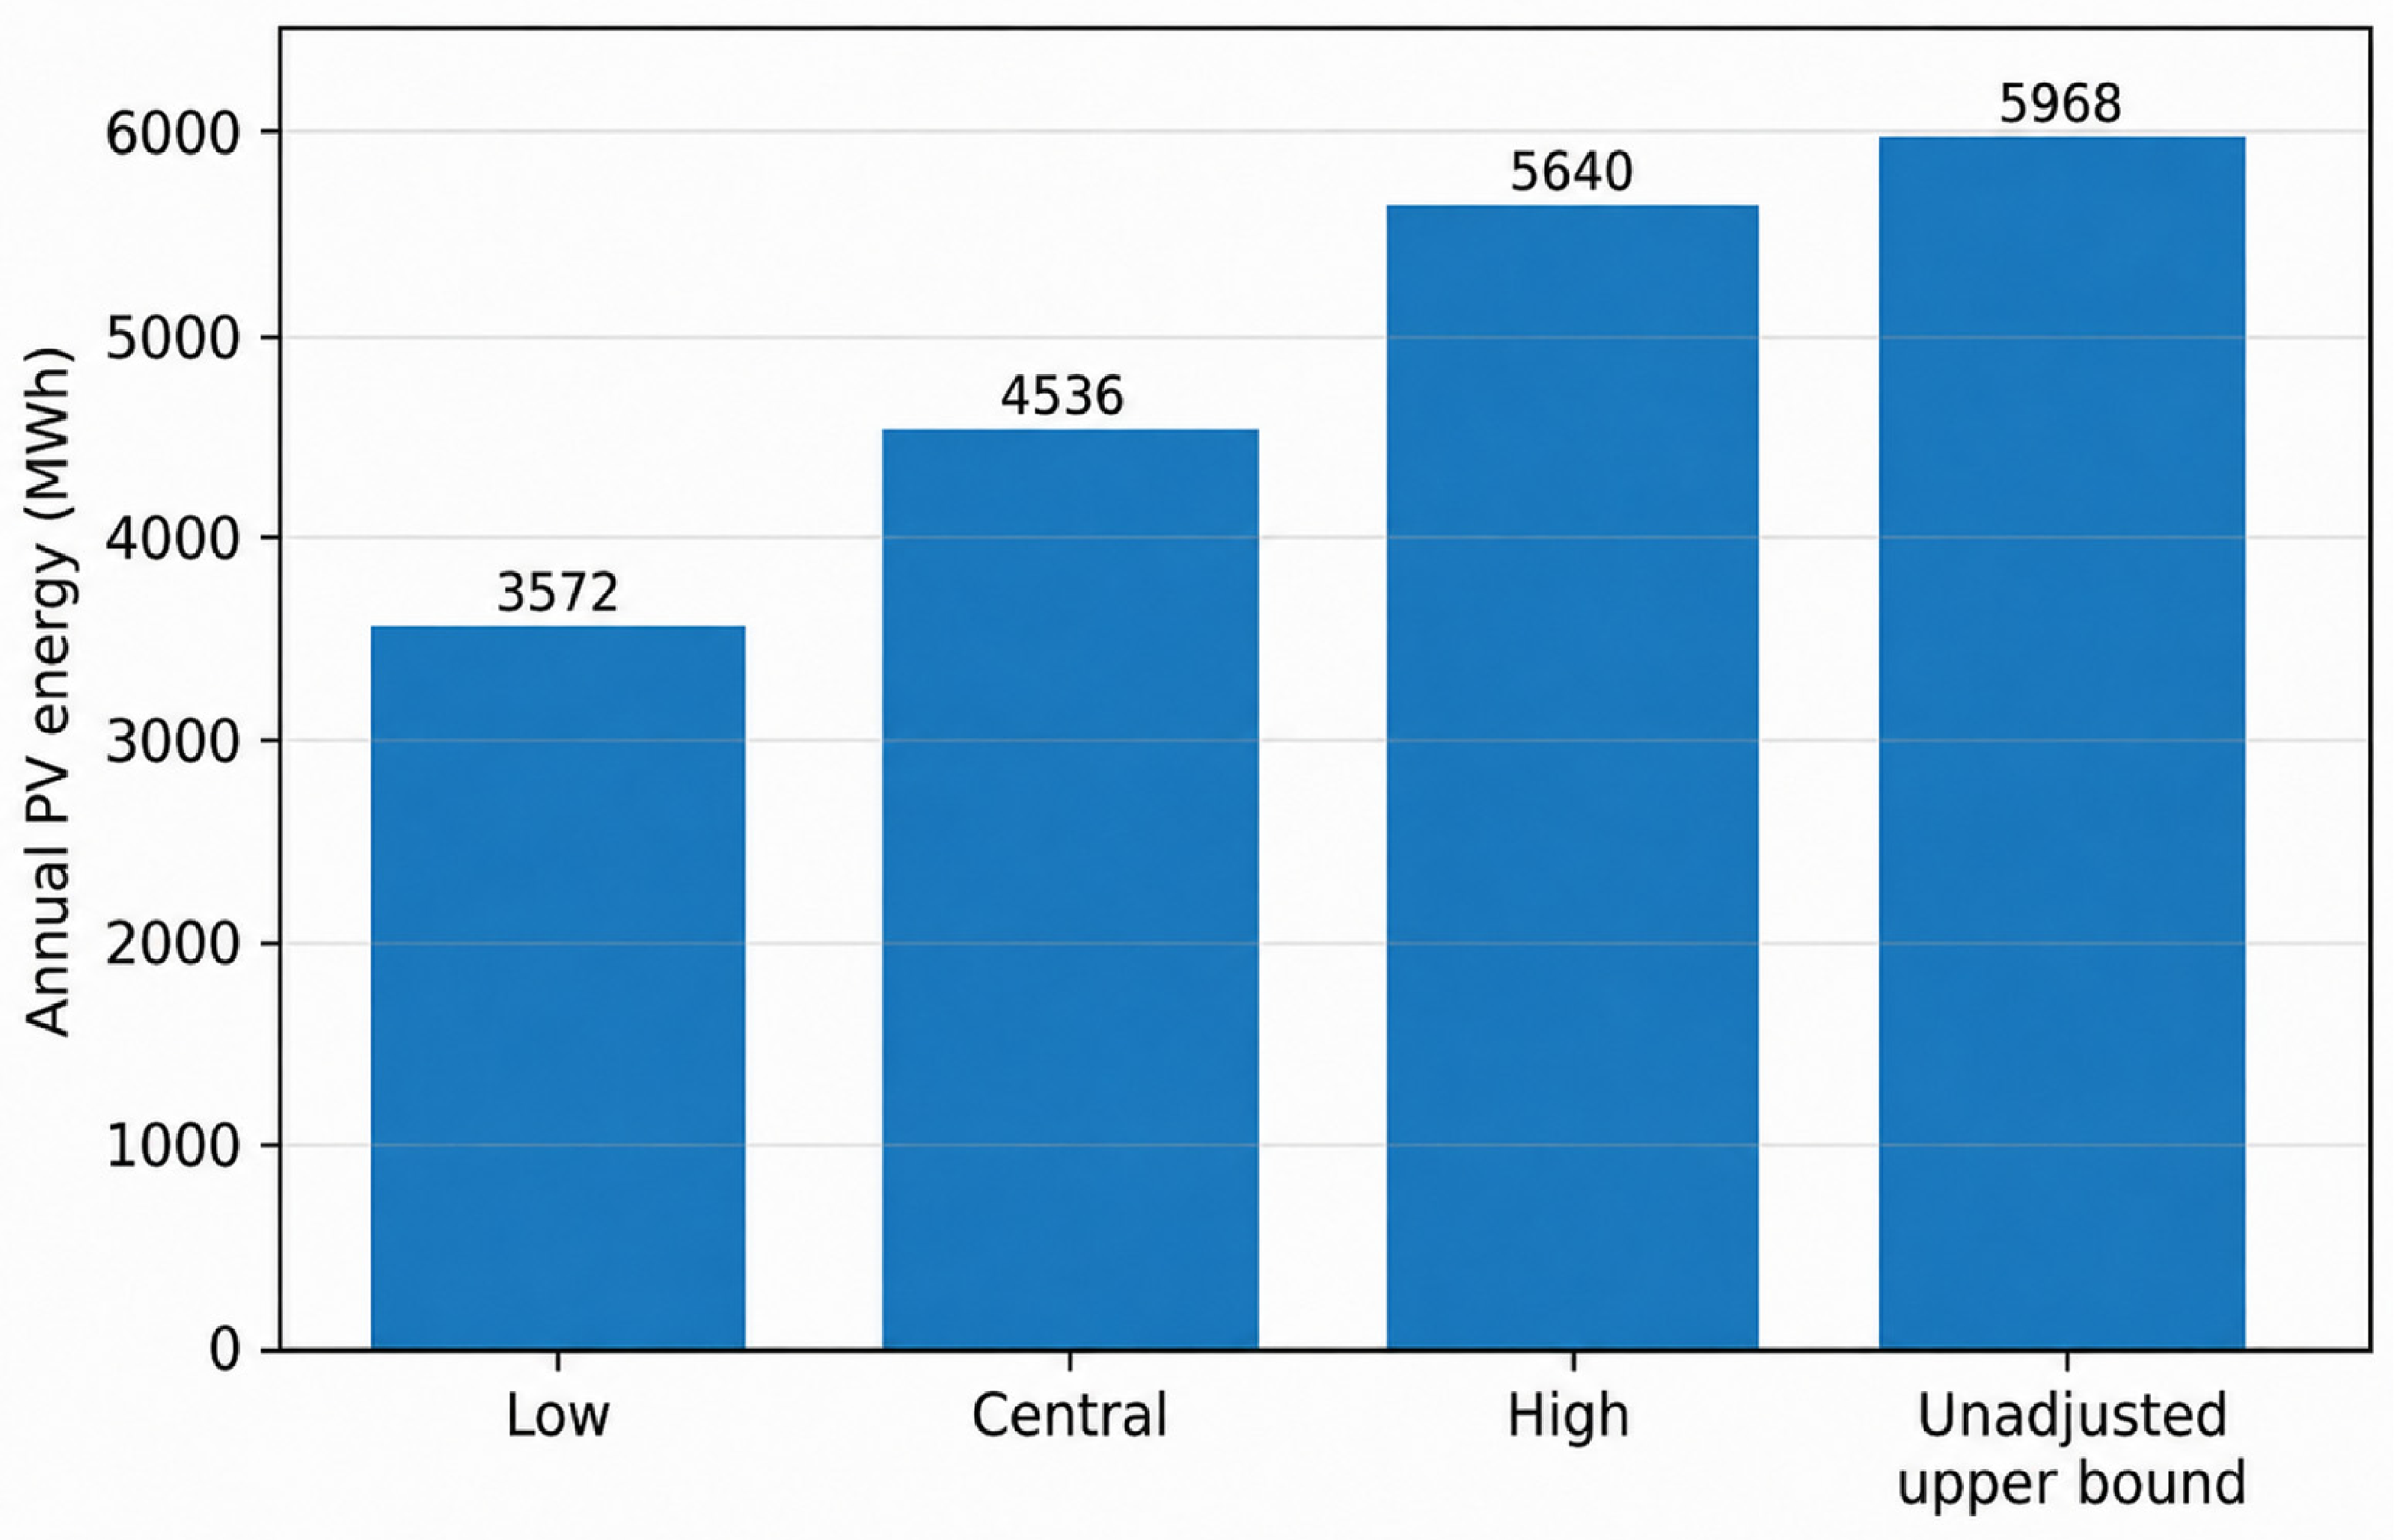
Applying explicit usable-area and operational-retention assumptions yields annual PV-energy values of 3.572 GWh in the low scenario, 4.536 GWh in the central scenario, and 5.640 GWh in the high scenario for the 30-station sample, as illustrated in Figure 5. The corresponding combined assumptions are summarised in Table 4. The 5.968 GWh/year value is retained as an unadjusted historical technical reference. The spread across the scenarios is an assumption-based planning range rather than a statistical uncertainty interval. Table 4 also includes the arithmetic consequence of multiplying each sample result by 1544/30, and those values are not estimates of actual national potential.
Figure 5.
Annual PV-energy output for the 30-station sample under the low, central, high, and unadjusted reference scenarios.
Table 4.
Combined assumption-based PV-energy scenarios for the 30-station sample, with illustrative arithmetic extrapolation to the 1544-station three-operator count.
3.3. Charging-Session Sensitivity and Fleet Diversity
Using the observed mean SOC increase and the large-battery reference capacity, the station-side energy requirement is estimated at 45.23 kWh per charging session after accounting for a charging efficiency of 95%. Under the central PV-energy scenario of 4.536 GWh/year, this corresponds to approximately 100,300 energy-equivalent charging sessions annually as summarised in Table 5. This estimate reflects the defined battery-capacity and charging-efficiency assumptions and should be interpreted as an energy-based capacity indicator rather than a direct forecast of charger utilisation.
Table 5.
Annual energy-equivalent charging sessions using a 95% charging efficiency for the battery-side fleet-diversity cases.
For the fleet-diversity analysis, 25, 40, and 60 kWh are explicitly defined as battery-side energy delivered per session. Applying the same 95% charging efficiency to the central station-side PV generation gives (4,536,000 × 0.95)/25 = 172,368, (4,536,000 × 0.95)/40 = 107,730, and (4,536,000 × 0.95)/60 = 71,820 sessions/year, reported as 172,400, 107,700, and 71,800 in Table 5. The same convention is applied to every row of Table 5. These values remain annual energy-equivalence indicators and do not represent charger throughput or utilisation forecasts.
3.4. Battery Storage, Grid Interaction and Temporal Matching
Annual PV energy alone does not establish the practical operation of fast chargers. Without storage, daytime PV may be used directly, exported or curtailed, while evening and night charging may require grid imports. Conversely, a sufficiently strong grid can absorb short-term mismatch without requiring full energy autonomy. BESS should therefore be treated as an optimisation variable rather than assumed or omitted without discussion.
A preliminary design range of one to two hours of storage per 150 kW charging port (150–300 kWh/port) can be used for screening peak shaving and solar shifting, but optimal power and energy ratings depend on measured 15 min or finer load, tariff demand charges, interconnection limits, degradation, reserve SOC and replacement strategy. The 2024 global utility-scale BESS benchmark of about USD 192/kWh [60] is not a turnkey commercial-station quote. A wider USD 200–400/kWh installed sensitivity is more appropriate for preliminary local assessment. Hourly PV, arrival and dwell-time data are required before claiming reliability or grid independence.
DC fast-charger investment is also separate from the PV retrofit. Published cost assessments show substantial variation with charger rating, civil works, utility service, transformer and installation conditions [65]. The revised study therefore does not combine a generic charger or BESS price into a single misleading payback value.
3.5. Illustrative Economics
For the central physical case, the PV-only screening produces CAPEX of USD 2.38–3.43 million, LCOE of USD 0.053–0.113/kWh, and simple payback of 6.8–19.0 years, as summarised in Table 6. These payback values assume that 100% of annual PV generation displaces electricity purchased at the stated commercial tariff. Under the central financial assumptions, payback increases from 10.8 years at 100% self-consumption to approximately 15.5 years at 75% and 27.6 years at 50%. The analysis therefore indicates conditional PV-retrofit economics only and does not establish the bankability or total-project feasibility of a solar-powered EV charging station.
Table 6.
Illustrative PV-only techno-economic sensitivity for the central physical case under a 100% self-consumption assumption.
The analysis excludes rooftop reinforcement, permitting, grid studies, transformer and switchgear upgrades, DC fast chargers and BESS. As illustrative adders, literature-based installed DC fast-charger costs can be on the order of USD 76,000–118,000 per port [65], while commercial BESS costs can exceed utility-scale benchmarks. These costs must be estimated for each station together with utilisation revenue, demand charges, export compensation, land/lease arrangements and maintenance contracts.
3.6. Environmental Assessment and Charging Timing
Applying the lower and upper grid-emission factors gives avoided-emissions ranges of 1.63–1.87, 2.06–2.37, and 2.57–2.95 ktCO2 e/year for the low, central, and high 30-station energy scenarios, respectively, as summarised in Table 7. The corresponding arithmetic national extrapolations are 83.6–96.1, 106.2–122.1, and 132.1–151.8 ktCO2 e/year. These are average-factor ranges and inherit the limitations of the unrepresentative national scaling.
Table 7.
Life-cycle-adjusted avoided-emissions ranges using grid-emission factors of 0.50–0.568 tCO2 e/MWh and a PV life-cycle factor of 0.045 tCO2 e/MWh.
The timing of generation and charging remains important. Daytime PV charging can displace contemporaneous grid generation, whereas night-time charging does not provide the same operational benefit unless daytime PV is exported or shifted through storage. A complete assessment requires hourly or sub-hourly Saudi marginal-emission factors, charging profiles, storage dispatch, PV replacement, cleaning-water use, chargers, and battery-storage life-cycle impacts.
3.7. Vehicle-Integrated Photovoltaics
Vehicle-integrated photovoltaics (VIPV) can reduce traction or auxiliary energy drawn from charging infrastructure, particularly for vehicles parked outdoors in high-irradiance environments. IEA PVPS defines VIPV as solar cells integrated into the vehicle shell and notes continuing technical development in weight, aesthetics, durability and safety [63]. In this study, VIPV is not credited in the numerical results because Saudi fleet penetration, vehicle surface area, parking exposure, conversion efficiency and user behaviour are unknown. It should be represented in future demand scenarios as a reduction in net station energy per vehicle rather than as guaranteed zero-emission charging.
3.8. Interpretation Relative to Previous Studies
The findings are consistent with earlier studies indicating that existing petrol-station rooftops can accommodate meaningful PV capacity [23,53]. However, the comparison with Malaysian applications is used only to provide contextual support and is not treated as direct validation of performance under Saudi conditions. Although Saudi Arabia benefits from a stronger solar resource, PV systems are also exposed to more severe temperature and soiling effects, which may reduce operational performance.
Recent Saudi PV–EV charging research shows that PV rating, charging capacity, storage, grid connection, and economics should be solved jointly [61]. The present contribution is an application-specific, planning-oriented integration of established methods for an urban petrol-station retrofit context. It does not introduce a fundamentally new PV–EV charging methodology and remains preliminary because station-level engineering files and hourly operating data are unavailable.
4. Limitations and Future Work
This assessment is constrained by several limitations that remain unresolved rather than eliminated by the present revision. First, the 30 petrol stations form an exploratory, non-probability sample whose selection cannot be independently reconstructed because the complete candidate list, search boundaries, and inclusion–exclusion log were not retained. The findings therefore cannot be generalised statistically to Riyadh, Jeddah, or Saudi Arabia. Second, the retained Google Earth Pro gross rooftop area of 19,071 m2 is subject to unquantified measurement error because the original measurement sheets, site coordinates, repeated measurements, and analyst cross-checks are unavailable; the 70–90% usable-area assumptions address engineering layout constraints and do not represent measurement-error bounds. Third, the retained 5.968 GWh/year PVsyst result is not independently reproducible from the available materials because the complete station-level PVsyst projects, meteorological files, detailed system configurations, and loss outputs were not preserved. These limitations restrict the evidential status of the area and PV-energy values to historical aggregate inputs for an exploratory planning assessment. Additional limitations include the use of scenario-based rather than measured temperature, soiling, degradation, and availability factors; reliance on Malaysian charging-session data that are not representative of Saudi charging behaviour; absence of hourly PV–load–storage–grid modelling; lack of feeder, transformer, protection, and interconnection studies; PV-only rather than complete EV-charging-infrastructure economics; and average-factor rather than full prospective life-cycle carbon assessment. The illustrative arithmetic scaling to 1544 stations does not account for regional, structural, climatic, operator, urban–rural, or grid heterogeneity.
Future work should therefore recover and publish the station-level dataset, conduct structural and electrical audits, develop a national GIS-based station inventory, obtain charging records from Saudi charge-point operators, simulate hourly PV–load–storage–grid interactions, and validate capital and operating costs using local quotations. Once these data are available, probabilistic methods such as Monte Carlo simulation or stratified bootstrap analysis could be used to derive confidence intervals rather than relying solely on heuristic scenario bands.
5. Conclusions
This preliminary planning assessment indicates that petrol-station rooftops in the sampled areas of Riyadh and Jeddah may offer useful opportunities for PV-supported EV charging. It does not establish nationwide feasibility, structural feasibility, complete EV-charging-infrastructure feasibility, or grid-independent operation. The retained historical PVsyst output for the 30-site sample is 5.968 GWh/year. However, this value is not independently reproducible from the currently available project files. Applying explicit usable-area, irradiance, and operational-retention assumptions gives a 30-site planning range of 3.572–5.640 GWh/year.
Analysis of 2999 complete charging sessions gives a mean SOC increase of 41.66 percentage points. With a 95% charging efficiency, the central scenario supports approximately 100,300 large-battery-equivalent sessions/year. When 25, 40, and 60 kWh are defined consistently as battery-side delivered energy, the central scenario yields approximately 172,400, 107,700, and 71,800 energy-equivalent sessions/year, respectively. These figures are annual energy-equivalence indicators rather than forecasts of charger throughput or utilisation.
The PV-only economic screening yields a levelised cost of electricity of USD 0.053–0.113/kWh and a simple payback period of 6.8–19.0 years under the stated assumptions. These estimates exclude the costs of DC fast chargers, battery energy storage systems, structural reinforcement, and grid-connection upgrades. Life-cycle-adjusted carbon benefits are estimated at approximately 1.63–2.95 ktCO2 e/year across the 30-site energy scenarios. As these calculations are based on average emission factors, hourly modelling is still required to account for the timing of PV generation, charging demand, storage operation, and displaced grid electricity.
The principal practical implication is that existing petrol stations warrant systematic field investigation as potential solar-supported charging nodes. Investment decisions should be preceded by station-level structural and electrical assessments, collection of Saudi-specific charging-demand data, hourly PV–load–storage–grid simulation, and validation of capital and operating costs using local quotations.
Author Contributions
Conceptualization, S.C.L. and C.A.V.; methodology, H.R.A.A.; software, H.R.A.A.; validation, S.C.L., M.H.S.M.H. and N.F.A.A.; formal analysis, H.R.A.A., M.H.S.M.H. and N.F.A.A.; investigation, H.R.A.A. and L.Y.H.; resources, L.Y.H.; data curation, L.Y.H.; writing—original draft preparation, H.R.A.A. and M.H.S.M.H.; writing—review and editing, S.C.L., C.A.V. and N.F.A.A.; visualization, C.A.V.; supervision, S.C.L. and N.F.A.A.; project administration, S.C.L.; funding acquisition, S.C.L. All authors have read and agreed to the published version of the manuscript.
Funding
This work was funded by Telekom Malaysia Research and Development (TM R&D) under the TM R&D Research Fund (Grant No: RDTC/261170, Project ID: MMUE/260007).
Data Availability Statement
The anonymised charging-session data were provided by EV Connection Sdn. Bhd. under third-party restrictions and cannot be distributed publicly by the authors. Aggregated SOC statistics and monthly PV outputs used in this analysis are reported in the article. The authors do not currently possess a complete station-level dataset, the original Google Earth Pro measurement sheets and site-coordinate records, or a complete set of PVsyst and HelioScope project files for all 30 sites. These materials therefore cannot be supplied upon request. The equations, aggregate values, and scenario assumptions reported in the manuscript are sufficient to reproduce the scenario calculations that follow from the retained aggregate inputs, but they are not sufficient to independently reproduce the historical 5.968 GWh/year PVsyst simulation or reconstruct the original 30-station selection procedure. Further inquiries can be directed to the corresponding author.
Acknowledgments
We sincerely thank EV Connection Sdn Bhd for the provision of the charging session data, which is vital for analysing and modelling EV user behaviour in this research. The support from the Faculty of Engineering, Multimedia University is also greatly appreciated.
Conflicts of Interest
Haneen Radi A AlJuhani is an employee of CEER National Automotive Company; Lee Yuen How is an employee of EV Connection Sdn. Bhd. The authors declare that this study received funding from TMR&D. The funder was not involved in the study design, collection, analysis, interpretation of data, the writing of this article, or the decision to submit it for publication.
Abbreviations
The following abbreviations are used in this manuscript:
| EV | Electric Vehicle |
| ICEV | Internal Combustion Engine Vehicle |
| PV | Photovoltaic |
| SoC | State of Charge |
| EVCS | Electric Vehicle Charging Station |
| SAT | Single-axis tracker |
References
- Sood, S.; Kumar, R.; Tiwari, N.K. Enviro-Economic Assessment of Energy Sources Used for Electric Vehicle Charging. In Proceedings of the 2022 1st International Conference on Sustainable Technology for Power and Energy Systems (STPES), Bilaspur, India, 4–6 July 2022; pp. 1–5. [Google Scholar] [CrossRef] [Scilit]
- Gnanavendan, S.; Selvaraj, S.K.; Dev, S.J.; Mahato, K.K.; Swathish, R.S.; Sundaramali, G.; Accouche, O.; Azab, M. Challenges, Solutions and Future Trends in EV-Technology: A Review. IEEE Access 2024, 12, 17242–17260. [Google Scholar] [CrossRef] [Scilit]
- Pamidimukkala, A.; Kermanshachi, S.; Rosenberger, J.M.; Hladik, G. Barriers and Motivators to the Adoption of Electric Vehicles: A Global Review. Green Energy Intell. Transp. 2024, 3, 100153. [Google Scholar] [CrossRef] [Scilit]
- Toukabri, M.; Boutaleb, B. Assessing Factors Impacting Electric Vehicle Adoption in Saudi Arabia: Insights on Willingness to Pay, Environmental Awareness, and Perceived Risk. Eng. Technol. Appl. Sci. Res. 2025, 15, 19729–19736. [Google Scholar] [CrossRef] [Scilit]
- Ceer: The First Saudi Electric Vehicle Brand. Available online: https://ceermotors.com/ (accessed on 6 January 2025).
- Lucid Group Makes History in Saudi Arabia as It Opens Country’s First-Ever Car Manufacturing Facility. Available online: https://lucidmotors.com/media-room/lucid-makes-history-saudi-arabia-first-car-manufacturing-facility (accessed on 27 January 2024).
- Elshurafa, A.M.; Peerbocus, N. Electric Vehicle Deployment and Carbon Emissions in Saudi Arabia: A Power System Perspective. Electr. J. 2020, 33, 106774. [Google Scholar] [CrossRef] [Scilit]
- Alharbi, S.J.; Alaboodi, A.S. A Review on Techno-Economic Study for Supporting Building with PV-Grid-Connected Systems under Saudi Regulations. Energies 2023, 16, 1531. [Google Scholar] [CrossRef] [Scilit]
- Tripathi, A.K.; Sree Lakshmi, G.; Mishra, H.; Chapala, S.; Alwetaishi, M.; Atamurotov, F.; Benti, N.E.; Sura, S.; Ahamed Saleel, C. Integration of Solar PV Panels in Electric Vehicle Charging Infrastructure: Benefits, Challenges, and Environmental Implications. Energy Sci. Eng. 2025, 13, 2135–2152. [Google Scholar] [CrossRef] [Scilit]
- Kabir, E.; Kumar, P.; Kumar, S.; Adelodun, A.A.; Kim, K.H. Solar Energy: Potential and Future Prospects. Renew. Sustain. Energy Rev. 2018, 82, 894–900. [Google Scholar] [CrossRef] [Scilit]
- Singh, A.; Nikhil, P.G.; Singh, J.P. Techno-Commercial Analysis of a Solar Powered Electric Vehicle Charging Station for Chennai, India. In Proceedings of the 2021 4th International Conference on Electrical, Computer and Communication Technologies (ICECCT), Erode, India, 15–17 September 2021; pp. 1–6. [Google Scholar] [CrossRef] [Scilit]
- Nair, L.M.; Prabha, D.M.S.R. Topologies Used in EV Charging System—A Comparative Analysis. In Proceedings of the 2023 International Conference on Control, Communication and Computing (ICCC), Thiruvananthapuram, India, 19–21 May 2023; pp. 1–6. [Google Scholar] [CrossRef] [Scilit]
- Wu, Y.; Ravey, A.; Chrenko, D.; Miraoui, A. Demand Side Energy Management of EV Charging Stations by Approximate Dynamic Programming. Energy Convers. Manag. 2019, 196, 878–890. [Google Scholar] [CrossRef] [Scilit]
- Guo, G.; Gong, Y. Energy Management of Intelligent Solar Parking Lot with EV Charging and FCEV Refueling Based on Deep Reinforcement Learning. Int. J. Electr. Power Energy Syst. 2022, 140, 108061. [Google Scholar] [CrossRef] [Scilit]
- Mainul Islam, M.; Shareef, H.; Mohamed, A. Optimal Location and Sizing of Fast Charging Stations for Electric Vehicles by Incorporating Traffic and Power Networks. IET Intell. Transp. Syst. 2018, 12, 947–957. [Google Scholar] [CrossRef] [Scilit]
- Zhao, Z.; Lee, C.K.M. Dynamic Pricing for EV Charging Stations: A Deep Reinforcement Learning Approach. IEEE Trans. Transp. Electrif. 2022, 8, 2456–2468. [Google Scholar] [CrossRef] [Scilit]
- Alshareef, S.M.; Morsi, W.G. Probabilistic Modeling of Plug-In Electric Vehicles Charging From Fast Charging Stations. In Proceedings of the 2019 IEEE Electrical Power and Energy Conference (EPEC), Montreal, QC, Canada, 16–18 October 2019; pp. 1–6. [Google Scholar] [CrossRef] [Scilit]
- Lu, Z.; Zhang, Q.; Yuan, Y.; Tong, W. Optimal Driving Range for Battery Electric Vehicles Based on Modeling Users’ Driving and Charging Behavior. J. Adv. Transp. 2020, 2020, 8813137. [Google Scholar] [CrossRef] [Scilit]
- Huang, P.; Ma, Z.; Xiao, L.; Sun, Y. Geographic Information System-Assisted Optimal Design of Renewable Powered Electric Vehicle Charging Stations in High-Density Cities. Appl. Energy 2019, 255, 113855. [Google Scholar] [CrossRef] [Scilit]
- Hisoglu, S.; Tuominen, A.; Huovila, A. An Approach for Selecting Optimal Locations for Electric Vehicle Solar Charging Stations. IET Smart Cities 2023, 5, 123–134. [Google Scholar] [CrossRef] [Scilit]
- Wang, B.; Dehghanian, P.; Wang, S.; Mitolo, M. Electrical Safety Considerations in Large-Scale Electric Vehicle Charging Stations. IEEE Trans. Ind. Appl. 2019, 55, 6603–6612. [Google Scholar] [CrossRef] [Scilit]
- Hema, R.; Venkatarangan, M.J. Adoption of EV: Landscape of EV and Opportunities for India. Meas. Sens. 2022, 24, 100596. [Google Scholar] [CrossRef] [Scilit]
- Alghoul, M.A.; Hammadi, F.Y.; Amin, N.; Asim, N. The Role of Existing Infrastructure of Fuel Stations in Deploying Solar Charging Systems, Electric Vehicles and Solar Energy: A Preliminary Analysis. Technol. Forecast. Soc. Change 2018, 137, 317–326. [Google Scholar] [CrossRef] [Scilit]
- Al Garni, H.Z.; Awasthi, A. Solar PV Power Plant Site Selection Using a GIS-AHP Based Approach with Application in Saudi Arabia. Appl. Energy 2017, 206, 1225–1240. [Google Scholar] [CrossRef] [Scilit]
- Quddus, M.A.; Shahvari, O.; Marufuzzaman, M.; Usher, J.M.; Jaradat, R. A Collaborative Energy Sharing Optimization Model among Electric Vehicle Charging Stations, Commercial Buildings, and Power Grid. Appl. Energy 2018, 229, 841–857. [Google Scholar] [CrossRef] [Scilit]
- Ogbulezie, J.C.; Njok, A.O.; Panjwani, M.K.; Panjwani, S.K. The Impact of High Temperature and Irradiance source on the Efficiency of Polycrystalline Photovoltaic panel in a Controlled Environment. Int. J. Electr. Comput. Eng. (IJECE) 2020, 10, 3942–3947. [Google Scholar] [CrossRef] [Scilit]
- Al-Baghdadi, M.A.R.S.; Ridha, A.A.; Al-Khayyat, A.S. The Effects of Climate Change on Photovoltaic Solar Production in Hot Regions. Diagnostyka 2022, 23, 2022310. [Google Scholar] [CrossRef] [Scilit]
- Hashim, S.M.; Hassan, R.I. Impact of High Temperature on PV Productivity in Hot Desert Climates. Green Technol. Resil. Sustain. 2022, 2, 9. [Google Scholar] [CrossRef] [Scilit]
- Sakaka Solar Power Plant. Available online: https://www.vision2030.gov.sa/en/projects/sakaka/ (accessed on 6 December 2023).
- Nurunnabi, M.; Roy, N.K.; Pota, H.R. Optimal Sizing of Grid-Tied Hybrid Renewable Energy Systems Considering Inverter to PV Ratio—A Case Study. J. Renew. Sustain. Energy 2019, 11, 013505. [Google Scholar] [CrossRef] [Scilit]
- Díaz-Bello, D.; Vargas-Salgado, C.; Águila-León, J.; Lara-Vargas, F. Methodology to Estimate the Impact of the DC to AC Power Ratio, Azimuth, and Slope on Clipping Losses of Solar Photovoltaic Inverters: Application to a PV System Located in Valencia Spain. Sustainability 2023, 15, 2797. [Google Scholar] [CrossRef] [Scilit]
- Hazim, H.I.; Baharin, K.A.; Gan, C.K.; Sabry, A.H.; Humaidi, A.J. Review on Optimization Techniques of PV/Inverter Ratio for Grid-Tie PV Systems. Appl. Sci. 2023, 13, 3155. [Google Scholar] [CrossRef] [Scilit]
- Demirci, A.; Ozturk, Z.; Tercan, S.M.; Nakir, I. Determination of Photovoltaic Inverter Ratio Minimizing Energy Clipping for Electric Vehicle Charging Station under Different Solar Radiations. In Proceedings of the 4th International Congress on Human–Computer Interaction, Optimization and Robotic Applications (HORA 2022), Ankara, Türkiye, 9–11 June 2022; pp. 1–6. [Google Scholar] [CrossRef] [Scilit]
- Previous Versions—PVsyst. Available online: https://www.pvsyst.com/en/ (accessed on 4 September 2023).
- HelioScope|Commercial Solar Software. Available online: https://helioscope.aurorasolar.com/ (accessed on 31 December 2023).
- Visaria, A.A.; Jensen, A.F.; Thorhauge, M.; Mabit, S.E. User Preferences for EV Charging, Pricing Schemes, and Charging Infrastructure. Transp. Res. Part A Policy Pract. 2022, 165, 120–143. [Google Scholar] [CrossRef] [Scilit]
- Marinescu, C. Progress in the Development and Implementation of Residential EV Charging Stations Based on Renewable Energy Sources. Energies 2023, 16, 179. [Google Scholar] [CrossRef] [Scilit]
- Air|Lucid Motors. Available online: https://lucidmotors.com/ (accessed on 6 January 2025).
- Dost, P.; Spichartz, P.; Sourkounis, C. Charging Behavior of Users Utilizing Battery Electric Vehicles and Extended Range Electric Vehicles within the Scope of a Field Test. IEEE Trans. Ind. Appl. 2018, 54, 580–590. [Google Scholar] [CrossRef] [Scilit]
- Eider, M.; Berl, A. Dynamic EV Battery Health Recommendations. In Proceedings of the 9th ACM International Conference on Future Energy Systems (e-Energy ‘18), Karlsruhe, Germany, 12–15 June 2018; Association for Computing Machinery: New York, NY, USA, 2018; pp. 586–592. [Google Scholar] [CrossRef] [Scilit]
- Plötz, P.; Jakobsson, N.; Sprei, F. On the Distribution of Individual Daily Driving Distances. Transp. Res. Part B Methodol. 2017, 101, 213–227. [Google Scholar] [CrossRef] [Scilit]
- Alotaibi, S.; Omer, S.; Su, Y. Identification of Potential Barriers to Electric Vehicle Adoption in Oil-Producing Nations—The Case of Saudi Arabia. Electricity 2022, 3, 365–395. [Google Scholar] [CrossRef] [Scilit]
- Deb, S.; Medved, T.; Fournely, C.; Pečjak, M. Analysis of Real-Time Charging Datasets: A Case Study of Slovenian Village. In Proceedings of the 2023 International Conference on Future Energy Solutions (FES), Istanbul, Türkiye, 12–14 June 2023; pp. 1–6. [Google Scholar] [CrossRef] [Scilit]
- Lucid Air Grand Touring (2023–2024) Price and Specifications—EV Database. Available online: https://ev-database.org/car/1316/Lucid-Air-Grand-Touring#charge-table (accessed on 15 January 2024).
- Haji-Aghajani, E.; Hasanzadeh, S.; Heydarian-Forushani, E. A Novel Framework for Planning of EV Parking Lots in Distribution Networks with High PV Penetration. Electr. Power Syst. Res. 2023, 217, 109156. [Google Scholar] [CrossRef] [Scilit]
- NAFT. Available online: https://www.naft.com.sa/ (accessed on 19 January 2024).
- SASCO. Available online: https://www.sasco.com.sa/ (accessed on 19 January 2024).
- Aldrees Petroleum and Transport Services Company. Available online: https://www.aldrees.com/english/ (accessed on 19 January 2024).
- Karmaker, A.K.; Rahman, M.M.; Hossain, M.A.; Ahmed, M.R. Exploration and Corrective Measures of Greenhouse Gas Emission from Fossil Fuel Power Stations for Bangladesh. J. Clean. Prod. 2020, 244, 118645. [Google Scholar] [CrossRef] [Scilit]
- Kian, A.Y.; Lim, S.C. On the Potential of Solar Energy for Chemical and Metal Manufacturing Plants in Malaysia. Int. J. Adv. Sci. Eng. Inf. Technol. 2023, 13, 1898–1904. [Google Scholar] [CrossRef] [Scilit]
- Siow, C.L.; Leao, H.Y.; Panneerselvem, A. Techno-Economic Study of Solar Energy Implementation in Hospitals in Malaysia. Int. J. Energy Econ. Policy 2025, 15, 583–590. [Google Scholar] [CrossRef] [Scilit]
- Dawoud, B.M.; Lim, S.C. Performance Comparison of Fixed and Single Axis Tracker Photovoltaic System in Large Scale Solar Power Plants in Malaysia. Indones. J. Electr. Eng. Comput. Sci. 2021, 21, 10–17. [Google Scholar] [CrossRef] [Scilit]
- Chindamanee, A.; Lim, S.C. Feasibility Study of Solar-Powered Electric Vehicle Charging Infrastructure at Selected Petrol Stations in Malaysia. J. Inst. Eng. Malays. 2024, 85, 25–30. [Google Scholar] [CrossRef] [Scilit]
- International—U.S. Energy Information Administration (EIA). Available online: https://www.eia.gov/international/analysis/country/SAU (accessed on 27 February 2024).
- Saudi Arabia: Removal of Jeddah’s Last Slums Begins|Saudi—Gulf News. Available online: https://gulfnews.com/world/gulf/saudi/saudi-arabia-removal-of-jeddahs-last-slums-begins-1.91282943 (accessed on 24 August 2023).
- Sheik Mohammed, S.; Titus, F.; Thanikanti, S.B.; Sulaiman, S.M.; Deb, S.; Kumar, N.M. Charge Scheduling Optimization of Plug-In Electric Vehicle in a PV Powered Grid-Connected Charging Station Based on Day-Ahead Solar Energy Forecasting in Australia. Sustainability 2022, 14, 3498. [Google Scholar] [CrossRef] [Scilit]
- AlJuhani, H.; Bedywi, L.; AbdulNour, B. The Role of EV Charging Infrastructure in Shaping Energy Pricing and Consumer Behavior—Case Study in Saudi Arabia; SAE Technical Paper; SAE International: Warrendale, PSA, USA, 2025; p. 2025-01-0421. [Google Scholar] [CrossRef] [Scilit]
- Al Garni, H.Z. The Impact of Soiling on PV Module Performance in Saudi Arabia. Energies 2022, 15, 8033. [Google Scholar] [CrossRef] [Scilit]
- Schill, C.; Anderson, A.; Baldus-Jeursen, C.; Burnham, L.; Micheli, L.; Parlevliet, D.; Pilat, E.; Stridh, B.; Urrejola, E. Soiling Losses—Impact on the Performance of Photovoltaic Power Plants; IEA-PVPS T13-21:2022; IEA PVPS: Paris, France, 2022. [Google Scholar]
- International Renewable Energy Agency. Renewable Power Generation Costs in 2024; IRENA: Abu Dhabi, United Arab Emirates, 2025. [Google Scholar]
- Alhazmi, Y. Techno-Economic Design Analysis of Electric Vehicle Charging Stations Powered by Photovoltaic Technology on the Highways of Saudi Arabia. Energies 2025, 18, 315. [Google Scholar] [CrossRef] [Scilit]
- Saudi Electricity Regulatory Authority. Consumption Tariff. Available online: https://www.sera.gov.sa/en/consumer/electric-tariff/electric-tariff-categories/consumption-tariff (accessed on 3 August 2026).
- International Energy Agency Photovoltaic Power Systems Programme. Trends in Photovoltaic Applications 2024; IEA PVPS Task 1; IEA PVPS: Paris, France, 2024. [Google Scholar]
- Hsu, D.D.; O’Donoughue, P.; Fthenakis, V.; Heath, G.A.; Kim, H.C.; Sawyer, P.; Choi, J.K.; Turney, D.E. Life Cycle Greenhouse Gas Emissions of Crystalline Silicon Photovoltaic Electricity Generation: Systematic Review and Harmonization. J. Ind. Ecol. 2012, 16, S122–S135. [Google Scholar] [CrossRef] [Scilit]
- Bernal, D.; Raheem, A.A.; Inti, S.; Wang, H. Assessment of Economic Viability of Direct Current Fast Charging Infrastructure Investments for Electric Vehicles in the United States. Sustainability 2024, 16, 6701. [Google Scholar] [CrossRef] [Scilit]

Disclaimer/Publisher’s Note: The statements, opinions and data contained in all publications are solely those of the individual author(s) and contributor(s) and not of MDPI and/or the editor(s). MDPI and/or the editor(s) disclaim responsibility for any injury to people or property resulting from any ideas, methods, instructions or products referred to in the content. |
© 2026 by the authors. Published by MDPI on behalf of the World Electric Vehicle Association. Licensee MDPI, Basel, Switzerland. This article is an open access article distributed under the terms and conditions of the Creative Commons Attribution (CC BY) license.