


Abstract
Tree-ring chronologies are essential proxies for investigating ecosystem dynamics and reconstructing environmental variability, yet integrative approaches for assessing chronology quality and sampling representativeness across heterogeneous regions remain limited. We analyzed 190 tree-ring chronologies distributed across Mexico and developed two composite indicators: the Signal Quality Index (SQI), integrating internal coherence, interannual sensitivity, common growth signal strength, and the Sampling Representativeness Index (SRI), quantifying the statistical adequacy of sampling efforts. Both indices were standardized and evaluated using Moran’s I, Local Indicators of Spatial Association (LISA), Getis–Ord Gi* hotspot analysis, and correlations with climatic, hydrological, and edaphic variables. Results revealed a marked decoupling between chronology signal quality and sampling representativeness. SQI exhibited significant positive spatial autocorrelation, with clusters of high and low values associated with hydroclimatic gradients. It was strongly related to indicators of water availability and atmospheric evaporative demand, suggesting greater growth coherence under water-limited conditions. In contrast, SRI displayed weak spatial structure and largely non-significant relationships with environmental variables, indicating that representativeness is driven primarily by methodological decisions and sampling design. These findings highlight complementary ecological (SQI) and methodological (SRI) dimensions of dendrochronological networks and provide a practical framework for improving chronology evaluation, comparability, and network development across environmentally heterogeneous regions.
1. Introduction
Tree rings constitute high-resolution biological archives that provide unique insights into ecosystem dynamics and responses to natural and anthropogenic disturbances. Since the pioneering work of Andrew E. Douglass in the early twentieth century [1], dendrochronology has evolved from a discipline largely based on manual cross-dating procedures into a highly interdisciplinary field integrating ecology, climatology, hydrology, biogeography, remote sensing, and Earth system science [2,3,4,5]. Recent technological and analytical advances have substantially expanded the scope of dendrosciences, enabling increasingly sophisticated assessments of the interactions between forest ecosystems and the Earth system across multiple spatial and temporal scales [6,7].
Despite these advances, several authors have noted signs of a potential slowdown in global dendrochronological development. Although the number of applications has diversified considerably, the incorporation of new chronologies into international repositories has not kept pace with the growing demand for spatially extensive datasets. Moreover, dendrochronological research remains disproportionately concentrated in a relatively small number of species, ecosystems, and geographic regions, limiting the representativeness of existing tree-ring networks and constraining their contribution to large-scale ecological and Earth system research [8]. These challenges highlight the need for new methodological approaches capable of improving the assessment, comparability, and strategic expansion of dendrochronological networks.
Mexico offers an exceptional opportunity to address these challenges. As one of the world’s megadiverse countries, Mexico encompasses remarkable climatic, physiographic, ecological, and biogeographic heterogeneity across relatively short geographic distances [9]. This environmental complexity generates strong gradients in temperature, precipitation, seasonality, elevation, and species composition, creating an ideal natural laboratory for investigating the spatial structure of dendrochronological characteristics across diverse environmental conditions.
Historically, dendrochronological research in Mexico has focused primarily on temperate forests and species characterized by strong climatic sensitivity and reliable cross-dating properties, particularly Pseudotsuga menziesii [10]. This emphasis has produced valuable chronologies and high-quality hydroclimatic reconstructions [11,12], contributing substantially to the understanding of climate variability in Mexico. However, it has also resulted in pronounced taxonomic and geographic overrepresentation within the national dendrochronological network [10]. Consequently, large portions of the country’s environmental diversity remain underrepresented, particularly tropical and subtropical ecosystems, while emerging fields such as dendroecology, dendroanatomy, and dendroarchaeology continue to be comparatively underdeveloped [13].
The environmental heterogeneity that characterizes Mexico also influences the quality and structure of tree-ring records. Factors such as water availability, climatic seasonality, temperature regimes, elevation, soil conditions, and species-specific evolutionary histories directly affect radial growth dynamics and the strength of the environmental signal preserved in annual rings [14]. As a consequence, dendrochronological chronologies vary substantially in their sensitivity, coherence, and statistically valid across regions and species [15].
Traditionally, chronology quality has been evaluated using metrics such as mean sensitivity (MS), interseries correlation (Rbar), expressed population signal (EPS), and Gleichläufigkeit (GLK) [16,17,18,19]. These statistics provide complementary information regarding signal strength, common growth variability, and sampling adequacy, and remain essential tools in dendrochronological analysis. However, interpreting multiple quality metrics simultaneously becomes increasingly challenging when comparing large numbers of chronologies distributed across broad geographic extents. This limitation is particularly relevant in national or continental-scale networks, where hundreds of sites may need to be evaluated within a coherent analytical framework.
One potential solution is the development of synthetic indicators that integrate information from multiple dendrochronological statistics into composite measures. Such indices can facilitate comparative analyses, identify large-scale spatial patterns, and support the prioritization of future sampling efforts. Importantly, these synthetic indicators should not be interpreted as replacements for established dendrochronological metrics, but rather as exploratory tools that summarize multidimensional information and enhance its interpretation across extensive spatial domains. Despite their potential utility, integrative approaches combining dendrochronological quality metrics with spatial analytical frameworks remain largely absent from the literature.
In this study, we evaluate the quality and spatial distribution of dendrochronological records across Mexico using a nationwide network of tree-ring chronologies. Specifically, we (i) develop two synthetic indicators derived from conventional dendrochronological statistics that characterize signal quality and sampling representativeness, respectively, and (ii) assess their spatial structure using quantitative geographical approaches to identify regional patterns and clusters. By integrating chronology-level metrics within a spatially explicit framework, we seek to provide a broader understanding of the ecological and methodological dimensions underlying dendrochronological networks.
We hypothesize that the proposed synthetic indicators exhibit non-random spatial patterns across Mexico. Because these indices integrate information related to growth sensitivity, chronology coherence, common signal strength, and sampling structure, we expect their spatial variability to reflect underlying environmental gradients that influence tree growth dynamics. Consequently, we predict the emergence of spatial clusters and geographic gradients associated with hydroclimatic and ecological conditions rather than a random spatial distribution. Demonstrating such patterns would provide evidence that chronology quality itself contains a meaningful geographic component, with important implications for the interpretation, comparison, and future development of dendrochronological networks in environmentally heterogeneous regions.
2. Materials and Methods
2.1. Dendrochronological Database and Environmental Predictors
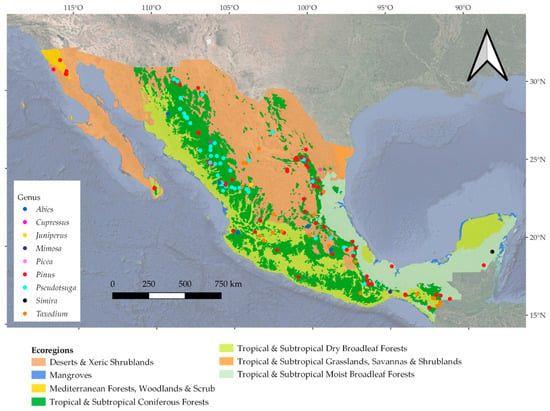
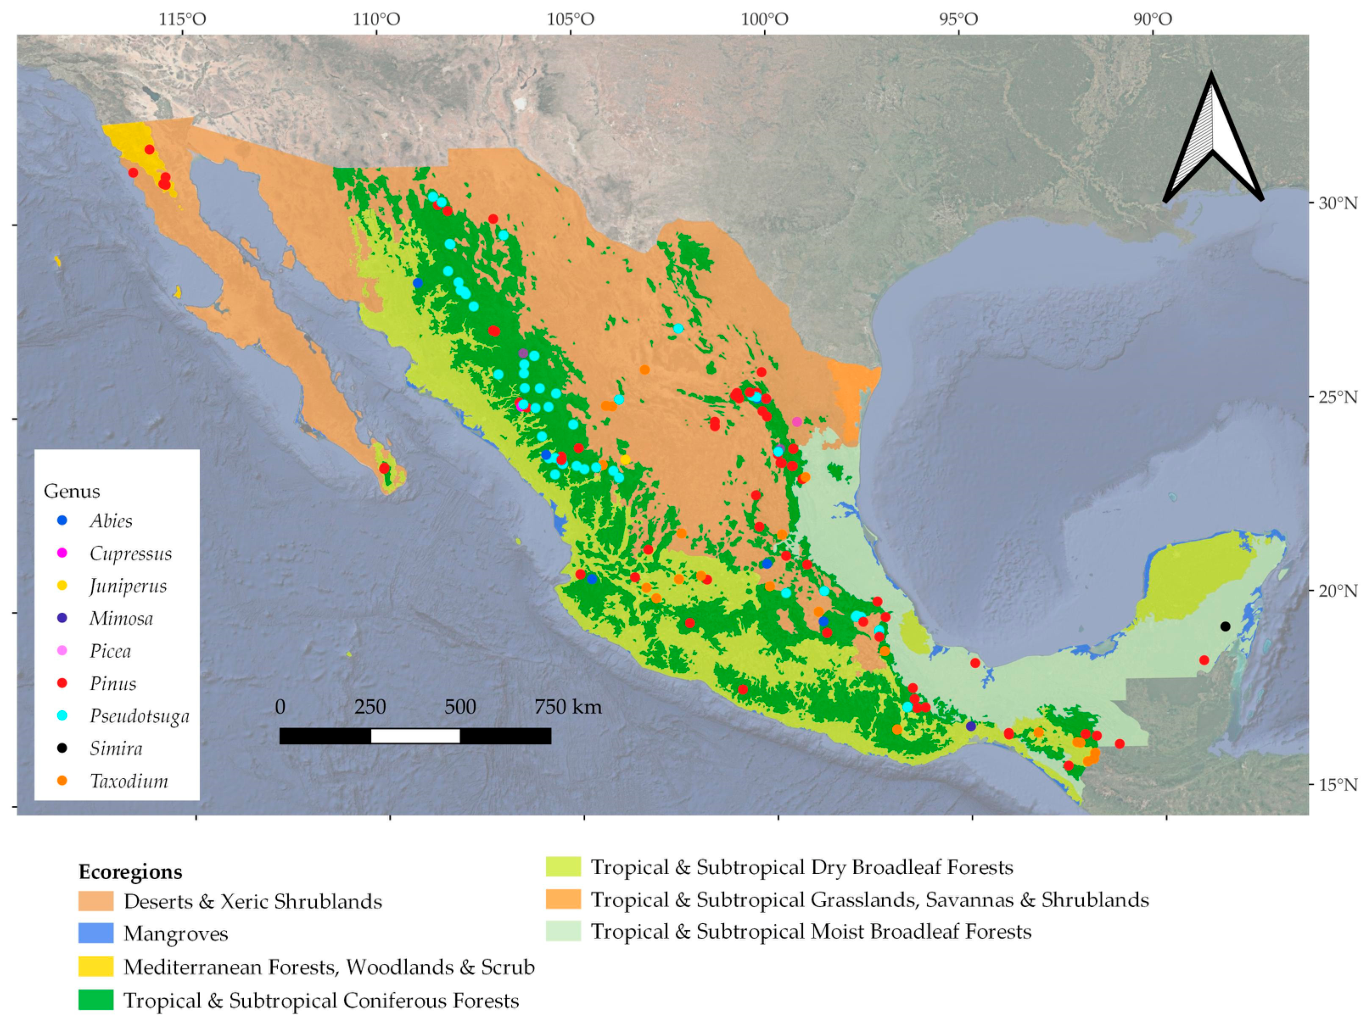
We assembled a quality-controlled database comprising 190 tree-ring chronologies distributed across Mexico (Figure 1). Chronology files in rwl format were compiled from two primary sources: the International Tree-Ring Data Bank (ITRDB) and the Dendroecology Laboratory of northern Mexico, which contributed approximately 70% and 30% of the chronologies, respectively. The resulting network encompasses 190 chronologies representing 49 tree species from four botanical families, spanning an elevational gradient from 33 to 3800 m across five major terrestrial ecoregions in Mexico. It is, however, dominated by climate-sensitive conifers widely used in dendroclimatological research, particularly species of Pseudotsuga (31% of the chronologies) and Pinus (36%), which together account for approximately 67% of the compiled chronologies. A detailed summary of species composition, taxonomic family, chronology contribution, elevational range, and represented ecoregions is provided in Table A1.
Figure 1.
Geographic distribution of the 190 tree-ring chronologies analyzed across Mexico. Color points indicate chronology locations computed by genus. Background shading delineates the major ecoregions represented in the dataset. Together, these regions encompass a marked bioclimatic gradient ranging from arid and semi-arid environments to humid tropical ecosystems. Sampling elevations range from 138 to 3504 m above sea level, capturing substantial environmental variation across Mexican forest ecosystems.
To characterize chronology quality and signal properties, we calculated four widely used dendrochronological statistics: mean sensitivity (MS), mean interseries correlation (Rbar), expressed population signal (EPS), and Gleichläufigkeit (GLK). Together, these metrics describe complementary attributes of chronology performance, including interannual growth variability, common signal strength, sampling adequacy, and temporal agreement among individual series (Table 1). All calculations were performed using the dplR package [20].
Because these statistics differ in scale and interpretation, all variables were standardized using min–max normalization before analysis. This transformation rescaled each metric to a common dimensionless range while preserving their relative distributions and directional relationships, thereby facilitating their integration into composite indices and subsequent multivariate analyses [21].
To investigate the environmental controls on chronology quality, we compiled geographic coordinates (latitude, longitude, and elevation) together with a suite of climatic, hydrological, edaphic, and vegetation structural variables representing the principal environmental gradients across Mexico.
Climatic predictors included maximum temperature (TMAX, °C), minimum temperature (TMIN, °C), precipitation (PPT, mm), Vapor-related atmospheric moisture (VAP, %); vapor pressure deficit (VPD, kPa), potential evapotranspiration (PET, mm), actual evapotranspiration (AET, mm), the six-month Standardized Precipitation–Evapotranspiration Index (SPEI-6), and climatic water deficit (DEF, mm). These variables were extracted from the TerraClimate dataset at approximately 4 km spatial resolution [22].
Soil variables included cation exchange capacity (CEC; mmol(c) kg−1), coarse fragment volume (CFVO; cm3 dm−3), clay, sand, and silt fractions (g kg−1), organic carbon density (OCD; hg m−3), soil organic carbon (SOC; dg kg−1), soil pH measured in water (pHH2O), and total nitrogen content (N; cg kg−1). These data were obtained from the globally harmonized SoilGrids and WoSIS databases. To account for variation in forest structure, we additionally incorporated canopy height (CH; m) derived from the Meta Forest Monitoring Canopy Height product at 10 m spatial resolution. This remotely sensed dataset, generated within the Google Earth Engine platform, provides spatially consistent estimates of forest canopy structure across Mexico.
Collectively, these datasets integrate dendrochronological, geographic, climatic, edaphic, and vegetation structural information across a wide range of environmental conditions, providing a comprehensive framework for evaluating the spatial variability of chronology quality and sampling representativeness at the national scale.
2.2. Development of Composite Dendrochronological Indices
To integrate multiple dimensions of chronology performance into a unified analytical framework, we developed two composite indices that characterize complementary aspects of dendrochronological datasets: the Signal Quality Index (SQI) and the Sampling Representativeness Index (SRI). These indices were designed to facilitate comparisons among chronologies spanning diverse species, ecosystems, and environmental conditions while maintaining the information contained in conventional dendrochronological statistics. The SQI was developed to summarize the overall strength and coherence of the dendrochronological signal. It was calculated as:
where (MS′), (Rbar′), (EPS′), and (GLK′) represent the min–max standardized values of mean sensitivity, mean interseries correlation, expressed population signal, and Gleichläufigkeit, respectively. Prior to index construction, all variables were normalized to a common scale ranging from 0 to 1 to ensure comparability and equal contribution of each component. Equal weighting was adopted because no established theoretical or empirical framework currently supports assigning differential importance to these metrics across the broad range of species (see Table A1), ecosystems, and environmental conditions represented in the dataset. Consequently, each component was assumed to contribute equally to the overall characterization of chronology quality.
The SQI integrates complementary attributes of chronology quality, including interannual growth sensitivity, common signal strength, population representativeness, and temporal agreement among series. Consequently, higher SQI values indicate chronologies characterized by stronger and more coherent growth signals, greater internal consistency, and enhanced sensitivity to environmental variability. Because some component metrics are not entirely independent, the SQI should be interpreted as a synthetic indicator of relative chronology quality rather than as an absolute measure of dendrochronological performance.
To quantify the adequacy of sampling efforts and the capacity of chronologies to represent population-level growth variability, we calculated the Sample Size Sufficiency statistic (SSS) as:
where (N) denotes the number of individual series included in a chronology and Rbar is the mean interseries correlation. The SSS explicitly combines sample size and common signal strength, thereby providing a quantitative measure of sampling adequacy for capturing the underlying population signal. Because conventional SSS does not explicitly account for the temporal extent of a chronology, we additionally evaluated chronology duration as a complementary dimension of sampling representativeness. A duration-weighted SSS was calculated by multiplying SSS values by a normalized chronology-length factor, where chronology length was scaled relative to the maximum chronology duration in the dataset (see Dataset S1 in Supplementary Materials). This sensitivity analysis was used to assess the contribution of temporal coverage to representativeness estimates without modifying the original SSS formulation.
To facilitate direct comparisons among chronologies, SSS values were subsequently standardized using min–max normalization:
The resulting metric, termed the SRI, ranges from 0 to 1, with higher values indicating greater statistical representativeness and an increased capacity of the chronology to reproduce population-level growth patterns.
In this study, SRI is interpreted as a measure of statistical sampling representativeness based on sample depth and interseries coherence. Chronology duration was evaluated separately as a complementary temporal attribute because temporal coverage represents an additional dimension of chronology stability rather than a direct component of statistical sampling adequacy.
Conceptually, the SQI and SRI capture two distinct but complementary dimensions of dendrochronological networks. The SQI reflects the ecological quality and coherence of the growth signal recorded by trees, whereas the SRI characterizes the methodological strength of the sampling design. Together, these indices provide an integrative framework for evaluating chronology performance across broad environmental gradients and large spatial networks.
To evaluate the sensitivity of SQI and SRI to the normalization procedure, we additionally calculated both indices using Z-score standardization. The resulting values were compared with those obtained from Min-Max scaling using Pearson and Spearman correlation coefficients to assess the consistency of chronology rankings between normalization approaches.
Table 1.
Descriptive statistics of dendrochronological metrics and composite indices for the 190 chronologies analyzed. Values are presented as mean ± standard deviation and observed range. Reported variables include mean sensitivity (MS), mean interseries correlation (Rbar), expressed population signal (EPS), sample size sufficiency (SSS), Gleichläufigkeit (GLK), Signal Quality Index (SQI), and Sampling Representativeness Index (SRI). Collectively, these metrics characterize chronology coherence, signal strength, sampling adequacy, and overall chronology performance.
2.3. Environmental Correlates of Chronology Quality
To explore potential environmental controls on chronology performance, we examined relationships between the composite dendrochronological indices and a suite of climatic, hydrological, edaphic, and vegetation structural variables using Pearson product–moment correlation analyses. This approach was intended as an exploratory assessment of the degree to which spatial variation in chronology quality and sampling representativeness may be associated with environmental gradients across Mexico.
Pairwise associations between each environmental variable and the dendrochronological indices were quantified using Pearson product–moment correlation coefficients (r). Statistical significance was evaluated using two-tailed tests at p < 0.05, 0.01, and 0.001. Because numerous pairwise comparisons were performed, the resulting correlations should be interpreted as exploratory evidence of association rather than as definitive tests of environmental control.
The chronology network comprises multiple tree species spanning diverse ecological settings (Table A1). Species-specific differences in growth strategy and climatic sensitivity are therefore expected to contribute to variability in chronology characteristics. Consequently, the correlation analyses were intended to evaluate the integrated environmental behavior of the chronology network rather than species-specific growth responses. The contribution of species identity to SQI variability was evaluated separately using a linear model (SQI ~ Species + Altitude), and the results are presented in the Discussion and Table A6.
To evaluate whether chronology quality exhibits nonlinear responses along environmental gradients, we complemented the correlation analysis with Generalized Additive Models (GAMs) fitted using the mgcv package in R version 2026.05.0 Build 218 (Posit Software, PBC, 2026). Pearson correlations were used as an exploratory assessment of broad environmental associations, whereas GAMs provided a flexible framework for evaluating potential nonlinear responses and identifying whether the observed relationships persisted beyond linear approximations. Prior to model fitting, multicollinearity among candidate predictors was assessed using Variance Inflation Factors (VIF), allowing the exclusion of highly redundant variables from the multivariable model. Smooth functions were initially evaluated for individual predictors, followed by a multivariable GAM including variables representing the strongest ecological gradients and acceptable collinearity levels (precipitation, actual evapotranspiration, maximum temperature, and soil pH). Models were fitted using restricted maximum likelihood (REML) and evaluated based on adjusted R2, deviance explained, effective degrees of freedom (EDF), F-statistics, and associated significance levels.
Correlation coefficients were summarized as a correlation matrix restricted to associations between dendrochronological indices and environmental predictors, facilitating visualization of broad ecological gradients influencing chronology characteristics. Because both Pearson correlations and GAMs evaluate statistical associations rather than causal mechanisms, the observed relationships should be interpreted as evidence of general environmental patterns operating across the chronology network. Local variation associated with species composition, site characteristics, and other unmeasured spatial processes is expected to contribute to the remaining unexplained variability. This exploratory framework nevertheless provides an appropriate basis for interpreting the environmental and spatial organization of chronology quality across Mexico.
2.4. Spatial Analyses
The spatial structure of the composite dendrochronological indices was evaluated using complementary measures of global and local spatial autocorrelation. Geographic coordinates (latitude and longitude) associated with each chronology were used to construct a spatial weights matrix based on a k-nearest-neighbor (k-NN) approach.
A neighborhood size of k = 5 was selected to ensure that all chronologies retained a consistent number of spatial connections while preserving sufficient local sensitivity to detect regional clustering patterns across an unevenly distributed sampling network. The resulting row-standardized spatial weights matrix was subsequently used in all spatial analyses.
To evaluate the sensitivity of spatial autocorrelation results to the neighborhood definition, we repeated the global Moran’s I analysis using alternative k-nearest neighbor configurations (k = 4, 5, 6, 8, and 10). This approach allowed us to assess whether the detected spatial patterns were dependent on the selected neighborhood size.
Global spatial autocorrelation was assessed using Moran’s I [23], which evaluates whether the spatial distribution of observed values differs significantly from a random spatial pattern. Positive values of Moran’s I indicate clustering of similar values, whereas negative values indicate spatial dispersion. Local spatial structure was examined using Local Indicators of Spatial Association (LISA; [24]). This analysis identifies statistically significant local clusters of similar values (high–high and low–low associations) as well as spatial outliers (high–low and low–high associations) at individual locations. Statistical significance was evaluated through Monte Carlo permutation tests using 999 random permutations, with significance assessed at p < 0.05.
To further characterize spatial concentration patterns, we applied the Getis–Ord Gi* statistic [25], which identifies statistically significant hotspots and coldspots of SQI and SRI values. Whereas LISA identifies local similarities and spatial outliers, the Gi* statistic detects broader regions where unusually high or low values are spatially concentrated. Together, these complementary approaches provide a reliable assessment of the geographic organization of chronology quality and sampling representativeness.
Spatial patterns were visualized using thematic maps depicting the distribution of SQI and SRI values, LISA cluster classifications, and Getis–Ord Gi* hotspot analyses. These visualizations enabled the identification of non-random geographic structures and facilitated the interpretation of potential relationships among chronology characteristics, environmental gradients, physiographic heterogeneity, and regional sampling intensity.
All statistical and spatial analyses were conducted in R (R Core Team, 2025) using the packages sf, spdep, spatialreg, corrplot, and associated spatial analysis libraries [26].
3. Results
3.1. Performance of Dendrochronological Indices
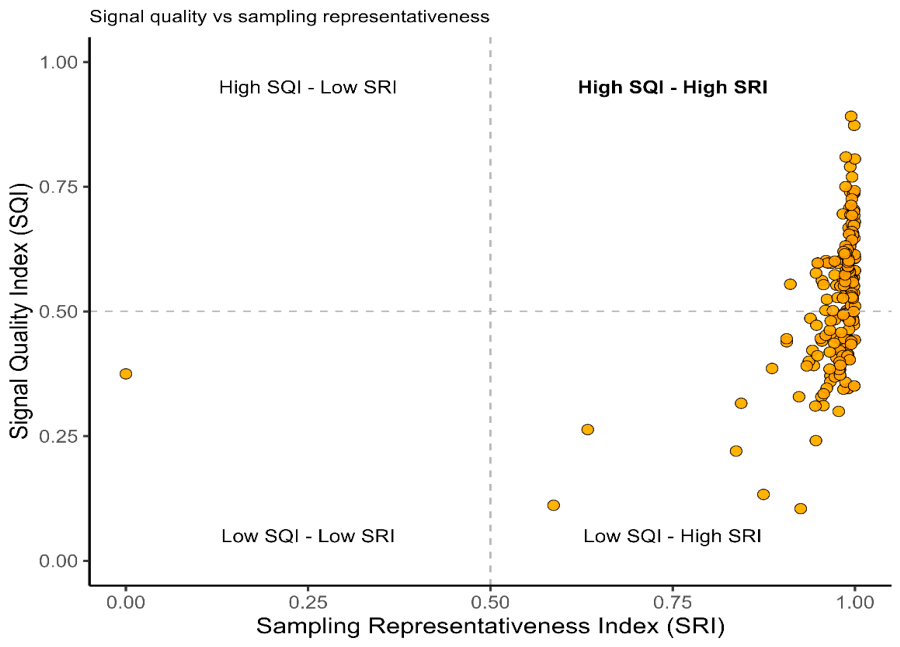
The SQI–SRI distribution reveals a well-structured and interpretable pattern in dendrochronological quality across the analyzed chronologies (Figure 2). Overall, the joint behavior of both indices demonstrates strong internal consistency and effective discrimination among chronologies, supporting the strength of the proposed composite framework. The normalization sensitivity analysis showed that SQI and SRI were highly consistent to the standardization approach. Values derived from Min–Max scaling and Z-score standardization showed very strong agreement for SQI (Pearson r = 0.999; Spearman ρ = 0.997) and identical rankings for SRI (Pearson r = 1.000; Spearman ρ = 1.000). The near-perfect agreement observed for SRI is likely related to its mathematical formulation, as both normalization approaches are linear transformations of the same SSS values and preserve the relative ranking among chronologies. The slightly lower correlations observed for SQI may result from the combination of multiple normalized components within the composite index. Overall, these results indicate that the choice of normalization method had a negligible effect on the relative assessment of chronology quality and sampling representativeness (Figure A1 and Table A2).
Figure 2.
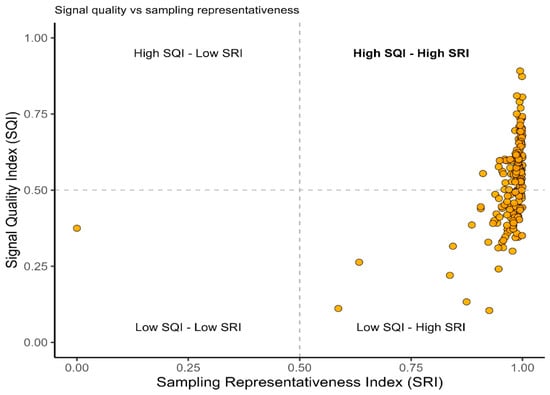
Bidimensional dendrochronological quality space. Distribution of chronologies according to the Signal Quality Index (SQI) and the Sampling Representativeness Index (SRI). Dashed lines indicate the median values of both indices and define four quality domains, distinguishing chronologies with contrasting combinations of signal strength and sampling representativeness.
The duration-weighted SSS sensitivity analysis showed that conventional SSS values remained consistently high across chronologies (mean SSS = 0.998), while incorporating chronology duration provided an additional perspective on temporal representativeness (Table A3).
A complementary temporal sensitivity analysis evaluated the relationship between chronology duration and dendrochronological quality indicators. Chronology length showed a weak positive relationship with SRI (Spearman ρ = 0.17, p = 0.015) and SSS (Spearman ρ = 0.17, p = 0.015), whereas weaker negative associations were observed with SQI (ρ = −0.29, p < 0.001), Rbar (ρ = −0.20, p = 0.005), and EPS (ρ = −0.31, p < 0.001). These results indicate that chronology duration captures a temporal attribute that is not strongly coupled with sampling representativeness or signal-strength metrics. Therefore, chronology duration was retained as a complementary descriptor rather than incorporated into the SRI formulation (Table A3; Figure A2).
A dominant proportion of observations is concentrated in the upper-right quadrant, indicating that most chronologies simultaneously exhibit high Signal Quality Index (SQI) and high Sampling Representativeness Index (SRI). This pattern reflects the presence of a substantial subset of high-performance chronologies characterized by both strong internal growth coherence and adequate sampling design. Importantly, the clear aggregation of observations in this quadrant supports the capacity of the proposed indices to consistently identify methodologically valid chronologies suitable for subsequent ecological and climatic inference.
A secondary but informative pattern emerges in the lower-right quadrant, where chronologies exhibit high sampling representativeness but comparatively low signal quality. This configuration suggests that, while sampling effort is generally sufficient to capture population-level variability, differences in intrinsic growth coherence and environmental signal strength remain a key source of variability among chronologies. This decoupling further highlights the added value of the SQI in isolating signal quality independently of sampling intensity.
In contrast, the scarcity of observations in quadrants associated with low SRI values indicates that insufficient sampling is relatively uncommon across the dataset. This result reinforces the general adequacy of the underlying dendrochronological sampling design and confirms that the SRI effectively captures a bounded and coherent dimension of sampling representativeness rather than random variability.
Taken together, the SQI–SRI structure demonstrates strong discriminatory power and conceptual complementarity between ecological signal quality (SQI) and methodological representativeness (SRI). The clear organization of observations in the bidimensional space supports the scientific soundness of the proposed indices and indicates that they provide a stable and interpretable framework for evaluating dendrochronological network quality across heterogeneous environmental conditions.
The upper-right quadrant represents high-performing chronologies characterized by both strong signal quality and reliable sampling design. The remaining quadrants reflect specific methodological or ecological constraints associated with either reduced signal quality or limited sampling representativeness. This visualization enables simultaneous evaluation of the two complementary dimensions of dendrochronological performance across the national network.
3.2. Spatial Structure of Dendrochronological Indices
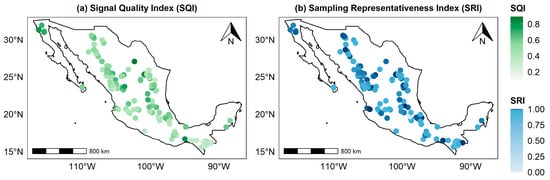
The spatial analysis of the derived dendrochronological indices revealed contrasting patterns between SQI and SRI. At the global scale, spatial autocorrelation analyses indicated a moderate but significant spatial structure for SQI, whereas SRI exhibited an approximately random spatial distribution across Mexico.
Moran’s I for SQI was positive and statistically meaningful (I = 0.255; expected value = −0.005), indicating significant spatial clustering of similar values. This pattern demonstrates that dendrochronological signal quality is not randomly distributed but instead exhibits a clear geographic structure. Such organization is consistent with the influence of spatially structured environmental gradients that regulate growth coherence and the strength of common signals among tree-ring series.
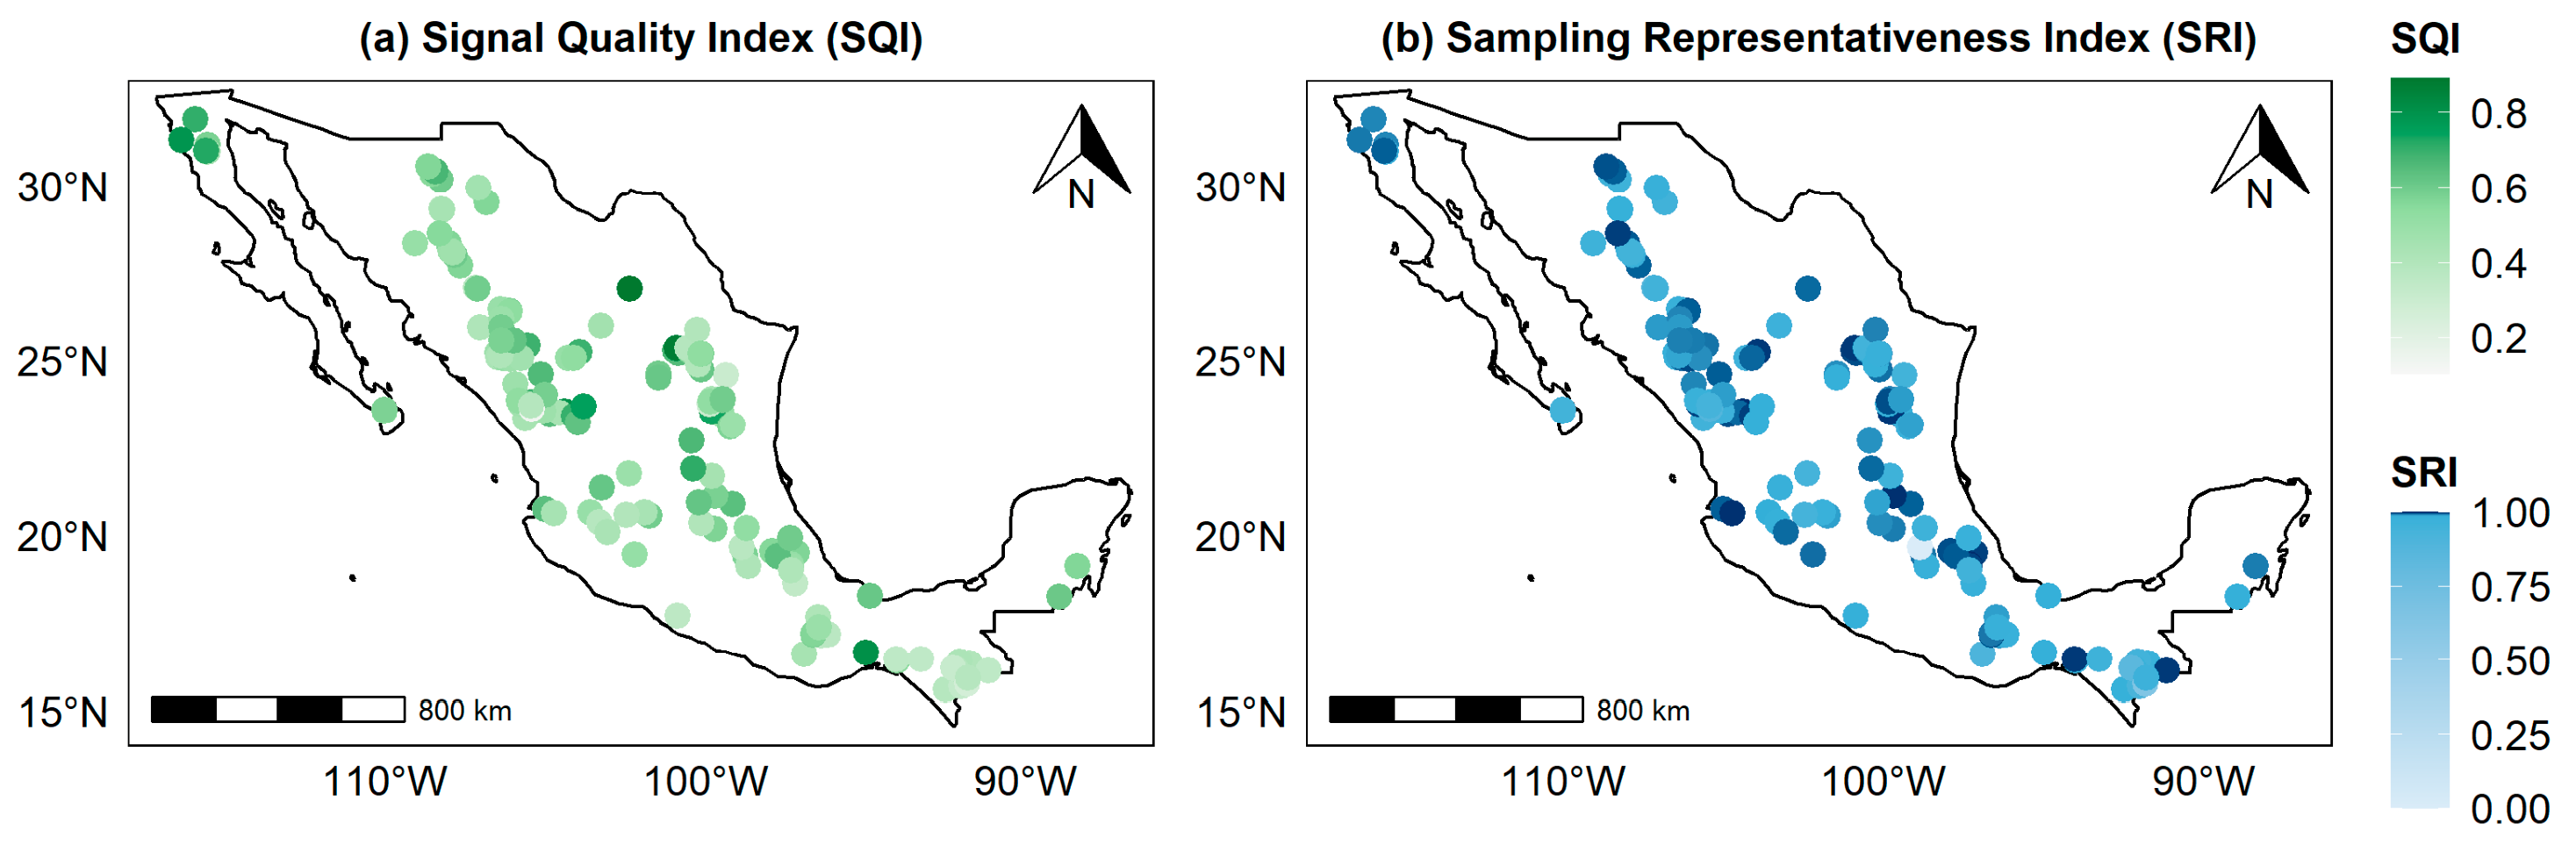
In contrast, SRI showed a Moran’s I value close to zero (I = 0.035; expected value = −0.005), indicating the absence of significant global spatial autocorrelation. This suggests that sampling representativeness is broadly homogeneous across the study domain and does not exhibit marked regional clustering. Overall, these results indicate that spatial variability within the dendrochronological network is primarily driven by SQI, whereas SRI remains comparatively invariant across geographic space (Figure 3).
Figure 3.
Spatial distribution of dendrochronological indices in Mexico. Spatial distribution of (a) the Signal Quality Index (SQI) and (b) Sampling Representativeness Index (SRI) across Mexico. The SQI reflects the spatial variability in dendrochronological signal quality, whereas the SRI represents the statistical representativeness of sampling across the national network.
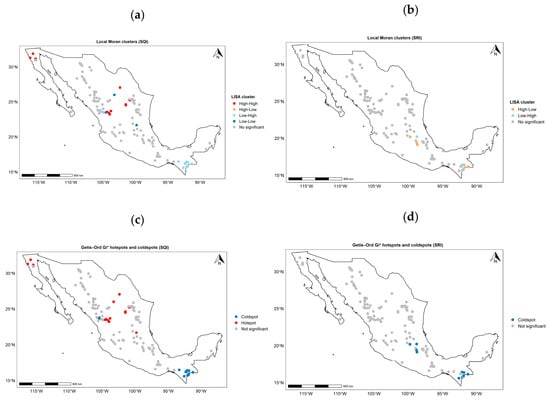
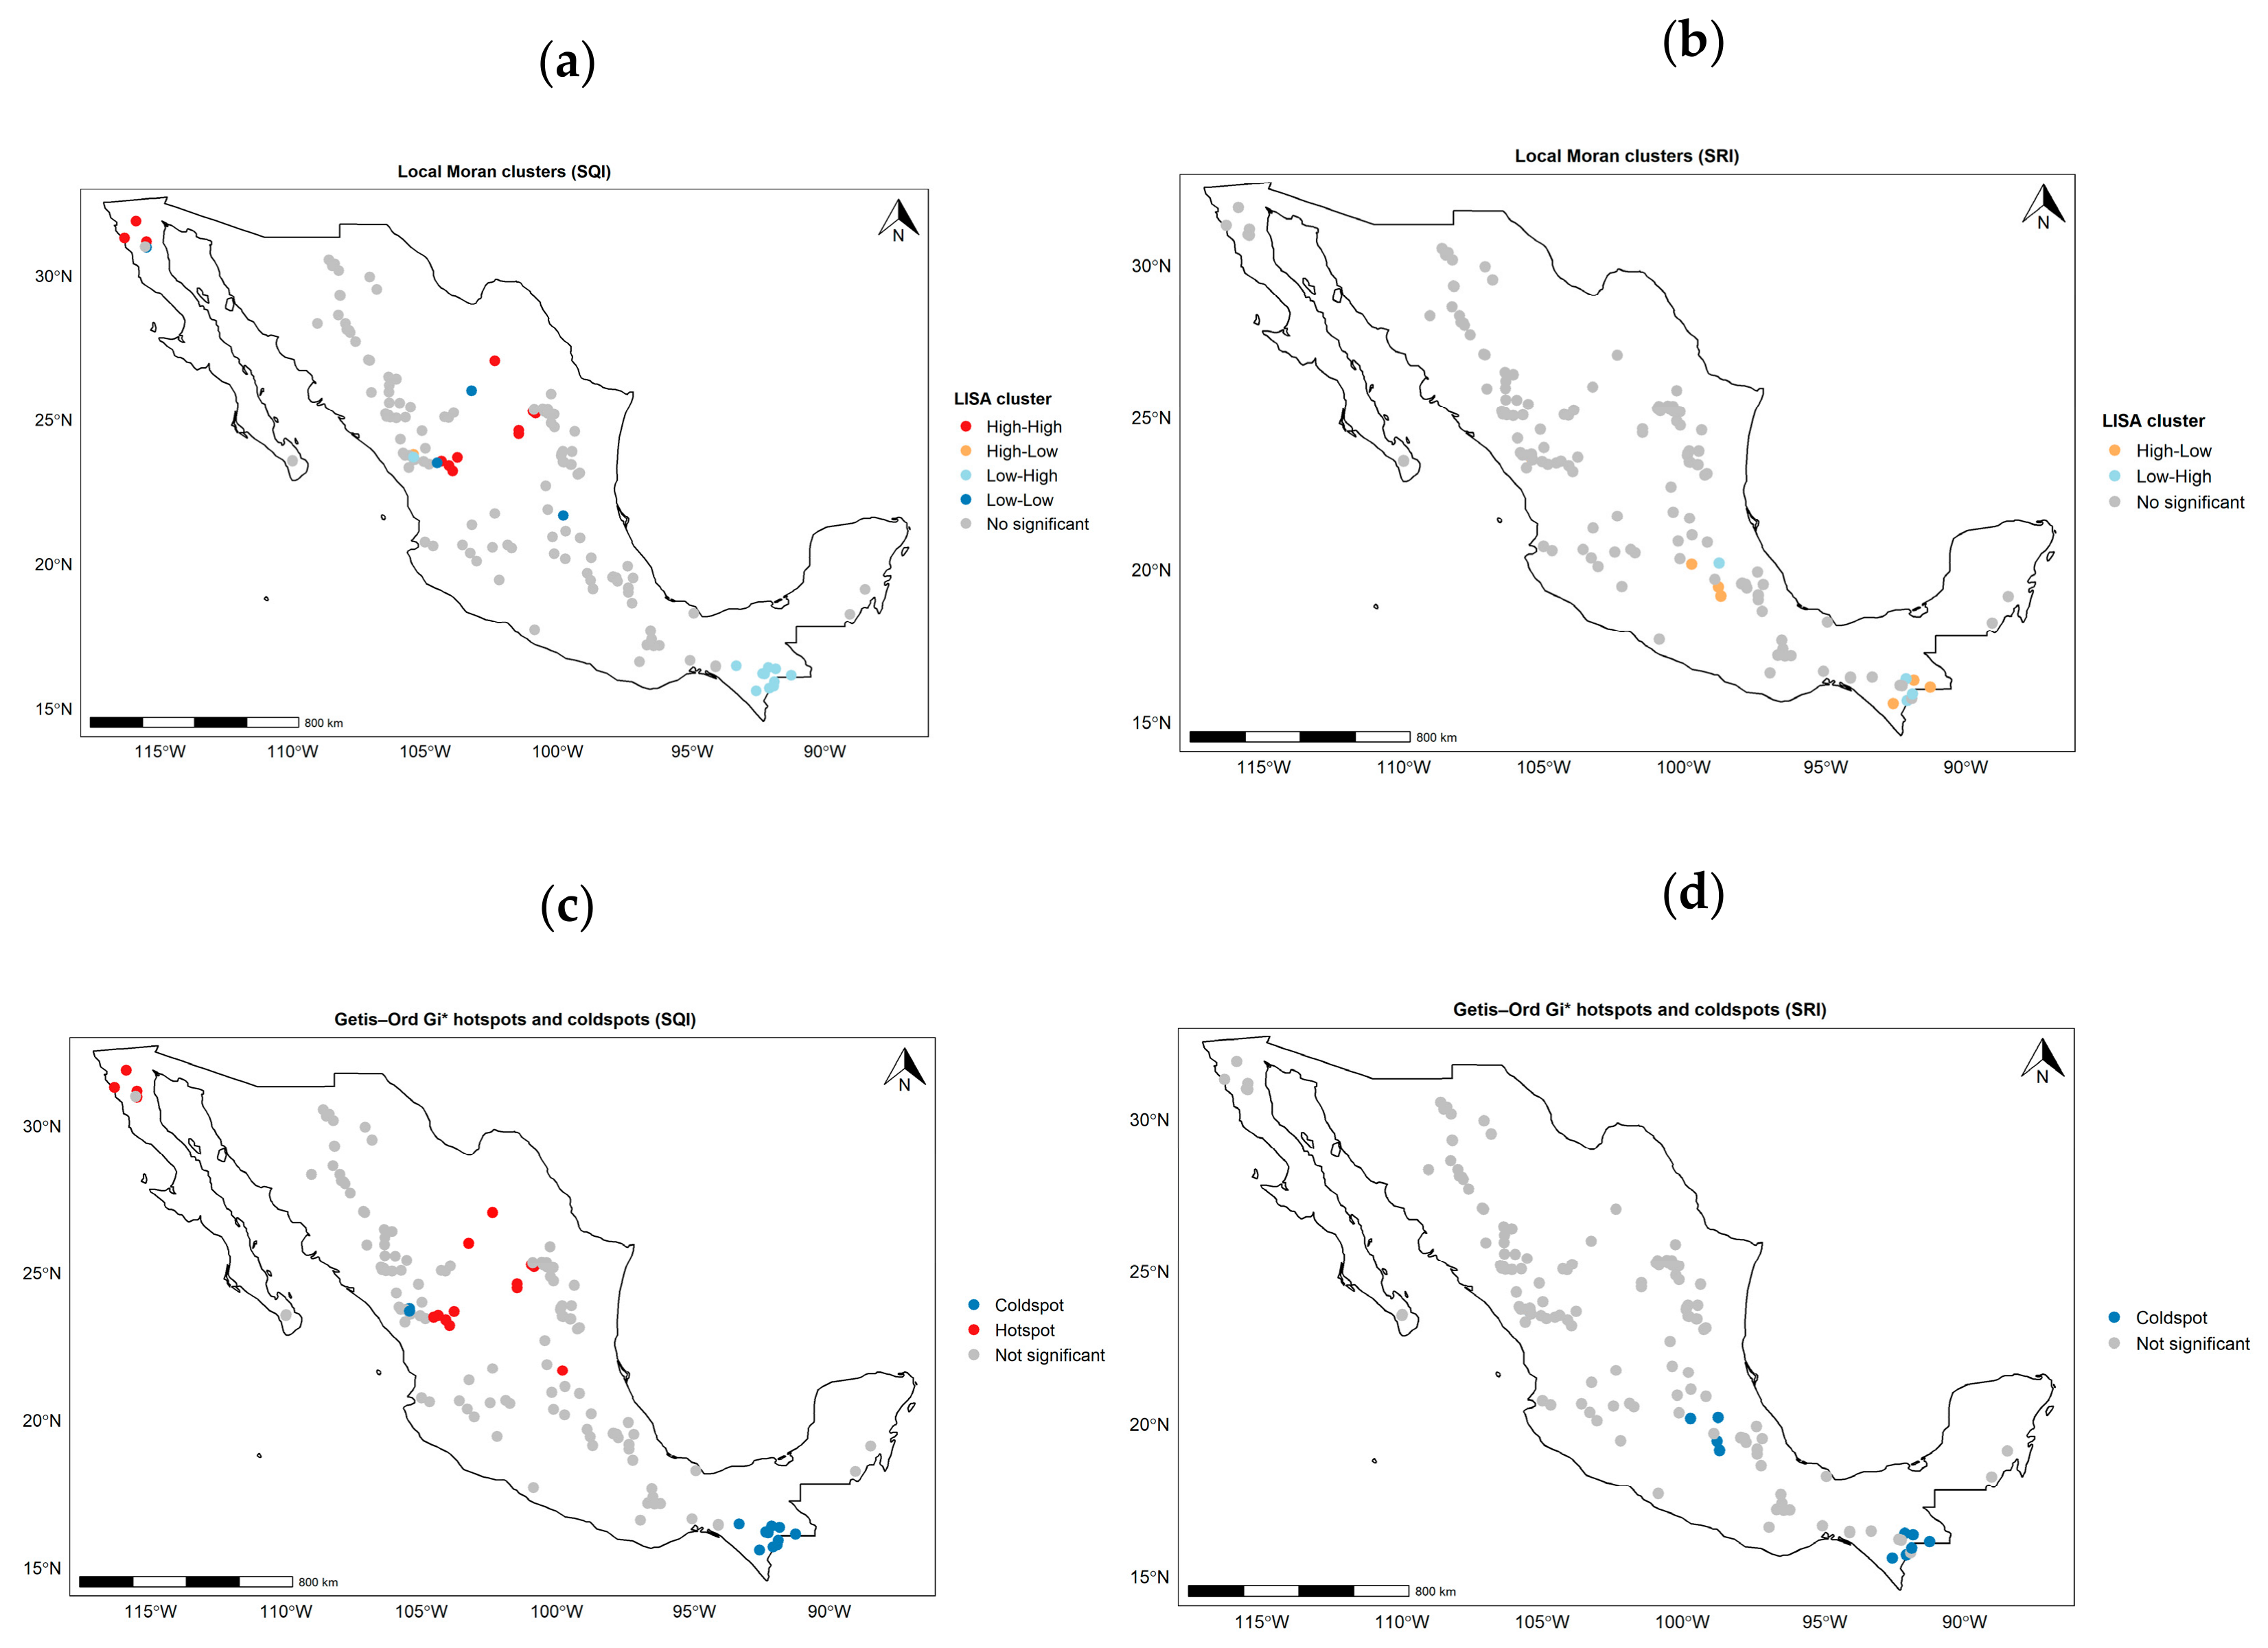
At the local scale, Local Indicators of Spatial Association (LISA) and Getis–Ord Gi* analyses provided a more detailed characterization of spatial heterogeneity (Figure 4).
Figure 4.
Local spatial patterns of dendrochronological indices in Mexico. (a) Local Indicators of Spatial Association (LISA) for SQI, showing significant clusters of high–high and low–low values indicative of spatial structure in dendrochronological signal quality. (b) LISA for SRI, indicating weak and spatially diffuse patterns with limited evidence of clustering. (c) Getis–Ord Gi* analysis for SQI, identifying statistically significant hotspots and coldspots of signal quality across the study region. (d) Getis–Ord Gi* analysis for SRI, showing weak spatial concentration and absence of well-defined hotspot–coldspot structures at the national scale.
The sensitivity analysis showed that the spatial pattern of SQI was consistent across alternative neighborhood configurations. Moran’s I values remained positive and highly significant across all tested k values (I = 0.175–0.267; p < 0.001), indicating that SQI spatial clustering was not dependent on the initial choice of k = 5. In contrast, SRI exhibited weak spatial autocorrelation across neighborhood definitions (I = 0.011–0.039), with four of five configurations showing non-significant spatial autocorrelation (p > 0.05), supporting the limited spatial structure previously observed for this index (Table A4).
LISA results for SQI revealed statistically significant local clusters of high and low values, indicating spatially coherent regions of strong and weak dendrochronological signal quality. These clusters suggest the presence of geographically structured zones where tree-ring coherence is enhanced or reduced, likely reflecting underlying environmental gradients and site-specific ecological conditions.
By contrast, LISA results for SRI showed weak and spatially inconsistent patterns, with few significant clusters. This finding is consistent with the absence of strong global autocorrelation and reinforces the interpretation that sampling representativeness is not spatially structured at the national scale.
Getis–Ord Gi* analysis further supported these patterns. For SQI, distinct hotspots and coldspots were identified, corresponding to regions of significantly high and low signal quality, respectively. These spatial concentrations highlight well-defined areas of enhanced or reduced dendrochronological coherence. In contrast, Gi* results for SRI showed weak and diffuse spatial patterns, with no clear evidence of concentrated hotspots or coldspots, confirming its spatial homogeneity.
Overall, the spatial analyses consistently demonstrate that dendrochronological variability across Mexico is primarily structured by differences in signal quality (SQI), whereas sampling representativeness (SRI) exhibits minimal spatial dependence. These results suggest that observed differences among chronologies are predominantly driven by biophysical and environmental factors influencing tree growth coherence, rather than by systematic spatial bias in sampling design.
3.3. Relationships Between Dendrochronological Indices and Environmental Variables
Pearson correlation analyses between the dendrochronological indices and a suite of climatic, hydrological, and edaphic variables revealed contrasting patterns of association, characterized overall by weak to moderate relationships and a limited number of statistically significant correlations (Figure 5). The GAM analysis supported the correlation patterns while identifying potential nonlinear responses. Precipitation and water-balance variables remained the strongest predictors of SQI, whereas temperature-related variables showed weaker and more complex responses. Predictor collinearity was low according to VIF diagnostics, supporting model interpretation.
Figure 5.
Correlation structure between dendrochronological indices and environmental variables. Heatmap showing Pearson correlation coefficients between SQI and SRI and climatic, hydrological, and edaphic variables across Mexico. Blue and red tones indicate positive and negative correlations, respectively, and asterisks denote significance levels (* p < 0.05, ** p < 0.01, *** p < 0.001). SQI showed stronger relationships with hydroclimatic variables, particularly those related to water availability, whereas SRI displayed weak or non-significant environmental associations. Nonlinear responses of SQI to major environmental gradients were further evaluated using generalized additive models (GAMs; Figure A3; Table A6).
The Signal Quality Index (SQI) exhibited a more structured response to environmental gradients. The most notable relationships were negative correlations with variables related to water availability and atmospheric demand, including precipitation (PPT; r ≈ −0.34), actual evapotranspiration (AET; r ≈ −0.31), and vapor-related atmospheric moisture (VAP; r ≈ −0.16). This pattern suggests that dendrochronological signal quality tends to increase under conditions of relatively higher water limitation, consistent with ecological systems in which radial growth is strongly constrained by moisture availability and therefore exhibits higher climatic sensitivity.
In addition, weaker positive associations were observed between SQI and drought-related indices such as SPEI-6 (r ≈ 0.21) and climatic water deficit (DEF; r ≈ 0.25). These relationships further support the interpretation that SQI captures, at least in part, the sensitivity of tree growth to seasonal water stress. In contrast, edaphic variables such as soil texture, pH (pHH2O), and nitrogen content showed generally weak associations with SQI, although some reached statistical significance, suggesting a secondary or indirect influence on dendrochronological signal quality.
By contrast, the SRI exhibited substantially weaker and less consistent relationships with environmental variables. Most correlations were not statistically significant, with only marginal associations observed, such as a weak negative correlation with maximum temperature (TMAX; r ≈ −0.18) and weak positive associations with soil structural properties such as coarse fragment volume (CFVO; r ≈ 0.17). Overall, these results indicate that SRI is largely independent of environmental conditions and is primarily driven by sampling design and the statistical structure of the chronologies rather than by climatic or edaphic controls.
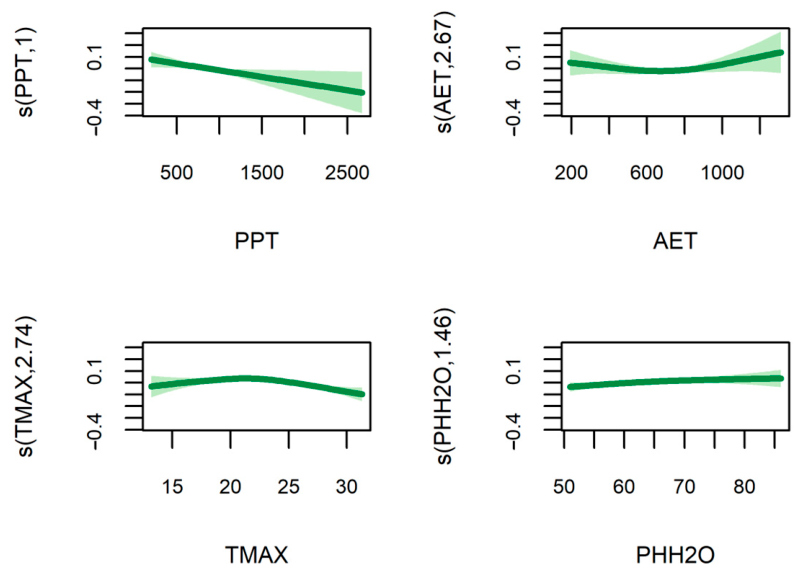
The GAM analysis supported the general patterns identified by the Pearson correlations (Figure 5 and Figure A3; Table A5). Precipitation and maximum temperature emerged as the main environmental predictors of SQI. Precipitation showed a significant smooth effect, whereas maximum temperature exhibited a significant nonlinear response. Actual evapotranspiration showed only a marginal effect, and soil pH was not significant. The final GAM explained 25.1% of the deviance in SQI (adjusted R2 = 0.219). Variance inflation factor (VIF) analysis indicated no evidence of problematic multicollinearity among the predictors retained in the GAM (all VIF < 5; Table A5). To further evaluate whether species composition or elevation contributed to SQI variability, we fitted an additional linear model including species identity and altitude as predictors. Species identity showed a significant effect on SQI variation (p < 0.001), whereas altitude had no significant effect (p = 0.678). Consistent with this result, no monotonic relationship was detected between altitude and SQI (Spearman ρ = −0.001, p = 0.993). These findings indicate that species-specific differences contribute to variation in signal quality, whereas elevation is not an important predictor of SQI variability across the dendrochronological network (Table A6).
An initial variance inflation factor (VIF) analysis identified substantial multicollinearity among several candidate climate variables representing water availability and atmospheric demand, particularly DEF, AET, PET, VAP, and TMIN, whereas SPEI-6 and soil pH showed low multicollinearity (Table A7). Consequently, highly collinear predictors were excluded from the final multivariable GAM, allowing retention of a reduced set of environmental predictors representing the main climatic gradients while minimizing redundancy among explanatory variables. VIF values recalculated for the retained predictors confirmed acceptable levels of multicollinearity (all VIF < 5; Table A5).
The comparison between both indices reveals a clear functional decoupling. Whereas SQI responds more consistently to hydroclimatic gradients associated with water balance and climatic stress, SRI exhibits relative independence from environmental variability, reflecting instead methodological and sampling-related characteristics of the dendrochronological network.
In general, these results suggest that environmental control is more strongly expressed in dendrochronological signal quality (SQI) than in sampling representativeness (SRI). However, the moderate magnitude of most correlations indicates that the relationship between chronology quality and environmental drivers is not strictly linear or deterministic. Additional sources of variation may include species-specific physiological responses, interactions among climatic variables, and unmodeled spatial effects.
4. Discussion
4.1. Dendrochronological Indices
In this study, we developed two composite dendrochronological indices: SQI and SRI, designed to facilitate the integrated comparison of tree-ring chronologies across a large and environmentally heterogeneous national-scale network. These indices provide a synthetic framework that summarizes complementary dimensions of chronology quality and sampling structure, enabling spatially explicit assessments that are not easily achievable using conventional dendrochronological statistics alone. Importantly, both SQI and SRI should be interpreted as relative, exploratory measures of synthesis rather than replacements for established dendrochronological metrics routinely used in chronology evaluation.
A first consideration concerns the composite nature of SQI. This index integrates four widely used dendrochronological statistics: MS, Rbar, EPS, and GLK, each describing different aspects of chronology behavior. While these metrics provide complementary information, they are not fully independent. In particular, EPS is mathematically derived from Rbar and sample depth, implying partial redundancy among components [16,17]. However, the objective of SQI was not to construct an orthogonal or statistically independent estimator, but rather to provide an operational synthesis of commonly used metrics that allows for consistent comparisons across large spatial datasets.
Similarly, MS should not be interpreted as a universal indicator of chronology quality. Although higher MS values often reflect stronger interannual variability and greater environmental sensitivity, they are also influenced by species-specific growth strategies, site conditions, and climatic regimes [16,27]. Consequently, SQI is not intended to establish an absolute ranking of chronology quality, but rather to capture relative differences in signal structure within the analyzed network.
An additional methodological limitation relates to the use of min–max normalization in constructing both SQI and SRI. Because this transformation is inherently dependent on the distribution of values within the dataset, resulting indices are most appropriately interpreted in a relative context restricted to the studied chronologies. Application to broader spatial domains or independent datasets may therefore require recalibration or alternative standardization approaches to ensure comparability and feasibility.
The SRI represents a synthetic measure of sampling representativeness that combines information on sample depth and interseries coherence. While this formulation provides a useful summary of sampling adequacy, it should be regarded as an initial approximation that requires further validation against established dendrochronological metrics such as EPS, signal-to-noise ratio (SNR), or other measures of chronology stability and temporal consistency.
An additional sensitivity analysis incorporating chronology duration as a temporal component demonstrated that chronology length provides complementary information beyond the statistical adequacy captured by the original SRI formulation. Specifically, duration-adjusted SSS values showed that temporal coverage can modify the interpretation of sampling representativeness, particularly for chronologies with shorter temporal spans. However, because chronology duration, sequence overlap, and cross-dating uncertainty describe different aspects of temporal robustness rather than statistical sampling adequacy alone, they were not incorporated directly into the SRI calculation. Instead, the duration-based assessment is considered a complementary evaluation of chronology representativeness. This distinction allows SRI to maintain a clear interpretation as a statistical sampling index while acknowledging the multidimensional nature of chronology evaluation.
While SSS provides a strong estimate of statistical sampling adequacy, chronology duration represents an additional temporal dimension that should be considered when interpreting the representativeness of dendrochronological networks.
Despite these limitations, this study introduces a generalizable and spatially explicit framework for evaluating dendrochronological networks by integrating multiple classical quality metrics into two complementary composite indices: SQI and SRI. Together, these indices operationalize two previously disconnected dimensions of dendrochronological data: signal integrity and sampling representativeness, within a unified analytical structure that enables direct spatial comparison across environmentally heterogeneous regions [15].
Importantly, the proposed framework moves beyond site-specific or species-specific evaluations by jointly assessing ecological signal strength and methodological design at the network scale. This dual-axis approach provides a scalable means to identify spatial biases, sampling gaps, and regions of high analytical robustness, thereby addressing a key limitation in the current use of dendrochronological databases in large-scale ecological, biogeographical, and Earth system research.
More broadly, SQI and SRI constitute a transferable conceptual and analytical tool for improving the design, evaluation, and synthesis of dendrochronological networks. Their application can support more informed sampling strategies, enhance comparability among studies, and contribute to a more standardized integration of tree-ring data into macroecological, climate, and Earth system modeling frameworks.
4.2. Environmental Drivers of Dendrochronological Indices
The environmental analyses consistently identified water availability as the principal factor associated with chronology signal quality across the Mexican network. Pearson correlations and complementary Generalized Additive Models (GAMs) yielded highly consistent patterns, indicating that the observed relationships were robust to moderate nonlinear responses. Precipitation exhibited an essentially linear positive effect on SQI (EDF ≈ 1), whereas actual evapotranspiration and maximum temperature showed moderate nonlinear responses. Despite these differences in functional form, hydroclimatic variables remained the strongest predictors of chronology signal quality.
The positive association between SQI and water-related variables suggests that chronology coherence and climatic sensitivity increase where radial growth is more strongly constrained by water availability. This pattern agrees with fundamental dendrochronological theory, which predicts greater synchronization of annual growth among trees under moderate to high environmental stress, resulting in stronger common signals and higher interseries correlation [28,29]. Our results extend these observations by showing that these hydroclimatic controls remain evident across a large, environmentally heterogeneous network spanning the principal climatic regions of Mexico [13].
In contrast, SRI exhibited weak or non-significant relationships with the environmental variables considered. This result is consistent with the conceptual basis of the index, which summarizes the statistical representativeness of each chronology from the sampling information available in the compiled database rather than environmental sensitivity itself. Accordingly, SRI primarily reflects methodological characteristics associated with chronology development, including sample depth and interseries coherence, both of which are influenced by historical sampling strategies and chronology construction procedures. Because detailed chronology-level information such as individual series overlap and cross-dating diagnostics was not consistently available for all datasets, SRI should be interpreted as a statistical approximation of sampling representativeness rather than a comprehensive measure of chronology quality.
The contrasting behavior of SQI and SRI therefore highlights two complementary dimensions of dendrochronological evaluation. Whereas SQI primarily reflects ecological signal strength emerging from interactions between climate and tree growth, SRI characterizes the statistical quality of chronology construction. Their weak environmental coupling indicates that chronology quality and sampling representativeness capture fundamentally different properties of dendrochronological datasets and should therefore be interpreted jointly rather than interchangeably.
Furthermore, the predominance of significant associations between SQI and water-related variables is consistent with previous studies documenting the high hydroclimatic sensitivity of tree growth in Mexico [12,28]. Research in temperate and semi-arid forest ecosystems has repeatedly shown that seasonal precipitation and drought stress are key drivers of ring formation, enabling good hydroclimatic reconstructions across multiple regions of the country [10]. By integrating multiple chronologies within a unified framework, our results indicate that these controls operate consistently across broad spatial gradients.
However, the moderate magnitude of most correlations indicates that the relationship between radial growth and environmental drivers is not strictly linear or deterministic. This suggests the potential influence of additional factors not explicitly accounted for, including interactions among climatic variables, species-specific physiological responses, and unmodeled spatial effects [30]. Accordingly, the observed relationships should be interpreted as important structural associations rather than direct causal linkages.
Several methodological considerations should also be acknowledged. Pearson correlations provide an effective first-order assessment of environmental associations but assume linear responses and do not explicitly account for interactions among predictors or spatial dependence. These limitations were partially addressed through complementary GAM analyses and formal evaluation of multicollinearity using VIF diagnostics, both of which supported the stability of the principal hydroclimatic relationships identified for SQI. Future studies could extend this framework using spatially explicit approaches, such as geographically weighted regression or other spatial regression techniques, to quantify regional variation in the environmental drivers of chronology quality. Despite these limitations, the observed patterns are consistent with dendrochronological theory and existing empirical evidence, supporting the utility of the proposed integrated framework for simultaneously evaluating signal quality and sampling representativeness in complex ecological systems.
4.3. Spatial Structure of Dendrochronological Indices
The spatial analyses reveal a fundamental distinction between the geographic organization of SQI and SRI across Mexico. Collectively, global spatial autocorrelation (Moran’s I), local clustering (LISA), and hotspot detection (Getis–Ord Gi*) indicate that both indices exhibit non-random spatial structure; however, their ecological and methodological meanings differ markedly (Figure 3 and Figure 4).
The Signal Quality Index (SQI) showed significant positive spatial autocorrelation (Moran’s I = 0.255; p < 0.001), indicating that dendrochronological signal quality is spatially structured rather than randomly distributed. This pattern suggests the influence of regional environmental controls associated with climatic and physiographic gradients. However, complementary analyses indicate that elevation alone does not explain SQI variability, suggesting that the observed spatial structure likely reflects the combined influence of species-specific traits and regional environmental conditions rather than a simple altitudinal gradient. To further evaluate the potential contribution of species composition to SQI variability, we tested the effects of species identity and altitude using a linear model (SQI ~ Species + Altitude). Species identity showed a significant contribution to SQI variability (p < 0.001), whereas altitude was not significant (p = 0.678). Consistently, no relationship was detected between elevation and SQI (Spearman ρ = −0.001, p = 0.993). These results indicate that taxonomic differences contribute to variation in chronology signal quality, but the spatial organization of SQI cannot be explained by elevation gradients alone.
Such spatial structuring is consistent with previous studies demonstrating that tree-ring sensitivity and interseries coherence are strongly modulated by regional gradients in temperature and precipitation [14,16,29].
Local analyses identified 18 significant hotspots and 23 coldspots, with a pronounced concentration of high SQI values in northern and northwestern Mexico. A significant latitudinal trend was also detected (β = 0.014; p = 0.002), indicating an increase in signal quality toward northern regions. This pattern is consistent with the transition toward more arid conditions, where radial growth is more strongly constrained by water availability, leading to increased climatic sensitivity and higher interannual coherence in tree-ring formation [31,32,33].
From a geographic perspective, SQI can be interpreted as an emergent property of the coupled climate–vegetation system, whose spatial structure reflects the regional organization of environmental constraints [27,34]. The identification of coherent spatial clusters is particularly relevant, as it highlights regions where dendrochronological signal strength is consistently high or low, providing valuable information for the prioritization of sampling sites and the design of paleoclimatic reconstructions.
In contrast, the SRI exhibited weak and non-significant spatial autocorrelation (Moran’s I = 0.035; p = 0.085). Local analyses confirmed this lack of spatial structure, identifying no hotspots, 14 coldspots, and 177 non-significant locations. This suggests that sampling representativeness is not governed by spatially structured environmental processes but rather by methodological decisions related to chronology construction and sampling design. This behavior is consistent with patterns commonly observed in ecological and paleoclimatic databases, where spatial distributions reflect accessibility, research history, and logistical constraints rather than underlying environmental gradients [35,36].
Overall, these results indicate that SQI exhibits a clear, hierarchical, and environmentally structured spatial pattern characterized by significant autocorrelation, well-defined local clusters, and coherent geographic gradients. In contrast, SRI displays no consistent spatial structure, suggesting an effectively random distribution at the national scale. This divergence highlights that the two indices are governed by fundamentally different mechanisms: SQI is primarily controlled by environmental gradients, whereas SRI reflects the structure of sampling design and data collection practices.
Several considerations should guide the interpretation and future application of SQI and SRI. The current distribution of chronologies reflects historical sampling efforts and ecological accessibility [13], highlighting the need for continued expansion of tree-ring networks and contributions to global repositories such as the ITRDB. Although additional validation across independent datasets remains necessary [37], the proposed framework provides a standardized approach for comparing chronology performance across heterogeneous regions.
SQI and SRI integrate complementary dimensions of dendrochronological evaluation: signal coherence and sampling representativeness. Their combined application enables the identification of spatial patterns in data robustness, supports the optimization of future sampling strategies, and facilitates the synthesis of large chronology networks. Thus, rather than replacing traditional dendrochronological metrics, these indices provide an additional comparative perspective for evaluating the structure and potential of expanding tree-ring datasets.
5. Conclusions
This study demonstrates that composite indices can provide a useful framework for synthesizing complementary dimensions of dendrochronological information across heterogeneous networks. The Signal Quality Index (SQI) and Sampling Representativeness Index (SRI) capture distinct but interconnected aspects of chronology evaluation, allowing the separation of ecological signal characteristics from sampling-related properties at a national scale.
The spatial organization of SQI supports the hypothesis that chronology signal quality is associated with broad environmental gradients, particularly those related to water availability and climatic stress. Conversely, the weak spatial structure of SRI indicates that sampling representativeness is primarily shaped by methodological and historical factors rather than by environmental conditions. This distinction highlights the importance of evaluating both dimensions jointly when assessing the consistency of dendrochronological databases.
Beyond their application to the Mexican network, SQI and SRI provide a transferable framework for identifying spatial patterns of chronology performance, prioritizing future sampling efforts, and improving comparative analyses among tree-ring datasets. Their interpretation should continue to be refined through additional datasets, species-specific evaluations, and broader integration of chronologies into international repositories.
In this context, the extensive contributions of Mexican dendrochronological laboratories have been fundamental for generating long-term records across diverse ecosystems. Continued expansion and integration of these datasets, together with increased representation in global tree-ring databases, will further improve the capacity to evaluate spatial patterns of chronology quality and strengthen future climate and ecological applications.
Supplementary Materials
The following supporting information can be downloaded at: https://www.mdpi.com/article/10.3390/f17080885/s1. Dataset S1. Sensitivity analysis of chronology representativeness using duration-weighted subsample signal strength (SSS) across Mexico.
Author Contributions
Conceptualization, M.P.-G.; methodology, M.P.-G. and F.D.J.R.-F.; software, F.D.J.R.-F.; validation, M.P.-G.; formal analysis, F.D.J.R.-F.; investigation, M.P.-G. and F.D.J.R.-F.; data curation, M.P.-G. and F.D.J.R.-F.; writing—original draft preparation, M.P.-G. and F.D.J.R.-F.; writing—review and editing, M.P.-G.; All authors have read and agreed to the published version of the manuscript.
Funding
This research received no external funding.
Data Availability Statement
The datasets generated and analyzed during the current study, are available from the corresponding author upon reasonable request.
Acknowledgments
We thank Fernando García Rodríguez, Víctor Jesús Morán López, and Andrea Acosta Hernández from DendroRed (https://dendrored.ujed.mx/ (accessed on 26 July 2026)) for their support during data organization and systematization. We acknowledge the two anonymous reviewers whose constructive comments and suggestions helped improve the manuscript.
Conflicts of Interest
The author declares no competing interests.
Abbreviations
The following abbreviations are used in this manuscript:
| SQI | The Signal Quality Index |
| SRI | The Sampling Representativeness Index |
| MS | Mean sensitivity |
| Rbar | Interseries correlation |
| EPS | Expressed population signal |
| GLK | Gleichläufigkeit statistic |
| ITRDB | The International Tree-Ring Data Bank |
| TMAX | Maximum temperature |
| TMIN | Minimum temperature |
| PPT | Precipitation |
| VAP | Vapor-related atmospheric moisture |
| VPD | Vapor pressure deficit |
| PET | Potential evapotranspiration |
| AET | Actual evapotranspiration |
| SPEI-6 | The six-month Standardized Precipitation–Evapotranspiration Index |
| DEF | climatic water deficit |
| CEC | Cation exchange capacity |
| CFVO | Coarse fragment volume |
| SOC | Organic carbon density |
| pHH2O | Soil pH measured in water |
| N | Total nitrogen content |
| CH | Canopy height |
| SSS | The Sample Size Sufficiency statistic |
| k-NN | The k-nearest-neighbor |
| LISA | Local Indicators of Spatial Association |
Appendix A. Figures
Figure A1.
Relationship between Min–Max and Z-score standardized SQI values (a) and SRI values (b). The comparison illustrates the consistency of index values obtained using alternative normalization approaches.
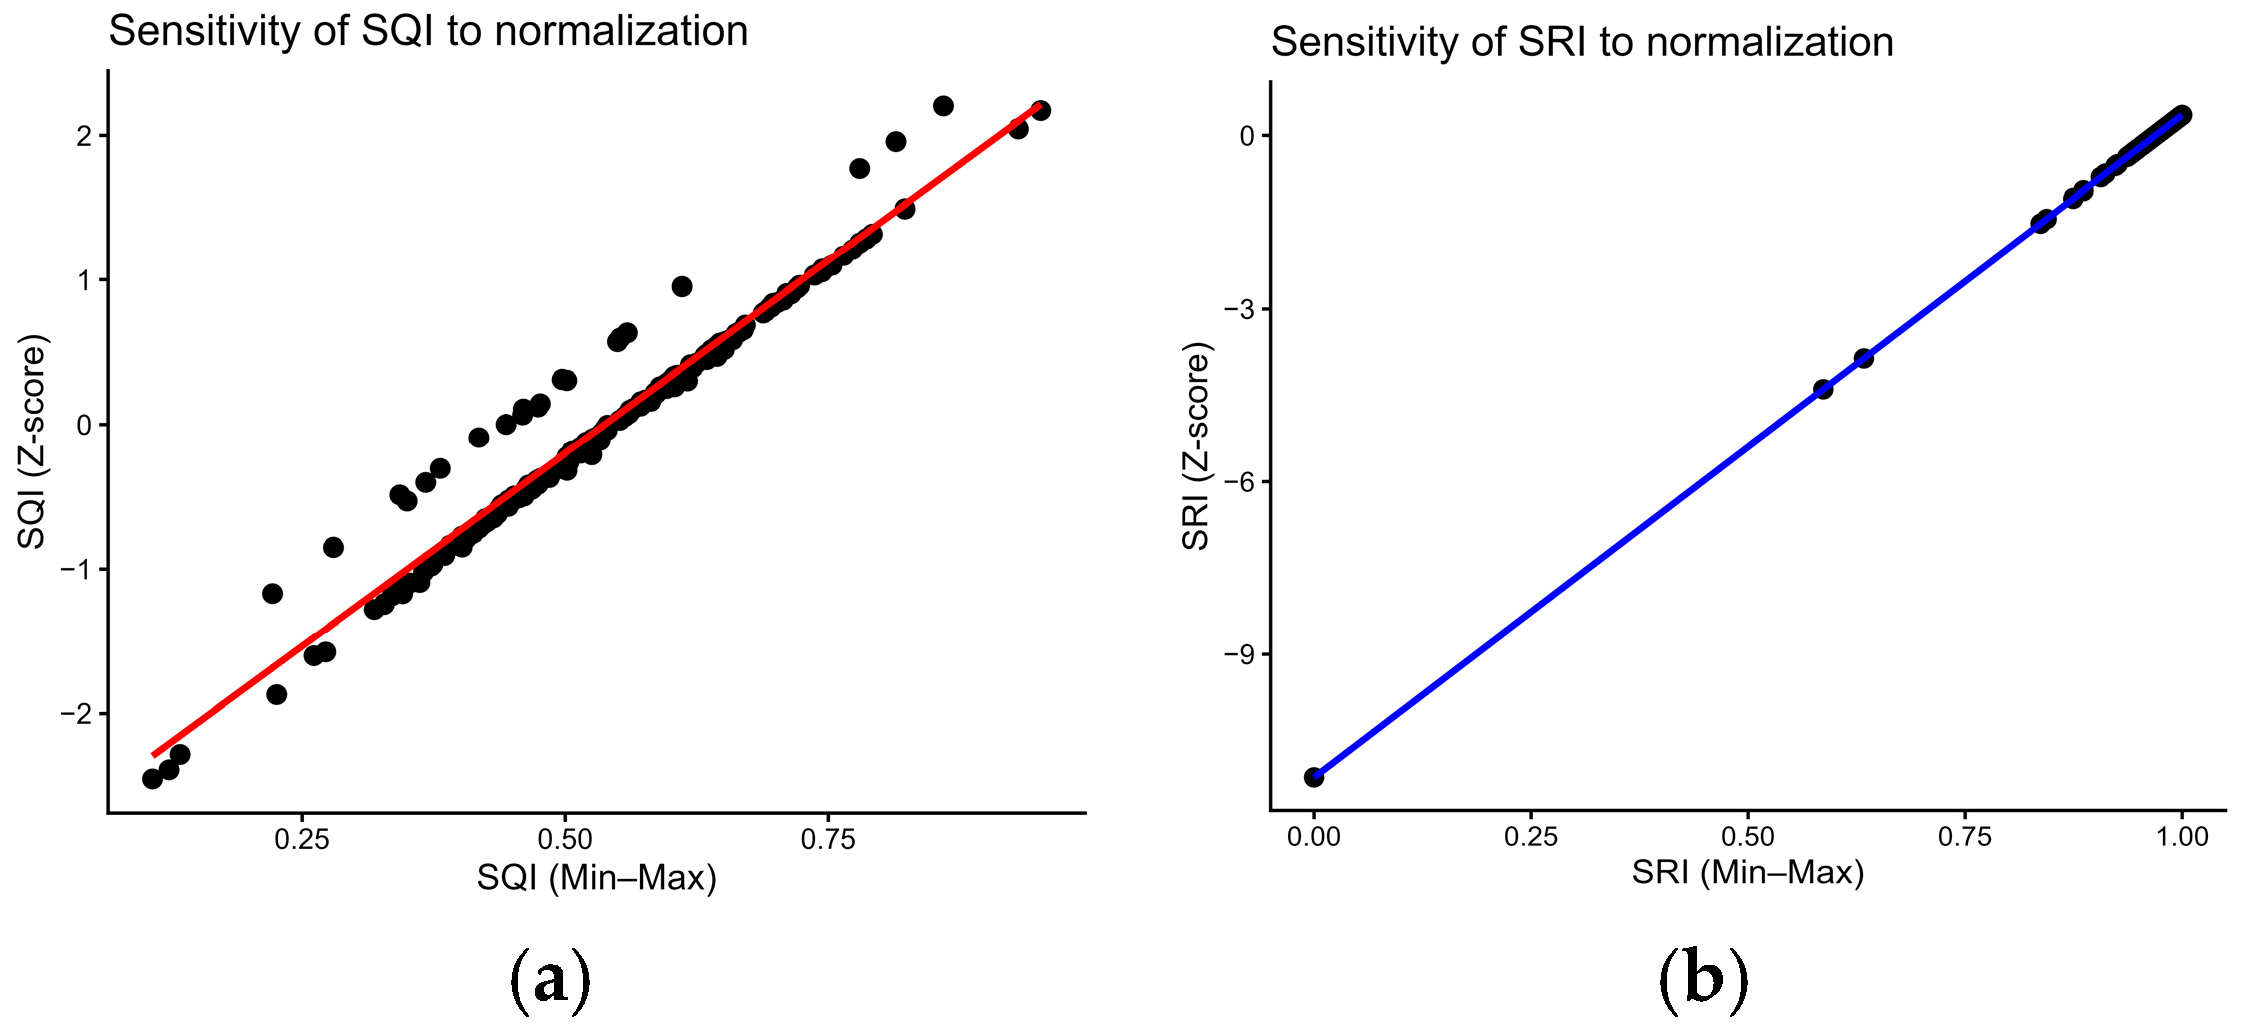
Figure A2.
Relationship between chronology duration and dendrochronological indices. Scatterplots showing relationships between chronology length and (A) Sampling Representativeness Index (SRI), (B) Signal Quality Index (SQI), and (C) Subsample Signal Strength (SSS). Solid lines represent linear regression fits with 95% confidence intervals. Spearman correlation coefficients indicate weak associations between chronology duration and statistical sampling indicators, supporting the interpretation of chronology duration as a complementary temporal attribute.
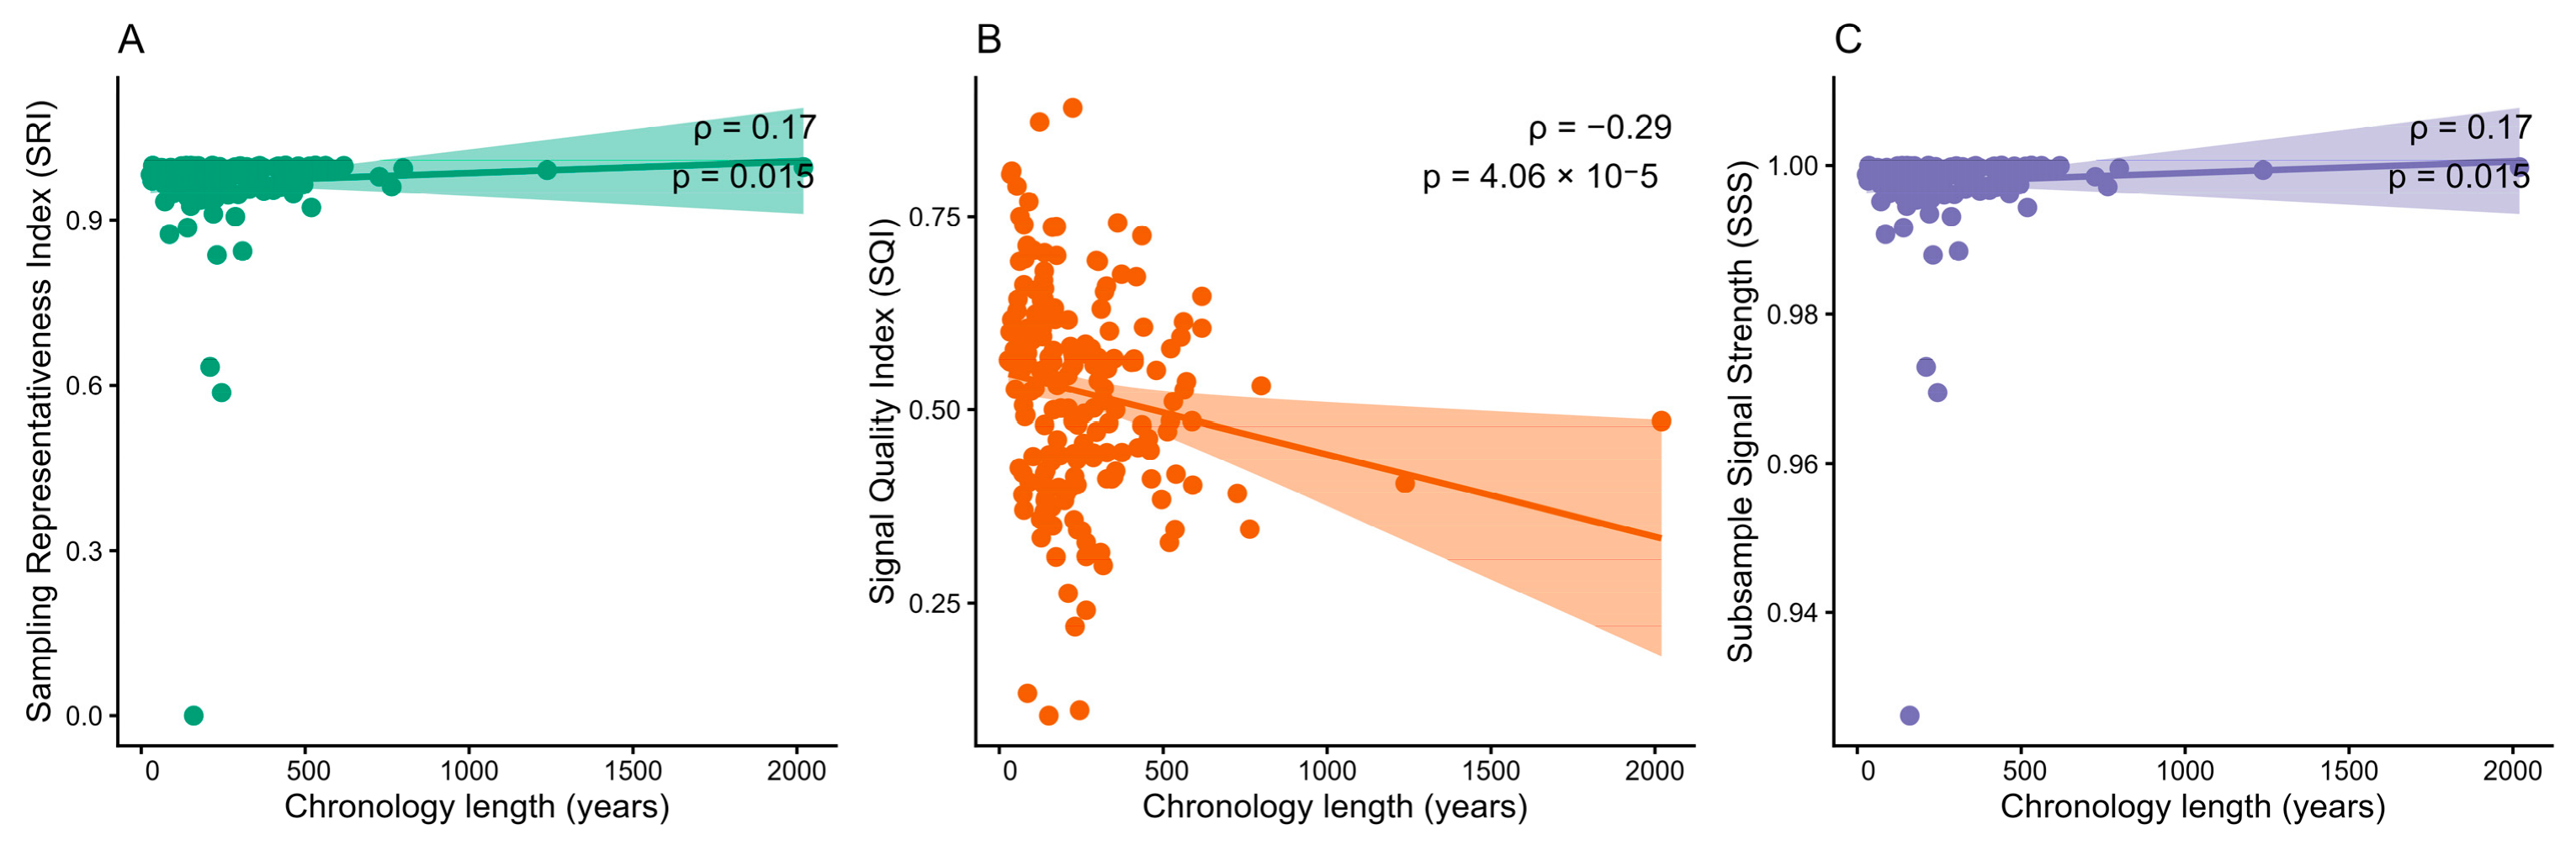
Figure A3.
Generalized additive model (GAM) smooth effects of environmental predictors on SQI. Partial effects of precipitation (PPT), actual evapotranspiration (AET), maximum temperature (TMAX), and soil pH (PHH2O) on the Signal Quality Index are shown. The model explained 25.1% of the deviance in SQI (adjusted R2 = 0.219).
Appendix B. Tables
Table A1.
Tree species and dendrochronological chronologies compiled in the database, including taxonomic family, number of chronologies, elevation range, and represented ecoregions.
Table A2.
Agreement between Min–Max and Z-score standardization approaches for SQI and SRI.
Table A3.
Spearman correlations between chronology duration and dendrochronological quality indicators. Chronology length was evaluated against the Sampling Representativeness Index (SRI), Signal Quality Index (SQI), Subsample Signal Strength (SSS), mean interseries correlation (Rbar), and Expressed Population Signal (EPS). These analyses were performed to assess whether temporal coverage represents an additional dimension of chronology evaluation independent from statistical sampling representativeness.
Table A4.
Sensitivity analysis of global Moran’s I under alternative k-nearest neighbor specifications for SQI and SRI. Note: The analysis was conducted using row-standardized spatial weights based on k-nearest neighbors.
Table A5.
Generalized Additive Model (GAM) results and multicollinearity diagnostics for environmental predictors of the Sampling Quality Index (SQI). Note: The GAM was fitted using restricted maximum likelihood (REML). Model performance: adjusted R2 = 0.219; deviance explained = 25.1%. Effective degrees of freedom (EDF), F-statistics, and p-values are reported for each smooth term. Variance inflation factors (VIF) were calculated from a linear model including the same predictors to assess multicollinearity. VIF values < 5 indicate acceptable levels of multicollinearity.
Table A6.
Effects of altitude and species identity on Signal Quality Index (SQI) variability. Results from a linear model evaluating the contribution of elevation and species composition to SQI variation across the dendrochronological network. Note: The model was fitted as: SQI ~ Altitude + Species. Species identity was included as a categorical factor, whereas altitude was treated as a continuous predictor.
Table A7.
Variance Inflation Factors (VIF) for candidate environmental predictors used to assess multicollinearity prior to fitting the multivariable Generalized Additive Model (GAM). Higher VIF values indicate stronger multicollinearity among predictors. Variables exhibiting substantial multicollinearity were not simultaneously retained in the final multivariable GAM.
References
- Douglass, A.E. Climatic Cycles and Tree-Growth: A Study of the Annual Rings of Trees in Relation to Climate and Solar Activity; Carnegie Institution of Washington: Washington, DC, USA, 1919. [Google Scholar]
- Cook, E.R.; Peters, K. Calculating unbiased tree-ring indices for the study of climatic and environmental change. Holocene 1997, 7, 361–370. [Google Scholar] [CrossRef] [Scilit]
- Tognetti, R.; Valentini, R.; Marchesini, L.B.; Gianelle, D.; Panzacchi, P.; Marshall, J.D. Continuous Monitoring of Tree Responses to Climate Change for Smart Forestry: A Cybernetic Web of Trees. In Climate-Smart Forestry in Mountain Regions; Springer International Publishing: Cham, Switzerland, 2021; pp. 361–398. [Google Scholar]
- Eliades, F.; Sarris, D.; Bachofer, F.; Michaelides, S.; Hadjimitsis, D. Understanding Tree Mortality Patterns: A Comprehensive Review of Remote Sensing and Meteorological Ground-Based Studies. Forests 2024, 15, 1357. [Google Scholar] [CrossRef] [Scilit]
- Leduc, F.; Coops, N.C.; Morin-Bernard, A.; Moreau, G.; Achim, A. A Review of Dendrochronology and Remote Sensing Integration for Forest Growth and Disturbance Monitoring. Curr. For. Rep. 2025, 11, 25. [Google Scholar] [CrossRef] [Scilit] [PubMed]
- Fonti, M.V.; von Arx, G.; Harroue, M.; Schneider, L.; Nievergelt, D.; Björklund, J.; Hantemirov, R.; Kukarskih, V.; Rathgeber, C.B.K.; Studer, N.-T.; et al. A Protocol for High-Quality Sectioning for Tree-Ring Anatomy. Front. Plant Sci. 2025, 16, 1505389. [Google Scholar] [CrossRef] [Scilit] [PubMed]
- Altman, J.; Altmanova, N.; Fibich, P.; Korznikov, K.; Fonti, P. Advancing Dendrochronology with R: An Overview of Packages and Future Perspectives. Front. Ecol. Evol. 2025, 13, 1593675. [Google Scholar] [CrossRef] [Scilit]
- Camarero, J.J. Is Dendrochronology Facing a Crisis? Dendrochronologia 2026, 97, 126527. [Google Scholar] [CrossRef] [Scilit]
- Acosta-Hernández, A.C.; Pompa-García, M.; Camarero, J.J. An Updated Review of Dendrochronological Investigations in Mexico, a Megadiverse Country with a High Potential for Tree-Ring Sciences. Forests 2017, 8, 160. [Google Scholar] [CrossRef] [Scilit]
- Morales-Estrada, R.; Correa-Diaz, A.; Villanueva-Díaz, J.; Villanueva-Morales, A.; Monterroso-Rivas, A.I. Dendrochronology in Mexico over the Last Seventy Years. Curr. Top. Agron. Sci. 2025, 5, e240501. [Google Scholar] [CrossRef] [Scilit]
- Villanueva-Díaz, J.; Cerano-Paredes, J.; Stahle, D.W.; Luckman, B.H.; Therrell, M.D.; Cleaveland, M.K.; Fulé, P.Z. La Dendrocronología y Reconstrucciones Paleoclimáticas en el Norte-Centro de México. In Escenarios de Cambio Climático: Registros del Cuaternario en América Latina; Caballero, M., Ortega-Guerrero, B., Eds.; Universidad Nacional Autónoma de México: Ciudad de México, México, 2011; pp. 47–72. [Google Scholar]
- Villanueva-Díaz, J.; Stahle, D.W.; Therrell, M.D.; Beramendi-Orosco, L.; Estrada-Ávalos, J.; Martínez-Sifuentes, A.R.; Astudillo-Sánchez, C.C.; Cervantes-Martínez, R.; Cerano-Paredes, J. The Climatic Response of Taxodium mucronatum in San Luis Potosí, México. Trees 2020, 34, 623–635. [Google Scholar] [CrossRef] [Scilit]
- Carlón-Allende, T.; De La Peña-Guillén, K.A.; Villanueva-Díaz, J.; Macías-Vázquez, J.L. La Investigación Dendrocronológica en México: Un Análisis Bibliométrico. Rev. Chapingo Ser. Cienc. For. Ambient. 2025, 31, e24037. [Google Scholar] [CrossRef] [Scilit]
- Fritts, H.C. Tree Rings and Climate; Academic Press: London, UK, 1976. [Google Scholar]
- Martínez-Meyer, E.; Peterson, A.T. Distributional Patterns of Species in Mexico: Effects of Environmental Heterogeneity and Implications for Conservation. Divers. Distrib. 2006, 12, 659–669. [Google Scholar] [CrossRef] [Scilit]
- Cook, E.R.; Kairiukstis, L.A. (Eds.) Methods of Dendrochronology: Applications in the Environmental Sciences; Kluwer Academic Publishers: Dordrecht, The Netherlands, 1990. [Google Scholar] [CrossRef] [Scilit]
- Briffa, K.R.; Jones, P.D. Basic chronology statistics and assessment. In Methods of Dendrochronology: Applications in the Environmental Sciences; Cook, E.R., Kairiukstis, L.A., Eds.; Kluwer Academic Publishers: Dordrecht, The Netherlands, 1990; pp. 137–152. [Google Scholar]
- Wigley, T.M.L.; Briffa, K.R.; Jones, P.D. On the average value of correlated time series, with applications in dendroclimatology and hydrometeorology. J. Clim. Appl. Meteorol. 1984, 23, 201–213. [Google Scholar] [CrossRef] [Scilit]
- Eckstein, D.; Bauch, J. Contribution to the rationalization of tree-ring analysis and its application to climate studies. Tree-Ring Bull. 1969, 29, 1–20. [Google Scholar]
- Bunn, A.G. A dendrochronology program library in R (dplR). Dendrochronologia 2008, 26, 115–124. [Google Scholar] [CrossRef] [Scilit]
- Legendre, P.; Legendre, L. Numerical Ecology: Developments in Environmental Modelling, 3rd ed.; Elsevier: Amsterdam, The Netherlands, 2012; 1006p. [Google Scholar]
- Abatzoglou, J.T.; Dobrowski, S.Z.; Parks, S.A.; Hegewisch, K.C. TerraClimate, a High-Resolution Global Dataset of Monthly Climate and Climatic Water Balance from 1958–2015. Sci. Data 2018, 5, 170191. [Google Scholar] [CrossRef] [Scilit] [PubMed]
- Moran, P.A.P. Notes on Continuous Stochastic Phenomena. Biometrika 1950, 37, 17–23. [Google Scholar] [CrossRef] [Scilit]
- Anselin, L. Local Indicators of Spatial Association—LISA. Geogr. Anal. 1995, 27, 93–115. [Google Scholar] [CrossRef] [Scilit]
- Getis, A.; Ord, J.K. The Analysis of Spatial Association by Use of Distance Statistics. Geogr. Anal. 1992, 24, 189–206. [Google Scholar] [CrossRef] [Scilit]
- R Core Team. R: A Language and Environment for Statistical Computing; Version 4.x.x; R Foundation for Statistical Computing: Vienna, Austria, 2025; Available online: https://www.R-project.org/ (accessed on 20 June 2026).
- McDowell, N.G.; Beerling, D.J.; Breshears, D.D.; Fisher, R.A.; Raffa, K.F.; Stitt, M. The Interdependence of Mechanisms Underlying Climate-Driven Vegetation Mortality. Trends Ecol. Evol. 2011, 26, 523–532. [Google Scholar] [CrossRef] [Scilit] [PubMed]
- Pompa-García, M.; Camarero, J.J.; Valeriano, C.; Vivar-Vivar, E.D. Climate sensitivity of seasonal radial growth in young stands of Mexican conifers. Int. J. Biometeorol. 2022, 66, 1711–1723. [Google Scholar] [CrossRef] [Scilit] [PubMed]
- Speer, J.H. Fundamentals of Tree-Ring Research; University of Arizona Press: Tucson, AZ, USA, 2010. [Google Scholar]
- Gao, S.; Liang, E.; Camarero, J.J.; Zhu, H.; Peñuelas, J.; Piao, S.; Chen, F. Tree Rings Uncover Dynamic Linkages of Earth Spheres. Sci. Bull. 2025, 70, 313–316. [Google Scholar] [CrossRef] [Scilit] [PubMed]
- Cook, E.R.; Woodhouse, C.A.; Eakin, C.M.; Meko, D.M.; Stahle, D.W. Long-Term Aridity Changes in the Western United States. Science 2004, 306, 1015–1018. [Google Scholar] [CrossRef] [Scilit] [PubMed]
- Holmes, R.L. Computer-Assisted Quality Control in Tree-Ring Dating and Measurement. Tree-Ring Bull. 1983, 43, 69–78. [Google Scholar]
- St. George, S. An Overview of Tree-Ring Width and Isotope Studies. Wiley Interdiscip. Rev. Clim. Change 2014, 5, 1–15. [Google Scholar] [CrossRef] [Scilit]
- Bailey, T.C.; Gatrell, A.C. Interactive Spatial Data Analysis; Longman Scientific & Technical/John Wiley & Sons: Harlow, UK, 1995. [Google Scholar]
- Fotheringham, A.S.; Brunsdon, C.; Charlton, M. Geographically Weighted Regression; Wiley: Chichester, UK, 2002. [Google Scholar]
- Phillips, S.J.; Anderson, R.P.; Schapire, R.E. Maximum entropy modeling of species geographic distributions. Ecol. Model. 2006, 190, 231–259. [Google Scholar] [CrossRef] [Scilit]
- Cliff, A.D.; Ord, J.K. Spatial Processes: Models & Applications; Pion: London, UK, 1981. [Google Scholar]


Disclaimer/Publisher’s Note: The statements, opinions and data contained in all publications are solely those of the individual author(s) and contributor(s) and not of MDPI and/or the editor(s). MDPI and/or the editor(s) disclaim responsibility for any injury to people or property resulting from any ideas, methods, instructions or products referred to in the content. |
© 2026 by the authors. Licensee MDPI, Basel, Switzerland. This article is an open access article distributed under the terms and conditions of the Creative Commons Attribution (CC BY) license.