


Abstract
Gridded precipitation datasets are increasingly used as operational tools, with growing emphasis on cloud-native processing to handle multi-decadal archives through reproducible and auditable workflows. This paper presents an end-to-end pipeline that uses Google Earth Engine for the automated extraction of ERA5-Land precipitation, enabling on-the-fly analysis and targeted spatiotemporal data retrieval. The extracted outputs are subsequently evaluated through station-based comparisons using one linear and one non-linear bias-correction technique. The workflow emphasizes scalable data access, consistent station alignment, and distribution-aware diagnostics for extremes. It is designed to support rapid national screening and to provide a transferable blueprint for hydrometeorological applications.
Keywords:
Google Earth Engine; ERA5-Land; precipitation; big data; cloud computing; bias correction; Greece 1. Introduction
Currently, the growing number of Earth observation and reanalysis archives related to hydro-meteorological variables has led to new forms of fragmentation. These are no longer driven by data availability, but by the capacity to efficiently process, validate, and reproduce results across different spatial and temporal scales and domains. In this context, cloud-native infrastructure has emerged as a key technology, enabling remote computation and storage without the need for powerful local workstations or large on-site data repositories. Moreover, this approach supports consistent and standardized workflows when processing large-scale datasets [1], such as those derived from remote sensing or from extensive real-time monitoring networks. Google Earth Engine represents a widely adopted model that integrates a public geospatial data catalogue with distributed computing capabilities for large-scale analysis [2]. At the same time, the integration of cloud computing with machine learning and artificial intelligence represents a promising research frontier of our era.
At the European Union scale, there is a clear and sustained commitment to free and open access to a wide range of environmental data and services. The Copernicus Programme, including the Copernicus Data Space Ecosystem, represents a characteristic example of this policy framework in Earth science where various water-related datasets, such as precipitation, can be retrieved. This initiative promotes service-based access and programmatic processing through API-first services that support automated data retrieval and aggregation [3]. Comparable approaches are also evident in commercial and public APIs, such as those offered by Sentinel Hub, which provides a suite of RESTful APIs for accessing various satellite imagery archives. These services enable users to retrieve raw satellite data, generate rendered imagery products, and perform statistical analyses without the need to download complete scenes [4].
Focusing on precipitation, reanalysis products provide spatially complete fields with multi-decadal continuity. ERA5-Land is a widely used reanalysis product generated by the European Centre for Medium-Range Weather Forecasts within the framework of the Copernicus Climate Change Service, providing precipitation records at a higher spatiotemporal resolution [5]. However, evaluation studies indicate that regional biases may limit the direct applicability of gridded datasets without prior validation, as precipitation performance is strongly region dependent. This underscores the need for local station-based screening, particularly for applications sensitive to precipitation magnitude, seasonality, and extremes [6,7].
This research aims to introduce a concise workflow that links cloud-based extraction of gridded datasets, namely ERA5-Land precipitation, with station-based evaluation and statistical post-processing at the national scale of Greece. The emphasis is on scalable access in Google Earth Engine, consistent station alignment, and out-of-sample assessment for two bias-correction families (one linear and one non-linear) to validate the performance of the ERA5-Land on the selected spatial domain.
2. Material and Methods
2.1. Cloud Workflow for National-Scale Rendering
The conducted research combines cloud-based workflows with local processing, structured across four sequential steps. The context of each step is presented in more detail in the following sections. Synoptically, the first step, within the Google Earth Engine environment, ERA5-Land precipitation is retrieved, queried over the geographic extent of Greece (case study area), and aggregated from hourly to monthly totals. Within the second step, the gridded field is sampled at station locations using a consistent spatial operator. In the third step, the station-aligned time series are exported in tabular format for downstream statistical analysis and archival purposes. Finally, quality checks are performed, and bias-correction models are fitted and evaluated in a local statistical environment. This division of tasks ensures traceability, minimizes manual handling, and allows the complete pipeline to be rerun whenever data or station inventories are updated.
2.2. Study Area and Data Availability
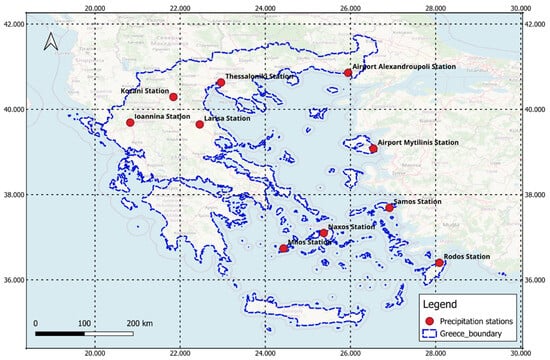
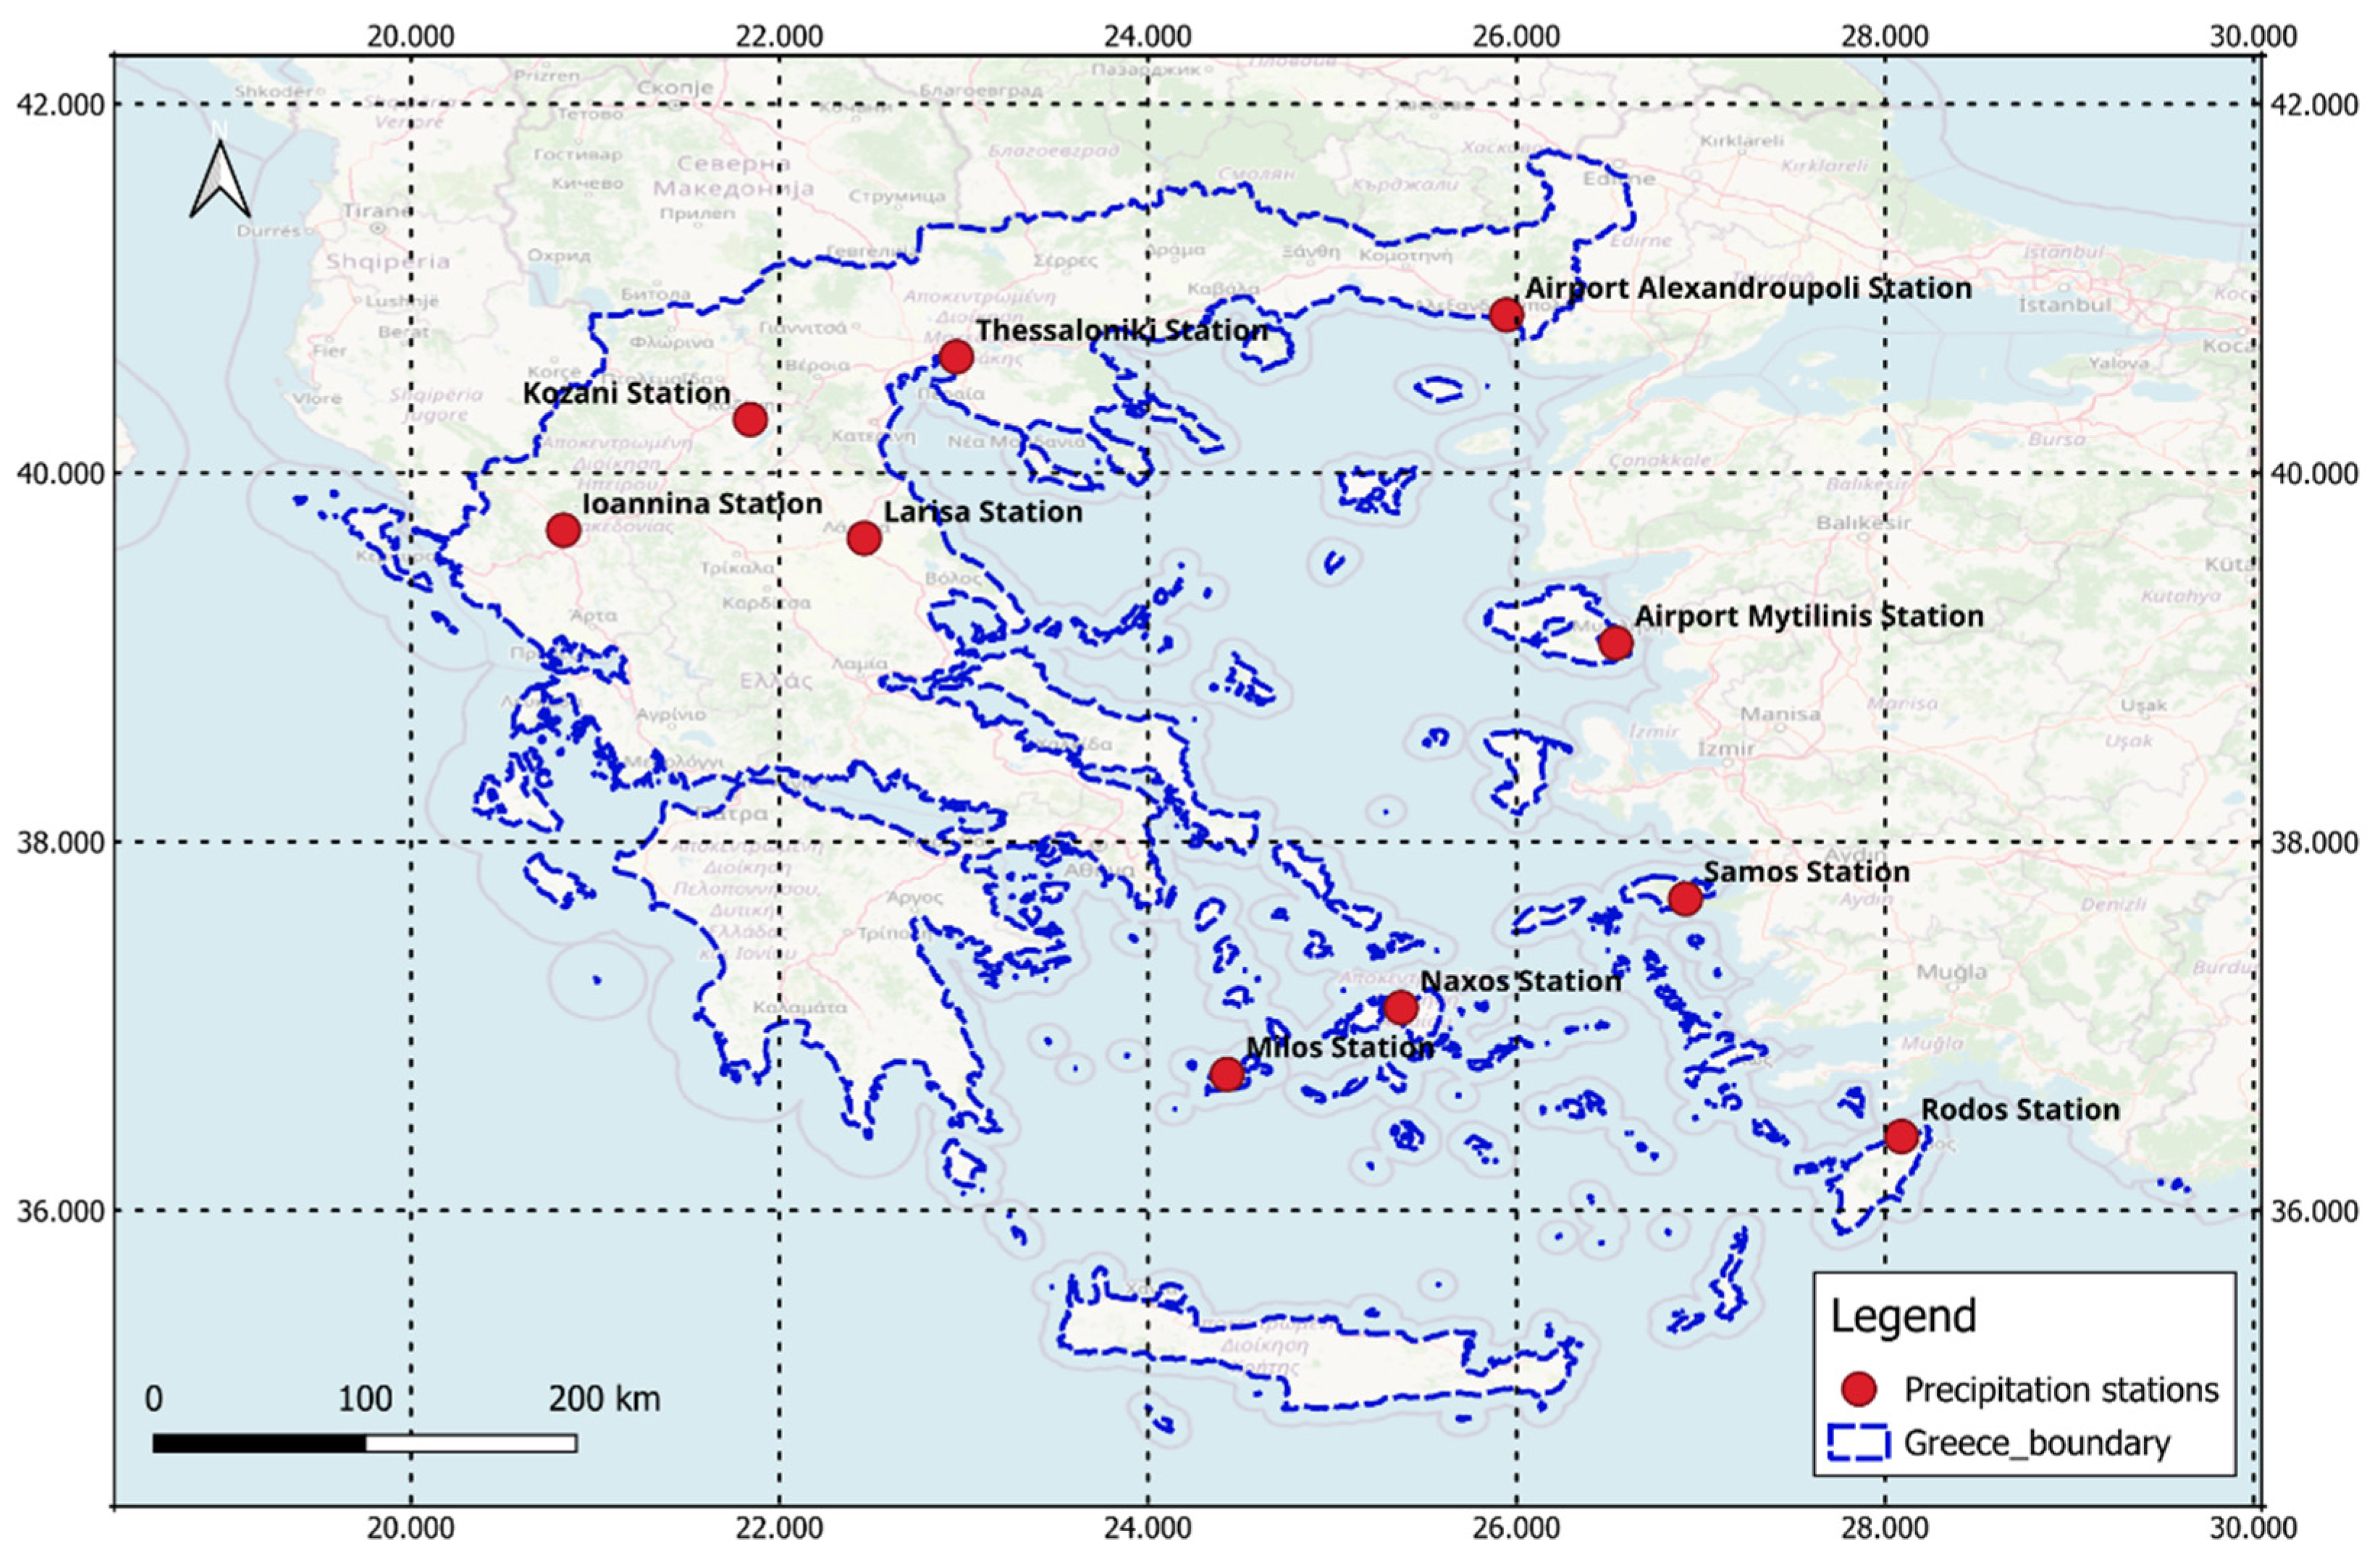
The research is conducted at the national scale of Greece. Reference precipitation data, i.e., monitored observations, were obtained from the Hellenic National Meteorological Service and included 10 meteorological stations with continuous records from 1958 to 2021, providing a robust long-term basis for evaluation, as seen in Figure 1. The analysis is performed at a monthly time step to facilitate reliable comparison with gridded reanalysis datasets and to align with the requirements of national-scale hydrometeorological screening. Station records are carefully checked for completeness, temporal consistency, and overall quality, and only months with valid observed and corresponding reanalysis data are retained. This approach enables rigorous assessment of both climatological patterns and extreme precipitation events while supporting the development of reliable bias-correction workflows. Additionally, it ensures that subsequent analyses maintain reproducibility and transparency, which are critical for operational and research applications at national scales.
Figure 1.
Case study area and precipitation monitoring network.
2.3. Gridded Precipitation Dataset
In this study, the ERA5-Land gridded dataset is used. ERA5-Land is a global reanalysis product designed to provide a consistent view of land-surface variables over several decades, with enhanced spatial resolution relative to ERA5 [7]. ERA5-Land precipitation is accessed through the Google Earth Engine public catalogue, which allows programmatic access to the hourly dataset and supports aggregation to user-defined temporal resolutions. In this study, precipitation data were aggregated to a monthly time step to match the temporal scale of station observations and to facilitate robust evaluation and national-scale analysis.
2.4. Bias-Correction Methods
Two statistical post-processing methods, namely linear regression mapping (lm) and quantile mapping (qm), are applied for station-scale adjustment of monthly ERA5-Land precipitation. Each method is calibrated independently for each station using the calibration period (1960–1994) and then applied unchanged to the validation period (1995–2021). A non-negativity constraint is enforced in all corrected series by setting negative adjusted precipitation values to zero.
Regarding linear regression mapping, a station-specific linear transfer function is fitted in the calibration period to map ERA5-Land precipitation to observed precipitation, as defined in Equation (1):
where Pobs(t) represents the observed monthly precipitation at time t (station record) and Pmod(t) represents the corresponding ERA5-Land monthly precipitation at time t (sampled at the station location after the spatial extraction step). The fitted coefficients a and b are then used to generate corrected values for both calibration and validation [8], with the corrected precipitation through linear regression mapping, namely Plm(t), to be given by Equation (2):
This approach targets mean bias and linear amplitude errors and is computationally efficient for national-scale station screening.
On the other hand, quantile mapping is used as the non-linear method to adjust the full distribution of monthly precipitation. In the calibration period, empirical cumulative distribution functions are estimated for observed, and modelled series, . Each model value is then mapped through the probability space of the model distribution into the observed distribution, with the bias-corrected precipitation Pqm(t) to be attributed by Equation (3).
Implementation uses discrete empirical quantiles with interpolation between quantile levels. Values outside the calibration range are mapped to the nearest available boundary quantiles. Quantile mapping is widely used for precipitation because it can correct distributional shape and tail behaviour, but statistical corrections may influence trends and extremes if not assessed out-of-sample; therefore, performance is evaluated on an independent validation period and interpreted with distribution-aware diagnostics [9].
2.5. Calibration and Validation Assessment
For each station, monthly precipitation series were temporally aligned between observations and ERA5-Land. Months with missing values in either series were excluded to ensure consistent sample sizes across methods. The records were split into a calibration period (1960–1994) and an independent validation period (1995–2021). All bias-correction parameters were fitted using the calibration data only and then applied unchanged to the validation period. The performance was quantified using well-established statistical metrics, including percent bias (PBIAS), root mean square error (RMSE), Pearson correlation coefficient r, and Kling–Gupta efficiency (KGE) coefficient.
3. Results and Discussion
3.1. Bias-Correction Outputs for the Ensemble of Stations and Data
Validation results are summarized for 10 stations over Greece using monthly precipitation for the period of 1995–2021, as depicted in Table 1. The raw ERA5-Land series exhibits a systematic wet tendency across the network. Mean PBIAS is 50.30%, ranging from 34.37% to 91.45%, while mean RMSE is 40.92 mm month−1, ranging from 30.35 to 77.79. Pearson correlation r is 0.740, indicating that temporal co-variability is often captured but overall agreement is degraded by bias and variability mismatch.
Table 1.
Validation performance summary across ten stations in Greece for the period of 1995–2021 (PBIAS in %, RMSE in mm month−1; Pearson r and KGE are dimensionless).
Both post-processing methods improve validation performance relative to the raw series. The initial RMSE of 40.92 mm month−1 decreases to 32.72 mm month−1 for lm and to 35.30 mm month−1 for qm. Gains in KGE are also substantial, with median KGE increasing from 0.389 in the raw series to 0.619 for lm and 0.621 for qm. Pearson correlation does change across methods, so improvements are primarily attributable to reductions in bias and variability mismatch rather than changes in temporal association.
3.2. Representative Station Example: Thessaloniki Station
The Thessaloniki station (see Figure 1) is used as a representative example to illustrate the behaviour of the raw ERA5-Land series and the two retained post-processing methods under the common calibration and validation protocol, Table 2. The validation period includes 324 monthly values for 1995–2021. Within this period, the raw ERA5-Land series shows a pronounced wet bias, with bias 19.07 mm and PBIAS 49.61%. The overall error is RMSE 30.35 mm month−1, while temporal association is relatively strong, with r equal to 0.799. Despite this association, agreement is limited by bias and variability mismatch, with KGE 0.404. Tail diagnostics confirm strong overestimation in high precipitation months, with q95_err 28.53 mm and q99_err 42.82 mm.
Table 2.
Validation performance summary for the Thessaloniki station for the period of 1995–2021.
Both post-processing methods substantially reduce validation errors. The linear regression mapping (lm) method produced the minimum validation RMSE, reducing it to 18.75 mm month−1, corresponding to a 38.2% reduction relative to the raw ERA5-Land values. Bias is reduced to 0.71 mm month−1 and PBIAS to 1.84%, while KGE increases to 0.694. However, percentile diagnostics indicate compression in the upper tail, with negative tail errors of q95_err = −16.5 mm and q99_err = −20.7 mm. In contrast, the quantile mapping (qm) method achieves the highest KGE for this station (0.797) and a small q95 error of −4.6 mm, but a slightly higher RMSE of 20.00 mm month−1 and a residual overestimation in the q99 percentile of 14.83 mm. The fact that the Pearson correlation remains unchanged indicates that most performance gains are attributable to bias and variability correction rather than improvements in temporal association.
Concluding, across the Greek station network, raw ERA5-Land precipitation shows a systematic wet bias in validation. Correlation indicates that temporal co-variability is often captured, yet agreement is limited by bias and variability mismatch, which motivates station-based post-processing prior to national-scale use in risk-sensitive applications. Under the common validation protocol, linear regression mapping typically achieves the lowest RMSE, while quantile mapping provides competitive performance and can better control distributional diagnostics in some cases. These findings reinforce established guidance that statistical bias correction does not create physical skill and should be evaluated out-of-sample with diagnostics that include distributional behaviour, not just mean error measures [10].
4. Conclusions
The methodology, together with the results, illustrates how cloud-based geospatial computing can support national-scale precipitation screening within a reproducible workflow. Google Earth Engine enables scalable access to multi-decadal reanalysis archives and consistent spatial sampling at station locations, reducing data-handling overhead and supporting rapid iteration of extraction, aggregation, and evaluation steps. Across the Greek station network, raw ERA5-Land precipitation exhibits a systematic wet bias during the validation period (mean PBIAS 50.30% and mean RMSE of 40.92 mm month−1). Both post-processing methods improve validation performance, as linear regression mapping reduces RMSE to 32.72 mm month−1 and improves KGE from 0.389 to 0.619, while quantile mapping provides comparable overall skill (RMSE 35.30 mm month−1 and KGE 0.621) with similar reductions in bias. In this context, the national-scale mapping of the most appropriate bias-correction techniques for ERA5-Land when used in hydrological modelling represents the main innovation of the present research. This work could be further enhanced by evaluating additional bias-correction techniques and by incorporating rainfall observations covering the western part of Greece, which are currently missing. Overall, the workflow provides a practical and transferable roadmap for rapid station-based screening and post-processing of gridded precipitation products prior to their use in water resources and risk-sensitive applications.
Author Contributions
Conceptualization, C.S.; methodology, C.S., N.A. and A.L.; software, N.A.; validation, C.S. and N.A.; formal analysis, N.A.; resources, N.A. and K.V.; data curation, N.A. and K.V.; writing—original draft preparation, N.A.; writing—review and editing, C.S. and A.L.; visualization, N.A.; supervision, C.S. and A.L. All authors have read and agreed to the published version of the manuscript.
Funding
This research was supported by the PREVENT project, which has received funding from the EU Horizon Europe framework programme (grant no. 101081276).
Institutional Review Board Statement
Not applicable.
Informed Consent Statement
Not applicable.
Data Availability Statement
The original data for the ERA5-Land datasets used in this study are openly available through the Copernicus Climate Data Store of the Copernicus European Union Space Programme at https://cds.climate.copernicus.eu/datasets/reanalysis-era5-land (accessed on 18 March 2026). The observed precipitation data analyzed and presented in this study for Greece were obtained for research purposes from the Hellenic National Meteorological Service and are available from the corresponding national authority upon reasonable request.
Acknowledgments
Part of the results presented in this work have been produced using Aristotle University of Thessaloniki (AUTh)’s high-performance computing infrastructure and resources.
Conflicts of Interest
The authors declare no conflicts of interest.
References
- Kurtz, W.; Lapin, A.; Schilling, O.S.; Tang, Q.; Schiller, E.; Braun, T.; Brunner, P. Integrating hydrological modelling, data assimilation and cloud computing for real-time management of water resources. Environ. Model. Softw. 2017, 93, 418–435. [Google Scholar] [CrossRef] [Scilit]
- Gorelick, N.; Hancher, M.; Dixon, M.; Ilyushchenko, S.; Thau, D.; Moore, R. Google Earth Engine: Planetary-scale geospatial analysis for everyone. Remote Sens. Environ. 2017, 202, 18–27. [Google Scholar] [CrossRef] [Scilit]
- Musial, J.; Leszczenski, J.; Bojanowski, J.; Milcinski, G.; Vrecko, A.; Clarijs, D.; Marquard, U. Overview of the Copernicus Data Space Ecosystem APIs. In Proceedings of the EGU General Assembly 2024, Vienna, Austria, 14–19 April 2024; p. 10109. [Google Scholar]
- Sentinel Hub. Available online: https://dataspace.copernicus.eu/analyse/apis/sentinel-hub (accessed on 20 April 2026).
- Gomis-Cebolla, J.; Rattayova, V.; Salazar-Galán, S.; Francés, F. Evaluation of ERA5 and ERA5-Land reanalysis precipitation datasets over Spain (1951–2020). Atmos. Res. 2023, 284, 106606. [Google Scholar] [CrossRef] [Scilit]
- Skoulikaris, C.; Venetsanou, P.; Lazoglou, G.; Anagnostopoulou, C.; Voudouris, K. Spatio-Temporal Interpolation and Bias Correction Ordering Analysis for Hydrological Simulations: An Assessment on a Mountainous River Basin. Water 2022, 14, 660. [Google Scholar] [CrossRef] [Scilit]
- Dhawan, P.; Dalla Torre, D.; Niazkar, M.; Kaffas, K.; Larcher, M.; Righetti, M.; Menapace, A. A comprehensive comparison of bias correction methods in climate model simulations: Application on ERA5-Land across different temporal resolutions. Heliyon 2024, 10, e40149. [Google Scholar] [CrossRef] [Scilit] [PubMed]
- Maraun, D. Bias Correcting Climate Change Simulations: A Critical Review. Curr. Clim. Change Rep. 2016, 2, 211–216. [Google Scholar] [CrossRef] [Scilit]
- Cannon, A.J.; Sobie, S.R.; Murdock, T.Q. Bias correction of GCM precipitation by quantile mapping: How well do methods preserve changes in quantiles and extremes? J. Clim. 2015, 28, 6938–6959. [Google Scholar] [CrossRef] [Scilit]
- Gupta, H.V.; Kling, H.; Yilmaz, K.K.; Martinez, G.F. Decomposition of the mean squared error and NSE performance criteria: Implications for improving hydrological modelling. J. Hydrol. 2009, 377, 80–91. [Google Scholar] [CrossRef] [Scilit]

Disclaimer/Publisher’s Note: The statements, opinions and data contained in all publications are solely those of the individual author(s) and contributor(s) and not of MDPI and/or the editor(s). MDPI and/or the editor(s) disclaim responsibility for any injury to people or property resulting from any ideas, methods, instructions or products referred to in the content. |
© 2026 by the authors. Licensee MDPI, Basel, Switzerland. This article is an open access article distributed under the terms and conditions of the Creative Commons Attribution (CC BY) license.