


Abstract
Microplastic pollution is a significant and growing environmental concern. Polyethylene terephthalate (PET) is one of the most prevalent microplastics, posing substantial risks to aquatic ecosystems. A promising removal technique is magnetic extraction, utilizing hydrophobic magnetic nanoparticles (MNPs) to adsorb microplastics for subsequent separation from water. In this work, we investigate the adsorption of PET microplastics onto oleic acid/oleylamine (OA/OAm) capped cobalt ferrite (CoFe2O4) MNPs using a combined computational and experimental approach. Experimentally, CoFe2O4 MNPs have been synthesized, functionalized to enhance hydrophobicity, and applied in PET adsorption studies, with the material’s adsorption characterized using a combination of transmission electron microscopy (TEM) and Fourier transform infrared (FTIR), energy-dispersive X-ray (EDX), X-ray photoelectron (XPS), and ultraviolet–visible (UV-Vis) spectroscopy. Density functional theory (DFT) calculations have been employed to model the adsorption process, with time-dependent density functional theory (TDDFT) methods employed to obtain the optical absorption spectra in the UV-Vis regime. By combining these techniques, we show the mechanism of PET adsorption on CoFe2O4 MNPs is via charge transfer to the surface, with an estimated PET uptake on OA/OAm capped CoFe2O4 MNPs of ∼57%. These findings provide both a fundamental understanding of microplastic adsorption on MNPs and an effective strategy for mitigating microplastic contamination in water.
1. Introduction
Plastic production has soared in recent decades, surpassing forty million tons annually worldwide. This increase has led to widespread plastic waste in both aquatic and terrestrial ecosystems. Physical, chemical, and biological processes break down larger debris into microplastics, which are defined as particles smaller than 5 mm. Because of their persistence, mobility, and ability to carry contaminants, microplastics have become a major environmental concern. Recent studies have found microplastics in oceans, rivers, drinking water, sediments, agricultural soils, and living organisms. These findings raise concerns about impacts on ecosystems and human health [1,2,3,4].
Microplastic removal from water typically involves membrane filtration, coagulation, flocculation, sedimentation, electrocoagulation, or advanced oxidation [5]. While these methods can remove significant amounts of microplastics, they face limitations. Common issues include membrane fouling, high costs, incomplete recovery, and the creation of secondary waste [5]. As a result, there is ongoing research to develop reusable and efficient adsorbent materials [5,6,7,8].
Polyethylene terephthalate (PET) is particularly relevant because of its widespread use in beverage containers, food packaging, and polyester textiles. PET particles and fibers have been identified in raw and treated drinking water, bottled water, and marine water columns [9,10,11]. For example, Pivokonsky et al. detected PET, polypropylene, and polyethylene among the predominant polymers in drinking-water treatment systems, with residual microplastics remaining after treatment [9]. PET microplastics have also been reported throughout different depths of marine water columns, reflecting their environmental persistence and transport beyond surface waters [11]. Compared with nonpolar polyolefins such as polyethylene and polypropylene, PET contains aromatic terephthalate rings and polar ester groups. These structural features influence its wettability and interfacial interactions and provide an intrinsic ultraviolet chromophore that can support spectroscopic quantification and electronic-structure analysis. PET is therefore a suitable model for investigating how polymer functionality affects adsorption at magnetic nanomaterial interfaces.
Magnetic separation is a promising new strategy for microplastic remediation. Magnetic materials can be dispersed in contaminated water, bind to microplastics, and then be collected with a magnetic field. This offers a highly efficient, easily recoverable, and potentially reusable solution for microplastic removal. Many studies have shown the effectiveness of magnetic nanoparticles (MNPs), magnetic carbon materials, and magnetic composites for capturing microplastics in water [6,12]. Hydrophobic magnetic surfaces, in particular, enhance interactions with hydrophobic polymer particles and improve microplastic removal [13].
Cobalt ferrite (CoFe2O4) is a magnetic nanomaterial of great interest because it offers high chemical and mechanical stability, resistance to corrosion, and strong magnetism. Researchers have studied CoFe2O4 magnetic nanoparticles (MNPs) for pollutant adsorption, catalysis, separation, biomedical uses, and environmental cleanup [13]. Synthesis using oleic acid (OA) and oleylamine (OAm) yields highly crystalline hydrophobic nanoparticles [14] that interact strongly with polymers such as PET [15,16]. Despite interest in magnetic materials for microplastic remediation, the mechanisms underlying PET adsorption onto CoFe2O4 MNPs remain unclear.
Although magnetic microplastic capture has advanced rapidly, most studies emphasize removal efficiency and material recovery rather than the molecular competition between the polymer, interfacial water, and individual adsorption sites. This distinction is important because adsorption energies calculated for an ideal, ligand-free oxide cannot be interpreted directly as the behavior of a ligand-capped nanoparticle in water. Density functional theory (DFT) provides a useful framework for identifying favorable adsorption geometries, site-dependent energetics, charge redistribution, and magnetic changes on oxide surfaces. Previous calculations on CoFe2O4 have demonstrated that adsorption depends strongly on surface termination and the coordination environment of Co, Fe, and O sites [17]. Nevertheless, the interaction of a PET molecular model with CoFe2O4 MNPs, including competition with interfacial water and organic dispersing agents [18], remains insufficiently understood. A computational bare-surface model can therefore provide a mechanistic limiting case, provided that its differences from the experimentally capped interface are explicitly acknowledged.
DFT is a first-principles computational method which has proven highly effective for studying adsorption reactions at the quantum level [19,20]. Specifically, DFT calculations may reveal adsorption geometries, surface energetics, charge transfer, electronic changes, and magnetic moments of molecules on metal oxides [21]. These results may then be used within microkinetic models to describe surface coverages of adsorbed molecules under realistic conditions [20]. Moreover, time-dependent density functional theory (TDDFT) calculations [22] at the independent particle level in the optical limit and frequency domain have proven highly effective for describing the optical absorbance of isolated molecules [23]. Such calculations can provide both a qualitative and semi-quantitative description of the optical absorbance as well as a spatially and energetically resolved description of an excitation via the electron-hole spectral density difference [23,24].
For CoFe2O4, DFT studies have examined adsorption of environmentally relevant species on different surfaces, highlighting how surface metal sites and oxygen atoms affect adsorption [17]. However, a systematic study of PET adsorption on CoFe2O4 or the competition between PET and water (H2O) for adsorption sites under real-world conditions is still lacking.
In this work, PET adsorption on OA/OAm-capped CoFe2O4 MNPs (PET+CoFe2O4 MNPs) is investigated using complementary experimental and computational approaches. Specifically, CoFe2O4 MNPs, PET, and PET+CoFe2O4 MNPs are characterized by transmission electron microscopy (TEM), Fourier-transform infrared (FTIR), energy-dispersive X-ray (EDX), and X-ray photoelectron spectroscopy (XPS), while PET uptake is monitored by ultraviolet–visible (UV-Vis) spectroscopy. Time-dependent DFT (TDDFT) calculations are used to interpret the characteristic PET optical absorption and the spatial distribution of the main excitation at nm. Our spin-polarized DFT calculations model adsorption on representative sites of the CoFe2O4 (001) surface by water, OA, OAm, and PET using H2O, propanoic acid (C3O2H5), ethylenamine (C2NH7), and the PET monomer (C10O5H10), respectively. In so doing, we focus specifically on the more relevant quantum-mechanical description of the chemical adsorption of the head groups of these long-chain molecules at a reduced computational cost [25]. A microkinetic treatment is subsequently employed to evaluate H2O/OA/OAm/PET coverage as a function of concentration and temperature. The resulting analysis provides a molecular basis for understanding PET–CoFe2O4 interactions and identifies surface-ligand coverage as a central variable that must be controlled in the design of magnetic adsorbents.
2. Methodology
2.1. Sample Preparation
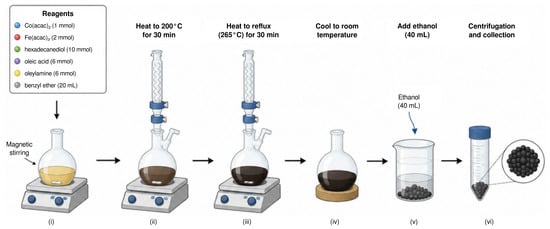
CoFe2O4 MNPs were synthesized using the thermal decomposition method reported in Ref. [26]. The procedure consisted of mixing 1 mmol cobalt(II) acetylacetonate (Co(acac)2), 2 mmol iron(III) acetylacetonate (Fe(acac)3), 10 mmol 1,2 hexadecanediol, 6 mmol oleic acid (OA), 6 mmol oleylamine (OAm), and 20 mL benzyl ether, and magnetically stirred. All chemical reagents were purchased from Sigma-Aldrich (Sigma-Aldrich, St. Louis, MI, USA). The mixture was heated to C for 30 min and then heated to reflux (C) for another 30 min. The black-brown mixture was cooled to room temperature by removing the heat source. Under ambient conditions, ethanol (40 mL) was added to the mixture. A black material precipitated, was separated by centrifugation, and dried at C for 24 h as depicted in Figure 1.
Figure 1.
Six-step CoFe2O4 MNP synthesis procedure involving (i) mixing and magnetic stirring of six reagents (see inset), heating to (ii) C and (iii) C for 30 min each, (iv) cooling to ambient conditions, (v) addition of 40 mL ethanol, and (vi) centrifugation and collection of resulting black precipitate.
The structural properties of the OA/OAm capped CoFe2O4 MNPS have previously been analyzed using X-ray diffraction (XRD) in Ref. [27]. The peaks corresponding to (220), (311), (222), (400), (422), (511) and (440) planes, which are indicative of a single-phase cubic mixed-type spinel structure, were identified using an XRD card of the Joint Committee on Powder Diffraction Standards (JCPDS) file no. 22-1086 for CoFe2O4 [27].
To quantify polyethylene terephthalate (PET), a simulated microplastic sample was prepared via hydrothermal alkaline treatment [8,28,29]. PET flake waste (5.5 g) was introduced into a hydrothermal reactor containing 50 mL of a 1.7 M sodium hydroxide (NaOH) solution, and the mixture was heated at C for 20 h. The resulting slurry was then filtered and washed three times by decantation with distilled water to remove residual alkaline species. Finally, the hydrothermally fragmented PET microparticles were dried at C for 12 h. Simulated PET microplastics were prepared at nominal concentrations of 50, 100, 200, 250, 400, 750, 500, 1000, 5000, and 10,000 parts per million (ppm) by serial dilution in distilled water.
2.2. Sample Characterization
Each PET sample was characterized using its UV-Vis spectra to plot the calibration curve for PET microplastics. This calibration curve enables the quantitative determination of PET concentration in aqueous suspensions by spectrophotometry, consistent with the Beer–Lambert law.
The change in absorbance with respect to concentration c at a given wavelength , , should be proportional to the absorbance, so that
where k is a constant of proportionality. Assuming the absorbance goes to zero at zero concentration, i.e., , and letting be the absorbance of a pure sample, i.e., , we find
Note that for , and expanding to linear order in the concentration c, we recover the Beer–Lambert law , where is the extinction coefficient and b is the sample thickness.
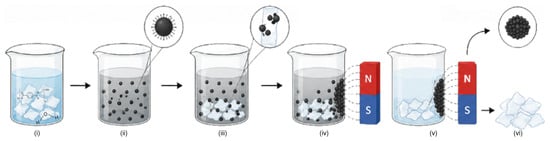
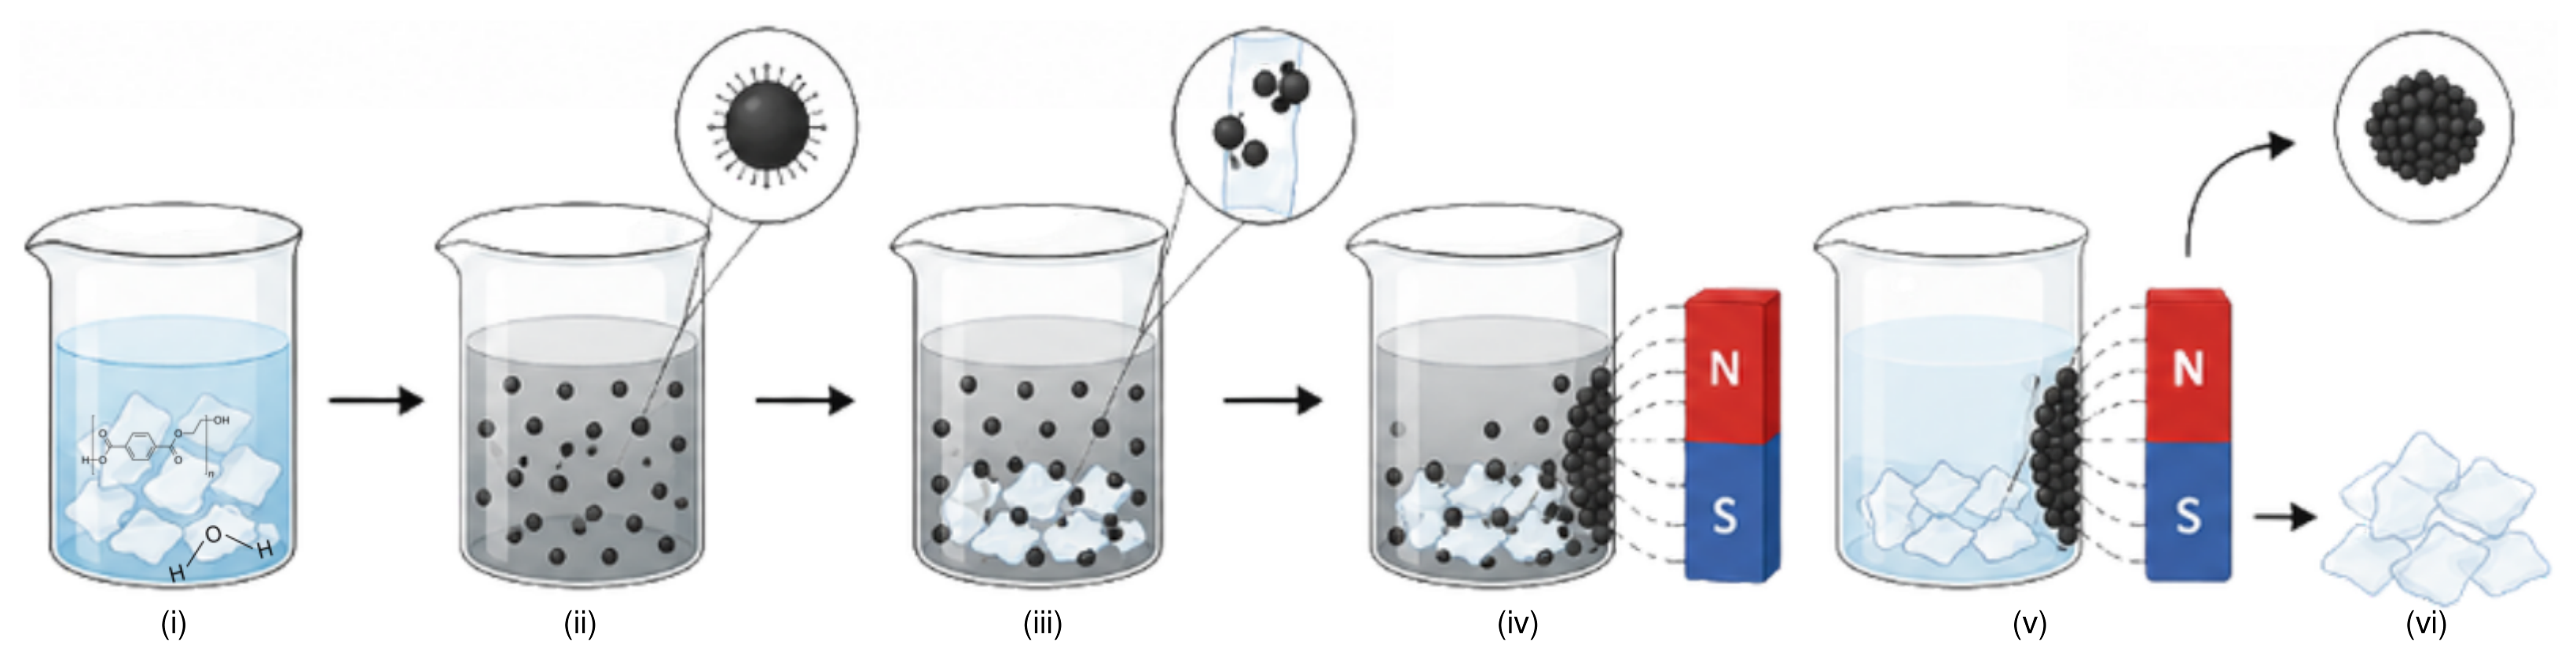
For the UV-Vis measurements, 0.01 g of CoFe2O4 MNPs were placed in 1 mL of ∼100 ppm microplastics solution, and data were collected for 7 days at room temperature and pH 6, as shown schematically in Figure 2. Based on a PET mass density of g/mol, this resulted initially in mol of PET in the PET+CoFe2O4 MNP sample. Employing a spherical model for the CoFe2O4 MNPs and using a CoFe2O4 theoretical mass density of g/cm3, and the theoretical CoFe2O4 (001) area per adsorption site of 0.700 nm2, we find the number of surface sites on the CoFe2O4 MNPs is , where is the wt.% of carbon in the sample and d is the MNP diameter in nm. We may estimate and d using EDX and TEM measurements, respectively, of the CoFe2O4 MNP sample.
Figure 2.
Six-step PET separation procedure using CoFe2O4 MNPs involving (i) PET suspension at 100 parts per million (ppm) in water, (ii) addition of 0.01 g CoFe2O4 MNPs, (iii) mixing, (iv) applying a magnetic field, (v) maintaining the field for a week, and (vi) collection and recovery of CoFe2O4 MNPs.
The change in PET concentration with respect to time t, , should obey , where the time dependence of reflects the decrease in the rate of adsorption with time [30]. In this way , where and k is the rate constant for PET adsorption [30]. Applying the initial and final conditions , , and , we obtain the time-dependent equation for PET concentration
By applying the Beer–Lambert law to the measured absorbance, so that , we may use (3) to estimate the reduction in and final PET concentration in solution, and , respectively, and hence the fraction of PET adsorbed .
TEM analysis of the CoFe2O4 MNPs was carried out in a FEI spirit microscope (at 120 kV). Infrared analysis was performed using an Agilent Technologies Cary 360 spectrometer (Agilent Technologies, Santa Clara, CA, USA) equipped with a diamond attenuated total reflectance (ATR) accessory, with a resolution of 4 cm−1. PET adsorption was analyzed using a UV-Vis spectrophotometer (Genova Nano, Jenway, Cole-Parmer Ltd., Stone, Staffordshire, UK).
The wettability of the OA/OAm capped CoFe2O4 MNP surface with and without PET was assessed using the sessile-drop technique [31,32]. A L drop of CoFe2O4 MNPs was applied to a clean glass substrate and allowed to dry. Subsequently, a L aliquot of either the aqueous PET dispersion or distilled water was deposited onto the nanoparticle-coated surface. Six droplet profiles were recorded for each sample from the side immediately after deposition under static conditions. The apparent contact angle was determined from digital images by identifying the solid–liquid baseline and phase contact points (see Figure S1 of the Supplementary Materials (SM)). The droplet contour was analyzed at both left and right contact points, and the contact angle was defined as the angle between the tangent to the liquid–vapor interface at the phase contact line and the solid baseline, measured through the or droplet.
XPS measurements were performed using a VersaProbe III 5000 photoelectron spectrometer (Physical Electronics, Chanhassen, MN, USA). Survey scans were collected from 0 to 1400 eV with a pass energy of 226 eV for each sample (see Figure S2 of the SM), followed by the high-resolution regions C 1s, O 1s, Co 2p, and Fe 2p with a pass energy of 60 eV. Each high-resolution spectral region was scanned between 10 and 20 times, depending on the signal intensity. Curve fitting was performed using a nonlinear algorithm assuming mostly Gaussian peak shape without asymmetries. The surface morphology and EDX spectra of the samples (see Figure S3 of the SM) was examined by field-emission scanning electron microscopy (FEG-SEM) using an Apreo ChemiSEM S LoVac microscope (Thermo Fisher Scientific, Waltham, MA, USA). XPS and EDX atomic compositions of each sample in atomic (at.%) and weight (wt.%) percent are provided in Tables S1 and S2 of the SM.
2.3. Computational Details
In this work, we have performed DFT calculations to investigate the adsorption process of PET in aqueous solution on CoFe2O4 MNPs. Specifically, we employ the most stable CoFe2O4(001) surface as a model for MNPs of diameter nm. The initial atomic structures were constructed using the Atomic Simulation Environment (ASE) [33]. The substrate was modeled as a repetition of the CoFe2O4(001) surface with a Å3 unit cell. Spin-polarization was included due to the magnetic nature of the CoFe2O4 substrate, with initial magnetic moments assigned to the transition metal atoms based on their oxidation states and coordination environments.
All DFT calculations were performed using the projector augmented wave (PAW) method as implemented in the GPAW code [34,35]. For the exchange and correlation (xc) functional, we employ the Perdew, Burke, and Ernzerhof (PBE) functional optimized for solids (PBEsol) [36], which belongs to the generalized gradient approximation (GGA) family and provides improved lattice constants and surface properties [36] compared with the original PBE functional [37]. A double- polarized (DZP) basis set was employed for all atoms [38]. A grid spacing of Å and grid points were employed to describe the electronic density. The Brillouin zone integration was performed using a -centered k-point mesh. The occupation numbers followed a Fermi–Dirac distribution with a width of eV to facilitate convergence of the self-consistent iterations. Structural relaxations were performed using the Fast Inertial Relaxation Engine (FIRE) optimization algorithm [39] as implemented in ASE [33]. The atomic positions of all atoms were relaxed until the maximum force fell below 0.03 eV/Å. We apply Bader’s partitioning scheme [40,41,42] to GPAW’s all-electron charge density to assign charges to each atomic species, and hence describe any charge transfer between adsorbate and surface.
Optical absorbance of isolated PET in the UV-Vis region has been calculated within TDDFT in the reciprocal space (k) and frequency domain () in the independent particle approximation using the LCAO-TDDFT-k- code [23,24,43,44] employing the Gritsenko, van Leeuwen, van Lenthe, and Baerends solid and correlation (GLLB-SC) xc functional [45]. This methodology provides a method for spatially and energetically resolving the exciton, hole, and electron spectral densities [24]. Based on these quantities, the electron-hole spectral density difference is defined as , where and are hole and electron spectral densities, respectively, obtained by averaging the two-point excitonic spectral probability density over the other coordinate [24].
2.4. Microkinetic Modeling
Adsorption of isolated H2O, OA, OAm, and PET molecules has been studied on atop Co and Fe surface sites, Fe coordinately unsaturated sites Fecus, and coordinated with O surface atoms Osurf, via the adsorption reactions
respectively, where “*” denotes an empty site on the CoFe2O4 (001) surface, “(l)” denotes the liquid phase, “(aq)” denotes species in aqueous solution, and “(ads)” denotes species adsorbed on the CoFe2O4 (001) surface.
The adsorption energy for H2O, OA, OAm, and PET from reactions (R1), (R2), (R3), and (R4), respectively, are modeled using
where , , , and are the total energies of H2O, C3O2H5, C2NH7, and C10O5H10 adsorbed on the CoFe2O4(001) surface, respectively, is the total energy of the clean CoFe2O4(001) surface, , , and are the total energies of isolated C3O2H5, C2NH7, and C10O5H10 molecules, respectively, and is the total energy per water molecule in gas () or liquid () phase. To model , we employ an isolated H2O molecule model, whereas we model using increasing numbers of hydrogen-bonded H2O molecules until a minimum energy per molecule is obtained.
The complete adsorption complex includes a PET molecule co-adsorbed with H2O to simulate realistic environmental conditions. Specifically, this reaction compares the CoFe2O4 (001) surface completely covered by H2O with that with one H2O molecule replaced by a PET molecule, that is,
The enthalpy of reaction (R5) is
where and are the total energy of one C10O5H10with three H2O molecules and four H2O molecules, respectively, adsorbed on the CoFe2O4(001) surface. It is worth noting that the enthalpy for reaction (R5) will strongly depend on the chemical potential, i.e., the total energy, of water employed, as is significantly more stable compared with .
The fractional coverage of the CoFe2O4 (001) surface by PET in aqueous solution, , is modeled via reaction (R5) using
where is the concentration of PET, as modeled by the monomer C10O5H10, is Boltzmann’s constant, T is the temperature, and is the change in Gibbs free energy for reaction (R5). At equilibrium, this is defined as , where is the enthalpy for the reaction, is the change in zero-point energy, is the change in entropy, is the Boltzmann constant, and T is the temperature [20]. For reaction (R5), the change in both zero-point energy and entropy are negligible, i.e., , so that .
However, (9) neglects the presence of organic dispersing agents adsorbed on the surface of CoFe2O4 MNPs during their synthesis in order to impede their natural agglomeration. To account for this, we may use
where is the concentration of organic dispersing agents, i.e., oleic acid (OA) and oleylamine (OAm), as modeled by propanoic acid (C3O2H5) and ethylenamine (C2NH7), respectively, and is the minimum difference in adsorption energy between OA or OAm and PET from (5), (6) and (7), respectively, so that, .
3. Results and Discussion
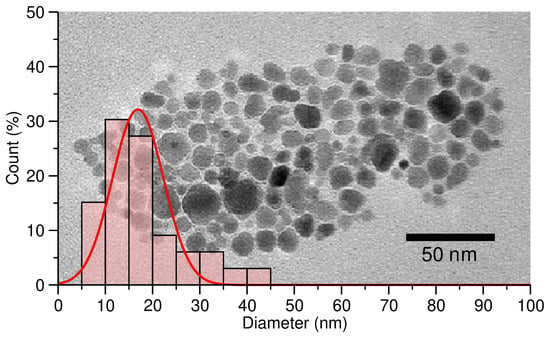
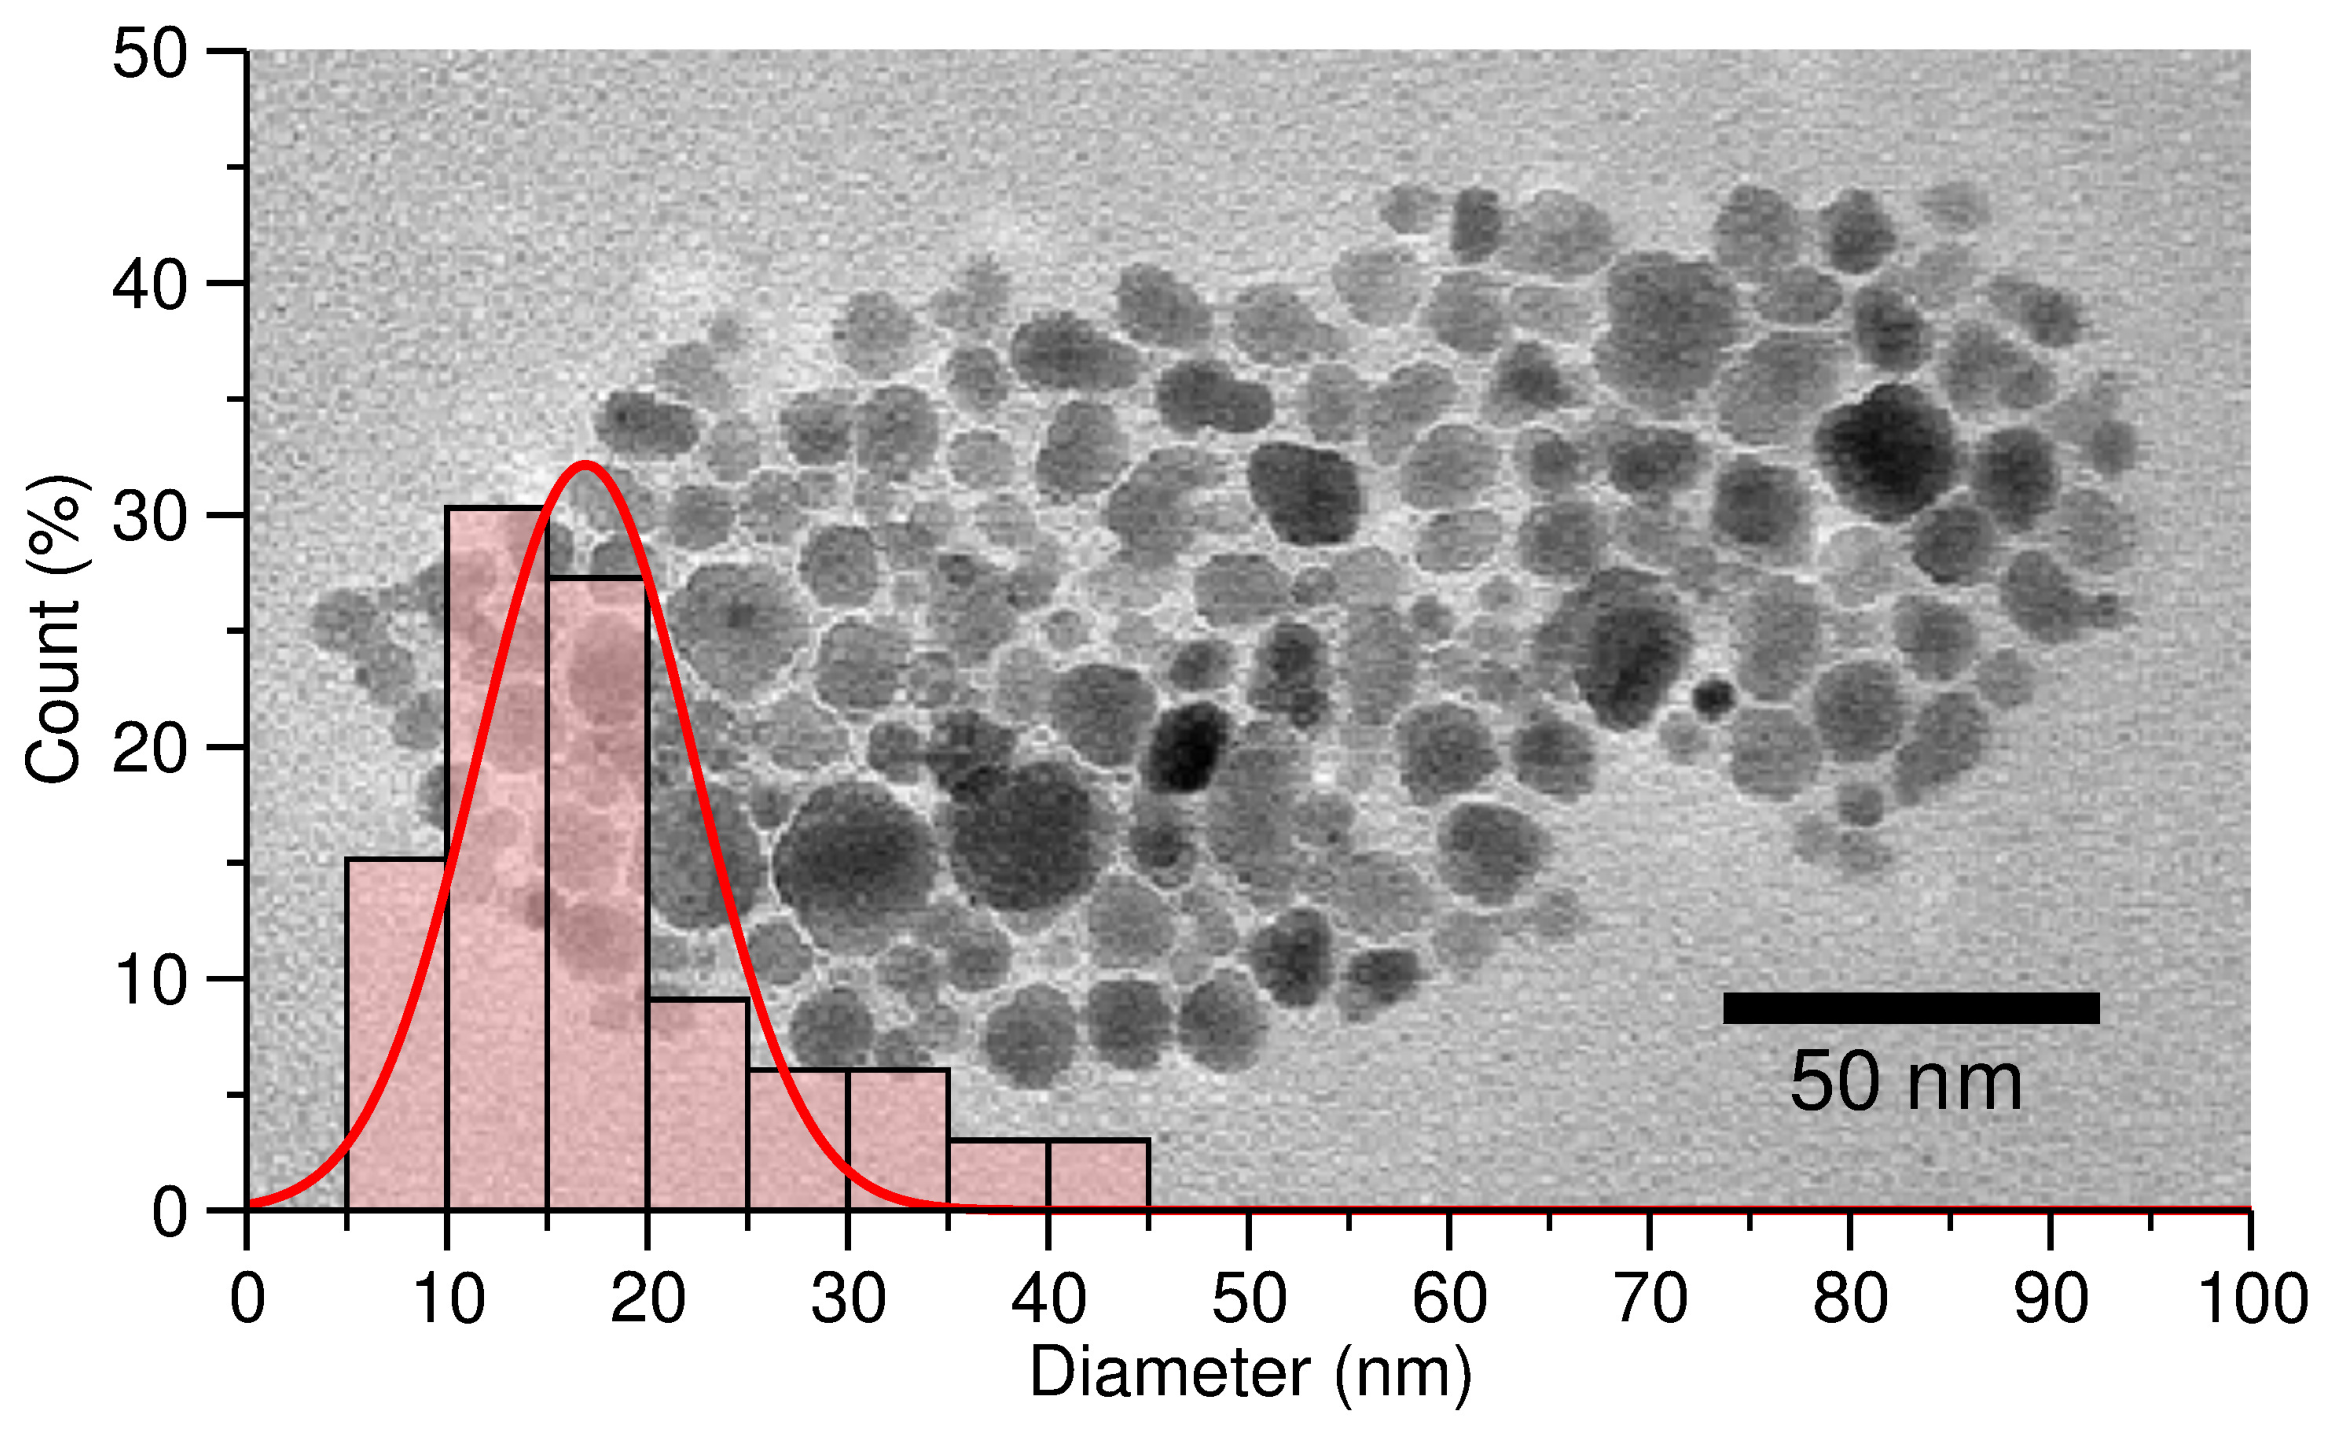
We begin by providing a detailed characterization of the CoFe2O4 MNPs synthesized by the thermal decomposition method [26] outlined in Figure 1. Figure 3 shows a TEM image of a typical sample of the synthesized CoFe2O4 MNPs. Based on this TEM image, we have performed diameter measurements for each of the CoFe2O4 MNPs present in this sample. These data are provided as a histogram in Figure 3. From these results, we find our CoFe2O4 MNPs have a diameter distribution of nm. This diameter distribution justifies our use of a CoFe2O4(001) surface slab model to describe adsorption of PET and H2O on OA/OAm capped CoFe2O4 MNPs.
Figure 3.
Transmission electron micrograph of CoFe2O4 MNPs and histogram of count in % versus MNP diameter d in nm with a Gaussian fit (%, nm, nm, red solid line).
To estimate the OA/OAm coverage of the CoFe2O4 MNPs [14], we have performed EDX measurements of the sample, yielding a carbon contribution of wt.% (see Table S2 of the SM for elemental compositions of each sample). This is rather significant and clearly demonstrates that the OA/OAm dispersing agents cover the CoFe2O4 MNPs. Employing the measured CoFe2O4 MNP diameter of nm and carbon contribution of wt.%, we find . The ratio of adsorption sites to PET molecules is then 47%, that is, the maximum fraction of PET molecules which may be adsorbed on CoFe2O4 MNP sites.
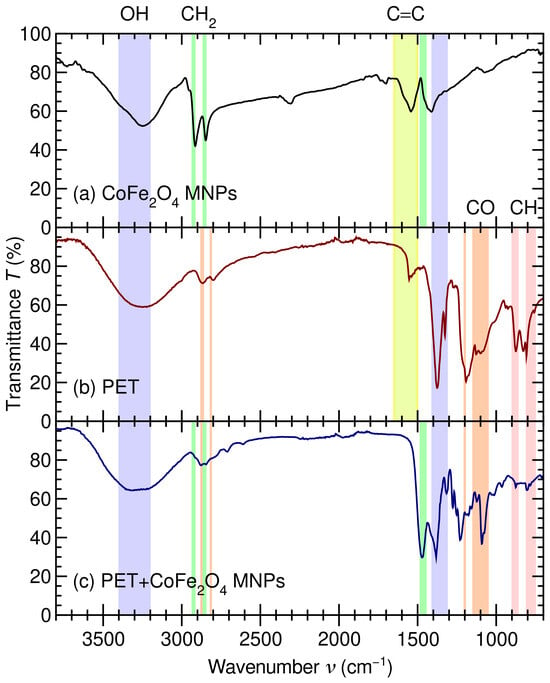
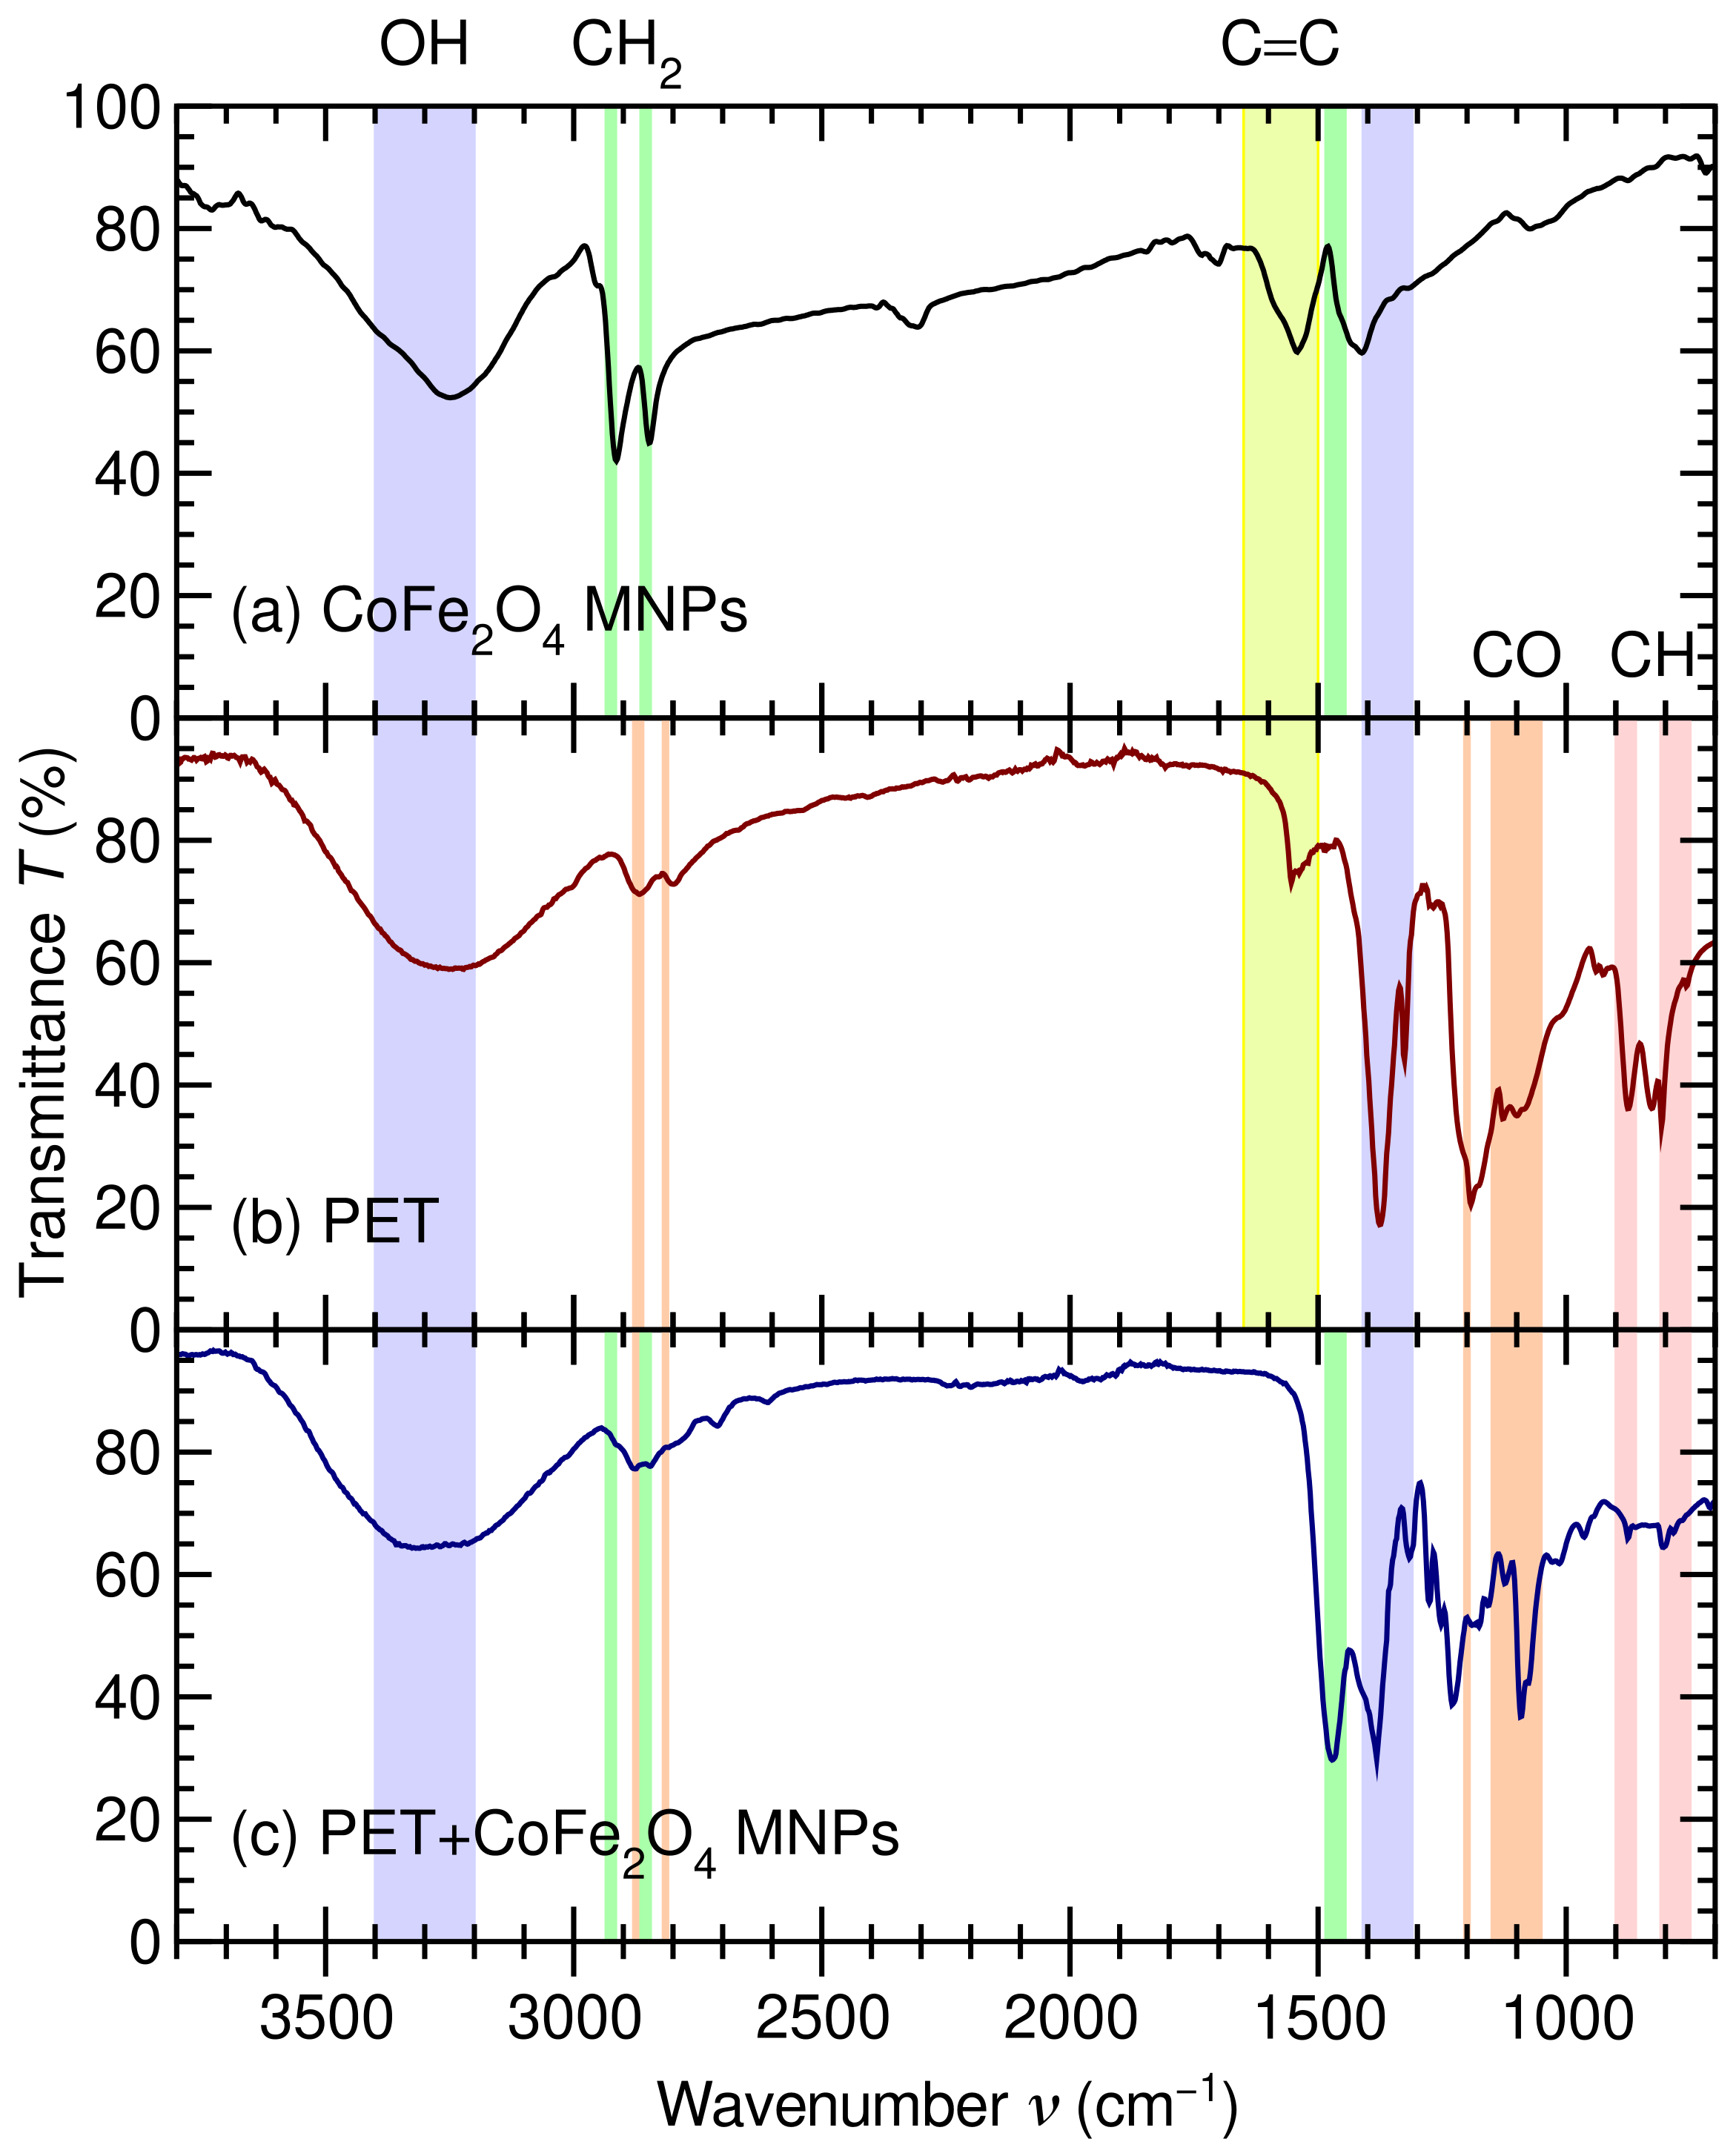
To further characterize our CoFe2O4 MNP sample, in Figure 4a, we provide its FTIR spectra. As shown in Figure 4a, the spectra of our CoFe2O4 MNP sample exhibits a narrow peak at 1310– and a broad peak at 3200– due to –OH groups of OA [46]. The narrower peaks at 2920 and are due to –CH stretching vibrations of long hydrocarbon chains from OA and OAm from the thermal decomposition process used for the preparation of the samples. Furthermore, the regions at 1540–1560 and 700– are consistent with carboxylate vibrations from oleate bound to the CoFe2O4 nanoparticle’s surface [26]. Altogether, these results clearly demonstrate that oleate compounds remain bound to the CoFe2O4 MNPs following their synthesis.
Figure 4.
Transmittance T in % versus wavenumber in of (a) CoFe2O4 MNPs (black), (b) PET (red), and (c) PET adsorbed on CoFe2O4 MNPs (blue). OH stretching (blue region), CH2 stretching (green regions), aromatic C=C stretching (yellow region), CO alkyl ether (orange regions), and aromatic CH stretching (red regions) modes are highlighted as described in Ref. [46].
Figure 4b shows the FTIR spectra of our PET sample, which exhibits characteristic bands related to PET. Specifically, aromatic C=C stretching at , esther C–O vibrations at 1090, 1190, 2800, and , aromatic ring C–H vibrations at 800 and , and CH2 wagging vibrations at are clear fingerprints of PET. However, the C=O peak at of pristine PET is absent in Figure 4b due to the hydrothermal treatment with NaOH [8] we have performed to obtain our simulated microplastic sample [28,29]. Altogether, these bands confirm that the microplastic is PET and that the terephthalate–ethylene glycol structure is preserved after the hydrothermal reaction [8].
Figure 4c shows the FTIR spectra of PET adsorbed on CoFe2O4 MNPs following the PET separation procedure shown schematically in Figure 2. The spectrum contains PET bands attributable to the CoFe2O4 metal–oxygen contribution, confirming that PET interacts with the CoFe2O4 nanoparticles. However, because the nanoparticles are capped with OA/OAm, the interaction should be described as a hybrid interface. More precisely, PET interacts not only with exposed Co/Fe–O sites but also with the organic ligand shell. The persistence of the PET carbonyl and C–O bands indicates adsorption. Specifically, the reduced intensity at 800, 870, 1090, and indicates immobilization of PET on the capped CoFe2O4 surface [13].
Altogether, the FTIR spectra shown in Figure 4 demonstrate that PET is adsorbed onto OA/OAm-capped CoFe2O4 MNPs. After the interaction with PET, the composite spectrum retains the characteristics of the PET bands, while changes in their relative intensities indicate interfacial immobilization. This suggests PET adsorption is mostly driven by hydrophobic and van der Waals interactions between PET and the OA/OAm organic shell, assisted by secondary interactions involving PET ester groups and the ferrite surface [47].
The interfacial wettability of the OA/OAm capped CoFe2O4 MNP surface was further examined using sessile-drop analysis with the aqueous PET dispersion. As shown in Figure S1, the droplet maintained a nearly spherical profile on the nanoparticle-coated surface, exhibiting an apparent contact angle of for both an aqueous PET dispersion and water on CoFe2O4 MNPs, and for on PET+CoFe2O4 MNPs. This high apparent contact angle demonstrates poor wetting of the OA/OAm capped CoFe2O4 MNP surface by both and , consistent with a low-wettability interface [48].
This behavior is attributed to the surface chemistry of the synthesized CoFe2O4 MNPs, as OA and OAm, incorporated during thermal-decomposition synthesis, serve as organic surface ligands that modify the interaction between the ferrite surface and the surrounding aqueous phase. For this reason, the contact-angle results provide evidence for the presence of a distinct interfacial environment.
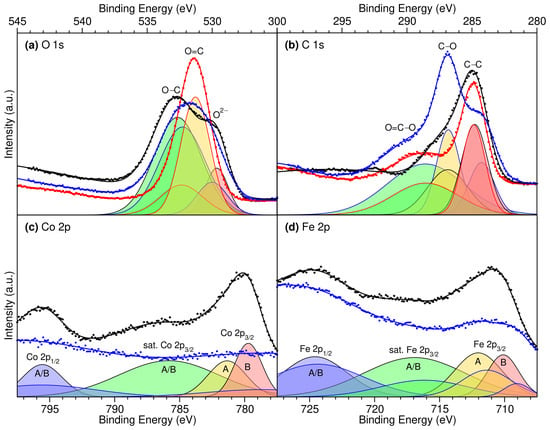
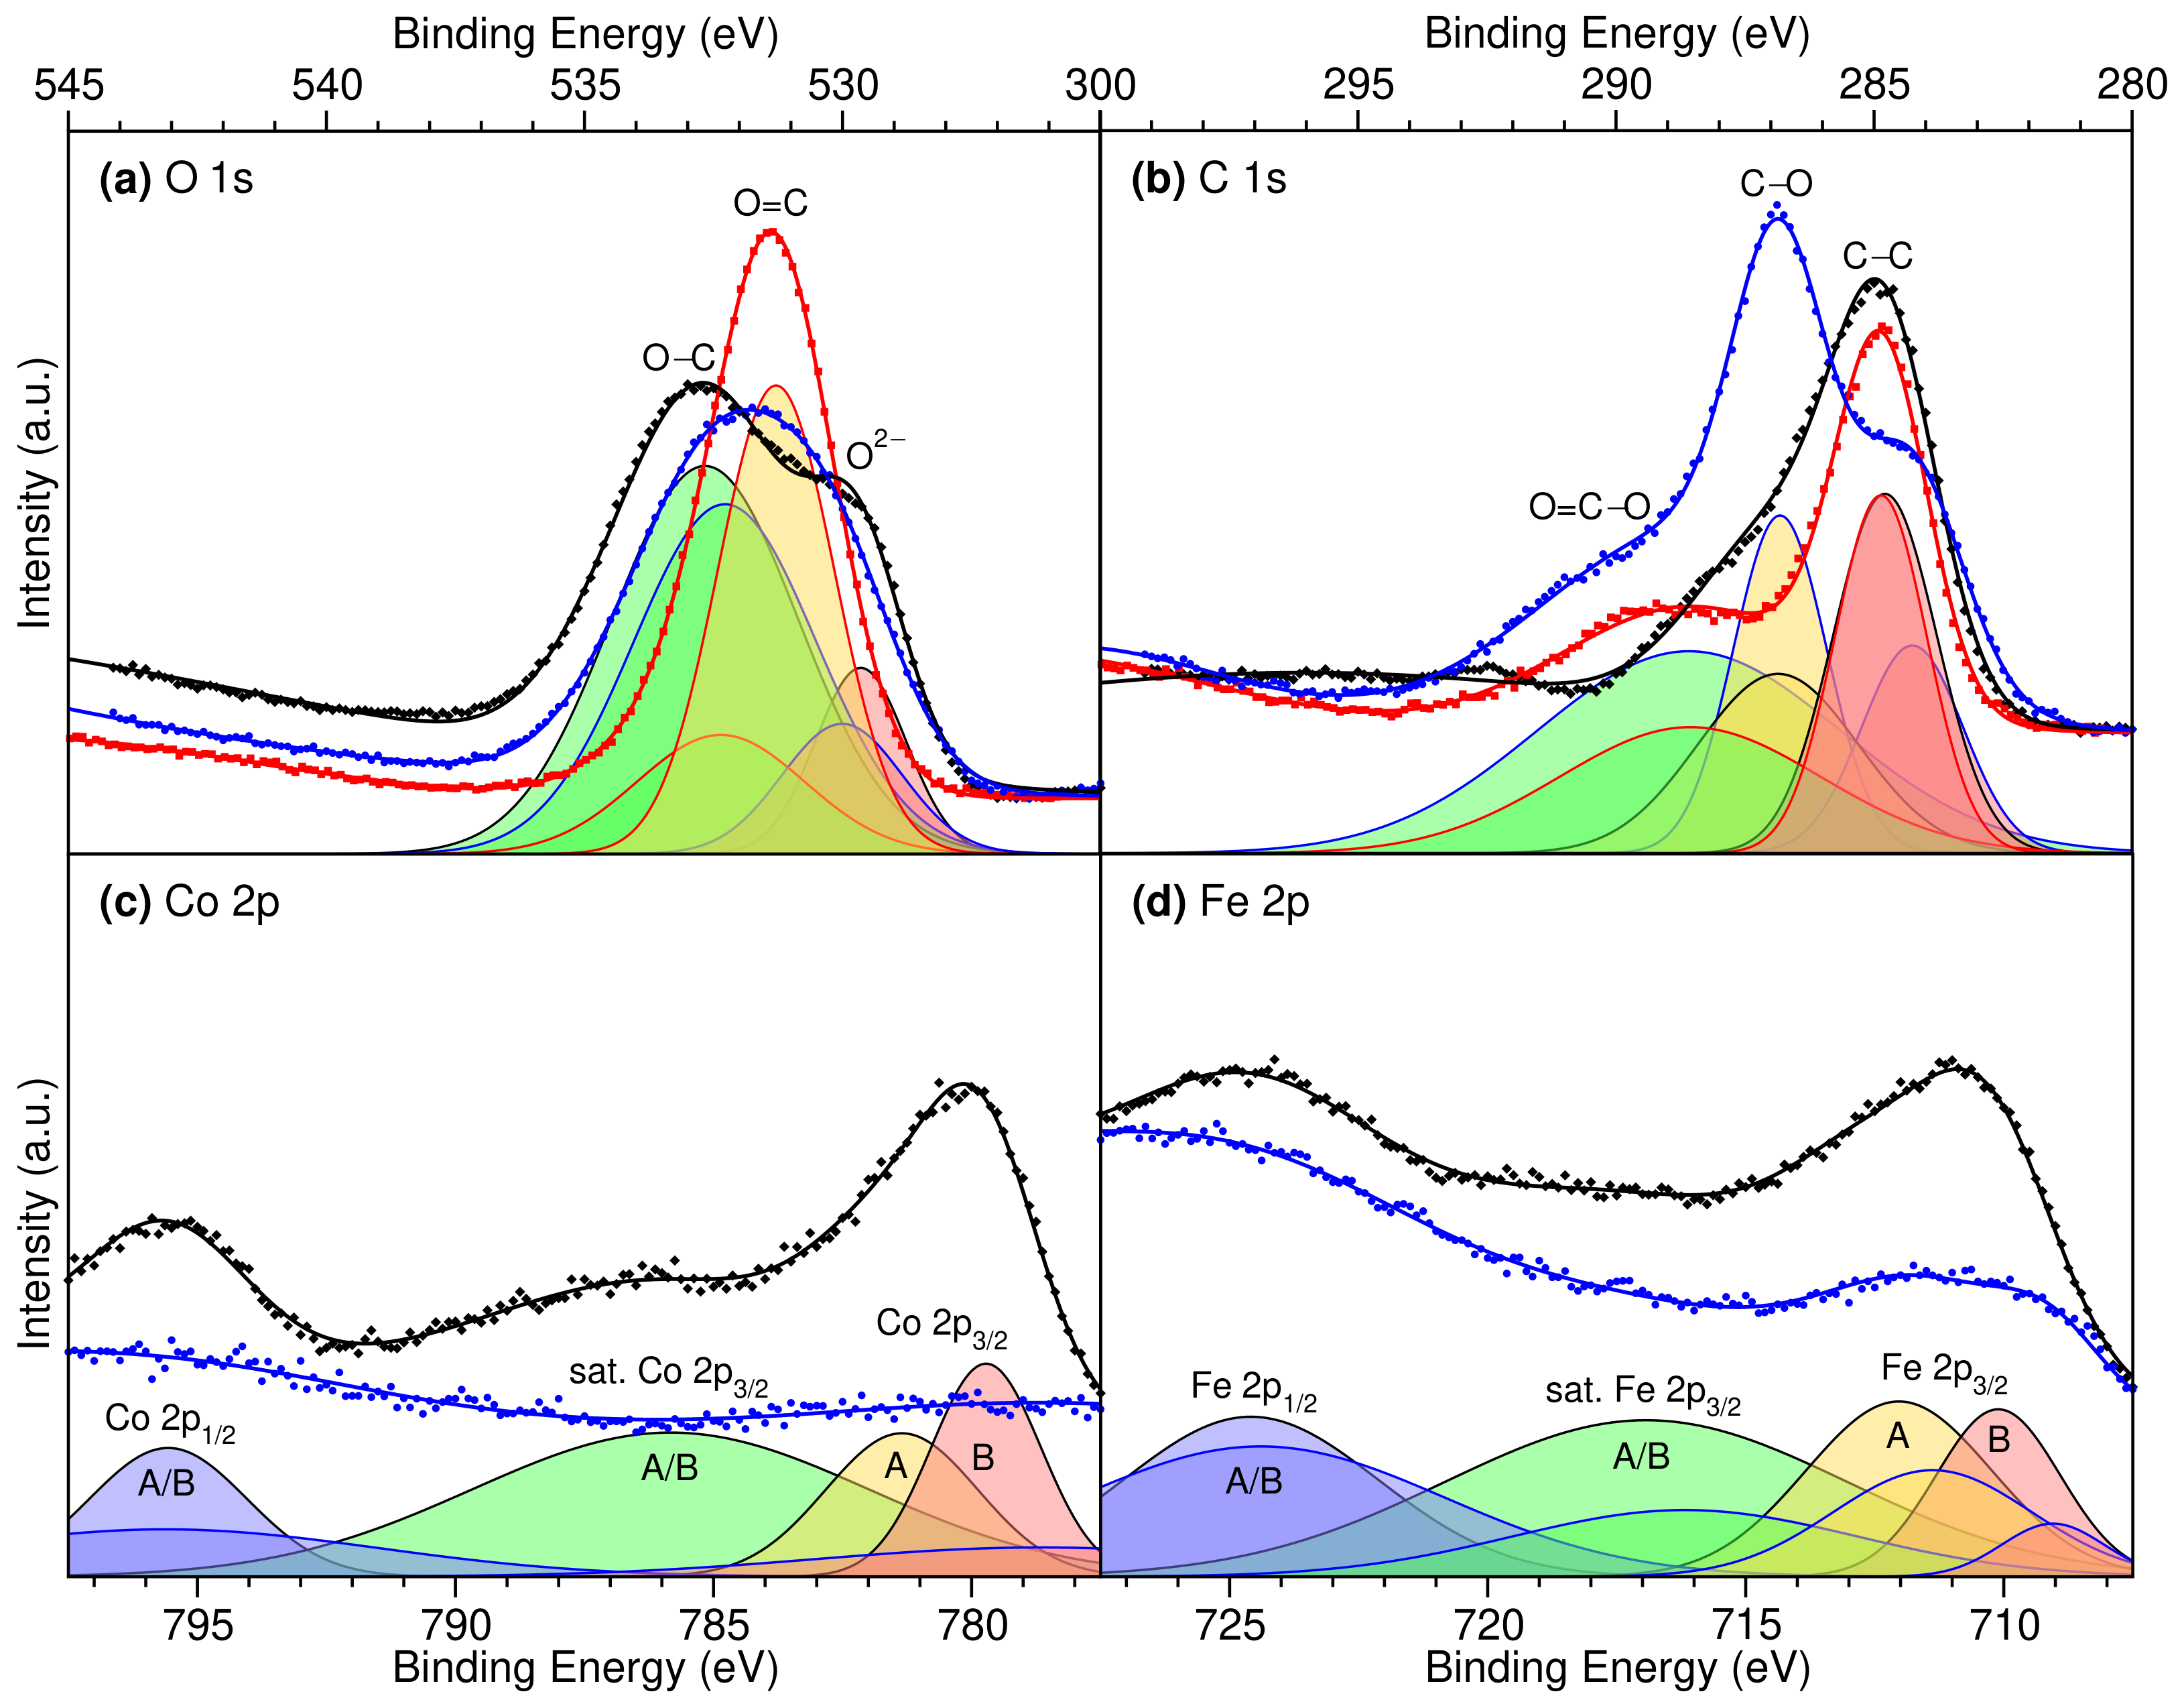
To further probe the nature of the PET–CoFe2O4 MNP interaction, we provide high-resolution XPS measurements of the O 1s [49,50,51,52], C 1s [52,53,54,55], Co 2p [50,56,57], and Fe 2p [51,56,58] core spectra for CoFe2O4 MNPs, PET, and PET+CoFe2O4 MNPs and their Gaussian decompositions, in Figure 5 (see Figure S2 of the SM for the survey spectra). For both the Co 2p and Fe 2p spectra, we find the addition of PET to the CoFe2O4 MNPs causes a significant reduction in overall intensity and a shift to weaker binding for the 2p3/2 peaks, as seen in Figure 5c,d. On the one hand, the observed reduction in intensity may be attributed to the adsorption of micrometer-long PET molecules screening the CoFe2O4 MNPs, as X-ray photoelectrons typically penetrate tens of nanometers [52,59,60]. On the other hand, the shift to weaker Co and Fe 2p3/2 binding energies suggests charge is transferred to metallic sites of the CoFe2O4 MNPs from PET upon adsorption [61].
Figure 5.
XPS high-resolution spectra of CoFe2O4 MNPs (black diamonds), PET (red squares), and PET+CoFe2O4 MNPs (blue circles), Gaussian fits (thick solid lines) and decompositions (thin solid lines) for (a) O 1s into O–C (green filling), O=C (yellow filling), and O2– (red filling) [49]; (b) C 1s into O=C–O (green filling), C–O (yellow filling), and C–C (red filling) [53]; and (c) Co 2p and (d) Fe 2p into 2 p1/2 A/B (blue filling), satellite 2 p3/2 A/B (green filling), 2 p3/2 A (yellow filling), and 2 p3/2 B (red filling) sites [56].
In contrast, for both the O 1s and C 1s spectra, we find the addition of PET to the CoFe2O4 MNPs leaves the overall intensity relatively unchanged, with the O 1s main peak narrowed and the C 1s peaks for PET+CoFe2O4 MNPs a convolution of the individual CoFe2O4 MNP and PET spectra, as seen in Figure 5a,b. The observed consistency in O 1s and C 1s intensities suggests these atomic species are primarily located in the upper layers of each sample, that is, in OA/OAm layers covering the CoFe2O4 MNPs or in adsorbed PET. The narrowing of the main O 1s peak upon PET adsorption suggests weaker-binding O2− species of the CoFe2O4 surface are shifted to stronger binding, whereas stronger-binding O–C species of adsorbed OA are shifted to weaker binding. Although this might initially suggest charge is transferred out of the O 1s levels of the CoFe2O4 MNPs into the adsorbed molecules, a more detailed analysis suggests the observed shifts are related to an improved screening of the O2− 1s levels by neighboring negatively charged Co and Fe species [61]. To provide a more quantitative analysis of the XPS spectra, we have also performed a Gaussian decomposition of each spectrum into specific atomic species with characteristic binding energies.
The O 1s, C 1s, Co 2p, and Fe 2p binding energies obtained from the Gaussian decompositions of Figure 5 are provided in Table 1, and compared with those from Refs. [49,53,56]. Overall, we find our measured binding energies are consistent with those measured for CoFe2O4 nanopowders [56] and PET [49,53]. A more detailed discussion of the individual XPS peaks is provided in the SM. Most importantly, we observe a shift of ∼−1 eV to weaker binding for both Co and Fe octahedral (B) 2p3/2 levels, indicative of a charge transfer to the CoFe2O4 MNPs upon PET adsorption. Altogether, our XPS measurements suggest that PET binds strongly to the CoFe2O4 MNPs and that the adsorption mechanism is via charge transfer from the adsorbate to the surface.
Table 1.
O 1s, C 1s, Co 2p, and Fe 2p XPS binding energies in eV for CoFe2O4 MNPs, PET, and PET+CoFe2O4 MNPs from Figure 5 compared with CoFe2O4 Powder from Ref. [56] and PET from Refs. [49,53].
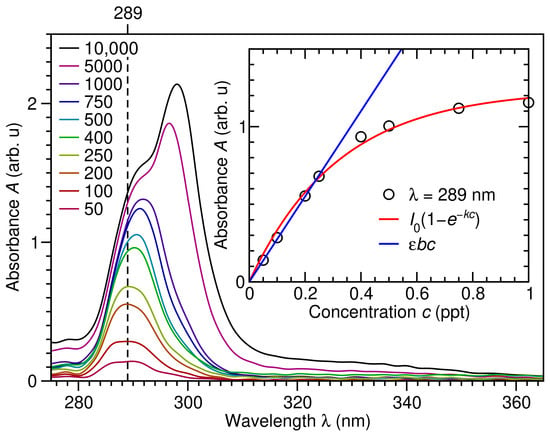
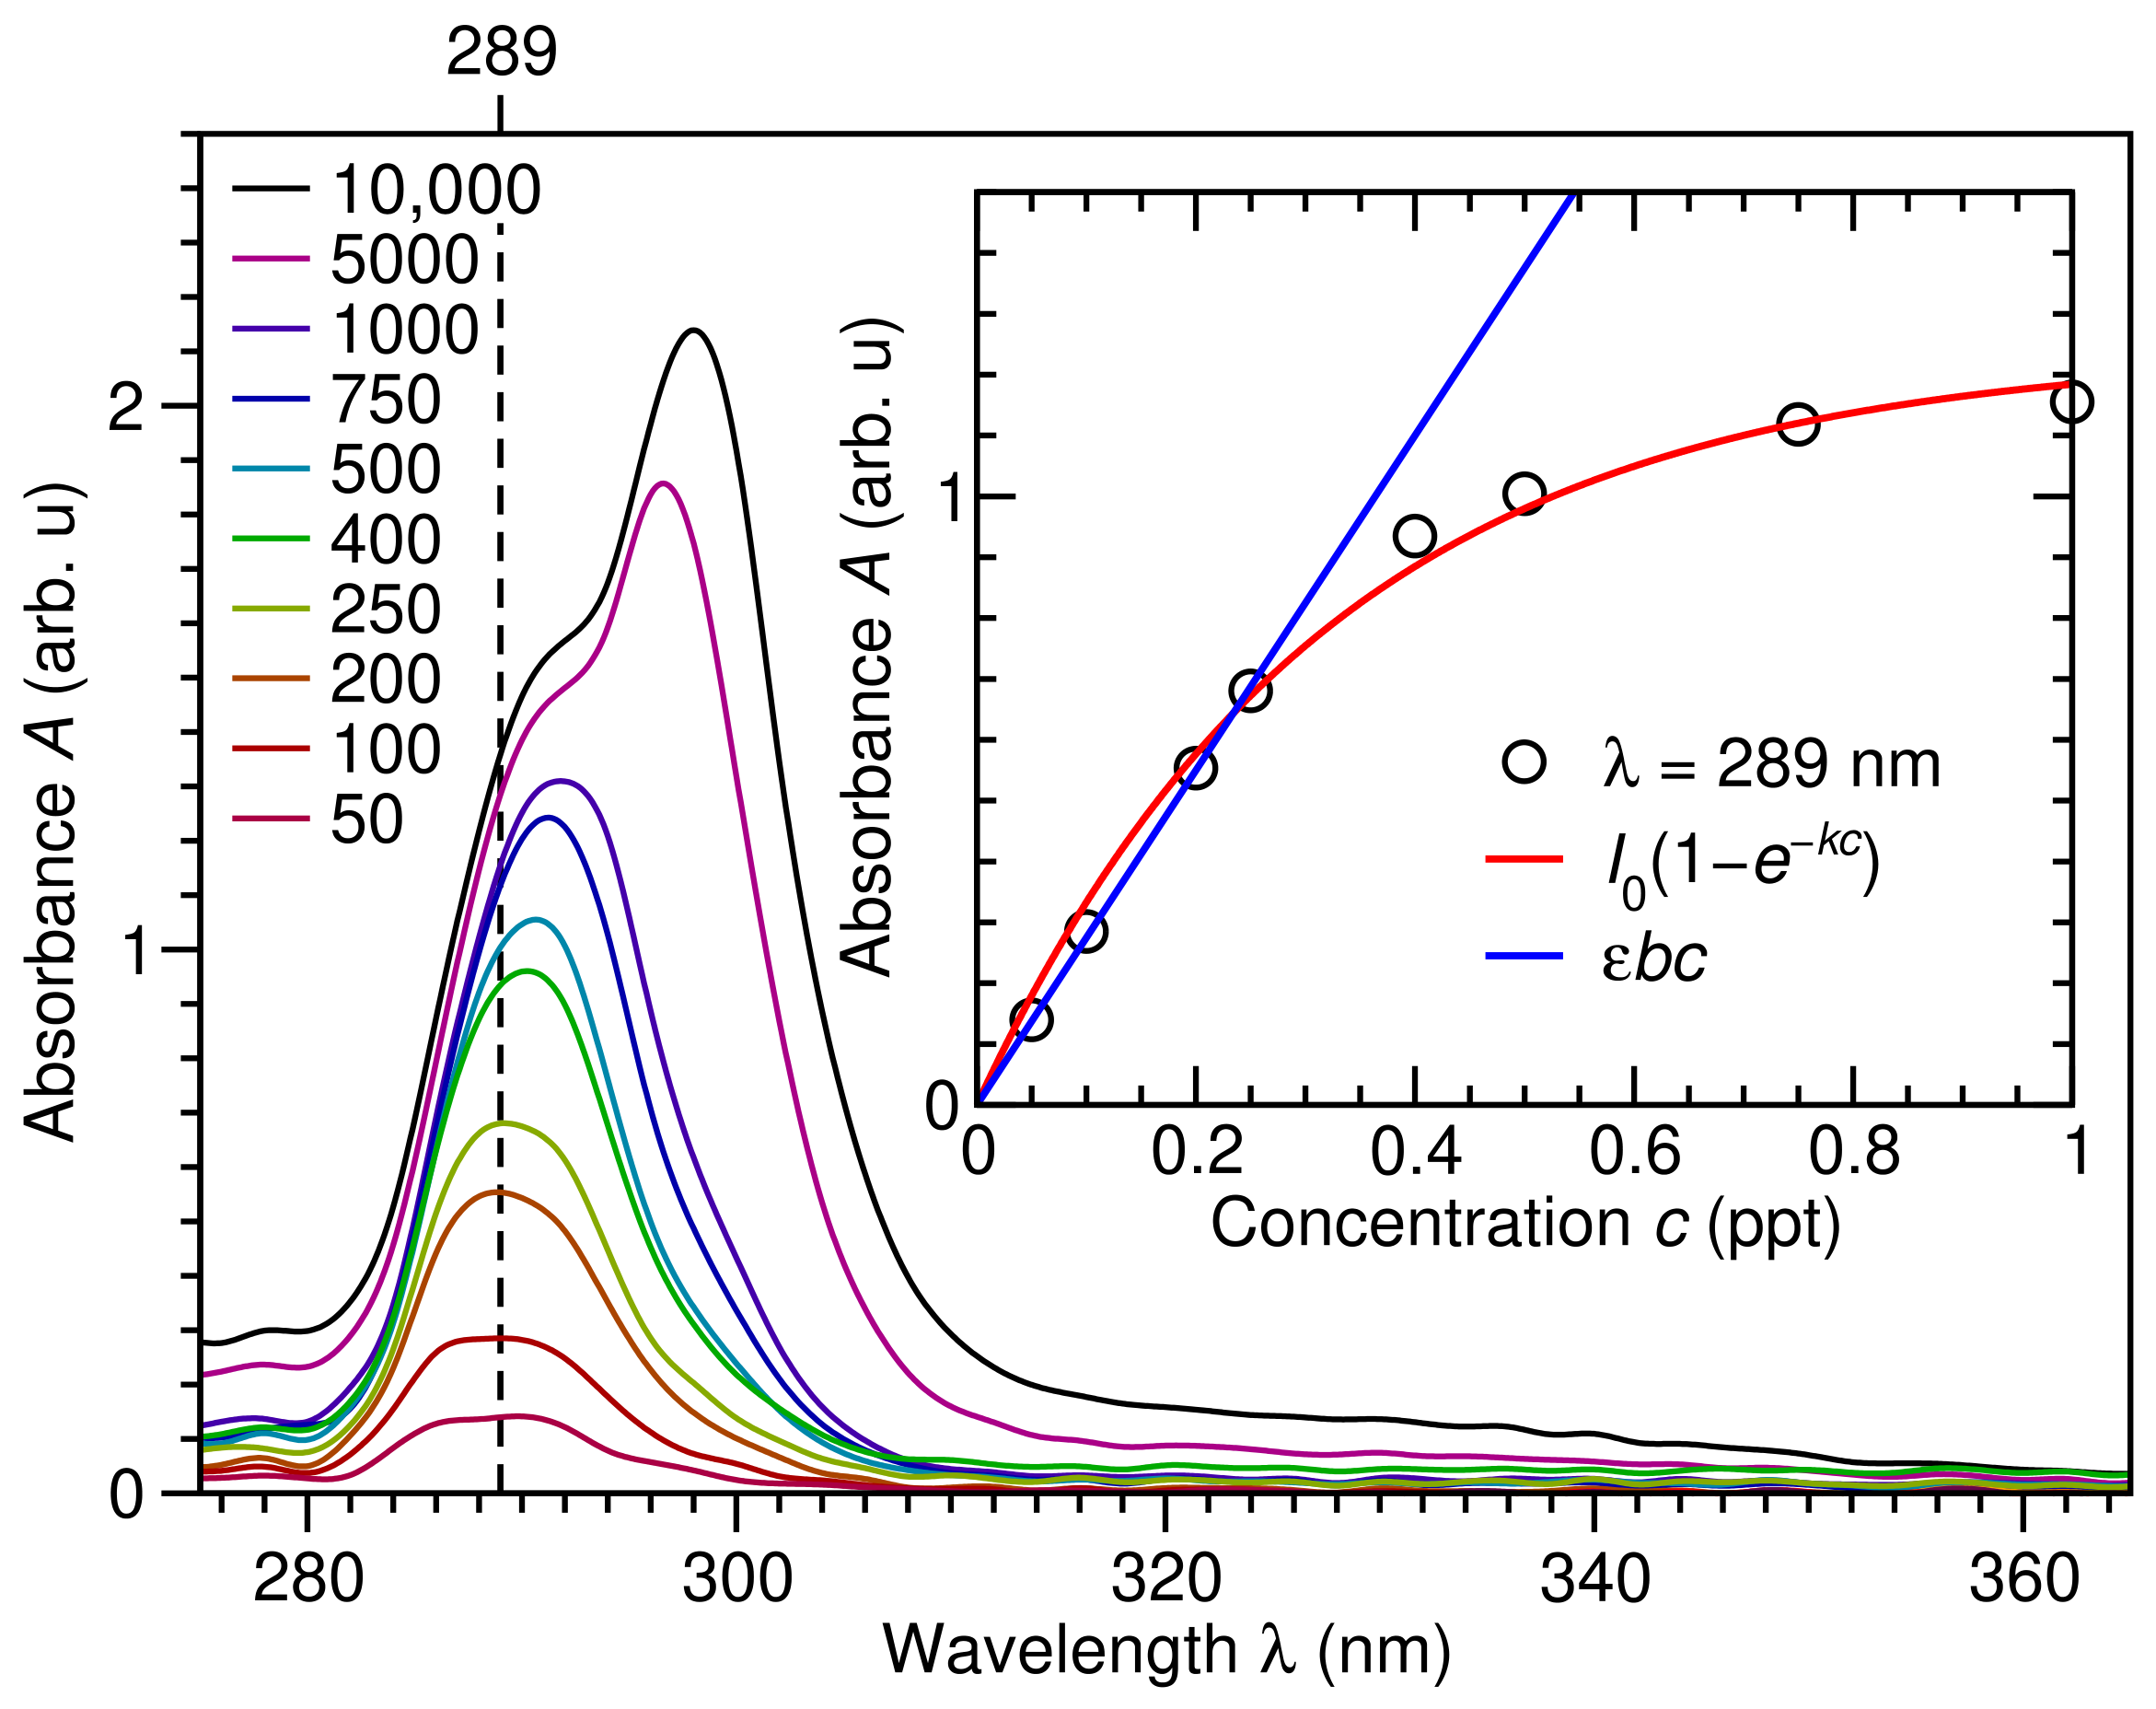
In order to obtain a more quantitative description of the adsorption of PET on CoFe2O4 MNPs, we have first performed UV-Vis absorbance measurements at PET concentrations ranging from 50 to 10,000 ppm to determine a relation between absorbance A and concentration c, as shown in Figure 6. All PET spectra exhibit an absorbance peak in the UV region at nm, which slowly red-shifts to about 298 nm at increasing PET concentrations. The inset to Figure 6 shows how PET absorbance at nm depends on PET concentration c. We find the absorbance exhibits a clear non-linear decaying behavior over the entire concentration range considered, so that , with ppt−1. However, this suggests that for ppt, the absorbance should depend linearly on the concentration, and we recover the Beer–Lambert law . As shown in the inset to Figure 6, this is indeed the case for ppt, with ppt−1. Altogether, this provides a means for quantifying the PET concentration in aqueous solutions based on the absorbance at nm using , where ppt−1.
Figure 6.
Absorbance A versus wavelength in nm of PET at concentrations c of 50 (maroon), 100 (dark red), 200 (orange), 250 (yellow), 400 (green), 500 (cyan), 750 (blue), 1000 (indigo), 5000 (magenta) and 10,000 (black) parts per million (ppm) with nm marked (vertical dashed line) and absorbance versus concentration c in parts per thousand (ppt) at nm (black circles) and fits (red line) where and ppt−1, and the Beer–Lambert law for ppt (blue line) where ppt−1 shown as an inset.
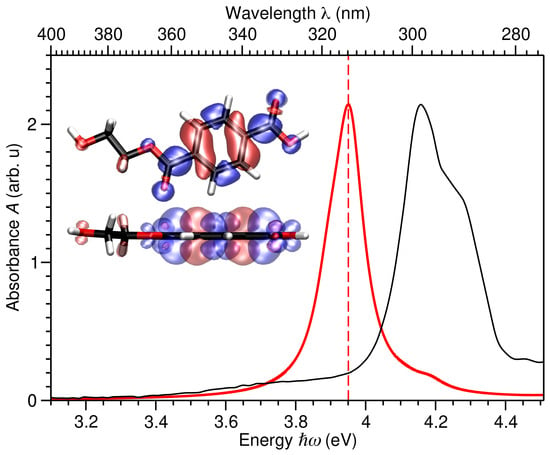
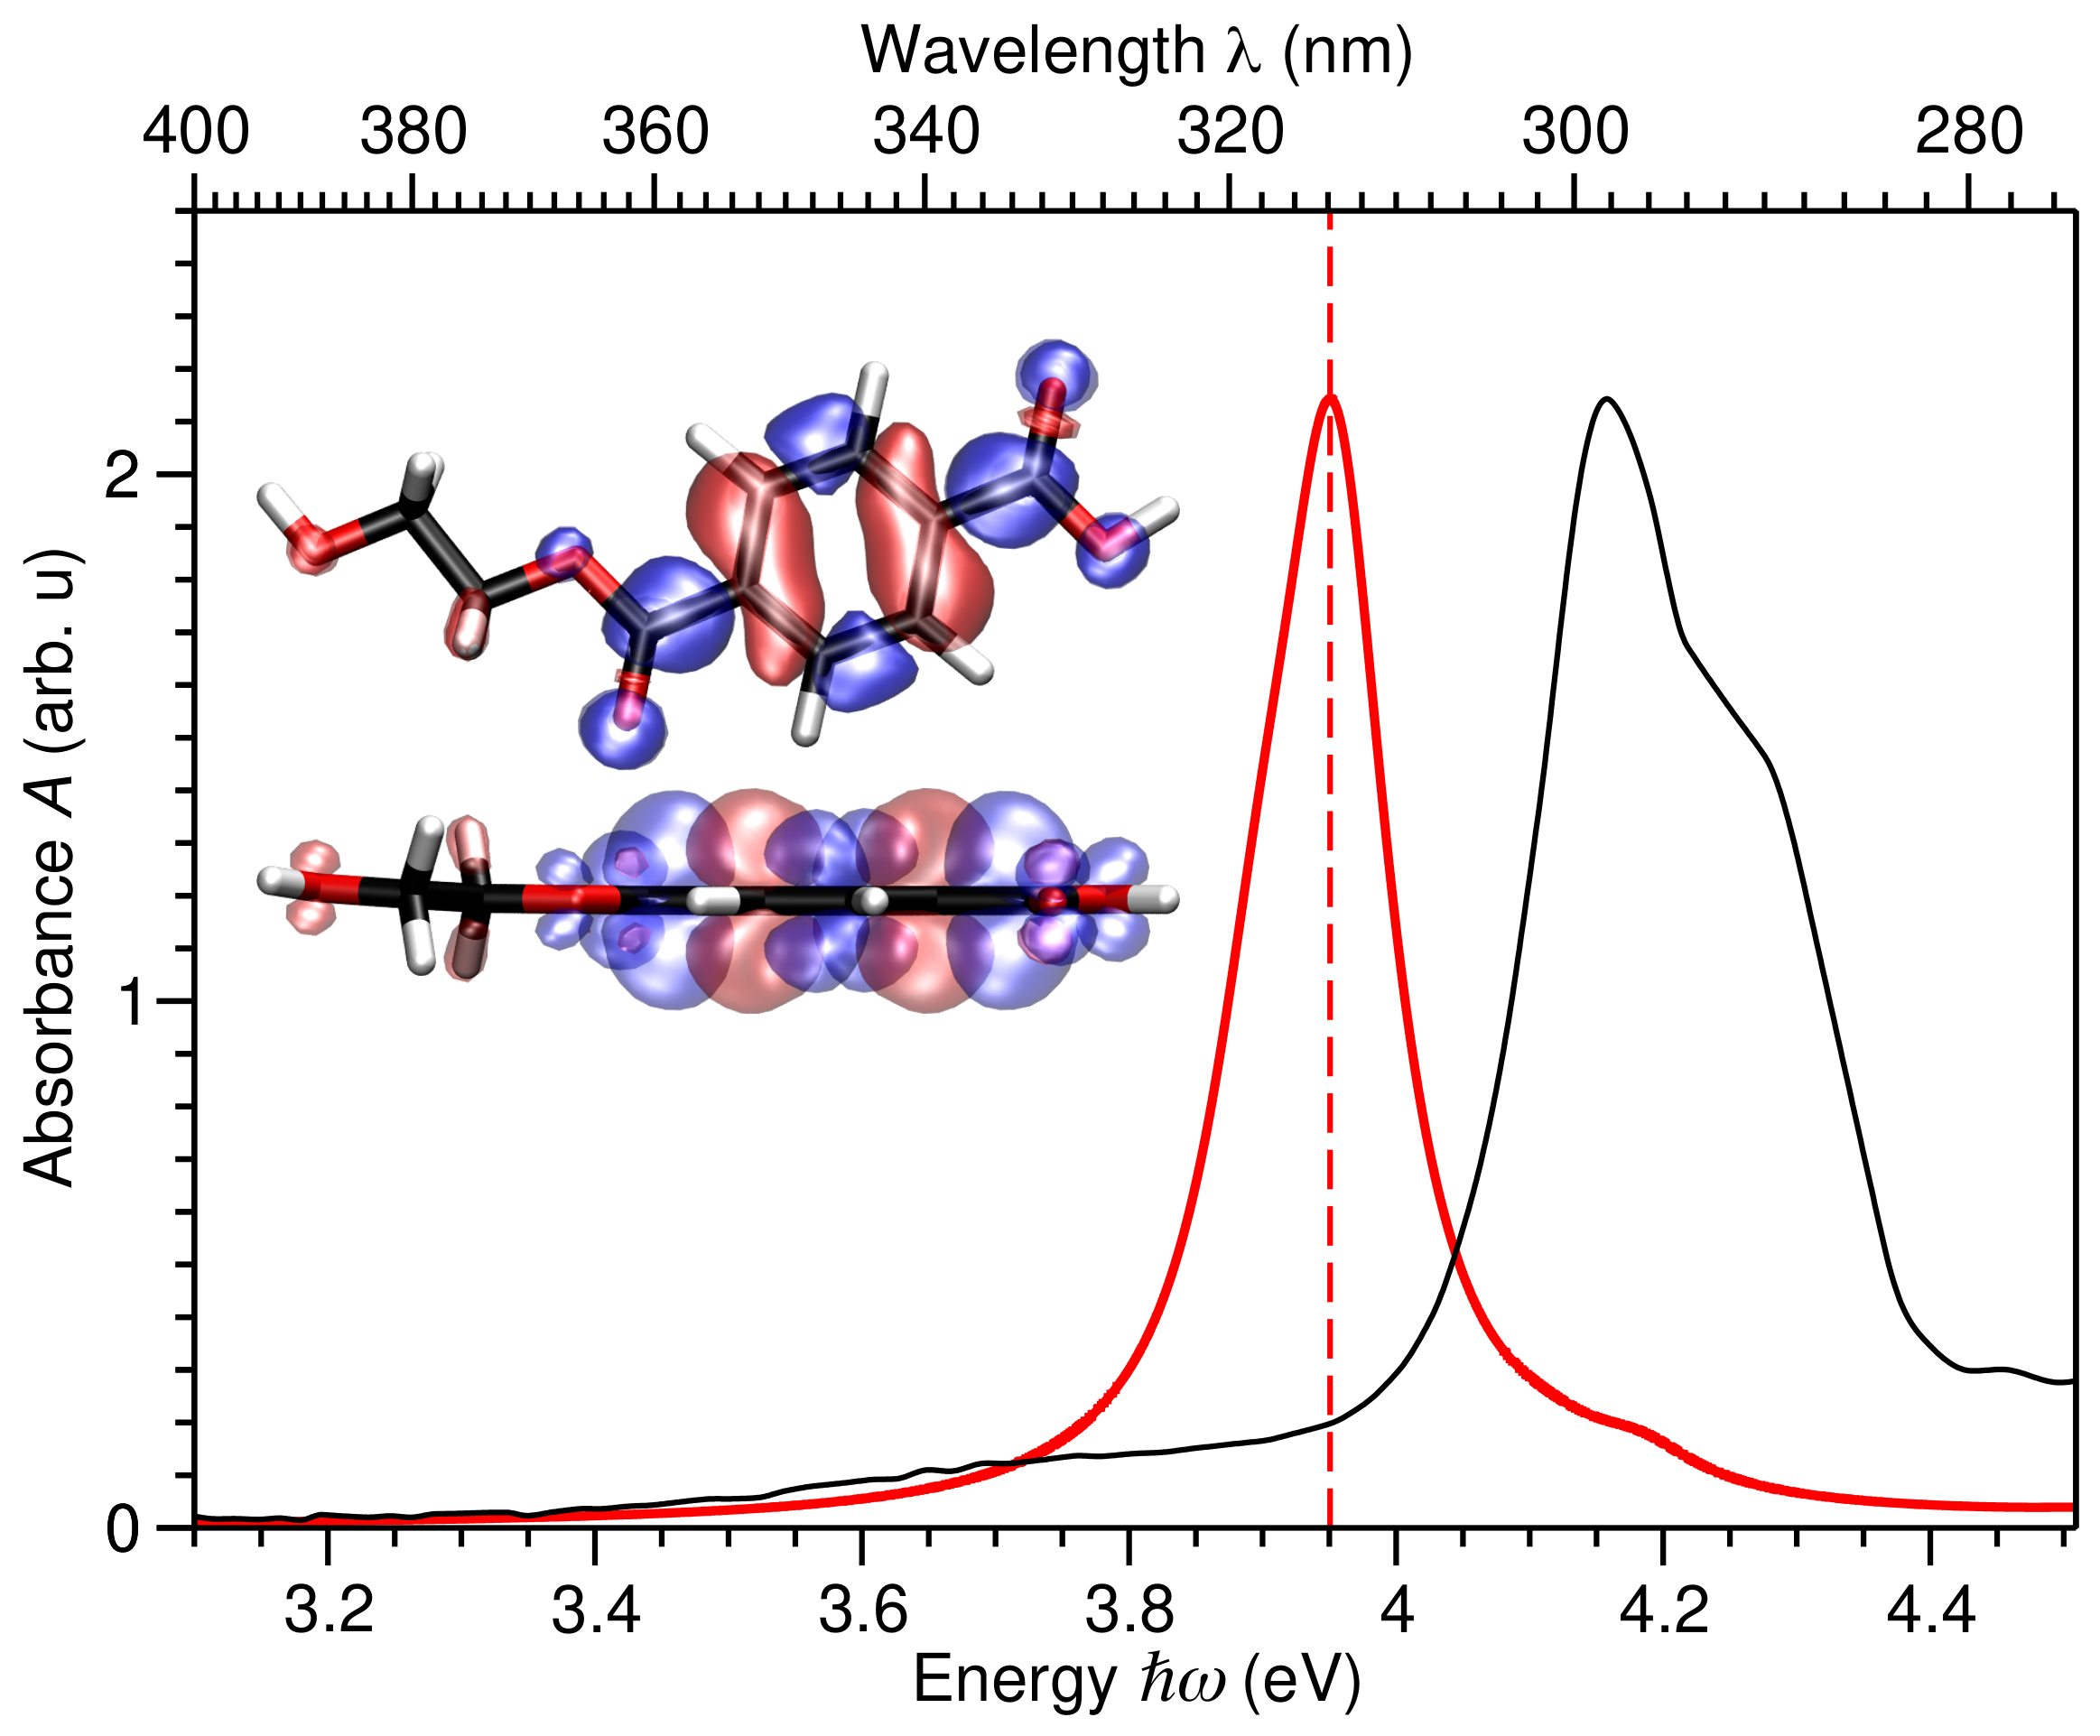
To better understand the nature of this peak in PET’s absorbance, in Figure 7 we compare the LCAO-TDDFT-k- calculated absorbance of PET with that measured at a PET concentration of . The calculated spectrum reproduces the measured UV-Vis spectra qualitatively and semi-quantitatively, only underestimating the main peak position by about 5%. This justifies our use of the calculated electron-hole spectral density difference at 3.95 eV to provide a qualitative description of the measured excitation at nm.
Figure 7.
PET absorbance A versus energy in eV and wavelength in nm calculated with LCAO-TDDFT-k- (thick red) and measured at PET concentration of (thin black). Insets show top and side views of PET’s atomic structure and isosurfaces of the electron-hole spectral density difference in blue/red at 3.95 eV (red dashed line). C, O, and H atoms depicted in black, red, and white, respectively.
As seen in the insets of Figure 7, the electron-hole density difference consists of a hole located in a bonding level of PET’s aromatic ring (red) and an electron located in anti-bonding levels localized on C=C bonds of the aromatic ring and the chain (blue). Altogether, this shows the pronounced absorption band of PET at nm may be attributed to electronic transitions of the aromatic groups of the benzene ring and transitions associated with the ester functionality of PET.
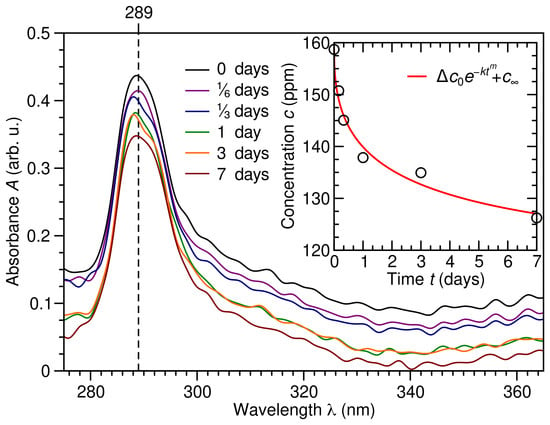
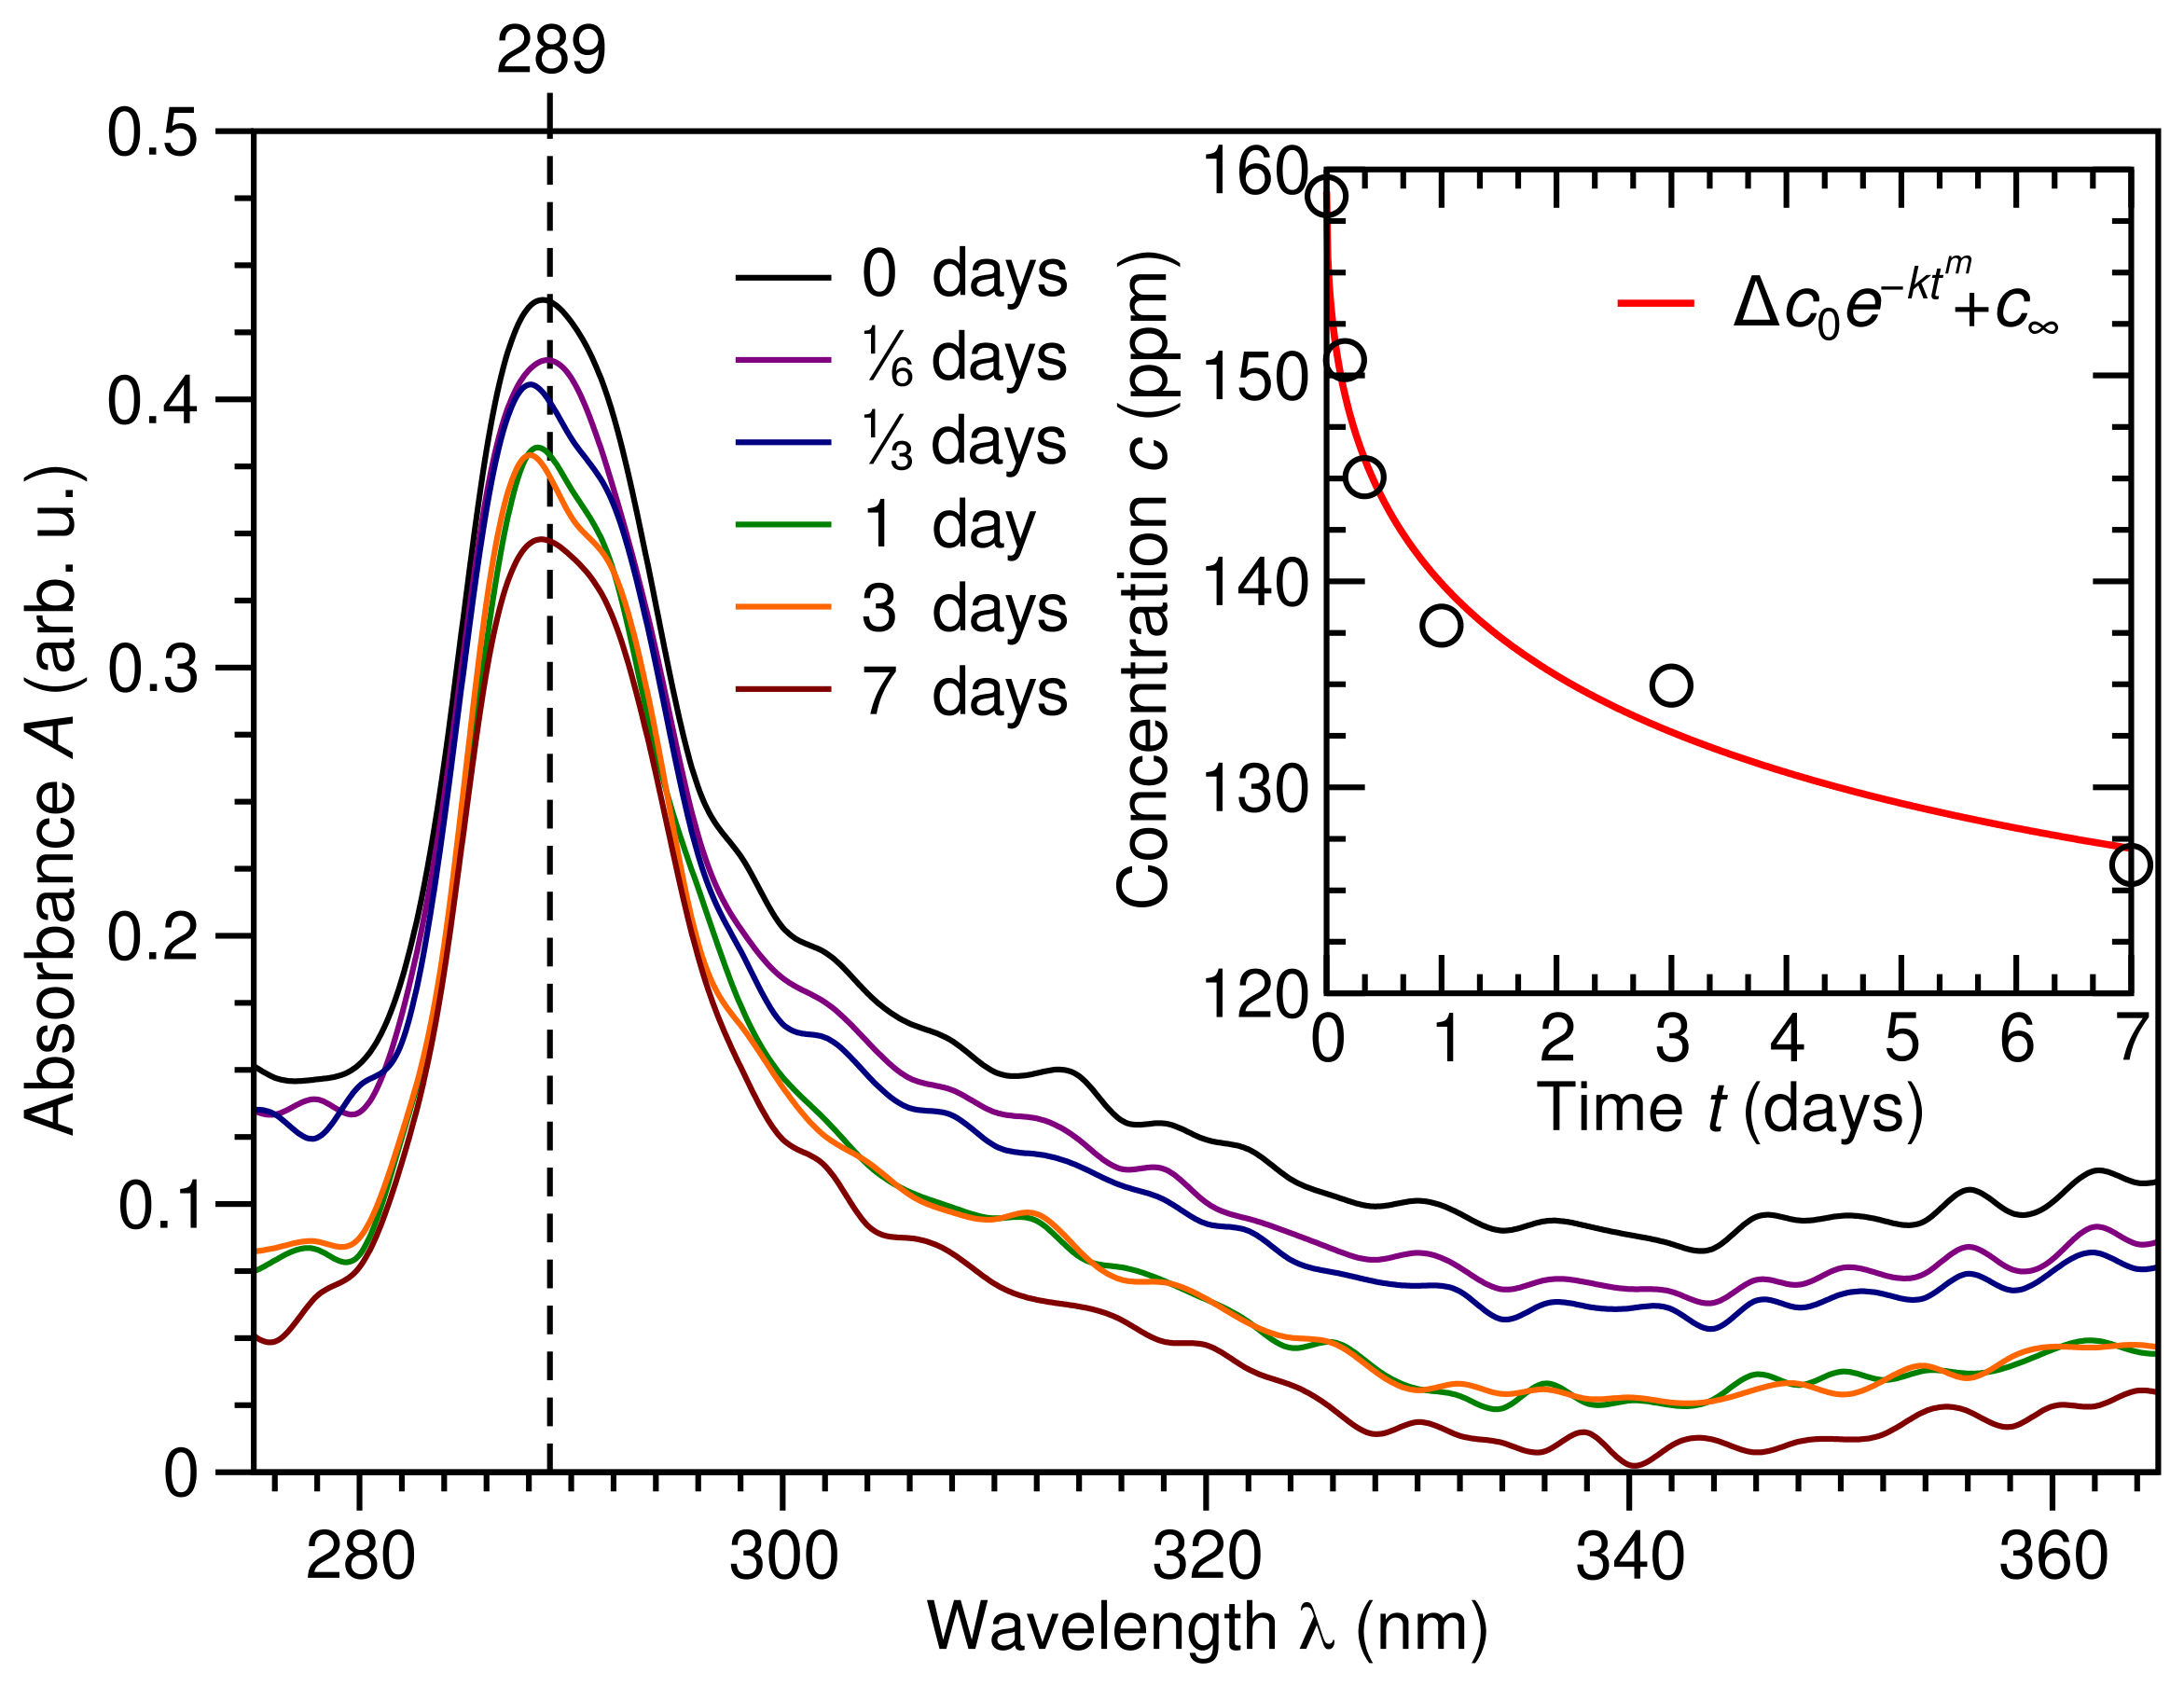
Having calibrated the Beer–Lambert relation between PET absorbance and concentration at nm of ppt in Figure 6, in Figure 8 we show how PET absorbance A, and hence concentration c, change with time after exposure to CoFe2O4 MNPs. By considering PET’s absorbance peak at nm, and employing the Beer–Lambert law, we see in the inset to Figure 8 that PET concentration c decays exponentially with respect to time from ppm to ppm, yielding a fraction of PET adsorbed of . However, accounting for the number of available CoFe2O4 MNP sites, we obtain an estimated PET uptake on OA/OAm capped CoFe2O4 MNPs of ∼57%. Although significant, we need to find ways to optimize this fractional PET adsorption. To do so, we will employ DFT calculations and microkinetic modeling to understand the mechanism of PET adsorption on CoFe2O4 MNPs.
Figure 8.
Absorbance A versus wavelength in nm of PET adsorbed on CoFe2O4 MNPs after 0 (black), ⅙ (indigo), ⅓ (blue), 1 (green), 3 (orange), and 7 (dark red) days, with nm marked (vertical dashed line) and concentration c in parts per million (ppm) versus time t in days obtained from the Beer–Lambert law at nm (black circles), where ppt−1 from Figure 6, and fit (red line), where ppm, , , and ppm provided as an inset.
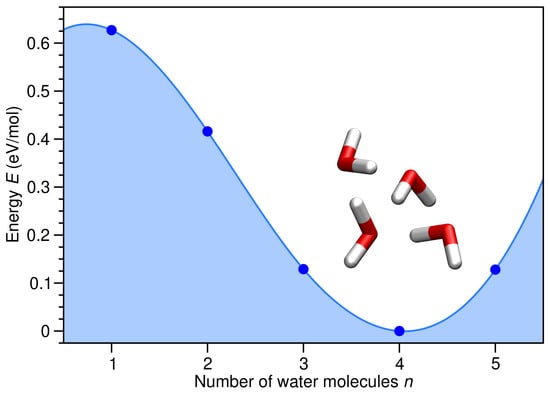
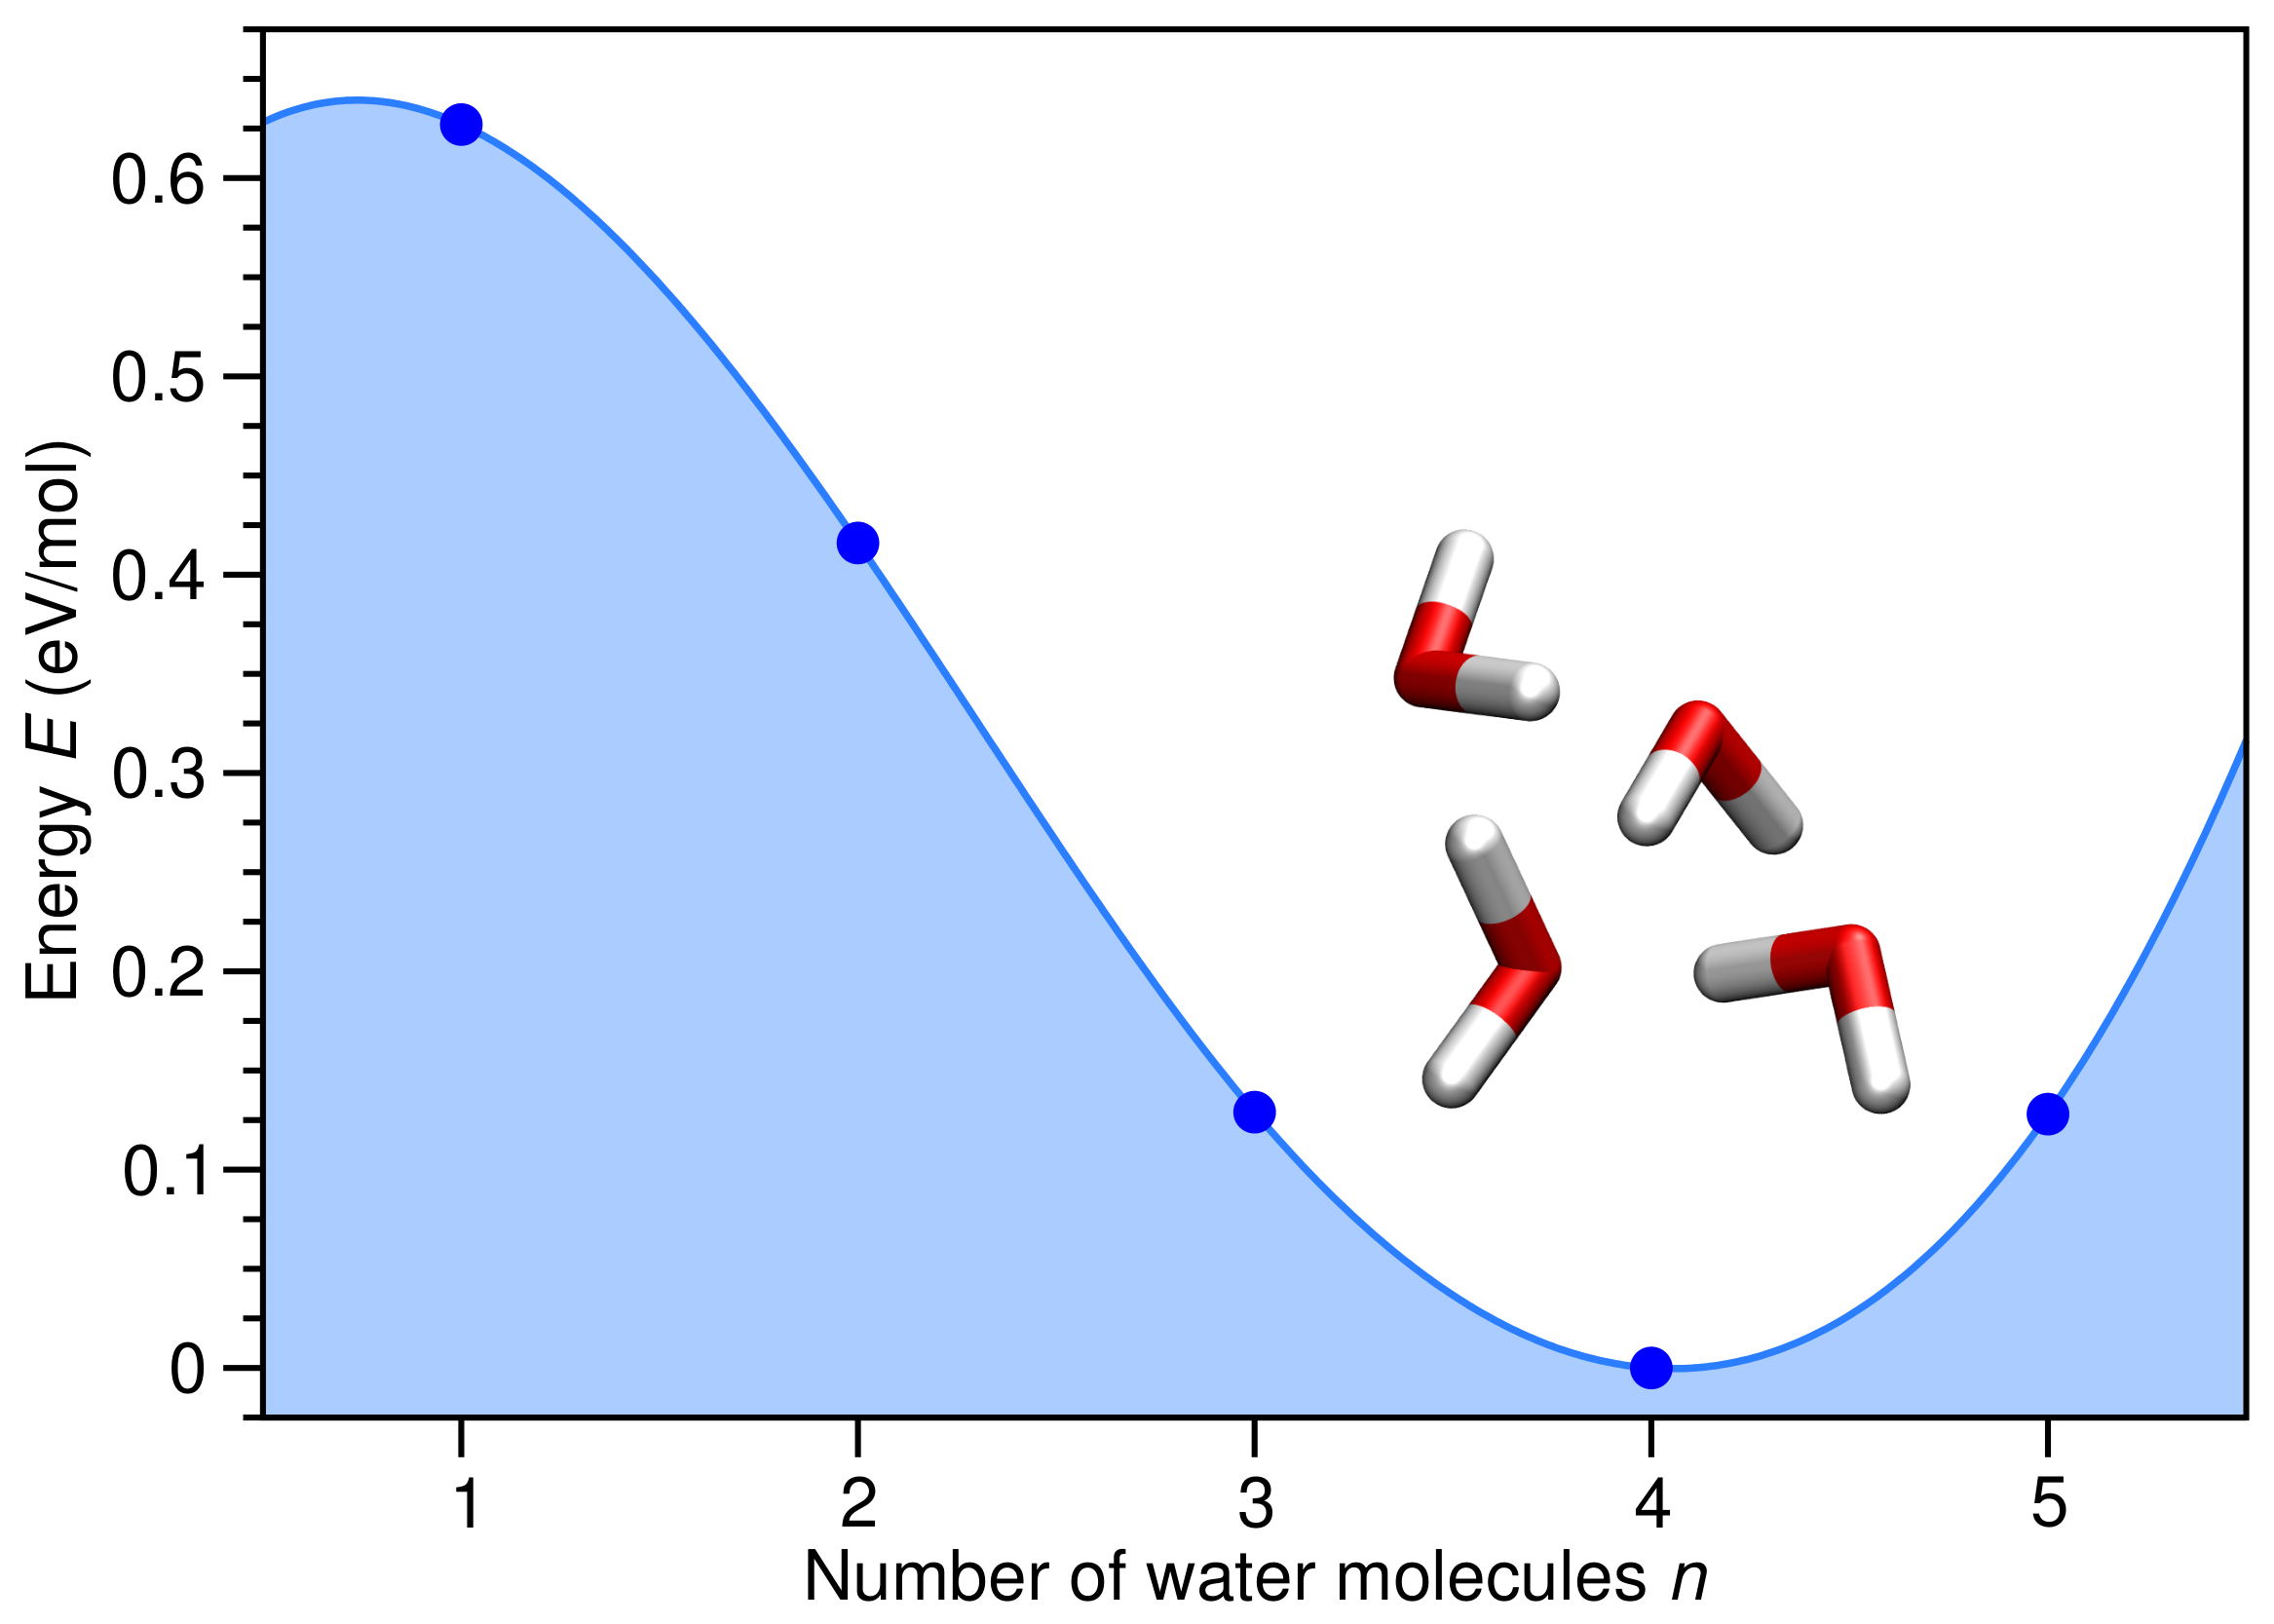
We begin by considering the chemical potential of H2O in the liquid and gas phases. As shown in Figure 9, is about 0.627 eV less stable than , due to the formation of intermolecular O⋯H hydrogen bonds. This substantial difference means the adsorption of H2O on the CoFe2O4 MNP will be much stronger in the gas phase compared with aqueous solution. As a result, drying CoFe2O4 MNPs covered with PET molecules may lead to their replacement by water.
Figure 9.
H2O energy E relative to four H2O molecules, , in eV per H2O molecule (blue filled circles) versus number of H2O molecules n. Relaxed atomic structure for four H2O molecules provided as an inset, with O and H atoms depicted in red and white, respectively.
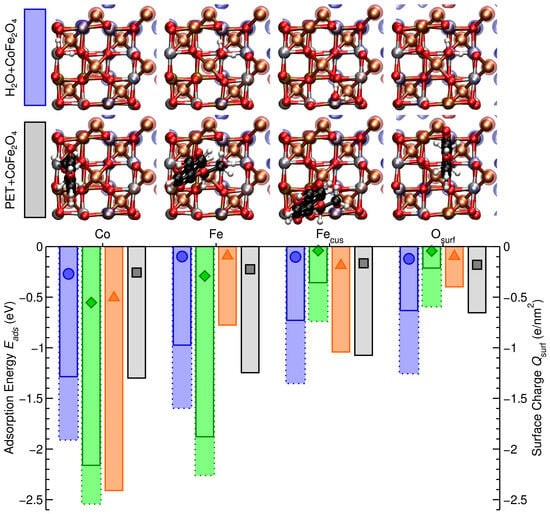
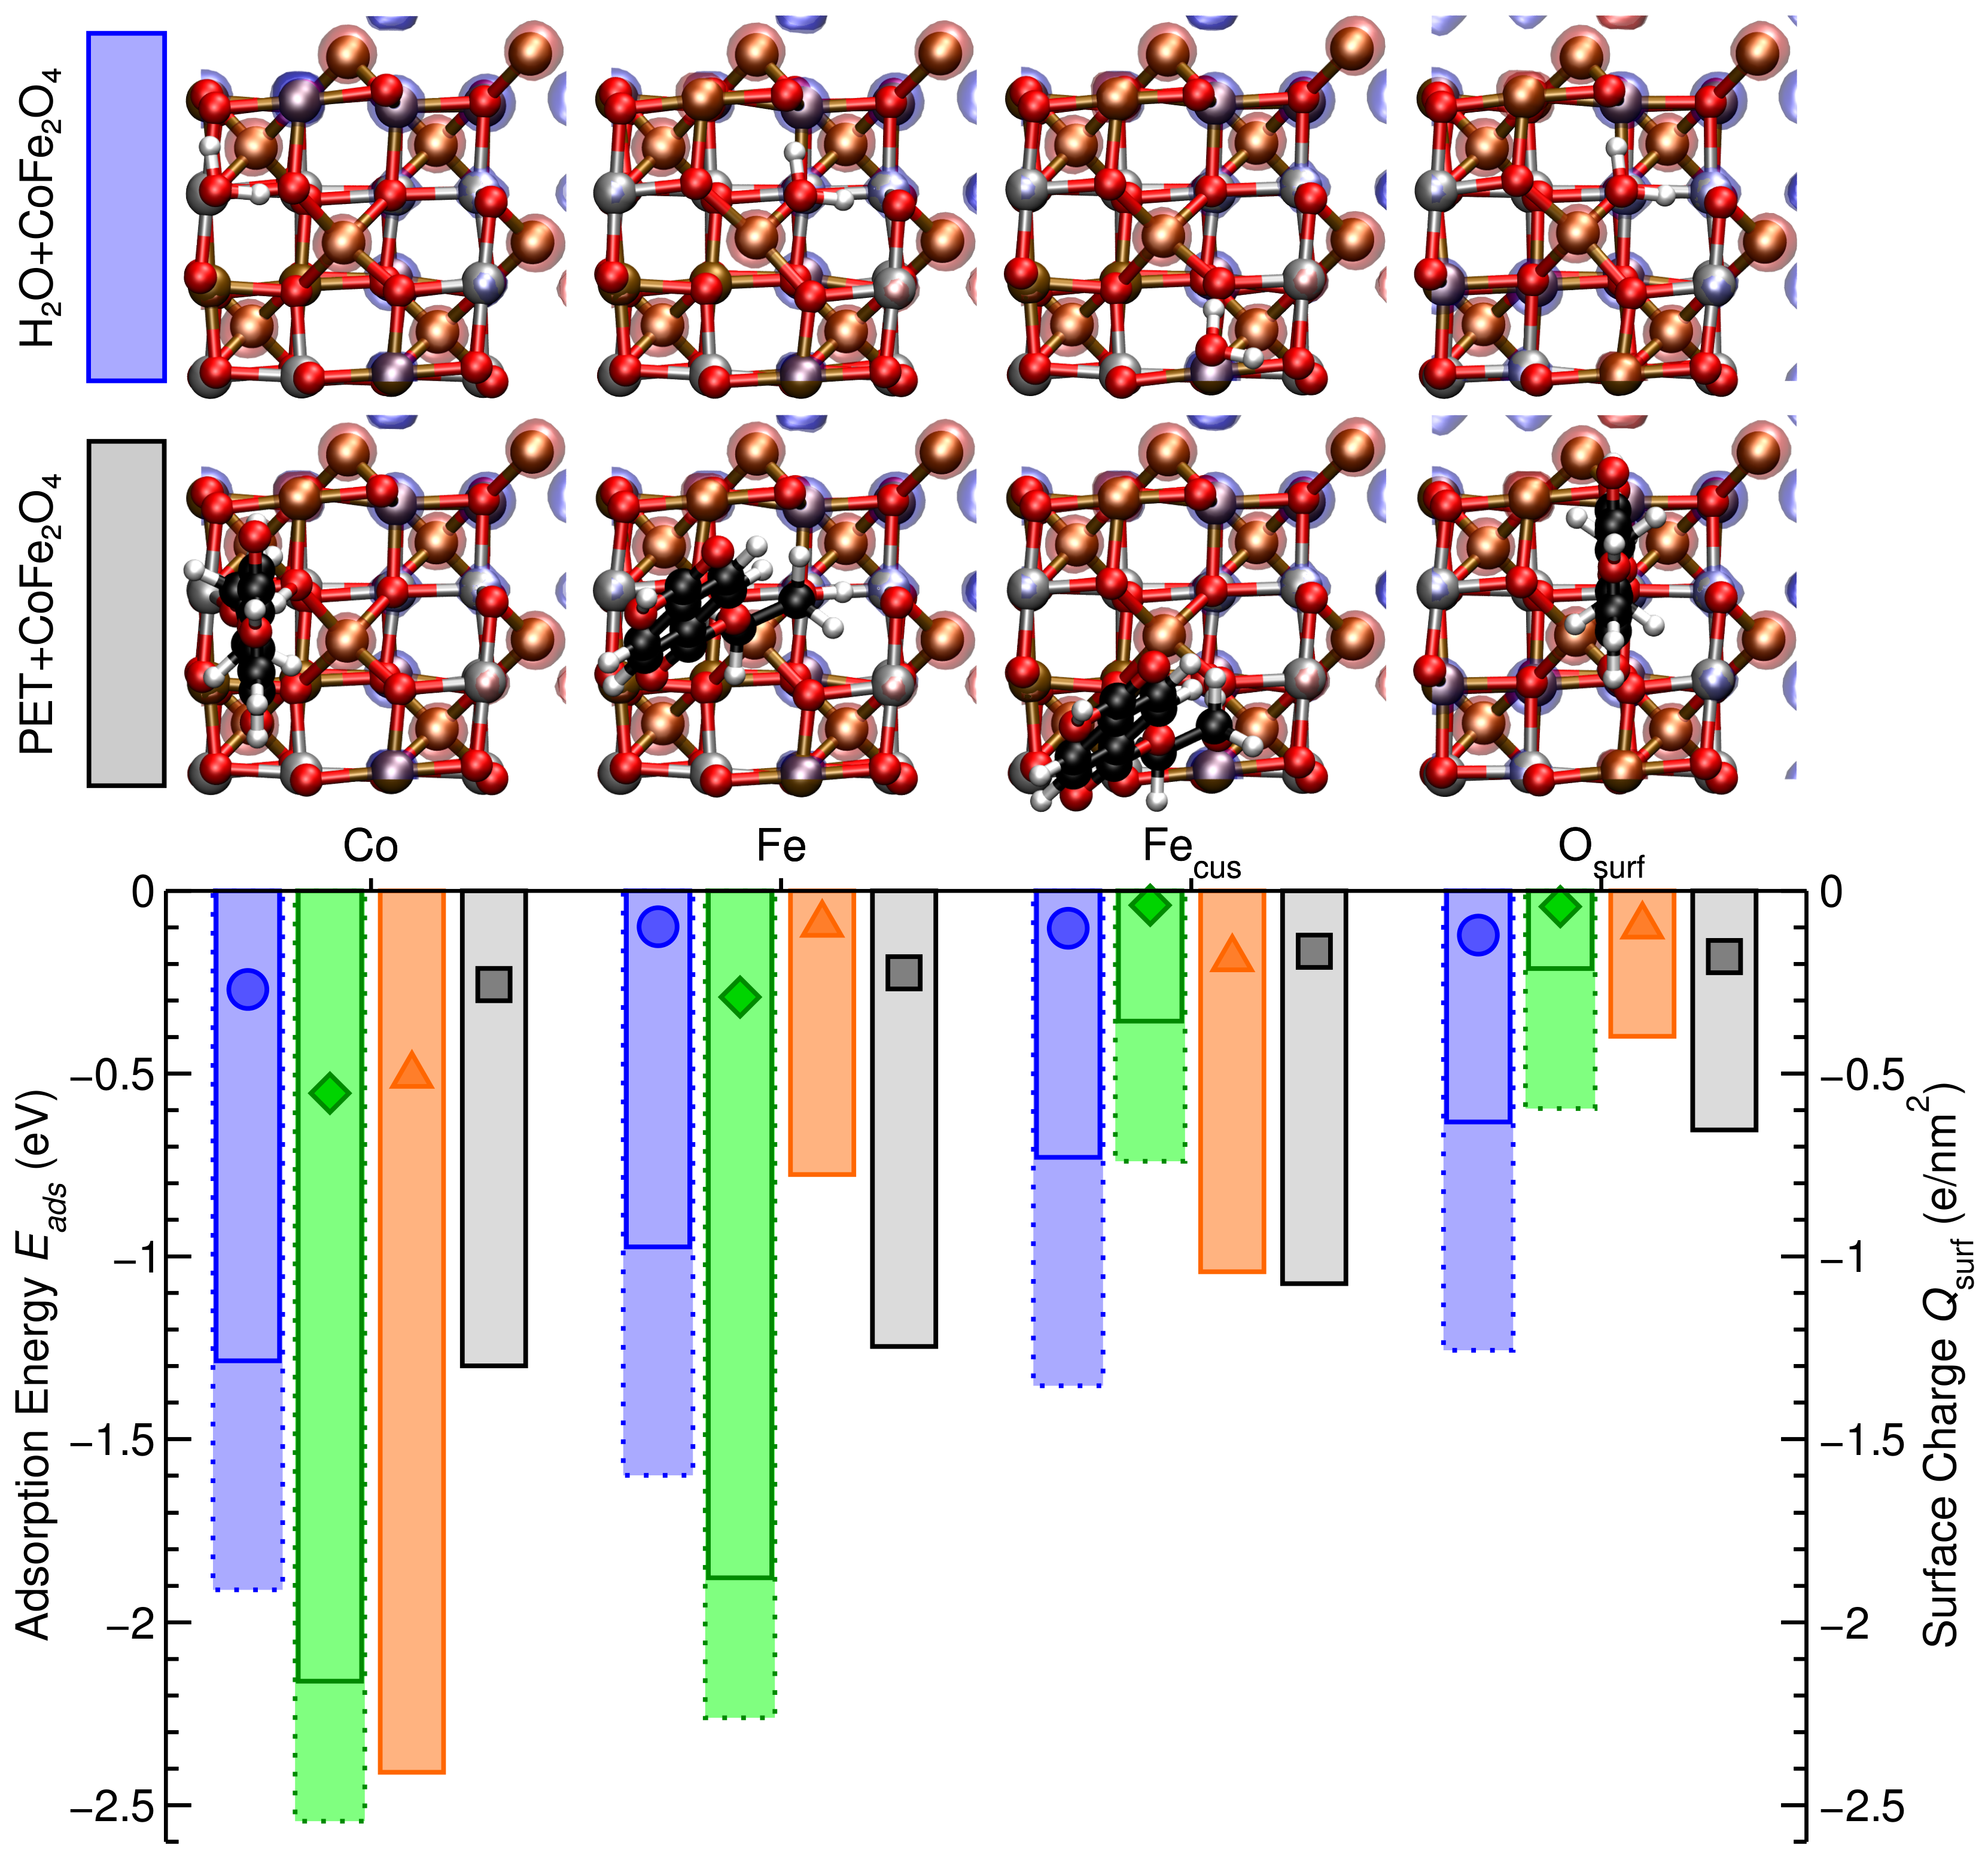
In order to determine whether this is indeed the case, in Figure 10 we compare the adsorption energies of , , OA, OAm, and on Co, Fe, Fecus, and Osurf of the CoFe2O4(001) surface, as depicted in Figure 10. For both the strongest-binding Co site and the weakest-binding Osurf site, we find PET and adsorption are isoenergetic on CoFe2O4 MNPs. However, on both the Fe and Fecus sites PET binds significantly stronger than , with and eV, respectively. This suggests PET should adsorb preferentially on Fe sites of the CoFe2O4(001) surface in aqueous solution. In contrast, for each adsorption site PET binds significantly weaker than , suggesting adsorbed PET will be replaced by H2O when the CoFe2O4 MNPs are placed in air.
Figure 10.
Adsorption energy in eV (bars) from aqueous solution (solid lines) or gas phase (dotted lines) and surface charge in e/nm2 (symbols) of water (H2O, blue, circles), OA (C3O2H5, green, diamonds), OAm (C2NH7, orange, triangles), and PET (C10O5H10, black, squares) on Co, Fe, Fecus, and Osurf sites of the CoFe2O4 (001) surface, as shown above. Co, Fe, O, H, and C atoms are shown in silver, ochre, red, white, and black, respectively. Isosurfaces of spin up (↑ red) and down (↓ blue) channels are shown.
To understand how the presence of organic dispersing agents affects PET adsorption on CoFe2O4 MNPs, we also provide adsorption energies for OA and OAm in Figure 10. On both Co and Fe sites, we find propanoic acid’s OH group spontaneously dissociates upon adsorption, with the H atom transferred to an Osurf site, and C3O2H5’s two O atoms both adsorbing on Co or Fe sites of the CoFe2O4 (001) surface. For this reason, OA binds much more strongly than PET to the Co and Fe sites of the CoFe2O4 (001) surface. In contrast, on both Fecus and Osurf sites, propanoic acid remains intact and binds significantly weaker than PET. This suggests OA dispersing agents would cover both Co and Fe sites, while leaving Fecus and Osurf available for PET adsorption. Although ethylenamine remains intact upon adsorption on each site of the CoFe2O4 (001) surface, we find OAm binds significantly more strongly than OA, PET, or H2O on Co sites, binds significantly more weakly than PET on both Fe and Osurf sites, but is isoenergetic to PET on Fecus sites, with eV. Altogether, this suggests that, when taking OA/OAm dispersing agents into account, PET adsorption is primarily on Fecus sites of CoFe2O4 MNPs, competes with OAm adsorption on the same sites, and all other sites are covered by H2O molecules.
Figure 10 also shows the spatial distribution of magnetic moments via the spin-resolved electron density difference for both H2O and PET adsorbed on each site of the CoFe2O4 (001) surface. Interestingly, we see in each case that the magnetic moment of the Co and Fe atoms remains relatively unchanged upon molecular adsorption. This is significant as it suggests the magnetism of the CoFe2O4 MNPs is robust against molecular adsorption, an essential requirement for CoFe2O4 MNPs to be successfully employed for microplastic removal.
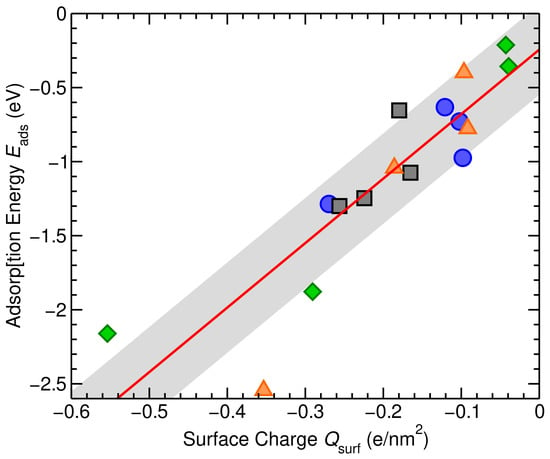
Finally, Figure 10 also provides the surface charge in e/nm2 of the CoFe2O4 (001) surface upon H2O, OA, OAm, and PET adsorption. In each case, we find the adsorbate transfers charge to the surface, with a greater charge transfer typically resulting in a stronger binding to the surface.
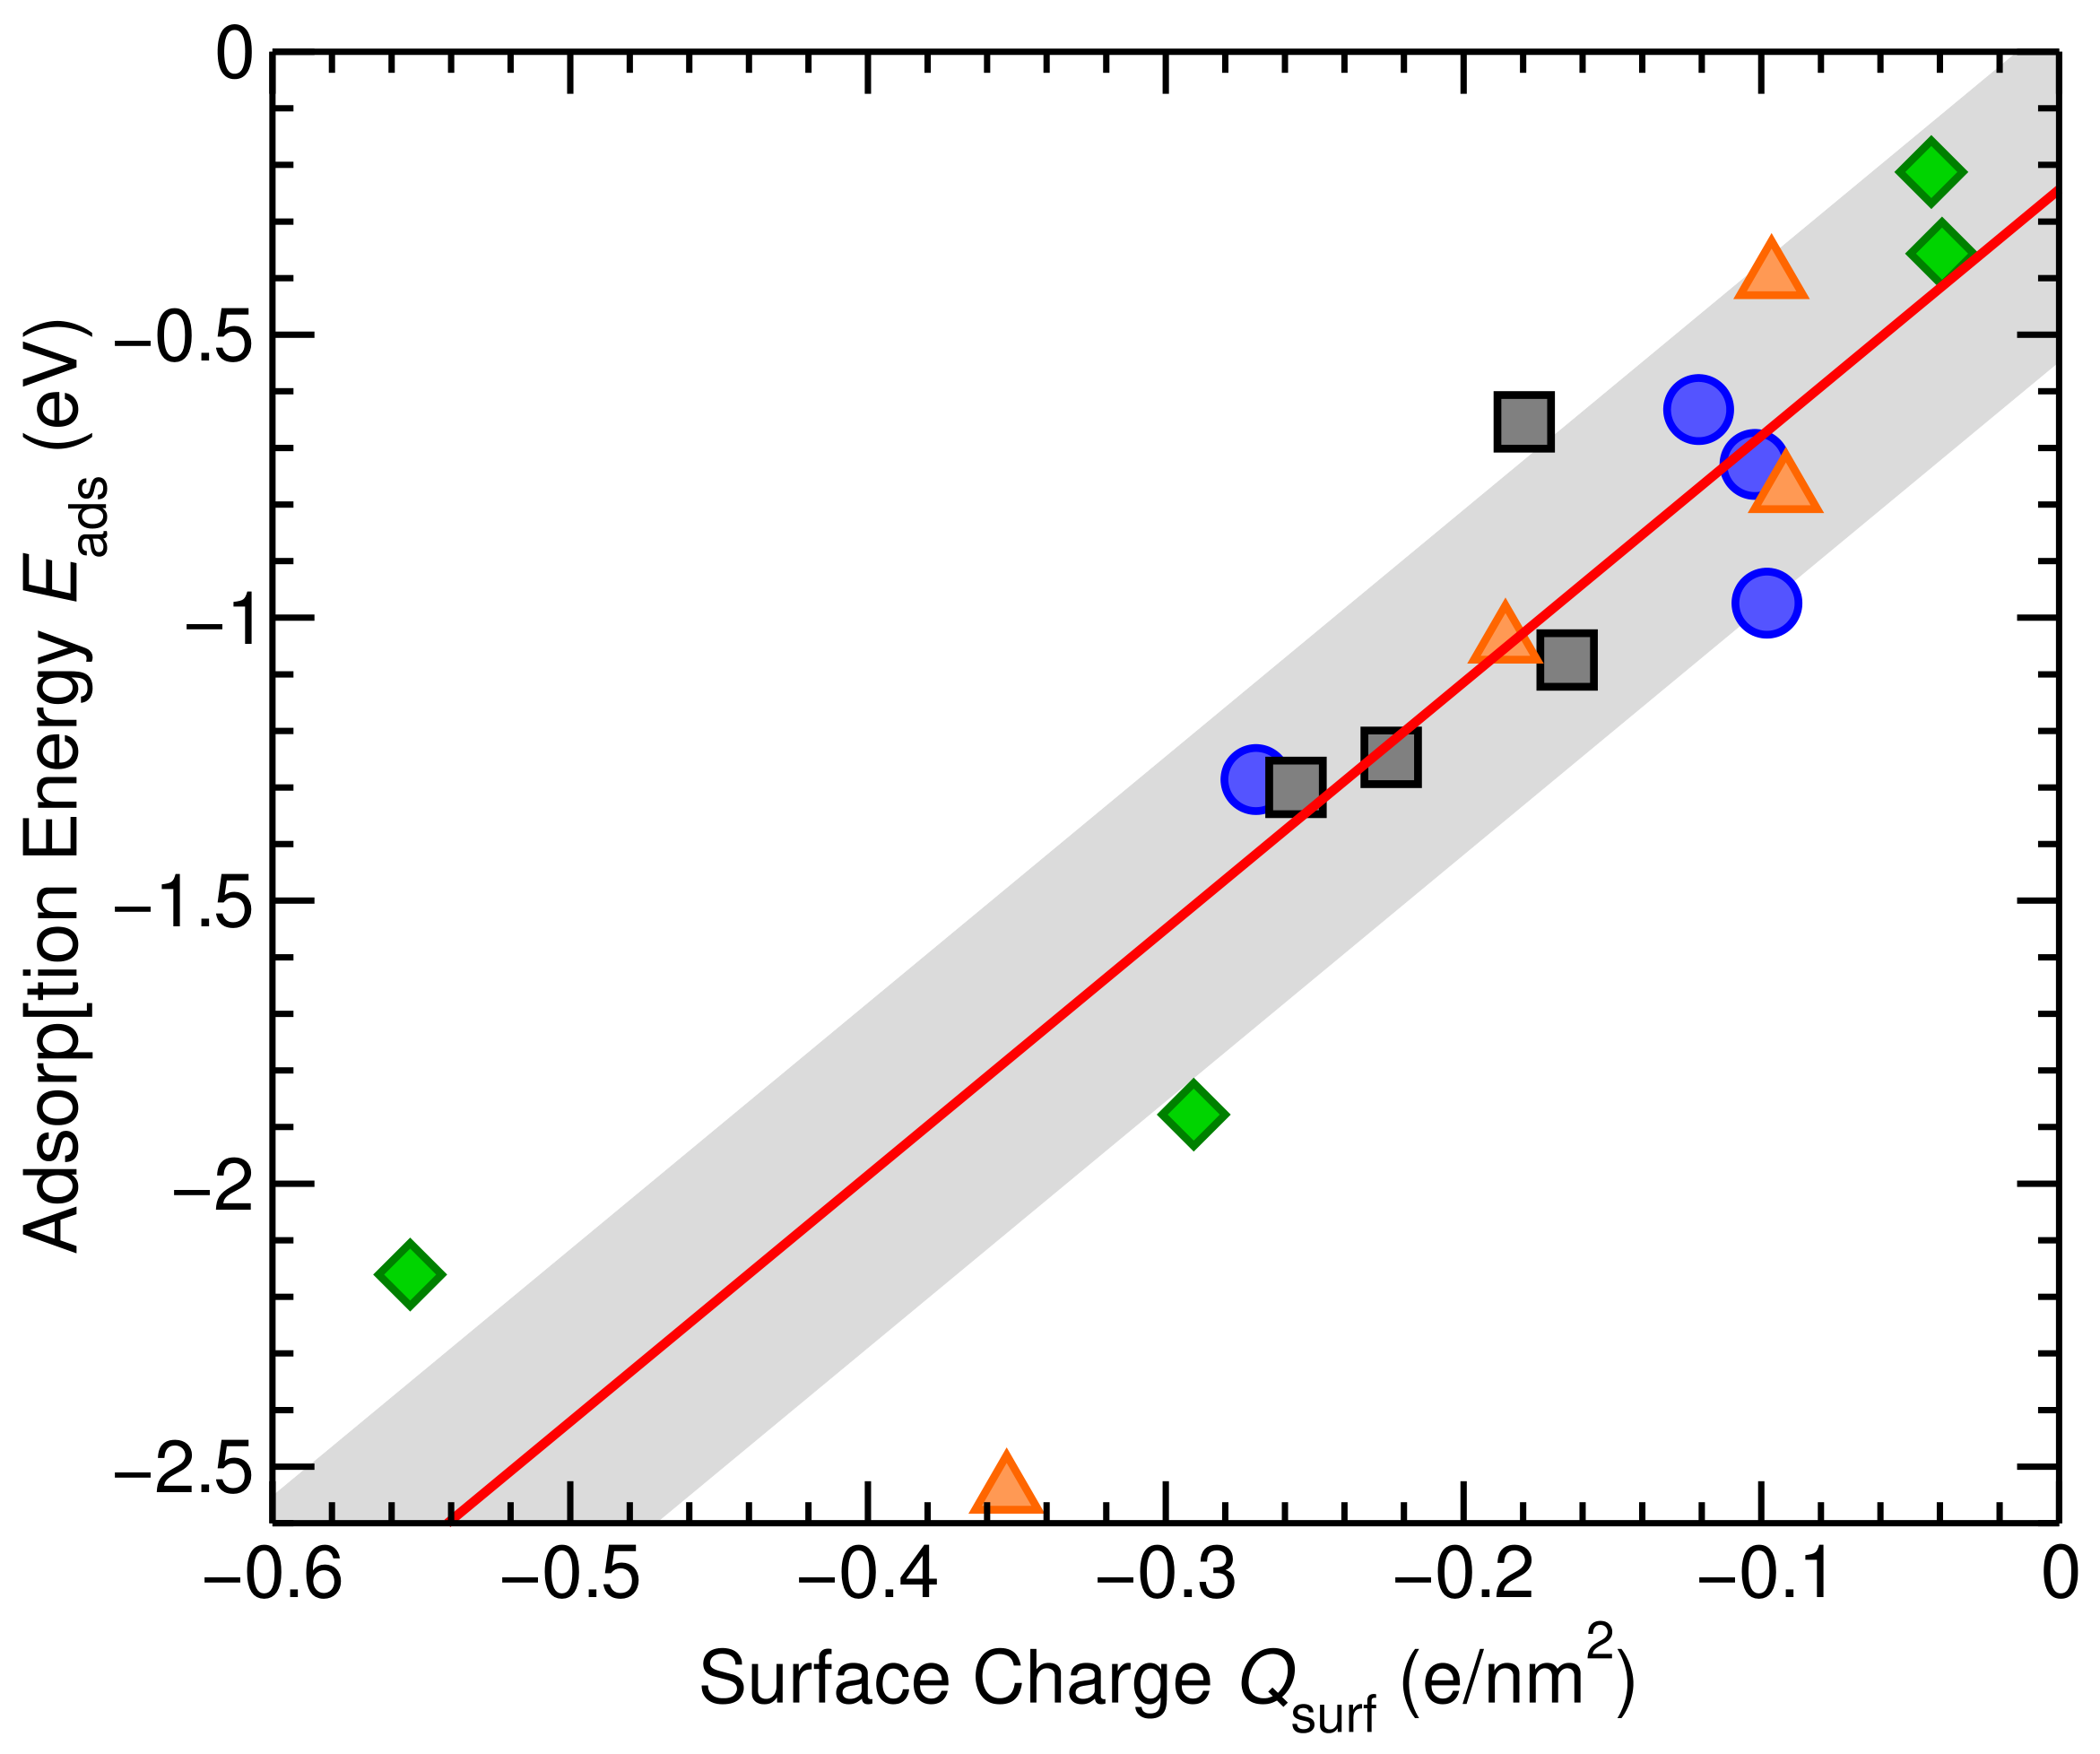
Figure 11 demonstrates the correlation between adsorption energy and charge transfer to the surface for H2O, OA, OAm, and PET on Co, Fe, Fecus, and Osurf sites of the CoFe2O4 (001) surface. Performing a linear fit, we find eV, with a correlation coefficient of , and a standard deviation of eV. Altogether, this clearly demonstrates that the mechanism of molecular adsorption on the CoFe2O4 (001) surface is via charge transfer from adsorbate to surface, as also suggested by our XPS measurements.
Figure 11.
Adsorption energy in eV versus surface charge in e/nm2 for water (H2O, blue circles), OA (C3O2H5, green diamonds), OAm (C2NH7, orange triangles), and PET (C10O5H10, black squares) on Co, Fe, Fecus, and Osurf sites of the CoFe2O4 (001) surface, and linear fit eV (red line, ) with a standard deviation eV (grey region).
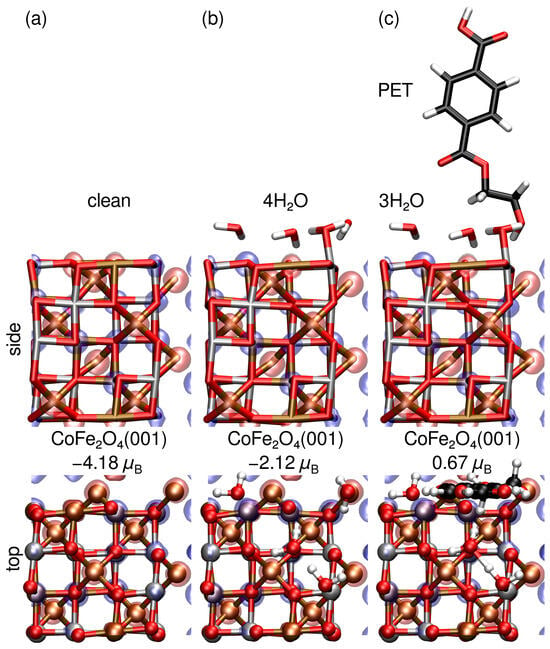
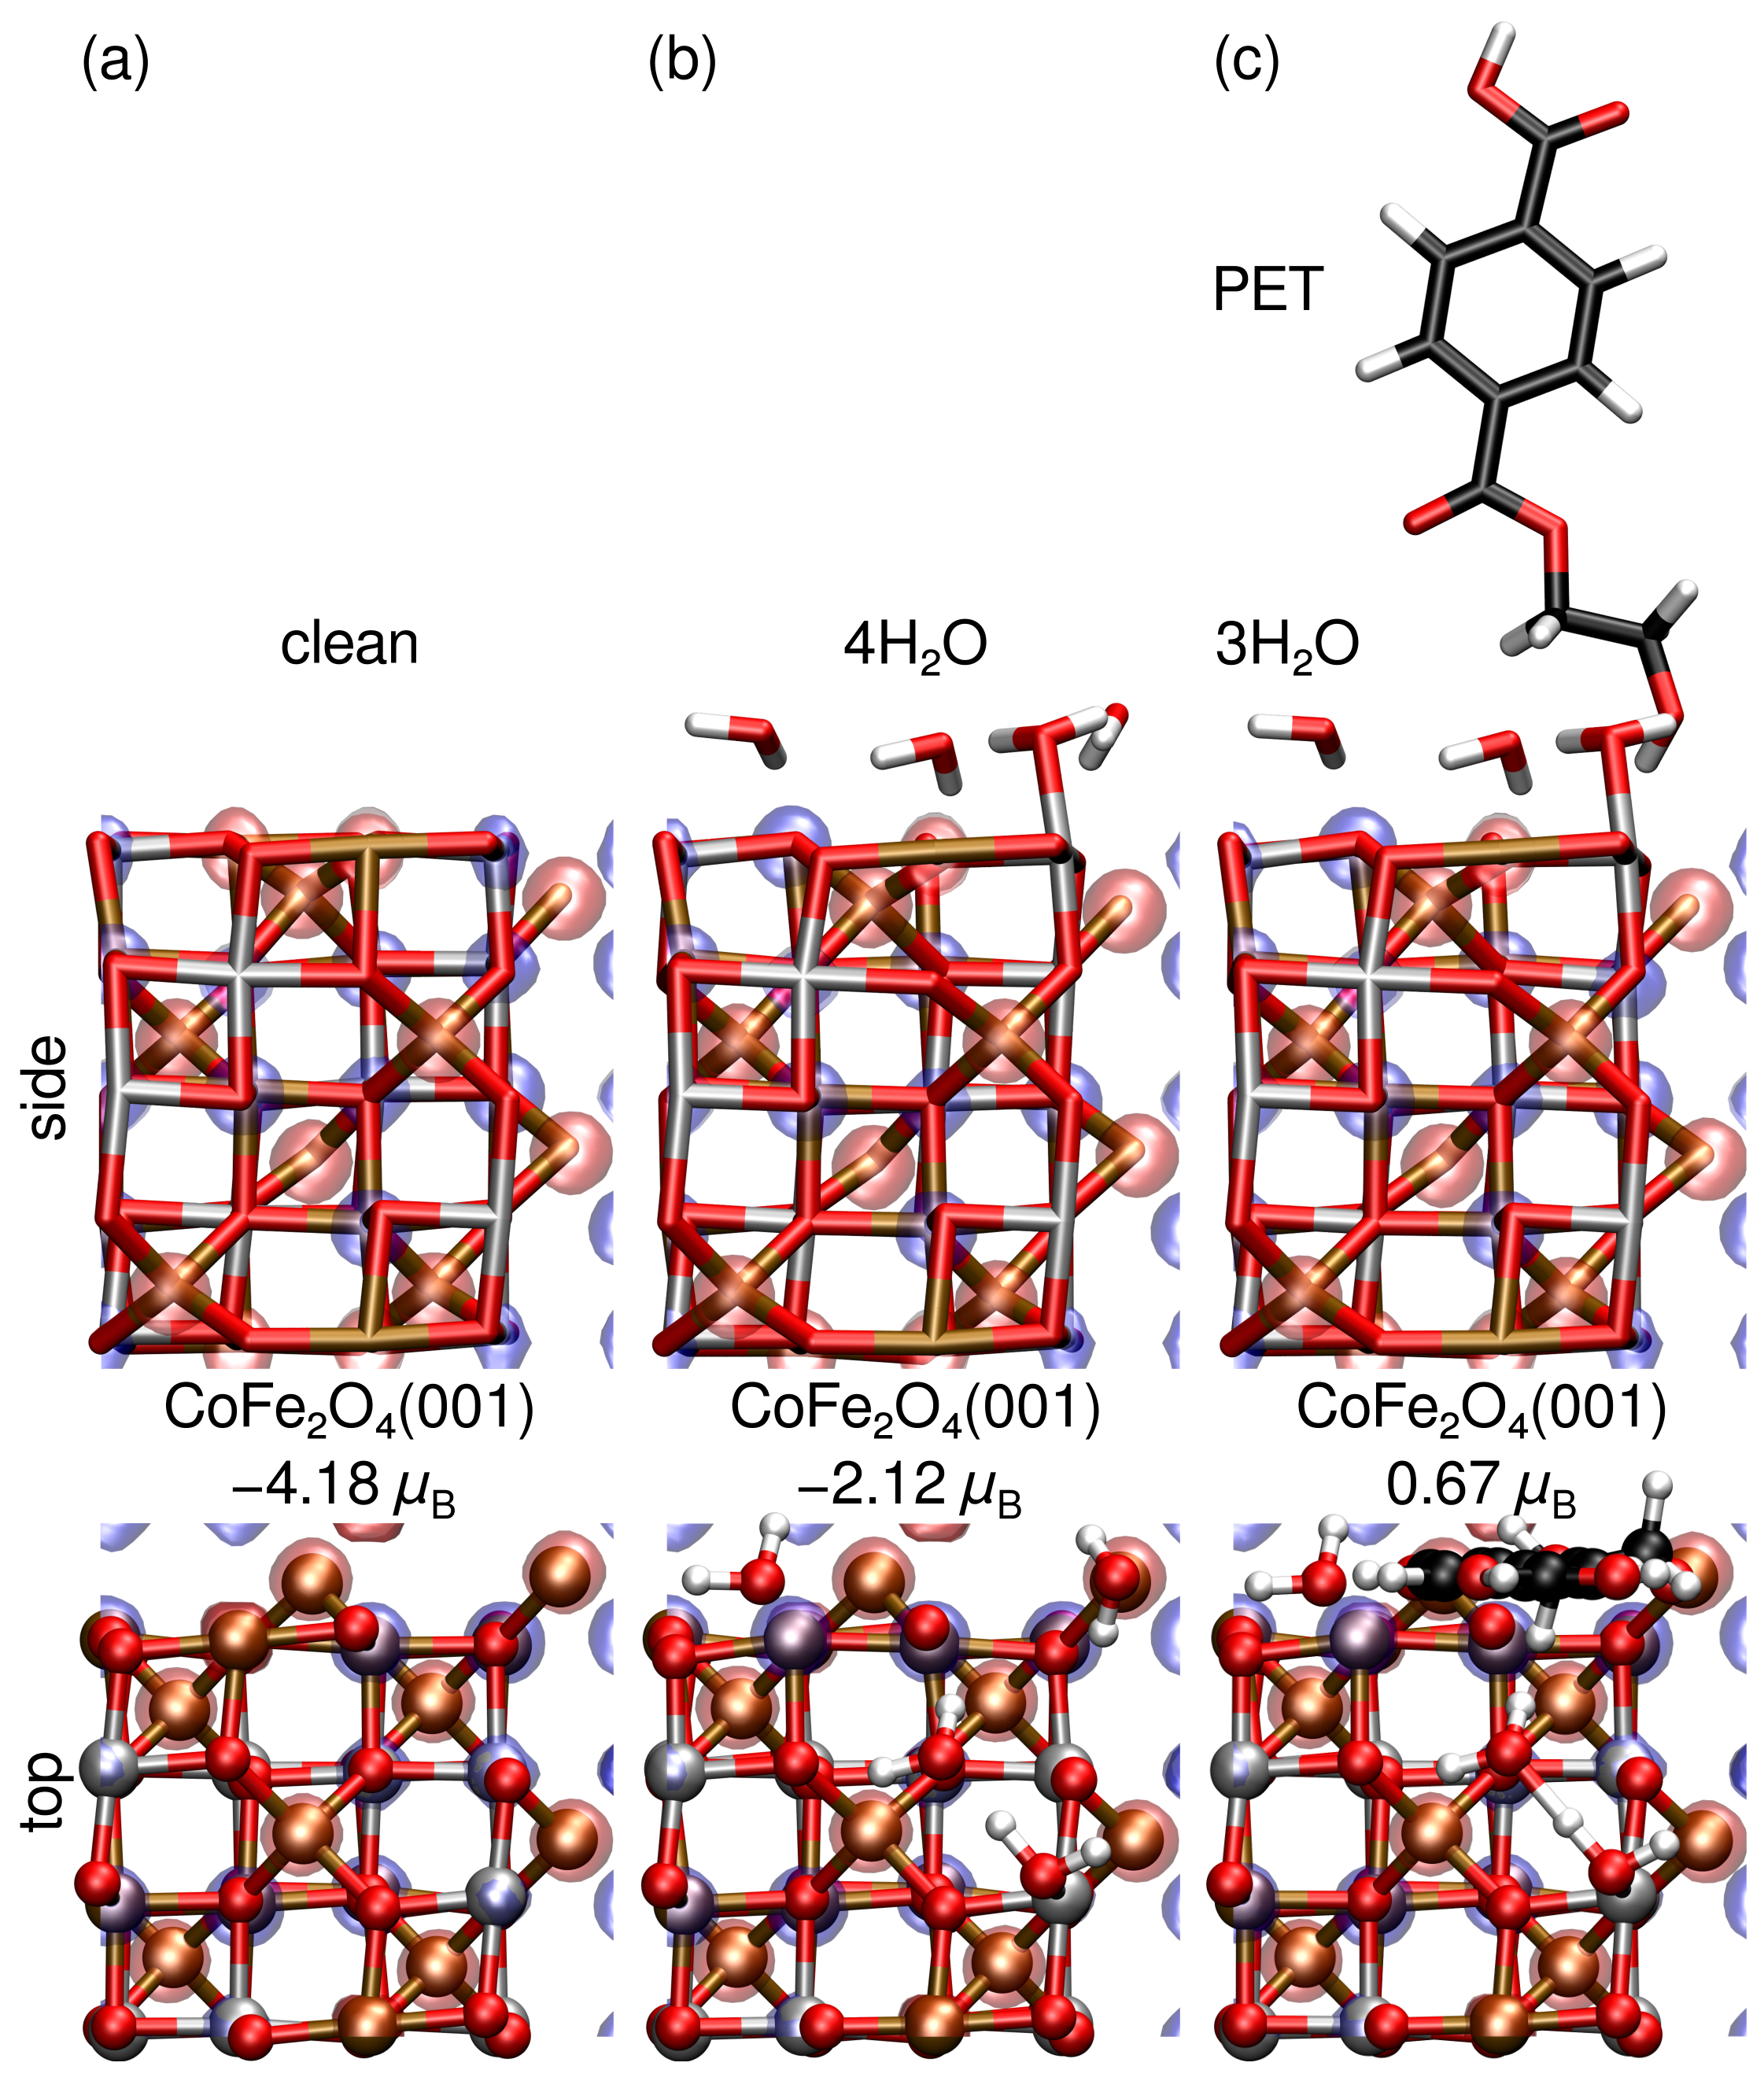
However, due to the qualitative differences in relative adsorption energies for , , and on Co, Fe, Fecus, and Osurf sites of the CoFe2O4(001) surface, we also consider H2O and PET co-adsorption via reaction (R5) in aqueous solution. Figure 12 provides the relaxed structures, magnetic moments, and isosurfaces of the spin-resolved electron density difference for clean CoFe2O4(001), 4H2O@CoFe2O4(001), and (PET+3H2O)@CoFe2O4(001). Although the CoFe2O4(001) surface retains its magnetic moment upon molecular adsorption, it is basically halved when covered by water, and reduced further to a third upon PET adsorption. This suggests molecular adsorption, especially by PET, may hinder the magnetic extraction of CoFe2O4 MNPs. However, although reduced, the magnetic moment of PET on water-covered CoFe2O4 MNPs is still significant. As a result, these differences in magnetic moment may actually prove useful as a means of separating PET and H2O covered CoFe2O4 MNPs, permitting their reuse.
Figure 12.
Spin-resolved density difference and total magnetic moments in for (a) clean, (b) 4 H2O, and (c) 3 H2O+PET adsorbed on a CoFe2O4(001) surface. Co, Fe, O, H, and C atoms are shown in silver, ochre, red, white, and black, respectively. Isosurfaces of spin-up (↑ red) and spin-down (↓ blue) channels are shown.
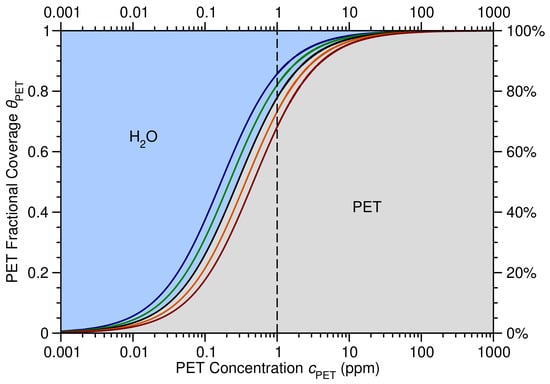
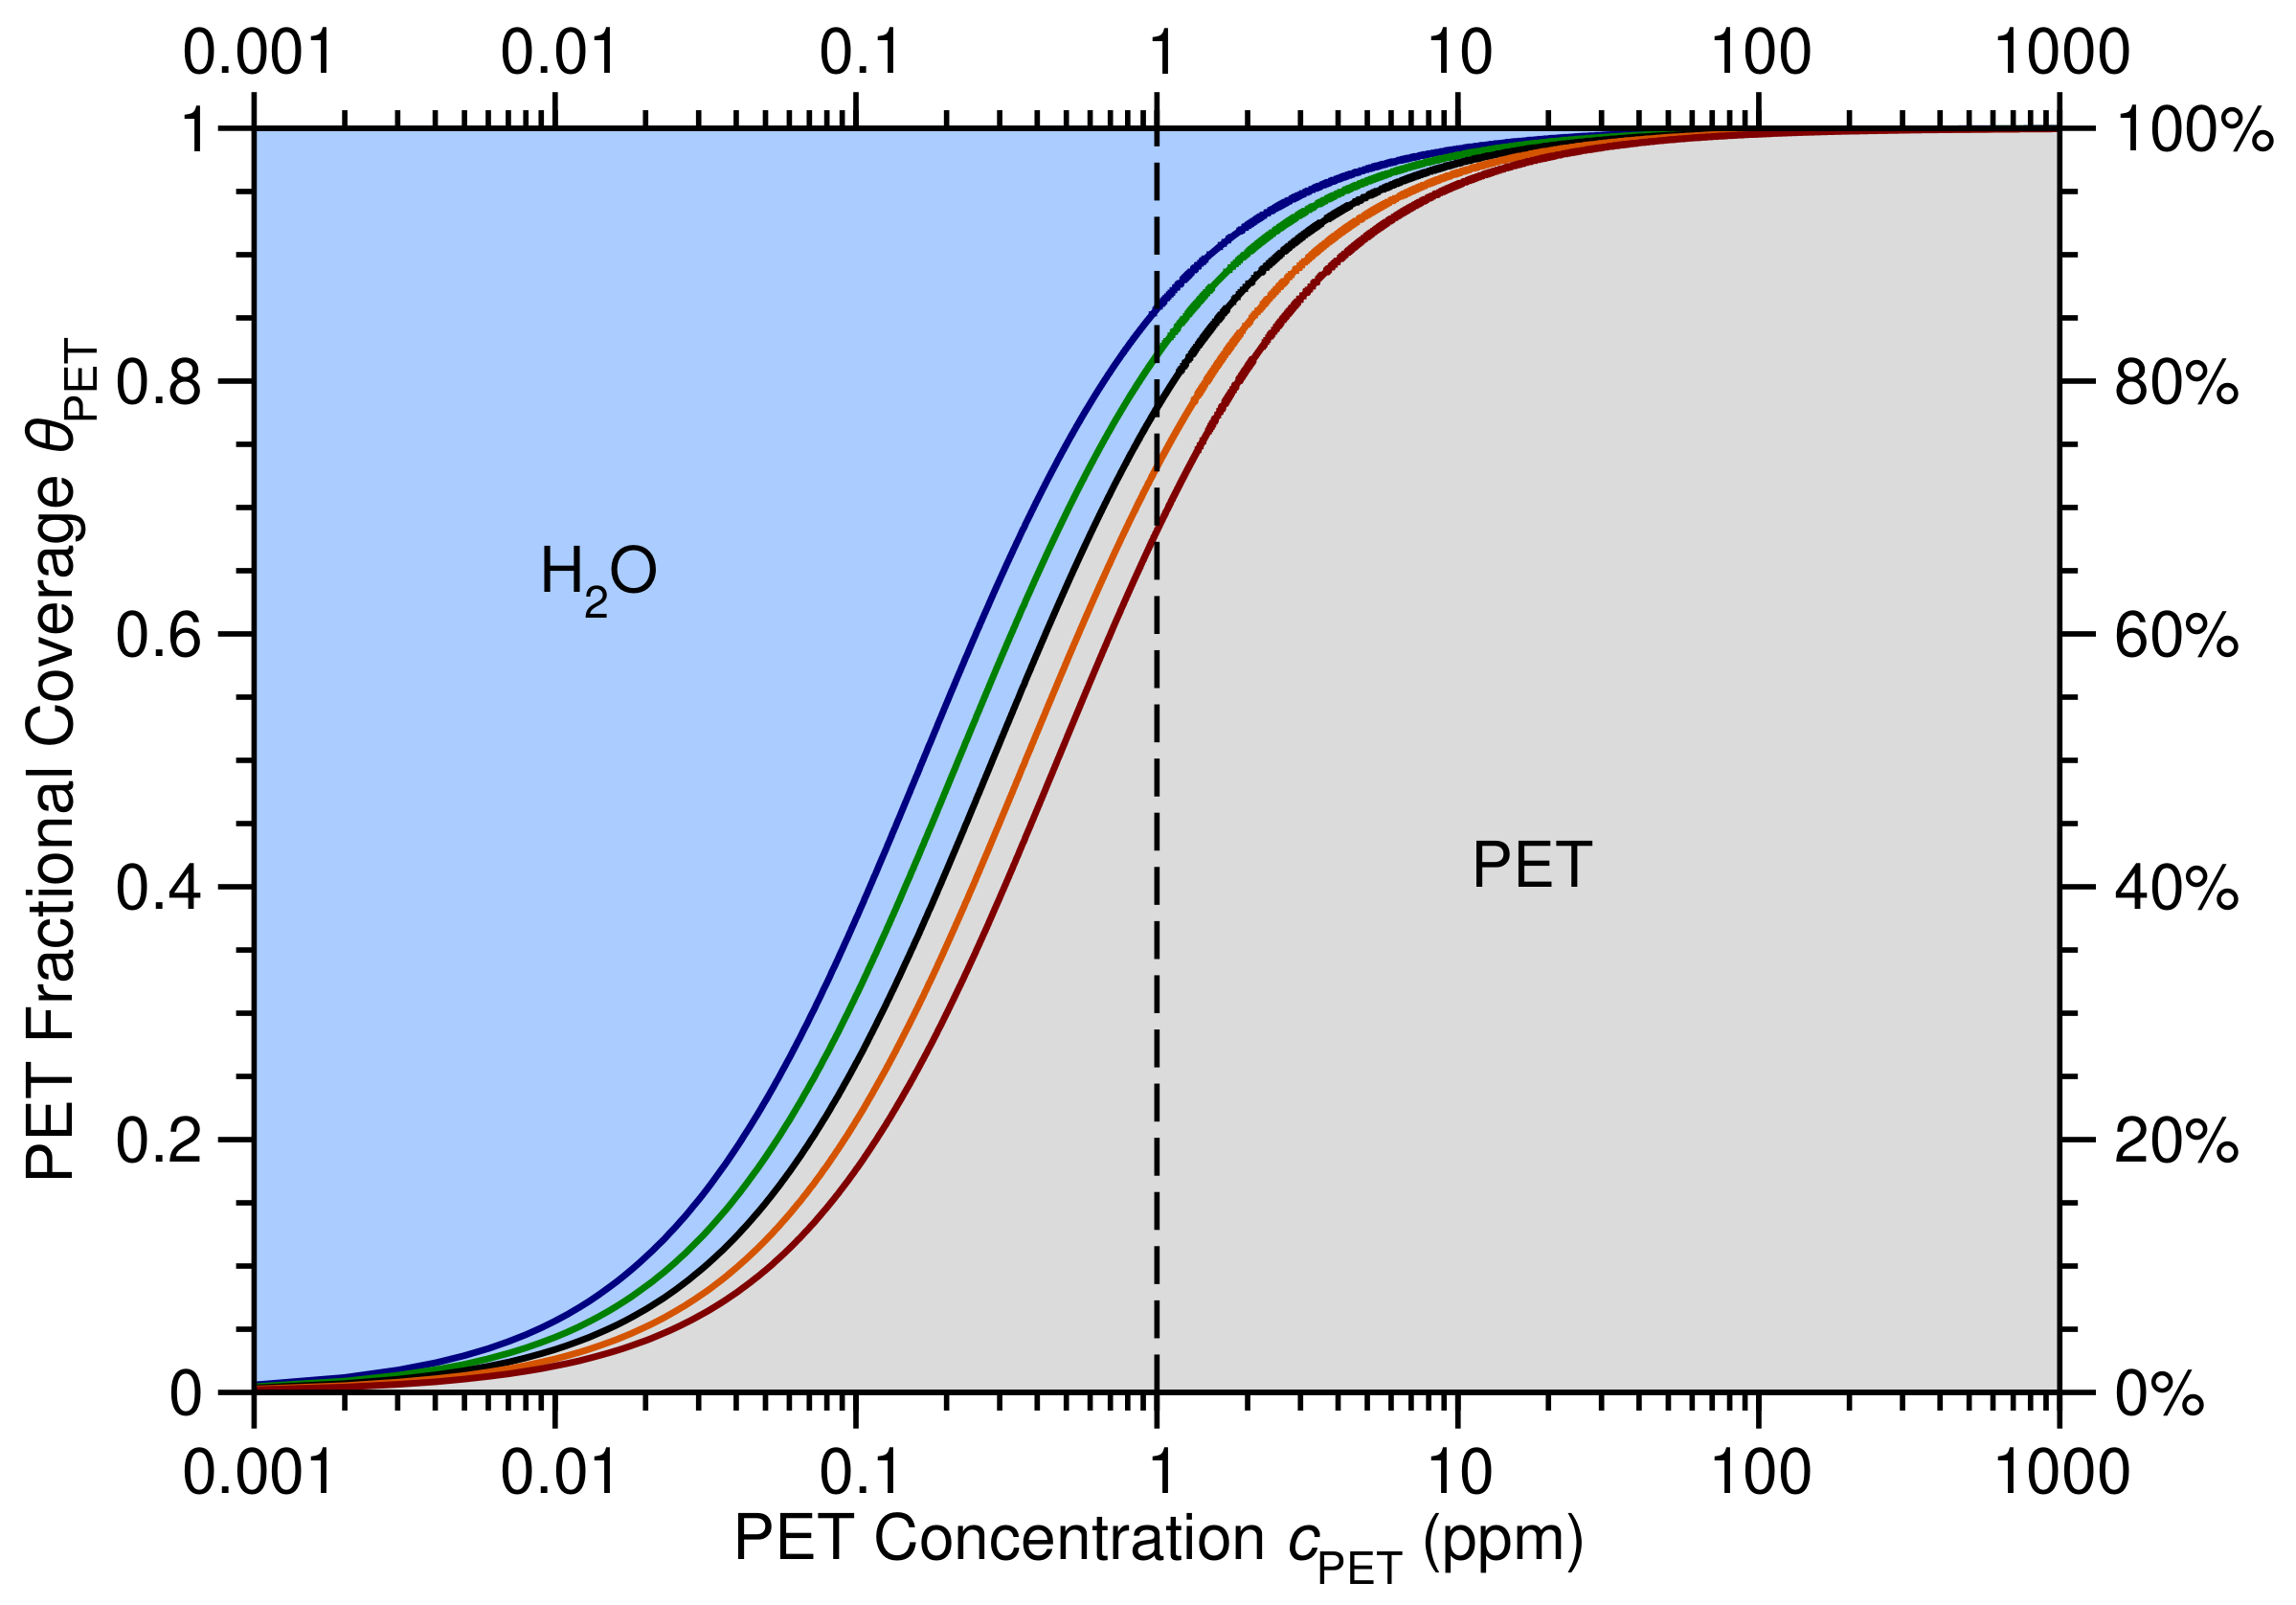
Importantly, from our DFT calculations we find the enthalpy of reaction (R5) eV, demonstrating a strong preference for PET compared with adsorption on the water-covered CoFe2O4(001) surface. By employing our DFT-calculated enthalpy for reaction (R5) in (9), we obtain an expression for the fractional coverage of PET, , on the CoFe2O4(001) surface as a function of PET concentration, , at various temperatures, as shown in Figure 13. Our results suggest that between C and C in aqueous solution, the CoFe2O4(001) surface should be almost completely covered by PET molecules for ppm, reducing to 65–85 % coverage at ppm. This is important as concentrations below 1 ppm are typically considered acceptable. Altogether, these results suggest PET concentrations may be effectively reduced to ppm through the judicious application of CoFe2O4 MNPs in aqueous solution.
Figure 13.
Fractional coverage of PET, , and H2O, , on CoFe2O4 (001) versus PET concentration in parts per million (ppm) at C (blue), C (green), C (black), C (orange), and C (dark red), with a 1 ppm concentration highlighted (vertical dashed line).
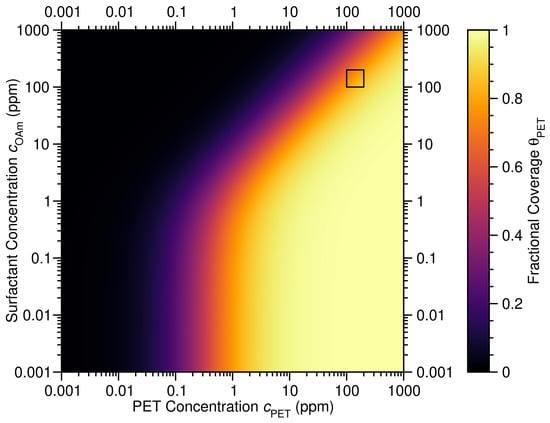
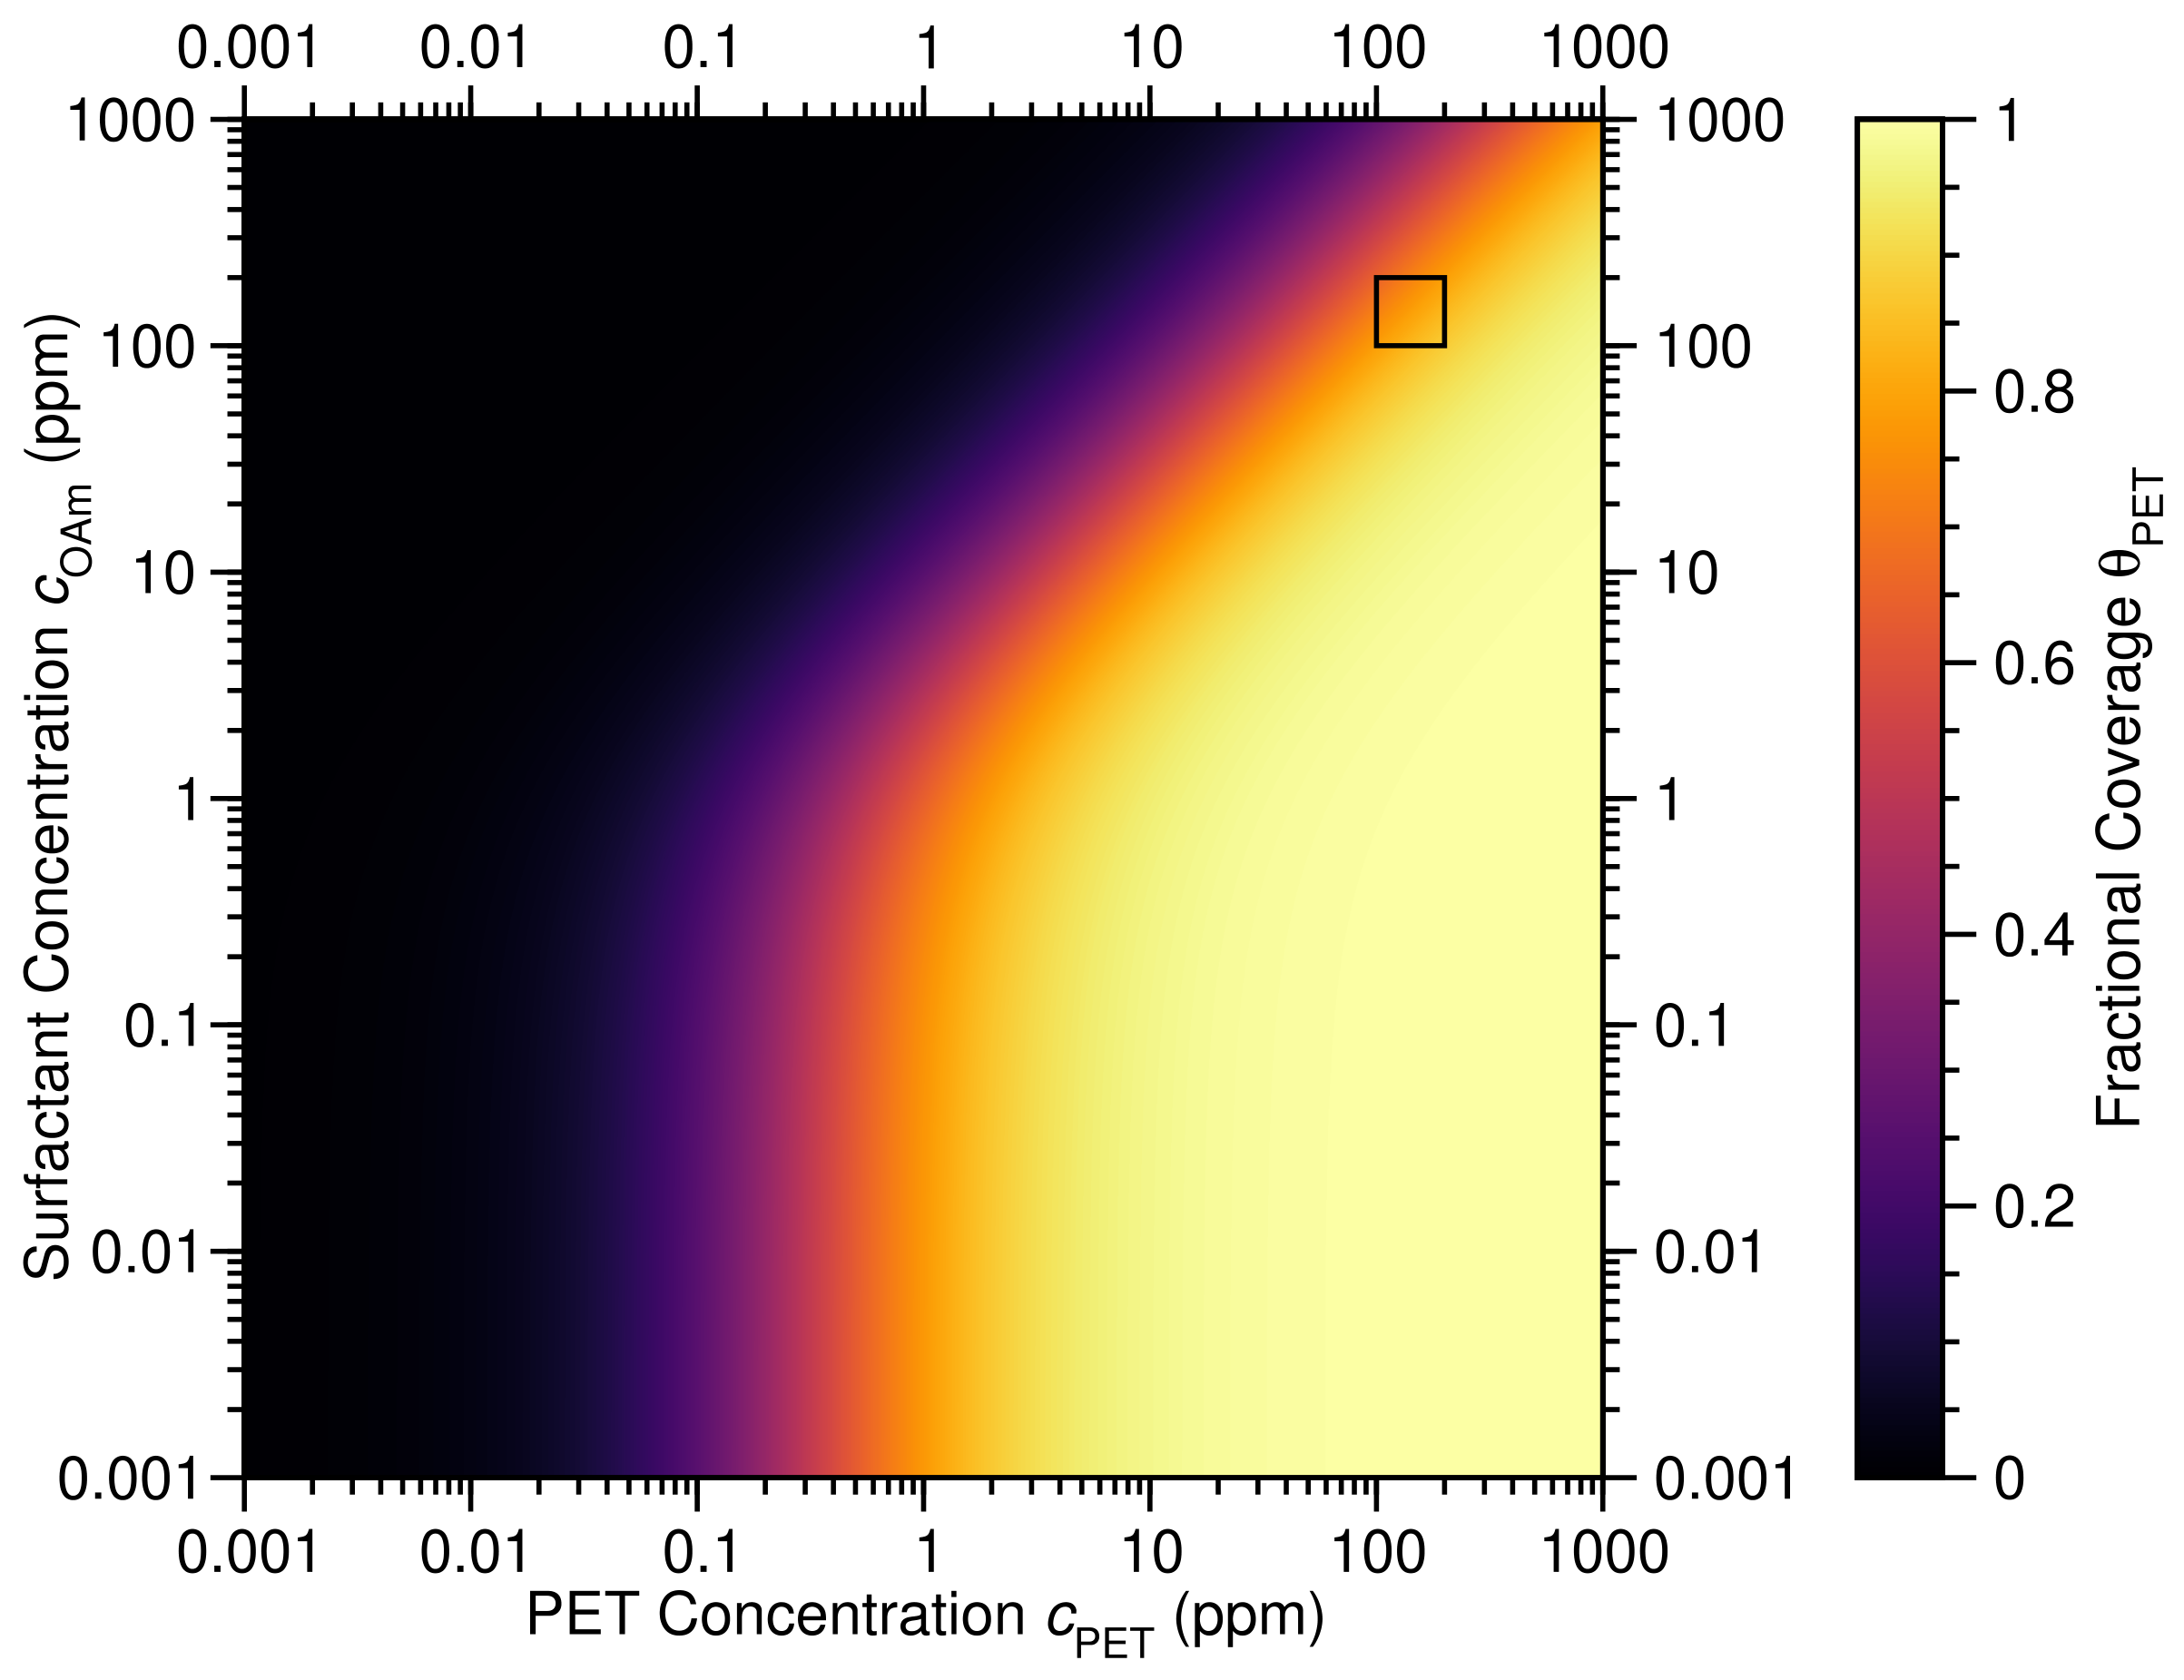
However, as shown by the FTIR and XPS measurements of PET and CoFe2O4 MNPs provided in Figure 4 and Figure 5, respectively, the CoFe2O4 MNPs remain capped by OA/OAm. The presence of these groups on the CoFe2O4 MNP surface may significantly hinder PET adsorption, as shown in Figure 14, explaining the lower PET adsorption measured experimentally. In fact, as highlighted in Figure 14, for OAm concentrations between 100 and 200 ppm, PET coverage range between 55 and 80 %, in excellent agreement with the measured PET uptake of ∼57%.
Figure 14.
Fractional coverage of PET on CoFe2O4 (001), , versus PET and OAm concentrations, and , respectively, in parts per million (ppm) at C, with the ppm region highlighted (black square).
4. Conclusions
In this work, we have performed a combined theoretical and experimental study of PET adsorption on CoFe2O4 MNPs in aqueous solution. Specifically, we show PET adsorbs at nm due to a electronic transition that may be used to characterize the PET concentration in aqueous solution via the Beer–Lambert law below 300 ppm. Combined with our TEM and EDX characterization of the system, we obtain a PET uptake on OA/OAm capped CoFe2O4 MNPs of ∼57%. Our XPS measurements and DFT calculations show the mechanism of PET adsorption on the CoFe2O4(001) surface of MNPs is via charge transfer from the adsorbate to the substrate, with PET adsorbing on the Fecus sites that bind PET molecules significantly more strongly than H2O or OA in aqueous solution while retaining their magnetic properties. We also employ a microkinetic model based on PET adsorption on the water-covered CoFe2O4(001) surface to show that PET covers between 65 and 85 % of the surface at very low concentrations ( ppm). Moreover, by accounting for OAm coadsorption, we find PET covers between 55 and 80 % of the surface for PET and OAm concentrations between 100 and 200 ppm. Our results suggest CoFe2O4 MNPs may prove highly effective for microplastic removal from contaminated water. We believe these results will stimulate further research into the efficacy of CoFe2O4 MNPs for PET removal that takes into account the influence of organic matter, clay particles, and other coexisting constituents present in real-world water bodies.
Supplementary Materials
The following supporting information can be downloaded at https://www.mdpi.com/article/10.3390/microplastics5040224/s1, Figure S1: Apparent contact angle measurements; Figure S2: XPS survey spectra; Table S1: XPS elemental composition, Figure S3: EDX morphological and elemental characterization; Table S2: EDX elemental composition.
Author Contributions
Conceptualization, S.B. and D.J.M.; methodology, S.B., M.A., C.R. and D.J.M.; software, D.J.M.; validation, D.E.L.-V., S.B. and D.J.M.; formal analysis, S.B., M.A., C.R., and D.J.M.; investigation, D.E.L.-V., S.B., M.A., C.R., and D.J.M.; resources, S.B.; data curation, D.E.L.-V.; writing—original draft preparation, D.J.M.; writing—review and editing, S.B. and D.J.M.; visualization, D.J.M.; supervision, S.B. and D.J.M.; project administration, S.B. and D.J.M. All authors have read and agreed to the published version of the manuscript.
Funding
This research received no external funding.
Institutional Review Board Statement
Not applicable.
Data Availability Statement
The original contributions presented in this study are included in the article.
Acknowledgments
This work used the Imbabura cluster of Yachay Tech University, which was purchased under contract No. 2017-024 (SIE-UITEY-007-2017). CR acknowledges UITEY Project PII24-09 for funding the experimental setup used for XPS sample preparation. The authors thank the Instituto Venezolano de Investigaciones Científicas (IVIC) for support in TEM measurements.
Conflicts of Interest
The authors declare no conflicts of interest.
Abbreviations
The following abbreviations are used in this manuscript:
| A | Tetrahedral |
| arb. u. | Arbitrary units |
| ASE | Atomic Simulation Environment |
| at.% | atomic percent |
| B | Octahedrall |
| C2NH7 | Ethylenamine |
| C3O2H5 | Propanoic acid |
| Co(acac)2 | Cobalt(II) acetylacetonate |
| CoFe2O4 | Cobalt ferrite |
| DFT | Density functional theory |
| DZP | Double- polarized |
| EDX | energy-dispersive X-ray |
| eV | Electron volt |
| FEG-SEM | Field-emission scanning electron microscopy |
| FIRE | Fast Inertial Relaxation Engine |
| Fe(acac)3 | Iron(III) acetylacetonate |
| FTIR | Fourier transform infrared |
| H2O | Water |
| GGA | Generalized gradient approximation |
| GLLB-SC | Gritsenko, van Leeuwen, van Lenthe, and Baerends solid and correlation |
| JCPDS | Joint Committee on Powder Diffraction Standards |
| LCAO | Linear combination of atomic orbitals |
| MNP | Magnetic nanoparticle |
| NaOH | Sodium hydroxide |
| nm | nanometer |
| OA | Oleic acid |
| OAm | Oleylamine |
| PAW | Projector augmented wave |
| PBE | Perdew, Burke, and Ernzerhof |
| PBEsol | PBE functional optimized for solids |
| PET | Polyethylene terephthalate |
| ppm | Parts per million |
| ppt | Parts per thousand |
| TDDFT | Time-dependent density functional theory |
| TEM | Transmission electron microscopy |
| UV-Vis | Ultraviolet–visible |
| wt.% | Weight percent |
| xc | Exchange and correlation |
| XPS | X-ray photoelectron spectroscopy |
| XRD | X-ray diffraction |
References
- Andrady, A.L. Microplastics in the marine environment. Mar. Pollut. Bull. 2011, 62, 1596–1605. [Google Scholar] [CrossRef] [Scilit] [PubMed]
- Geyer, R.; Jambeck, J.R.; Law, K.L. Production, use, and fate of all plastics ever made. Sci. Adv. 2017, 3, 1700782. [Google Scholar] [CrossRef] [Scilit] [PubMed]
- Hidalgo-Ruz, V.; Gutow, L.; Thompson, R.C.; Thiel, M. Microplastics in the marine environment: A review of the methods used for identification and quantification. Environ. Sci. Technol. 2012, 46, 3060–3075. [Google Scholar] [CrossRef] [Scilit] [PubMed]
- Rochman, C.M.; Browne, M.A.; Underwood, A.J.; Van Franeker, J.A.; Thompson, R.C.; Amaral-Zettler, L.A. Policy: Classify plastic waste as hazardous. Nature 2013, 494, 169–171. [Google Scholar] [CrossRef] [Scilit] [PubMed]
- Li, M.; Zhao, Z.; Zhao, Z.; Li, M. Review of Techniques for the Detection, Removal, and Transformation of Environmental Microplastics and Nanoplastics. ACS Appl. Mater. Interfaces 2025, 17, 20560–20589. [Google Scholar] [CrossRef] [Scilit] [PubMed]
- Zhao, X.; Korey, M.; Li, K.; Copenhaver, K.; Tekinalp, H.; Celik, S.; Kalaitzidou, K.; Ruan, R.; Ragauskas, A.J.; Ozcan, S. Plastic waste upcycling toward a circular economy. Chem. Eng. J. 2022, 428, 131928. [Google Scholar] [CrossRef] [Scilit]
- Briceño, S.; Arevalo-Fester, J.E.; Fierro-Sanchez, I.A. Sustainable Magnetic Nanorobots for Microplastics Remediation. Microplastics 2025, 4, 97. [Google Scholar] [CrossRef] [Scilit]
- Vargas-Lopez, I.J.; Vera, A.; Rivadeneira, A.; Brämer-Escamilla, W.; González, G.; Briceño, S. Magnetic Ferrotitaniferous Sands for Microplastic Removal. Microplastics 2026, 5, 104. [Google Scholar] [CrossRef] [Scilit]
- Pivokonsky, M.; Cermakova, L.; Novotna, K.; Peer, P.; Cajthaml, T.; Janda, V. Occurrence of Microplastics in Raw and Treated Drinking Water. Sci. Total Environ. 2018, 643, 1644–1651. [Google Scholar] [CrossRef] [Scilit] [PubMed]
- Schymanski, D.; Goldbeck, C.; Humpf, H.U.; Fürst, P. Analysis of Microplastics in Water by Micro-Raman Spectroscopy: Release of Plastic Particles from Different Packaging into Mineral Water. Water Res. 2018, 129, 154–162. [Google Scholar] [CrossRef] [Scilit] [PubMed]
- Liu, M.; Lu, S.; Song, Y.; Lei, L.; Hu, J.; Lv, W.; Zhou, W.; Cao, C.; Shi, H.; Yang, X.; et al. Prevalence of Microplastic Fibers in the Marginal Sea Water Column off Southeast China. Sci. Total Environ. 2022, 804, 150138. [Google Scholar] [CrossRef] [Scilit] [PubMed]
- Wang, J.; Liu, X.; Li, Y. Microplastics as contaminants in the soil environment: A mini-review. Sci. Total Environ. 2020, 691, 848–857. [Google Scholar] [CrossRef] [Scilit] [PubMed]
- Ren, A.; Rius-Ayra, O.; Kang, M.; Llorca-Isern, N. Durably Superhydrophobic Magnetic Cobalt Ferrites for Highly Efficient Oil–Water Separation and Fast Microplastic Removal. Langmuir 2024, 40, 21533–21546, Correction in Langmuir 2024, 40, 24193. https://doi.org/10.1021/acs.langmuir.4c04235. [Google Scholar] [CrossRef] [Scilit] [PubMed]
- Klokkenburg, M.; Hilhorst, J.; Erné, B. Surface analysis of magnetite nanoparticles in cyclohexane solutions of oleic acid and oleylamine. Vib. Spectrosc. 2007, 43, 243–248. [Google Scholar] [CrossRef] [Scilit]
- Park, J.; An, K.; Hwang, Y.; Park, J.G.; Noh, H.J.; Kim, J.Y.; Park, J.H.; Hwang, N.M.; Hyeon, T. Ultra-large-scale syntheses of monodisperse nanocrystals. Nat. Mater. 2004, 3, 891–895. [Google Scholar] [CrossRef] [Scilit] [PubMed]
- Guardia, P.; Di Corato, R.; Lartigue, L.; Wilhelm, C.; Espinosa, A.; Garcia-Hernandez, M.; Gazeau, F.; Manna, L.; Pellegrino, T. One-pot synthesis of monodisperse water soluble iron oxide nanocrystals with high values of the specific absorption rate. J. Mater. Chem. B 2014, 2, 4426–4434. [Google Scholar] [CrossRef] [Scilit]
- Lewis, D.W.; Broadbent, C.J.; Arachchige, I.U.; Brock, S.L. First-principles density functional theory characterisation of arsenic adsorption on cobalt ferrite surfaces. Minerals 2021, 11, 195. [Google Scholar] [CrossRef] [Scilit]
- Vasilakaki, M.; Ntallis, N.; Trohidou, K.N. Tuning the magnetic properties of oleic-acid-coated cobalt ferrite nanoparticles by varying the surfactant coverage. J. Phys. Chem. Solids 2023, 180, 111424. [Google Scholar] [CrossRef] [Scilit]
- Flores-Holguín, N.; Frau, J.; Glossman-Mitnik, D. Recent advances, new perspectives and applications of conceptual density functional theory. Font. Chem. 2022, 10, 1003106. [Google Scholar] [CrossRef] [Scilit] [PubMed]
- Jiang, T.; Mowbray, D.J.; Dobrin, S.; Falsig, H.; Hvolbæk, B.; Bligaard, T.; Nørskov, J.K. Trends in CO Oxidation Rates for Metal Nanoparticles and Close-Packed, Stepped, and Kinked Surfaces. J. Phys. Chem. C 2009, 113, 10548–10553. [Google Scholar] [CrossRef] [Scilit]
- Giustino, F. Materials Modelling Using Density Functional Theory: Properties and Predictions; Oxford University Press: Oxford, UK, 2014. [Google Scholar]
- Marques, M.A.; Maitra, N.T.; Nogueira, F.M.; Gross, E.K.; Rubio, A. Fundamentals of Time-Dependent Density Functional Theory; Springer: Berlin/Heidelberg, Germany, 2012; Volume 837. [Google Scholar]
- Preciado-Rivas, M.R.; Mowbray, D.J.; Lyon, K.; Larsen, A.H.; Milne, B.F. Optical excitations of chlorophyll a and b monomers and dimers. J. Chem. Phys. 2019, 151, 174102. [Google Scholar] [CrossRef] [Scilit] [PubMed]
- Lyon, K.; Preciado-Rivas, M.R.; Zamora-Ledezma, C.; Despoja, V.; Mowbray, D.J. LCAO-TDDFT-k-ω: Spectroscopy in the optical limit. J. Phys. Condens. Matter 2020, 32, 415901. [Google Scholar] [CrossRef] [Scilit] [PubMed]
- Narváez-Muñoz, C.; Diaz-Suntaxi, D.F.; Carrión-Matamoros, L.M.; Guerrero, V.H.; Almeida-Naranjo, C.E.; Morales-Flórez, V.; Debut, A.; Vizuete, K.; Mowbray, D.J.; Zamora-Ledezma, C. Impact of the solvent composition on the structural and mechanical properties of customizable electrospun poly(vinylpyrrolidone) fiber mats. Phys. Chem. Chem. Phys. 2021, 23, 22923–22935. [Google Scholar] [CrossRef] [Scilit] [PubMed]
- Briceño, S.; Reinoso, C. CoFe2O4-chitosan-graphene nanocomposite for glyphosate removal. Environ. Res. 2022, 22, 113470. [Google Scholar] [CrossRef] [Scilit] [PubMed]
- Alcalá, O.; Briceño, S.; Brämer-Escamilla, W.; Silva, P. Toroidal cores of MnxCo1–xFe2O4/PAA nanocomposites with potential applications in antennas. Mater. Chem. Phys. 2017, 192, 17–21. [Google Scholar] [CrossRef] [Scilit]
- Paszun, D.; Spychaj, T. Chemical Recycling of Poly(ethylene terephthalate). Ind. Eng. Chem. Res. 1997, 36, 1373–1383. [Google Scholar] [CrossRef] [Scilit]
- Umdagas, L.; Orozco, R.; Heeley, K.; Thom, W.; Al-Duri, B. Advances in chemical recycling of polyethylene terephthalate (PET) via hydrolysis: A comprehensive review. Polym. Degrad. Stab. 2025, 234, 111246. [Google Scholar] [CrossRef] [Scilit]
- Zamora-Ledezma, C.; Hernández, A.B.; López-González, I.; Elango, J.; Paindépice, J.; Alexis, F.; González-Sánchez, M.; Morales-Flórez, V.; Mowbray, D.J.; Meseguer-Olmo, L. Fabrication, Physical–Chemical and Biological Characterization of Retinol-Loaded Poly(vinyl Alcohol) Electrospun Fiber Mats for Wound Healing Applications. Polymers 2023, 15, 2705. [Google Scholar] [CrossRef] [Scilit] [PubMed]
- Akbari, R.; Antonini, C. Contact angle measurements: From existing methods to an open-source tool. Adv. Colloid Interface Sci. 2021, 294, 102470. [Google Scholar] [CrossRef] [Scilit] [PubMed]
- Huang, X.; Gates, I. Apparent contact angle around the periphery of a liquid drop on roughened surfaces. Sci. Rep. 2020, 10, 8220. [Google Scholar] [CrossRef] [Scilit] [PubMed]
- Larsen, A.H.; Mortensen, J.J.; Blomqvist, J.; Castelli, I.E.; Christensen, R.; Dułak, M.; Friis, J.; Groves, M.N.; Hammer, B.; Hargus, C.; et al. The atomic simulation environment—A Python library for working with atoms. J. Phys. Condens. Matter 2017, 29, 273002. [Google Scholar] [CrossRef] [Scilit] [PubMed]
- Mortensen, J.J.; Hansen, L.B.; Jacobsen, K.W. Real-Space Grid Implementation of the Projector Augmented Wave Method. Phys. Rev. B 2005, 71, 035109. [Google Scholar] [CrossRef] [Scilit]
- Enkovaara, J.; Rostgaard, C.; Mortensen, J.J.; Chen, J.; Dułak, M.; Ferrighi, L.; Gavnholt, J.; Glinsvad, C.; Haikola, V.; Hansen, H.A.; et al. Electronic Structure Calculations with GPAW: A Real-Space Implementation of the Projector Augmented-Wave Method. J. Phys. Condens. Matter 2010, 22, 253202. [Google Scholar] [CrossRef] [Scilit] [PubMed]
- Perdew, J.P.; Ruzsinszky, A.; Csonka, G.I.; Vydrov, O.A.; Scuseria, G.E.; Constantin, L.A.; Zhou, X.; Burke, K. Restoring the density-gradient expansion for exchange in solids and surfaces. Phys. Rev. Lett. 2008, 100, 136406, Erratum in Phys. Rev. Lett. 2009, 102, 039902. https://doi.org/10.1103/PhysRevLett.102.039902. [Google Scholar] [CrossRef] [Scilit] [PubMed]
- Perdew, J.P.; Burke, K.; Ernzerhof, M. Generalized Gradient Approximation Made Simple. Phys. Rev. Lett. 1996, 77, 3865–3868. [Google Scholar] [CrossRef] [Scilit] [PubMed]
- Larsen, A.H.; Vanin, M.; Mortensen, J.J.; Thygesen, K.S.; Jacobsen, K.W. Localized atomic basis set in the projector augmented wave method. Phys. Rev. B 2009, 80, 195112. [Google Scholar] [CrossRef] [Scilit]
- Bitzek, E.; Koskinen, P.; Gähler, F.; Moseler, M.; Gumbsch, P. Structural relaxation made simple. Phys. Rev. Lett. 2006, 97, 170201. [Google Scholar] [CrossRef] [Scilit] [PubMed]
- Bader, R.F.W. Atoms in Molecules: A Quantum Theory; Oxford University: Oxford, UK, 1990; Volume 3, pp. 1–120. [Google Scholar]
- Tang, W.; Sanville, E.; Henkelman, G. A grid-based Bader analysis algorithm without lattice bias. J. Phys. Condens. Matter 2009, 21, 084204. [Google Scholar] [CrossRef] [Scilit] [PubMed]
- Henkelman, G.; Arnaldsson, A.; Jónsson, H. A fast and robust algorithm for Bader decomposition of charge density. Comp. Mater. Sci. 2006, 36, 354–360. [Google Scholar] [CrossRef] [Scilit]
- Glanzmann, L.N.; Mowbray, D.J.; Figueroa del Valle, D.G.; Scotognella, F.; Lanzani, G.; Rubio, A. Photoinduced absorption within single-walled carbon nanotube systems. J. Phys. Chem. C 2016, 120, 1926–1935. [Google Scholar] [CrossRef] [Scilit]
- Preciado-Rivas, M.R.; Torres-Sánchez, V.A.; Mowbray, D.J. Optical absorption and energy loss spectroscopy of single-walled carbon nanotubes. Phys. Rev. B 2019, 100, 235429. [Google Scholar] [CrossRef] [Scilit]
- Gritsenko, O.V.; Leeuwen, R.V.; Baerends, E.J. Direct approximation of the long- and short-range components of the exchange-correlation Kohn-Sham potential. Int. J. Quantum Chem. 1997, 61, 231–243. [Google Scholar] [CrossRef]
- Nandiyanto, A.B.D. How to Read and Interpret FTIR Spectra for Materials: A Master Dataset with Step-by-Step Guided Peak-Correlation Analysis, Representative Examples, and a Foundation for Future Artificial Intelligence (AI)-Assisted Analysis. ASEAN J. Sci. Eng. Mater. 2026, 5, 323–356. [Google Scholar]
- Aquino, I.; Freire, E.; Rodrigues, A.; Vercillo, O.; Silva, M.; Rocha, M.; Amaral, M.; Amorim, A. Sustainable Strategy for Microplastic Mitigation: Fe3O4 Acid-Functionalized Magnetic Nanoparticles for Microplastics Removal. Sustainability 2025, 17, 5203. [Google Scholar] [CrossRef] [Scilit]
- Munjal, S.; Khare, N. Transforming single domain magnetic CoFe2O4 nanoparticles from hydrophobic to hydrophilic by novel mechanochemical ligand exchange. J. Nanopart. Res. 2017, 19, 18. [Google Scholar] [CrossRef] [Scilit]
- Gonzalez, E., II; Barankin, M.D.; Guschl, P.C.; Hicks, R.F. Remote Atmospheric-Pressure Plasma Activation of the Surfaces of Polyethylene Terephthalate and Polyethylene Naphthalate. Langmuir 2008, 24, 12636–12643. [Google Scholar] [CrossRef] [Scilit] [PubMed]
- Biesinger, M.C.; Payne, B.P.; Grosvenor, A.P.; Lau, L.W.; Gerson, A.R.; Smart, R.S. Resolving surface chemical states in XPS analysis of first row transition metals, oxides and hydroxides: Cr, Mn, Fe, Co and Ni. Appl. Surf. Sci. 2011, 257, 2717–2730. [Google Scholar] [CrossRef] [Scilit]
- Grosvenor, A.P.; Kobe, B.A.; Biesinger, M.C.; McIntyre, N.S. Investigation of multiplet splitting of Fe 2p XPS spectra and bonding in iron compounds. Surf. Interface Anal. 2004, 36, 1564–1574. [Google Scholar] [CrossRef] [Scilit]
- Baer, D.R.; Artyushkova, K.; Cohen, H.; Easton, C.D.; Engelhard, M.; Gengenbach, T.R.; Greczynski, G.; Mack, P.; Morgan, D.J.; Roberts, A. XPS guide: Charge neutralization and binding energy referencing for insulating samples. J. Vac. Sci. Technol. A 2020, 38, 031204. [Google Scholar] [CrossRef] [Scilit]
- Recek, N.; Jaganjac, M.; Kolar, M.; Milkovic, L.; Mozetič, M.; Stana-Kleinschek, K.; Vesel, A. Protein Adsorption on Various Plasma-Treated Polyethylene Terephthalate Substrates. Molecules 2013, 18, 12441–12463. [Google Scholar] [CrossRef] [Scilit] [PubMed]
- Beamson, G.; Briggs, D. High Resolution XPS of Organic Polymers: The Scienta ESCA300 Database; John Wiley & Sons: Chichester, UK, 1992; p. 306. [Google Scholar]
- Strohmeier, B.R. An ESCA method for determining the oxide thickness on aluminum alloys. Surf. Interface Anal. 1990, 15, 51–56. [Google Scholar] [CrossRef] [Scilit]
- de Lima Alves, T.M.; Amorim, B.F.; Torres, M.A.M.; Bezerra, C.G.; de Medeiros, S.N.; Gastelois, P.L.; Outonc, L.E.F.; de Almeida Macedo, W.A. Wasp-waisted behavior in magnetic hysteresis curves of CoFe2O4 nanopowder at a low temperature: Experimental evidence and theoretical approach. RSC Adv. 2017, 7, 22187. [Google Scholar] [CrossRef] [Scilit]
- Ansari, S.M.; Sinha, B.B.; Sen, D.; Sastry, P.U.; Kolekar, Y.D.; Ramana, C.V. Effect of Oleylamine on the Surface Chemistry, Morphology, Electronic Structure, and Magnetic Properties of Cobalt Ferrite Nanoparticles. Nanomaterials 2022, 12, 3015. [Google Scholar] [CrossRef] [Scilit] [PubMed]
- Yamashita, T.; Hayes, P. Analysis of XPS spectra of Fe2+ and Fe3+ ions in oxide materials. Appl. Surf. Sci. 2008, 254, 2441–2449. [Google Scholar] [CrossRef] [Scilit]
- Baer, D.R. Guide to making XPS measurements on nanoparticles. J. Vac. Sci. Technol. A 2020, 38, 031201. [Google Scholar] [CrossRef] [Scilit]
- Techane, S.; Gamble, L.; Castner, D. X-ray photoelectron spectroscopy characterization of gold nanoparticles functionalized with amine-terminated alkanethiols. Biointerphases 2011, 6, 98–104. [Google Scholar] [CrossRef] [Scilit]
- Cabellos, J.L.; Mowbray, D.J.; Goiri, E.; El-Sayed, A.; Floreano, L.; de Oteyza, D.G.; Rogero, C.; Ortega, J.E.; Rubio, A. Understanding Charge Transfer in Donor–Acceptor/Metal Systems: A Combined Theoretical and Experimental Study. J. Phys. Chem. C 2012, 116, 17991–18001. [Google Scholar] [CrossRef] [Scilit]

Disclaimer/Publisher’s Note: The statements, opinions and data contained in all publications are solely those of the individual author(s) and contributor(s) and not of MDPI and/or the editor(s). MDPI and/or the editor(s) disclaim responsibility for any injury to people or property resulting from any ideas, methods, instructions or products referred to in the content. |
© 2026 by the authors. Licensee MDPI, Basel, Switzerland. This article is an open access article distributed under the terms and conditions of the Creative Commons Attribution (CC BY) license.