


Abstract
Polystyrene nanoplastics (PS-NPs) are increasingly recognized as environmental contaminants with potential implications for human health. However, the changes that polystyrene undergoes under environmental conditions, as well as the cellular stress responses and adaptive processes induced by these particles in human neuronal cell models, have not yet been fully characterized. In this study, we investigated the effects of 100 nm polystyrene nanoplastics functionalized with carboxyl groups (PS-NPs-COOH) on SH-SY5Y cells after 24 h of exposure, focusing on cell viability, intracellular particle accumulation, oxidative stress, antioxidant responses, and endoplasmic reticulum (ER) stress-associated signaling. Cell viability decreased significantly (p < 0.0001) to 68% at a concentration of 500 µg/mL, compared to 96.14% in the control group. Holotomographic microscopy showed concentration-dependent intracellular accumulation and aggregation of PS-NPs-COOH. Exposure was also associated with increased dihydroethidium-derived fluorescence, consistent with an alteration in cellular oxidative status. The increased expression of NRF2 and antioxidant response-related genes suggested a compensatory transcriptional response to the oxidative stress generated. In parallel, changes in ER stress-associated markers, including components of the unfolded protein response (UPR), together with alterations in apoptosis-related transcripts, indicated the involvement of interconnected cellular stress response pathways. These responses varied according to the exposure concentration of PS-NPs-COOH, possibly suggesting an adaptive process in response to cellular stress. Further studies are needed to clarify this proposed adaptive response and determine the balance between cellular dysfunction and survival mechanisms.
1. Introduction
Plastic pollution has become a global environmental and public health concern, a phenomenon exacerbated by the exponential increase in the production and consumption of plastics in recent decades. This has led to the widespread accumulation of microplastics (MPs; <5 mm) and nanoplastics (NPs; <100 nm) in the environment [1,2,3]. Measurements in aquatic environments have shown that concentrations of these polymers can reach up to 0.04 mg/L [4], highlighting the extensive and pervasive exposure resulting from human activity. Depending on the type of polymer, plastics can persist in the environment for decades or even centuries; for example, while polypropylene (PP) takes approximately 20–30 years to degrade, polyvinyl chloride (PVC) takes ~100 years, polyethylene terephthalate (PET) and polystyrene (PS) ~500 years, and polyethylene (PE) can take up to 1000 years [3].
MPs and NPs originate both from the secondary fragmentation of larger plastic debris and from their intentional production for specific industrial and commercial applications. Due to their small size, high persistence, and physicochemical stability, these particles have been detected in air, drinking water, food, and various consumer products, implying that chronic human exposure is virtually unavoidable [5,6]. Current evidence indicates that MPs and NPs can enter the human body through multiple exposure routes, including ingestion, inhalation, and dermal contact [6]. Once internalized, they can translocate across biological barriers and distribute systemically, accumulating in target organs where they may exert adverse effects [7]. MPs and NPs have been detected in various human biological samples, including feces, lungs, blood, thrombi, placenta, testes, and even the brain, raising significant concerns about human health [4]. Although recent findings suggest the potential toxicity of MNPs to the Central Nervous System (CNS), studies specifically addressing their effects on the brain remain limited, and the mechanisms of neurotoxicity are not well understood.
The study by Nihart et al. [8] remarks on the relevance of using microscopy and mass spectroscopy techniques to demonstrate the existence of MNPs in different human organs. They employed pyrolysis gas chromatography–mass spectrometry to quantify MNP concentrations in post-mortem human brain, liver, and kidney tissue from donors sampled between 2016 and 2024. Brain tissue had the highest plastic concentrations of the three organs, with levels increasing significantly over the 8 years; individuals with documented dementia diagnoses showed even greater microplastic deposition in cerebrovascular walls and resident immune cells. Different microscopy techniques (scanning electron microscopy, polarization wave microscopy, transmission electron microscopy [TEM]) were used to demonstrate the existence of MNPs in human organs. TEM imaging was conducted on the dispersed KOH-insoluble pellets obtained from the liver and kidney, showing shard-like morphology, less than 400 nm in length.
Complementing this evidence, Xiang et al. [9] documented that NPs co-accumulate with environmental co-contaminants (heavy metals, persistent organic pollutants, endocrine disruptors) in food matrices, compounding the neurotoxic risk associated with routine dietary exposure. Specifically, NPs possess unique physicochemical characteristics, a large specific surface area, and high mobility, enabling them to act as efficient carriers of hydrophobic organic contaminants, thereby increasing their harmful potential [1].
Among the potentially affected systems, the central nervous system (CNS) has received particular attention due to its limited regenerative capacity and high susceptibility to oxidative and inflammatory processes [10]. Experimental studies increasingly suggest that NP exposure can disrupt neural homeostasis, posing potential risks to cognitive function and contributing to neurodegenerative processes [11]. NPs have demonstrated a greater ability to cross the blood–brain barrier (BBB) compared to MPs. The BBB constitutes a critical biological barrier that protects the brain from harmful substances. Recent studies have highlighted the detrimental effects of ultrafine particles (≤100 nm) on the human brain. NPs have been shown to disrupt the BBB, potentially affecting brain function and altering behavior in murine models [4,12].
Once within the CNS, micro and nanoplastics (MNPs) can accumulate in regions involved in cognitive and motor functions, such as the hypothalamus, hippocampus, amygdala, and cerebral cortex, where they directly interact with neurons and glial cells [10,11,13]. In this context, in vitro neuronal models have been essential for elucidating underlying cellular mechanisms, as they allow controlled evaluation of variables such as particle size, polymer type, and concentration while minimizing systemic complex factors [14,15,16].
The transport of MNPs across biological barriers is a complex process that depends on factors such as particle size, charge, surface chemistry, and the type of interacting cell. Larger particles in the micrometer range are typically internalized through receptor-mediated binding followed by phagocytic uptake and fusion with lysosomes. Alternatively, particles may enter cells via endocytosis, where the membrane engulfs the particle without forming a classical phagosome. For particles smaller than 0.5 µm, transcytosis may occur, allowing them to cross cellular barriers by diffusing through the lipid bilayer and exiting on the opposite side without being retained within the cell [12].
The toxicological impact and adsorption of MNPs depend on particle size, surface characteristics, polarity, and aging. Nonpolar polymers (e.g., polyethylene (PE), polypropylene (PP), and polystyrene (PS)) exhibit greater affinity for contaminants than polar polymers (e.g., polyvinyl chloride (PVC) and polycarbonate (PC)), enhancing their role as vectors of toxic compounds. Functionalized NPs, such as those bearing carboxyl (–COOH) or amino (–NH2) groups, may exhibit improved colloidal stability and reduced aggregation. However, these surface modifications can also alter their interactions with biological systems, potentially enhancing neurotoxic effects by modulating cellular signaling pathways and disrupting membrane integrity. Polystyrene nanoplastics (PS-NPs) exhibit a hydrophobic character that favors their aggregation in water. Surface functionalization of PS-NPs with carboxylic groups aids the hydrophilic behavior of these materials. In addition, the carboxylic group (pKa~4.8) deprotonates in aqueous media at a neutral pH value, resulting in negatively charged particles that repel due to electrostatic interactions, contributing to colloidal stability. The behavior of naked PS-NPs is different due to their hydrophobic nature; however, their colloidal stability can be analogous to PS-NPs-COOH considering the nature of the solvent, composition (ions, biomolecules) and the concentration of the particles. Another key factor is the formation of the protein corona, which occurs when biomolecules adsorb onto NP surfaces in biological fluids. Its composition depends on NP size, shape, charge, and functionalization, thereby influencing uptake, distribution, and toxicity [13].
The transport and toxicological impact of MNPs across biological barriers constitute a complex process governed by polymer chemistry, particle size, surface charge, polarity, and aging dynamics [12,13]. Polystyrene nanoplastics (PS-NPs) are widely utilized as a model pollutant due to their commercial availability, widespread presence in aquatic ecosystems and food chains, and unique toxicity patterns driven by reactive aromatic benzene rings, which render them more reactive than nonpolar polymers like polyethylene (PE) or polypropylene (PP) [13,17].
At the cellular level, NPs uptake, reactivity, and intracellular fate are critically dictated by hydrodynamic diameter, surface functionalization, and colloidal stability regulated by protein corona formation in biological fluids [13,18,19,20]. Rather than traversing membranes via simple diffusion, entry pathways and accumulation kinetics are strictly size-dependent [12,20,21]. Smaller NPs display higher penetration efficiency and enter cells via clathrin- and caveolin-mediated endocytosis, whereas larger particle fractions internalize through macropinocytosis or receptor-mediated phagocytosis [12,21,22,23]. Following internalization, NPs are predominantly targeted to lysosomes for fusion or engage in direct interactions with mitochondria and the cytoskeleton [12,19,22].
Furthermore, surface charge and chemical modifications strongly modulate these cellular interactions. While positively charged amine-functionalized analogs (+NH2) generally exhibit heightened membrane damage and acute cytotoxicity, carboxyl functionalization (–COOH) significantly alters the biological identity of PS-NPs, distinctively influencing their rate of endocytosis, intracellular trafficking pathways, generation of reactive oxygen species (ROS), and overall neurotoxic potential [13,21,24,25].
One of the primary mechanisms underlying MNP-induced neurotoxicity is oxidative stress. Several in vitro studies have reported increased reactive oxygen species (ROS) production following MNP exposure, leading to disruption of redox homeostasis, oxidative damage, and mitochondrial dysfunction [11,16,26]. In SH-SY5Y cells, Tang et al. showed that PS-NPs increased ROS and Ca2+ levels while decreasing mitochondrial membrane potential and ATP content, accompanied by cytochrome c release, apoptosis-related signaling, and increased expression of autophagy-associated proteins [14]. The attenuation of these effects by N-acetylcysteine further supports a central role for oxidative stress in PS-NP-induced mitochondrial dysfunction [14]. In addition, Chen et al. [27] reported that acute PS-NP exposure induced UPR-associated signaling in mouse lungs and BEAS-2B cells, including IRE1α, eIF2α, and ATF6α, together with increased global protein ubiquitination. Notably, IRE1α activation was not accompanied by XBP1 mRNA splicing, indicating that activation of individual UPR components does not necessarily reflect complete activation of the corresponding pathway [27]. Collectively, these findings suggest that PS-NPs can induce interconnected oxidative, mitochondrial, and ER stress responses, which may initially represent adaptive mechanisms but, when sustained or excessive, may contribute to impaired proteostasis and apoptosis.
For in vitro model studies, advanced microscopy constitutes a powerful tool for the detailed characterization of cellular morphology, subcellular architecture, and dynamic biological responses to experimental stimuli. Holotomographic microscopy (HTM) offers non-invasive, quantitative three-dimensional imaging capabilities that enable the examination and analysis of cells and tissues without requiring sample preparation such as fixation or staining [28].
The objective of this study was to evaluate the cellular responses associated with exposure to PS-NPs in a neuronal cell model, establishing a concentration–response relationship between increasing concentrations of PS-NPs, their cellular uptake, and the progressive induction of responses to misfolded proteins, a cellular stress response that is relevant to neurodegenerative processes.
2. Methods
2.1. Characterization of Polystyrene Nanoparticles
Polystyrene nanospheres used in this study consisted of a commercial suspension of carboxyl-modified polystyrene nanospheres (PS-NPs-COOH; average diameter: 100 nm; solid content: 2%; fluorescent, excitation/emission 505/515 nm) purchased from Thermo Fisher Scientific (FluoSpheres™, catalog no. F8803, Eugene, OR, USA). According to the manufacturer’s certificate of analysis (lot no. 2916325), the original suspension contained 2.7 × 10¹³ particles/mL with a nominal particle diameter of 110 ± 7 nm.
The concentrations were selected based on previously published studies examining a variety of exposures to concentrations of PS-NPs [4,6,9,14]. The lower concentrations (0.25, 0.5, and 5 μg/mL) were intended to investigate cellular responses under environmental exposure conditions, while the higher concentrations (particularly 50 to 500 μg/mL) were considered elevated exposure conditions, suitable for mechanistic and toxicological assessments, taking into account the potential for cellular bioaccumulation.
Prior to use, the stock suspension was vortexed briefly (10 s) and subsequently dispersed by water bath sonication (continuous mode, room temperature, ~22 °C) for 15 min to ensure adequate redispersion and prevent aggregation. Working concentrations (0.25, 0.5, 5, 25, 50, and 500 µg/mL) were prepared immediately before use by serial dilution of the sonicated stock into supplemented DMEM/F-12 culture medium (Corning, catalog no. 10-090-CV; Corning, NY, USA).
Particle size distribution and zeta potential were determined by dynamic light scattering (DLS) using a Zetasizer Nano ZS (Malvern Instruments Ltd., Malvern, UK). As the primary characterization medium, PS-NPs-COOH were dispersed in ultrapure bidistilled water (n = 3 independent measurements).
To evaluate nanoparticle behavior under conditions approximating those used for cell exposure, DLS measurements were additionally performed in DMEM/F-12 base medium (n = 3 independent measurements).
Particle morphology was further evaluated by atomic force microscopy (AFM) as described in the Supplementary Materials.
2.2. Cell Culture
The human neuroblastoma cell line SH-SY5Y (ATCC CRL-2266) was used as an in vitro model to evaluate neurotoxicity following PS-NP-COOH exposure. Cells were maintained at 37 °C in a humidified incubator (model CCL-170B-9; ESCO Lifesciences, Singapore) with an atmosphere containing 5% CO2 for 24 h. Cells were cultured in DMEM/F-12 medium supplemented with 5% fetal bovine serum (FBS, Corning, catalog no. 35-010-CV; Corning, NY, USA), 2% L-glutamine (Corning, catalog no. 25-005-CL; Corning, NY, USA), and 1% antibiotic–antimycotic solution (penicillin/streptomycin/amphotericin B 100X; Corning, catalog no. 30-004-CI; Corning, NY, USA). In all experiments, exposure treatments were performed on semi-confluent monolayers (85%) after 24 h of culture.
2.3. Cell Viability Assay (MTT)
The SH-SY5Y cells (5 × 10³ cells/well) were exposed to polystyrene nanoparticles (PS-NPs-COOH) at concentrations of 0.25, 0.5, 5, 50, and 500 μg/mL [14] in DMEM/F-12 medium for 24 h. After the exposure period, the treatment medium was completely removed. Cell viability was assessed using the MTT assay (3-[4,5-dimethylthiazol-2-yl]-2,5-diphenyltetrazolium bromide (Sigma-Aldrich, catalog no. M2128; St. Louis, MO, USA)). A working MTT solution (0.5 mg/mL) was prepared in DMEM/F-12 from a sterile stock solution of 5 mg/mL in 1× PBS. Subsequently, 100 μL of MTT solution was added to each well and incubated for 4 h at 37 °C in a humidified incubator with 5% CO2.
After incubation, the MTT solution was carefully removed, and the resulting formazan crystals were solubilized by adding 100 μL of acidified isopropanol (2.5 mL 0.1 N HCl in 22.5 mL isopropanol) per well. Plates were incubated at room temperature for 10 min under gentle agitation to ensure complete dissolution. Absorbance was measured at 492 nm with a reference wavelength of 630 nm using a microplate reader (Stat Fax® 4200; Awareness Technology, Inc., Palm City, FL, USA). Cell viability was expressed as a percentage relative to untreated control cells, which were defined as 100% viability. The assays were performed in four independent biological experiments. In each run, every concentration was tested in 12 wells per treatment.
2.4. Cell Viability by Trypan Blue Exclusion Assay
A total of 80,000 cells per well were seeded in 24-well plates and incubated for 24 h at 37 °C and 5% CO2 to allow cell attachment. Cells were then treated with PS-NPs-COOH at concentrations of 0, 0.5, 5, and 50 μg/mL and incubated for an additional 24 h. The medium was collected from each well, followed by two washes with 200 μL of 1× PBS, and the supernatants were retained.
Cells were detached by adding 200 μL of 0.4% Trypsin-EDTA solution (0.05% trypsin, 0.53 mM EDTA; Corning, catalog no. 25-052-CV; Corning, NY, USA). and incubated for 4 min until complete detachment. Trypsin was neutralized by adding 200 μL of supplemented DMEM/F-12 medium. The total cell suspension (supernatant, washes, and harvested cells) was collected and centrifuged at 300× g for 5 min. The resulting pellet was resuspended in 1 mL of supplemented medium. A 1:1 dilution with trypan blue (0.2%) was performed, and viable and non-viable cells were counted using a Neubauer chamber and the image stained with trypan blue was captured using an inverted phase-contrast microscope (IM-3; OPTIKA S.r.l., Ponteranica, BG, Italy). Cell viability was determined from four independent biological experiments, counting a minimum of 100 total cells per condition in each run.
2.5. Subcellular Identification of PS-NPs-COOH
Intracellular localization of nanoparticles and morphological alterations were evaluated using advanced optical microscopy techniques to assess PS-NP-COOH internalization and structural changes in exposed cells.
2.5.1. Phase-Contrast Microscopy
A total of 80,000 cells per well were seeded in 24-well plates and cultured in supplemented DMEM/F-12 medium until reaching 70–80% confluence. The culture medium was then replaced with DMEM/F-12 containing PS-NPs-COOH at concentrations of 0, 0.5, 5, 50, and 500 μg/mL. Cells were exposed for 24 h under standard incubation conditions (37 °C, 5% CO2). Morphological evaluation was performed using an inverted optical microscope (IM-3; OPTIKA S.r.l., Ponteranica, BG, Italy) in phase-contrast mode to assess cellular integrity and structural alterations induced by different nanoparticle concentrations.
2.5.2. Epifluorescence Microscopy
A total of 80,000 cells per well were seeded in 24-well plates and grown to 70–80% confluence in supplemented DMEM/F-12 medium. Cells were then treated with PS-NPs-COOH at concentrations of 0, 0.5, 5, 50, and 500 μg/mL for 24 h at 37 °C and 5% CO2. After exposure, cells were washed three times with 1× PBS to remove residual particles and counterstained with Hoechst dye 34580 (Invitrogen, Thermo Fisher Scientific, catalog no. H21486; Waltham, MA, USA) (1:1000 dilution) for 10 min.
Following staining, cells were washed three additional times with PBS. Fluorescence imaging was performed using an upright optical microscope (Axioskop 40; Carl Zeiss Microscopy GmbH, Jena, Germany). Image acquisition and analysis were conducted using Image-Pro Plus software (version 4.5.0.19; Media Cybernetics, Inc., Silver Spring, MD, USA). Nuclear diameter analysis: The cells were counterstained with Hoechst, and images were captured under identical acquisition conditions using epifluorescence microscopy (ZEISS Axioskop 40). The images were calibrated according to the microscope’s pixel-to-micrometer scale under the working objective, and the nuclear diameter was determined from individual Hoechst-positive nuclei using digital image analysis (AxioVision 4.x, ZEISS). The maximum nuclear diameter (Dmax), defined as the longest distance across each nucleus, was measured in micrometers (µm). Nuclei that overlapped, were fragmented, were partially located at the edges of the image, or were otherwise unsuitable for accurate segmentation were excluded from the analysis. At least 50 Hoechst-positive nuclei per condition were measured in each run (n ≥ 50 nuclei/group). The mean nuclear diameter (Dmax in µm) obtained from each of the five independent biological experiments was used for statistical analysis.
2.5.3. Holotomographic Microscopy (HTM)
Three-dimensional (3D) cellular structure of SH-SY5Y cells control and after interaction with PS-NPs-COOH were evaluated using holotomographic microscopy (HTM) with a Tomocube HT-2 microscope (Tomocube Inc., Daejeon, Republic of Korea). This system simultaneously generated bright-field images and 3D maps of RI, from which 2D maps of maximum intensity projection (MIP) were visualized.
Cells were seeded in TomoDish™ culture dishes (50 mm; Tomocube Inc., catalog No. 901002-02; Daejeon, Republic of Korea) at a density of 5000 cells/cm2 (approximately 75,000 cells per dish) and cultured for 24 h in supplemented DMEM/F-12 until reaching approximately 50% confluence. The culture medium was then replaced with DMEM/F-12 containing PS-NPs-COOH at 5 and 50 μg/mL to evaluate nanoparticle internalization after 24 h of exposure. Quantitative biophysical profiling was performed with the commercial software TomoAnalysis (Gen3, version 3.3.9 TomocubeInc., Daejeon, Republic of Korea). Cells were segmented in 3D from the HT reconstructions by identifying every region with RI ≥ 1. 3500 to isolate material with an optical density greater than the culture medium; the resulting connected regions were identified as single cells, while objects smaller than ~100 µm3 were identified and removed as debris. Individual single cells were then analyzed across exposure conditions (control: n = 9, 5 µg/mL: n = 6, 50 µg/mL: n = 8) to evaluate cellular heterogeneity and biophysical distributions. The statistical analysis of these results proceeded as per Section 2.10.
2.6. Assessment of Oxidative Stress Using Dihydroethidium (DHE)
A total of 250,000 cells per well were seeded in 6-well plates and treated with PS-NPs-COOH at concentrations of 0.5, 5, and 50 μg/mL for 24 h. The cells were then scraped off, centrifuged in Eppendorf tubes at 3000 rpm for 5 min, and the supernatant was removed. Cells were washed with 1× PBS and resuspended in 500 μL of HEPES sodium buffer (pH 7.2) containing DHE (final concentration 5 μM; Thermo Fisher Scientific, catalog no. D11347; Waltham, MA, USA).
Samples were analyzed by epifluorescence microscopy (Axioskop 40; Carl Zeiss Microscopy GmbH, Jena, Germany)). Fluorescence intensity was measured using a Quantus™ Fluorometer (Promega Corporation, Madison, WI, USA) configured with the Blue Channel (excitation wavelength: 495 nm; emission filter: 510–580 nm), which efficiently captures the fluorescent excitation/emission spectrum of oxidized DHE products. Three independent biological experiments were performed. For each experiment, six technical replicates (wells) per treatment (n = 6) were analyzed and averaged to evaluate intracellular reactive oxygen species (ROS) levels.
2.7. Quantitative Reverse Transcription Polymerase Chain Reaction (qRT-PCR)
Gene Expression Analysis
Total RNA was extracted from 1 × 10⁶ cells per treatment using the Direct-zol RNA Miniprep Kit (Zymo Research, catalog no. C1011-250, Irvine, CA, USA), following the manufacturer’s instructions. The concentration and purity of the extracted RNA were assessed spectrophotometrically by measuring the absorbance at 260 and 280 nm using a BioDrop TOUCH spectrophotometer (BioDrop Ltd., Cambridge, UK)., and the integrity of the RNA was evaluated prior to reverse transcription. Only RNA samples meeting the established quality criteria were used for subsequent analyses. Reverse transcription was performed using 1000 ng of total RNA with the RevertAid First Strand cDNA Synthesis Kit (Thermo Fisher Scientific, catalog no. K1622; Waltham, MA, USA), according to the manufacturer’s instructions.
Gene expression was quantified by real-time quantitative PCR (qPCR) using 50 ng of cDNA and Maxima SYBR Green qPCR Master Mix (2×) (Thermo Fisher Scientific, catalog no. K0221; Waltham, MA, USA) in a StepOne™ Real-Time PCR System (Applied Biosystems, Thermo Fisher Scientific, Waltham, MA, USA). Thermal cycling conditions consisted of an initial denaturation at 95 °C for 3 min, followed by 40 cycles at 95 °C for 15 s and at 66 °C for 30 s. All reactions were performed using cDNA from three independent biological experiments. Each cDNA sample was analyzed in technical duplicates on the qPCR plate.
Oligonucleotide primers were designed to target genes associated with endoplasmic reticulum stress and oxidative stress in SH-SY5Y cells, including GRP78, ATF6, IRE1, PERK, CHOP, BAX, BCL2, CASP3, NRF2, SOD2, and HMOX1 (Table 1). Primer performance was evaluated based on amplification specificity and efficiency prior to quantitative analysis. Relative gene expression levels were normalized using β-actin as the primary reference gene and further validated using tubulin as an independent reference gene. The use of both reference genes provided an additional assessment of the stability of normalization under the experimental conditions. Fold changes in gene expression were calculated using the method [29].
Table 1.
Forward and reverse primers for real-time PCR.
2.8. Immunofluorescence Staining
The SH-SY5Y cell line was grown in 24-well dishes with 8 × 10⁴ cells per well, pre-treated with polystyrene nanoparticles (PS-NPs-COOH) at concentrations of 0.5, 5, and 50 μg/mL for 24 h. After being fixed with 4% paraformaldehyde and incubated with methanol 100% for permeabilization, the cells were blocked with PBS 1×-FBS 1% and incubated with primary antibody rabbit anti-human GRP78 BIP 1:200 (AB21685), rabbit anti-human IRE1 (phosphor S724) 1: 200 (AB48187), and rabbit anti-human ATF-6 1:200 (AB203119), at 4 °C over-night followed by incubation with the secondary antibody (Goat anti-rabbit Alexa Fluor 488, ab150077, Abcam; Cambridge, UK). The cell nuclei were stained with Hoechst as a counterstain. Image analysis was performed using Fiji/ImageJ software version 1.53t (Fiji contributors, Madison, WI, USA). For cell counting, the Set Scale function was used to calibrate the measurement units according to the scale bar. Non-overlapping fields of view per condition were analyzed across three independent biological experiments. The Grid function was then used to generate a grid over the image, and the Cell Counter tool was used to count cells in each field [30]. For each independent experiment, values from multiple fields were averaged before statistical evaluation.
2.9. Puromycin Incorporation Assay
Global protein synthesis was evaluated using the incorporation of puromycin into nascent polypeptide chains [31]. SH-SY5Y cells were seeded in six-well plates at a density of 250,000 cells/well and cultured in 3 mL of supplemented DMEM. Once the cells reached approximately 80% confluence, they were exposed to the corresponding experimental treatments in triplicate (n = 3). After 24 h of treatment with PS-NPs-COOH at concentrations of 0.5, 5, and 50 μg/mL, the culture medium was replaced with supplemented medium containing 1 μM puromycin, and cells were incubated for an additional 15 min to allow puromycin incorporation into newly synthesized proteins.
Following puromycin incubation, the cells were washed with 1× PBS containing 0.00036% digitonin (Sigma-Aldrich, catalog no. D141; St. Louis, MO, USA), followed by a second wash with 1× PBS. Total cellular proteins were subsequently extracted using RIPA lysis buffer (Thermo Scientific, 89901; Waltham, MA, USA) with protease inhibitors (5 mM N-ethylmaleimide, 3 mM iodoacetamide, 1 mM phenylmethanesulfonyl fluoride, and 3 mM tosyl-L-lysine chloromethyl ketone). All inhibitors were purchased from Sigma-Aldrich.
Total protein concentration was determined using the bicinchoninic acid (BCA) assay with the Pierce protein assay kit (Sigma-Aldrich, 23227). For Western blotting, 50 µg of each protein extract was separated in a 10% SDS-PAGE gel and transferred onto PVDF membranes. Puromycin incorporation was detected using a mouse monoclonal anti-puromycin antibody (Sigma-Aldrich, MABE343; 1:1000), followed by a peroxidase-conjugated Goat Anti-Mouse IgG (H + L) secondary antibody 1:5000 (Jackson ImmunoResearch, catalog no 115-035-003; Laboratories, Inc., West Grove, PA, USA). Immunoreactive bands were visualized by chemiluminescence and quantified by densitometric analysis.
The intensity of puromycin-reactive bands across the molecular weight range was used as a measure of global nascent protein synthesis. The puromycin signal was normalized to GAPDH, and relative protein synthesis was compared with that of the untreated control group.
2.10. Statistical Analyses
Statistical analysis was performed using GraphPad Prism version 8.0 (GraphPad Software, Inc., San Diego, CA, USA). Data are expressed as the mean ± standard error of the mean (SEM). Data distribution and homogeneity of variance were evaluated using the Shapiro–Wilk and Levene tests, respectively. Because the assumptions of normality and homoscedasticity were not met, non-parametric tests were used for all analyses. Comparisons among multiple exposure groups and their corresponding controls were carried out using the Kruskal–Wallis test followed by Dunn’s post hoc test for multiple comparisons. A p-value < 0.05 was considered statistically significant.
3. Results
3.1. Characterization of PS-NPs-COOH
The results of DLS analysis are presented in Figure S1 and Table 2 and Table S1. Figure S1 denotes a narrow size distribution for the suspension of NPs in water. A well-defined main peak centered around 119.1 nm is observed, reflecting a narrow hydrodynamic diameter (Dh) with a unimodal size distribution, which is markedly supported by a low polydispersity index (PDI) with a value of 0.021. Within the experimental uncertainty, the calculated Dh agrees well with the manufacturer’s data (polystyrene nanospheres with a nominal diameter of 100 nm). These results are as expected, given that the COOH-PS-NP suspension in water shows colloidal stability, as indicated by its high Z-potential of −63.3. The deprotonation of the carboxylate groups on the surface of the NPs contributes to the stability of the colloid due to repulsive interactions that avoid particle aggregation. A small difference between Dh (119 nm) measured by DLS and the manufacturer’s specification is reasonable, as DLS measures the hydrodynamic shell (core particle plus hydration layer and covalently attached functional groups).
Table 2.
Summary of DLS analysis of carboxylated nanoparticles in Bidistilled water and DMEM media.
Furthermore, Figure S2 depicts the DLS analysis of carboxylated nanoparticles in DMEM medium, indicating an average size increase (Z-average over three measurements) to ~286 nm and a PDI increase to 0.287. This can be expected from the complex composition and viscosity of the DMEM medium. The interaction of the PS-NPs-COOH with the organic and inorganic medium components and dissolved salts results in an increase in the PDI due to a heterogeneous size distribution that results from protein corona thickness variations between individual particles, as well as multiple oligomeric aggregates (dimers, trimers, etc.) that form in the solution. Whereas the water suspensions of COOH-PS-NPs denote colloidal stability, in the DMEM suspension, larger aggregates form over time.
Previous studies report similar zeta potential, hydrodynamic size, and PDI values for PS-NPs in Milli-Q Water and DMEM medium. Although the average hydrodynamic size of the PS-NPs increases in DMEM, several studies demonstrate that fetal bovine serum (FBS) improves PS-NPs’ colloidal stability through steric mechanisms due to protein corona formation [13].
3.2. Cell Viability Assays
3.2.1. MTT Viability Assay
Cell metabolic viability was assessed by MTT assay following 24 h exposure to PS-NPs-COOH at concentrations ranging from 0.25 to 500 μg/mL (Figure 1A). The control group showed viability of 96.14% relative to the normalization baseline, confirming optimal culture conditions. At 0.25 and 0.5 μg/mL, viability remained near the control (83.87% and 81.24%, respectively), with statistically significant differences (p = 0.0067) observed for the 0.5 μg/mL treatment (Kruskal–Wallis with Dunn’s post hoc, p > 0.05). At 5 μg/mL, a non-monotonic partial stabilization was observed, compatible with an adaptive cellular response at intermediate concentrations. Significant reductions in viability were detected at 50 μg/mL (p = 0.0024 vs. control), and the lowest viability was recorded at 500 μg/mL with 67.98% (p < 0.0001 vs. control).
Figure 1.
(A) Cell viability of SH-SY5Y cells after 24 h exposure to PS-NPs-COOH (0.25–500 μg/mL), assessed by MTT assay. Data represent the mean ± SEM from four independent biological experiments (N = 4, performed on separate days), each comprising 12 technical replicates per treatment condition (n = 12 wells/group per run). Statistical analysis: Kruskal–Wallis test with Dunn’s post hoc correction. p < 0.05, p < 0.01 vs. control. (B,C) Cell viability of SH-SY5Y cells after 24 h exposure to PS-NPs-COOH (0.5, 5, 50 μg/mL) was assessed by the trypan blue exclusion assay in the images shown in panel (C); cells exhibiting increased dye permeability due to loss of membrane integrity are indicated by the black arrow, whereas cells showing enhanced dye binding at the plasma membrane are indicated by the red arrow. Data are expressed as mean ± SEM from N = 4 independent biological experiments, with a minimum of 100 total cells counted per condition in each run (n = 100 cells/group per experiment). No statistically significant differences were detected (Kruskal–Wallis, p > 0.05). The inset shows magnified views of selected areas indicated by the dashed squares in the main micrographs.
3.2.2. Cell Viability Determined by Trypan Blue Exclusion Assay
Cell viability assessed by the trypan blue exclusion assay in SH-SY5Y cells after 24 h of exposure to PS-NPs-COOH showed slight variations depending on concentration; however, no significant differences were found (Figure 1B,C). The control group exhibited viability close to 100%, while exposure to 0.5 µg/mL did not produce significant changes (p = 0.0574), maintaining values equal to or slightly higher than the control.
In contrast, concentrations of 5 and 50 µg/mL showed a trend toward decreased cell viability, reaching approximately 85–95% relative to the control. However, these reductions were moderate, reflecting a mild cytotoxic effect under the evaluated conditions.
These results indicate that, in contrast to the MTT assay, cell membrane integrity is not severely compromised at the tested concentrations. This suggests that NPs may induce early metabolic alterations without causing massive cell death in this experimental model.
3.3. Subcellular Effects Induced by the Bioaccumulation of PS-NPs-COOH in SH-SY5Y Cells
In this analysis, phase-contrast imaging revealed that control SH-SY5Y cells exhibited a characteristic neuronal-like morphology, with well-defined cell bodies and prominent neurite extensions. At low concentrations (0.5 and 5 μg/mL), cells largely preserved this morphology, although subtle changes in cell density and spatial organization were observed. In contrast, exposure to higher concentrations (50 and 500 μg/mL) resulted in a marked loss of neuritic processes, a transition toward a rounded or oval morphology, and reduced cell adherence, indicative of cytotoxicity-associated structural alterations.
Green fluorescence corresponding to PS-NPs-COOH was negligible in control cells and at 0.5 μg/mL. A faint fluorescent signal became detectable at 5 μg/mL and increased markedly at 50 and 500 μg/mL, indicating a dose-dependent intracellular accumulation of NPs. Hoechst staining revealed nuclei with regular morphology and homogeneous distribution in control and low-dose conditions. However, at higher concentrations, an increase in nuclear diameters was observed, as well as condensation characteristic of nuclear damage and apoptotic processes (Figure 2A,B).
Figure 2.
(A) Epifluorescence microscopy of SH-SY5Y cells exposed to PS-NPs-COOH, including phase-contrast images to assess cell morphology, PS-NP-COOH fluorescence to visualize nanoparticle uptake and distribution, Hoechst staining to label cell nuclei, and merged images illustrating the spatial relationship between nanoparticles and cellular structures. (B) Nuclear diameter (µm) of cells exposed to increasing concentrations of PS-NPs-COOH (0.5, 5, 50, and 500 µg/mL) compared to control. A significant increase in nuclear size was observed in all treated groups relative to control (p < 0.001). Data represent the mean ± SEM from five independent biological experiments. Individual data points correspond to the mean nuclear diameter calculated from a minimum of 50 nuclei analyzed per condition in each experiment.
Merged images showed a partial overlap between the PS-NP-COOH (green) and the nuclear staining (blue), especially in the perinuclear regions. Although these observations are consistent with the internalization of the NPs, the apparent overlap with the nuclear signal could suggest the possibility that the nanoparticles are located within the nucleus or very close to it. However, these images do not provide sufficient evidence to confirm direct nuclear localization.
These findings demonstrate that exposure to PS-NPs-COOH induces concentration-dependent cellular uptake, accompanied by pronounced morphological and nuclear alterations in SH-SY5Y cells, especially at concentrations ≥50 μg/mL.
Holotomographic Microscopy Analysis
Three-dimensional refractive index (RI) reconstructions of control SH-SY5Y cells by holotomographic microscopy (HTM) revealed characteristic neuronal-like morphology: a polygonal to elongated cell body with well-defined plasma membrane boundaries, homogeneous cytoplasmic optical density, a centrally located spherical-to-ovoid nucleus with higher RI contrast relative to the surrounding cytoplasm, and frequent neurite-like projections characteristic of the neuroblastoma-derived neuronal phenotype (Figure 3A,B and Figure S3a–e).
Figure 3.
Holotomographic microscopy of SH-SY5Y cells exposed to PS-NPs-COOH. Control cells show typical neuronal-like morphology with homogeneous RI distribution and a centrally located nucleus (A,B). At 5 μg/mL, cells maintain overall morphology with increased RI heterogeneity and perinuclear nanoparticle accumulation (C,D). At 50 μg/mL, larger intracellular aggregates are observed, predominantly in perinuclear regions, indicating enhanced uptake and early subcellular alterations in a concentration-dependent manner (E,F).
At 5 μg/mL, cells maintained an overall adherent morphology; however, increased heterogeneity in RI distribution was evident throughout the cytoplasm, revealing localized alterations in molecular composition. Green fluorescence imaging confirmed the presence of dispersed PS-NPs-COOH accumulating preferentially in perinuclear regions. Peripheral fluorescent signals indicated ongoing nanoparticle uptake at the cell membrane (Figure 3C,D and Figure S4a,b).
At 50 μg/mL, more pronounced intracellular accumulation was observed, characterized by the formation of larger, more defined NP aggregates concentrated in the perinuclear region. Despite preserved cell adhesion at this stage, the increased nanoparticle burden and cytoplasmic RI heterogeneity indicate early subcellular stress associated with higher NP loads. These findings demonstrate a concentration-dependent increase in nanoparticle internalization and intracellular aggregation, accompanied by progressive changes in subcellular organization (Figure 3E,F and Figure S5a–d).
Quantitative HTM analysis of cellular biophysical parameters revealed dose-dependent alterations in the morphological and compositional properties of SH-SY5Y cells exposed to PS-NPs-COOH (Figure 4). Control cells established the baseline biophysical profile: regular cellular volume, surface area, and projected area consistent with the adherent neuronal-like phenotype of undifferentiated SH-SY5Y cells; a mean refractive index (RI) of approximately 1.37, reflecting bulk intracellular protein and organelle composition (Figure 4A).
Figure 4.
(A,B) Quantitative holotomographic microscopy parameters of SH-SY5Y cells exposed to PS-NPs-COOH at control, 5 µg/mL, and 50 µg/mL: cellular volume (µm3), surface area (µm2), projected area (µm2), mean refractive index (RI), dry mass (pg), and sphericity index. The data are presented as violin plots showing individual scatter points with median and interquartile ranges to fully illustrate cellular heterogeneity and biophysical distribution across treatment groups. Statistical analysis: Kruskal–Wallis test with Dunn’s multiple-comparisons post hoc. p < 0.05 vs. control.
At 5 µg/mL, statistically significant alterations in biophysical parameters were observed relative to control. Cellular volume exhibited marked inter-individual heterogeneity, reflecting divergent cellular responses within the same exposure condition: subpopulations undergoing cytoplasmic condensation coexisted alongside cells exhibiting adaptive volume expansion. Surface area and projected area were reduced significantly at this concentration (p < 0.05 vs. control), while sphericity increased, indicating possibly a shift toward a more rounded morphology associated with early cytoskeletal remodeling and initiation of cellular stress (Figure 4A,B).
At 50 µg/mL, persistent morphological compaction was evident: surface area and projected area remained significantly below control values despite partial normalization of cellular volume (p < 0.05), indicating structural remodeling rather than physiological recovery. Sphericity decreased relative to 5 µg/mL, reflecting increased morphological heterogeneity and incipient structural disruption associated with higher nanoparticle loads. Progressive decline in dry mass at 50 µg/mL, together with a decrease in mean RI approaching but remaining below control values, points to redistribution of intracellular components and compromised cellular integrity. Collectively, these data demonstrate a biphasic biophysical response: initial cytoplasmic condensation and volume heterogeneity at 5 µg/mL, followed by partial structural disruption and dry mass depletion at 50 µg/mL (Figure 4A,B).
3.4. PS-NPs-COOH Induce Increased Superoxide Production as Determined by Dihydroethidium (DHE)
Fluorescence microscopy analysis using the DHE probe revealed intracellular red fluorescence, indicative of reactive oxygen species (ROS) production, specifically the superoxide anion (Figure 5A,B). A dose-dependent increase in fluorescence intensity was observed in treated groups compared to the control, evidencing enhanced oxidative stress (Figure 5A).
Figure 5.
Evaluation of reactive oxygen species (ROS) production using the DHE probe in SH-SY5Y cells exposed to PS-NPs-COOH. Representative fluorescence images show a progressive increase in red signal with increasing concentrations (0.5, 5, and 50 µg/mL) compared to control (A). Quantitative analysis of Relative Fluorescence Units (RFU) confirms a significant dose-dependent increase in ROS generation (B). Data are presented as mean ± SEM from N = 3 independent biological experiments (individual dots represent the average value of each independent run). p < 0.01, p < 0.001 vs. control. Scale bar: 100 µm.
Furthermore, fluorometric quantification of DHE demonstrated a significant increase in fluorescence intensity in cells exposed to PS-NPs-COOH in a dose-dependent manner (Figure 5B). Notably, significant differences were observed at concentrations of 5 and 50 μg/mL compared to both the control group and the lowest concentration (0.5 μg/mL), evidencing increased superoxide production. Fluorescence values were normalized to total protein content.
3.5. PS-NPs-COOH Modulate the Expression of Components of All Three Canonical UPR Branches
To simultaneously illustrate global transcriptional trends and detailed experimental variability, gene expression profiles are depicted through comprehensive individual bar charts showing biological replicates, relative expression values, and statistical significance for selected transcripts (Figure 6) as well as heatmap representing log2 fold-changes across UPR, apoptotic, and antioxidant pathways (Figure 7).
Figure 6.
Relative mRNA expression of genes involved in (A) endoplasmic reticulum stress, (B) apoptosis, and oxidative stress in SH-SY5Y cells exposed to PS-NPs-COOH for 24 h. Relative mRNA expression of GRP78, ATF6, PERK, IRE1, CHOP, BAX, BCL2, CASP3, NRF2, SOD2, and HOX was quantified by RT-qPCR in SH-SY5Y cells following exposure to PS-NPs-COOH at 0.5, 5, and 50 μg/mL. Gene expression levels were normalized to β-actin as the reference gene and calculated using the method. Expression levels are presented as fold change relative to the untreated control group (set to 1). Data are expressed as mean ± SEM from three independent biological replicates (n = 3 per group). Statistical analyses were performed using the Kruskal–Wallis test followed by Dunn’s multiple-comparisons post hoc test. Statistical significance is indicated as p < 0.05 and p < 0.01.
Figure 7.
Heat map of relative mRNA expression (2−ΔΔCt) of 11 genes associated with ER stress/UPR, apoptosis, and antioxidant response in SH-SY5Y cells exposed to PS-NPs-COOH (0.5, 5, and 50 μg/mL) for 24 h. Values represent mean fold change relative to the control group (n = 3 biological replicates). Color scale (log2): white = FC of 1 (no change); dark red = FC ≥ 10 (log2(FC) ≥ 5). Genes are grouped by functional category: UPR/ER Stress, Apoptosis, and Antioxidant Response. SOD2 and NRF2 exhibit the highest induction levels across all conditions. CASP3 shows a characteristic biphasic pattern with attenuation at 5 μg/mL.
The analysis of GRP78 (HSPA5), the master ER stress sensor and chaperone, showed a progressive, dose-dependent increase: 1.99-fold at 0.5 μg/mL, 1.63-fold at 5 μg/mL, and 2.86-fold at 50 μg/mL. ATF6 expression increased progressively from 0.62-fold at 0.5 μg/mL to 2.42-fold at 50 μg/mL, indicating dose-dependent activation of this branch. PERK (EIF2AK3) shows an early-activation plateau: expression reached 2.19-fold at both 0.5 and 5 μg/mL and declined modestly to 1.91-fold at 50 μg/mL, raising the possibility of saturation of PERK-mediated eIF2α phosphorylation or negative regulatory feedback at higher NP concentrations. IRE1α (ERN1) induction was moderate and relatively concentration-independent (1.02–1.16-fold). The downstream pro-apoptotic transcription factor CHOP (DDIT3) was induced: (i) 1.71-fold at 0.5 μg/mL, (ii) 1.43-fold at 5 μg/mL, and (iii) 2.37-fold at 50 μg/mL (peak), demonstrating progression toward pro-apoptotic UPR output at the highest concentration. Statistically significant upregulation was confirmed for GRP78, ATF6, and CHOP at ≥one concentration (p < 0.05, Kruskal–Wallis with Dunn’s post hoc) (Figure 6A and Figure 7).
The BCL2 mRNA expression increased progressively, reaching: (i) 0.44-fold at 0.5 μg/mL, (ii) 1.89-fold at 5 μg/mL, and (iii) 3.09-fold at 50 μg/mL. BAX expression followed a non-monotonic pattern, increasing 2.42-fold at 0.5 μg/mL, decreasing to 0.57-fold at 5 μg/mL, and increasing again to 3.05-fold at 50 μg/mL. At all tested concentrations, BCL2 expression exceeded BAX expression, resulting in a BCL2/BAX mRNA ratio greater than 1. These findings denote a relative predominance of BCL2 over BAX at the transcriptional level across the tested concentration range.
CASP3 exhibited a non-monotonic, biphasic expression profile, with a marked increase at 0.5 μg/mL (5.49-fold), a reduction at 5 μg/mL (3.02-fold), and the highest expression level at 50 μg/mL (6.54-fold). At 0.5 μg/mL, CASP3 transcript levels increased without significant cytotoxicity, as assessed by MTT and trypan blue assays. The subsequent increase at 50 μg/mL coincided with the highest CHOP expression and the strongest antioxidant response. These findings indicate concentration-dependent changes in the transcriptional regulation of apoptosis-related genes following PS-NP-COOH exposure. BCL2 and CASP3 expression values differ in treated groups (statistically significant differences) at one or more concentrations compared with the control (p < 0.05).
Antioxidant response genes showed the highest absolute fold-change values of all 11 genes analyzed, with all three markers increasing progressively and dose-dependently. NRF2 (NFE2L2) mRNA increased 5.99-fold at 0.5 μg/mL, 5.88-fold at 5 μg/mL, and 8.10-fold at 50 μg/mL, the largest single induction value among all UPR, apoptotic, and antioxidant genes at the highest concentration. SOD2, encoding the cytoplasmic manganese superoxide dismutase, was the most highly induced gene in the entire panel: 6.54-fold at 0.5 μg/mL, 6.24-fold at 5 μg/mL, and 7.36-fold at 50 μg/mL. Substantial SOD2 upregulation at 0.5 μg/mL, maintained across concentrations and peaking at 50 μg/mL, is corroborated by DHE data showing significant superoxide production even at the lowest tested dose. The increase in SOD2 expression suggests activation of a mitochondrial antioxidant response, consistent with the increased DHE fluorescence observed following PS-NP-COOH exposure, indicating enhanced oxidative stress.
In addition, HMOX1 showed a non-monotonic expression pattern: 1.53-fold at 0.5 μg/mL, −0.01-fold at 5 μg/mL, and 2.91-fold at 50 μg/mL. Differences (statistically significant) in the upregulation values of NRF2, SOD2, and HMOX1 were confirmed at ≥one concentration vs. control (p < 0.05, Kruskal–Wallis with Dunn’s post hoc). The NRF2 and SOD2 co-induction at 50 μg/mL indicates that the antioxidant defense system operates at maximum inductive capacity at this concentration, paralleled by the significant viability loss recorded by MTT at the same dose (Figure 6B and Figure 7).
3.6. PS-NPs-COOH Induce Concentration-Dependent Changes in ER Stress-Associated Protein-Positive Cells
Exposure to PS-NPs-COOH for 24 h altered the number of cells positive for GRP78, p-IRE1α, and ATF6 compared with the control group. Immunofluorescence images showed limited signals for these markers in control cells, whereas PS-NP-COOH-treated cells exhibited visibly increased immunofluorescent signals and a higher number of positive cells.
For GRP78, a significant increase in the number of positive cells was observed at 0.5 µg/mL (~40 cells/mm2; p < 0.05), while the greatest increase was detected at 50 µg/mL (~95–100 cells/mm2; p < 0.01). Consistent with the quantitative analysis, the immunofluorescence images showed a greater presence of GRP78 signal in cells exposed to PS-NPs-COOH, particularly at 50 µg/mL.
For p-IRE1α, the control group exhibited minimal signal. Exposure to 0.5 µg/mL resulted in a significant increase in positive cells (~5 cells/mm2; p < 0.05), whereas treatment with 50 µg/mL produced the highest number of positive cells (~34 cells/mm2; p < 0.01). The immunofluorescence images were consistent with the quantitative findings, showing an increased presence of p-IRE1α signal with increasing PS-NP-COOH exposure.
ATF6 limited signal was observed in the control and 0.5 µg/mL exposure groups. At 5 µg/mL, the number of positive cells increased markedly to approximately 390 cells/mm2, representing a statistically significant difference compared with the control (p < 0.01). At 50 µg/mL, approximately 300–320 cells/mm2 are present, also showing a significant difference compared with the control (p < 0.05). The immunofluorescence images showed greater intensity and distribution (with respect to ATF6 signal) at both higher treatment concentrations.
Overall, exposure to PS-NPs-COOH significantly increased the number of cells positive for GRP78, p-IRE1α, and ATF6, although each marker displayed a distinct concentration-dependent pattern. GRP78 and p-IRE1α showed their greatest responses at 50 µg/mL, whereas ATF6 reached its highest number of positive cells at 5 µg/mL, followed by a relative decrease at 50 µg/mL. These findings demonstrate changes in the cellular presence of proteins associated with the endoplasmic reticulum stress response following exposure to PS-NPs-COOH (Figure 8A,B).
Figure 8.
(A) PS-NPs-COOH alter the cellular distribution of ER stress-associated markers in SH-SY5Y cells. Representative immunofluorescence images showing GRP78, p-IRE1α, and ATF6 expression in SH-SY5Y cells following 24 h exposure to PS-NPs-COOH at 0.5, 5, and 50 µg/mL (green mark). Nuclei were counterstained with Hoechst (blue), while immunofluorescent signals for the respective markers are shown in Alexa Fluor 488 (red). (B) Quantification represents the number of marker-positive cells per mm2. PS-NP-COOH exposure increased the number of GRP78- and p-IRE1α-positive cells, with the greatest response observed at 50 µg/mL, whereas ATF6-positive cells reached their highest level at 5 µg/mL and showed a relative decrease at 50 µg/mL. Data are expressed as cells/mm2 and presented as mean ± SEM from 3 independent biological experiments (individual dots represent the average value of each independent run. Statistical significance was determined relative to the control group and indicated as p < 0.05 and p < 0.01.
3.7. Protein Synthesis Rate Assessment with Puromycin
Puromycin assay data show that the control group pretreatment (with puromycin) increases the rate of protein synthesis (7.92 ± 1.15 relative units). The untreated control group had a value of 1.98 ± 0.23. The difference was statistically significant (p = 0.0004). The group treated with the pentacyclic alkaloid HHT showed a very low protein synthesis rate (1.83 ± 0.17 relative units), similar to the group without puromycin pretreatment. In contrast, PS-NP-COOH-exposed groups showed a slight increase (10.30 ± 0.21) at a low dose (0.5 µg/ml) and a significant decrease at higher doses (5 µg/ml; 3.94 ± 0.26) and 50 µg/ml (4.8 ± 0.14) (Figure 9).
Figure 9.
Evaluation of protein synthesis rate by puromycin (PM) incorporation (SUnSET assay). (A) Representative Western blot analysis of puromycin-labeled proteins in cells treated with nanoparticles at different concentrations (0.5, 5, and 50 µg/mL). Untreated control, puromycin-treated control, and translation inhibition control using homoharringtonine (HHT) are included. Band intensity reflects the incorporation of puromycin into nascent polypeptide chains, serving as an indicator of translational activity. (B) Densitometric quantification of puromycin signal normalized to GAPDH. Data are presented as mean ± SEM from three independent biological replicates (n = 3 per group). A significant increase in protein synthesis is observed at low concentration (0.5 µg/mL), whereas a decrease is evident at higher concentrations (5 and 50 µg/mL) compared to the puromycin control. HHT treatment markedly reduces the signal, confirming effective inhibition of translation. p < 0.01, p < 0.001 vs. control.
4. Discussion
The results of the present study demonstrate that 100 nm PS-NPs-COOH induce significant neurotoxic effects in SH-SY5Y cells, characterized by a dose-dependent decrease in cell viability, nuclear morphological alterations, intracellular accumulation, increased oxidative stress, and a concentration-dependent increase in antioxidant and endoplasmic reticulum (ER) stress response pathways.
PS-NPs age in natural environments because of their exposure to environmental conditions (radiation, redox, and acid–base equilibria). As a result, the surface properties and morphology change. Recent studies report a time-dependent rise in surface oxygen content and functional groups in aged PS-NPs, favoring polar interactions [32]. In this study, we use commercial PS-NPs-COOH as a model toxicant. Due to the negative charge of the PS-NP surface groups under physiological conditions, colloidal stability increases, avoiding hampered interpretation of their bioactivity due to aggregation.
This study shows that exposure to PS-NPs-COOH significantly reduces SH-SY5Y cell viability after 24 h. The cytotoxic effect is dose-dependent, particularly evident at higher concentrations (50–500 µg/mL). A non-monotonic trend at 5 μg/mL suggested partial cellular adaptation to intermediate concentrations. At 50 μg/mL, viability decreased significantly, establishing a cytotoxic threshold relative to the control. These findings agree with those of Laganà et al. [16], who reported dose-dependent reductions in viability in SH-SY5Y cells exposed to modified and oxidized PS nanoparticles, with the most pronounced effects observed at the highest concentrations tested. Similarly, Tang et al. [14] documented significant cytotoxicity in SH-SY5Y cells at concentrations ≥ 100 μg/L through mechanisms involving the activation of autophagy and mitochondrial dysfunction.
The cytotoxic response to PS-NPs-COOH documented here is consistent with the multi-mechanistic cell death framework recently described by Bu et al. [33], who systematically reviewed the biological impacts of PS-NPs on cellular systems and demonstrated that PS-NPs can simultaneously induce apoptosis, ferroptosis, necroptosis, and pyroptosis through distinct yet interconnected molecular pathways. Based on the above regarding various reported processes of cell death and/or cellular adaptations caused by nanoplastics [14,33], this could explain the dose-threshold behavior observed in the current MTT data, in which significant cytotoxicity is observed starting at 0.5, 50 and 500 µg/mL. Once these concentrations had been evaluated using the MTT assay, 0.5, 5, and 50 μg/mL were selected for the remaining analyses. This selection was based on the absence of significant changes at 0.25 μg/mL compared with the control group, whereas 500 μg/mL resulted in nanoparticle aggregation, modifying particle properties and biological outcomes.
The trypan blue exclusion assay did not detect statistically significant differences in membrane integrity at any tested concentration (0.5–50 μg/mL), although a trend toward reduced viability was observed at 5 and 50 μg/mL (~90% and ~88%, respectively). The dissociation between metabolic impairment (MTT) and membrane integrity (trypan blue) in Masson-Meyers et al. [34] indicates that PS-NPs-COOH primarily compromise mitochondrial activity rather than plasma membrane structure at these concentrations. This interpretation possibly aligns with observations by Huang et al. [4], who reported mitochondrial-specific dysfunction without concomitant membrane rupture in differentiated SH-SY5Y cells exposed to PS-NPs, and with Mota et al. [13], who demonstrated that carboxylated nanoplastics exhibit greater cellular uptake and metabolic disruption than unmodified counterparts in human neuronal cells.
From a molecular perspective, oxidative stress emerges as a central component. Laganà et al. [16] reported a rapid and sustained increase in reactive oxygen species (ROS) production in cells exposed to oxidized particles, which is reinforced by the reduced metabolic activity observed in the MTT assay of the present study. However, findings by Huang et al. [4] suggest that cytotoxicity induced by polystyrene nanoparticles is not exclusively dependent on oxidative stress. In their study, SH-SY5Y cells were exposed to PS-NPs-COOH for 48 h and subsequently treated with the antioxidant N-acetylcysteine; however, this intervention did not fully restore cell viability. Their results identified intracellular nanoparticle accumulation, particularly within mitochondria, as a key driver of cellular dysfunction. This mechanism is supported by our findings, where decreased viability may reflect mitochondrial and metabolic alterations beyond oxidative damage.
Additionally, Cai et al. [1] demonstrated that co-exposure to chemical contaminants (e.g., PFOA) and polystyrene nanoparticles significantly exacerbates cytotoxicity in SH-SY5Y cells, impairing not only viability but also proliferation and migration. These findings suggest that nanoplastics may act as toxicity amplifiers in complex environmental contexts, extending the relevance of our results to more realistic exposure scenarios.
Regarding morphological changes, the increase in nuclear diameter observed in this study suggests structural alterations associated with cellular stress. This phenomenon may be linked to chromatin remodeling, DNA damage, or activation of cell death programs [35]. Although this parameter has been less explored in the context of nanoplastics, sustained oxidative stress has been shown to induce nuclear alterations preceding apoptosis.
Shape is an inherent property of nanomaterials that influences their toxicity. Advanced microscopy techniques represent versatile tools for elucidating nanoparticle (NP) interactions with living systems [36], providing complementary strategies to assess their toxicological potential at the cellular level. In the present study, microscopy-based approaches were used to evaluate NP internalization and to confirm, through fluorescent labeling, the cellular alterations associated with nanoplastic exposure.
Holotomographic microscopy (HTM) provided label-free, three-dimensional, quantitative evidence of concentration-dependent morphological and biophysical alterations in SH-SY5Y cells exposed to PS-NPs-COOH. Analysis of RI-derived quantitative parameters (Figure 4) demonstrated that exposure to 5 µg/mL induced significant inter-individual cellular volume heterogeneity and increased sphericity, reflecting early changes in cellular architecture and a shift toward a more rounded morphology associated with cellular stress. These alterations were accompanied by reductions in surface area, projected area, and dry mass, indicating that exposure to PS-NPs-COOH was associated with measurable changes in cellular morphology and biophysical composition. These findings are consistent with the molecular responses observed at this concentration, including the activation of pathways associated with cellular stress. At 50 µg/mL, persistent morphological compaction, evidenced by surface area and projected area remaining significantly below control values despite partial normalization of cellular volume, together with the progressive reduction in dry mass, indicated more pronounced alterations in cellular biophysical properties under higher nanoparticle exposure. These changes were concomitant with the molecular responses associated with oxidative stress, cellular stress, and apoptotic signaling observed at this concentration. Medina-Ramírez et al. [37] demonstrated that HTM can quantitatively resolve cellular and intracellular structural alterations that may be difficult to characterize using conventional imaging approaches, supporting the use of HTM as a complementary tool for investigating nanoparticle-induced cellular responses. Santoro et al. [5] reviewed evidence indicating that nanoplastics can interact with intracellular organelles and induce organelle-associated stress responses. In the present study, the observed RI heterogeneity provides evidence of intracellular structural alterations, although the specific subcellular localization of PS-NPs-COOH cannot be established solely from RI measurements.
Our findings indicate that PS-NP-COOH exposure induced a concentration-dependent increase in DHE-derived fluorescence, consistent with enhanced intracellular oxidative stress. Importantly, this response was accompanied by increased expression of NRF2, SOD2, and HMOX1, suggesting the engagement of an adaptive antioxidant response. These findings are consistent with the observations of Guo et al. [38], who reported that exposure to polystyrene nanoplastics induced oxidative stress and mitochondrial damage in HepG2 and L02 cells while simultaneously activating the Nrf2 pathway. Notably, inhibition of Nrf2 exacerbated PS-NP-induced oxidative and mitochondrial damage, supporting a protective role for Nrf2 in maintaining cellular redox homeostasis during nanoplastic exposure.
The sustained upregulation of NRF2 and SOD2 suggests the persistence of an antioxidant response under PS-NP exposure, potentially reflecting cellular adaptation to oxidative stress. The preferential induction of SOD2, a mitochondrial manganese superoxide dismutase, over cytosolic markers identifies mitochondria as the primary site of ROS generation, consistent with the findings of Huang et al. [4] and Tang et al. [14], who reported mitochondrial membrane potential disruption as an early event following PS-NP internalization. Liang et al. [39] demonstrated that NRF2 deficiency converts PS-NP-induced oxidative stress into ferroptosis in gut cells via ether phospholipid peroxidation, underscoring the protective role of the NRF2–SOD2–HMOX1 axis documented here. González-Caballero et al. [35] reported comparable NRF2 induction in immortalized human neural stem cells exposed to PS-NPs, indicating that this antioxidant response is a conserved feature across human neural cell models.
The neuroinflammatory dimension of PS-NP-induced oxidative stress was further characterized by Song et al. [40], who demonstrated that PS-NPs activate the MAPK signaling pathway in BV2 microglial cells, inducing intracellular ROS accumulation, upregulation of pro-inflammatory cytokines, and apoptosis. Although the present study employed a monoculture neuronal model that precludes direct assessment of microglial crosstalk, the massive NRF2–SOD2 induction observed at 50 µg/mL is commensurate with the oxidative burden sufficient to trigger neuroinflammatory responses in the presence of resident glial cells, further supporting the use of co-culture or organoid models in future studies.
Beyond mitochondrial oxidative damage, recent studies have highlighted the role of endoplasmic reticulum (ER) stress as a key mechanism in MNP-induced cytotoxicity [41]. Intracellular accumulation of these particles can interfere with protein folding processes, triggering activation of the unfolded protein response (UPR). When sustained and unable to restore proteostasis, UPR activation shifts toward pro-apoptotic signaling, ultimately leading to neuronal cell death [5,41]. Oxidative stress and ER stress are closely interconnected: ROS can exacerbate protein misfolding, while ER stress can amplify ROS production, establishing a feedback loop that promotes cellular dysfunction [41].
The expression profile of UPR-related genes was accompanied by changes in the cellular presence of ER stress-associated proteins following PS-NP-COOH exposure. GRP78 (HSPA5), the primary regulator of endoplasmic reticulum stress, gradually increased as the concentration of nanoplastics rose, confirming sustained proteostatic stress across the entire range of exposure concentrations.
The PERK-associated response showed an increase in transcription at all concentrations analyzed, which was consistent with the immunofluorescence results, which revealed increased cellular positivity for GRP78 and changes in the distribution of endoplasmic reticulum stress-associated signals. Although the present study did not evaluate PERK phosphorylation or subsequent eIF2α phosphorylation, the concomitant changes in PERK-related transcription and in the puromycin assay indicate an altered cellular response in overall protein synthesis following exposure to PS-NPs-COOH.
Similarly, the IRE1α-associated response was supported by the increased presence of p-IRE1α-positive cells, particularly at the highest concentration tested. The progressive increase in p-IRE1α-positive cells with increasing PS-NP-COOH exposure was consistent with the observed changes in ER stress-associated gene expression, suggesting that the IRE1α branch was responsive to nanoparticle exposure. However, because XBP1 splicing was not evaluated, these findings do not establish activation of the complete IRE1α/XBP1 signaling pathway.
The ATF6 response displayed a distinct concentration-dependent pattern. ATF6-positive cells increased markedly at intermediate concentration and remained significantly elevated at the highest concentration, although a relative reduction was observed at 50 µg/mL compared with 5 µg/mL. This pattern was consistent with the transcriptional changes observed for ATF6 and indicates that the cellular response associated with this UPR component was not strictly proportional to nanoparticle concentration.
Overall, the combined findings from the transcriptional and immunofluorescence analyses indicate that exposure to PS-NPs-COOH alters multiple components associated with the endoplasmic reticulum stress response, including GRP78, p-IRE1α, and ATF6. Importantly, these findings are consistent with observations reported by Chen et al. [27] in BEAS-2B cells, in which increased p-IRE1α and ATF6 expression was associated with adaptive and pro-survival responses to PS-NP-induced cellular stress. Similarly, in our study, the observed increases in these ER stress-related markers may reflect an adaptive response aimed at maintaining cellular homeostasis and promoting cell survival following PS-NP-COOH exposure. This interpretation is further supported by the cytotoxicity assays, which did not reveal a significant reduction in cell viability under the experimental conditions evaluated, suggesting that the cellular stress response may remain predominantly adaptive rather than progressing toward overt loss of viability.
The downstream pro-apoptotic transcription factor CHOP (DDIT3) was increased following PS-NP-COOH exposure across the tested concentrations, with the highest expression observed at the highest concentration. These findings indicate an association between PS-NP-COOH exposure and increased expression of a pro-apoptotic ER stress-associated marker, particularly under the highest exposure condition. Chen et al. [42] documented equivalent UPR branch activation, including PERK, IRE1, and ATF6 upregulation, alongside global protein ubiquitination in mouse lungs acutely exposed to PS-NPs, supporting the interpretation that ER proteostasis disruption is a conserved mechanism of nanoplastic toxicity across tissue types. Lu et al. [41] further demonstrated that ER stress-driven CHOP upregulation activates the NLRP3 inflammasome in polystyrene microplastic-exposed chicken lung cells, highlighting that CHOP-mediated transcription amplifies inflammatory cascades beyond direct apoptotic pathways. Li et al. [43] proposed that relative PERK dominance over IRE1 directs the UPR toward apoptotic rather than adaptive outcomes, consistent with the PERK-dominant pattern observed here preceding significant cytotoxicity at 50 μg/mL.
The downstream consequences of UPR activation by PS-NPs at the tissue level were further elucidated by Wei et al. [44], who demonstrated that whole-brain organoids (WBOs) exposed to PS-NPs (50–100 µg/mL, 50 nm) exhibited aberrant neural epithelial architecture, marked DNA double-strand damage, and substantial activation of the TLR9/MyD88 innate immune signaling pathway. This led to significant upregulation of the excitotoxicity marker c-Fos and the excitatory synaptic receptor NMDAR, linking the ER stress and oxidative damage observed in isolated neural cells to excitotoxic neuronal dysfunction in more complex three-dimensional neural models. The concentration overlaps between Wei’s work (50 µg/mL) and the present study, together with the convergent activation of ROS-dependent and proteostasis-disruption pathways, strengthens the translational relevance of the molecular signatures identified here and underscores the need to evaluate PS-NP neurotoxicity in architecturally organized neural systems.
Although CHOP expression increased following PS-NP-COOH exposure, BCL2 and BAX expression exhibited distinct concentration-dependent changes at the transcriptional level. BCL2 mRNA expression progressively increased with increasing PS-NP-COOH concentrations, whereas BAX expression showed a non-linear pattern, with an initial increase, a relative reduction at the intermediate concentration, and a subsequent increase at the highest concentration. Despite these changes, the BCL2/BAX mRNA ratio remained above 1 across all concentrations analyzed, indicating a relative predominance of BCL2 transcripts over BAX transcripts. This expression profile may reflect an adaptive cellular response that could contribute to maintaining apoptotic balance under PS-NP-COOH exposure. Consistent with this interpretation, no significant cytotoxic effects were observed at concentrations below 50 μg/mL, as assessed by MTT and trypan blue assays, suggesting that the transcriptional changes in apoptosis-related genes may occur as part of an early cellular response to nanoparticle exposure rather than as evidence of overt cell death. These findings are consistent with previous observations by González-Caballero et al. [35], who reported a concentration-dependent upregulation of BCL2 in human neural stem cells exposed to PS-NPs.
CASP3 mRNA exhibited a non-monotonic expression pattern, characterized by marked increases at the lowest and highest concentrations, with a pronounced attenuation at the intermediate concentration. This pattern indicates that the transcriptional response of CASP3 did not increase proportionally with PS-NP-COOH exposure and suggests a concentration-dependent, non-linear regulation of this apoptosis-associated gene. At 0.5 μg/mL, the marked increase in CASP3 transcript occurred in the absence of significant cytotoxicity, indicating transcriptional modulation of apoptosis-related pathways without evidence of overt loss of cell viability. This apparent dissociation between increased CASP3 transcription and preserved viability may reflect the engagement of adaptive cellular responses, including autophagy, which can contribute to cellular homeostasis and survival under sublethal stress conditions. In this context, previous findings have shown that PS-NPs can induce autophagy activation together with mitochondrial dysfunction in SH-SY5Y cells, supporting the possibility that autophagic responses may contribute to maintaining cellular viability during early or sublethal nanoparticle exposure. At 5 μg/mL, the attenuation of CASP3 expression occurred concomitantly with changes in BCL2 expression, although these transcriptional changes do not establish functional inhibition of apoptotic signaling. At 50 μg/mL, the marked increase in CASP3 expression coincided with maximal CHOP induction and a significant reduction in MTT activity, indicating increased cellular stress at the highest concentration tested. Overall, these findings indicate concentration-dependent modulation of apoptosis-related gene transcription, while the preserved viability at lower concentrations may be compatible with the activation of adaptive survival responses, including autophagy. However, CASP3 mRNA expression alone does not establish caspase-3 activation or apoptotic execution.
Beyond classical apoptosis, recent evidence suggests that PS-NPs may engage alternative programmed cell death mechanisms in neurons, particularly under conditions of sustained autophagy–lysosomal stress. Liang et al. [45] demonstrated that PS-NPs accelerate the onset of Parkinson’s disease in dopaminergic neurons by disrupting autophagosome–lysosome fusion through the TSC2–mTOR–TFEB axis, leading to protein aggregation and NLRP3-mediated pyroptosis because of lysosomal dysfunction. This mechanism expands the spectrum of PS-NP-induced neuronal death beyond the BCL2/BAX/CASP3-mediated apoptotic axis characterized in the present study and suggests that, in more differentiated neuronal phenotypes or under chronic and/or high-concentration exposure, the predominant cell death pathway may shift from apoptotic priming toward pyroptotic execution. Consistent with this possibility, Tang et al. [14] reported that high concentrations of PS-NPs induced cell death through this mechanism. In this context, the resurgence of CASP3 expression at 50 µg/mL, coinciding with maximal CHOP induction and increased oxidative stress, may represent an early point at which alternative cell death pathways begin to emerge.
The puromycin incorporation assay provided functional evidence of NP-induced translational modulation. At 0.5 μg/mL, protein synthesis increased significantly above control, reflecting chaperone upregulation (GRP78, HSP70) as part of the possible initial adaptive UPR. At 5 μg/mL, protein synthesis declined markedly, which may be associated with the transcriptional response and increased GRP78 expression observed under PS-NP-COOH exposure. This response may contribute to PERK-mediated phosphorylation of eIF2α and the subsequent global suppression of cap-dependent translation as part of the integrated stress response (ISR). This translational repression, while globally inhibitory, promotes preferential translation of ATF4 and downstream CHOP, linking the PERK plateau at 5 μg/mL mechanistically to the pro-apoptotic gene expression escalation observed at 50 μg/mL. Wang et al. [46] demonstrated an equivalent PERK/eIF2α-mediated translational suppression in SH-SY5Y cells exposed to acrylamide, with ATF4 upregulation serving as the key transcriptional mediator of CHOP induction, supporting the mechanistic model proposed here.
Following a comprehensive analysis and discussion of our findings, we identified several areas that should be considered as limitations of the present study while also providing important directions for future research. Addressing these aspects may further clarify the effects of PS-NPs-COOH on neural cells and help determine whether the observed cellular responses can be extended to more complex in vivo models. Among the key experimental approaches that could be pursued by the scientific community are the direct subcellular localization of nanoparticles within specific organelles using advanced microscopy techniques, combined with a comprehensive panel of organelle-specific markers; the evaluation of a broader range of concentrations of carboxyl-functionalized polystyrene nanoplastics and their direct comparison with unmodified polystyrene nanoplastics; increasing the number of biological replicates; and directly assessing protein activation and post-translational modifications of key UPR mediators.
Importantly, these approaches could help determine whether the responses observed in SH-SY5Y cells represent a transient cellular reaction or a more sustained adaptive process to persistent nanoplastic-associated stress. In this context, the present study raises the possibility that neural cells may develop mechanisms of cellular adaptation that allow them to maintain homeostasis despite the persistent intracellular presence of PS-NPs-COOH. Elucidating the extent and biological consequences of such adaptation is particularly relevant, as it may reveal how prolonged exposure to nanoplastics influences cellular homeostasis and whether adaptation ultimately represents a protective response or a state of persistent cellular stress.
5. Conclusions
PS-NPs-COOH elicit concentration-dependent cellular stress and adaptive responses in SH-SY5Y cells, involving intracellular particle accumulation, oxidative stress, antioxidant responses, and ER stress-associated signaling. These findings suggest that cellular adaptation may coexist with progressive dysfunction depending on the exposure concentration. Further studies are needed to clarify the interplay between these responses and determine their implications for cellular survival and the potential neurobiological effects of nanoplastic exposure.
Supplementary Materials
The following supporting information can be downloaded at: https://www.mdpi.com/article/10.3390/microplastics5040223/s1, Figure S1: DLS-based hydrodynamic size distribution and zeta potential of PS-NPs-COOH; Figure S2: Hydrodynamic size distribution and aggregation of PS-NPs-COOH in DMEM medium; Table S1: Analysis of PS-NPs-COOH by DLS; Figures S3–S5: Control SH-SY5Y cells and cells exposed to 5 and 50 μg/mL PS-NPs-COOH, analyzed using holotomographic microscopy (HTM).
Author Contributions
E.A.S.-L.: Conceptualization, Methodology, Investigation, Formal Analysis, Writing—Original Draft. E.S.-J.: Conceptualization, Supervision, Writing—Review and Editing. C.E.-D.: Investigation, Data Curation. M.E.A.-B.: Methodology and Investigation. D.I.-M.: Investigation, Data Curation. J.A.Z.: Writing—Review and Editing. I.E.M.-R.: Conceptualization, Supervision, Writing—Review and Editing. M.M.-O.: Conceptualization, Supervision, Writing—Review and Editing. All authors have read and agreed to the published version of the manuscript.
Funding
This work was supported by the Secretaría de Ciencias, Humanidades, Tecnología e Innovación (SECIHTI), Mexican Federal Government [Project No. 1331035], and by the Universidad Autónoma de Aguascalientes (UAA) [Internal Grant/PIBB No. 24-7]. The funders had no role in study design, data collection and analysis, decision to publish, or preparation of the manuscript.
Institutional Review Board Statement
This study was conducted exclusively using the SH-SY5Y human neuroblastoma cell line, a commercially established in vitro model that does not constitute human subjects research under applicable national and institutional regulations. No human participants, biological specimens obtained from human donors, or experimental animals were used at any stage of the study. Accordingly, approval from an institutional ethics committee or animal care and use committee was not required. All experimental procedures complied with the biosafety guidelines of the Universidad Autónoma de Aguascalientes and with standard laboratory practices for the handling of biological material at biosafety level 1.
Data Availability Statement
The data that support the findings of this study are available from the corresponding authors (I.E. Medina-Ramirez or M.H. Munoz-Ortega) upon reasonable request.
Acknowledgments
The authors gratefully acknowledge Gladis Pedroza Herrera, Jorge Humberto Martínez Montelongo, Rafael Hernández Rangel, Brenda Alicia Rosales Pérez, and Juan Pablo López Álvarez for their invaluable technical and scientific support throughout the development of this study. Their contributions were essential to the successful completion of the experimental work presented here.
Conflicts of Interest
The authors declare no conflicts of interest.
References
- Cai, H.; Luo, S.; Zhou, Z.; Chen, F.; Ying, J.; Wu, Q.; Wu, Y.; Chen, S.; Yao, X.; Xie, F.; et al. Co-exposure to PFOA, PFBA and nanoplastics synergistically exacerbates neurotoxicity by impairing PINK1/Parkin-mediated mitophagy. Environ. Int. 2026, 208, 110102. [Google Scholar] [CrossRef] [Scilit]
- Yang, D.; Zhu, J.; Zhou, X.; Pan, D.; Nan, S.; Yin, R.; Lei, Q.; Ma, N.; Zhu, H.; Chen, J.; et al. Polystyrene micro- and nano-particle coexposure injures fetal thalamus by inducing ROS-mediated cell apoptosis. Environ. Int. 2022, 166, 107362. [Google Scholar] [CrossRef] [Scilit]
- Liu, X.; Fang, L.; Yan, X.; Gardea-Torresdey, J.L.; Gao, Y.; Zhou, X.; Yan, B. Surface functional groups and biofilm formation on microplastics: Environmental implications. Sci. Total Environ. 2023, 899, 166585. [Google Scholar] [CrossRef] [Scilit]
- Huang, Y.; Liang, B.; Li, Z.; Zhong, Y.; Wang, B.; Zhang, B.; Du, J.; Ye, R.; Xian, H.; Min, W.; et al. Polystyrene nanoplastic exposure induces excessive mitophagy by activating AMPK/ULK1 pathway in differentiated SH-SY5Y cells and dopaminergic neurons in vivo. Part. Fibre Toxicol. 2023, 20, 55. [Google Scholar] [CrossRef] [Scilit]
- Santoro, A.; Marino, M.; Vandenberg, L.N.; Szychlinska, M.A.; Lamparelli, E.P.; Scalia, F.; Della Rocca, N.; D’aUria, R.; Pastorino, G.M.G.; Della Porta, G.; et al. PLASTAMINATION: Outcomes on the Central Nervous System and Reproduction. Curr. Neuropharmacol. 2024, 22, 1870–1898. [Google Scholar] [CrossRef] [Scilit]
- Dennis, J.; Arulraj, D.; Mistri, T.K. Unseen toxins: Exploring the human health consequences of micro and nanoplastics. Toxicol. Rep. 2025, 14, 101955. [Google Scholar] [CrossRef] [Scilit]
- Bhardwaj, G.; Abdulkadhim, M.; Joshi, K.; Wankhede, L.; Das, R.K.; Brar, S.K. Exposure Pathways, Systemic Distribution, and Health Implications of Micro- and Nanoplastics in Humans. Appl. Sci. 2025, 15, 8813. [Google Scholar] [CrossRef] [Scilit]
- Nihart, A.J.; Garcia, M.A.; El Hayek, E.; Liu, R.; Olewine, M.; Kingston, J.D.; Castillo, E.F.; Gullapalli, R.R.; Howard, T.; Bleske, B.; et al. Bioaccumulation of microplastics in decedent human brains. Nat. Med. 2025, 31, 1114–1119. [Google Scholar] [CrossRef] [Scilit] [PubMed]
- Xiang, S.; Chen, M.; Liu, J.; Wang, J. Exposure to Nanoplastics and Co-Contaminants in Foods and Environment: Threats to Human Health. Foods 2025, 14, 3349. [Google Scholar] [CrossRef] [Scilit]
- Chulkov, V.; Gasanov, M.; Isakov, V.; Denisenko, A.; Nwosu, C.; Rodkin, S. Molecular and Cellular Effects of Microplastics and Nanoplastics in the Pathogenesis of Cardiovascular, Nervous, Urinary, Digestive, and Reproductive System Diseases: A Global Systematic Review. Int. J. Mol. Sci. 2025, 26, 11194. [Google Scholar] [CrossRef] [Scilit]
- Vojnits, K.; de León, A.; Gibon, J.; Barker, P.; Mahmoudi, M.; Pakpour, S. A systematic review of the potential neurotoxicity of micro-and nanoplastics: The known and unknown. Part. Fibre Toxicol. 2025, 22, 647. [Google Scholar] [CrossRef] [Scilit]
- Kopatz, V.; Wen, K.; Kovács, T.; Keimowitz, A.S.; Pichler, V.; Widder, J.; Vethaak, A.D.; Hollóczki, O.; Kenner, L. Micro- and Nanoplastics Breach the Blood–Brain Barrier (BBB): Biomolecular Corona’s Role Revealed. Nanomaterials 2023, 13, 1404. [Google Scholar] [CrossRef] [Scilit] [PubMed]
- Mota, C.; Araújo, A.M.; Enea, M.; Pereira, E.; Reis-Mendes, A.; Fernandes, R.; Pacheco, S.; Lúcio, M.; Lopes, C.M.; Ferreira, I.M.; et al. Are all nanoplastics equally neurotoxic? Influence of size and surface functionalization on the toxicity of polystyrene nanoplastics in human neuronal cells. Environ. Pollut. 2026, 390, 127445. [Google Scholar] [CrossRef] [Scilit]
- Tang, Q.; Li, T.; Chen, K.; Deng, X.; Zhang, Q.; Tang, H.; Shi, Z.; Zhu, T.; Zhu, J. PS-NPs Induced Neurotoxic Effects in SHSY-5Y Cells via Autophagy Activation and Mitochondrial Dysfunction. Brain Sci. 2022, 12, 952. [Google Scholar] [CrossRef] [Scilit]
- Hernández, A.F.; Lacasaña, M.; Tsatsakis, A.M.; Docea, A.O. Cellular and Molecular Mechanisms of Micro- and Nanoplastics Driving Adverse Human Health Effects. Toxics 2025, 13, 921. [Google Scholar] [CrossRef] [Scilit] [PubMed]
- Laganà, A.; Billè, B.; Visalli, G.; Facciolà, A.; Cappello, T.; Maisano, M.; Di Pietro, A. Toxicological assays and metabolomic profiling to evaluate the effects of virgin and aged micro- and nano- polystyrene plastics in SH-SY5Y human neuroblastoma cells. Sci. Total Environ. 2025, 975, 179262. [Google Scholar] [CrossRef] [Scilit]
- Kim, Y.; Park, S.Y.; Jo, A.; Ahn, S.; Kwon, J.; Jung, E.M.; Kim, H.S.; Jeong, S.; Lee, K.E.; Oh, C.-K.; et al. Long-term low-dose exposure to polystyrene nanoplastics induces morphological and transcriptional reprogramming to enhance metastatic potential of colorectal cancer cells. Toxicology 2025, 501, 154356. [Google Scholar] [CrossRef] [Scilit]
- Abdelkhaliq, A.; van der Zande, M.; Punt, A.; Helsper, J.; Boersma, M.G.; Bouwmeester, H. Impact of nanoparticle surface functionalization on the protein corona and cellular adhesion, uptake and transport. J. Nanobiotechnol. 2018, 16, 70. [Google Scholar] [CrossRef] [Scilit]
- Hua, X.; Wang, D. Cellular Uptake, Transport, and Organelle Response After Exposure to Microplastics and Nanoplastics: Current Knowledge and Perspectives for Environmental and Health Risks. Rev. Environ. Contam. Toxicol. 2022, 260, 12. [Google Scholar] [CrossRef] [Scilit]
- Płuciennik, K.; Sicińska, P.; Misztal, W.; Bukowska, B. Important Factors Affecting Induction of Cell Death, Oxidative Stress and DNA Damage by Nano- and Microplastic Particles In Vitro. Cells 2024, 13, 768. [Google Scholar] [CrossRef] [Scilit]
- Zhang, Y.X.; Wang, M.; Yang, L.; Pan, K.; Miao, A.J. Bioaccumulation of differently-sized polystyrene nanoplastics by human lung and intestine cells. J. Hazard. Mater. 2022, 439, 129585. [Google Scholar] [CrossRef] [Scilit]
- Liu, L.; Xu, K.; Zhang, B.; Ye, Y.; Zhang, Q.; Jiang, W. Cellular internalization and release of polystyrene microplastics and nanoplastics. Sci. Total Environ. 2021, 779, 146523. [Google Scholar] [CrossRef] [Scilit]
- Ruan, Y.; Zhong, Z.; Liu, X.; Li, Z.; Li, J.; Sun, L.; Sen, H. Correlation between cellular uptake and cytotoxicity of polystyrene micro/nanoplastics in HeLa cells: A size-dependent matter. PLoS ONE 2023, 18, e0289473. [Google Scholar] [CrossRef] [Scilit]
- Chen, J.; Xu, Z.; Liu, Y.; Mei, A.; Wang, X.; Shi, Q. Cellular absorption of polystyrene nanoplastics with different surface functionalization and the toxicity to RAW264.7 macrophage cells. Ecotoxicol. Environ. Saf. 2023, 252, 114574. [Google Scholar] [CrossRef] [Scilit]
- Martín-Pérez, J.; Villacorta, A.; Banaei, G.; Morataya-Reyes, M.; Tavakolpournegari, A.; Marcos, R.; Hernández, A.; García-Rodriguez, A. Hazard assessment of nanoplastics is driven by their surface-functionalization. Effects in human-derived primary endothelial cells. Sci. Total Environ. 2024, 934, 173236. [Google Scholar] [CrossRef] [Scilit]
- Prüst, M.; Meijer, J.; Westerink, R.H.S. The plastic brain: Neurotoxicity of micro- and nanoplastics. Part. Fibre Toxicol. 2020, 17, 24. [Google Scholar] [CrossRef] [Scilit]
- Chen, Y.; Liu, Y.; Li, Y.; Yao, C.; Qu, J.; Tang, J.; Zhang, X. Acute exposure to polystyrene nanoplastics induces unfolded protein response and global protein ubiquitination in lungs of mice. Ecotoxicol. Environ. Saf. 2024, 280, 116580. [Google Scholar] [CrossRef] [Scilit]
- Winiarska, E.; Chaszczewska-Markowska, M.; Ghete, D.; Jutel, M.; Zemelka-Wiacek, M. Nanoplastics Penetrate Human Bronchial Smooth Muscle and Small Airway Epithelial Cells and Affect Mitochondrial Metabolism. Int. J. Mol. Sci. 2024, 25, 4724. [Google Scholar] [CrossRef] [Scilit]
- Livak, K.J.; Schmittgen, T.D. Analysis of Relative Gene Expression Data Using Real-Time Quantitative PCR and the 2−ΔΔCT Method. Methods 2001, 25, 402–408. [Google Scholar] [CrossRef] [Scilit] [PubMed]
- Schindelin, J.; Arganda-Carreras, I.; Frise, E.; Kaynig, V.; Longair, M.; Pietzsch, T.; Preibisch, S.; Rueden, C.; Saalfeld, S.; Schmid, B.; et al. Fiji: An Open-Source Platform for Biological-Image Analysis. Nat. Methods 2012, 9, 676–682. [Google Scholar] [CrossRef] [Scilit] [PubMed]
- Ravi, V.; Jain, A.; Mishra, S.; Sundaresan, N.R. Measuring Protein Synthesis in Cultured Cells and Mouse Tissues Using the Non-Radioactive SUnSET Assay. Curr. Protoc. Mol. Biol. 2020, 133, e127. [Google Scholar] [CrossRef] [Scilit]
- Zhang, L.; Qin, Z.; Bai, H.; Xue, M.; Tang, J. Photochemically induced aging of polystyrene nanoplastics and its impact on norfloxacin adsorption behavior. Sci. Total Environ. 2024, 930, 172511. [Google Scholar] [CrossRef] [Scilit]
- Bu, W.; Cui, Y.; Jin, Y.; Wang, X.; Jiang, M.; Huang, R.; Egbobe, J.O.; Zhao, X.; Tang, J. Unmasking the Invisible Threat: Biological Impacts and Mechanisms of Polystyrene Nanoplastics on Cells. Toxics 2024, 12, 908. [Google Scholar] [CrossRef] [Scilit]
- Masson-Meyers, D.S.; Bumah, V.V.; Enwemeka, C.S. A comparison of four methods for determining viability in human dermal fibroblasts irradiated with blue light. J. Pharmacol. Toxicol. Methods 2016, 79, 15–22. [Google Scholar] [CrossRef] [Scilit]
- González-Caballero, M.C.; de Alba González, M.; Torres-Ruiz, M.; Iglesias-Hernández, P.; Zapata, V.; Terrón, M.C.; Sachse, M.; Morales, M.; Martin-Folgar, R.; Liste, I.; et al. Internalization and toxicity of polystyrene nanoplastics on immortalized human neural stem cells. Chemosphere 2024, 355, 141815. [Google Scholar] [CrossRef] [Scilit]
- Sun, M.; Zhang, M.; Di, F.; Bai, W.; Sun, J.; Zhang, M.; Liu, R. Polystyrene nanoplastics induced learning and memory impairments in mice by damaging the glymphatic system. Ecotoxicol. Environ. Saf. 2024, 284, 116874. [Google Scholar] [CrossRef] [Scilit]
- Medina-Ramirez, I.E.; Macias-Diaz, J.E.; Masuoka-Ito, D.; Zapien, J.A. Holotomography and atomic force microscopy: A powerful combination to enhance cancer, microbiology and nanotoxicology research. Discov. Nano 2024, 19, 120. [Google Scholar] [CrossRef] [Scilit]
- Guo, M.; Li, Y.; Niu, S.; Zhang, R.; Shen, X.; Ma, Y.; Wu, L.; Wu, T.; Zhang, T.; Tang, M.; et al. Oxidative stress-activated Nrf2 remitted polystyrene nanoplastic-induced mitochondrial damage and inflammatory response in HepG2 cells. Environ. Toxicol. Pharmacol. 2024, 106, 104385. [Google Scholar] [CrossRef] [Scilit] [PubMed]
- Liang, B.; Huang, X.; Li, Z.; Huang, Y.; Deng, Y.; Chen, X.; Zhong, Y.; Yang, X.; Feng, Y.; Bai, R.; et al. Polystyrene nanoplastics trigger ferroptosis in Nrf2-deficient gut via ether phospholipid accumulation. Environ. Int. 2025, 197, 109367. [Google Scholar] [CrossRef] [Scilit]
- Song, M.; Wei, Z.; Wang, J.; Li, L.; Li, X.; Ma, X.; Pozzolini, M.; Liu, X.; Xiao, L.; Zhong, P. Polystyrene nanoplastics induce oxidative stress in Aurelia coerulea polyps, microglia, and mice. Front. Immunol. 2025, 16, 1609208. [Google Scholar] [CrossRef] [Scilit]
- Lu, H.; Guo, T.; Zhang, Y.; Liu, D.; Hou, L.; Ma, C.; Xing, M. Endoplasmic reticulum stress-induced NLRP3 inflammasome activation as a novel mechanism of polystyrene microplastics (PS-MPs)-induced pulmonary inflammation in chickens. J. Zhejiang Univ. Sci. B 2024, 25, 233–243. [Google Scholar] [CrossRef] [Scilit]
- Chen, Y.; Nan, Y.; Xu, L.; Dai, A.; Orteg, R.M.M.; Ma, M.; Zhang, Y. Polystyrene nanoplastics exposure induces cognitive impairment in mice via induction of oxidative stress and ERK/MAPK-mediated neuronal cuproptosis. Part. Fibre Toxicol. 2025, 22, 33. [Google Scholar] [CrossRef] [Scilit]
- Li, K.; Geng, Y.; Lin, B.; Xi, Z. Molecular mechanisms underlying mitochondrial damage, endoplasmic reticulum stress, and oxidative stress induced by environmental pollutants. Toxicol. Res. 2023, 12, 1014–1023. [Google Scholar] [CrossRef] [Scilit]
- Wei, Y.; Cao, G.; Ma, J.; Mi, Y.; Zhao, Y.; Zhang, L.; Wang, B.; Liu, H.; Li, K.; Shi, Y.; et al. Polystyrene Nanoplastics Induce DNA Damage and Excitotoxicity in Whole-Brain Organoids: The Role of the TLR9/MyD88 Pathway. Toxics 2025, 14, 5. [Google Scholar] [CrossRef] [Scilit]
- Liang, X.; Zeng, Y.; Zhang, P.; Zhu, B.; Feng, J.; Deng, T.; Fu, Z.; Liu, C.; Chen, C.; Zhang, Y. Polystyrene nanoplastics trigger pyroptosis in dopaminergic neurons through TSC2/TFEB-mediated disruption of autophagosome-lysosome fusion in Parkinson’s disease. J. Transl. Med. 2025, 23, 6634. [Google Scholar] [CrossRef] [Scilit]
- Wang, Y.; Liu, Y.; Zhang, X.; Jiao, Y.; Duan, L.; Cheng, R.; Yang, N.; Yan, H. Acrylamide Induces Antiapoptotic Autophagy and Apoptosis by Activating PERK Pathway in SH-SY5Y Cells. Toxics 2025, 13, 41. [Google Scholar] [CrossRef] [Scilit]
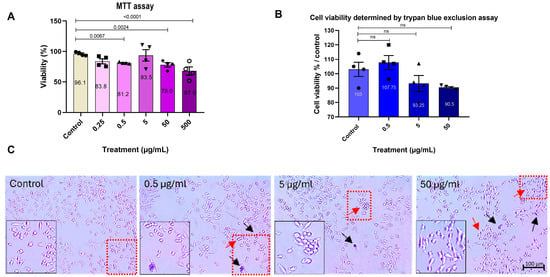
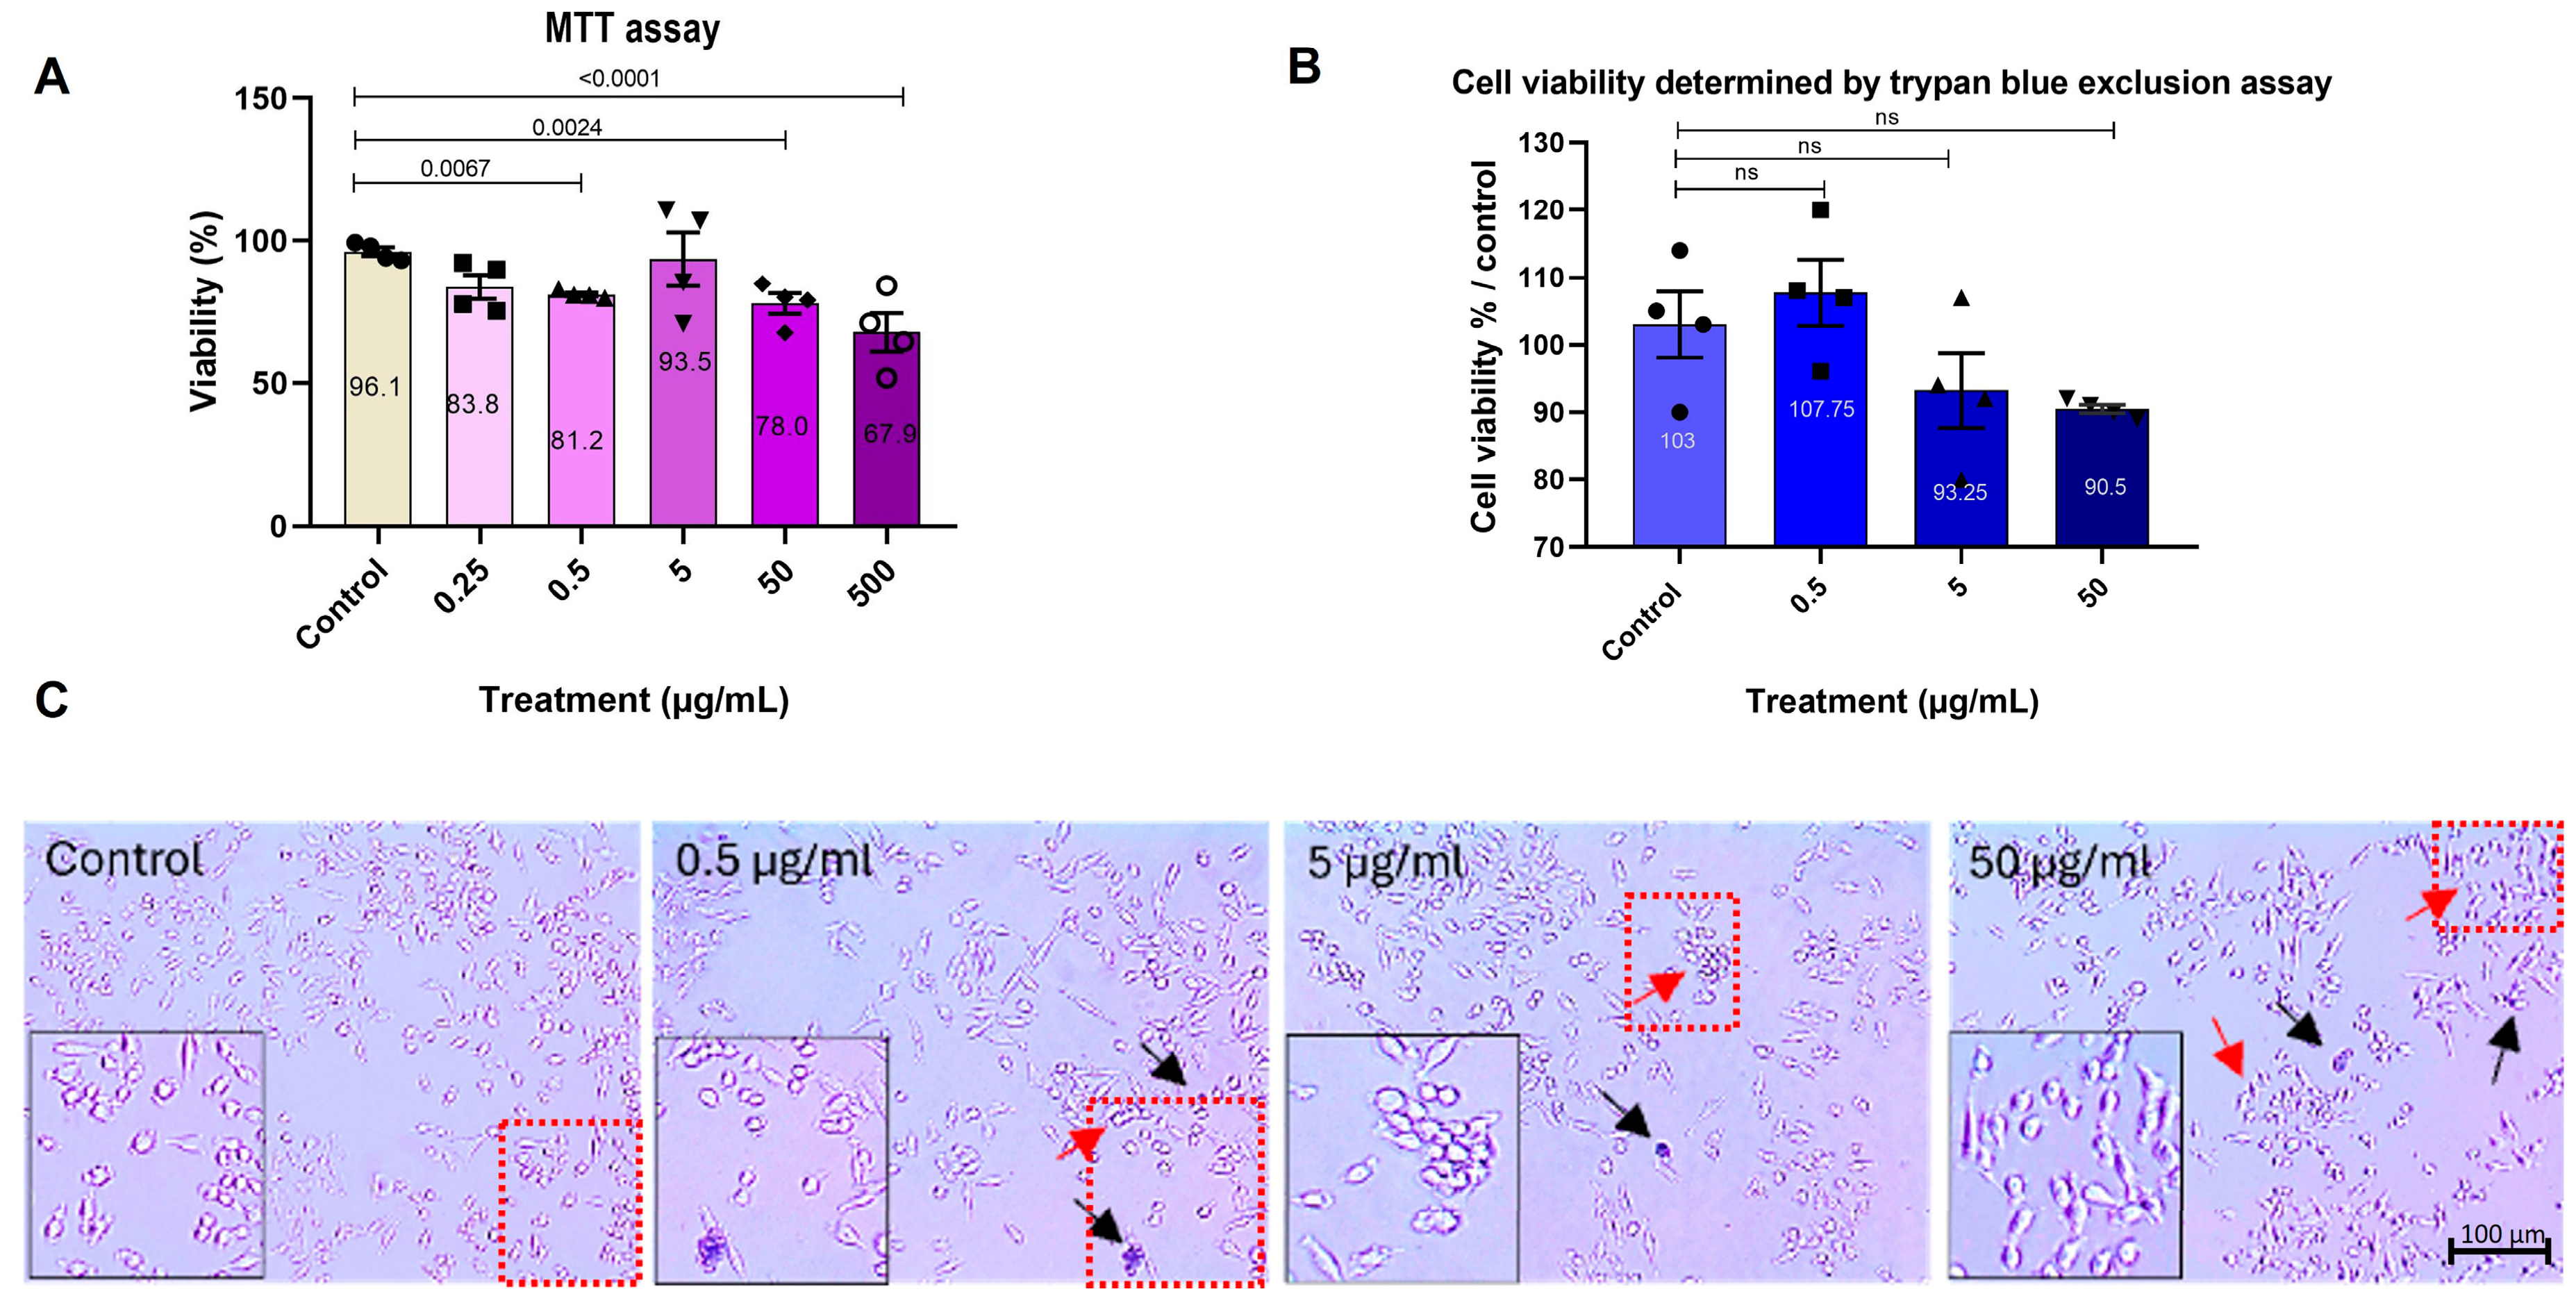
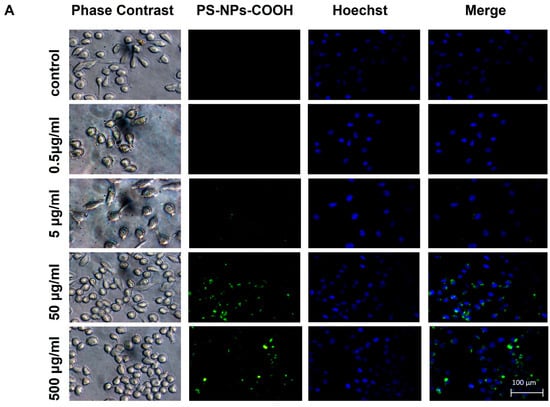
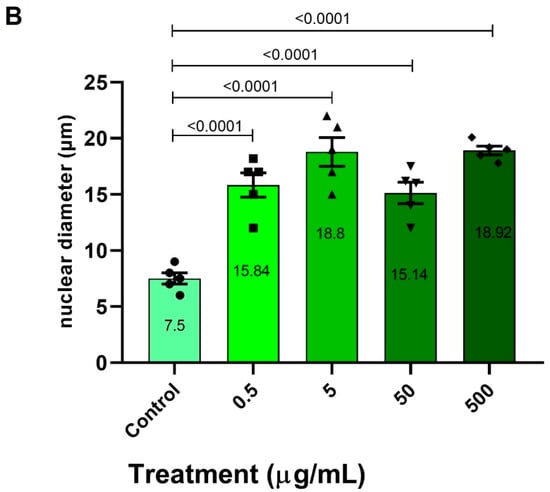
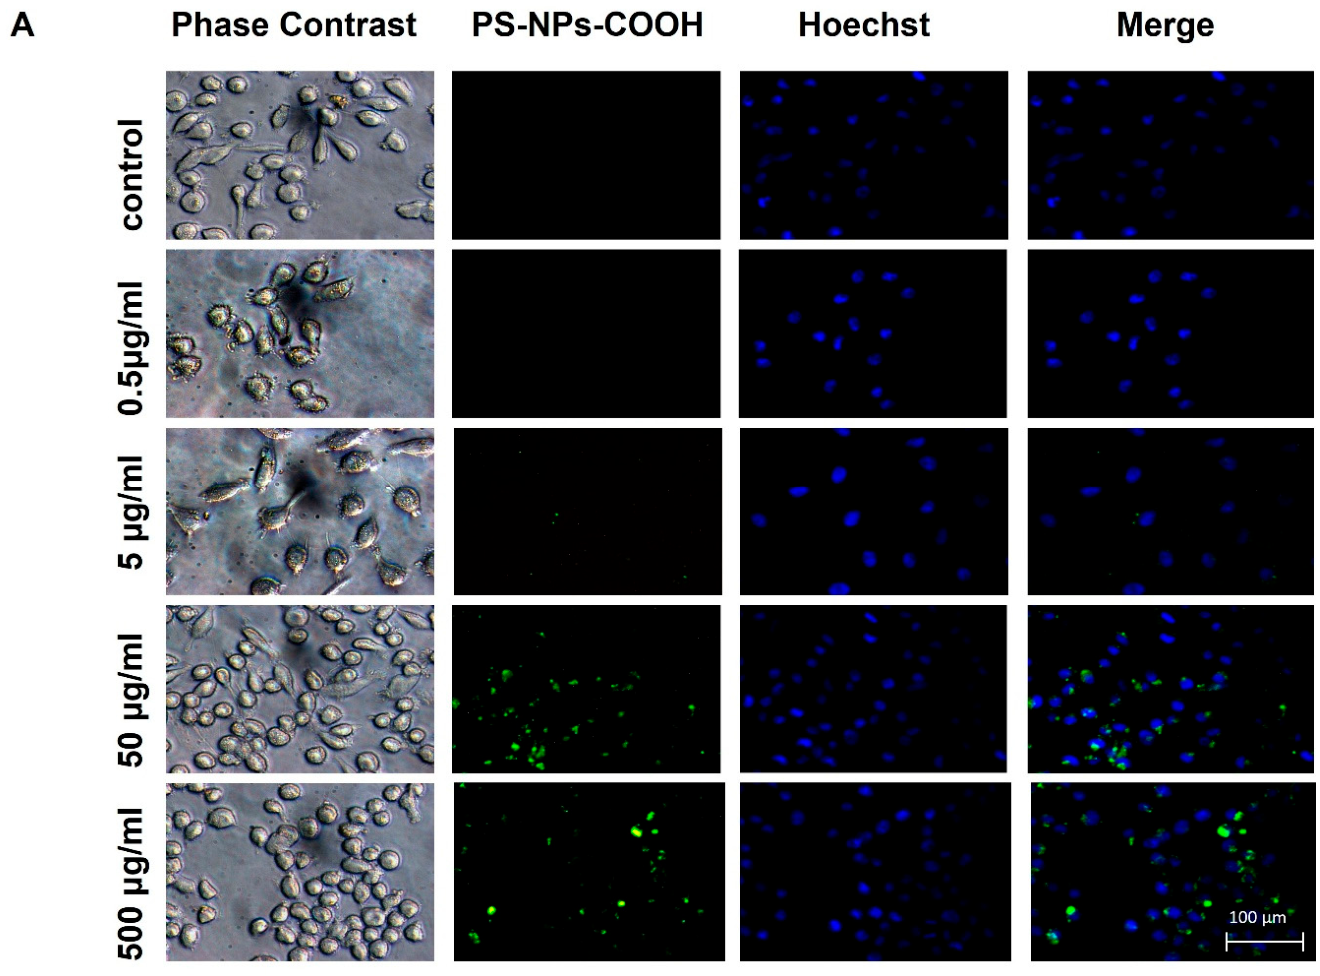
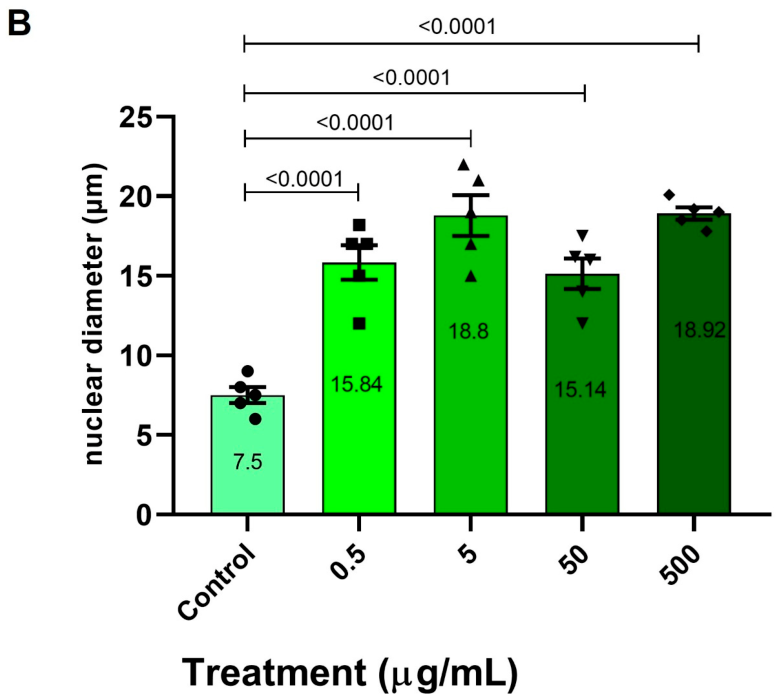
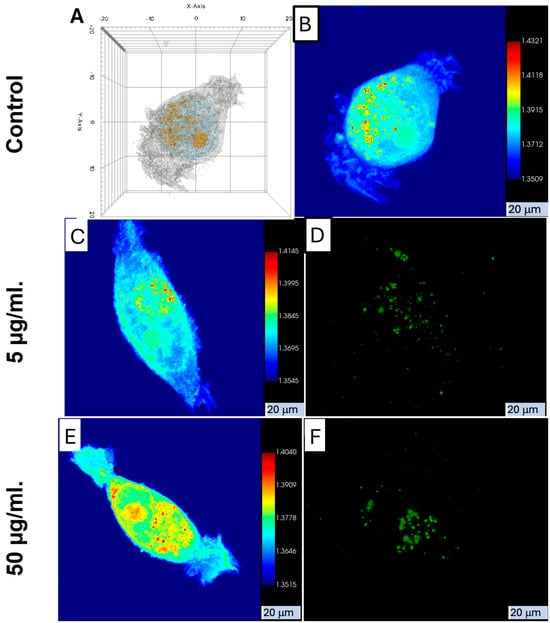
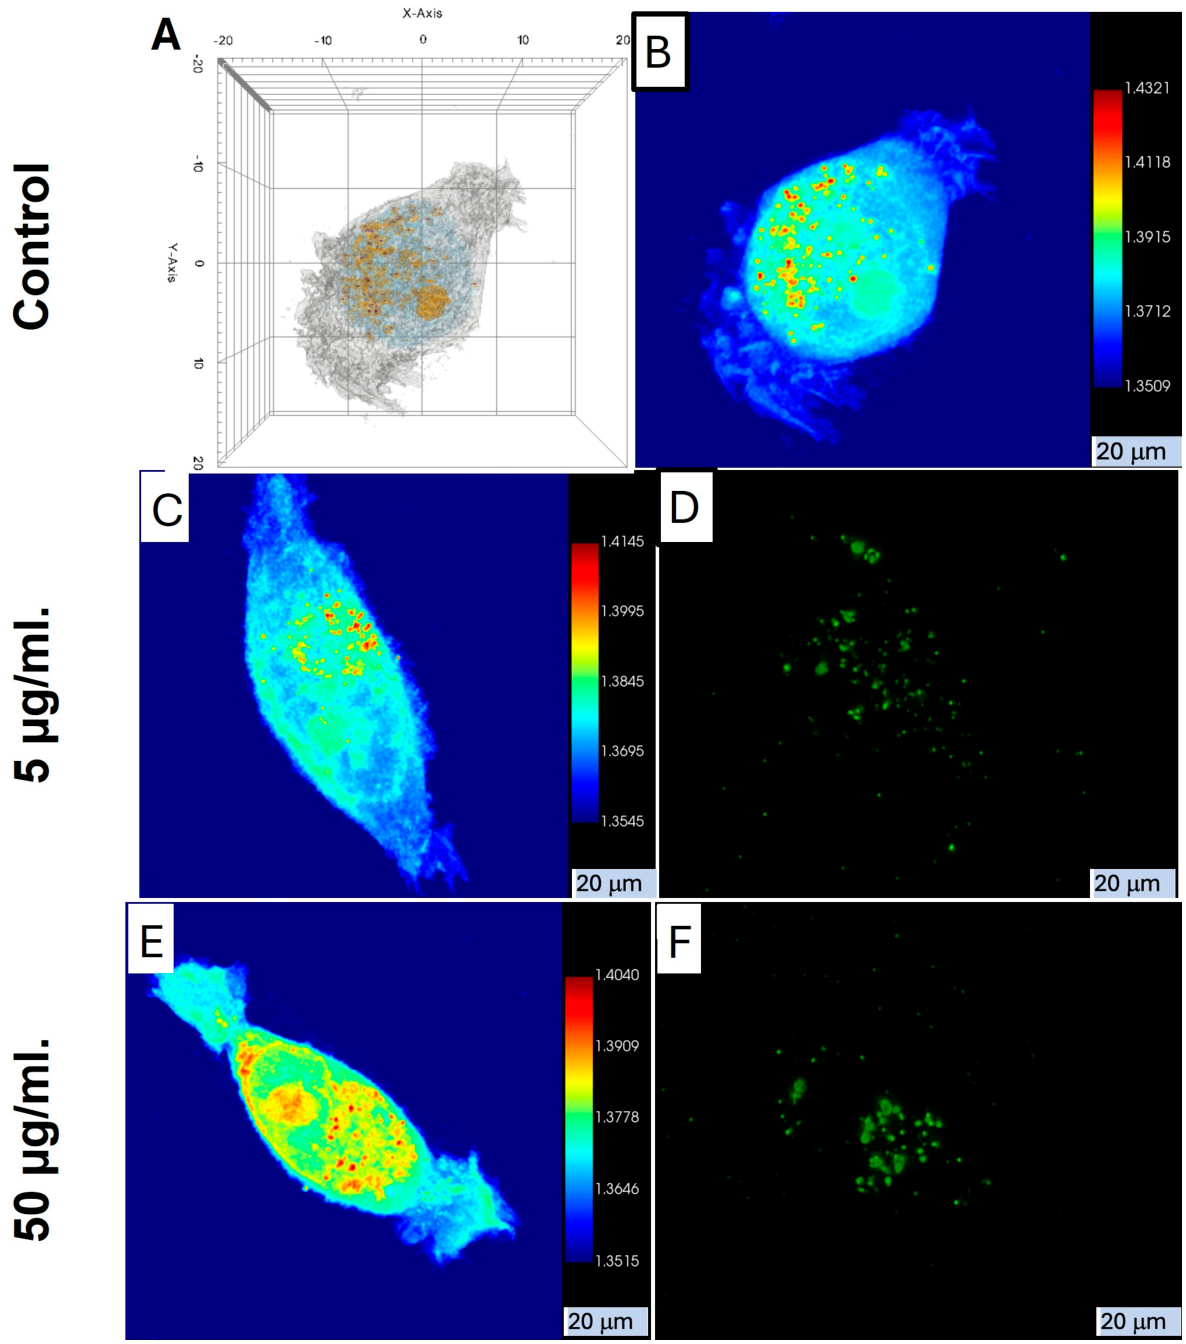
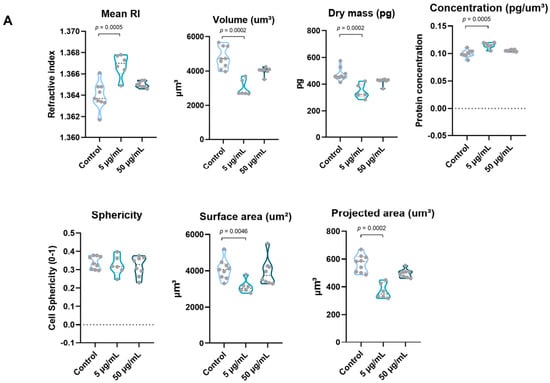
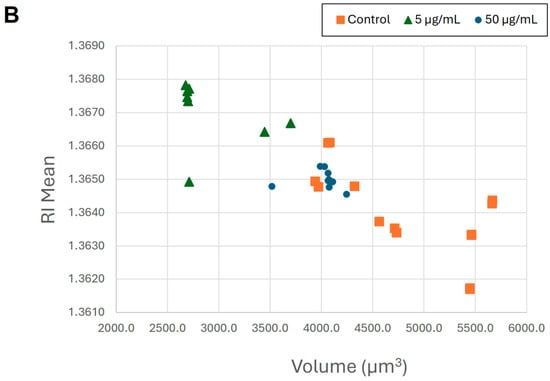
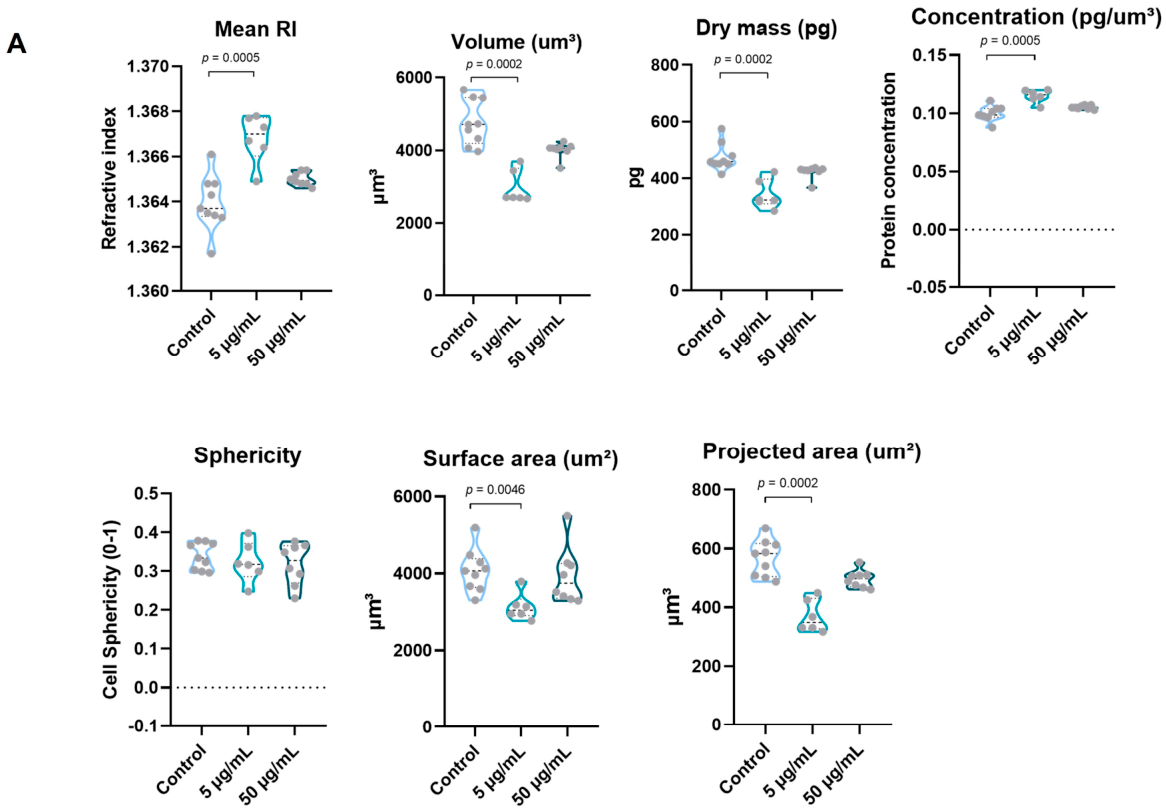
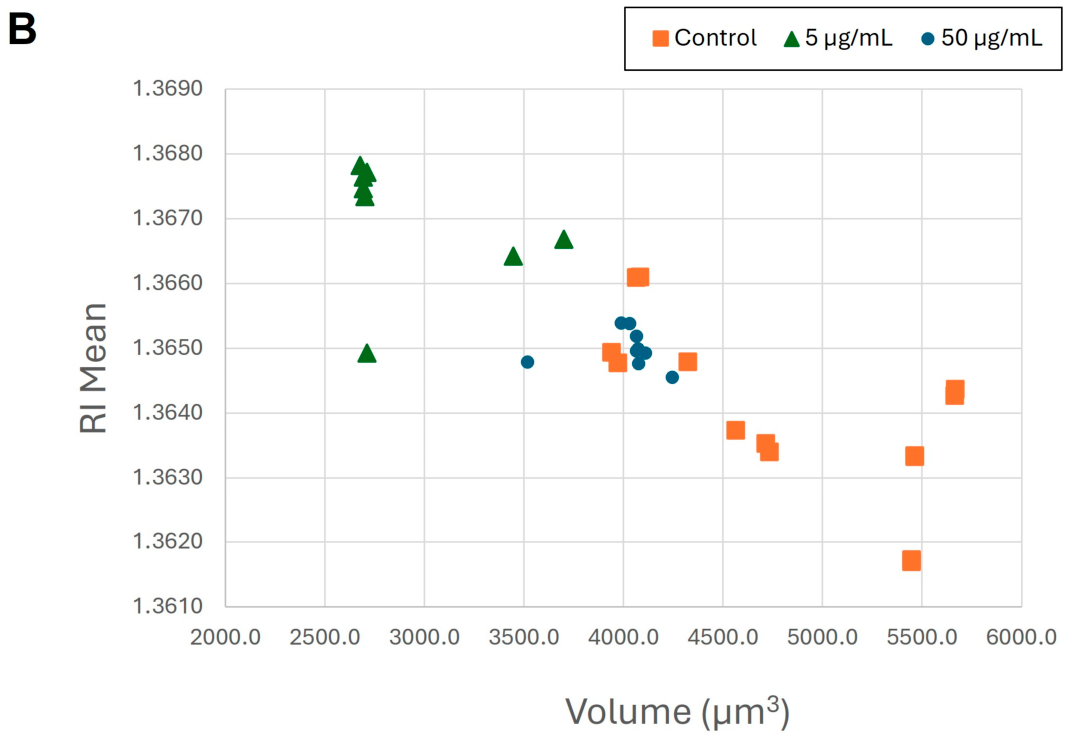
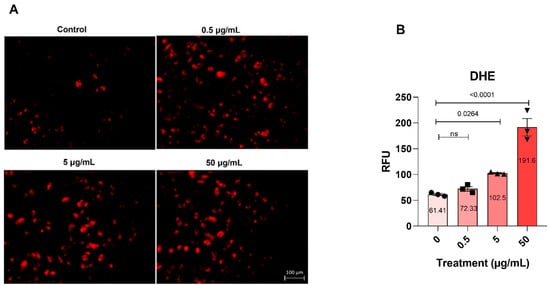
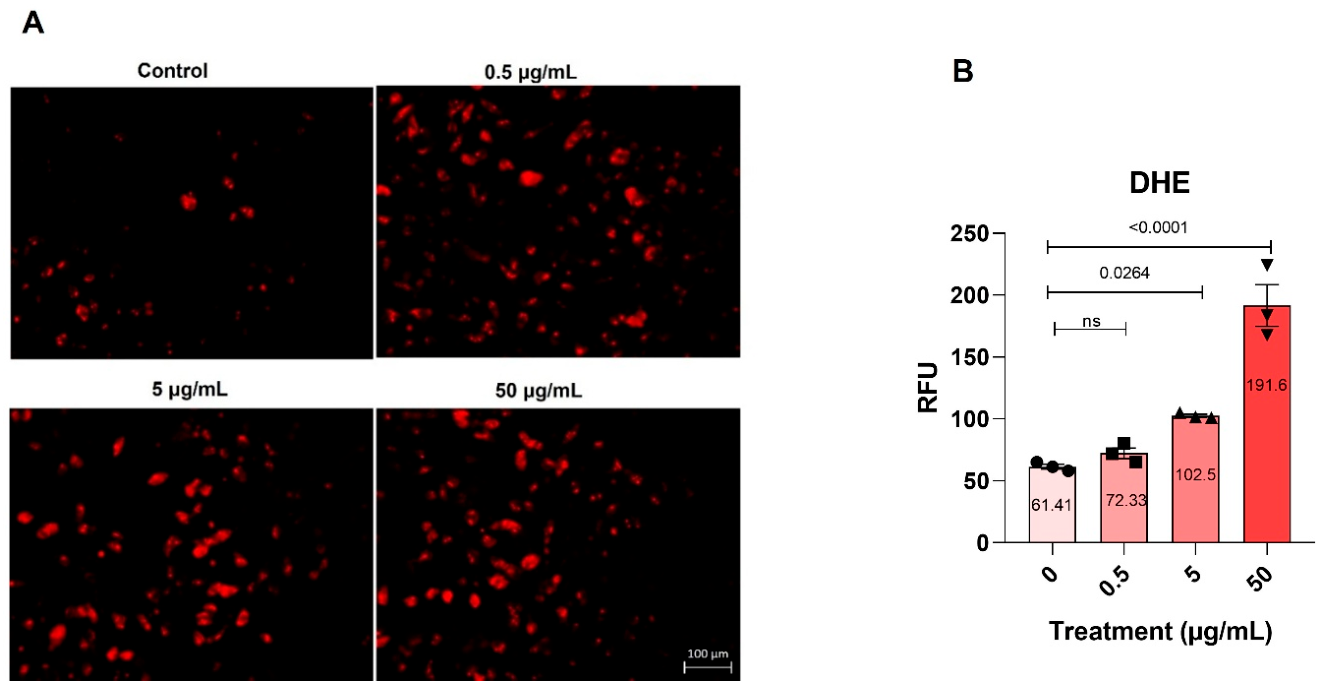
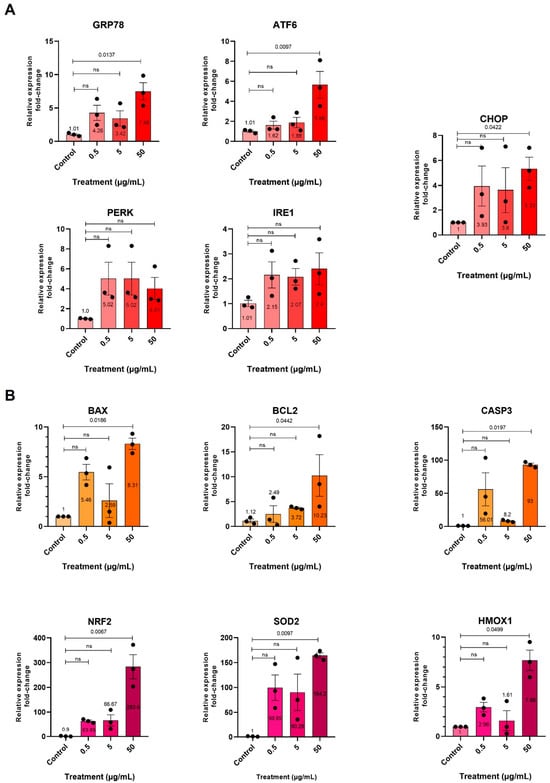
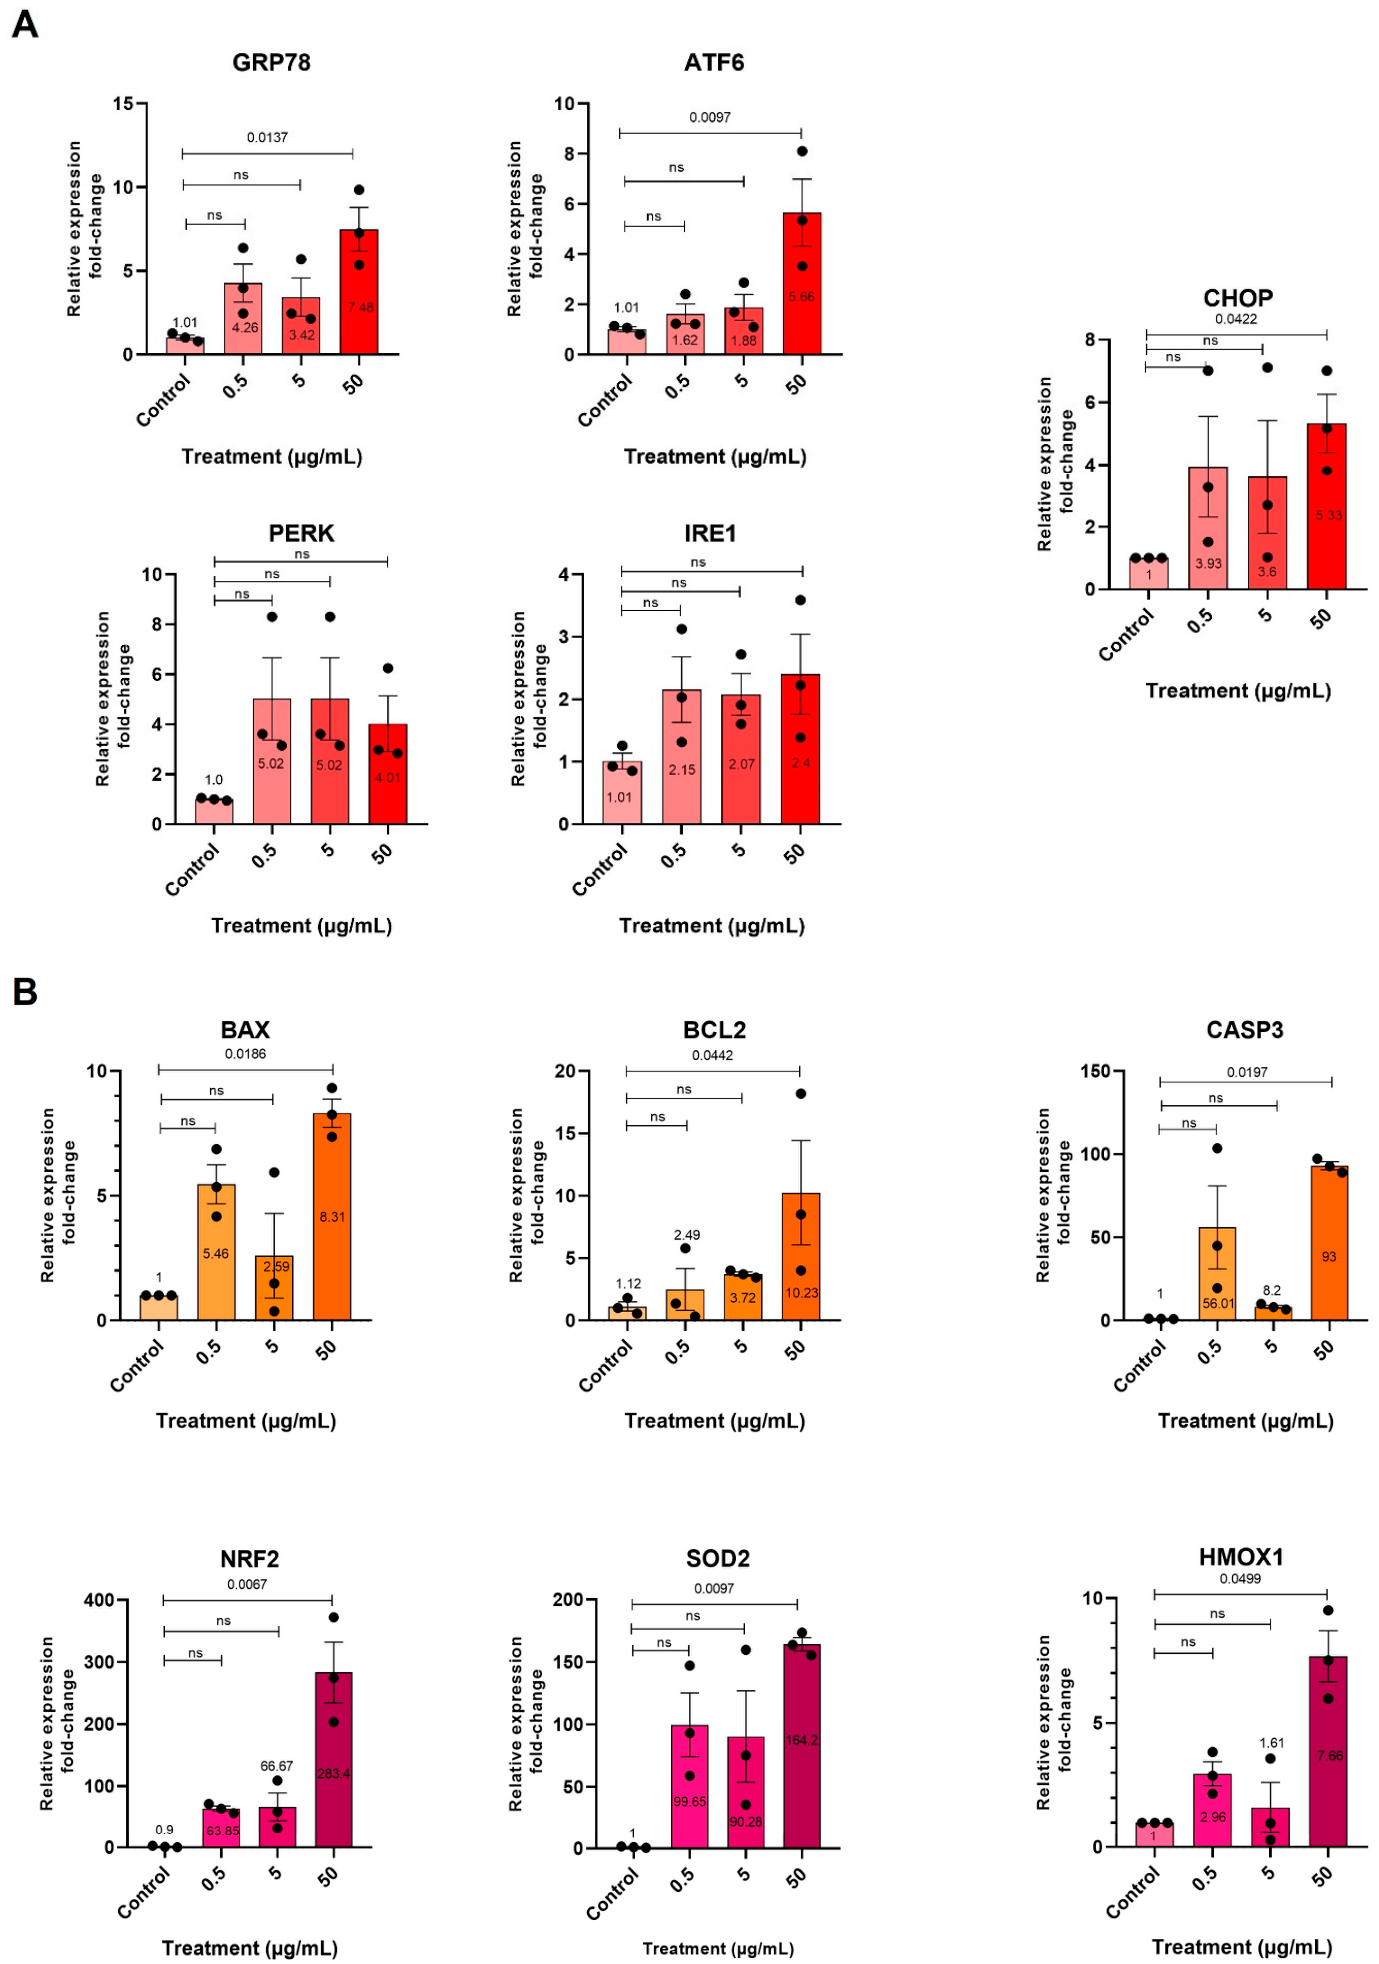
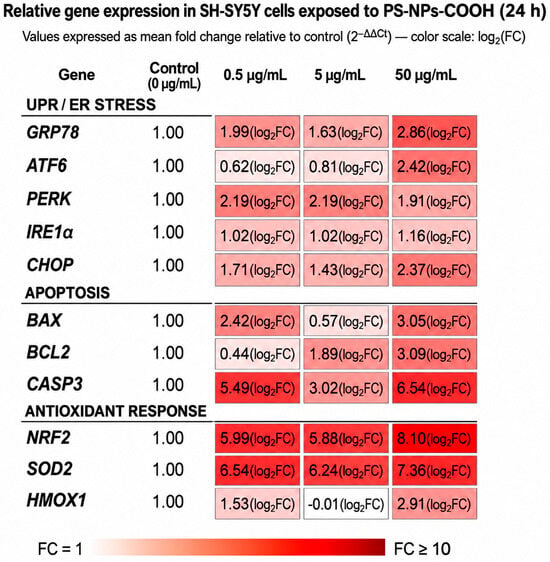
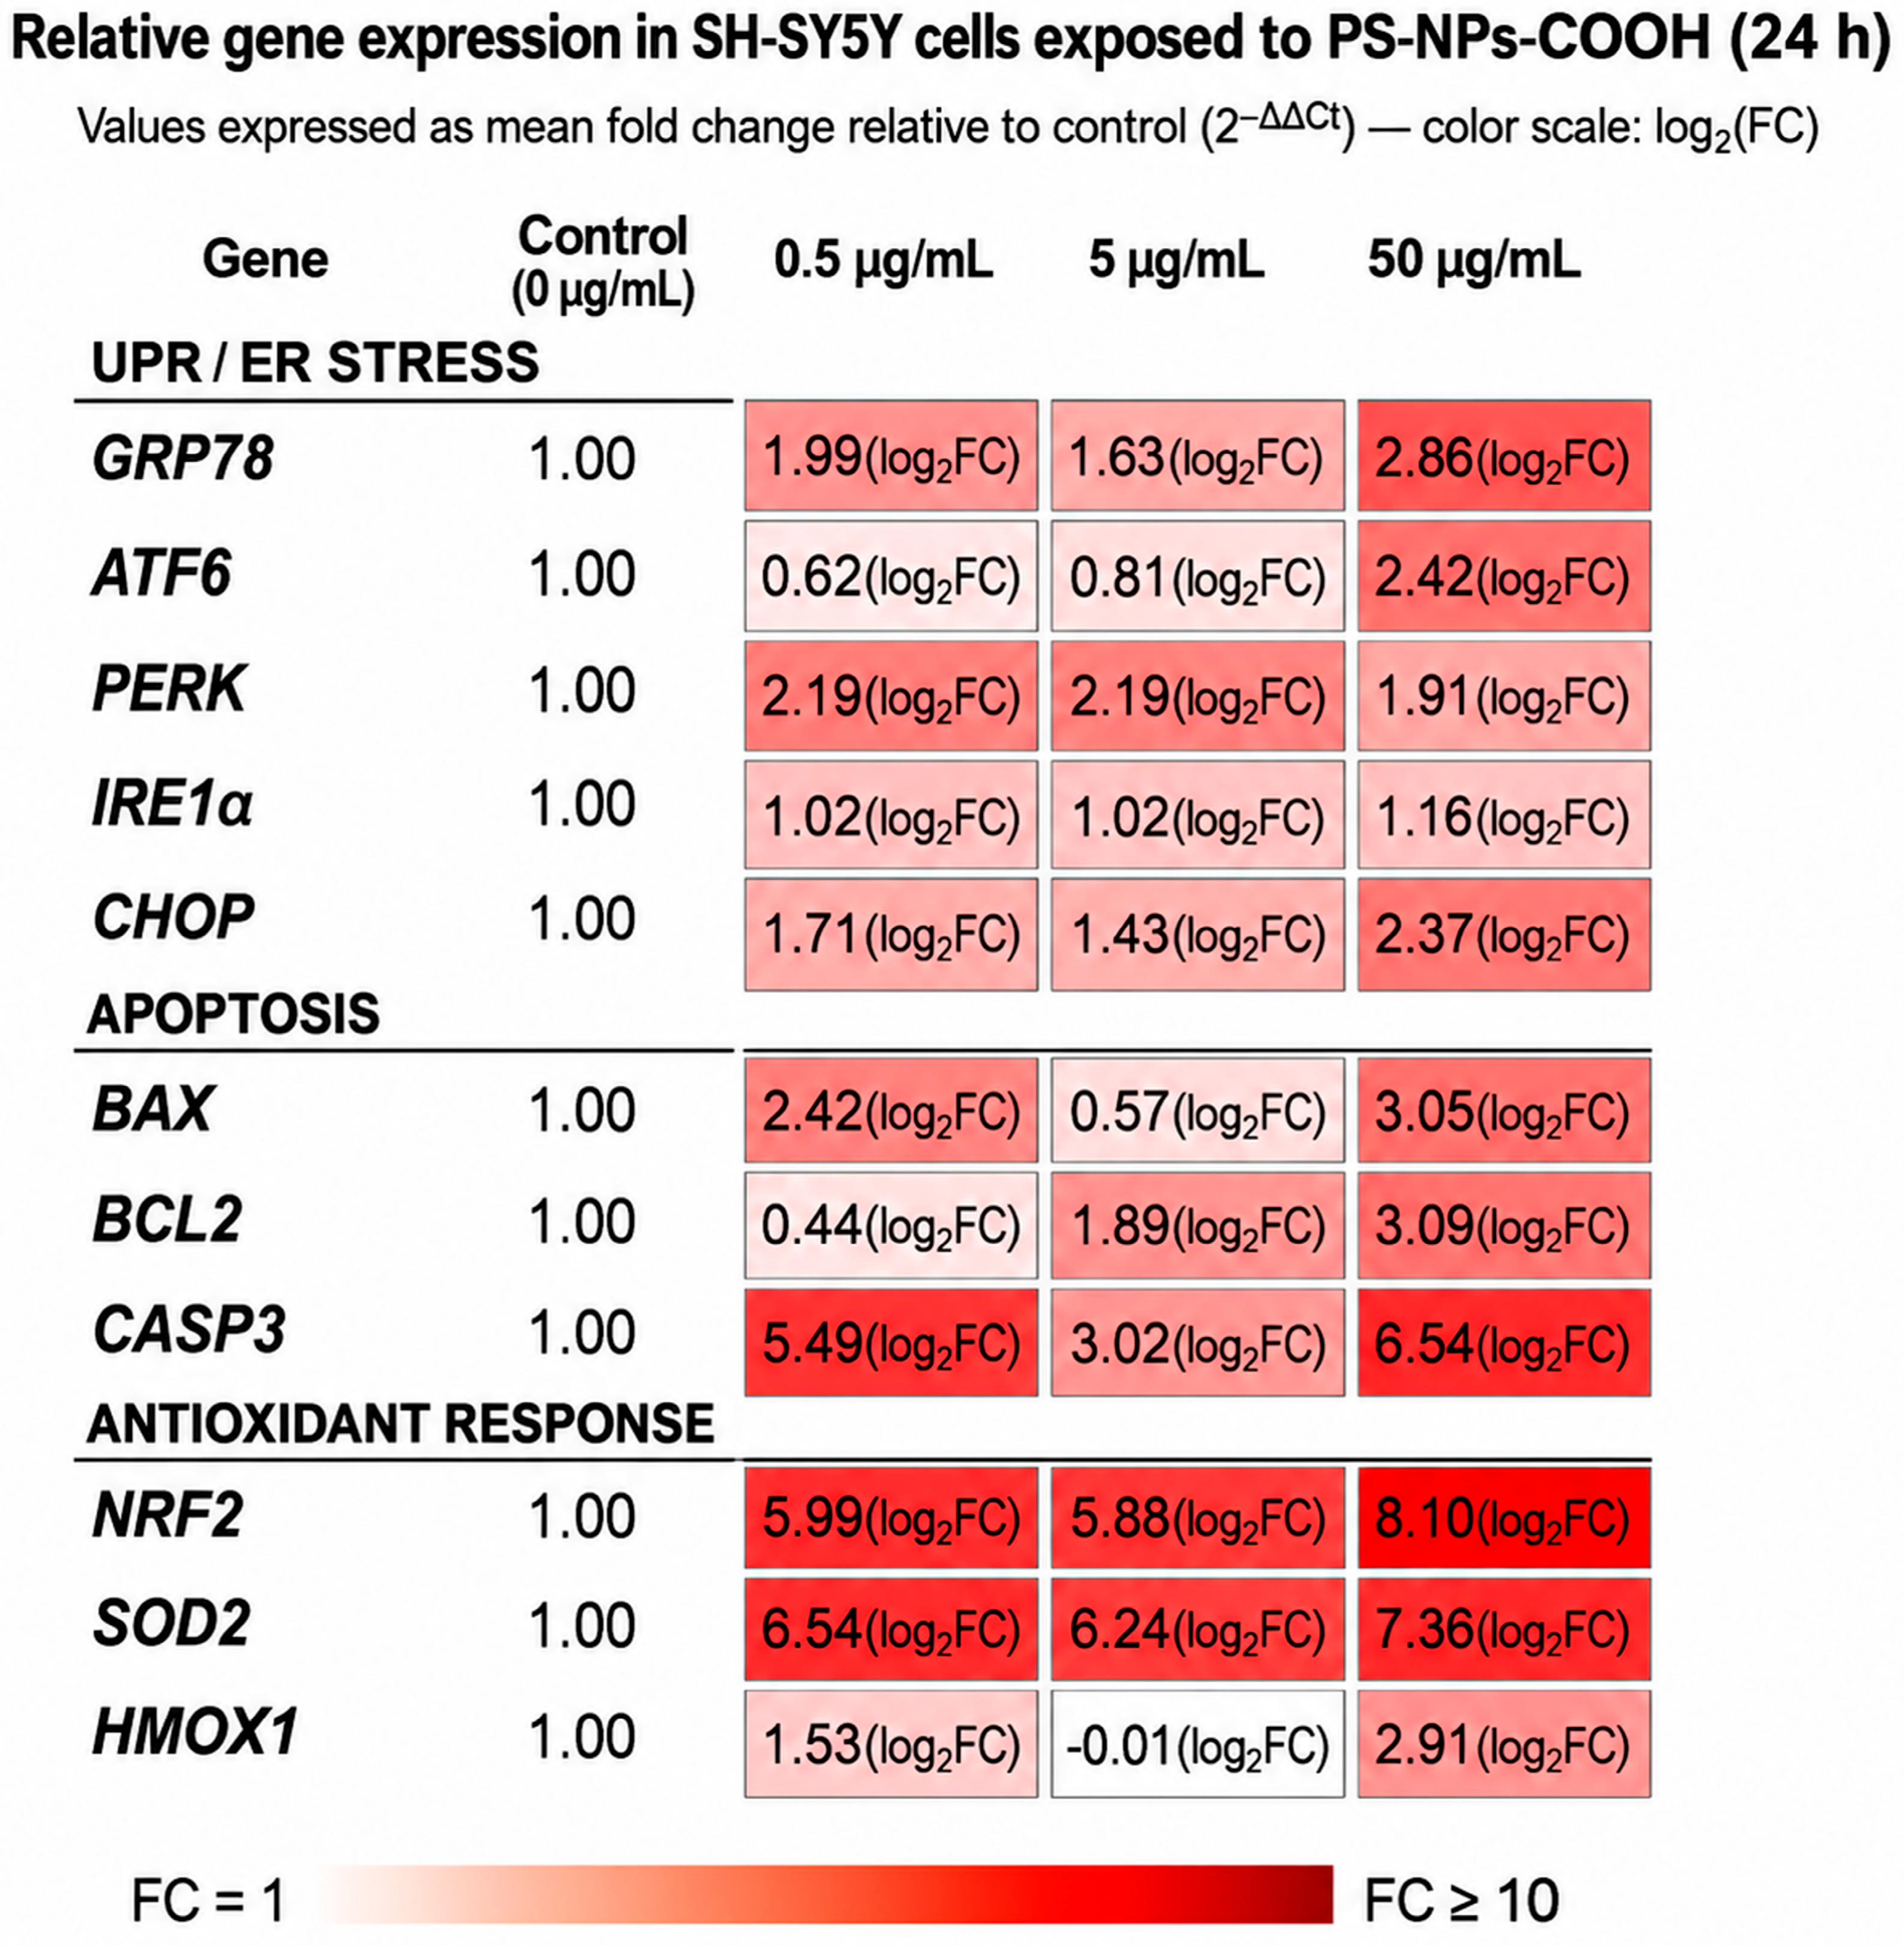
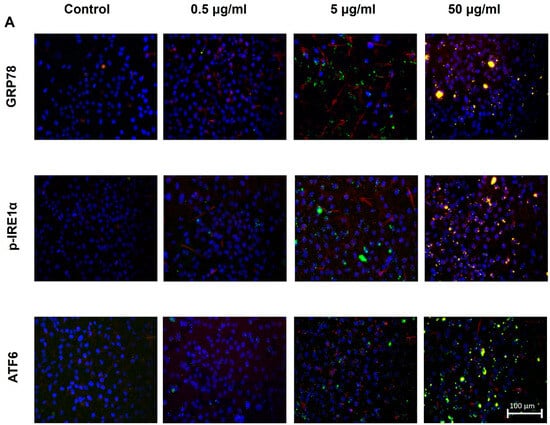
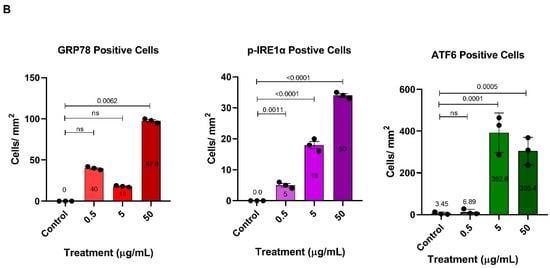
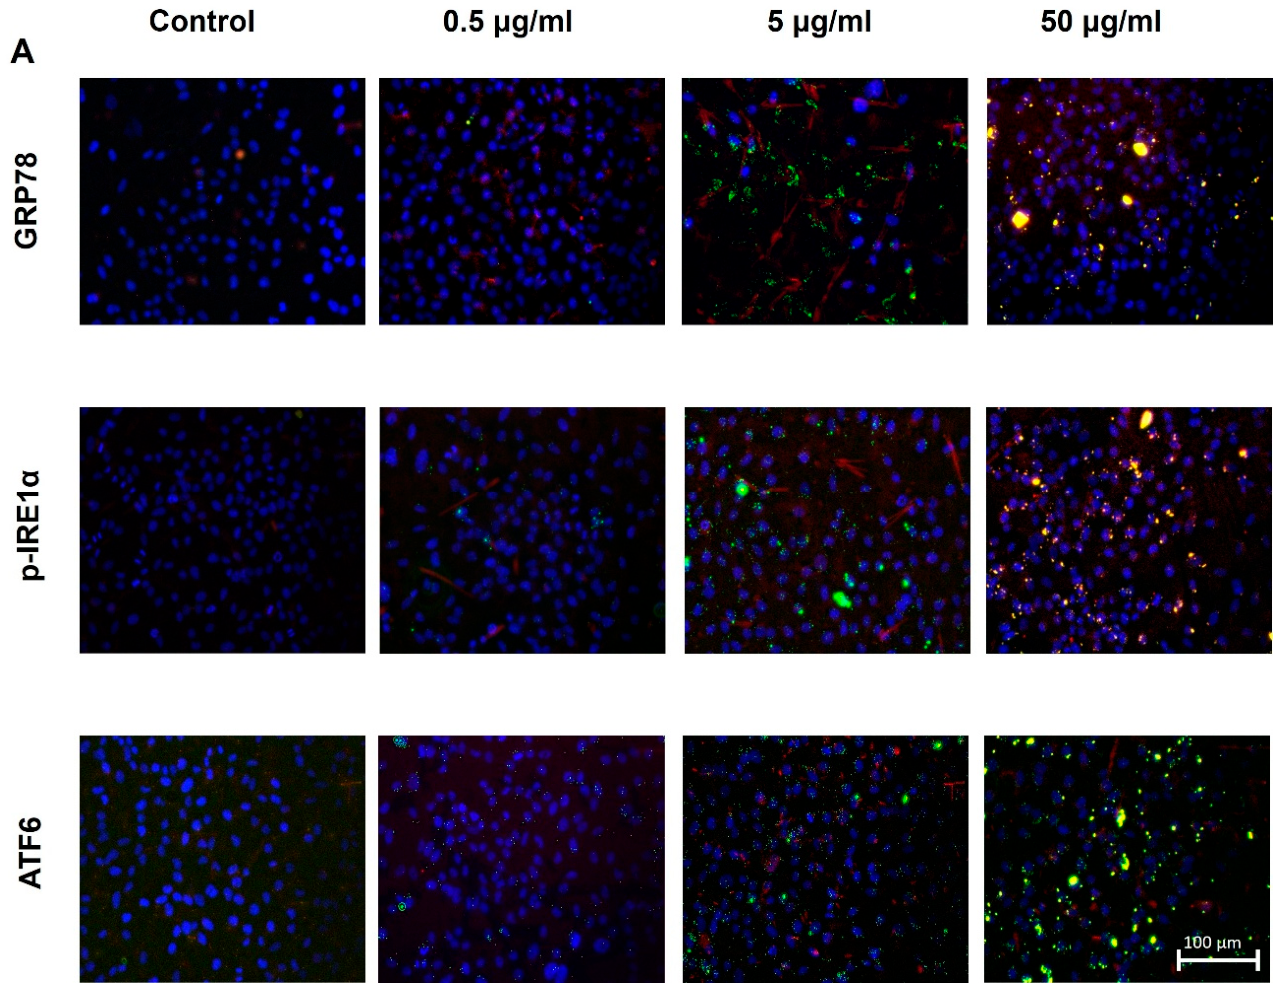
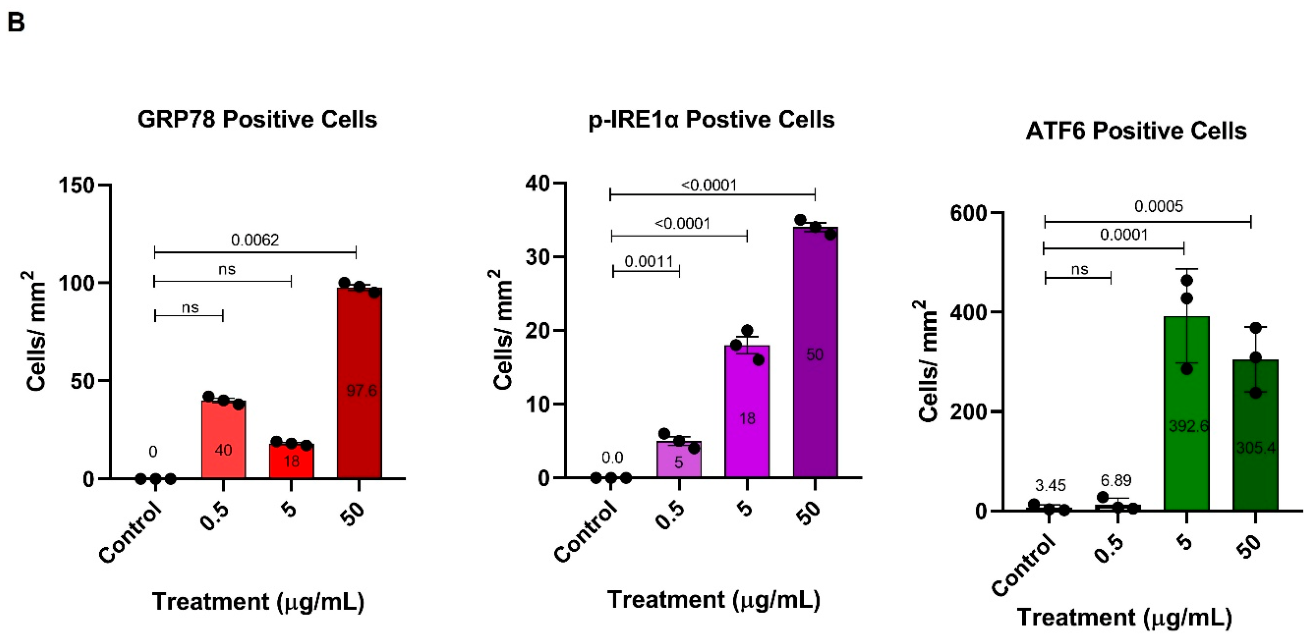
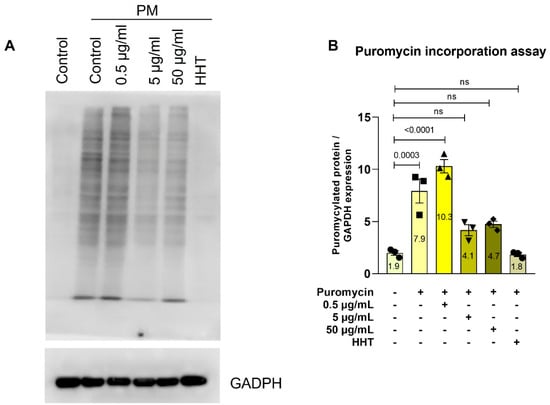
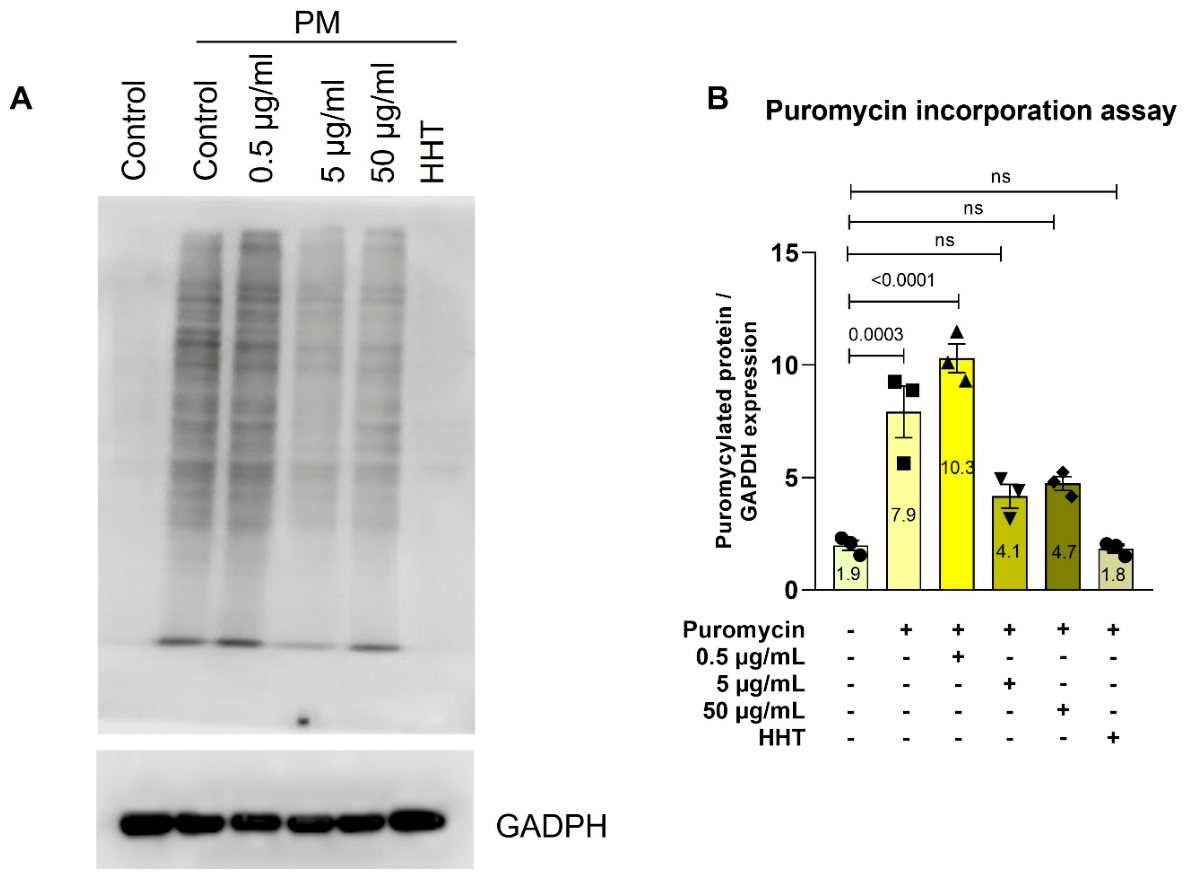

Disclaimer/Publisher’s Note: The statements, opinions and data contained in all publications are solely those of the individual author(s) and contributor(s) and not of MDPI and/or the editor(s). MDPI and/or the editor(s) disclaim responsibility for any injury to people or property resulting from any ideas, methods, instructions or products referred to in the content. |
© 2026 by the authors. Licensee MDPI, Basel, Switzerland. This article is an open access article distributed under the terms and conditions of the Creative Commons Attribution (CC BY) license.