


Abstract
Microplastic (MP) contamination in freshwater systems has emerged as a growing environmental concern. This study investigated the occurrence and seasonal variability of MPs in surface water, the water column, and sediments at selected sites in Lake Alhajuela, Panama. Lake Alhajuela is an artificial reservoir that supplies water to the Panama Canal lock system and to the cities of Panama and Colón, serving more than 50% of the country’s population. MPs were isolated using two digestion protocols followed by density separation, and fragments and films larger than 1 mm were chemically characterized using FTIR–ATR spectroscopy. Mean MP concentrations were 759 ± 536 MPs L−1 in surface water, 328 ± 140 MPs L−1 in the water column, and 109 ± 87 MPs g−1 in sediments. Statistical analyses revealed no significant differences among sampling sites; however, significant seasonal differences were observed (p < 0.01). Smaller MPs (63–249 µm) were more abundant compared to larger MPs (>250 µm). Fragments and fibers were the most predominant type of MP reported. Our results confirm the presence of MPs in the surface and water column, as well as sediments of the Alhajuela Lake. Further studies are needed to elucidate the fate, sources, transport, and distribution of MPs across Lago Alhajuela as well as to assess the lake’s potential contribution of MPs to Gatun Lake and the Panama Canal system.
1. Introduction
Microplastics (MPs) are increasingly recognized as persistent organic pollutants [1], originating from the fragmentation and degradation of plastics manufactured for consumer and industrial use. The excessive production and improper management of plastic waste [2] have led to their widespread accumulation in the environment, resulting in the adverse consequences currently observed. Since the seminal study by Thompson et al. (2004), MPs have received growing scientific attention due to their ubiquity and persistence across ecosystems [3]. Their impacts, particularly on marine ecosystems, have been extensively documented, showing ecological and environmental risks associated with MP pollution [4,5,6].
The impacts of MPs on freshwater ecosystems, including lakes, and on human health have also received increasing attention in recent years [7,8,9,10]. Approximately 80% of MPs entering the marine environment originate from land-based sources and are transported through freshwater systems [11,12,13,14]. MPs exhibit the defining characteristics of emerging contaminants, including environmental persistence, bioaccumulation potential, long-range transport, and inherent toxicity, which together may result in adverse effects on ecosystems and human health [15,16,17].
MPs can adsorb and concentrate a wide range of chemical contaminants, thereby exacerbating pollutant enrichment and posing risks to lake ecosystems, which ultimately affects humans [15]. Previous studies have shown that MPs’ abundance in lakes is negatively correlated with lake depth, surface area, and distance from populated areas and positively correlated with surrounding population density [16]. The first studies in lakes were performed by Eriksen et al. in 2013 [17]. In their review, Yang et al. compare the differences in lake MPs globally and show the correlation between distribution and countries’ socio economic development [18], which might be one factor that contributes to the observed increase in MP concentrations.
The morphology and limnological aspects of lakes are extremely important in these studies. Almost all Panamanian lakes are exoreic basins or open lakes with an outflow to rivers and the ocean, but they are also classified as shallow lakes, meaning that floating MP accumulation will have a short retention time and they can be flushed out into the ocean. Lake Alhajuela was created in 1935 as a reservoir of the Chagres River by flooding an area of about 50 km and building a dam. The height difference allows for the generation of hydroelectric power but affects the distribution and abundance of MPs. Studies in dams around the world have shown that they act as MP sinks, interrupting their continuous downstream flow [19,20]. The lake has two main functions: it serves as a water reservoir for the Panama Canal and it is the main freshwater reservoir for the cities of Panama and Colon. The impounded water of the Chagres River and five other minor tributaries form the lake that feeds the Gatun Lake. Altogether, they are part of the Panama Canal watershed. Population studies show that at least 40,000 inhabitants are settled around the lake in small communities [21]. According to Gutiérrez et al. [22], the average depth of Lake Alajuela is 12.7 m, reaching a maximum of 48 m. Recent assessments of the reservoir confirm these values [23].
The Chilibre water treatment plant is found on its banks and produces 250 million gallons per day (MGD) of potable water. Anthropogenic activities such as fishing and tourism take place and exert pressure on the watershed; settlements generate debris, with plastic being the main component. One of the most significant changes observed in lake basins is the transformation of natural areas into urbanized areas due to migration and displacement of certain groups, such as Indigenous people and displaced farmers from rural areas [24]. Migration occurs due to the need for more agricultural land, but relocation and displacement occur due to development updates for the Panama Canal infrastructure [25]. Furthermore, the removal of natural vegetation in basins can increase soil erosion and lake sedimentation, negatively impact water quality, and potentially reduce lake water storage capacity [26]. The reservoir is crucial for supporting water levels for the Panama Canal, but, most importantly, it provides drinking water to major cities and sustenance to the population [27].
There are no studies on MPs in freshwater systems in Panama [7]. Due to its importance, Alhajuela Lake is monitored monthly by the Panama Canal Authority (ACP) [10,27] for compliance with local standards and is periodically dredged to prevent silting up. MPs are not included in the monitoring program, only physical–chemical parameters (pH, turbidity, nitrates), heavy metals, and microbiological indicators. Therefore, this study reports on the following objectives: (1) it quantifies MP concentrations, types, and abundances, (2) it compares sites with the presence of MPs, and (3) it assesses the seasonal influence on MPs in the Alhajuela Lake. Because of technical limitations, it remains a quantitative study; we hypothesized that MP densities would be (1) greater in surface water during the dry season compared to the transition and rainy season, and (2) less abundant in lake sediments than in the lake surface water and water column.
2. Materials and Methods
2.1. Site Description
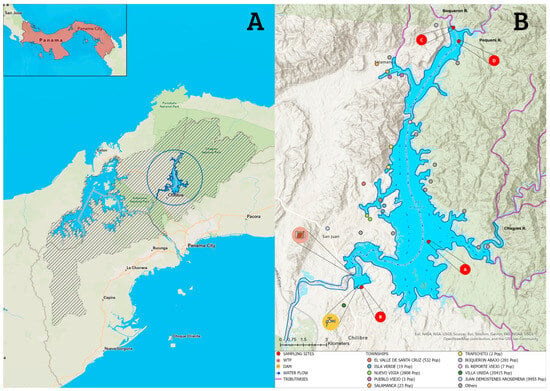
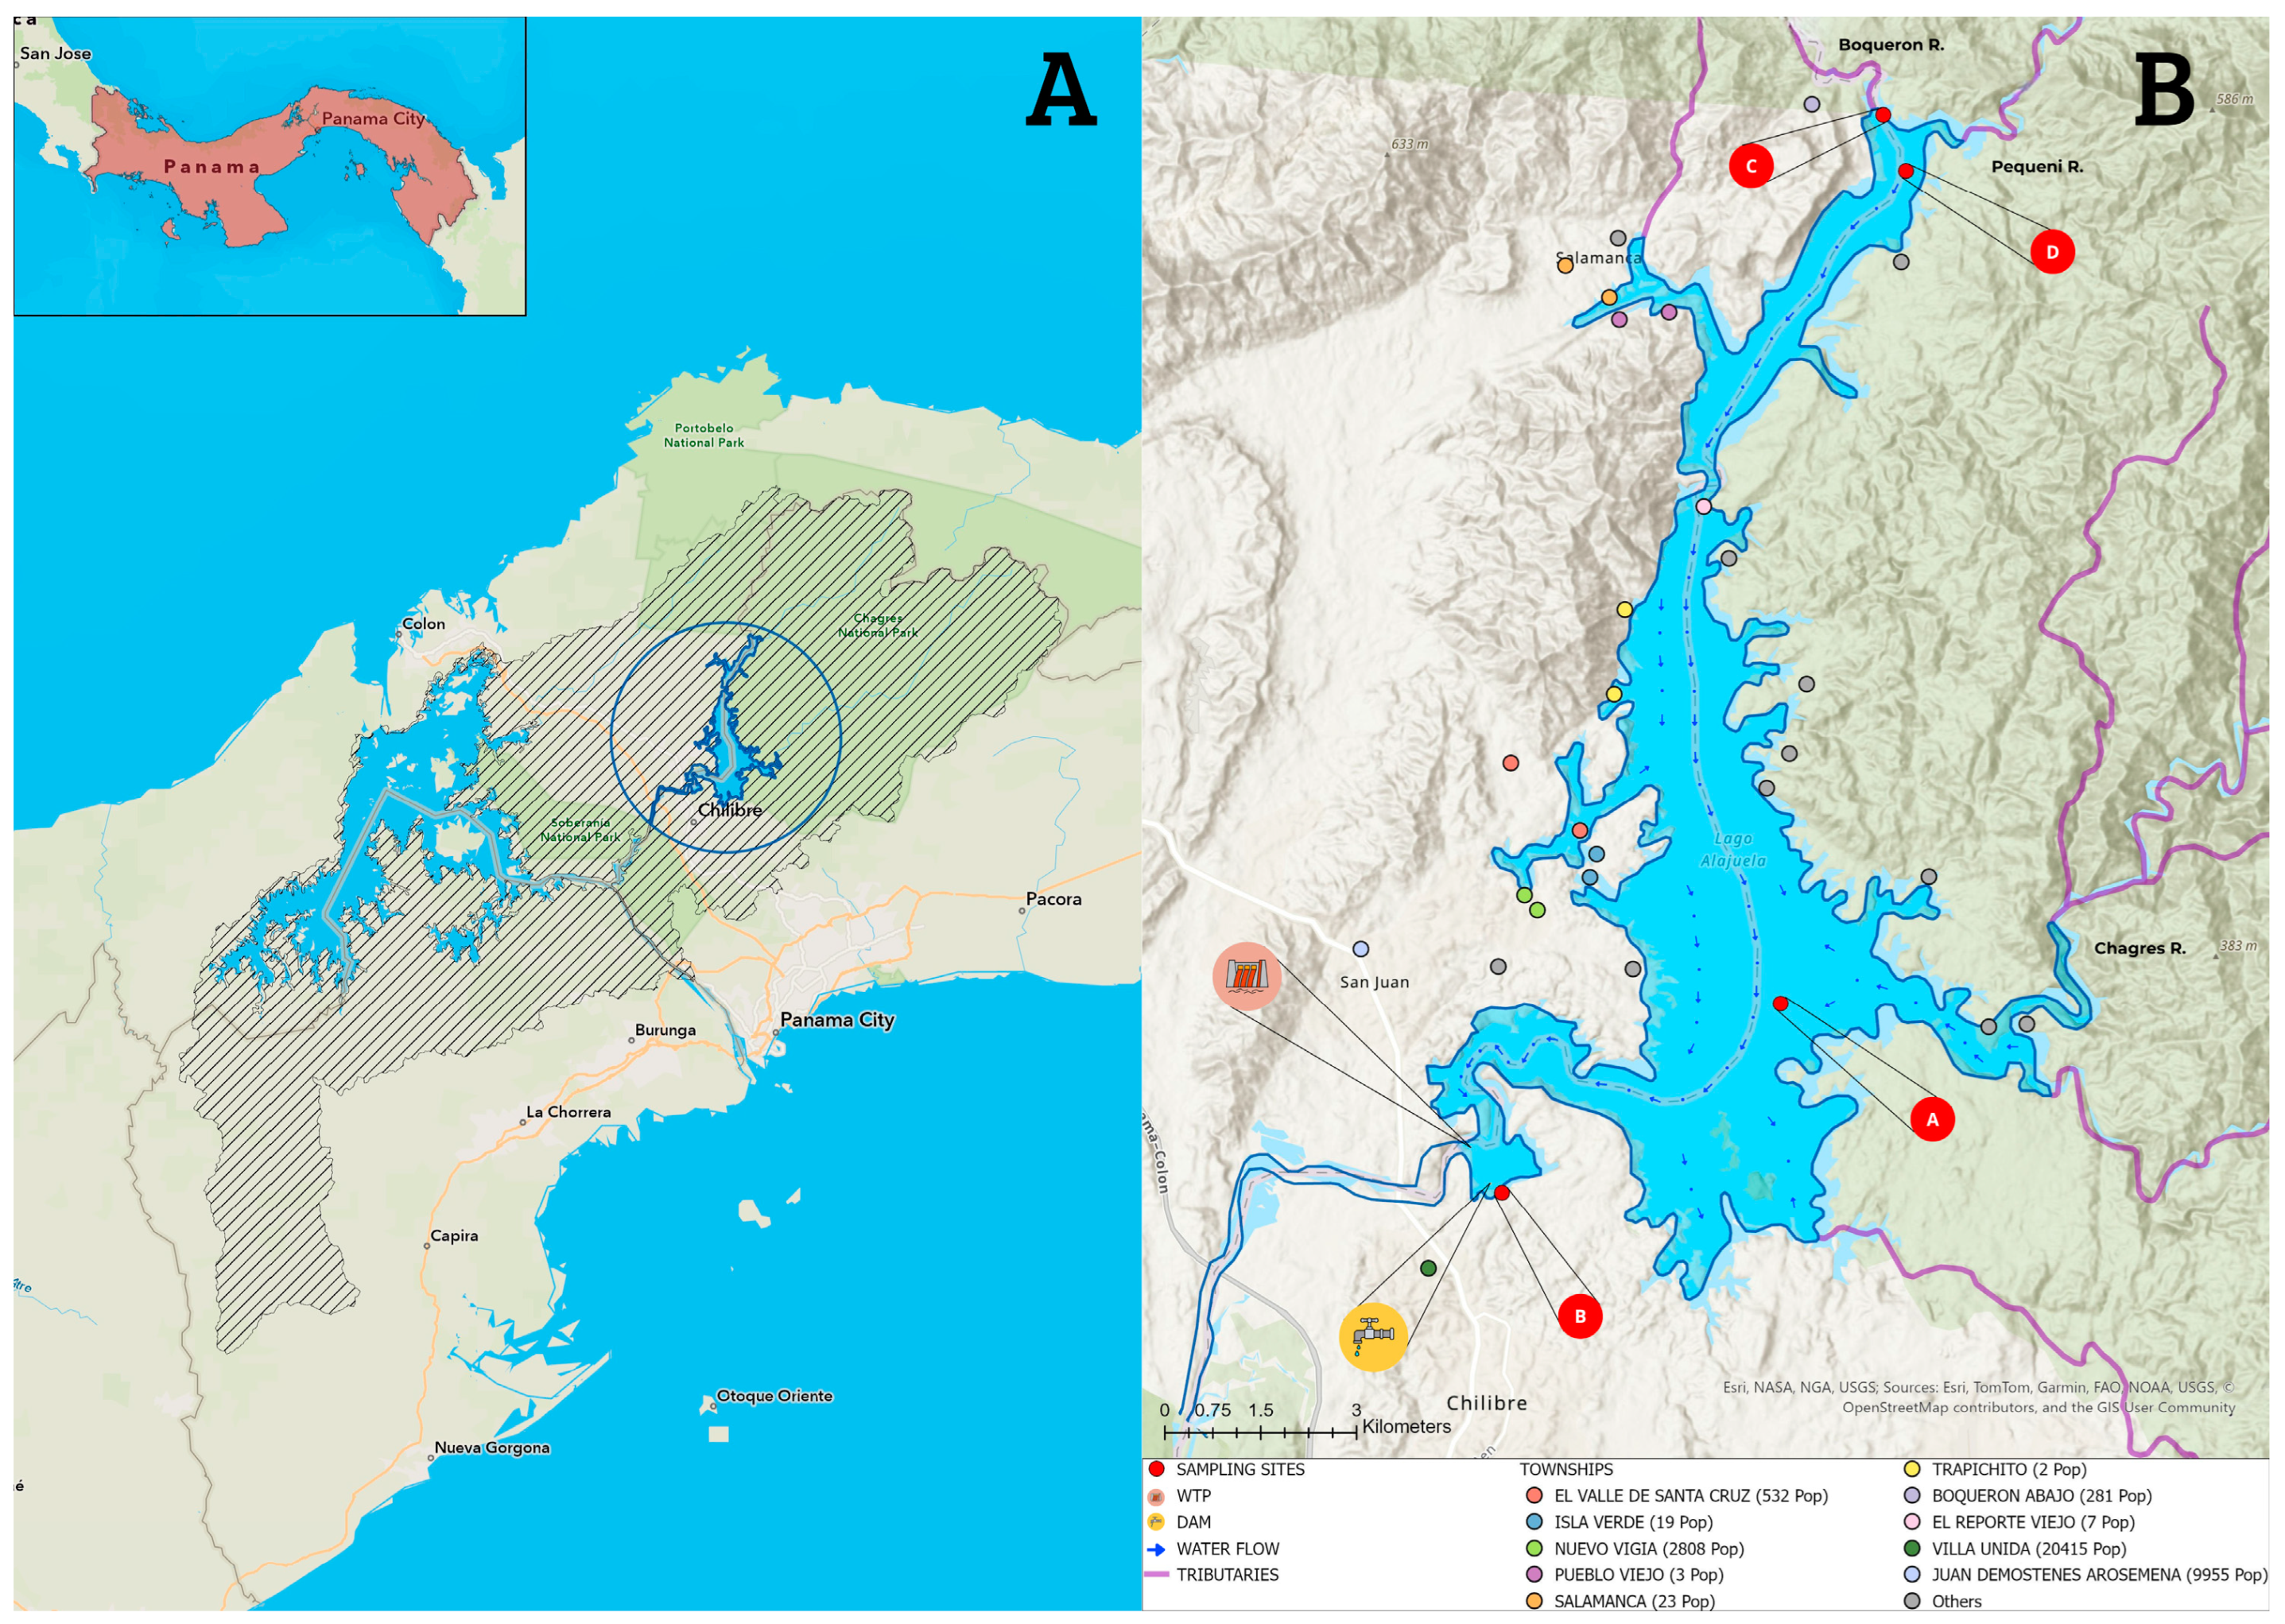
Constructed between 1931 and 1939 by damming the Chagres River, Lago Alhajuela plays a critical role in flood control and supports the operational water needs of the Panama Canal. The reservoir covers approximately 50 km2 and is in the Chilibre district of Panama Province, extending into parts of Colón Province. Lago Alajuela is situated at 9°15′18″ N latitude and 79°34′48′′ W longitude, with an average depth of 12.7 m and a maximum depth of 48 m. The watershed area encompasses approximately 952 km2 and is characterized by dense vegetation cover and high annual rainfall, ranging from 1500 to 4000 mm. Water storage capacity fluctuates seasonally between approximately 765 million m3 at full capacity and 222 million m3 at minimum levels, affecting an exposed area of about 13 km2. The reservoir supports significant fishing activity, with more than 1043 fishermen operating across 21 fishing communities with a combined population of approximately 40,000 inhabitants. Major fishing zones include Victoriano Lorenzo and San Juan de Pequení, the latter of which is one of the sampling sites in this study. Fishing practices primarily involve gill nets and traps, and vessels are typically diesel-powered and constructed from fiberglass and polymer-based materials. Local livelihoods depend largely on fishing and ecotourism, particularly within Indigenous communities, where the average reported income is approximately US$192.64 [28]. For MP sampling, four sites (Table 1) were selected based on hydrological characteristics and human activity, as illustrated in Figure 1. A total of eight field trips were carried out during 2025 (dry, transition and rainy season).
Table 1.
Description of sampling sites A, B, C, and D with given denomination and a short description of their main characteristic.
Figure 1.
Location of Alhajuela lake in the Panama Canal watershed in the hatched area (A) and location of sampling sites (see Table 1) and communities settled around the lake (B).
The chosen sites are close to the basins and sub-basins that supply the lake. Settlements and communities are located near these sites and are expected to exert pressure on the lake’s water quality and increase the presence of MPs. Plastic pollution also reaches the lake through five main tributaries and minor stream draining water from the upper watershed of the Panama Canal basin [29].
2.2. Sampling and Treatment Methods
2.2.1. Superficial Water
A volume of 3000 mL (triplicates of one liter each) was collected at each sampling site per field trip. Before sampling, bottles were rinsed three times with lake surface water, then labeled and stored in a cooler. Upon arrival at the laboratory, visual inspection of the samples revealed none to very few visible floating particles. Each water sample was filtered through a stack of 63 and 250 µm certified sieves (Gilson, ASTM E11 standard test sieves, Columbus, OH, USA) to enable primary size fractionation. The sieves, with an outer diameter of 3.5 in, were placed over 400 mL beakers, and the remaining filtrate was transferred to the beakers using small volumes of distilled water. Beakers containing the filtrates were covered with aluminum foil and dried in an oven at 45 °C to avoid overheating and prevent potential plastic fractionation. Subsequently, a wet peroxidation step was performed to remove organic matter. In total, 10 mL of 30% H2O2 and 5 mL of Fenton reagent (as a catalyst) were added to the dried filtrates to digest microalgae and other organics. Peroxidation was conducted at room temperature (~23 °C) under a fume hood, and the exothermic reaction was controlled using an ice bath. After the reaction, 2 mL of H2O2 was added to confirm completion. Finally, the digested filtrates were filtered, dried, and stored in labeled Petri dishes for subsequent MP quantification.
2.2.2. Water Column
Samples of water column were collected using a 5 L Niskin bottle submersed to a depth of approximately 5–6 m. The sealing mechanism was activated via Niskin’s triggering system, and the collected water was transferred into three pre-labeled 1 L plastic bottles. These triplicate samples were collected at each field trip and sampling point and then treated in the same manner as surface water, being filtered through stacked sieves; however, the resulting filtrates contained fewer visible particles compared to those obtained from surface water. Using this approach, a total of 192 water samples (surface water and water column) were processed. Quantification results for these samples are presented in Section 3 of this article.
2.2.3. Sediments
Sediment samples were collected using a mini Van Veen dredge, with sampling depths ranging from 3 to 20 m in all four locations. Recovered sediments were transferred to pre-coded plastic Ziploc bags and transported to the laboratory in a cooler. In the laboratory, sediments were weighed, placed in aluminum trays, covered with aluminum foil, and dried in an oven at 45 °C. Triplicate subsamples of 1 g each were transferred to Erlenmeyer flasks containing 35 mL of enzyme solution [30,31,32]. Digestion was performed using BioClean® (Superior Biosolutions LLC, Dane, WI, USA), an industrial mixture of bacteria and enzymes (Proteases, Lipases, Chitinases, and Cellulases); samples were placed in an orbital shaker incubator (Infitek®, Minhang District, Shanghai, China) at 45 °C and 150 rpm for 72 h. Using this approach, a total of 96 g sediment samples were processed.
Following enzymatic digestion, sediments were transferred to 50 mL plastic vials and centrifuged at 1000 rpm for 30 min. Both the supernatant and centrifugation residue were examined for the presence of MPs. The supernatant was then poured onto a 100 µm certified metal filter and preserved. Two additional extractions were performed to recover MPs based on density separation. First, 35 mL of NaCl solution (1.2 g mL−1) was added to the remaining sediment in the vial, centrifuged at 1000 rpm for 30 min, and the supernatant was filtered through the same 100 µm metal sieve to recover less dense MPs, which were then dried in an oven. The remaining residue was treated with 35 mL of KI solution (1.6 g mL−1), and the procedure was repeated. The KI supernatant, containing denser MPs, was filtered through a second 100 µm metal sieve, dried, and preserved for counting.
2.2.4. Verification of Polymeric Nature of Particles
Due to the small size, even though the methodologies employed in the extraction of particles for all three matrices followed the step-by-step elimination of unwanted organic matter and any possible inorganic compounds, a quick verification method was applied to randomly chosen filters. Nile Red is a lipophilic fluorescent dye that stains the surface of plastics and becomes fluorescent under a blue light (Crime Lite: 450–510 nm) and is observed using an orange filter (529 nm) for protection. We used the recommended concentration for the dye, which was 10 μg mL−1 [33,34]
2.2.5. Quantification of Filters
Particle quantification was performed using a Leica S9i stereomicroscope with apochromatic optics (Leica Model LED2500, Boston, MA, USA), zoom range: 6.1×–110.0×). For surface and water column samples, the 63 µm and 250 µm filters were examined, and both the number and type of particles were recorded. Sediment samples, filtered through 100 µm certified metal sieves, were similarly analyzed. All filters were meticulously inspected, and particles were classified into fibers, fragments, pellets, microspheres, and foams. Representative particles from each category were photographed for documentation [34].
2.2.6. Fourier Transform Infrared Analysis
Particles larger than 250 µm recovered from surface water samples were manually picked using fine tweezers and preserved in Petri dishes for FTIR–ATR analysis. Before analysis, each particle was subjected to ultrasonic treatment in ultrapure water for 10 min and then dried in an oven at 45 °C overnight to prevent interference from residual moisture.
Fourier transform infrared (FTIR) spectroscopy with attenuated total reflectance (ATR) was conducted using an Alpha II Bruker spectrometer (Bruker, Ettlingen, Germany) at the Microplastics Laboratory. For each particle, a background scan was first performed, and spectra were recorded as an average of 24 scans over the range of 4500–400 cm−1 at a resolution of 4 cm−1. Polymer composition was determined by comparing the full spectral range of the unprocessed spectra with reference spectra from the diamond crystal ATR library (KIMW-Polymer, Kunststoff-Institut, Lüdenscheid, Germany). A match of ≥75% similarity was considered acceptable for identification.
2.2.7. QA/QC Control in the Field and in the Laboratory
MPs are ubiquitous in both indoor and outdoor air, and laboratory contamination is a significant concern during sample processing. To minimize contamination, staff wore cotton clothing and pink-colored gloves and gowns, a precautionary measure chosen because the color is uncommon in environmental samples and facilitates visual detection of potential contaminants. All extraction, filtration, and density separation procedures were performed within a Class II laminar flow cabinet (Infitek, Minhang District, Shanghai, China), and wet peroxidation was conducted under a fume hood. Samples were covered with aluminum foil whenever possible to reduce airborne contamination. The use of plastic materials in the laboratory was minimized, as abrasion from items such as plastic centrifuge vials with colored caps could contribute to MP contamination. Laboratory equipment and accessories were periodically evaluated for integrity, and substitutions were made where feasible (e.g., glass rods replacing Teflon stirrers). Personal protective equipment, including goggles and nitrile gloves, was mandatory. The laboratory is equipped with a stainless-steel distillation apparatus and a water purification system (ARIUM Mini, Sartorius, Göttingen, Germany) to ensure the use of ultrapure water in all procedures.
2.2.8. Data Analysis
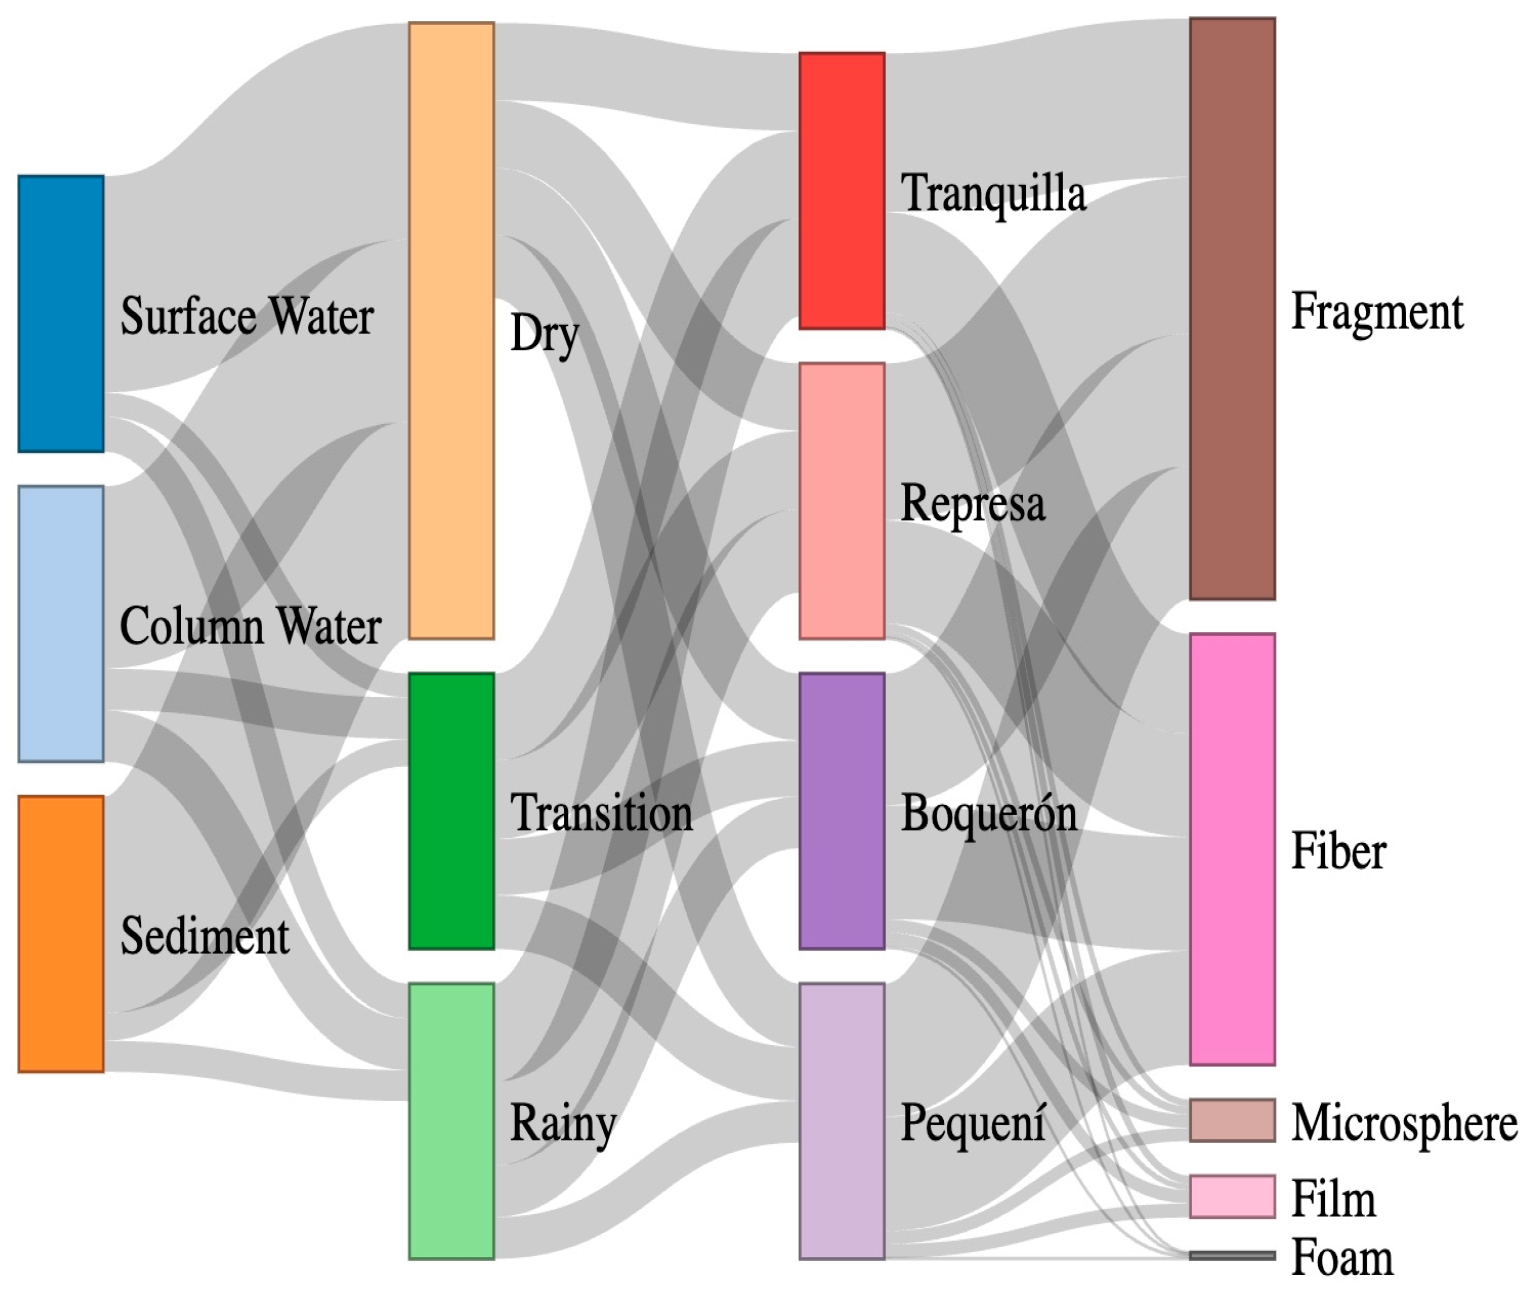
MP concentrations were expressed as MPs per liter for surface and water column, and MPs per gram for sediments. Data are presented as mean ± standard deviation for concentrations in the text and mean ± standard error of the mean in graphs. Average proportions ± are shown to describe MPs’ shape across the three seasons and three matrices for four locations. To evaluate differences in MP concentrations across four locations (factor 1) and three seasons (factor 2) for the three matrices (surface water, sediments, and water column), a two-way ANOVA was conducted. Raw MP counts were square-root-transformed to improve normality. Assumptions of normality and homogeneity of variances were assessed using the Shapiro–Wilk test and Levene’s test, respectively. Statistical significance was set at α = 0.05. All figures include the corresponding raw data to provide a clearer illustration of MP distributions across locations, seasons, and matrices. Figure 1 was created in ArcGIS Pro 3.5.57366 and modified with Biorender.com. This software was used to create Figure 2, and R Studio (2025.09.2) was used to develop the Sankey in Figure 3 using the network3D package [35].
Figure 2.
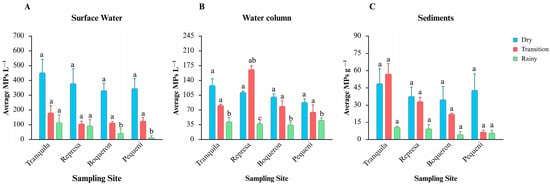
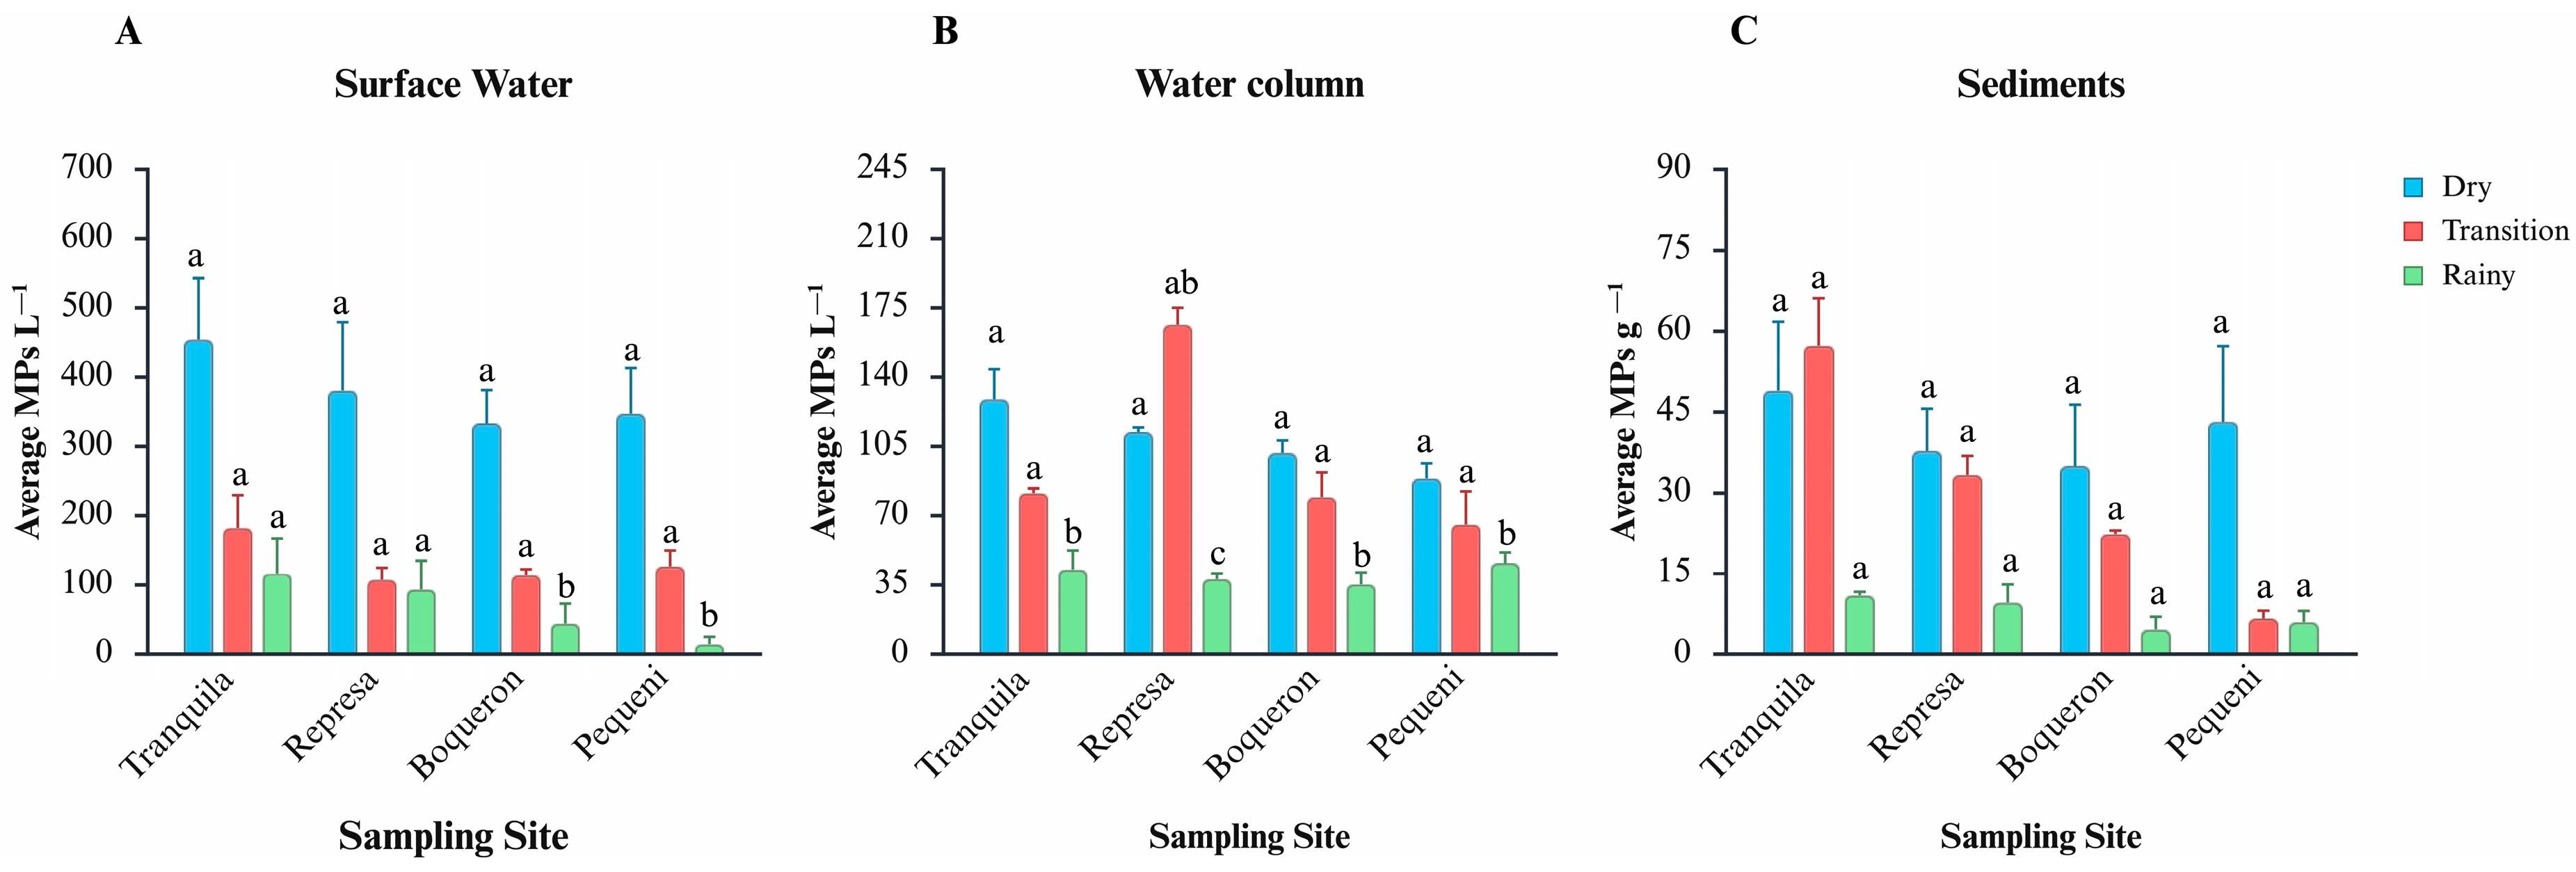
Average MP concentrations in surface water (A), surface water (B), and water column (C) across three seasons and four locations in Alajuela Lake, Panama. Bars represent mean ± standard error of the mean. Different letters above bars indicate statistically significant differences within each group and each matrix (p < 0.05).
Figure 3.
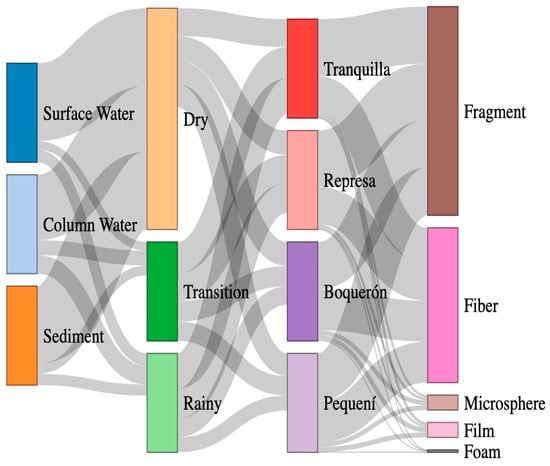
Occurrence of MPs across matrices represented in a Sankey diagram. The diagram represents the proportion of MPs across matrices (sediment, surface water, and water column) to seasons, sampling locations, and, ultimately, to the identified MPs’ shapes. The thickness of each connection indicates the relative abundance of particles following each pathway. The visualization highlights a high concentration of fragments and fibers across most locations and seasons, as well as differences in shape composition among matrices and sampling periods.
3. Results
3.1. Microplastics in Surface Water
MP concentrations in surface water were measured across all four locations and three seasons. During the dry season (DS), the highest concentrations were observed at Tranquilla (455 ± 178 MPs L−1), followed by Represa (381 ± 197 MPs L−1) and Boquerón (334 ± 95 MPs L−1). Pequení showed a concentration of 348 ± 131 MPs L−1, which was higher than Boquerón but lower than Tranquilla and Represa (Figure 2A). This general pattern was consistent across the transition season (TS) and rainy season (RS). A significant seasonal effect on surface water MP concentrations was detected (F = 31.95, p < 0.001), with significant differences between the DS and RS (p < 0.001), TS and RS (p = 0.04) and DS and TS (p = 0.03). When analyzing seasonal differences within each location, Boquerón and Pequení exhibited significantly higher MP concentrations in the DS compared to the RS (p < 0.001). No significant differences in MP concentrations were found between locations (p > 0.05).
3.2. Microplastics in Water Column
MPs were detected at all four locations and across all three seasons. During the DS, the highest concentrations were observed at Tranquilla (132 ± 29 MPs L−1), followed by Represa (113 ± 5 MPs L−1), Boquerón (101 ± 13 MPs L−1), and Pequení (89 ± 15 MPs L−1). A significant seasonal effect was found (F = 21.9, p < 0.001), with MP concentrations differing significantly between the DS and TS (p < 0.001) and between the TS and RS (p < 0.001). When examining seasonal differences within each location, all four sites showed significantly higher MP concentrations in the DS compared to the RS (p < 0.001). Represa additionally showed significant differences between the DS and TS (p < 0.001) and between the TS and RS (p < 0.001). No significant differences in MP concentrations were detected between locations (p > 0.05, see Figure 2B).
3.3. Microplastics in Sediments
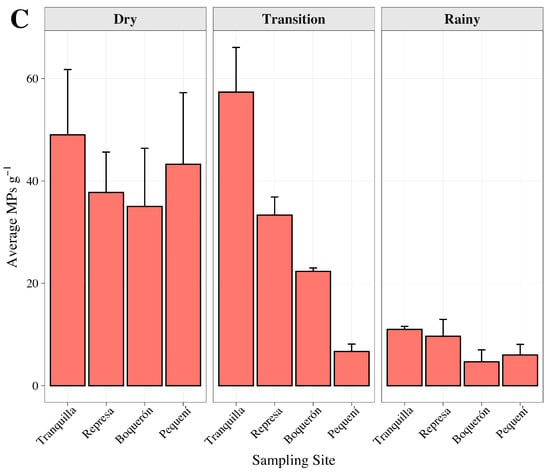
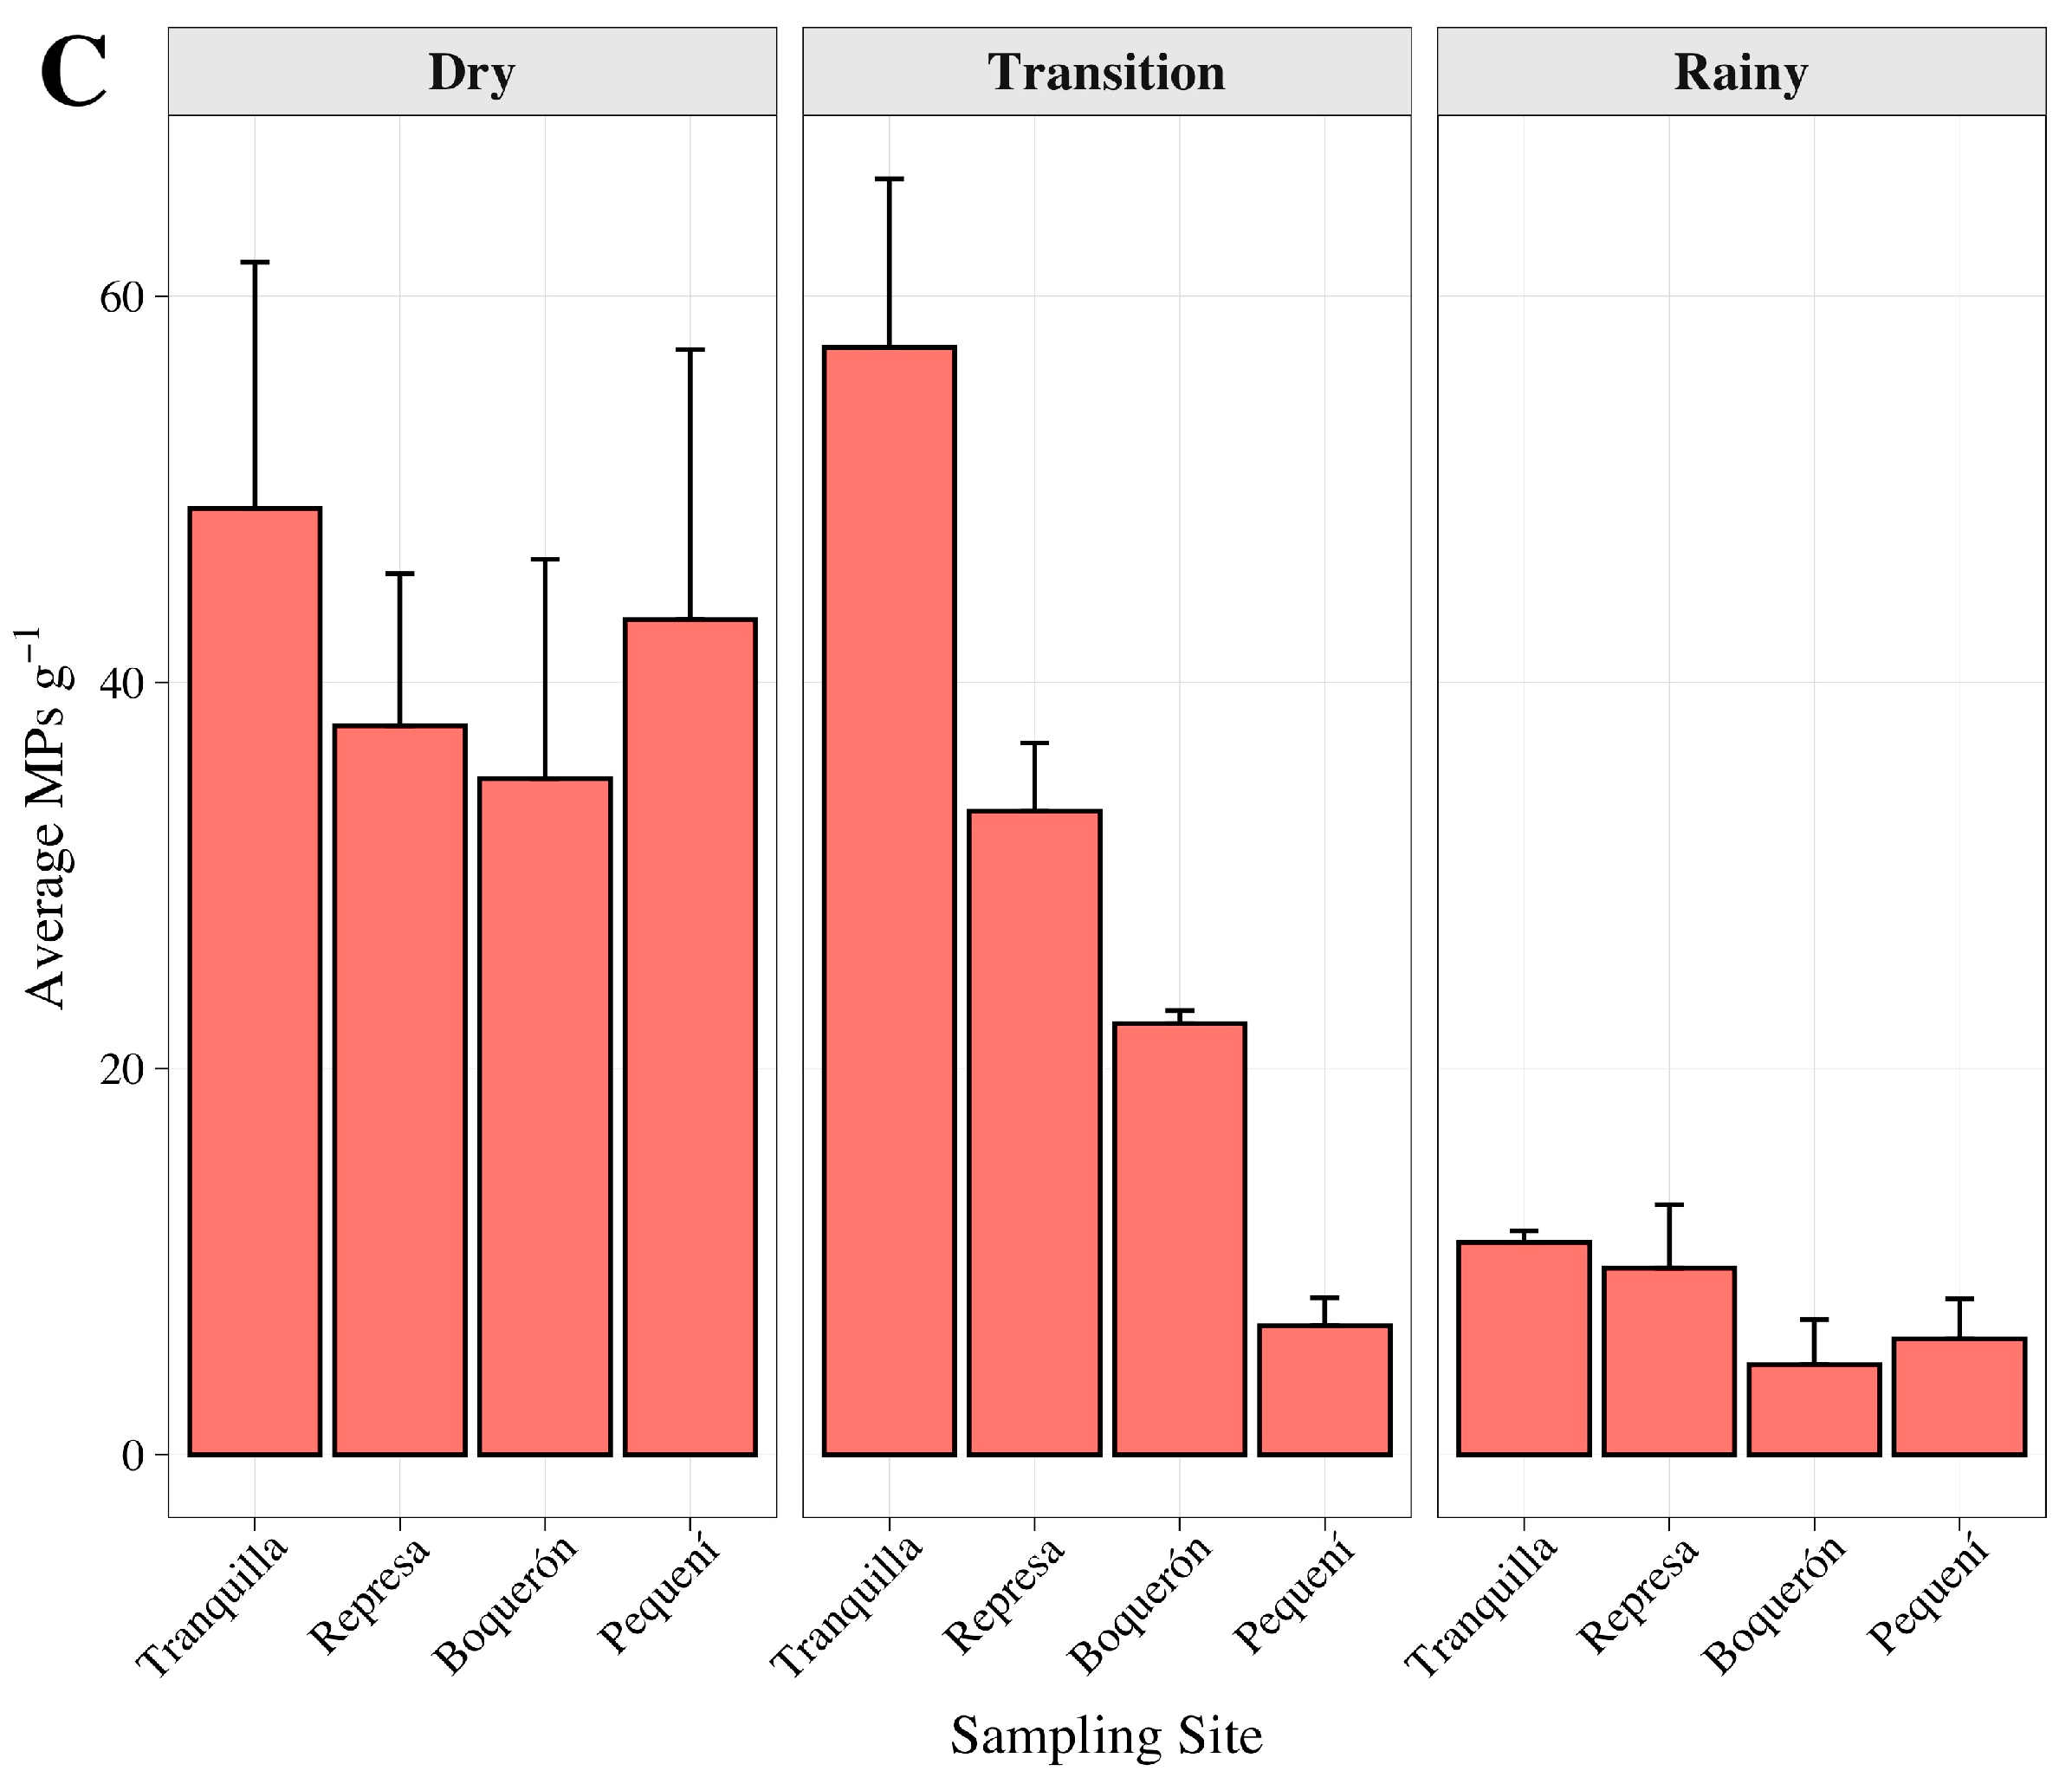
MPs were detected in all sediment samples across the four locations and three seasons. Concentrations ranged from 68 to 269 MPs g−1 (165 ± 86 MPs g−1) during the dry season (DS), reached 120 MPs g−1 in the transition season (TS), and ranged from 26 to 39 MPs g−1 (31 ± 7 MPs g−1) in the rainy season (RS). The highest sediment MP concentrations were observed in Tranquilla during both the TS and DS (57 ± 12 and 49 ± 25 MPs g−1, respectively), followed by Pequení during the DS (43 ± 28 MPs g−1). A decreasing trend in MP concentrations from DS to TS to RS was observed in Represa, Boquerón, and Pequení; however, Tranquilla showed higher concentrations in the TS than in the DS (Figure 1A). The two-way ANOVA indicated a significant temporal effect across seasons (F = 15.53, p < 0.01, Figure 2C), with significant differences between the DS and RS (p < 0.001) and between the TS and RS (p = 0.04). No significant differences in MP concentrations were detected between locations (p > 0.05).
3.4. Characterization of MPs’ Shape
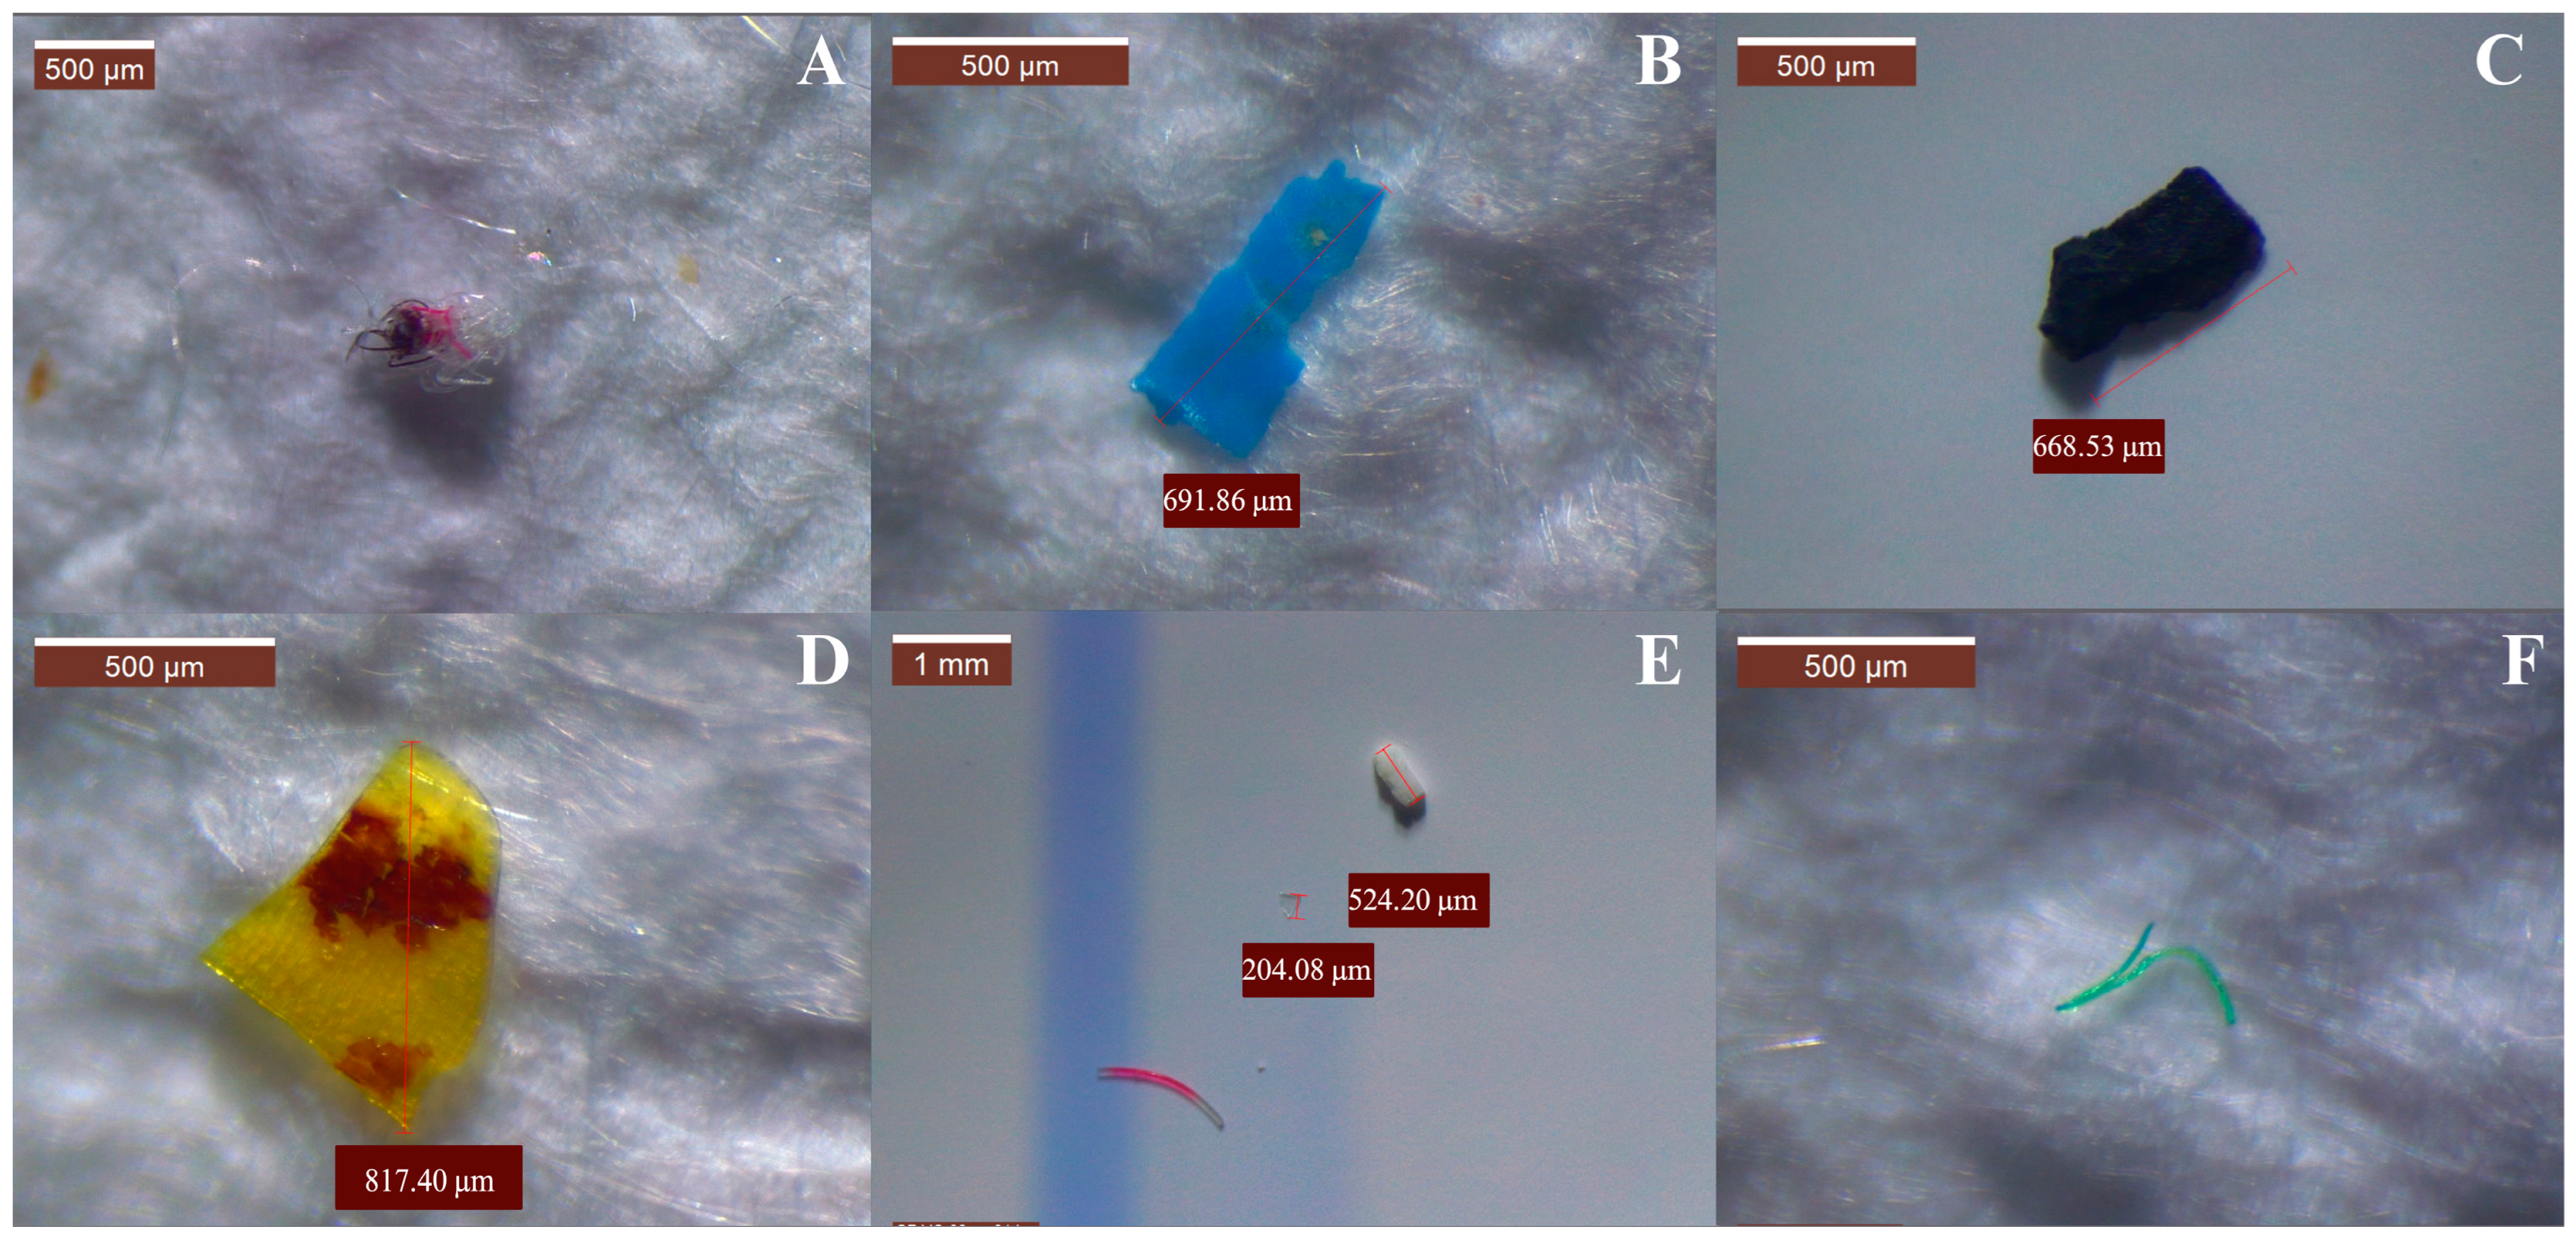
Across all seasons, matrices, and locations, five MPs shapes were identified: fragments, microspheres, fibers, film, and foam (Figure 3 and Figure 4). During the DS, fragments were the most dominant shape in water column, surface water, and sediments (60 ± 1%, 55 ± 8%, and 47 ± 7%, respectively). Fibers were the second most prevalent, particularly in column and surface water (36 ± 4% and 36 ± 5%), followed by sediments (29 ± 3%). In the TS, fiber became the predominant shape across matrices, following the pattern water column > sediment > surface water (62 ± 9% > 52 ± 16% > 47 ± 12%). Fragments were most abundant in surface water (50 ± 10%), followed by water column (30 ± 13%) and sediments (15 ± 24%). During the RS, fibers remained the most abundant in column and surface water (68 ± 8% and 44 ± 12%), followed by sediments (43 ± 6%). Although fragments were more abundant than fibers in surface water (54 ± 12%), they were less dominant than fibers in water column (30 ± 7%) and sediments (40 ± 11%).
Figure 4.
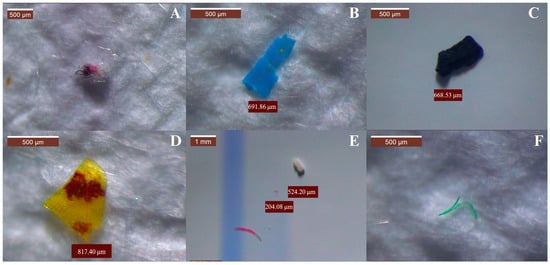
Visual representation of small MP shapes: fiber cumulus (A), blue fragment (B), black fragment (C), yellow-brownish dotted fragment (D), white, clear fragments and fiber (E), green fiber (F). The actual size is shown in the pictures.
3.5. Size Distribution of Microplastics
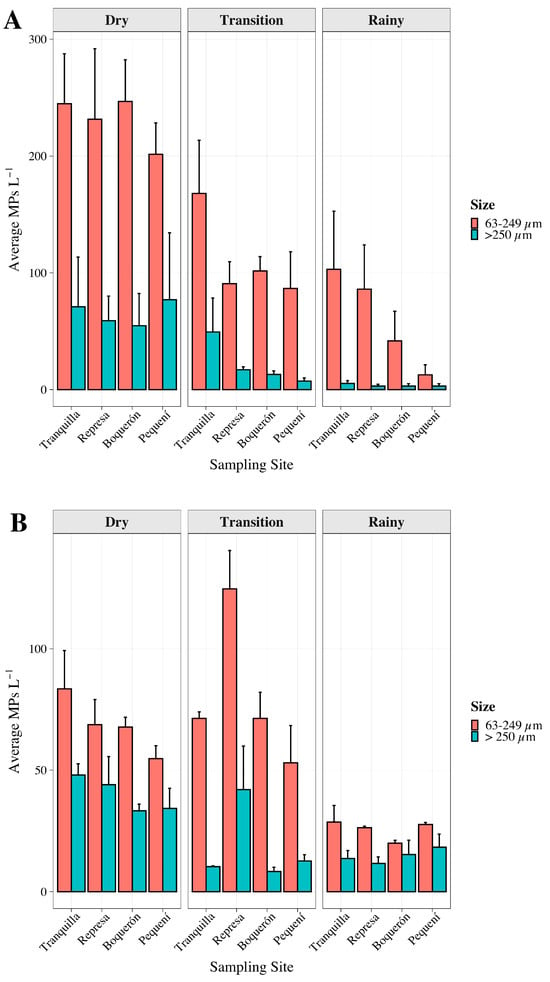
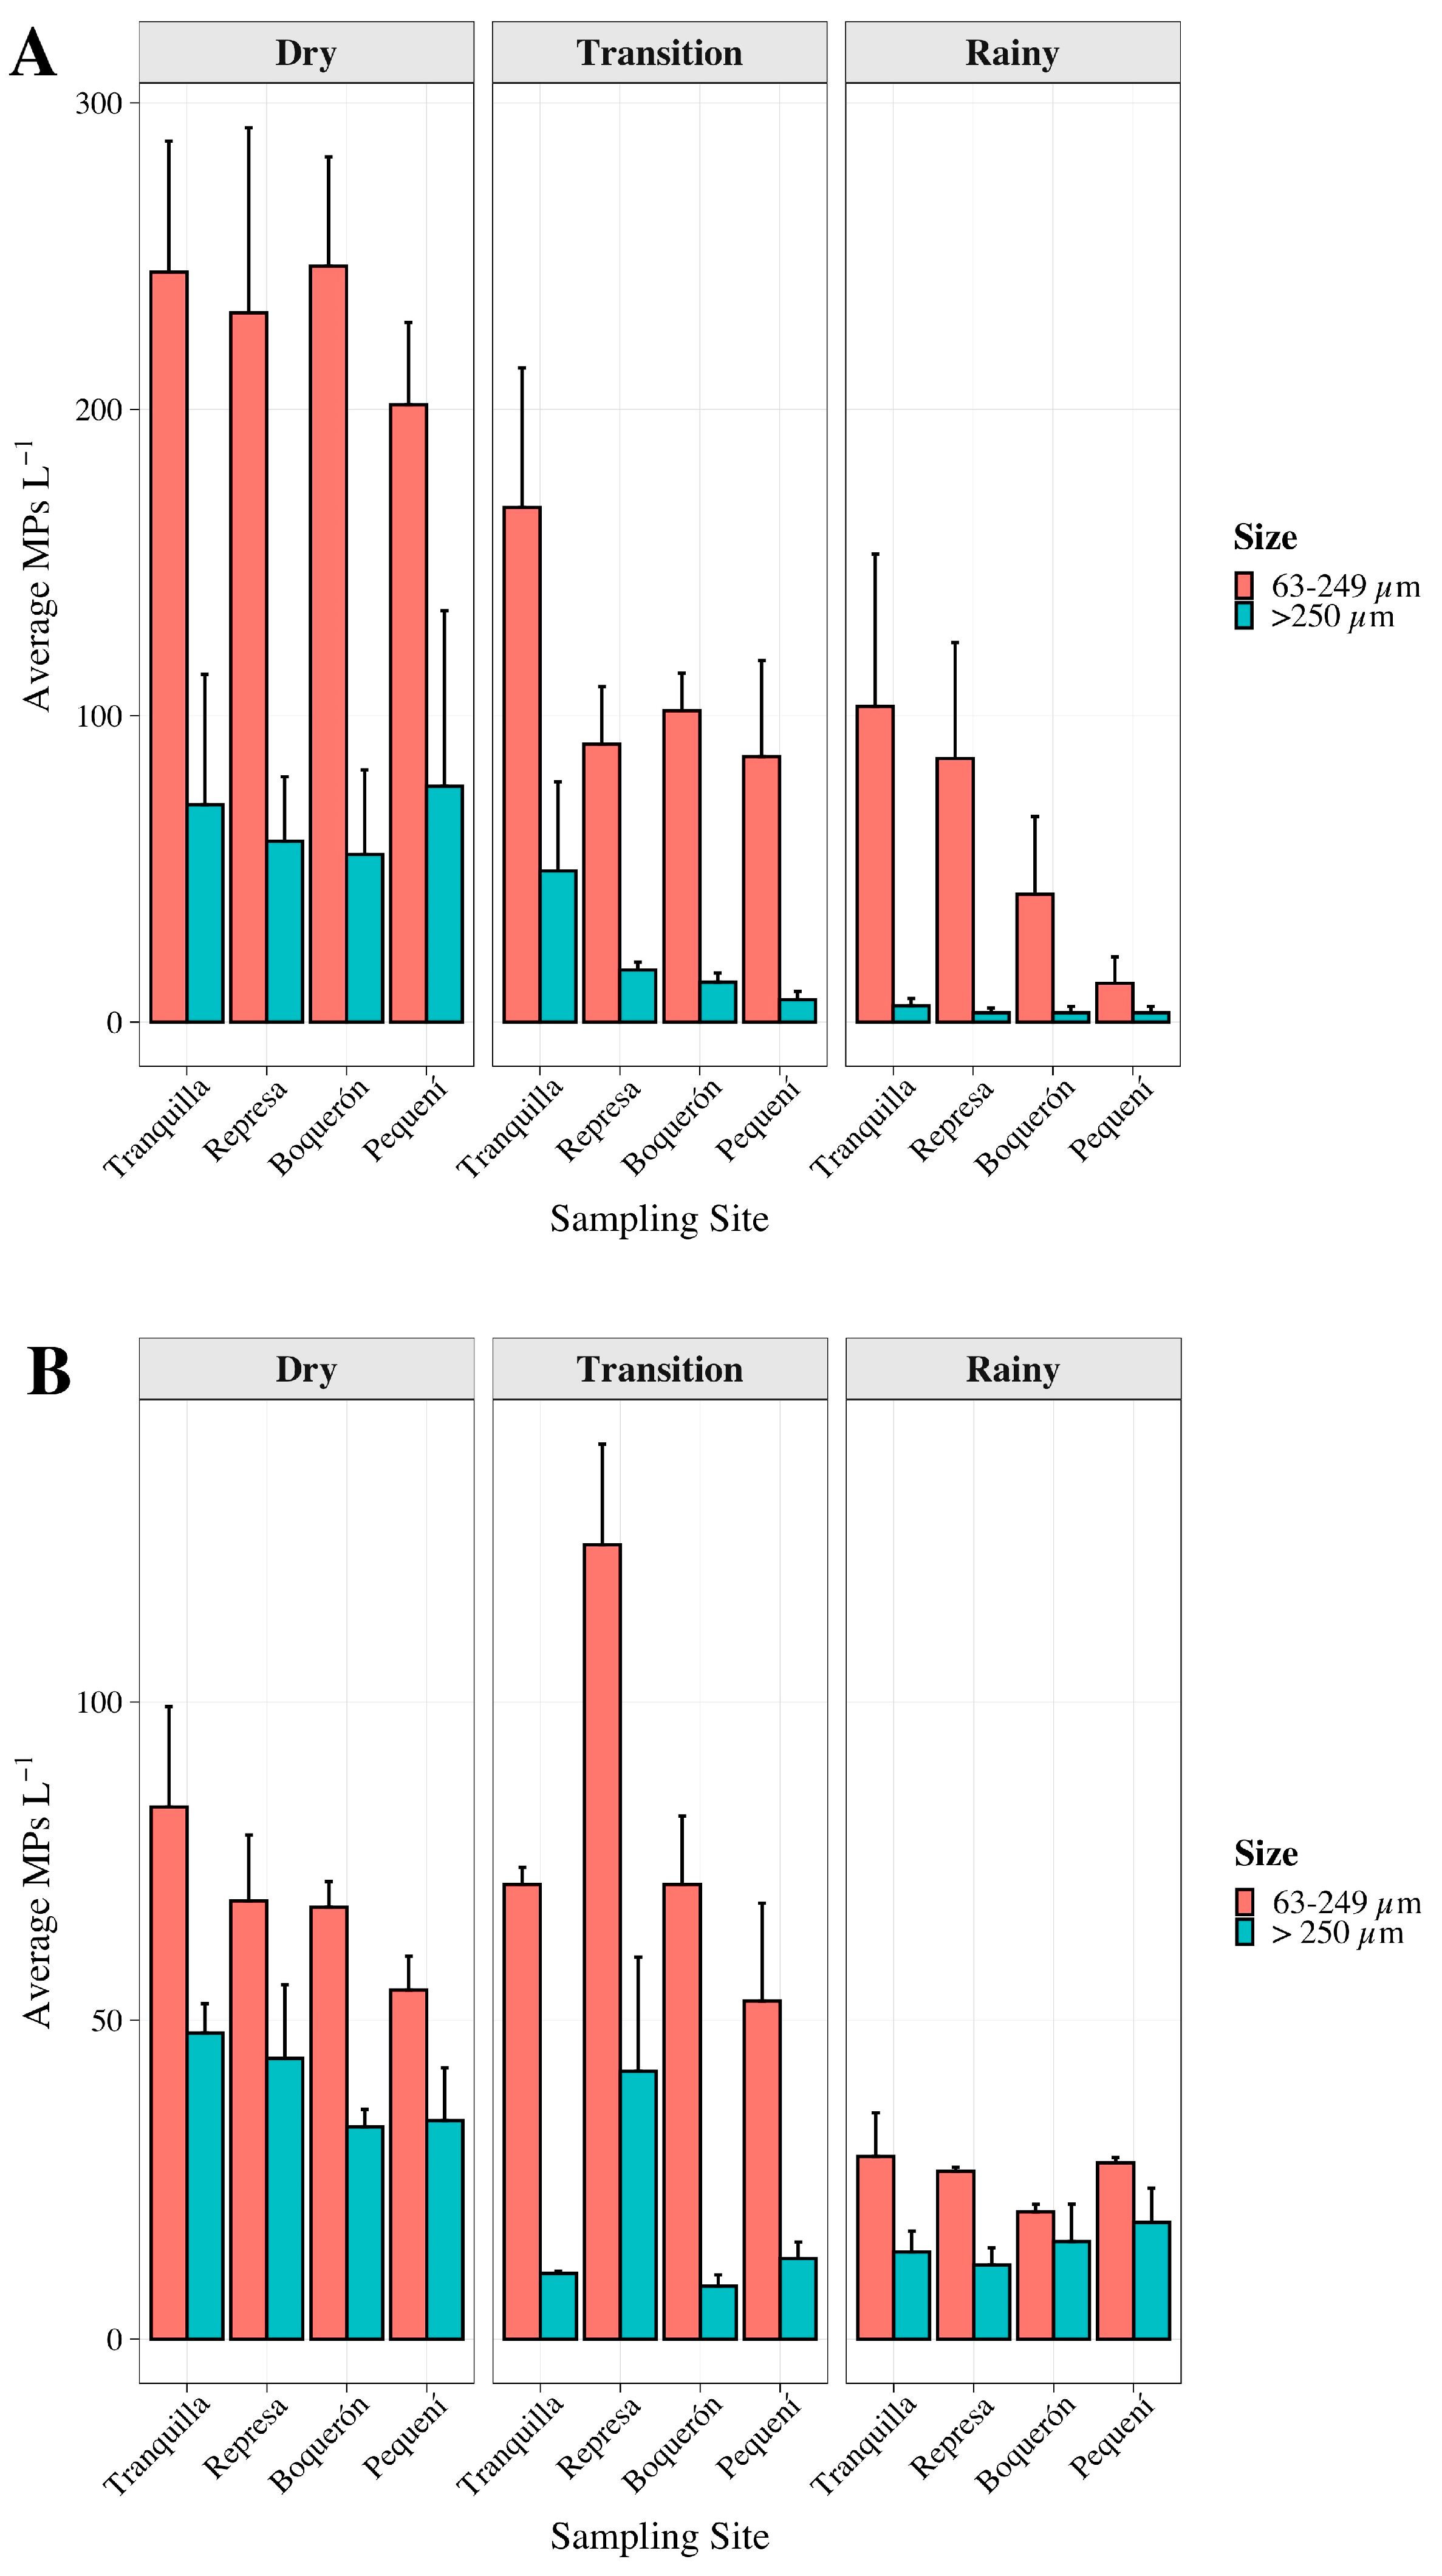
This study focused on MPs between 63 µm and 249 µm (small) and higher than 250 µm (large) in surface and water column, and higher than 100 µm for sediments. Our results show consistently higher concentrations of small MPs than large ones in both the surface and water column (see Figure 5A,B). In the surface water during the dry season, small MPs were markedly more abundant at all sites: Tranquilla (245 ± 46 vs. 71 ± 42 MPs L−1), followed by Represa (231 ± 60 vs. 59 ± 21 MPs L−1), Boquerón (247 ± 36 vs. 55 ± 28 MPs L−1), and Pequení (201 ± 27 vs. 77 ± 57 MPs L−1). A similar pattern occurred in water column, where small MPs also dominated during the dry season: Tranquilla (83 ± 16 vs. 33 ± 3 MPs L −1), Represa (68 ± 10 vs. 44 ± 11 MPs L−1), Boquerón (67 ± 4 vs. 48 ± 4 MPs L−1), and Pequení (55 ± 5 vs. 34 ± 8 MPs L−1). Because sediment sampling targeted MPs > 100 µm, size-based comparison was not possible. However, sediments also show a decreasing trend in MP abundance from the dry to rainy season (Figure 5C).
Figure 5.
Size distribution of MPs across surface water (A), water column (B), and sediments (C) during dry, transition, and rainy seasons for all sampling sites.
3.6. FTIR ATR Analysis
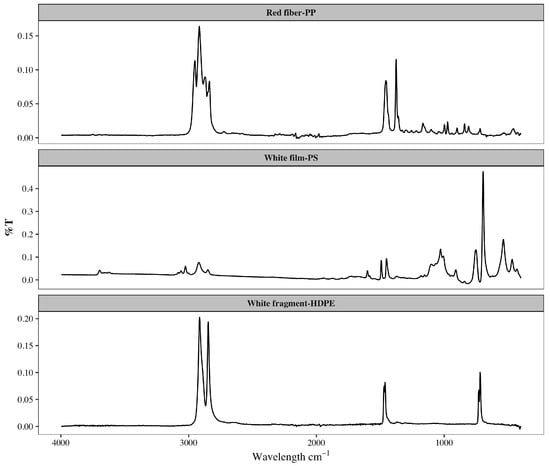
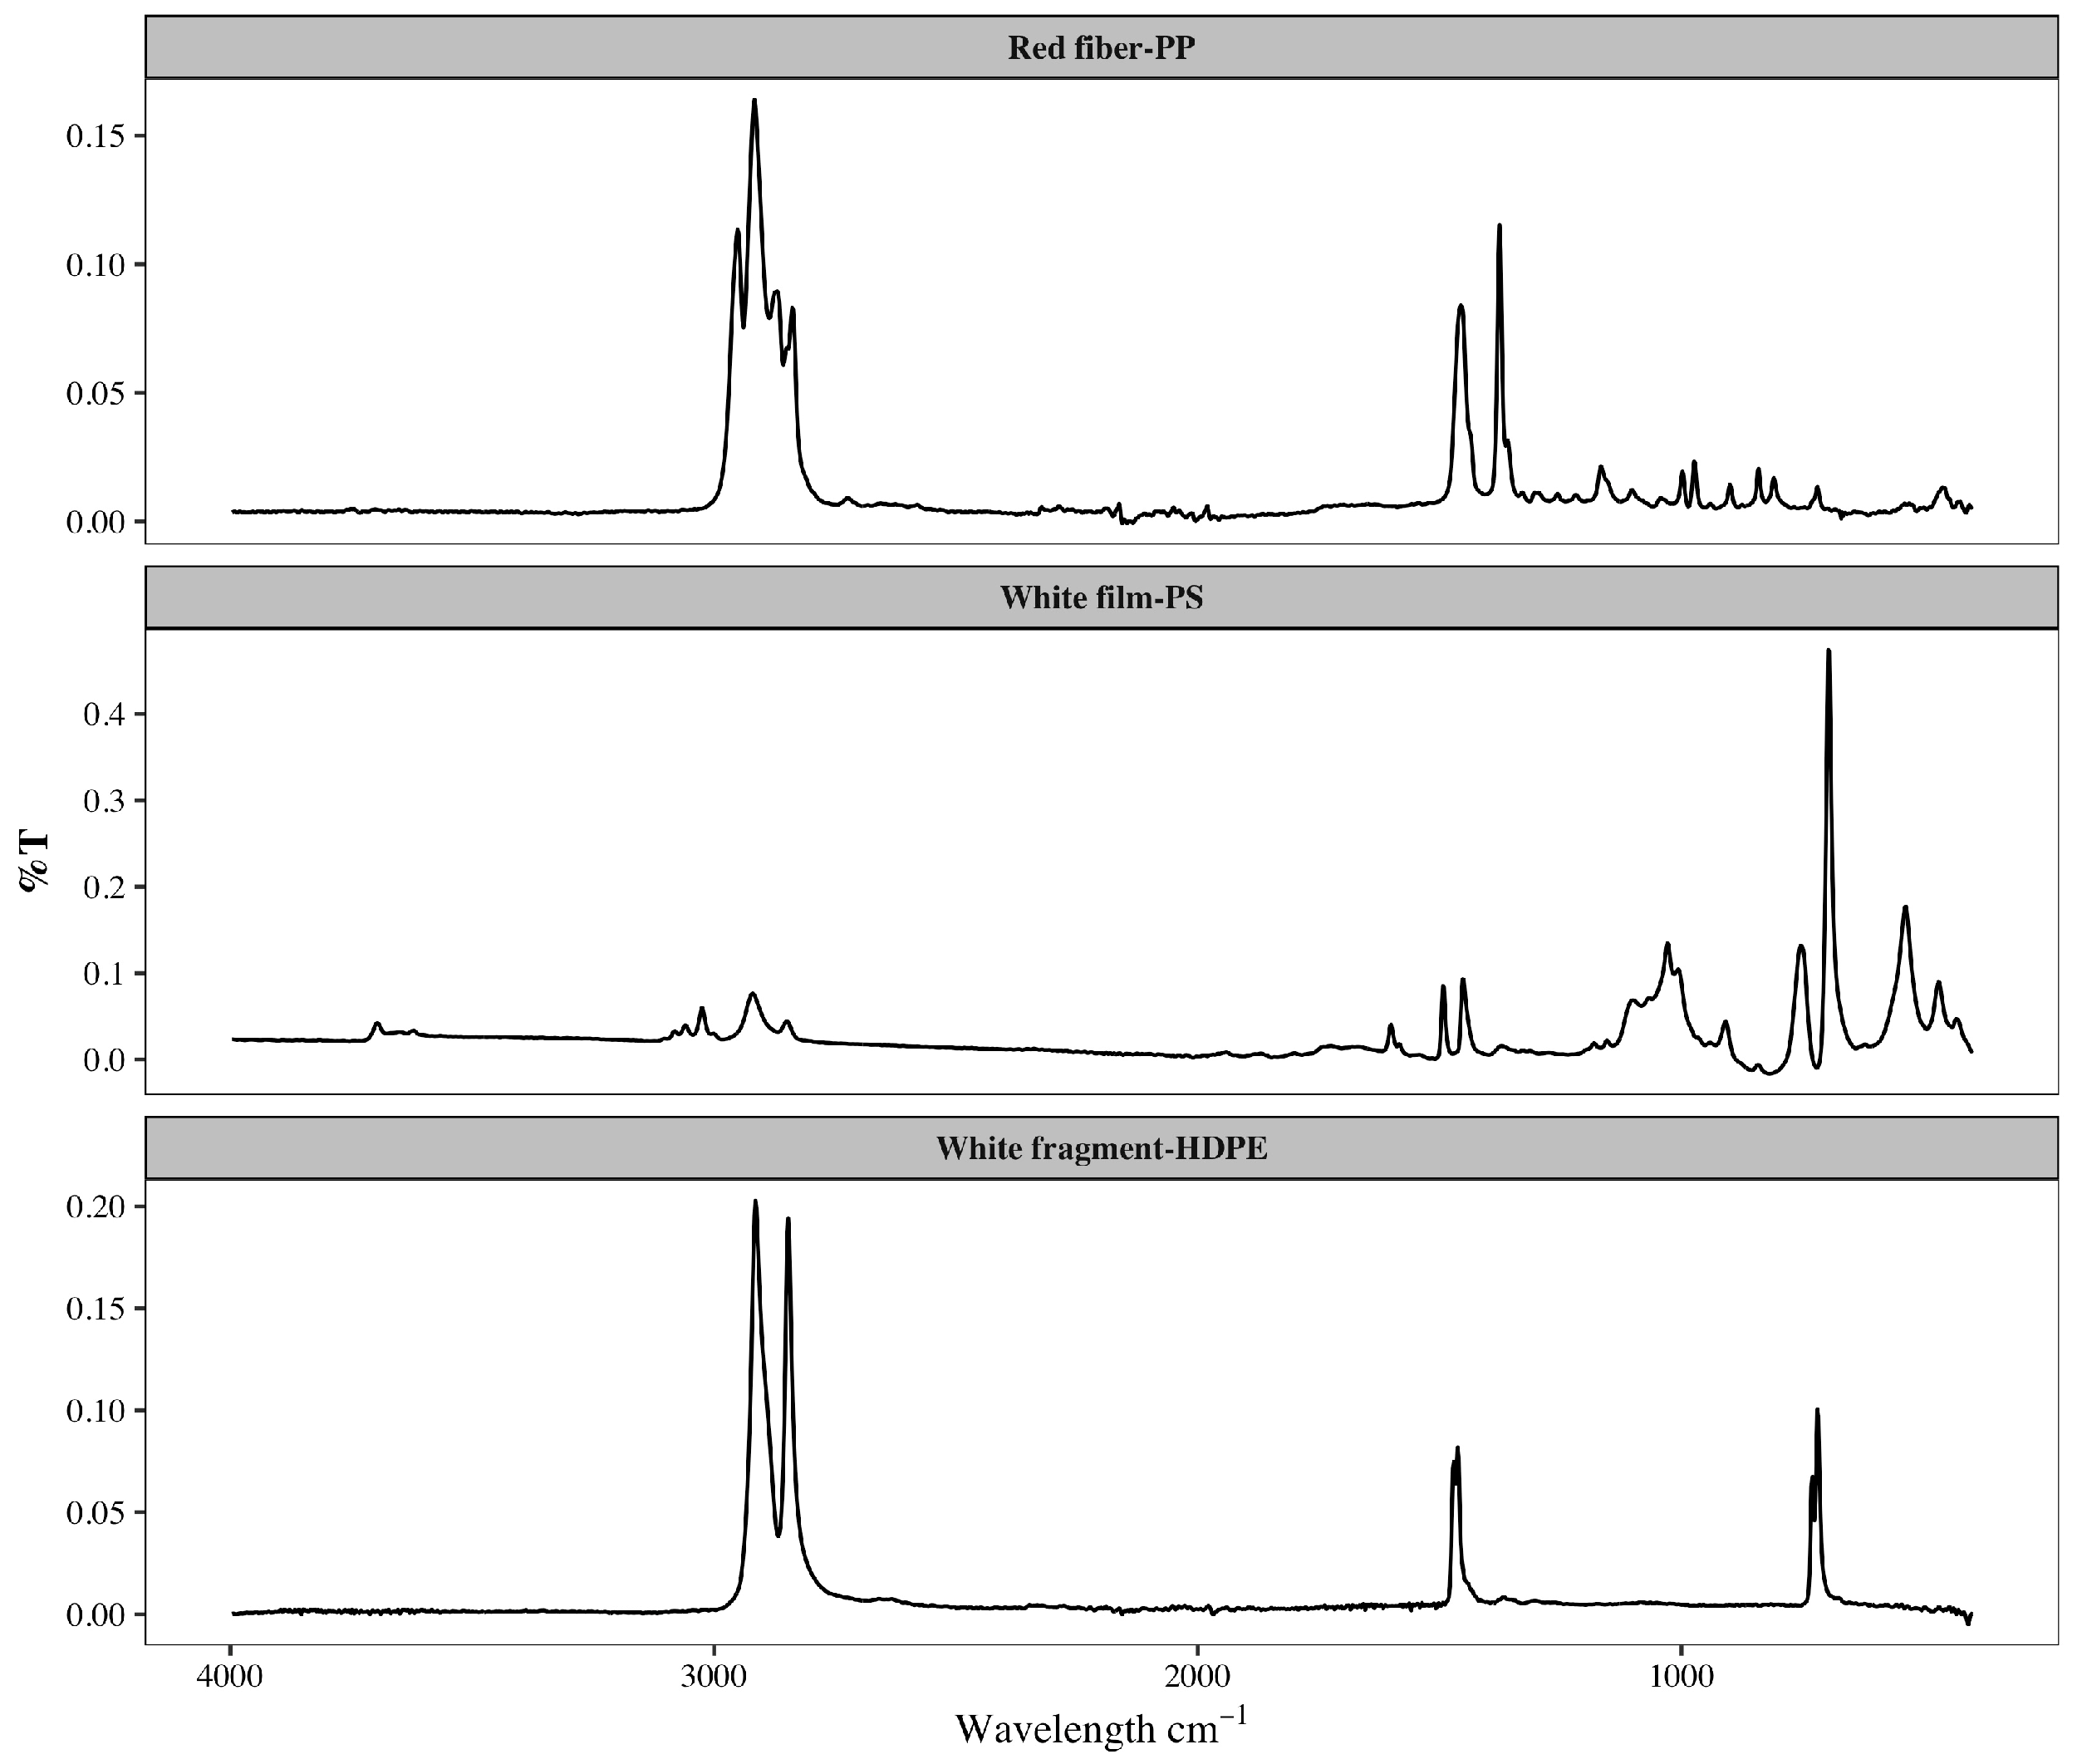
Only a total of 20 particles were recovered from surface water that were large enough to be characterized (>1 mm). The measured particles were confirmed to be polymers, with polystyrene being the most abundant one. Figure 6 shows the best spectral analysis results of three different polymer types with main spectral bands at the following wavelengths: polypropylene (PP-AB: 2950, 2915, 2838, 1455, 1377, 1166, 997, 972, 840, 808 cm−1), polystyrene (PS-AB: 3024, 2847, 1601, 1492, 1451, 1027, 694, 537 cm−1) and polyethylene (PE-AB: 2915, 2845, 1462, 730, 717 cm−1).
Figure 6.
Spectral analysis of MP particles > 1 mm recovered from surface water.
4. Discussion
4.1. Novelty Contribution of MPs in the Alhajuela Lake
MP research in Latin America remains heavily focused on marine environments, with freshwater studies representing a smaller—though rapidly growing—part of the literature [8,9,14]. Freshwater systems are critical sources of drinking water for rural communities, and contamination can directly threaten this essential resource [9]. In Panama, Alhajuela Lake plays a significant role in providing potable water for the population and maintaining the operation of the Panama Canal, one of the world’s most important commercial routes [10]. Although recent studies have documented marine MP pollution in Panamanian biota—for example, in Bocas del Toro [36] and on Pacific and Caribbean beaches [37]—monitoring in freshwater environments remains limited. Therefore, this multi-matrix, multi-season assessment offers valuable baseline data for inland freshwater systems in Panama.
4.2. Factors Affecting the Presence and Distribution of MPs in Alhajuela Lake
Consistent with regional and global freshwater studies, which refer to high MP concentration in surface water and sediments depending on lake characteristics, we found higher particle retention in surface water, which showed a tendency to decrease in water column and sediments (Figure 2), suggesting that MPs remain in shallow and surface water rather than in the Alhajuela lake system [38,39]. This might be explained by the natural characteristics of the lake, which gets shallow during the dry season, mainly driven by evaporation or long dry periods, and returns to its original depth during the rainy season [40]. The fact that floating particles of bigger sizes of 1–5 mm are rare might be explained through UV exposure in a shallow environment, elevated temperatures, and mechanical forces caused by current dynamics or human intervention [41]. Thus, these environmental or human factors increase MPs’ brittleness. Our findings show a wide variety of MP types, such as fibers, fragments, pellets, microspheres, and foam, particularly in the size range > 250 µm. Although recovered particles were counted and classified, it was not possible to identify their polymer due to equipment limitations.
During the rainy season, MP concentrations decreased markedly across all four sampling sites in the three matrices assessed. This reduction may occur because, once Alhajuela Lake returns to its normal depth, excess water is released to help fill Gatún Lake, which supplies water for running the Panama Canal locks. We hypothesize that a substantial portion of MPs are being transported along this hydrological pathway from Alhajuela Lake to Gatún Lake, through the Panama Canal, and, ultimately, into the ocean. Similar studies in tropical reservoirs and lakes report increased MP transport during wet seasons or high-flow periods, likely reflecting enhanced land-runoff and resuspension [9,39].
4.3. Occurrence of MPs Across Locations in Alhajuela Lake
As reported, surface water showed a total concentration of 759 ± 536 MPs/L and water column showed a total concentration of 328 ± 140 MPs/L. The reported concentrations of MPs in sediment were 109 ± 87 MPs/g for all four sites, with greater accumulation towards the shores and communities and less towards the center of the lake. The highest values were found in areas with greater human activity and confluence of tributaries. According to our results, and remaining consistent with other studies [42,43] in tropical lakes, the highest concentrations of MPs occurred during the dry season. The lake lowers its depth with a variation of 8–14 m seasonal or drought-related drawdowns [44,45]; therefore, the concentration of contaminants rises. As expected, the highest concentrations were observed at Tranquilla and Represa, both of which are located near the strangled confluence of water masses that gather at the dam during the dry season. The southern and western sectors of Lake Alhajuela are where most of the population is concentrated and where anthropogenic activities like fishing or tourism take place. Furthermore, the access roads and water supply infrastructure to Panama City are located there. The farther points, Boquerón C and Pequení D, receive less input than the communities settled around the central section of the lake, but contamination might originate at the main tributary, the dammed Chagres River, through the contribution of Indigenous and rural communities. Special attention has been given to sedimentation, a normal process in the lake, due to sediment supply from the rivers feeding the lake [45,46].
4.4. Context of MP Pollution in Alhajuela Lake
Populations have settled around the shoreline of the lake and in the watershed, exerting intense pressure on the ecological balance of the lake. The lake itself constitutes a sink for accumulation, and transportation means for MPs when the dam is opened to release water. During retention times in the dry season, heavy metals and other pollutants might adhere to plastic particles, increasing their toxicity [39].
Recent studies consistently report widespread MP contamination in lake systems across different climatic and land use contexts, with marked spatial variability and matrix-specific patterns. In a suburban lake–tributary system influenced by highway runoff, Velasquez et al. (2025) found MPs to be abundant in both surface waters and sediments, dominated by fibers and fragments as reported in this study [46]. Similarly, Duan et al. (2024) documented significant MP pollution in Lake Chenghai (southwestern China), with higher concentrations in sediments than in surface waters, indicating sedimentation as an important sink; fibers and fragments were the predominant shapes, largely composed of polyethylene and polypropylene [47]. However, this study found more MPs in surface water and the water column compared to sediments, which might be due to the characteristics of and human intervention in Alhajuela Lake during the dry season. These factors have also been reported in other studies, such as the one in Dianchi Lake, where strong spatial heterogeneity in MP distribution was reported, driven by hydrodynamics, inflowing rivers, urbanization intensity, and lake morphology, with elevated concentrations near river mouths and densely populated areas [48,49]. Expanding beyond single matrices, Wang et al. (2025) showed that MPs migrate across interconnected environmental compartments in the Caohai watershed, accumulating in sediments and soils, which ultimately might represent an ecological risk through uptake by aquatic organisms [50]. Finally, Prikler et al. (2024) also reported pronounced spatial variability, with higher MP loads in sediments and wetland-protected areas, showing the role of low hydrodynamic energy zones in MP retention [51]. Altogether, these studies emphasize sediments as major accumulation reservoirs for MPs and demonstrate that spatial patterns in lakes are strongly controlled by anthropogenic inputs, hydrological connectivity, and physical transport processes. Similar factors might be contributing to the spatial distribution of MPs across matrices, but further studies will be needed to understand how MPs settle down and resuspend either by environmental forces or human interventions in the Alhajuela Lake.
4.5. Limitations and Advantages of the Study
Although sampling techniques for MPs in sediments have been widely discussed, there is currently no standardization regarding sediment subsample size. Devices such as Van Veen dredge and box corers [52] are commonly used to collect submersal sediments in lakes and rivers. Subsampling is required for laboratory analyses where sieving can be achieved as low as 63 µm for water and 100 µm for sediments [52]. In addition, small sediment subsamples allow for increased replication and the generation of seasonal datasets. This can be advantageous for monitoring programs focused on superficial water and sediments. Small subsamples of both water and sediments also improve efficiency in terms of processing time and analytical repeatability [53]. However, despite these advantages, the analysis of very small sediment masses (e.g., 3 g) might not adequately capture the heterogeneous distribution of MPs in lake sediments and, therefore, might underestimate the true extent of MP contamination. Thus, further studies are needed to explore the variability of MP quantification within and between sediment samples, as well as across sampling events.
5. Conclusions
MP concentrations in surface water, water column, and sediments were quantified across four locations and three seasons in Alhajuela Lake. This study reports, for the first time, the occurrence, distribution, and types of MPs in all three environmental matrices of the lake. MPs were consistently detected in surface water, the water column, and sediments, with fragments and fibers being the dominant morphotypes. MPs’ average concentrations were higher during the dry season compared to the transition and rainy season. Although only a limited number of particles were subjected to polymer identification (>250 µm), the polymers identified provide valuable preliminary evidence of the presence of specific plastic types in Alhajuela Lake. However, further studies are required to comprehensively characterize MP polymer composition. In addition, expanded spatial coverage, including additional sampling sites and detailed mapping of pollution hotspots, input sources, and transport pathways, is essential. Establishing a long-term monitoring program will be critical to ensure drinking water safety, safeguard Panama Canal operations, and protect the lake’s aquatic biodiversity.
Author Contributions
Conceptualization, D.M.D.B. and C.M.-O.; methodology, D.M.D.B.; software, C.M.-O.; validation, D.M.D.B., C.M.-O. and A.G.; formal analysis, D.M.D.B.; investigation, D.M.D.B., A.G. and D.V.; data curation, A.G. and D.V.; writing—original draft preparation, D.M.D.B. and C.M.-O.; writing—review and editing, D.M.D.B. and C.M.-O.; visualization, A.G. and D.V.; project administration, D.M.D.B.; funding acquisition, D.M.D.B. All authors have read and agreed to the published version of the manuscript.
Funding
This research was funded by Secretaria Nacional de Ciencia, Tecnologia e Innovacion-SENACYT, and Sistema Nacional de Investigación-SNI, grant number FID23-029, and the APC was funded by Secretaria Nacional de Ciencia, Tecnologia e Innovacion-SENACYT.
Institutional Review Board Statement
Not applicable.
Data Availability Statement
The raw data supporting the conclusions of this article will be made available by the authors on request.
Acknowledgments
We are grateful to the anonymous reviewers for their valuable comments and to the editors for their rigorous revisions, both of which contributed to improving this article.
Conflicts of Interest
The authors declare no conflicts of interest. The funders had no role in the design of the study; in the collection, analyses, or interpretation of data; in the writing of the manuscript; or in the decision to publish the results.
Abbreviations
| MPs | Microplastics |
| FTIR–ATR | Fourier Transform Infrared–Attenuated Total Reflectance |
| RS | Rainy Season |
| TS | Transition Season |
| DS | Dry Season |
| ACP | Panama Canal Authority |
References
- Siwach, S.; Bharti, M.; Yadav, S.; Dolkar, P.; Modeel, S.; Yadav, P.; Negi, T.; Negi, R.K. Unveiling the ecotoxicological impact of microplastics on organisms—The persistent organic pollutant (POP): A comprehensive review. J. Contam. Hydrol. 2024, 266, 104397. [Google Scholar] [CrossRef] [Scilit]
- Jambeck, J.R.; Geyer, R.; Wilcox, C.; Siegler, T.R.; Perryman, M.; Andrady, A.; Narayan, R.; Law, K.L. Plastic waste inputs from land into the ocean. Science 2015, 347, 768–771. [Google Scholar] [CrossRef] [Scilit] [PubMed]
- Thompson, R.C.; Olsen, Y.; Mitchell, R.P.; Davis, A.; Rowland, S.J.; John, A.W.G.; McGonigle, D.; Russell, A.E. Lost at Sea: Where Is All the Plastic? Science 2004, 304, 838. [Google Scholar] [CrossRef] [Scilit] [PubMed]
- Cole, M.; Lindeque, P.; Halsband, C.; Galloway, T.S. Microplastics as contaminants in the marine environment: A review. Mar. Pollut. Bull. 2011, 62, 2588–2597. [Google Scholar] [CrossRef] [Scilit]
- Hassen, M.B.; Zouari, A.B.; Abdennadher, M.; Assaf, J.-C.; Nakad, M.; Abboud, R.; Khammeri, Y.; Banni, M.; Panzeri, A.; Gomes, L.; et al. Plastics pollution: Pathways, impacts, and regulatory challenges in marine environments. Front. Environ. Sci. 2025, 13, 1635230. [Google Scholar] [CrossRef] [Scilit]
- Andrady, A. Microplastics in marine environments. Mar. Pollut. Bull. 2011, 62, 1596–1605. [Google Scholar] [CrossRef] [Scilit]
- Fernandes, A.; Bertoldi, C.; Lara, L.; Stival, J.; Alves, N.; Cabrera, P.; Grassi, M. Microplastics in Latin America Ecosystems: A Critical Review of the Current Stage and Research Needs. J. Braz. Chem. Soc. 2022, 33, 303–326. [Google Scholar] [CrossRef] [Scilit]
- Orona-Návar, C.; García-Morales, R.; Loge, F.J.; Mahlknecht, J.; Aguilar-Hernández, I.; Ornelas-Soto, N. Microplastics in Latin America and the Caribbean: A review on current status and perspectives. J. Environ. Manag. 2022, 309, 114698. [Google Scholar] [CrossRef] [Scilit]
- Jiménez-Contreras, J.; Fernández-Medina, R.I.; Fernández-Araiza, M.A. Microplastics pollution in tropical lakes: Water, zooplankton, and fish in Central Mexico. Environ. Monit. Assess. 2024, 196, 813. [Google Scholar] [CrossRef] [Scilit]
- Autoridad del Canal de Panamá. Beyond Scarcity: How the Canal Manages the Fresh Water Challenge. Available online: https://pancanal.com/en/how-the-canal-manages-the-fresh-water-challenge/ (accessed on 8 January 2026).
- Bhowmik, A.; Saha, G. Microplastics in Our Waters: Insights from a Configurative Systematic Review of Water Bodies and Drinking Water Sources. Microplastics 2025, 4, 24. [Google Scholar] [CrossRef] [Scilit]
- Mahidev, R.; Aravind, G.; Sandeep, K.; Arya, S.; Santosh, M.; Shaji, E. Microplastics in freshwater lakes: A case study from Southern India. Geosyst. Geoenviron. 2024, 3, 100306. [Google Scholar] [CrossRef] [Scilit]
- D’avignon, G.; Gregory-Eaves, I.; Ricciardi, A. Microplastics in lakes and rivers: An issue of emerging significance to limnology. Environ. Rev. 2022, 30, 228–244. [Google Scholar] [CrossRef] [Scilit]
- Bexeitova, K.; Baimenov, A.; Varol, E.; Kudaibergenov, K.; Zhantikeyev, U.; Sailaukhanuly, Y.; Toshtay, K.; Tauanov, Z.; Azat, S.; Berndtsson, R. Microplastics in freshwater systems: A review of classification, sources, and environmental impacts. Chem. Eng. J. Adv. 2024, 20, 100649. [Google Scholar] [CrossRef] [Scilit]
- Teuten, E.L.; Saquing, J.M.; Knappe, D.R.; Barlaz, M.A.; Jonsson, S.; Björn, A.; Rowland, S.J.; Thompson, R.C.; Galloway, T.S.; Yamashita, R.; et al. Transport and release of chemicals from plastics to the environment and to wildlife. Philos. Trans. R. Soc. B Biol. Sci. 2009, 364, 2027–2045. [Google Scholar] [CrossRef] [Scilit] [PubMed]
- Pan, T.; Liao, H.; Yang, F.; Sun, F.; Guo, Y.; Yang, H.; Feng, D.; Zhou, X.; Wang, Q. Review of microplastics in lakes: Sources, distribution characteristics, and environmental effects. Carbon Res. 2023, 2, 25. [Google Scholar] [CrossRef] [Scilit]
- Eriksen, M.; Mason, S.; Wilson, S.; Box, C.; Zellers, A.; Edwards, W.; Farley, H.; Amato, S. Microplastic pollution in the surface waters of the Laurentian Great Lakes. Mar. Pollut. Bull. 2013, 77, 177–182. [Google Scholar] [CrossRef] [Scilit]
- Yang, S.; Zhou, M.; Chen, X.; Hu, L.; Xu, Y.; Fu, W.; Li, C. A comparative review of microplastics in lake systems from different countries and regions. Chemosphere 2022, 286, 131806. [Google Scholar] [CrossRef] [Scilit]
- Abdipour, H.; Asgari, G.; Shokoohi, R. A review of microplastics pollution in dams globally: Consequences and future outlook. J. Contam. Hydrol. 2025, 276, 104730. [Google Scholar] [CrossRef] [Scilit]
- Watkins, L.; McGrattan, S.; Sullivan, P.J.; Walter, M.T. The effect of dams on river transport of microplastic pollution. Sci. Total. Environ. 2019, 664, 834–840. [Google Scholar] [CrossRef] [Scilit]
- ACP. Plan Maestro de la Cuenca Hidrográfica del Canal de Panamá. 2006. Available online: https://pancanal.com/wp-content/uploads/2024/04/Plan-maestro-acp.pdf (accessed on 8 January 2026).
- Gutiérrez, R.; González, A. Estudio Limnológico del Lago Alajuela; Instituto de Recursos Naturales Renovables (INRENARE): Panamá City, Panama, 1995.
- Embalse Lago Alajuela. ARAP. 2024. Available online: https://arap.gob.pa/wp-content/uploads/2024/08/Embalse-Lago-Alajuela.pdf (accessed on 19 January 2026).
- Zipperer, W.C.; Northrop, R.; Andreu, M. Urban Development and Environmental Degradation. In Oxford Research Encyclopedia of Environmental Science; Shugart, H., Ed.; Oxford University Press: New York, NY, USA, 2020. [Google Scholar] [CrossRef] [Scilit]
- Dale, V.H.; Brown, S.; Calderón, M.O.; Montoya, A.S.; Martínez, R.E. Projected Land-Use Change for the Eastern Panama Canal Watershed and Its Potential Impact. Río Chagres Panama 2005, 337–345, 52. [Google Scholar] [CrossRef] [Scilit]
- Rodriguez, L.G.; McCallum, A.; Kent, D.; Rathnayaka, C.; Fairweather, H. A review of sedimentation rates in freshwater reservoirs: Recent changes and causative factors. Aquat. Sci. 2023, 85, 60. [Google Scholar] [CrossRef] [Scilit]
- Autoridad del Canal de Panama. Informe de Calidad del agua del Sistema Hídrico del Canal de Panamá. Available online: https://pancanal.com/wp-content/uploads/2021/09/INFORME-CALIDAD-DE-AGUA-2021-1.pdf (accessed on 31 January 2026).
- Mendoza, P.A.C.; Pérez, R.L.R.; Pinto, S. Caracterización sociológica de los pescadores en Panamá. Cienc. Soc. 2024, 49, 163–180. [Google Scholar] [CrossRef] [Scilit]
- Ministerio de Ambiente. Informe de la Calidad del agua en las Cuencas Hidrograficas de Panama. 2009–2012. 2019. Available online: https://sinia.gob.pa/informe-de-monitoreo-de-la-calidad-del-agua-2009-2012/ (accessed on 12 December 2025).
- Cole, M.; Webb, H.; Lindeque, P.K.; Fileman, E.S.; Halsband, C.; Galloway, T.S. Isolation of microplastics in biota-rich seawater samples and marine organisms. Sci. Rep. 2015, 4, 4528. [Google Scholar] [CrossRef] [Scilit]
- Lavoy, M.; Crossman, J. A novel method for organic matter removal from samples containing microplastics. Environ. Pollut. 2021, 286, 117357. [Google Scholar] [CrossRef] [Scilit]
- Maes, T.; Jessop, R.; Wellner, N.; Haupt, K.; Mayes, A.G. A rapid-screening approach to detect and quantify microplastics based on fluorescent tagging with Nile Red. Sci. Rep. 2017, 7, srep44501. [Google Scholar] [CrossRef] [Scilit]
- Bakir, A.; Desender, M.; Wilkinson, T.; Van Hoytema, N.; Amos, R.; Airahui, S.; Graham, J.; Maes, T. Occurrence and abundance of meso and microplastics in sediment, surface waters, and marine biota from the South Pacific region. Mar. Pollut. Bull. 2020, 160, 111572. [Google Scholar] [CrossRef] [Scilit] [PubMed]
- GESAMP. Guidelines for the Monitoring and Assessment of Plastic Litter in the Ocean by Joint Group of Experts on the Scientific Aspects of Marine Environmental Protection. Published by United Nations Environment Programme (UNEP). 2019. ISSN: 1020-4873. Available online: https://www.gesamp.org/publications/guidelines-for-the-monitoring-and-assessment-of-plastic-litter-in-the-ocean (accessed on 12 December 2025).
- Posit Team. RStudio: Integrated Development Environment for R; Posit Software; PBC: Boston, MA, USA, 2025; Available online: https://www.posit.co/ (accessed on 12 December 2025).
- Fallon, B.R.; Freeman, C.J. Plastics in Porifera: The occurrence of potential microplastics in marine sponges and seawater from Bocas del Toro, Panamá. PeerJ 2021, 9, e11638. [Google Scholar] [CrossRef] [Scilit]
- de Borrero, D.D.; Duque, J.F.; Olmos, J.; Garcés-Ordóñez, O.; Amaral, S.S.G.D.; Vezzone, M.; Felizardo, J.P.d.S.; dos Anjos, R.M. Distribution of Plastic Debris in the Pacific and Caribbean Beaches of Panama. Air Soil Water Res. 2020, 13, 1–8. [Google Scholar] [CrossRef] [Scilit]
- Liu, Y.; Cao, W.; Hu, Y.; Zhang, J.; Shen, W. Horizontal and vertical distribution of microplastics in dam reservoir after impoundment. Sci. Total. Environ. 2022, 832, 154962. [Google Scholar] [CrossRef] [Scilit] [PubMed]
- Granados-Sánchez, R.R.; Sedeño-Díaz, J.E.; López-López, E. Microplastic pollution and associated trace metals in freshwater ecosystems within protected natural areas: The case of a biosphere reserve in Mexico. Front. Environ. Sci. 2024, 12, 1441340. [Google Scholar] [CrossRef] [Scilit]
- Available online: https://www.prensa.com/sociedad/los-bajos-niveles-que-presenta-el-lago-alajuela-afectan-suministro-de-agua-en-la-capital/ (accessed on 27 March 2026).
- Lin, Z.; Jin, T.; Zou, T.; Xu, L.; Xi, B.; Xu, D.; He, J.; Xiong, L.; Tang, C.; Peng, J.; et al. Current progress on plastic/microplastic degradation: Fact influences and mechanism. Environ. Pollut. 2022, 304, 119159. [Google Scholar] [CrossRef] [Scilit]
- Gerolin, C.R.; Zornio, B.; Pataro, L.F.; Labuto, G.; Semensatto, D. Microplastic pollution responses to spatial and seasonal variations and water level management in a polymictic tropical reservoir (São Paulo, Brazil). Environ. Sci. Pollut. Res. 2024, 31, 42388–42405. [Google Scholar] [CrossRef] [Scilit]
- Jin, X.; Li, Z.; Peñuelas, J.; Sardan, J.; Wu, Q.; Peng, Y.; Heděnec, P.; Li, Z.; Yuan, C.; Yuan, J.; et al. Quantitative assessment on the distribution patterns of microplastics in global inland waters. Commun. Earth Environ. 2025, 6, 331. [Google Scholar] [CrossRef] [Scilit]
- Alhajuela Reservoir Water Levels. Available online: https://panama.aquaticinformatics.net/Data/Chart/ChartId/6/Interval/Latest (accessed on 27 March 2026).
- Leiser, R.; Schumann, M.; Dadi, T.; Wendt-Potthoff, K. Burial of microplastics in freshwater sediments facilitated by iron-organo flocs. Sci. Rep. 2021, 11, 24072. [Google Scholar] [CrossRef] [Scilit] [PubMed]
- Velasquez, P.M.; Green, L.; Scott, J.; Steinman, A.D. Characterization of Microplastics and 6-PPD Quinone in a Suburban Lake–Tributary System Impacted by Highway Runoff. Microplastics 2025, 4, 91. [Google Scholar] [CrossRef] [Scilit]
- Duan, L.; Luo, L.; Zhang, L.; Li, D.; Li, H.; Xu, T.; Xu, J.; Zhang, H. The Occurrence of Microplastics Pollution in the Surface Water and Sediment of Lake Chenghai in Southwestern China. Water 2024, 16, 2672. [Google Scholar] [CrossRef] [Scilit]
- Deng, C.; Huang, Y.; Hu, Y.; Zhang, Q.; Zhao, H. Factors Influencing the Spatial Distribution of Microplastics in Lakes with the Example of Dianchi Lake. Water 2025, 17, 2377. [Google Scholar] [CrossRef] [Scilit]
- Ji, J.; Huang, J.; Chen, M.; Jin, H.; Wang, X.; Wu, Y.; Qian, X.; Ma, H.; Xu, J. Spatiotemporal Patterns, Characteristics, and Ecological Risk of Microplastics in the Surface Waters of Shijiu Lake (Nanjing, China). Water 2025, 17, 3224. [Google Scholar] [CrossRef] [Scilit]
- Wang, X.; Wu, X.; Wang, X.; Xia, P.; Zhang, L.; Huang, X.; Zhang, Z. The migration and pollution risk of microplastics in water, soil, sediments, and aquatic organisms in the Caohai watershed, Southwest China. Water 2025, 17, 1168. [Google Scholar] [CrossRef] [Scilit]
- Prikler, B.; Svigruha, R.; Háhn, J.; Harkai, P.; Fodor, I.; Kaszab, E.; Kriszt, B.; Tóth, G.; Szabó, I.; Csenki, Z.; et al. Spatial Variations in Microplastics in the Largest Shallow Lake of Central Europe and Its Protecting Wetland Area. Water 2024, 16, 1014. [Google Scholar] [CrossRef] [Scilit]
- Frias, J.; Pagter, E.; Nash, R.; O’Connor, I.; Carretero, O.; Filgueiras, A.; Viñas, L.; Gago, J.; Antunes, J.; Bessa, F.; et al. Standardised Protocol for Monitoring Microplastics in Sediments; JPI-Oceans BASEMAN Project; JPI-Oceans: Bruxelles, Belgium, 2018; Volume 33. [Google Scholar]
- Yang, L.; Zhang, Y.; Kang, S.; Wang, Z.; Wu, C. Microplastics in freshwater sediment: A review on methods, occurrence, and sources. Sci. Total. Environ. 2021, 754, 141948. [Google Scholar] [CrossRef] [Scilit] [PubMed]

Disclaimer/Publisher’s Note: The statements, opinions and data contained in all publications are solely those of the individual author(s) and contributor(s) and not of MDPI and/or the editor(s). MDPI and/or the editor(s) disclaim responsibility for any injury to people or property resulting from any ideas, methods, instructions or products referred to in the content. |
© 2026 by the authors. Licensee MDPI, Basel, Switzerland. This article is an open access article distributed under the terms and conditions of the Creative Commons Attribution (CC BY) license.