


Abstract
The growth of cloud services and immersive applications based on extended reality (XR), including Augmented Reality (AR), Virtual Reality (VR), and Mixed Reality (MR), imposes increasingly demanding requirements on access networks. The large-scale integration of IoT devices in smart buildings further increases the need for high throughput, low latency and jitter, and reliable connectivity. Traditional Fiber-to-the-Home (FTTH) networks with a single access point (AP) become quite limiting when there are high performance requirements, with many users with indoor mobility and high device density. Fiber-to-the-Room (FTTR) is an extension of FTTH, which brings fiber optics to each room of the house through a Main FTTR Unit (MFU) and several Sub FTTR Units (SFU) along with the APs, with centralized device management. Green FTTR networks are characterized by their energy efficiency through centralized control of signal power and Dynamic Bandwidth Allocation (DBA) management. The fgONT architecture allows for deterministic network slicing, enabling the allocation of specific resources isolated from the rest of the network traffic, allowing for predictable bandwidth and QoS. This work presents a framework that allows for a comparative analysis of FTTR and FTTH networks in different scenarios in order to ensure a compromise between transmission quality, network energy efficiency, and the user’s perceived experience. The results obtained show that, in high device density scenarios, FTTR reduces the average packet loss from 52.69% to less than 0.08%, decreases the average latency from 151 ms to less than 2 ms, and maintains the overall QoE above 0.974, compared to 0.27 in FTTH with a single AP.
1. Introduction
Smart buildings support complex digital ecosystems, enabling the integration of a high density of IoT devices [1], such as sensors, actuators, automation systems, and centralized building management platforms [2]. In this context, Building Automation and Control Systems (BACS) [3] and Building Energy Management Systems (BEMS) [4] support the integrated monitoring, control, and automation of building systems, including energy optimization through renewable-source integration and efficient management strategies, while contributing to increased user comfort [5].
The evolution of smart buildings aligns with the Energy Performance of Buildings Directive (EPBD), updated in 2024 [6], which defines requirements for improving the energy performance of buildings and integration of smart technologies, as well as the Smart Readiness Indicator (SRI), which assesses the ability of buildings to use technologies to optimize their energy performance [7]. This objective is particularly relevant because buildings are responsible for approximately 40% of global energy consumption and 36% of greenhouse gas emissions [8].
Wireless Sensor Network (WSN) [9,10] enables real-time collection of metrics associated with environmental parameters, occupancy profiles, and energy consumption. Increasing device density and application requirements [11] requires high-performance communication infrastructures. FTTR networks emerge as a promising solution, extending the optical network to the interior of each room in the house [12], guaranteeing high bandwidth and great scalability for the integration of new digital services.
The increase in the number of users for immersive services [13] imposes greater demands on throughput, latency, jitter, and reliability [14]. These parameters directly influence the user-perceived quality of experience, particularly in scenarios with a high density of devices and users. Thus, we must converge towards deterministic communication models [15,16], as these guarantee performance predictability and resource isolation. In this context, network slicing [17] is characterized by the creation of virtual networks adapted to different service requirements.
The Fifth Generation Fixed Network (F5G) paradigm [18] supports the evolution of FTTR by promoting high-performance, full-fiber fixed networks [19]. Its end-to-end (E2E) communications [20] help eliminate network bottleneck situations throughout the network. The integration of IoT devices in smart buildings also raises security, privacy, and legal-liability challenges [21]. The absence of standardized international norms from regulatory bodies leads to normative fragmentation, with different approaches among manufacturers, regulatory bodies, and operators [22]. With this lack of standardization, attacks increase significantly, making devices more vulnerable and posing serious risks to critical services, including systems such as threats from botnets [23] and distributed denial-of-service attacks such as Distributed Denial of Service (DDoS) [24].
The use of intelligent management mechanisms in smart buildings allows for greater efficiency in network management and, on the other hand, allows for the dynamic adaptation of resources to usage profiles. These mechanisms in FTTR networks allow for dynamic bandwidth allocation using DBA [25], signal spectrum management [26], and optimization of active equipment power, reducing energy consumption without compromising network performance.
Despite the growing evolution of fiber optic networks in smart buildings, there are significant gaps in comparative analyses of communication network solutions in buildings. Studies that have compared FTTH network architectures with AP and FTTR simultaneously and that relate network performance metrics, energy efficiency, and the quality of experience perceived by the user are still quite limited. Another shortcoming is the fact that each dimension is analyzed in isolation. Furthermore, the studies did not consider high-density user scenarios with different types of IoT devices nor applications requiring high bandwidth and roaming between rooms. The absence of integrated and reproducible frameworks that allow for a direct comparison between architectures for different scenarios was also a noteworthy fact, making it relevant for a comparative and critical analysis.
This work proposes the development of a simulation framework for the comparative evaluation between FTTH with AP and FTTR, taking into account a progressive increase in the number of users and devices with different traffic profiles. The main objective is to analyze both architectures in terms of their network performance, the quality of experience perceived by the user, energy efficiency, and continuity of service between the building’s rooms.
This study aims to identify the most suitable solutions for different building, user, and service scenarios, aligned with the principles of F5G.
With the aim of structuring the proposed analysis, the following scientific questions are defined:
- RQ1: How to compare FTTH architectures with AP and FTTR in terms of network performance metrics (throughput, latency, jitter, and reliability) in high-density user and device scenarios?
- RQ2: What are the energy consumptions in both architectures for the different scenarios?
- RQ3: Which performance, energy efficiency, QoS, and QoE metrics should be integrated into a simulation framework for a comparative analysis between architectures?
The work is structured in five sections: after introducing the topic of FTTR and energy efficiency in increasingly complex communication systems, Section 2 presents a review of the topic of Green FTTR. Section 3 explores the methods used for developing the framework, taking into account different factors that contribute to variations in the defined metrics. Section 4 discusses the results obtained, implications, challenges, and limitations identified. Section 5 presents the main conclusions and proposals for future work.
2. The Literature Review
2.1. F5G
Broadband networks have progressively transitioned from copper pair networks to fiber optic networks, responding to the growth of new devices and new digital services with increasingly higher bandwidth requirements. With the introduction of immersive applications together with cloud services and streaming with ever greater definition, the need to use high-capacity architectures with low latency and greater reliability is reinforced [14]. The Fiber to the Everywhere and Everything (FTTE) vision gains special relevance, extending fiber optics to different network segments and multiple usage scenarios, including homes, smart buildings, campuses, industrial environments, and smart cities [27].
Fixed networks have not defined generations of technology in a consolidated way, as occurs in mobile networks, where technologies such as 5G and Wi-Fi 7 are defined by different standardization bodies, called Standards Development Organizations (SDOs) [13]. In the case of the Fifth Generation Fixed Network (F5G), which was proposed by the Industry Specification Group F5G of the European Telecommunications Standards Institute (ETSI), it defined the various axes necessary for a fixed optical network [12], with full-fiber connectivity, gigabit services, and a reliable experience. In this way, it allowed the acceleration of FTTR networks and a scalable integration of IoT devices in smart buildings [19].
The three fundamental pillars of F5G are: enhanced Fixed Broadband (eFBB), Full-Fiber Connection (FFC), and Guaranteed Reliable Experience (GRE) as shown in Figure 1 [28]. These three axes allow defining the evolution of fixed networks based on increased capacity, expansion of fiber optic connectivity, and guaranteeing a reliable and predictable experience.
Figure 1.
Fundamental pillars of F5G. Reprinted with permission from [29]. Copyright [2026] [ETSI (European Telecommunication Standards Institute)].
The evolution of fixed networks does not end with F5G. The transition to F5G-A corresponds to an extension of the three initial axes of F5G, reinforcing eFBB, FFC, and GRE with greater capacity, higher density, and lower latency. F5G-A introduces two new axes: Green Agile Optical (GAO) and the real-time visualization and sensing mechanism [30]. In the future, F6G will expand this evolution with a more comprehensive number of dimensions, associated with AI-native optical networks, integration between communication and sensing, extreme capacity, ultra-low latency, massive connectivity, and sustainable full-fiber infrastructures [18]. Figure 2 summarizes this transition with its respective axes.
Figure 2.
Evolution of generations of fixed networks.
The eFBB pillar is associated with transmission capacity, requiring the availability of gigabit-order rates, typically exceeding 1 Gbps per user, supported by the evolution of PON technologies, including the transition from GPON to 10G-PON and, subsequently, to higher-capacity technologies such as 50G-PON [31,32]. Thus, the services that most need high bandwidth are immersive services, cloud applications, and collaborative digital environments [33].
The FFC pillar corresponds to fiber optic networks, enabling full-fiber connectivity throughout the network and within buildings. In this context, FTTR can be understood as an evolution of FTTH, since it extends the fiber optic cable from the entrance of the house or building to each room. By using FTTR networks, it is possible to reduce dependence on a single access point, generate wireless coverage inside the building, and improve connection stability in scenarios with high user density, mobility between rooms, and a large number of IoT devices. To guarantee deterministic full-fiber services with very low latency, high reliability, and assured quality throughout the network, architectures such as the Deterministic Full-Fiber Service Network (D-FSN) [14] emerge, which require fixed optical networks with predictable and controlled performance. This dimension brings F5G closer to an E2E communication logic [34].
The GRE pillar is associated with guaranteeing a reliable experience, with high availability, low latency, greater performance predictability, and assured QoS. This reliability is associated with high levels of availability, with five nines, i.e., 99.999%, as well as deterministic latency and guaranteed quality of service [20]. GRE is extremely relevant in applications that are very sensitive to delay and temporal variation in the network, such as immersive services, cloud gaming, video conferencing, e-health, and critical systems in smart buildings. In this way, GRE is directly connected to QoS and QoE, since the experience perceived by the user depends not only on the available transfer rate but also on link stability, latency, jitter, reliability, and continuity of service [35].
Network slicing is the mechanism that supports services with distinct requirements and isolated resources. Using logical network slices, it is possible to isolate resources and allocate resources to different service profiles, such as IoT services that require low bandwidth but high reliability, on the other hand, immersive applications with low latency and high throughput [17]. Thus, F5G should not be seen as a simple evolution of bandwidth but as a paradigm oriented towards dense optical communications, predictable performance, reliability, energy efficiency, and improved user experience [28].
In the context of smart buildings, F5G allows defining the technological resources needed to guarantee communications in buildings with a high number of IoT devices, building automation systems, and energy management platforms. The connection with FTTR is very relevant, as it allows transporting full-fiber logic to each room in the building, allowing the optical network to be closer to users, sensors, actuators, and access points.
2.2. FTTR
FTTR architecture corresponds to the extension of the FTTH network, allowing for full-fiber data transmission within buildings [33]. If FTTH allowed for very high-capacity fixed networks (VHCNs) between operators and buildings entirely in fiber optics, in the case of FTTR it allows extending fiber optics ever closer to the user, overcoming a physical barrier in many residential, business, and smart building scenarios.
Since the FTTH network only reaches the building entrance, and network distribution inside is done by an Optical Network Terminal (ONT) with a residential router or through a single Wi-Fi AP, this limitation becomes more evident in scenarios with multiple rooms, multiple floors, a high number of devices, internal user mobility, and latency-sensitive applications. Although the access network allows high throughput rates up to the building entrance, the final experience perceived by the user depends on the wireless coverage inside the building, the location of the AP, and attenuation due to walls and obstacles. It is also necessary to take into account the interference caused by adjacent Wi-Fi networks and by having a high concentration of devices at a single access point [36]. The evolution from FTTH to FTTR should not be interpreted only as an increase in capacity but as a reorganization of network coverage distribution in the indoor domain.
The analysis of the FTTR architecture can be analyzed in different dimensions: FTTR as an extension of FTTH and PON technology; MFU/SFU architecture and the coordination of various Wi-Fi devices; centralized management mechanisms at the energy efficiency level and support for immersive XR-based services. However, these dimensions are analyzed in isolation.
2.2.1. The Evolution from FTTH to FTTR Architecture
FTTH networks are the main infrastructure for fixed access networks in countries that have adopted strategies to migrate legacy copper pair networks to fiber optics early on, as can be seen through coverage rate, adoption, and penetration indicators [37]. However, FTTH should not be analyzed only as a high-bandwidth access technology but as a critical infrastructure to support gigabit connectivity and the evolution to VHCN. Its maturity results from the combination of the technological evolution of PON networks, regulatory frameworks, market structure, and investment strategies on the part of operators.
In terms of architecture, the PON-based FTTH network consists of the Optical Line Terminal (OLT) located on the operator’s side, its Optical Distribution Network (ODN), and a termination in an ONT inside each home, which reduces the number of active equipment in the distribution network. From the ONT, network distribution is done via Wi-Fi, Ethernet, or Mesh solutions [38]. Although PON technologies ensure high capacity up to the building entrance, the final user experience can be affected by the indoor network due to attenuation caused by walls and obstacles, interference between adjacent Wi-Fi networks, and an increased number of connected devices.
The difference between the capacity delivered by the access network and the capacity actually distributed within the building can be represented by Figure 3, which compares the FTTH architecture with the FTTR architecture. In the FTTH architecture, it is delimited between the operator’s OLT and the ONT inside the building. In the case of FTTR, it is defined between the MFU and the various SFUs located in each of the rooms.
Figure 3.
Structure of FTTH and FTTR architectures.
In this way, FTTR emerges as an evolution of the FTTH architecture, which reduces the mismatch between the optical capacity provided by the access network and the effective delivery capacity to the user inside the building. With indoor distribution concentrated on a single ONT as an access point, FTTR will extend the fiber optic cable to each of the rooms, allowing the connection of sensors, actuators, IoT devices, and distributed access devices. Thus, the network begins to function as a high-capacity indoor backbone, bringing connectivity closer to the locations where services are actually consumed [38].
According to Liu et al. [27], the use of FTTR networks allows responding to the bottleneck of home networks, not only the limitations of copper network infrastructures but also the interference between APs and adjacent Wi-Fi networks. They also mention that FTTR is an architecture that allows for an integrated fiber–WiFi network, with support for fast Wi-Fi roaming, dynamic power management, and the possibility of end-to-end network slicing. Thus, FTTR should be viewed as a centrally coordinated and managed wireless-optical architecture and not just as a physical extension of fiber.
The extension of the network into the building in the case of FTTR is done through an MFU that functions as an entry point, termination, and coordination point for the indoor network. From the MFU, connectivity is distributed through the Indoor Fiber Distribution Network (IFDN) or Fiber In-Premises (FIP) network, terminating in several SFUs distributed throughout each of the rooms. The SFUs allow local coverage to end devices through Wi-Fi, Ethernet, or other local access technologies. This organization allows for a clear distinction between the access domain, supported by PON technologies, and the in-premises domain, associated with optical distribution within the building.
Table 1 summarizes the main PON technologies used in FTTH and FTTR architectures, as well as the specifications associated with in-premises optical distribution. This distinction is essential, since GPON, XG-PON, XGS-PON, 25GS-PON, and 50G-PON correspond to access PON technologies, while FTTR, FIP, FIN, and G.fin refer to optical distribution models within the building. Therefore, FTTR should not be confused with a new PON technology but understood as an architecture that can reuse or complement existing PON technologies to extend optical connectivity to the end-use space [39].
Table 1.
PON technology.
If GPON formed the basis for the massive implementation of FTTH, with asymmetric capacity adjusted to traditional residential services, the evolution to XG-PON, XGS-PON and 50G-PON made it possible to support applications with higher bandwidth, latency, and reliability requirements. However, the increase in capacity only translates into an effective improvement in the end experience if the indoor network manages to preserve its capacity up to the end user. Otherwise, the indoor segment becomes the main bottleneck, even when the FTTH connection provides high capacity up to the ONT.
Marotta et al. [13] propose an architecture based on two cascaded PON networks. The primary PON is responsible for the connection between OLT and ONT/ONU; in the case of the secondary PON, it is implemented inside the building. In this model, the residential gateway has a dual function: it functions as an ONT in relation to the operator’s access network and as an optical control element in relation to the internal network. This approach explicitly separates the external ODN from the internal ODN, allowing a home network to be transformed into a structured optical domain, instead of maintaining only centralized wireless distribution.
Cai et al. [33] describe this evolution in the context of Fiber In-Premises (FIP) networks and G.fin specifications. According to the authors, the FTTR architecture integrates an FTTH segment and an interior network. In the FTTH network segment, existing optical technologies such as 10G-EPON or XG(S)-PON can be used, while in the FTTR network segment, an MFU, an IFDN, and multiple SFUs are included. Thus, it is clear that FTTR does not eliminate FTTH but adds an optical distribution layer with internal functionalities, allowing the capacity delivered by the access network to be extended and distributed in a more granular way within the building.
With the generalization of gigabit access networks, the FTTR architecture is positioned as a complementary architecture to FTTH. Fiber optics plays a fundamental role in communication infrastructure in order to guarantee high capacity. Wi-Fi access works closer to users [40]. With this approach, FTTR networks are not just high-bandwidth channels to the interior of the building but an approach to an indoor access and distribution architecture oriented towards experience and towards improving stability, coverage, and perceived quality by the end user [36].
2.2.2. MFU and SFU Model with Centralized Management
FTTR architecture can be implemented in accordance with the ITU-T G.fin set of recommendations, namely G.9940 [41], allowing the implementation of an in-premises network, consisting of three main elements: the MFU, the SFUs and the IFDN. The MFU is the main element of the indoor network, having three essential functions: termination of the optical network coming from the access network, control, and coordination of the SFUs installed in each of the building’s rooms and management of the distributed Wi-Fi network. Communication between the MFU and the SFUs is done through the IFDN. The SFUs are simplified units in each room with Wi-Fi interfaces, Ethernet ports, and in some cases, with local sensing functionalities. The MFU allows centralized coordination of indoor network resources, including distributed APs and dynamic allocation of resources to each SFU, based on the overall state of the network.
With this structure, it is possible to bring the network closer to the locations where the services are actually used, significantly reducing the distance between the access point and the end devices, improving coverage by room, allowing for reduced interference due to walls and obstacles, less congestion, and greater predictability in performance [42]. This type of structure can be exemplified in Figure 4, indicating the communication mechanisms between the various elements of the FTTR network, based on the recommendations of G.fin networks.
Figure 4.
FTTR network architecture.
At the control level, in the G.fin architecture, you have three logical planes: management, control, and data. For the management plane, the MFU controls the entire network through an MFU Management Entity (MME), with functions such as identifying network devices, configurations, performance monitoring, and fault detection. At the control level, the MFU continuously collects information about Wi-Fi channel conditions, interference levels, traffic profiles, and latency requirements for each service through the set of instructions given to the SFUs via the Network Control Interface (NCI) [43]. In the data plane, communication between the MFU and the SFUs is ensured through IFDN optical connections, while connections to devices are made through the different SFU interfaces. Logical separation through layers allows the network to be managed in an integrated way and with global visibility [44], unlike the AP approach, which operates autonomously, without sharing the state of neighboring nodes.
With centralized management, one of the most relevant contributions is the coordination of the Wi-Fi spectrum for situations where there are several distributed APs operating independently; interference between adjacent channels constitutes a limiting factor for effective throughput, especially in buildings with high device density [36].
The Centralized Wi-Fi Access Network (C-WAN) architecture, developed on the G.fin framework, seeks to address this problem by using the Dynamic Wi-Fi Management (DWM) algorithm, centrally scheduling and allocating radio resources, and eliminating interference conflicts [45,46]. Compared to conventional multi-AP networks without coordination, this approach allows significant gains in throughput in concurrent access scenarios [43]. In addition, it allows for the optimization of transmission power by room, as each SFU serves a physically delimited space, minimizing interference between adjacent SFUs and reducing the energy consumption of active equipment. The per-room power control mechanism, which allows for dynamic spectrum management capabilities, becomes an essential element of the Green FTTR model [47].
MFU and SFU equipment have centralized management and are supported by a remote management scheme based on the Optical Network Unit Management and Control Interface (OMCI) protocol extended in the FTTR domain. This mechanism, recently proposed in the context of the G.fin recommendations, introduces an OMCI adapter in the MFU in order to exchange management messages between the OLT and the FTTH and FTTR networks. With a standardized management message format across the entire network, allowing the network administrator to remotely configure authentication policies, VLAN segmentation, QoS parameters, and performance monitoring on all SFUs through a single management interface [47]. To reinforce this policy, the supplement to ITU-T recommendation G.Sup89 [48] reinforces this approach with coordinated management between PON access networks and FIP networks, identifying as a fundamental requirement the existence of a low-latency, high-priority management channel between the OLT and SFU.
For integration with wireless access technologies, SFUs can operate with Wi-Fi 6 (IEEE 802.11ax) and, in newer devices, with Wi-Fi 7 (IEEE 802.11be), guaranteeing gigabit bandwidth to end users in each of the rooms. The power supply for SFUs can be made through hybrid cables consisting of optical fiber and metallic conductors for power supply, called Power Over Fiber (PoF), thus eliminating the need for additional electrical outlets in each environment, simplifying installation and contributing to a coherence of the indoor full-fiber distribution model [49].
The convergence between the MAC and PHY layers of Wi-Fi in the MFU is proposed as a simplified architecture [33,47], where the MAC layer of Wi-Fi is processed in the MFU, while the SFUs are closer to the physical PHY layer and the radio unit (RF). This integration gives the MFU granular control over frame construction, transmission scheduling, and resource allocation per user, with a single entity for radio resource management decision-making [50]. Users, when distributed across different rooms, are managed as if they were connected to a single access point, having direct implications for quality of service, performance predictability, and service continuity between rooms. For this to translate into an effective improvement in coordination between channels, power, roaming, and resource allocation, it will only be possible if analyzed in an integrated manner.
2.3. FTTR in Smart Buildings and IoT Environments
Smart buildings can be seen as distributed digital environments, where different technical systems, such as air conditioning, lighting, access control, security, and energy management, interact continuously and interdependently with each other, using sensors, actuators, and management platforms for devices connected to the building’s indoor network [51]. Thus, if a conventional residential access network’s main function is to provide internet connection, in the case of the network infrastructure of smart buildings, it is presented as an essential operational element, as the building’s own control and automation processes are based on this infrastructure. Thus, the network stops being a support service and becomes a critical functional component, whose performance directly conditions the effectiveness of the systems that depend on it [52].
The growing number of connected devices in a smart building leads to an increase in the complexity of the indoor network. Devices are heterogeneous, both in terms of traffic profiles and quality of service requirements. In the case of temperature, humidity, and air quality, presence sensors need low flow rates but have high sampling frequency and reduced operational latency requirements. For the video surveillance system, constant rates in the order of Mbps and low jitter are required. Air conditioning and lighting system actuators require communication channels with high reliability and deterministic response time, as communication failures have a direct impact on the comfort and safety of occupants [53]. On the other hand, users’ mobile devices generate variable traffic such as productivity applications, communications, and gradually immersive services [54]. The existence of heterogeneous profiles, which use the same physical medium but have requirements for service differentiation and traffic isolation, means that access management architectures without centralized management are hardly able to respond in a consistent manner.
BACS and BEMS play a central role in the technical and energy management of buildings, collecting and processing information from multiple devices in the building [55]. The evolution of this type of architecture begins to integrate IoT, WSN, artificial intelligence and data analysis, requiring infrastructures capable of guaranteeing interoperability between systems, low operational latency, continuity of access to information and support for real-time operations [56]. At the network level, these systems need low latency and sufficient bandwidth to guarantee the transmission of telemetry data, which is increasingly large. The infrastructure’s ability to guarantee both requirements simultaneously, at various points in the building, corresponds to one of the great challenges of indoor networks in smart buildings [57], as exemplified in Figure 5.
Figure 5.
FTTR architecture in a building.
In this context, the FTTH model with the distribution of a single AP becomes limiting, despite the FTTH connection allowing high capacity up to the ONT. The final experience within the building becomes dependent on the indoor wireless network. For scenarios with multiple rooms, multiple floors, various physical obstacles, and a high density of devices, not to mention the various digital services and distributed forms, the existence of only one AP can give rise to areas without coverage, increased latency, increased packet loss, and degradation of the user experience. This limitation is especially relevant in smart buildings, where connectivity must support different types of traffic with IoT, mobile services, management platforms, and latency-sensitive applications [58].
FTTR corresponds to the appropriate model to respond to the identified limitations, with the entire indoor network in fiber optics allowing the network to be closer to the devices and services used, thus reducing the dependence on a single access point, achieving a more granular distribution in the connection. With the integration of MFU, SFU, and distributed APs, it is possible to guarantee centralized management of indoor resources, including the coordination of Wi-Fi coverage and differentiation of services. It also ensures network status monitoring and energy optimization between the various APs. FTTR is not limited to simply extending the internal fiber optic network but corresponds to an architecture oriented towards predictability, stability, and integrated management of the various services in the building [36].
2.4. Green FTTR and Energy Efficiency
Energy analysis of FTTR architectures should be analyzed separately from the overall energy efficiency of buildings. The Green FTTR approach is associated with the energy efficiency of the various active network elements for data transport between the MFU, passing through the SFU and ending at an AP that will be the boundary between the network and users with their respective digital services [33]. For an assessment of network efficiency, it must be viewed at the level of the physical architecture and the different operational states of the equipment, since the amount of data to be transmitted and the power used in data transmission must also be taken into account [59].
In FTTH networks, the optical access component uses a PON architecture, with OLT and ONU/ONT being the main active elements. The OLT is located on the operator’s network, while the ONU/ONT is inside the building. The optical distribution network (ODN) essentially consists of passive elements, such as optical splitters that do not require power during transmission, allowing networks based on the PON architecture to have lower consumption than active optical architectures based on equipment powered along the network [60]. The energy efficiency of FTTH must take into account the energy consumption of the ONT/ONU, the different operating modes, the number of users, and the average data rate per user, which directly influences the overall network consumption.
In the FTTH network scenario with one AP, the Wi-Fi network inside the building must be considered for energy consumption purposes. The AP’s consumption depends on the characteristics of the traffic type, the number of associated devices, and the operation of the equipment itself, being an element to consider when comparing FTTH and FTTR [61]. This avoids limiting the FTTH scenario to the optical connection up to the ONT and disregarding the wireless network distribution.
The distribution is based on a single AP that characterizes the FTTH model, where all the capacity from the access network is routed to the single AP, forcibly sharing it with all devices and users in the building. In situations with a high density of IoT devices and multiple users using applications with different latency requirements, this model can give rise to three categories of degradation [33,62]: contention in access to the shared medium, which increases with the number of competing devices and worsens latency; roof degradation in distant rooms or separated by physical obstacles, as attenuation caused by walls and building materials reduces signal power and effective transmission rate; and absence of service differentiation mechanisms by room or device profile, making it difficult to isolate critical automation traffic from traffic generated by users.
In the case of FTTR, the analysis of energy consumption becomes more complex, as the architecture no longer focuses only on the ONT and the AP but introduces the MFU with several SFUs, in addition to the interior optical interfaces and distribution access points. In a quick analysis, one could assume that energy consumption would be higher, given the increase in the number of active devices.
Energy assessment should not be limited to the absolute value of energy consumption but to the relationship between the additional energy of the SFU and the increase in effective capacity as well as the improvement in coverage. In addition, a reduction in the number of lost packets is achieved; therefore, there are fewer retransmissions, meeting the requirements of QoS and QoE [33].
When considering the mobility of various users within the building, with several rooms or floors, this movement will continuously alter the distance to the access point and consequently pass through areas with different levels of coverage. For situations based on a single AP, or with multi-AP networks without centralized coordination, such transitions may lead to signal degradation. This situation becomes particularly relevant in applications with high bandwidth and continuous reliability requirements [36].
The comparison between FTTH with a single AP and FTTR should also consider that many conventional APs operate with fixed transmission power, even during periods of reduced traffic. The energy efficiency of FTTR should be viewed dynamically, where consumption varies according to the actual conditions of use. In this way, it is possible to create a bridge with the objectives of the EPBD and with its GAO principle of F5G-A, which associates performance, energy efficiency, and intelligent management of network resources.
- Energy Modeling of Active Components
FTTR energy modeling involves decomposing the power consumption of each active device. The SFU consists of an optical interface for connection to the MFU, Wi-Fi radio signal modules for wireless connections, signal processing units, and management and control circuits. Therefore, the power consumption of each SFU can be defined by three elements:
where
- PI is the idle power required to keep the unit operational if there is no active traffic;
- PD is the dynamic power that depends on the traffic load and the respective data processing and routing;
- PT is the radio transmission power associated with local wireless coverage and also has the necessary power to ensure connection with end devices.
In this way, it is possible to distinguish between the minimum consumption for the SFU to be operational, the additional consumption for data transmission, and the consumption to guarantee local wireless coverage [32]. Thus, energy efficiency depends not only on the number of SFUs installed, but also on the amount of data to be transmitted, the number of active users, the distance between the devices and the access point, interference, and the power required to guarantee the minimum level for the received signal.
The MFU should also be included for energy model purposes, as it has gateway, coordination element, and internal network controller functions, unlike SFUs that can change between different states depending on occupancy and traffic. The MFU tends to always maintain the same operational state to ensure network supervision, synchronization, SFU management, and coordination between the optical connection and the Wi-Fi connection. Thus, the total power can be defined by Equation (2):
In the FTTH scenario with a single AP, the modeling becomes simpler, as it is centered on the ONT/router and the single AP, with its power depending on data traffic and wireless transmission. In a comparison between architectures, it is recommended to normalize the results based on the useful traffic delivered and the performance levels obtained.
In the Green FTTR model, each SFU transitions between different energy states, according to the presence of users, the existence of traffic, and the control policy defined by the MFU. The active state means that the MFU is transmitting or receiving data, keeping the optical, Wi-Fi, and data processing modules active. In the idle state, the SFU remains operational and ready to communicate with devices, but without any active data transmission. For the twelve state, most of the functionalities of each SFU are reduced, with only the capacity limited to monitoring, recommended for situations where there are users in the building, but without relevant traffic in that room. In the deep sleep state, the SFU deactivates most of its modules, significantly reducing energy consumption. This occurs when there are no active users or devices associated with its coverage area. Differentiating states allows the FTTR architecture to explore energy-saving mechanisms in each of the rooms, without requiring all SFUs to remain continuously active. The SFU operational-state decision logic implemented in the FTTR_SMART model is illustrated in Figure 6.
Figure 6.
SFU operational-state decision flow.
Thus, the total SFU consumption is defined as the sum of the different states of the device.
where
- Q = {active, idle, doze, deep sleep}.
Thus, the total consumption of the different states can be given by Equation (4), where T corresponds to
The existence of centralized management in the MFU is what differentiates a Green FTTR network from a network with multiple independent APs. With the technological evolution of FTTR networks, there is coordination in the optical network and the wireless network through the C-WAN. With this model, the MFU is able to collect information about the state of Wi-Fi connections, channel occupancy, traffic queues, associated users, and transmission conditions, subsequently sending coordination strategies to the SFU. With this global view, it is possible to create conditions for coordinated power management, channel optimization, roaming, and slicing, allowing for low-power policies, something that could not be achieved in a multi-AP architecture without centralized control [27,36].
The user aggregation strategy proposed by Cai et al. [12] allows us to delve deeper into the Green FTTR logic, which argues that not all SFUs need to remain active at all times. To achieve this, Station Terminal (STA) connections are aggregated into a small subset of active SFUs, allowing a set of underutilized SFUs to be placed in low-consumption states or temporarily switched off [63]. Despite this strategy, there is difficulty in combining three independent decisions: which SFUs should remain active; which STAs should be associated with each SFU; and what power should be allocated to each active SFU.
As complementary strategies to energy efficiency, traffic-aware methods are used [63], with SFU activation decisions and resource management being adjusted according to the amount of traffic. With this approach, consumption is not directly proportional to the presence or absence of users but also to traffic, different priority levels, and a temporal distribution of traffic. With traffic-based strategies, it is possible to approximate network energy management based on real network usage conditions, reinforcing the need to evaluate different traffic profiles within the simulation framework.
The power for this type of strategy can be defined by Equation (5), where Pj corresponds to the total power of SFUj. Note that each STA can only be connected to a single SFU, and there is a minimum transmission power required for each SFU to meet the minimum RSSI threshold for the worst-case propagation condition. Thus, energy minimization cannot be done solely by disabling SFU, because turning off an SFU alters coverage, redistributes users, and may force the remaining SFUs to increase transmission power, in which case δci corresponds to the additional energy cost for each additional STA.
where
- aj represents the activation state of SFUj, where it assumes the value of 1 if SFUj is on, and the value 0 if SFUj is off or in deep sleep mode;
- Pstatic is the base power of an active SFU;
- ptx,j is the transmission power of SFUj for wireless communication to each STA; note that if aj is 0, ptx,j will also be 0;
- xij is the binary value that takes the value 1 when STAi is connected to SFUj; otherwise, it takes the value 0;
- δc,i differentiates the usage profile of STAi depending on the service class c, such as IoT, web, streaming, games, or XR.
Thus, energy assessment should be defined as a trade-off between energy and performance. The traffic-aware strategy can reduce consumption by putting SFUs into sleep mode, reducing transmission power, or limiting active resources, but it becomes unsustainable if it results in excessive latency, jitter, packet loss, and service interruptions. The Green FTTR approach should be viewed as an optimization subject to QoS and QoE constraints, and not simply a minimization of the power of each SFU.
The energy advantage of FTTR should not be presented as a universal solution but as dependent on the scenario, occupancy, traffic, number of active SFUs, energy states used, and minimum QoS and QoE requirements.
2.5. QoS and QoE in FTTR Networks
QoS and QoE can be defined as complementary dimensions in the evaluation of indoor network architectures for smart buildings. QoS is associated with metrics such as throughput, delay, jitter, packet loss, availability, reliability, and connection stability [64]. For architectures with centralized access, priority is given to time-sensitive services and Wi-Fi throughput prediction, thus allowing the reduction in delay and jitter in the radio segment, thus allowing a more efficient use of optical resources [46].
QoE is defined as the quality perceived by the user when using a given service, requiring connection continuity, flow stability, absence of interruptions, and adaptation of the network to the specific requirements of each application. In this study, QoE is inferred from the network-performance and service-compliance metrics considered in the proposed framework. This issue is quite relevant since the network may present acceptable average QoS values, but the experience may still be degraded in applications sensitive to latency, packet loss or temporal variation in the service [65].
Table 2 summarizes the reference QoS and QoE requirements for each service class and the corresponding supporting sources. It appears that the studies do not analyze the different dimensions in an integrated manner regarding FTTR in smart buildings.
In smart buildings, the joint assessment of QoS and QoE becomes particularly important given the existence of different traffic profiles in the same environment. Video surveillance systems need continuous bandwidth and controlled jitter. In the case of actuators connected to BACS and BEMSs, they require low response times to guarantee real-time control actions. Note that another type of profile is productivity applications, streaming, video conferencing, and cloud gaming with higher bandwidth, latency, and stability requirements [66]. The assessment of the indoor network will not only be the maximum available capacity, but also the type of architecture that allows it to support heterogeneous, simultaneous services operating in different rooms of the building must be considered.
In the FTTH architecture with a single AP, the final QoS is highly conditioned by the performance of the internal Wi-Fi network, although the optical connection to the ONT can provide high capacity. User experience depends on the location of the AP and the attenuation caused by walls and obstacles. Interference between adjacent Wi-Fi networks becomes an element of degradation. The greater the number of rooms, floors, and devices on the network, in addition to the mobility of users within the building [62,66], the greater the degradation of effective throughput per user, with an increase in access latency to the medium and also an increase in jitter, increasing the probability of packet loss and consequently an increase in the number of packets to be retransmitted.
The FTTR architecture makes it possible to respond to these limitations, with the optical network reaching each room, bringing the network closer to the end devices, reducing the average distance between the access point and the user, thus improving propagation conditions and traffic distribution across the various points, allowing for granular management of the indoor network. According to Zhang et al. [36], this architecture is a key technology for F5G and future fixed networks, standing out for supporting higher performance services and coordinating the relationship between fiber and Wi-Fi. In the case of Marotta et al. [13] also consider this architecture capable of supporting high QoS services, with an impact on latency and jitter, especially in cases of edge computing and cascaded PON networks.
The C-WAN architecture emerges in this context as a relevant mechanism for improving QoS and QoE in FTTR. In uncoordinated multi-AP networks, where multiple access points compete with each other for the radio channel without any coordination rules between them, C-WAN allows the MFU to collect network information, make control decisions, and coordinate the network’s optical and wireless resources [31]. Such coordination may include channel management, traffic scheduling, power control, and QoS mapping. In this way, the C-WAN architecture allows optimizing latency-sensitive services, improving real-time communication, and supporting continuous roaming, meeting the requirements for improving QoE [46].
It is interesting to analyze the different types of services in a smart building with different QoS and QoE metrics. This analysis is described in Table 2 for each of the scenarios.
Table 2.
QoS and QoE reference parameters by service class.
A gap is identified in the review due to the lack of studies analyzing dimensions such as architecture, QoS, QoE, and energy efficiency in a unified manner. Thus, an approach that allows relating different dimensions to different smart building scenarios within a single framework is lacking. Based on this gap, the following section proposes a comparative evaluation framework between FTTH with a single AP and FTTR. This framework considers different levels of device density, traffic profiles, mobility between rooms, and requirements for each service class, allowing for analysis of under what conditions FTTR improves quality of service, quality of experience, and energy efficiency compared to a traditional FTTH architecture based on a single AP.
3. Comparative Analysis Framework
The proposed framework allows for a systematic comparative evaluation between FTTH and FTTR architectures in residential smart building scenarios. To this end, it combines the architectural principles of each solution, physical parameters, traffic values, propagation models, energy consumption, and a set of common evaluation metrics, ensuring that the comparison is made under equivalent and reproducible conditions. The framework considers three operating modes: FTTH with one AP; FTTR with all SFUs permanently active; and an FTTR configuration with intelligent energy management where each SFU can switch between active, idle, doze, and deep sleep states depending on the occupancy of the room and the traffic load, as described in Figure 6. The FTTR configurations are called FTTR_SIMPLE and FTTR_SMART, respectively. This differentiation allows for separating the gains associated with the full-fiber indoor architecture itself from the gains introduced by the dynamic management of the SFU’s energy states.
Figure 7 presents the dimensional structure of the proposed framework, where the methodology defines five functional levels: study input parameters; architectures; evaluation methods; types of modeling and simulation; evaluation metrics; and final output through the F indicator. The input parameters consider the building plan, defining the distances between the entry point and each room, the number of walls to be traversed, device density scenarios, transmission frequencies, and device classes. The final output F corresponds to the integrated F index, allowing for an aggregated comparison of the performance of each architecture.
Figure 7.
Dimensional structure comparing FTTH and FTTR.
The evaluation is defined in three main dimensions: energy efficiency, quality of service, and quality of experience. Energy efficiency is evaluated by total energy consumption and energy consumed per bit transmitted. QoS is analyzed by throughput, latency, jitter, and packet loss, while QoE is represented by the proportion of flows that simultaneously meet the technical requirements associated with the respective service class. These dimensions are subsequently integrated into a composite evaluation index, allowing comparison of various scenarios, architectures, and operating modes from a multi-objective perspective.
The framework implementation was based on the Network Simulation 3 (ns-3) tool, applied to a residential building with T3 typology, composed of six rooms, three device density scenarios, and two Wi-Fi frequency bands (2.4 Ghz and 5 Ghz), using the IEEE 802.11ax standard (Wi-Fi 6) [72] and internal propagation based on the ITU-R P.1238-12 model [73]. For each configuration, 30 independent simulations were run, each lasting 60 s, allowing the calculation of averages, standard deviations, and 95% confidence intervals for the analyzed metrics. This approach ensures statistical aggregation of results and supports comparative analysis between FTTH and FTTR.
3.1. Simulation Scenarios
The reference plant was used in all simulations with T3 typology, ensuring that performance differences are associated with the network architecture and not dependent on topology variations. The apartment is divided into six rooms requiring network coverage. Each of the rooms has an SFU in FTTR mode or is exposed to the field of a single AP in FTTH mode. The walls are made of brick masonry with attenuation of 5.0 dB at 2.4 GHz and 7.0 dB at 5 GHz, according to the ITU-R P.1238-12 standard.
Table 3 characterizes parameters of the physical topology used in the simulation, defining distances between the central point of the network and each of the rooms, as well as the number of walls that the Wi-Fi signal will have to pass through in FTTH mode. In the case of FTTR, the distance between the MFU and the SFU is considered. An average distance of 1.5 m is considered between the client device and the SFU without obstacles and without intermediate walls.
Table 3.
RSSI parameters for FTTH and FTTR architecture in the 2.4 GHz and 5 GHz frequencies.
They defined three types of scenarios according to device density: low density, medium density, and high density. Each scenario represents different residential occupancy profiles, from basic use with few active devices to a smart home with multiple IoT devices, BACS/BEMS equipment, IP video surveillance cameras, video conferencing services, 4 K streaming, cloud gaming, and immersive applications. Using these three scenarios, it is possible to evaluate the scalability of FTTH and FTTR architectures in the face of progressively increasing traffic load and simultaneous connections. Service classes are defined according to various requirements for bandwidth, latency, jitter, packet loss, and minimum RSSI level. This distinction is important because not all devices exhibit the same sensitivity to network degradation. Table 4 shows the number of devices for each scenario, as well as the number of devices.
Table 4.
Defining the number of devices for each device density scenario.
3.2. Modeling of FTTH and FTTR Architectures
Both architectures are modeled with the same physical and traffic parameters, differing essentially in the positioning of the Wi-Fi access point for users and the energy consumption model. The methodological symmetry between architectures is fundamental for attributing the observed performance differences to the network architecture. In the FTTH architecture, the single AP is located at the building entrance, and the distance between the AP and the device can be defined by Equation (6).
The loss along the way will be calculated by Equation (7) [73]:
where
- PL(d0) is the loss at d0 = 1 m;
- n is the propagation exponent;
- Nw is the number of walls;
- Lw is the attenuation per wall;
- Xσ represents the shading component modeled as a Gaussian random variable with mean zero and standard deviation σ, used to represent variations in indoor propagation that do not depend exclusively on the distance and attenuation of the walls.
The parameters defined in Table 5 refer to the specifications for typical brick masonry construction:
Table 5.
Specifications regarding signal propagation through brick walls at frequencies of 2.4 GHz and 5 GHz.
The power received by device j can be defined by Equation (8), and the signal-to-noise ratio (SNR) is defined by Equation (9):
where
- Nfloor = −95 dBm is the reference noise level.
The minimum coverage requirement for each service class s is given by Equation (10):
where
- corresponds to the minimum value for the service class s;
- The thresholds are: IoT −80 dBm; BACS −75 dBm; immersive services −65 dBm [74].
In the FTTR architecture, the MFU-SFU link is modeled with a point-to-point fiber optic link with a capacity of 10 Gbps and negligible latency in the residential context, but for simulation purposes, the latency is parameterized to 1 × 10⁻⁶ s.
In the simulation, two simulation modes are considered, independent of the number of users and traffic in each room, where the SFUs are always in active mode. In the FTTR mode with intelligent energy management, each SFU alternates between one of four states. This allows for the evaluation of the additional contribution of dynamic management of the SFU’s energy states.
3.3. Evaluation Metrics
In terms of energy efficiency [59,61], for the FTTH architecture, the calculation of power and energy consumed are defined by Equations (11) and (12), respectively.
In the case of FTTR architecture, power must take into account the power of the MFU and the SFU. The MFU has a static value and also a dynamic value depending on the traffic at any given time. The SFU varies between one of the four states. Power in the FTTR architecture is defined by Equations (13)–(15).
Table 6 shows the power values for each active piece of equipment and, in the case of SFU, the consumption in each state [61].
Table 6.
Energy parameters of the FTTH and FTTR consumption model.
Regarding energy efficiency and relative savings, Equations (16)–(18) can be used.
Beyond the energy dimension, the comparative evaluation considers a set of QoS metrics designed to characterize each architecture in supporting different classes of service under equivalent traffic and propagation conditions. In this case, the evaluation is based on throughput, average latency, jitter, and packet loss. These measures ensure stable connectivity with low temporal variability and guarantee performance in different applications with distinct requirements, from IoT devices to immersive applications. The metrics are calculated using the ns-3 FlowMonitor and are defined by Equations (19)–(22):
where:
- is the total number of bytes successfully received by stream j.
- corresponds to the number of packets received in stream j;
- is the number of packets transmitted in stream j.
The QoS compliance of each flow j is determined by comparing the simulated values of latency, jitter, and packet loss with the limit values defined for each service class as per Table 7. Therefore, for a flow to be considered compliant, it must simultaneously meet the various conditions of Equation (23).
Table 7.
QoS limit values by service class [75,76].
After evaluating the QoS metrics, the quality of experience can be estimated through the ability of each architecture to guarantee the technical requirements associated with each class of service. QoE cannot be treated as a subjective perception but through objective metrics obtained through simulation. A flow is considered to contribute positively to QoE when it simultaneously meets the threshold values for latency, jitter and packet loss defined for the respective class of service [77]. In this way, it is possible to relate the technical performance of the network to the functional suitability of those supported. The global QoE index will be defined by the Equation:
In voice services and the audio component in video conferencing, experience degradation is highly dependent on latency, jitter, and packet loss. For these cases, it can be represented using the MOS (Mean Opinion Score) estimated by the ITU-T G. 107 E model [78]. Thus, for these services, the MOS is calculated by Equation (25):
For streaming and immersive services, the EQE index weights QoS compliance with RSSI coverage using Equation (26). In these cases, we consider the weights of = 0.7 and = 0.3.
To enable a global comparison between both architectures, the different scenarios and the various modes of operation, the aggregated F-score is used. This index aggregates into a single normalized score the various dimensions considered in the framework such as energy consumption, latency, jitter, packet loss and QoE compliance. This index allows comparison from a multi-objective perspective [79].
where
- Σλk = 1 ensures that the weighting coefficients of the F index are normalized.
In order to reduce the dependence of the F-index on a single choice of weights for each component, a careful analysis of the sensitivity of the λ coefficients should be carried out. In this study, λ = 0.2 was considered for each of the five components. Complementarily, two alternative weighting schemes are evaluated: the Analytical Hierarchy Process (AHP), based on a structured comparison of the relative importance of the metrics, and the Entropy Weight Method (EWM), which assigns greater weight to metrics with greater discriminatory capacity in the set of results. Note that the lower the F-index, the better its overall performance.
The F-index remains a key integrated metric for the comparison between FTTH and FTTR. In the complementary analysis, it is only important to know whether the order of the results obtained is maintained with different sets of weights, as it is important to test the sensitivity of the results. The variation in the importance of each of the dimensions should not affect the order of the results.
3.4. Implementation of the Simulation Model in ns-3
The framework was implemented using the ns-3.42 simulator, responsible for scenario configuration, typology definition, propagation model definition, and UDP traffic generation. In the FTTR architecture, the connections between the MFU and the SFU are modeled as point-to-point fiber optic connections. Device access is via IEEE 802.11ax Wi-Fi. Each SFU works with isolated channels, thus representing in a simplified way the centralized channel coordination foreseen in C-WAN/DWM architectures.
Each of the eighteen configurations was executed thirty times, with independent and fixed seeds, ensuring the reproducibility of the results. Each execution simulates 60 s.
Algorithm 1 synthesizes this procedure, from the initialization of the building topology, through the different scenarios, to the export and aggregation of results. With this structure, it is possible to ensure that all architectures are evaluated under the same conditions of propagation, device density, traffic profiles, and simulation duration.
| Algorithm 1: Comparative Evaluation Procedure FTTH vs. FTTR |
| 1. Input: S ∈ {A,B,C}, M ∈ {FTTH, FTTR_SIMPLE, FTTR_SMART}, 2. F ∈ {2.4 GHz, 5 GHz}, R = 30, T_sim = 60 s 3. Output: Aggregate metrics with 95% confidence intervals 4. Initialize building topology 5. for all freq ∈ F do 6. for all s ∈ S do 7. for all m ∈ M do 8. for r = 1 to R do 9. set the random seed using RngSeedManager::SetSeed(r) 10. Configure N_dev devices according to scenario s 11. Install 802.11ax WiFi channel using propagation mode 12. If m ≠ FTTH then 13. enable fiber links MFU→SFU 14. Launch UDP streams by device and architecture 15. Run simulation during T_sim; 16. FlowMonitor active 17. Calculate Throughput, Delay, Jitter, Loss 18. Calculate E_FTTH and E_FTTR 19. Calculate QoE_global, EQE 20. Calculate F_FTTH and F_FTTR (λk = 0.2) 21. Save to {freq}_{s}_{m}_run{r}.csv 22. End for 23. Calculate the mean, σ, and 95% CI for R executions 24. Recalculate (F) using EWM- and AHP-based weights 25. Compare the ranking of the architectures under the different weighting schemes. 26. End for 27. End for 28.End for |
In computational terms, the calculation and aggregation of framework metrics increase almost linearly with the number of flows, devices, and SFUs considered in each scenario. However, the overall computational cost is primarily determined by the ns-3 event-driven simulation, as execution time increases with the number of packets generated, active devices, wireless interactions, and configurations evaluated. In larger implementations, scalability can be improved through parallel execution of independent simulations, batch processing, and, when necessary, the use of distributed computing resources.
4. Result Analysis
The results obtained were based on five hundred and forty simulations, resulting from eighteen experimental configurations and thirty configuration-independent seeds. The comparison focuses on three types of architectural configuration: FTTH with a single AP; FTTR with all SFUs in the permanently active state, called FTTR_SIMPLE; and FTTR with the SFU varying between four possible states, which is called FTTR_SMART. The analysis considers three device density levels: Scenario A with eight devices; Scenario B with twenty-nine devices; and Scenario C with fifty-six devices. In each scenario, the focus is not only on increasing the number of devices but also on an average increase in bandwidth per device. Whenever applicable, an analysis is performed for both 2.4 GHz and 5 GHz frequencies to assess the effect of frequency, wall attenuation, and traffic density.
For the comparative data analysis, statistical stability was evaluated after thirty independent runs. This validation was necessary because the propagation model includes a random Xσ shading component that can affect the results in FTTH architecture, since the single AP has to cover all rooms, including rooms with greater distances and a greater number of walls to cross.
where
- corresponds to the sample mean;
- s is the sample standard deviation;
- is the critical value for Student’s t-distribution for a two-sided 95% confidence interval, with 2.5% in each tail.
In Figure 8, the cumulative average evolution of the 95% confidence interval for the metrics with the greatest variation is presented. In the different graphs in the figure, it can be seen that the average stabilizes after twenty runs, which confirms that the thirty runs are sufficient to guarantee statistical convergence of results. The greatest variability occurs in the FTTH configuration at 5 GHz, specifically in scenario C, which has the highest density, resulting from greater attenuation along the path and greater penalty due to walls, with greater contention of access to the medium.
Figure 8.
Statistical convergence over 30 runs.
4.1. RSSI Coverage and the Impact of Frequency
Wi-Fi coverage becomes the first differentiating parameter between FTTH and FTTR architectures. In the case of FTTH, with a single AP, it is located in the hall and has to cover all the rooms in the house, including the most distant rooms, crossing several brick masonry walls. In the FTTR architecture, each room has a local SFU, reducing the distance between the access point and the end devices and practically eliminating the penalty associated with internal walls.
According to the propagation model defined earlier, the 5 GHz band has greater attenuation than the 2.4 GHz band due to the higher path loss exponent and the higher penalty for each wall. This difference is particularly relevant in architectures with a single AP, in which the signal must cross several rooms. For the FTTH model, the analytical RSSI values show that some rooms fall below the minimum limits required for certain service classes. At the 5 GHz frequency, the furthest room, located 22 m from the AP and separated by three walls, has an RSSI of −88.3 dBm, below the minimum threshold considered for IoT devices. At 2.4 GHz, although propagation is more favorable, the closest rooms continue to show values below the reference threshold for some service classes.
In contrast, the FTTR architecture maintains significantly higher and more homogeneous RSSI values between rooms, since the SFU is located within each compartment. This result shows that the main advantage of FTTR stems not only from the aggregated network capacity, but above all from the reduction in radio distance and the elimination of dependence on a single centralized access point.
Figure 9 shows the impact that frequency has on overall QoE for the three scenarios evaluated. In the FTTH architecture, the 2.4 GHz band shows higher QoE values compared to the 5 GHz band in scenarios A and B. In scenario C, despite the degradation of QoE in the case of FTTH, it presents an overall result at 2.4 GHz. This degradation with the increase in the number of devices is due to the fact that all the flow passes through the single AP. In this figure, boxes represent the interquartile range (IQR), the horizontal line indicates the median, whiskers extend to 1.5 × IQR, and dots represent outliers.
Figure 9.
Impact of frequency on overall QoE for different scenarios.
In both FTTR configurations, the QoE remains close to the maximum value in both frequencies and in the various scenarios. One of the main advantages of the FTTR architecture is highlighted here: the absence of the signal “needing” to pass through walls, thus reducing the need for radio channel variation, making the overall performance very predictable.
4.2. QoS and QoE Performance
For QoS analysis, it is important to evaluate the metrics of average latency, jitter, packet loss, and compliance with the thresholds of each service class. These metrics are quite relevant in the context of smart buildings, as there are several devices with very different requirements. Thus, more than evaluating the available throughput, it is important to understand the network’s behavior in terms of maintaining stability, low latency, and a reduced number of packet losses when the density of devices increases.
Thus, more than evaluating the available throughput, it is important to understand whether the network can maintain stability, low latency, and reduced packet loss when the density of devices increases. Figure 10 shows the average latency for each of the configurations.
Figure 10.
Average latency in each configuration.
The average latency in the FTTH architecture shows satisfactory results in scenario A, regardless of the frequency. With the increase in the number of devices in this architecture, the latency grows proportionally, resulting in a very evident degradation, especially at the 5 GHz frequency. In scenario B, the average latency increases drastically, approaching 157 ms, and in scenario C, the value is 151 ms. Note that in scenario C, the value may be misleading, as there is an error rate of 52.69%, which does not account for packets that were not delivered. The existence of a single AP acts as a bottleneck, given the increase in the number of devices as well as the increase in the average traffic volume. The 2.4 GHz frequency shows better results in scenarios A and B due to lower indoor attenuation. However, this architecture has limitations, as many devices compete for the same access point. In the case of FTTR_SIMPLE and FTTR_SMART, latency always remains low in the various configurations; even in high-density configurations, the increase is negligible.
Analysis of packet loss levels allows us to verify if the same pattern as latency is observed. Figure 11 shows the behavior of packet loss in different configurations. The main problem is seen in FTTH, with low loss in scenario A at both frequencies. The results degrade more rapidly at the 5 GHz frequency. Thus, the network ceases to guarantee stable delivery with the increase in the number of users and their traffic. In scenario C, at 5 GHz, the rate is 50%, and at 2.4 GHz, it is 30%. In the FTTR architecture, regardless of the configuration, the values are close to zero, thus not only improving RSSI coverage but also reducing access point contention, allowing for increased predictability of the indoor network.
Figure 11.
Packet loss due to configuration.
QoE is interpreted as an objective metric of compliance, that is, the number of flows that meet the requirements defined for each service class, making QoE an aggregate measure of QoS technical requirements rather than a subjective assessment.
While in various configurations with the FTTR architecture the QoE values are very close to 1, in FTTH the QoE varies strongly with the increase in devices, being more sensitive at the 5 GHz frequency, where in scenario C there are 0.27 and 0.38 QoE values for the 2.4 GHz and 5 GHz frequencies, respectively, as can be seen in Figure 12.
Figure 12.
QoE performance in each configuration.
If we analyze the distribution of QoE results across the thirty runs at the 5 GHz frequency, we see that in the FTTR_SIMPLE and FTTR_SMART modes, the distribution is fully concentrated at its maximum value, revealing high stability between runs. In the FTTH mode, however, it is not only less favorable on average, but also less predictable with increasing device density and service diversity.
These results are consistent with RQ1 of the research. While in low-density scenarios FTTH may be sufficient for less demanding services, with an increase in the number of devices, average bandwidth per device, and simultaneous flows, both FTTR modes show superior performance across the various metrics evaluated.
4.3. Energy Efficiency
The analysis of energy efficiency should be viewed from two perspectives: absolute consumption and the efficiency associated with the useful traffic delivered. This differentiation is fundamental, as architectures with reduced consumption may still not be the most efficient if the analysis is viewed as energy consumption per bit, and also if the most efficient model cannot maintain the necessary QoS and QoE in each service class.
The total energy consumption for the considered simulation interval, of sixty seconds per execution, is described in Figure 13. In scenario A, having few devices and the installation of several SFUs results in a significant energy penalty. In this same scenario, the FTTR_SMART mode reduces consumption compared to FTTR_SIMPLE, which has all SFUs always active. This reduction is due to the fact that there are rooms without associated devices, allowing some of the SFUs to transition to lower consumption states. Thus, the dynamic management of SFUs allows for a reduction in the additional consumption of FTTTR, although it does not completely eliminate the penalty associated with the distributed infrastructure. In scenarios B and C, the difference between FTTR_SIMPLE and FTTR_SMART becomes reduced with the increase in the number of devices, as in these scenarios the SFUs remain mainly in the active state during the simulation. Thus, it can be concluded that the advantage of the FTTR_SMART mode varies according to the occupancy profile and spatial distribution of the devices. In the case of partial occupancy of each SFU, dynamic management is quite relevant, but during periods of high occupancy, the savings margin is smaller.
Figure 13.
Total energy consumption.
In the case of FTTH, it always presents a lower energy consumption in absolute terms in any configuration but note that packet losses are greater than 50% in the 5 GHz frequency and a very low overall QoE. Thus, it can be stated that part of the energy consumed does not translate into useful traffic delivered with acceptable quality.
In an analysis of the energy efficiency for each bit transmitted, calculated using Equation (16), which determines the energy consumption for each bit delivered, as can be seen in Table 8.
Table 8.
Energy consumption for each bit transmitted.
Thus, it can be seen that in scenario C, with higher density, the energy consumption per bit is thirteen times better than in the FTTH model, with 7.65 × 10⁻⁸ J/bit compared to 1.23 × 10⁻⁶ J/bit. This reversal of results compared to scenarios A and B is a result of the collapse of the useful throughput, which presents 52.69% packet loss, since most of the energy is consumed in packet retransmissions and MAC collisions, not corresponding to effectively delivered traffic. In scenario A, the results are the opposite, where FTTH is 2.9 times more efficient than FTTR_SMART mode, highlighting that in situations of low device density in FTTR_SMART, the increased energy cost is not offset by the QoS gain.
Thus, answering research RQ2, at low density, FTTH is more energy-efficient, while in higher density scenarios, the degradation of QoS and QoE significantly reduces the functionality of the architecture. In FTTR_SMART, static consumption is higher, but it manages to compensate with a greater delivery of useful traffic and higher quality. This model becomes even more competitive when the analysis simultaneously considers energy, performance, and QoE.
4.4. Integrated F Index
The integrated F index allows aggregating the various dimensions of the study: energy, latency, jitter, packet loss, and QoE. The aim is to minimize the first four criteria, while QoE is a maximization criterion. Thus, the lower the value of the F indicator, the better the configuration’s performance, as can be seen in Figure 14.
Figure 14.
Aggregate F index for the eighteen configurations.
In this F indicator, the same weights are assigned to each component according to Equation (26). In scenario A, FTTH presents the lowest F value at both frequencies. This result is expected, since at low device density, the FTTH architecture can guarantee acceptable performance with the advantage of energy consumption. FTTR presents better QoS and QoE, but this does not fully compensate for the additional consumption of MFU and SFU. In scenarios B and C with the frequency at 5 GHz, FTTH presents higher values than FTTR_SIMPLE and FTTR_SMART, but with a marked degradation in latency, packet loss, and QoE. For the 2.4 GHz frequency, FTTH maintains a more favorable performance in scenario B, due to the advantage of better indoor propagation, but in scenario C it degrades abruptly. With this behavior, it is verified that the 2.4 GHz frequency can prolong the viability of FTTH in intermediate scenarios, but it does not eliminate the limitation of traffic concentration at a single point.
FTTR_SIMPLE and FTTR_SMART modes show very similar values in both scenarios B and C, as all rooms are occupied and the SFUs remain almost always active. The advantage of FTTR_SMART is seen in the lower occupancy scenario, where energy management allows for reduced consumption without compromising performance. Thus, FTTR_SMART represents the most balanced configuration when it is desired to combine distributed coverage, QoS/QoE stability, and energy adaptation.
The sensitivity analysis of the weights considers three weighting modes: equal weights, EWM, and the AHP method. EWM assigns a higher weight to metrics with greater discriminatory capacity in the result set, while AHP allows structuring the relative importance of metrics through pairwise comparison. Note that these methods are not seen as a new multi-criteria decision method but only as a robustness test of the F-index compared to the context of equal weights.
Table 9 shows that the weights obtained for EWM and AHP present a common trend, both assigning a greater weight to the packet loss dimension. This result is consistent with the simulations, since it is the metric that most penalizes FTTH in high-density scenarios. QoE has the lowest weight since it functions as an aggregate compliance metric, indirectly incorporating the effect of the other performance dimensions.
Table 9.
Weights defined in the sensitivity analysis of the F-index.
The analysis shows that even with changes in weighting, the results remain robust, as the ranking of each architecture does not change regardless of the weighting method, as can be seen in Table 10. In scenario A, FTTH is the model with the lowest F-value in any of the weighting schemes, reflecting the energy advantage when there are few active devices. In scenarios B and C, the FTTR_SMART model becomes the recommended solution, as the degradation of FTTH in non-energy metrics has a greater impact on the integrated result.
Table 10.
Aggregate F index for the three weighting scenarios.
Therefore, it can be stated that FTTH remains the recommended solution for low-density applications, while FTTR_SMART offers the best overall compromise in medium and high-density scenarios.
5. Conclusions
The energy efficiency of telecommunication networks becomes a relevant issue in the residential context in smart buildings. The framework implementation evaluates network performance, energy efficiency, and quality of experience using a multi-objective composite index F. The evaluation was based on five hundred and forty simulation runs covering three density scenarios, three operating modes, and the two frequencies at which Wi-Fi 6 operates.
In the FTTH architecture with a single AP, the results confirm that acceptable QoS and QoE levels cannot be maintained with increasing device density. In the highest density scenario with fifty-six devices at 5 GHz, FTTH has an average packet loss of 52.69% and an average latency of 151 ms, exceeding the threshold values of all latency-sensitive service classes. In the FTTR architecture, placing an SFU in each partition eliminates the dependence on attenuation due to walls and MAC contention at a single access point, guaranteeing packet loss below 0.08% and latency below 2 ms in all scenarios and frequencies. The overall QoE degrades to 0.27 in FTTH for the highest density scenario, while in both FTTR models it maintains a QoE above 0.974. In the intermediate intensity scenario, the 2.4 GHz frequency slightly mitigates FTTH degradation, but does not resolve the fundamental limitation due to traffic concentration at a single access point, thus addressing RQ1 of the work.
In terms of absolute power consumption, the FTTH architecture exhibits reduced consumption in all configurations, ranging between 588 and 606 J per minute, reflecting the absence of the six SFUs foreseen in the other models. If the analysis is done by energy consumption per bit, the results in scenario C are reversed: FTTH reaches 1.23 × 10⁻⁶ J/bit, thirteen times worse than the FTTR_SMART model with 7.65 × 10⁻⁸ J/bit, because most of the energy in FTTH is consumed and wasted in retransmissions, resulting in a packet loss rate of 52.79%. In the case of scenario A, with lower density, FTTH is 2.9 times more efficient per bit than FTTR_SMART. In this case, the additional energy cost of SFUs is not compensated by QoS at low density. The FTTR_SMART model achieves a 12.1% reduction in consumption compared to FTTR_SIMPLE in low-density scenario A, allowing unoccupied SFUs to transition to lower-consumption states. For scenarios B and C with higher density, the values converge, as the majority operational state of the SFU becomes the active state. Thus, the energy advantage of the FTTR_SMART model depends on the spatial occupancy profile of the building, thus answering RQ2 of the work.
The composite index F, in line with RQ3, was considered with the same weight in the different dimensions and subsequently calibrated through EWM and AHP, demonstrating that the ordering of each of the architectures is maintained regardless of the weighting schemes considered. The dimension with the greatest weight was the packet loss dimension (EWM:0.3259 and AHP:0.3751), confirming it as the dimension with the greatest discriminatory capacity in the dataset. In the analysis of the F indicator, it is found that FTTH is preferable for scenario A in all configurations, while FTTR_SMART is preferable in scenarios B and C. The inversion point lies between scenarios A and B, corresponding approximately to 15 to 20 devices simultaneously. This result allows for practical guidance on what type of architecture should be adopted depending on the scenario.
The implementation of this reproducible simulation framework using ns-3.42 allowed us to identify three contributions in this study: Firstly, it simulated three architecture models, with three device density scenarios and two frequencies with five hundred and forty independent runs and independent statistical validation. Secondly, we have established a multi-objective composite F index that integrates energy, QoS and QoE calibrated using AHP and EWM dual weighting, presenting a consistency ratio CR of 0.0074. Finally, the determination of the inversion point between FTTH and FTTR architectures as a function of device density allows for practical guidance, through evidence, for decision-making regarding the architecture to be implemented in smart residential homes.
As future work, it is recommended to include indoor mobility models between SFU and handover events, since this model assumed that the devices were in fixed positions. In addition, empirical validation of the implemented energy model is planned in comparison to commercially available FTTR equipment, since the ONT, AP, MFU, and SFU used nominal values. Finally, it is intended to extend this framework to different housing typologies, buildings with more than one floor, and to analyze the impact of other alternative materials for the walls.
A relevant future extension would be the evaluation of scenarios with Wi-Fi 7, according to IEEE 802.11be, using Multi-Link Operation (MLO), allowing the combination of different bands such as 5 GHz and 6 GHz or even the use of all three frequencies: 2.4 GHz, 5 GHz, and 6 GHz. However, achieving these gains depends on the simultaneous compatibility of the access point and the fact that the STAs support Wi-Fi 7, so integration is relevant.
Author Contributions
Conceptualization, J.D., A.V., S.R. and S.L.; data curation, J.D.; formal analysis: J.D.; investigation, J.D.; methodology, J.D., A.V., F.S., P.L., M.Â.M., S.R. and S.L.; project administration, J.D.; supervision, A.V., F.S., P.L., M.Â.M., S.R. and S.L.; validation, A.V., F.S., P.L., M.Â.M., S.R. and S.L.; visualization, J.D.; writing—original draft, J.D.; writing—review and editing, J.D., A.V., F.S., P.L., M.Â.M., S.R. and S.L. All authors have read and agreed to the published version of the manuscript.
Funding
This research received no external funding.
Data Availability Statement
The original contributions presented in this study are included in the article. Further inquiries can be directed to the corresponding author.
Conflicts of Interest
The authors declare no conflicts of interest.
Abbreviations
The following abbreviations are used in this manuscript:
| AHP | Analytical Hierarchy Process |
| AP | Access Point |
| AR | Augmented Reality |
| BACS | Building Automation and Control Systems |
| BEMS | Building Energy Management Systems |
| C-WAN | Centralized Wi-Fi Access Network |
| D-FSN | Deterministic Full-Fiber Service Network |
| DBA | Dynamic Bandwidth Allocation |
| DDoS | Distributed Denial of Service |
| DWM | Dynamic Wi-Fi Management |
| E2E | End-to-End |
| eFBB | Enhanced Fixed Broadband |
| EWM | Entropy Weight Method |
| F5G | Fifth Generation Fixed Network |
| FFC | Full-Fiber Connection |
| FIP | Fiber In-Premises |
| FTTE | Fiber to the Everywhere and Everything |
| FTTH | Fiber-to-the-Home |
| FTTR | Fiber-to-the-Room |
| GAO | Green Agile Optical |
| GRE | Guaranteed Reliable Experience |
| IFDN | Indoor Fiber Distribution Network |
| MFU | Main FTTR Unit |
| MME | MFU Management Entity |
| MR | Mixed Reality |
| ODN | Optical Distribution Network |
| OLT | Optical Line Terminal |
| OMCI | Optical Network Unit Management and Control Interface |
| ONT | Optical Network Terminal |
| PoF | Power Over Fiber |
| SDO | Standards Development Organizations |
| SFU | Sub FTTR Units |
| SNR | Signal-to-Noise Ratio |
| STA | Station Terminal |
| VHCN | Very High Capacity Network |
| VR | Virtual Reality |
| XR | Extended Reality |
References
- Das, D.K. Integrating IoT and AI for Sustainable Energy-Efficient Smart Building: Potential, Barriers and Strategic Pathways. Sustainability 2025, 17, 10313. [Google Scholar] [CrossRef] [Scilit]
- Sarker, K.U. A systematic review on lightweight security algorithms for a sustainable IoT infrastructure. Discov. Internet Things 2025, 5, 47. [Google Scholar] [CrossRef] [Scilit]
- Vandenbogaerde, L.; Verbeke, S.; Audenaert, A. Optimizing Building Energy Consumption in Office Buildings: A Review of Building Automation and Control Systems and Factors Influencing Energy Savings. J. Build. Eng. 2023, 76, 107233. [Google Scholar] [CrossRef] [Scilit]
- Billanes, J.D.; Ma, Z.G.; Jørgensen, B.N. Data-Driven Technologies for Energy Optimization in Smart Buildings: A Scoping Review. Energies 2025, 18, 290. [Google Scholar] [CrossRef] [Scilit]
- Kozlovska, M.; Petkanic, S.; Vranay, F.; Vranay, D. Enhancing Energy Efficiency and Building Performance through BEMS-BIM Integration. Energies 2023, 16, 6327. [Google Scholar] [CrossRef] [Scilit]
- Delavar, T.; Borgentorp, E.; Junnila, S. The Smart Buildings Revolution: A Comprehensive Review of the Smart Readiness Indicator Literature. Appl. Sci. 2025, 15, 1808. [Google Scholar] [CrossRef] [Scilit]
- Chatzikonstantinidis, K.; Giama, E.; Fokaides, P.A.; Papadopoulos, A.M. Smart Readiness Indicator (SRI) as a Decision-Making Tool for Low Carbon Buildings. Energies 2024, 17, 1406. [Google Scholar] [CrossRef] [Scilit]
- Sesana, M.M.; Salvalai, G.; Della Valle, N.; Melica, G.; Bertoldi, P. Towards Harmonising Energy Performance Certificate Indicators in Europe. J. Build. Eng. 2024, 95, 110323. [Google Scholar] [CrossRef] [Scilit]
- Duobiene, S.; Simniškis, R.; Račiukaitis, G. Enabling Seamless Connectivity: Networking Innovations in Wireless Sensor Networks for Industrial Application. Sensors 2024, 24, 4881. [Google Scholar] [CrossRef] [Scilit]
- Lavric, A.; Petrariu, A.I.; Popa, V. Long Range SigFox Communication Protocol Scalability Analysis Under Large-Scale, High-Density Conditions. IEEE Access 2019, 7, 35816–35825. [Google Scholar] [CrossRef] [Scilit]
- Alsharif, M.H.; Kelechi, A.H.; Jahid, A.; Kannadasan, R.; Singla, M.K.; Gupta, J.; Geem, Z.W. A Comprehensive Survey of Energy-Efficient Computing to Enable Sustainable Massive IoT Networks. Alex. Eng. J. 2024, 91, 12–29. [Google Scholar] [CrossRef] [Scilit]
- Cai, J.; Shen, G.; Li, J.; Bose, S.K.; Zhang, X.; Liu, H.; Wang, X.; Chang, T. Is Fiber-to-the-Room (FTTR) Green?–Modeling and Analysis of Power and Energy Consumption. IEEE Trans. Green Commun. Netw. 2025, 9, 522–535. [Google Scholar] [CrossRef] [Scilit]
- Marotta, A.; Valcarenghi, L.; Kondepu, K.; Centofanti, C.; Rinaldi, C.; Graziosi, F.; Cassioli, D. Fiber To The Room Challenges and Opportunities. In Proceedings of the 2024 16th International Conference on COMmunication Systems & NETworkS (COMSNETS), Bengaluru, India, 3 January 2024; IEEE: Piscataway, NJ, USA, 2024; pp. 1139–1142. [Google Scholar]
- Li, Z.; Zhao, Y.; Li, Y.; Li, H.; Xie, G.; Lin, Y.; Zhang, J. Deterministic Full-Fiber Service Network for the Fifth-Generation Fixed Network (F5G). IEEE Netw. 2023, 37, 189–196. [Google Scholar] [CrossRef] [Scilit]
- Liu, X.; Chi, Y.; Xie, Y.; Zhou, X.; Zhang, J.; Wang, R.; Chen, F.; Wang, M. Survey of Deterministic Network Technologies. In Proceedings of the 2025 8th International Conference on Electronics Technology (ICET), Chengdu, China, 17 May 2025; IEEE: Piscataway, NJ, USA, 2025; pp. 191–196. [Google Scholar]
- Li, Y.; Dong, Y.; Fan, P.; Letaief, K.B. How Far Are Wireless Networks from Being Truly Deterministic? IEEE Internet Things Mag. 2022, 5, 64–71. [Google Scholar] [CrossRef] [Scilit]
- Wijethilaka, S.; Liyanage, M. Survey on Network Slicing for Internet of Things Realization in 5G Networks. IEEE Commun. Surv. Tutor. 2021, 23, 957–994. [Google Scholar] [CrossRef] [Scilit]
- Hillerkuss, D.; Brunner, M.; Jun, Z.; Zhicheng, Y. A Vision Towards F5G Advanced and F6G. In Proceedings of the 2022 13th International Symposium on Communication Systems, Networks and Digital Signal Processing (CSNDSP), Porto, Portugal, 20 July 2022; IEEE: Piscataway, NJ, USA, 2022; pp. 483–487. [Google Scholar]
- Sah, C.B.; Shastri, P.; Dawadi, B.R. The Fifth Generation Fixed Network (F5G): Full-Fiber Access Embracing the Gigabit Era. Adv. Engin. Technol. 2022, 2, 1–9. [Google Scholar] [CrossRef] [Scilit]
- Pesando, L.; Fischer, J.K.; Shariati, B.; Freund, R.; Cananao, J.; Li, H.; Lin, Y.; Ferveur, O.; Jiang, M.; Jin, J.; et al. Standardization of the 5th Generation Fixed Network for Enabling End-to-End Network Slicing and Quality-Assured Services. IEEE Comm. Stand. Mag. 2022, 6, 96–103. [Google Scholar] [CrossRef] [Scilit]
- Karale, A. The Challenges of IoT Addressing Security, Ethics, Privacy, and Laws. Internet Things 2021, 15, 100420. [Google Scholar] [CrossRef] [Scilit]
- Reddy, C.V.K.; Kumar, K.K.; Richayadav; Jha, S.; Kaushik, A.; Siva, T. The Impact of Internet of Things (IoT) on Legal Liability and Regulation. In Proceedings of the 2025 International Conference on Frontier Technologies and Solutions (ICFTS), Chennai, India, 27 March 2025; IEEE: Piscataway, NJ, USA, 2025; pp. 1–7. [Google Scholar]
- Greuter, K.; Sarmah, D.K. The Baseline of Global Consumer Cyber Security Standards for IoT: Quality Evaluation. J. Cyber Secur. Technol. 2022, 6, 175–200. [Google Scholar] [CrossRef] [Scilit]
- Ballo, A.B.; Mamadou, D. A Comprehensive Study of IoT Security Issues and Protocols. Int. J. Comput. Eng. Res. Trends 2023, 10, 8–14. [Google Scholar] [CrossRef] [Scilit]
- Alvarado, R.; Opina, B.; Tellez, J.; Triana, V. Dynamic Bandwidth Allocation with Machine Learning in Dense WiFi Network. Facets 2025, 10, 1–9. [Google Scholar] [CrossRef] [Scilit]
- Szott, S.; Kosek-Szott, K.; Gawlowicz, P.; Gomez, J.T.; Bellalta, B.; Zubow, A.; Dressler, F. Wi-Fi Meets ML: A Survey on Improving IEEE 802.11 Performance With Machine Learning. IEEE Commun. Surv. Tutor. 2022, 24, 1843–1893. [Google Scholar] [CrossRef] [Scilit]
- Liu, X.; Li, J.; Wu, X.; Zhu, J.; Zeng, Y.; Liu, D.; Wang, X.; Zhang, D. Fiber-to-The-Room (FTTR) Technologies for the 5th Generation Fixed Network (F5G) and Beyond. In Proceedings of the 2022 IEEE Future Networks World Forum (FNWF), Montreal, QC, Canada, 12–14 October 2022; IEEE: Piscataway, NJ, USA, 2022; pp. 351–354. [Google Scholar]
- ETSI. The Fifth Generation Fixed Network (F5G): Bringing Fibre to Everywhere and Everything; ETSI White Paper No. 41; ETSI: Sophia Antipolis, France, 2020; pp. 1–24. [Google Scholar]
- ETSI. GR F5G 001 V1.1.1. Fifth Generation Fixed Network (F5G); F5G Generation Definition Release #1; ETSI: Sophia Antipolis, France, 2020; pp. 1–26. [Google Scholar]
- Karahan, S.N.; Güllü, M.; Çımen, S.; Yazar, A.; Osmanca, M.S. AI-Driven Network Slicing for F5G-A Networks: A Framework With Unsupervised Discovery, Temporal Dynamics, and Explainable AI. IEEE Open J. Commun. Soc. 2026, 7, 3360–3378. [Google Scholar] [CrossRef] [Scilit]
- Luo, Y.; Zhang, D.; Effenberger, F.; Zeng, T.; Gan, Y.; Jiang, M. A Use Case Study of Implementing 50G-PON for Fiber-to-the-Room-Business (FTTR-B). In Proceedings of the 2024 Asia Communications and Photonics Conference (ACP) and International Conference on Information Photonics and Optical Communications (IPOC), Beijing, China, 2 November 2024; IEEE: Piscataway, NJ, USA, 2024; pp. 1–6. [Google Scholar]
- Uzunidis, D.; Logothetis, M.; Stavdas, A.; Hillerkuss, D.; Tomkos, I. Fifty Years of Fixed Optical Networks Evolution: A Survey of Architectural and Technological Developments in a Layered Approach. Telecom 2022, 3, 619–674. [Google Scholar] [CrossRef] [Scilit]
- Cai, J.; Zhang, X.; Wang, X.; Chang, T.; Shen, G. Fiber to the Room: Key Technologies, Challenges, and Prospects. arXiv 2025, arXiv:2504.20433. [Google Scholar]
- Li, X.; Liu, Y.; Zhao, Y.; Li, Y.; Li, Z.; Rahman, S.; Zhang, J. End-to-End Service Provisioning Based on Extended Segment Routing in Multi-Domain Optical Networks of F5G. J. Opt. Commun. Netw. 2022, 14, 550. [Google Scholar] [CrossRef] [Scilit]
- Akbar, W.; Vilchez, F.J.; Robles, P.A.; Gifre, L.; Vilalta, R.; De Dios, Ó.G.; Fernández-Palacios, J.P.; Lin, Y.; Zhang, L.; Muñoz, R. A Real-Time Energy-Efficient Monitoring and Management Framework for Sustainability of F5G-Advanced Networks. IEEE Commun. Mag. 2026, 64, 142–147. [Google Scholar] [CrossRef] [Scilit]
- Zhang, D.; Zhu, J.; Liu, X.; Wu, X.; Li, J.; Zeng, Y.; Si, X.; Li, H. Fiber-to-the-Room: A Key Technology for F5G and Beyond. J. Opt. Commun. Netw. 2023, 15, D1. [Google Scholar] [CrossRef] [Scilit]
- Duarte, J.; Serôdio, C.; Pereira, S.D.C.; Santos, F.; Valente, A.; Ramos, S.; Leitão, S. The Evolution of FTTH Networks in Europe and South Korea—Regulatory Power. Telecom 2026, 7, 59. [Google Scholar] [CrossRef] [Scilit]
- Angelov, K.K.; Sadinov, S.M.; Kogias, P. Deployment of Mesh Network in an Indoor Scenario for Application in IoT Communications. IOP Conf. Ser. Mater. Sci. Eng. 2021, 1032, 012004. [Google Scholar] [CrossRef] [Scilit]
- Effenberger, F.; Luo, Y. PON for Fiber to the Room. In Proceedings of the Asia Communications and Photonics Conference 2021; Optica Publishing Group: Shanghai, China, 2021; p. T3C.1. [Google Scholar]
- Wu, X.; Zeng, Y.; Si, X.; Wang, X.; Liu, X. Fiber-To-The-Room (FTTR): Standards and Deployments. In Proceedings of the 2023 Optical Fiber Communications Conference and Exhibition (OFC), San Diego, CA, USA, 5–9 March 2023; IEEE: Piscataway, NJ, USA, 2023; pp. 1–3. [Google Scholar]
- International Telecommunication Union. ITU Recommendation ITU-T G.9940; ITU Publications: Geneva, Switzerland, 2023. [Google Scholar]
- Wang, Y.; Chen, C.; Zheng, H.; Chu, X. Performance of Indoor Small-Cell Networks Under Interior Wall Penetration Losses. IEEE Internet Things J. 2023, 10, 10907–10915. [Google Scholar] [CrossRef] [Scilit]
- Wei, H.; Zeng, Y.; Chen, Y.; Si, X.; Wu, X. Coordinated Multiple AP Wi-Fi Transmision over F5G FTTR. In Proceedings of the 2024 IEEE International Conference on Communications Workshops (ICC Workshops), Denver, CO, USA, 9 June 2024; IEEE: Piscataway, NJ, USA, 2024; pp. 720–725. [Google Scholar]
- Li, Q.; Zhang, D.; Zeng, T. Network Architecture and Use Cases for FTTR in Business Scenarios. In Proceedings of the 2023 International Conference on Advances in Artificial Intelligence and Applications, Wuhan, China, 18 November 2023; ACM: New York, NY, USA, 2023; pp. 332–335. [Google Scholar]
- Zhong, Z.; Li, J.; Zeng, T.; Li, Y.; Shen, G. Cross-Layer Dynamic Bandwidth Allocation in G.Fin Based Centralized Wi-Fi Access Network. In Proceedings of the 2025 Asia Communications and Photonics Conference (ACP), Jiangsu, China, 5 November 2025; IEEE: Piscataway, NJ, USA, 2025; pp. 1–5. [Google Scholar]
- Li, J.; Chen, Y.; Zhong, Z.; Li, Y.; Mukherjee, B.; Shen, G. Resource Allocation for Time-Sensitive Services in Centralized Optical and Wi-Fi Access Networks. IEEE Trans. Netw. Serv. Manag. 2026, 23, 3191–3202. [Google Scholar] [CrossRef] [Scilit]
- Chang, T.; Si, X.; Wang, X.; Chen, Y.; Gan, S.; Caire, G. Wireless Access Technology in FTTR Next Generation Home Networks: An Overview. IEEE Wirel. Commun. 2023, 30, 44–49. [Google Scholar] [CrossRef] [Scilit]
- ITU. ITU-T G Suppl. 89: Coordinated Management of Access and Fibre in Premises Networks; ITU: Geneva, Switzerland, 2025. [Google Scholar]
- Matsuura, M. Power-Over-Fiber Using Double-Clad Fibers. J. Light. Technol. 2022, 40, 3187–3196. [Google Scholar] [CrossRef] [Scilit]
- Vatsa, S.V.; Gp, A.; Roy, R.; Anand, S.; Kumar, A.; Kuri, J. Multi-AP Coordination with Centralized Overlay Time-Sliced Scheduling in WiFi Network. In Proceedings of the 2024 16th International Conference on COMmunication Systems & NETworkS (COMSNETS), Bengaluru, India, 3 January 2024; IEEE: Piscataway, NJ, USA, 2024; pp. 276–278. [Google Scholar]
- Afonso, J.A.; Monteiro, V.; Afonso, J.L. Internet of Things Systems and Applications for Smart Buildings. Energies 2023, 16, 2757. [Google Scholar] [CrossRef] [Scilit]
- Floris, A.; Porcu, S.; Girau, R.; Atzori, L. An IoT-Based Smart Building Solution for Indoor Environment Management and Occupants Prediction. Energies 2021, 14, 2959. [Google Scholar] [CrossRef] [Scilit]
- Taboada-Orozco, A.; Yetongnon, K.; Nicolle, C. Smart Buildings: A Comprehensive Systematic Literature Review on Data-Driven Building Management Systems. Sensors 2024, 24, 4405. [Google Scholar] [CrossRef] [Scilit]
- Dash, B.K.; Peng, J. Zigbee Wireless Sensor Networks: Performance Study in an Apartment-Based Indoor Environment. J. Comput. Netw. Commun. 2022, 2022, 1–14. [Google Scholar] [CrossRef] [Scilit]
- Chaudhari, P.; Xiao, Y.; Cheng, M.M.-C.; Li, T. Fundamentals, Algorithms, and Technologies of Occupancy Detection for Smart Buildings Using IoT Sensors. Sensors 2024, 24, 2123. [Google Scholar] [CrossRef] [Scilit]
- Akbulut, L.; Taşdelen, K.; Atılgan, A.; Malinowski, M.; Coşgun, A.; Şenol, R.; Akbulut, A.; Petryk, A. A Systematic Review of Building Energy Management Systems (BEMSs): Sensors, IoT, and AI Integration. Energies 2025, 18, 6522. [Google Scholar] [CrossRef] [Scilit]
- Qiang, G.; Tang, S.; Hao, J.; Di Sarno, L.; Wu, G.; Ren, S. Building Automation Systems for Energy and Comfort Management in Green Buildings: A Critical Review and Future Directions. Renew. Sustain. Energy Rev. 2023, 179, 113301. [Google Scholar] [CrossRef] [Scilit]
- Zeng, T.; Li, Q.; Li, H.; Zhang, D.; Jiang, M. China Telecom’s Research and Applications of Business-Enterprise Full-Optical Networking. IEEE Access 2023, 11, 55824–55833. [Google Scholar] [CrossRef] [Scilit]
- Lorincz, J.; Čusto, E.; Begušić, D. A Comprehensive Analysis of Methods for Improving and Estimating Energy Efficiency of Passive and Active Fiber-to-the-Home Optical Access Networks. Sensors 2025, 25, 6012. [Google Scholar] [CrossRef] [Scilit]
- Gu, R.; Wang, G.; Li, Z.; Ji, Y. Energy and Transmission Efficiency Enhancement in Passive Optical Network Enabled Reconfigurable Fronthaul Supporting Smart Homes. Sensors 2020, 20, 6245. [Google Scholar] [CrossRef] [Scilit]
- Dembélé, H.; Tohme, E.; Colin, R. Assessing and Modeling the Energy Consumption of PoE-Powered WiFi Access Point. IEEE Access 2023, 11, 74796–74804. [Google Scholar] [CrossRef] [Scilit]
- Bytyqi, S.; Jashari, B. Experimental Assessment of the Effects of Building Materials on Wi-Fi Signal 2.4 GHz and 5 GHz. JCC 2024, 12, 1–10. [Google Scholar] [CrossRef]
- Zan, M.; Cai, J.; Yu, S.; Li, J.; Shen, G. Traffic-Aware Energy-Saving Mechanism in the FTTR Network. In Proceedings of the 2024 Asia Communications and Photonics Conference (ACP) and International Conference on Information Photonics and Optical Communications (IPOC), Beijing, China, 2 November 2024; IEEE: Piscataway, NJ, USA, 2024; pp. 1–3. [Google Scholar]
- Ramadan, Z.; Yulindon, Y.; Yustini, Y.; Asril, A.A. Installation and Activation of Fiber To The Home (FTTH) Network Using Gigabit Passive Optical Network (GPON) Technology and Quality of Service (QoS) Analysis. J. Appropr. Technol. Agric. Environ. Dev. 2024, 2, 17–24. [Google Scholar] [CrossRef] [Scilit]
- Kowalik, K.; Andruloniw, P.; Partyka, B.; Zwierzykowski, P. Telecom Operator’s Approach to QoE. J. Telecommun. Inf. Technol. 2022, 2, 26–34. [Google Scholar] [CrossRef] [Scilit]
- Ali, A.M.; Hassan, M.R.; al-Qerem, A.; Hamarsheh, A.; Al-Qawasmi, K.; Aljaidi, M.; Abu-Khadrah, A.; Kaiwartya, O.; Lloret, J. Towards a Smart Environment: Optimization of WLAN Technologies to Enable Concurrent Smart Services. Sensors 2023, 23, 2432. [Google Scholar] [CrossRef] [Scilit]
- Minoli, D.; Sohraby, K.; Occhiogrosso, B. IoT Considerations, Requirements, and Architectures for Smart Buildings—Energy Optimization and Next-Generation Building Management Systems. IEEE Internet Things J. 2017, 4, 269–283. [Google Scholar] [CrossRef] [Scilit]
- Ożadowicz, A. Generic IoT for Smart Buildings and Field-Level Automation—Challenges, Threats, Approaches, and Solutions. Computers 2024, 13, 45. [Google Scholar] [CrossRef] [Scilit]
- Daengsi, T.; Wuttidittachotti, P. QoE Modeling for Voice over IP: Simplified E-Model Enhancement Utilizing the Subjective MOS Prediction Model: A Case of G.729 and Thai Users. J. Netw. Syst. Manag. 2019, 27, 837–859. [Google Scholar] [CrossRef] [Scilit]
- Metzger, F.; Geißler, S.; Grigorjew, A.; Loh, F.; Moldovan, C.; Seufert, M.; Hoßfeld, T. An Introduction to Online Video Game QoS and QoE Influencing Factors. IEEE Commun. Surv. Tutor. 2022, 24, 1894–1925. [Google Scholar] [CrossRef] [Scilit]
- Van Damme, S.; Sameri, J.; Schwarzmann, S.; Wei, Q.; Trivisonno, R.; De Turck, F.; Torres Vega, M. Impact of Latency on QoE, Performance, and Collaboration in Interactive Multi-User Virtual Reality. Appl. Sci. 2024, 14, 2290. [Google Scholar] [CrossRef] [Scilit]
- IEEE Std 802.11ax-2021; IEEE Standard for Information Technology—Telecommunications and Information Exchange between Systems—Part 11: Wireless LAN MAC and PHY Specifications—Amendment 1: Enhancements for High-Efficiency WLAN. IEEE Standards Association. IEEE: New York, NY, USA, 2021.
- ITU. ITU Recommendation ITU-R P.1238-12; ITU Publications: Geneva, Switzerland, 2023. [Google Scholar]
- Mayor, V.; Estepa, R.; Estepa, A.; Madinabeitia, G. Energy-Efficient UAVs Deployment for QoS-Guaranteed VoWiFi Service. Sensors 2020, 20, 4455. [Google Scholar] [CrossRef] [Scilit]
- ITU. ITU Recommendation ITU-T Y.1541; ITU Publications: Geneva, Switzerland, 2011. [Google Scholar]
- ETSI. Telecommunications and Internet Protocol Harmonization over Networks (TIPHON) Release 3; End-to-End Quality of Service in TIPHON Systems; Part 1: General Aspects of Quality of Service (QoS); ETSI TR 101 329-1 V3.1.2; ETSI: Sophia Antipolis, France, 2002; pp. 1–19. [Google Scholar]
- Fiedler, M.; Hossfeld, T.; Tran-Gia, P. A Generic Quantitative Relationship between Quality of Experience and Quality of Service. IEEE Netw. 2010, 24, 36–41. [Google Scholar] [CrossRef] [Scilit]
- International Telecommunication Union. ITU Recommendation ITU-T G.107; ITU Publications: Geneva, Switzerland, 2015. [Google Scholar]
- Greco, S.; Ishizaka, A.; Tasiou, M.; Torrisi, G. On the Methodological Framework of Composite Indices: A Review of the Issues of Weighting, Aggregation, and Robustness. Soc. Indic. Res. 2019, 141, 61–94. [Google Scholar] [CrossRef] [Scilit]
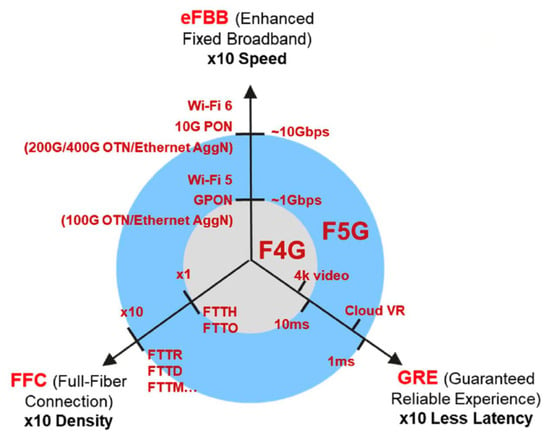
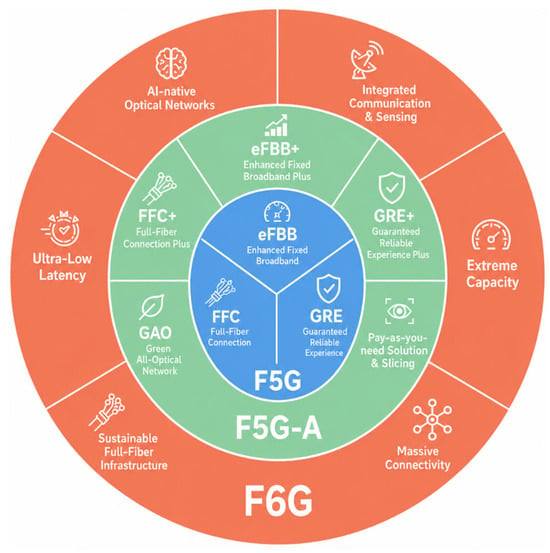
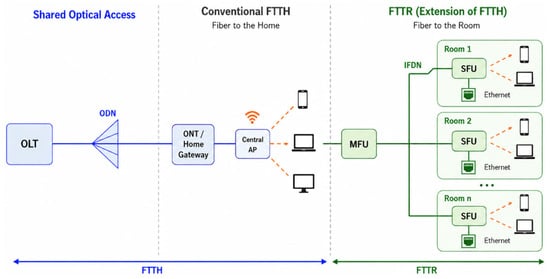
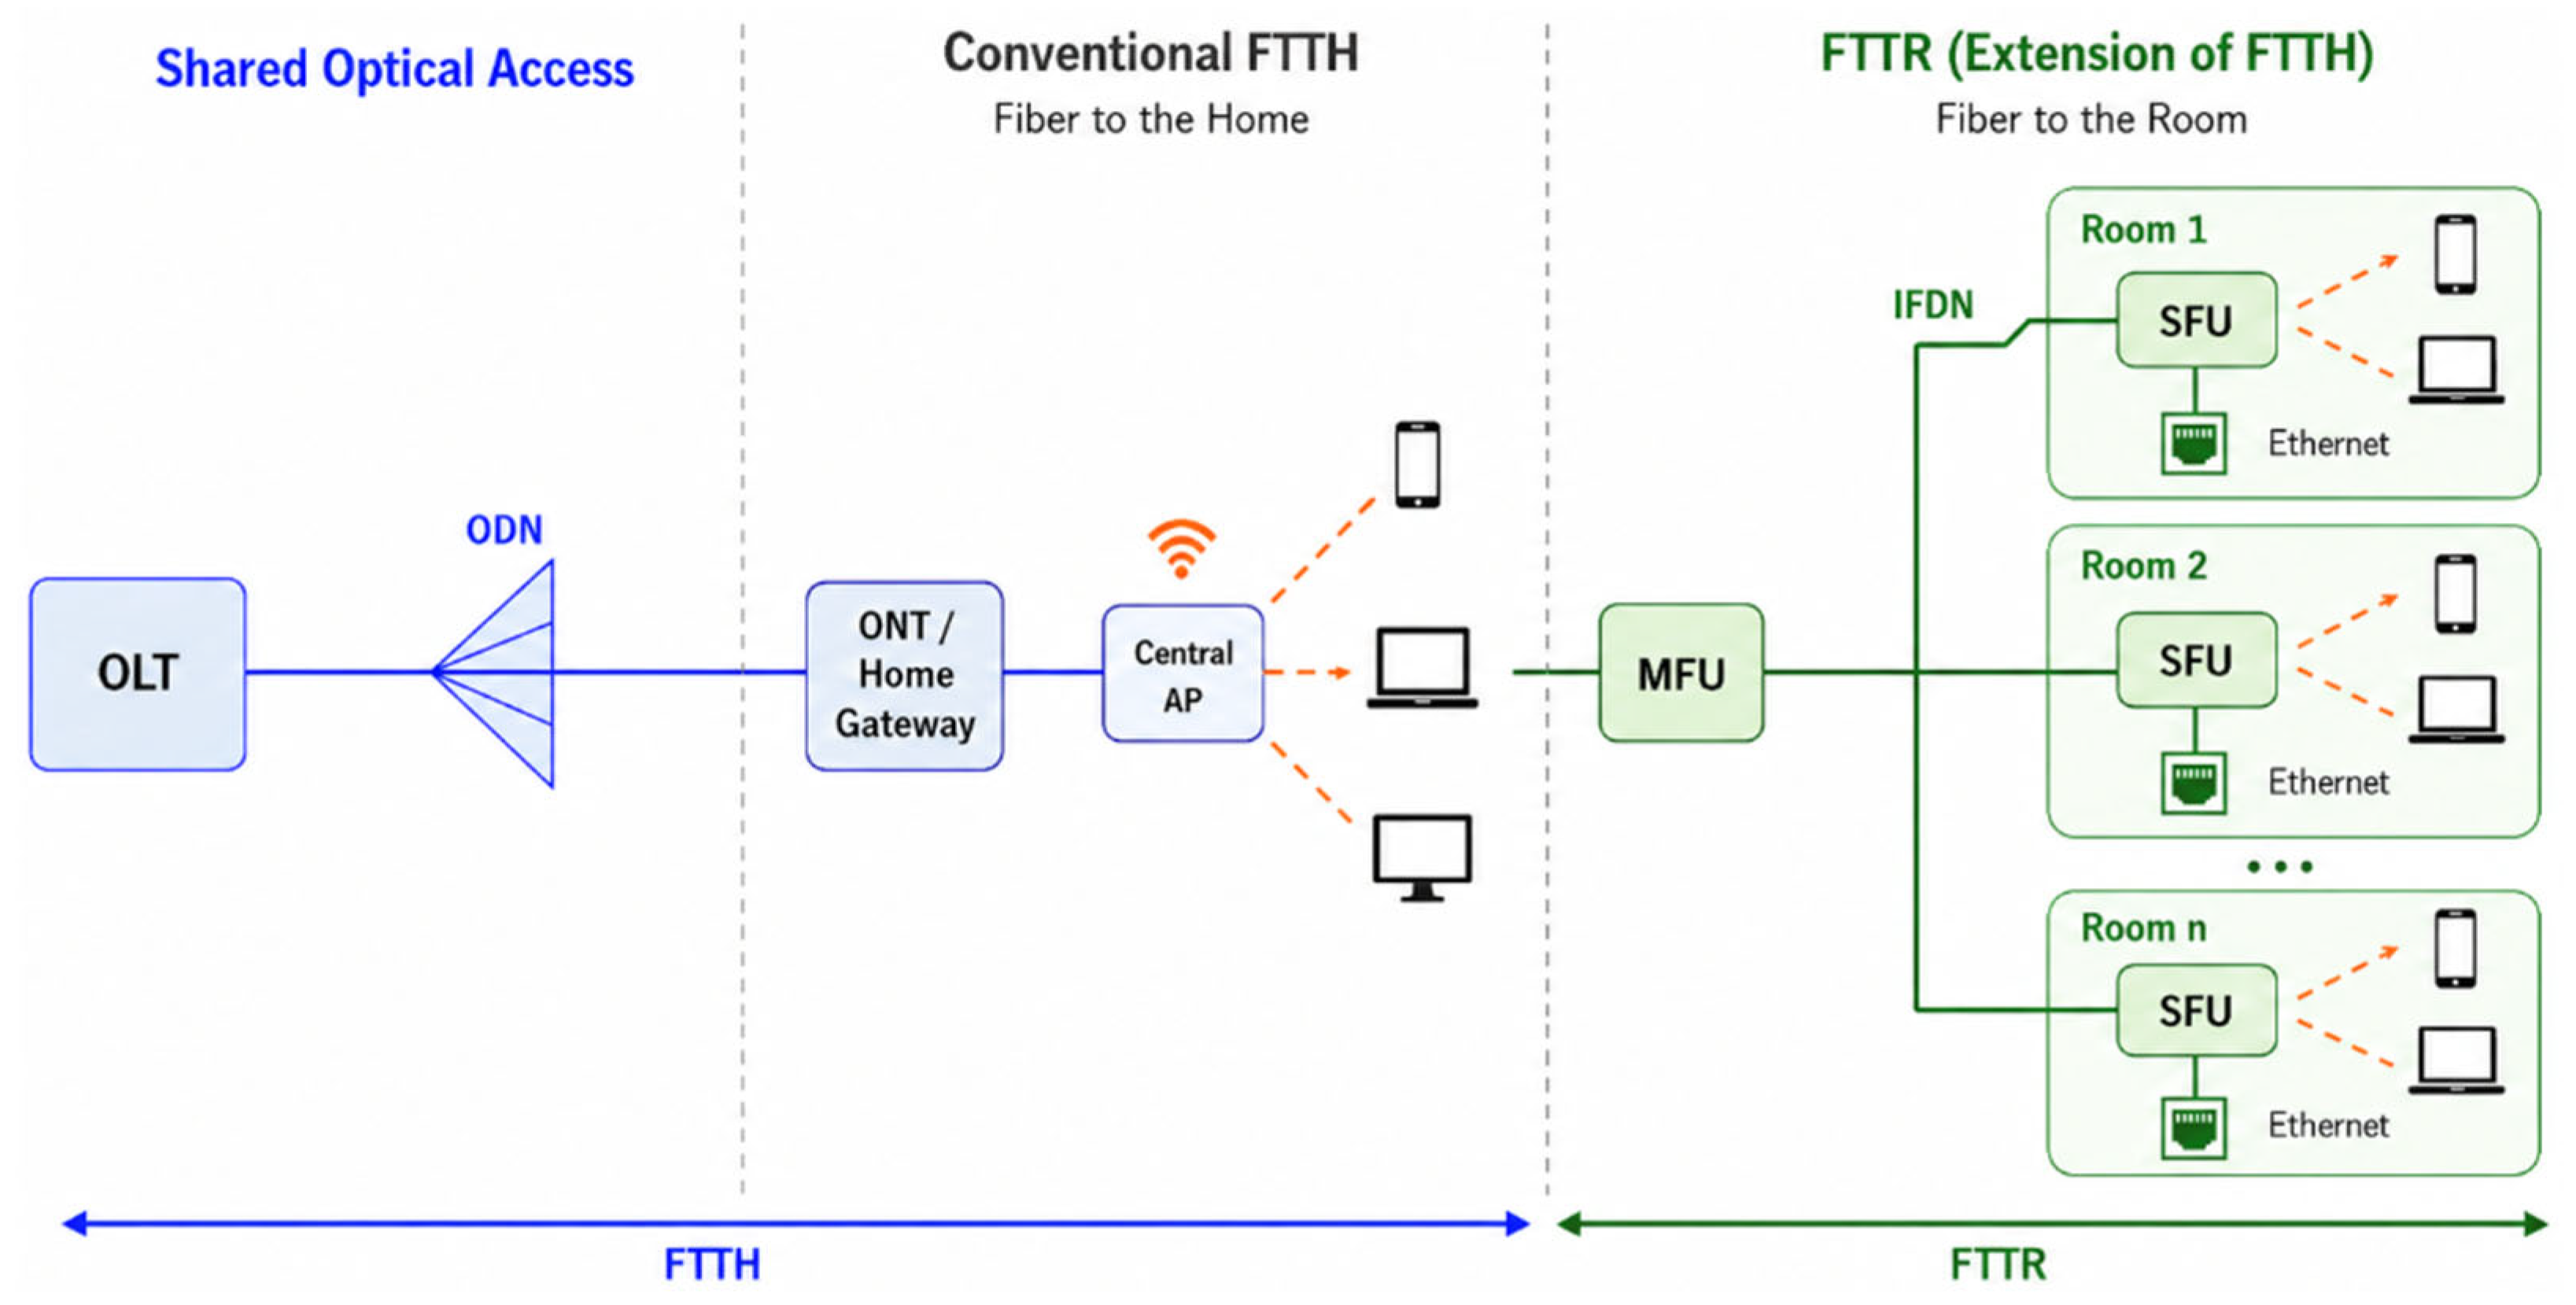
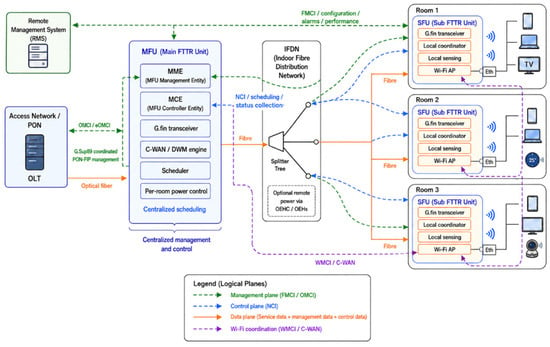
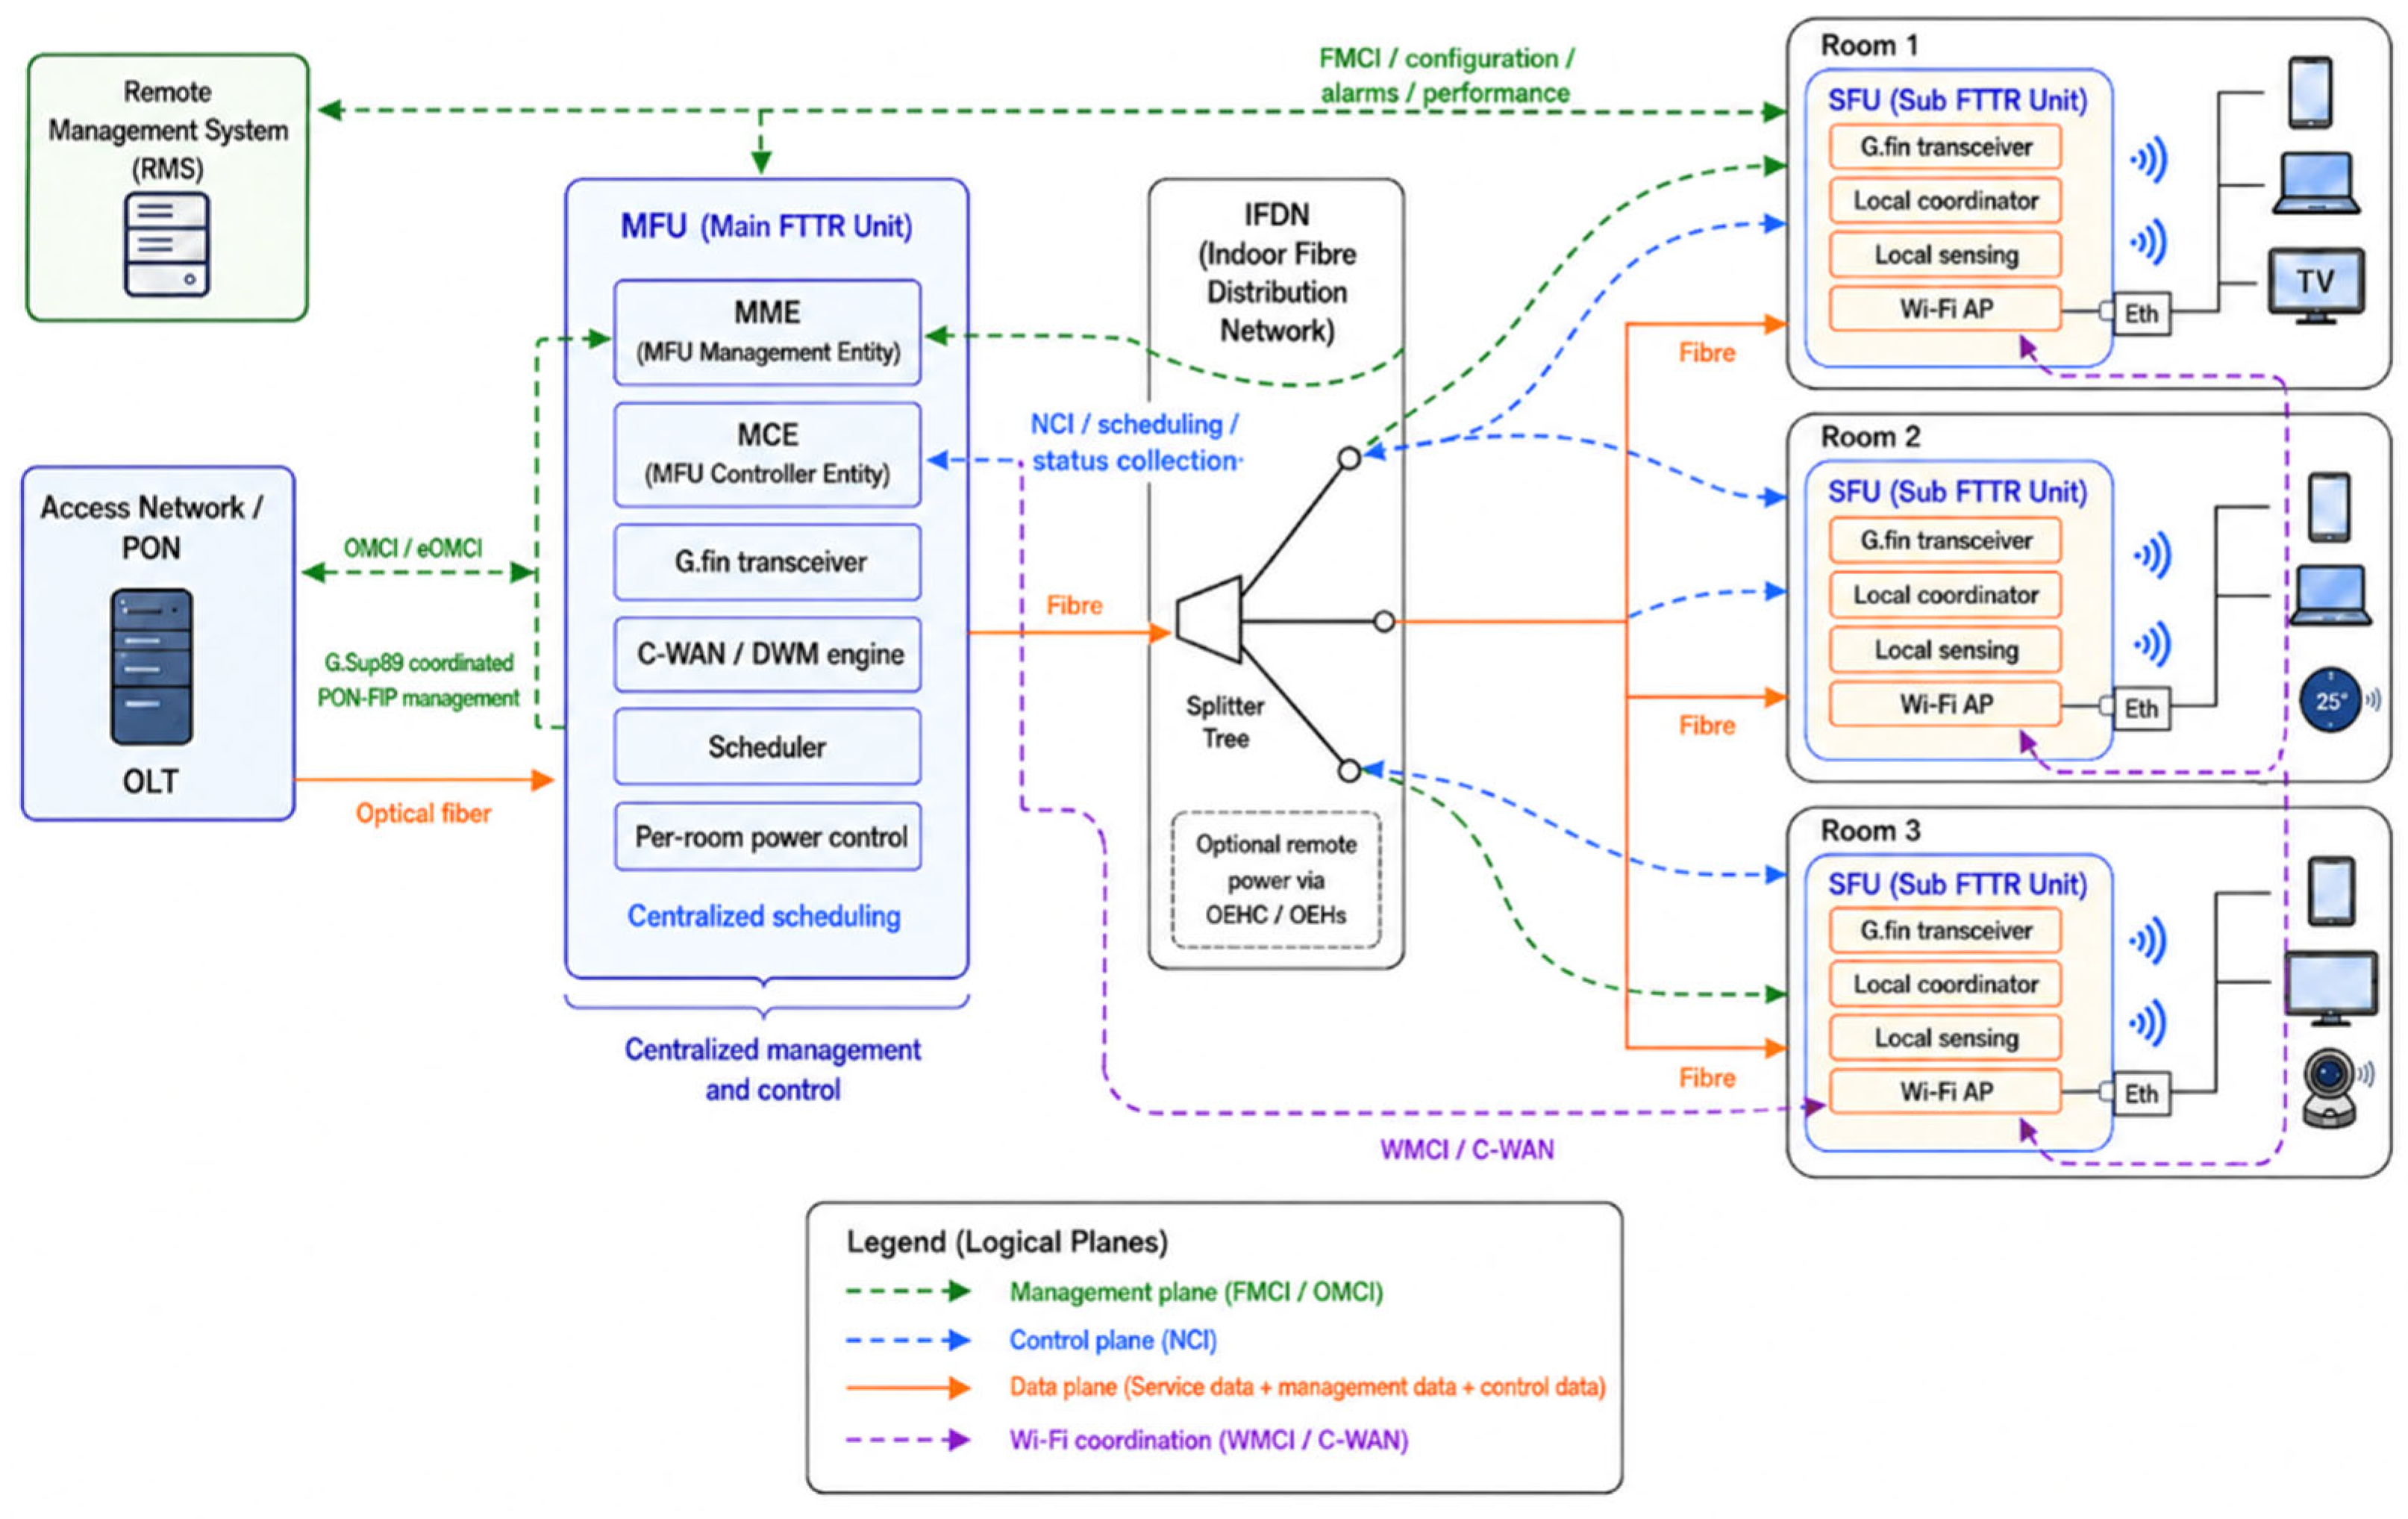
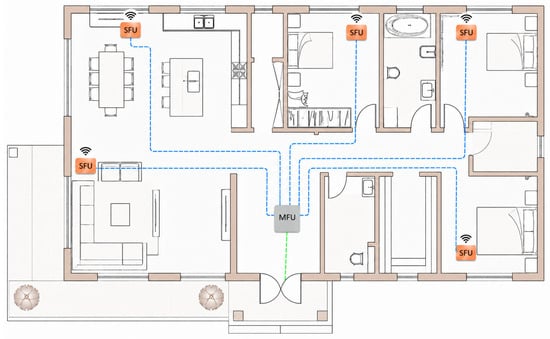
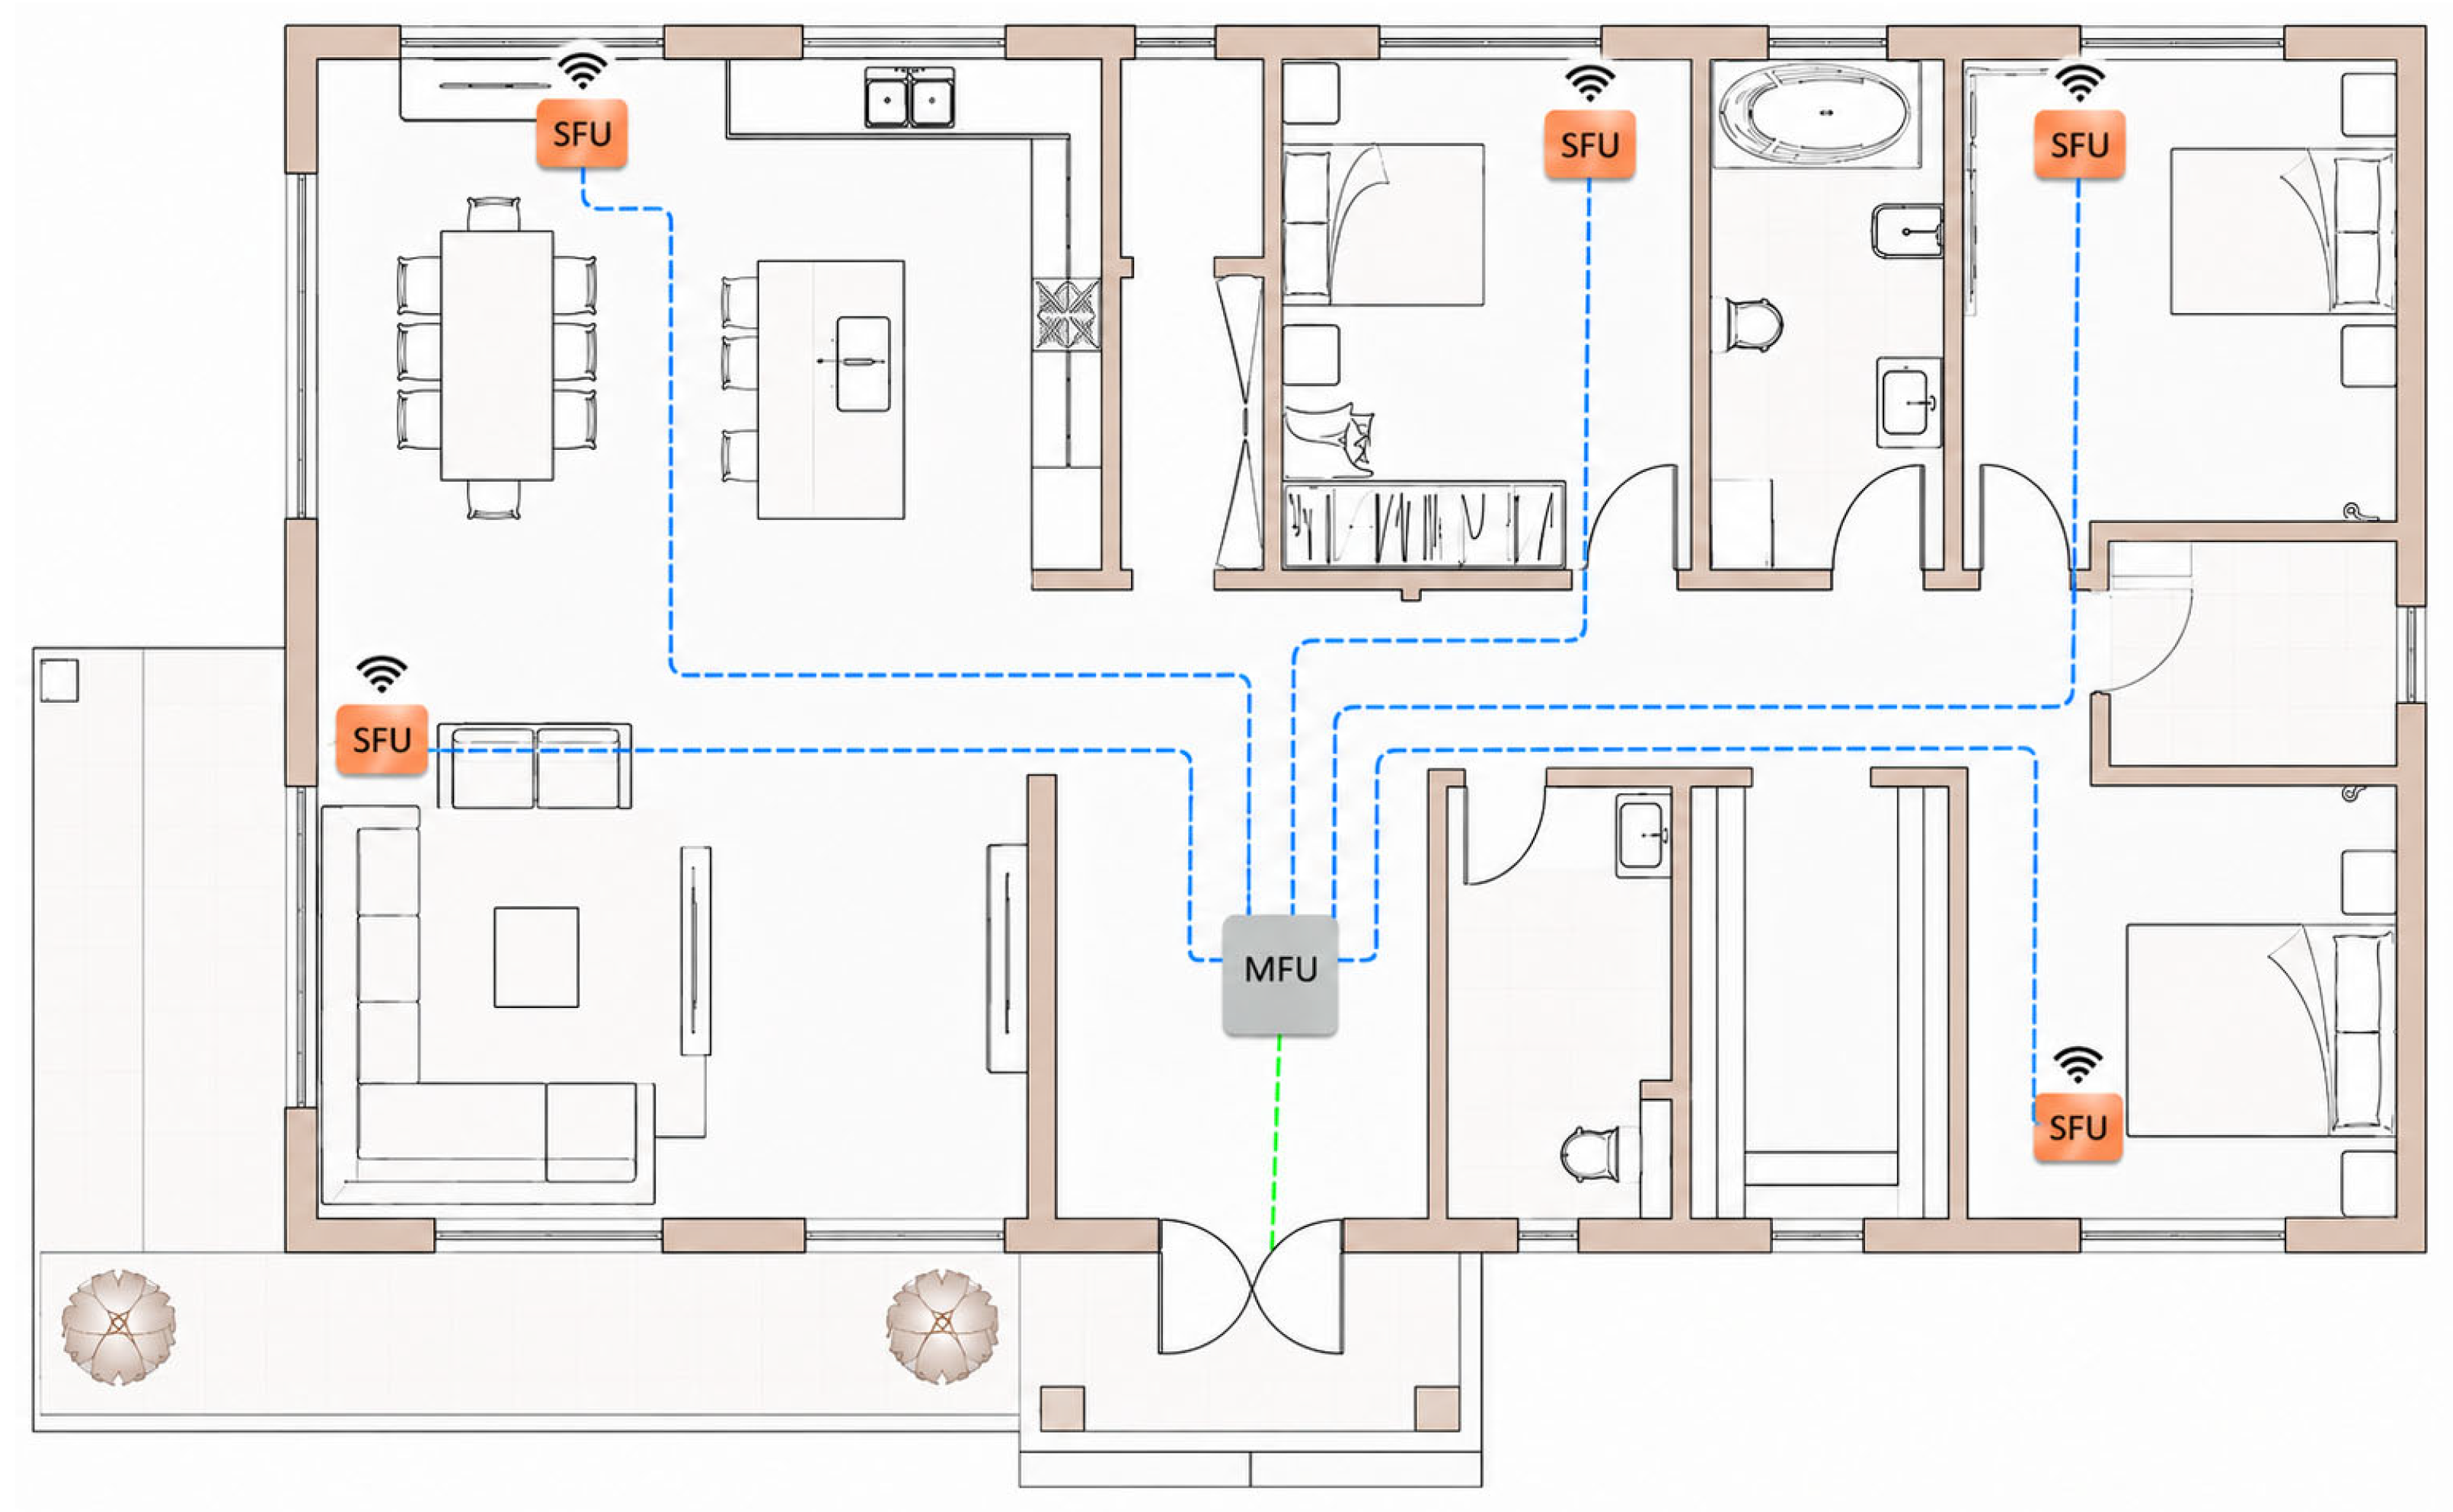
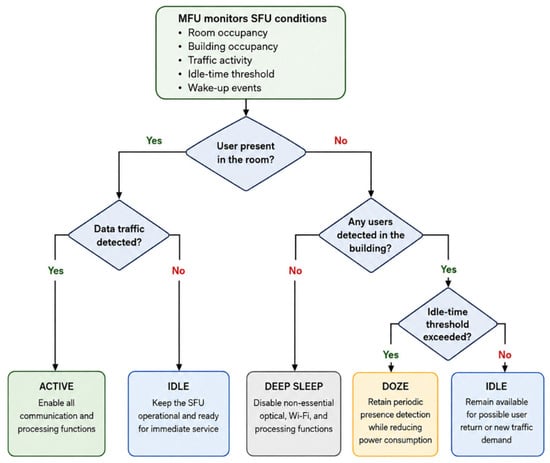
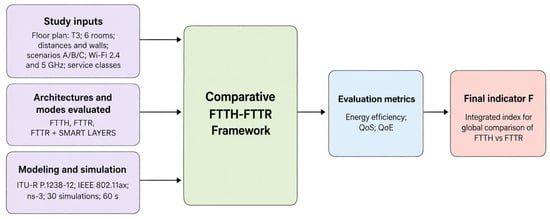
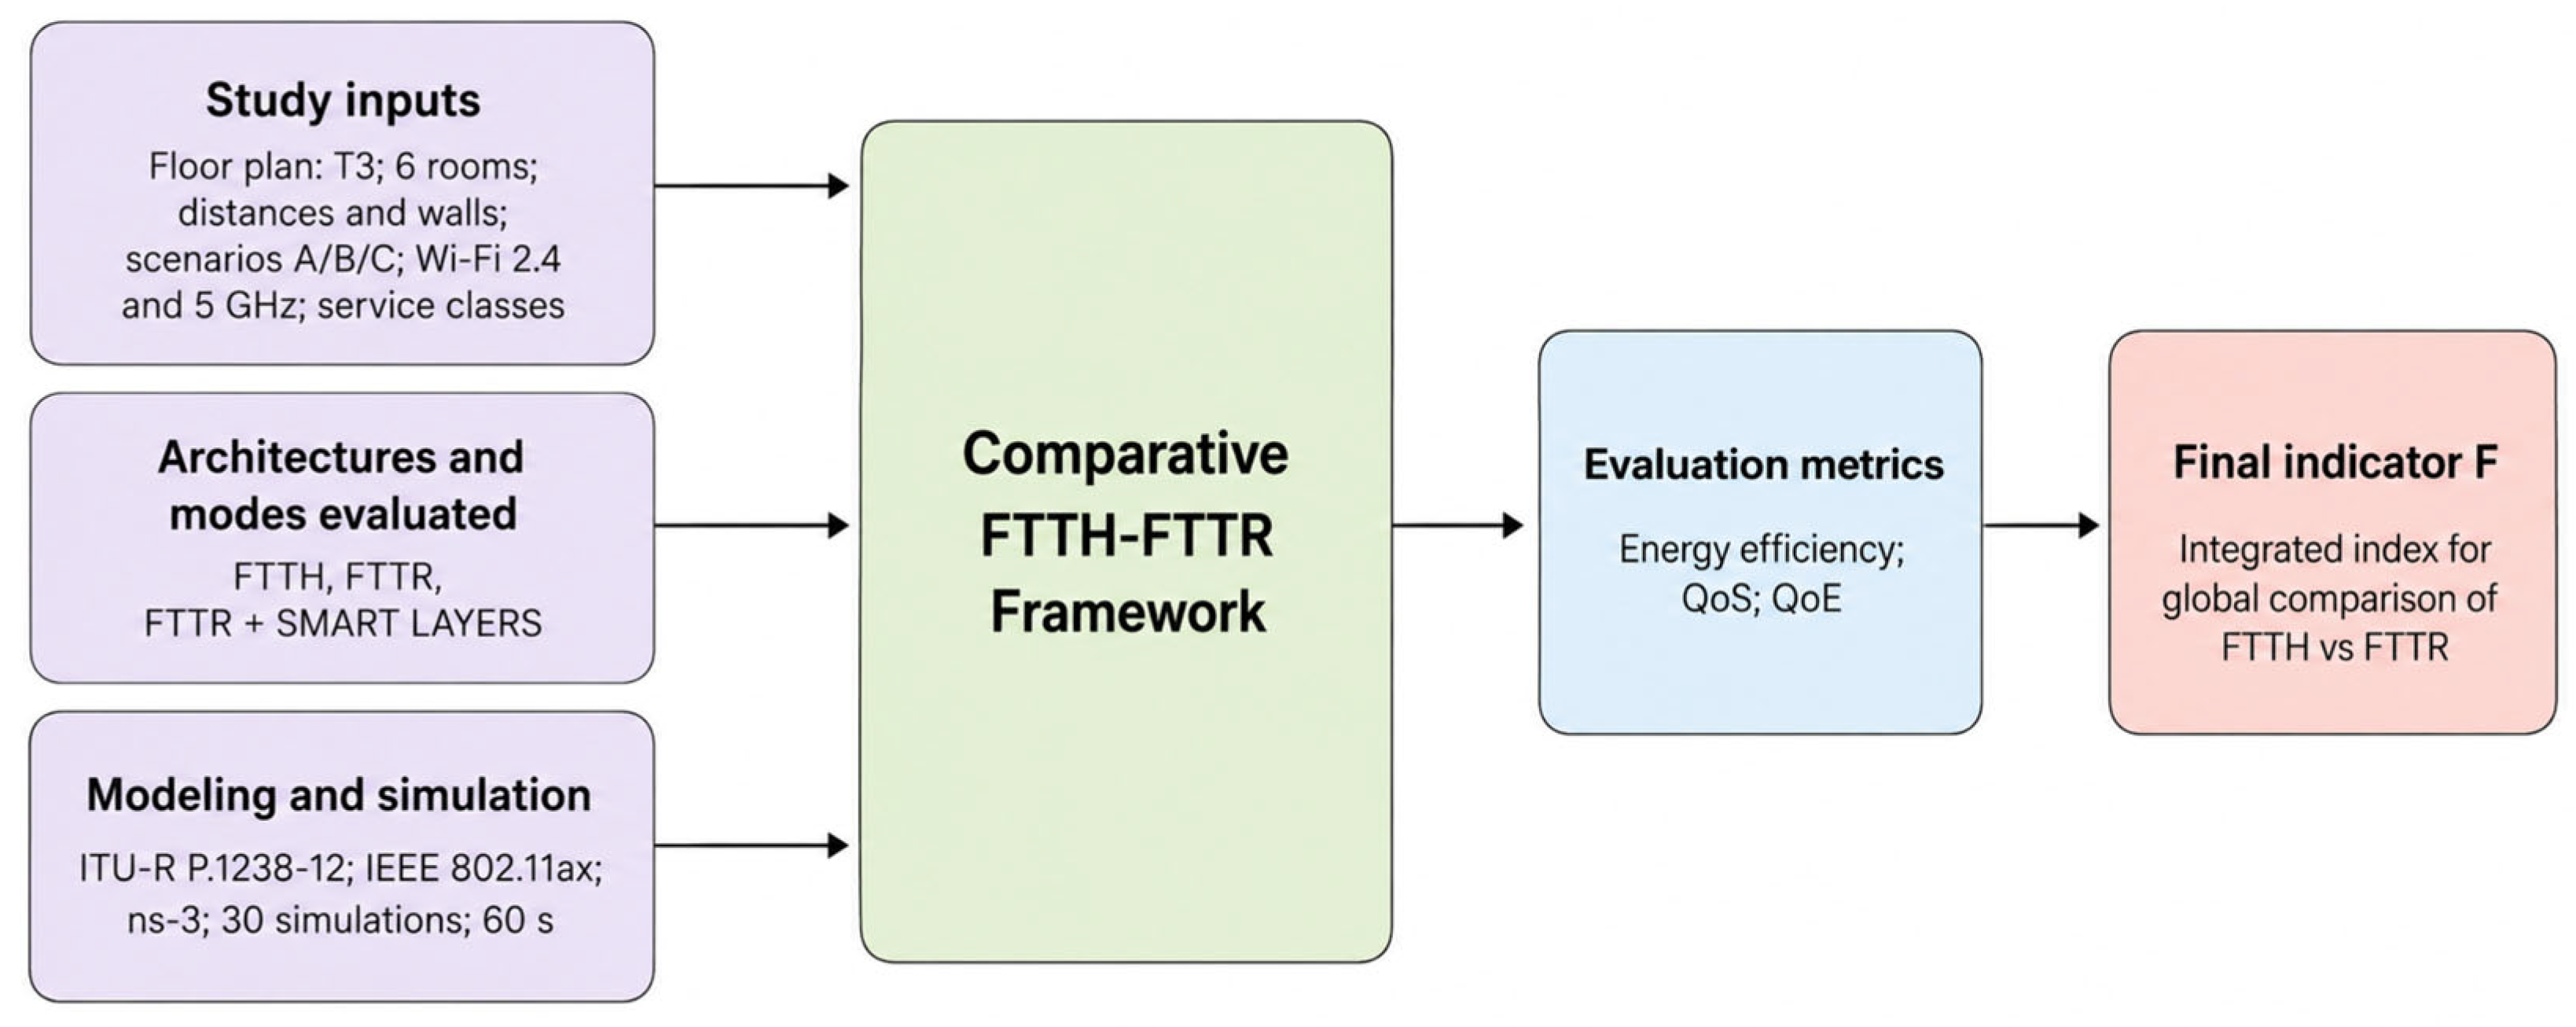
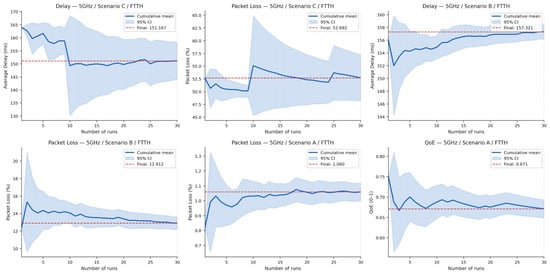
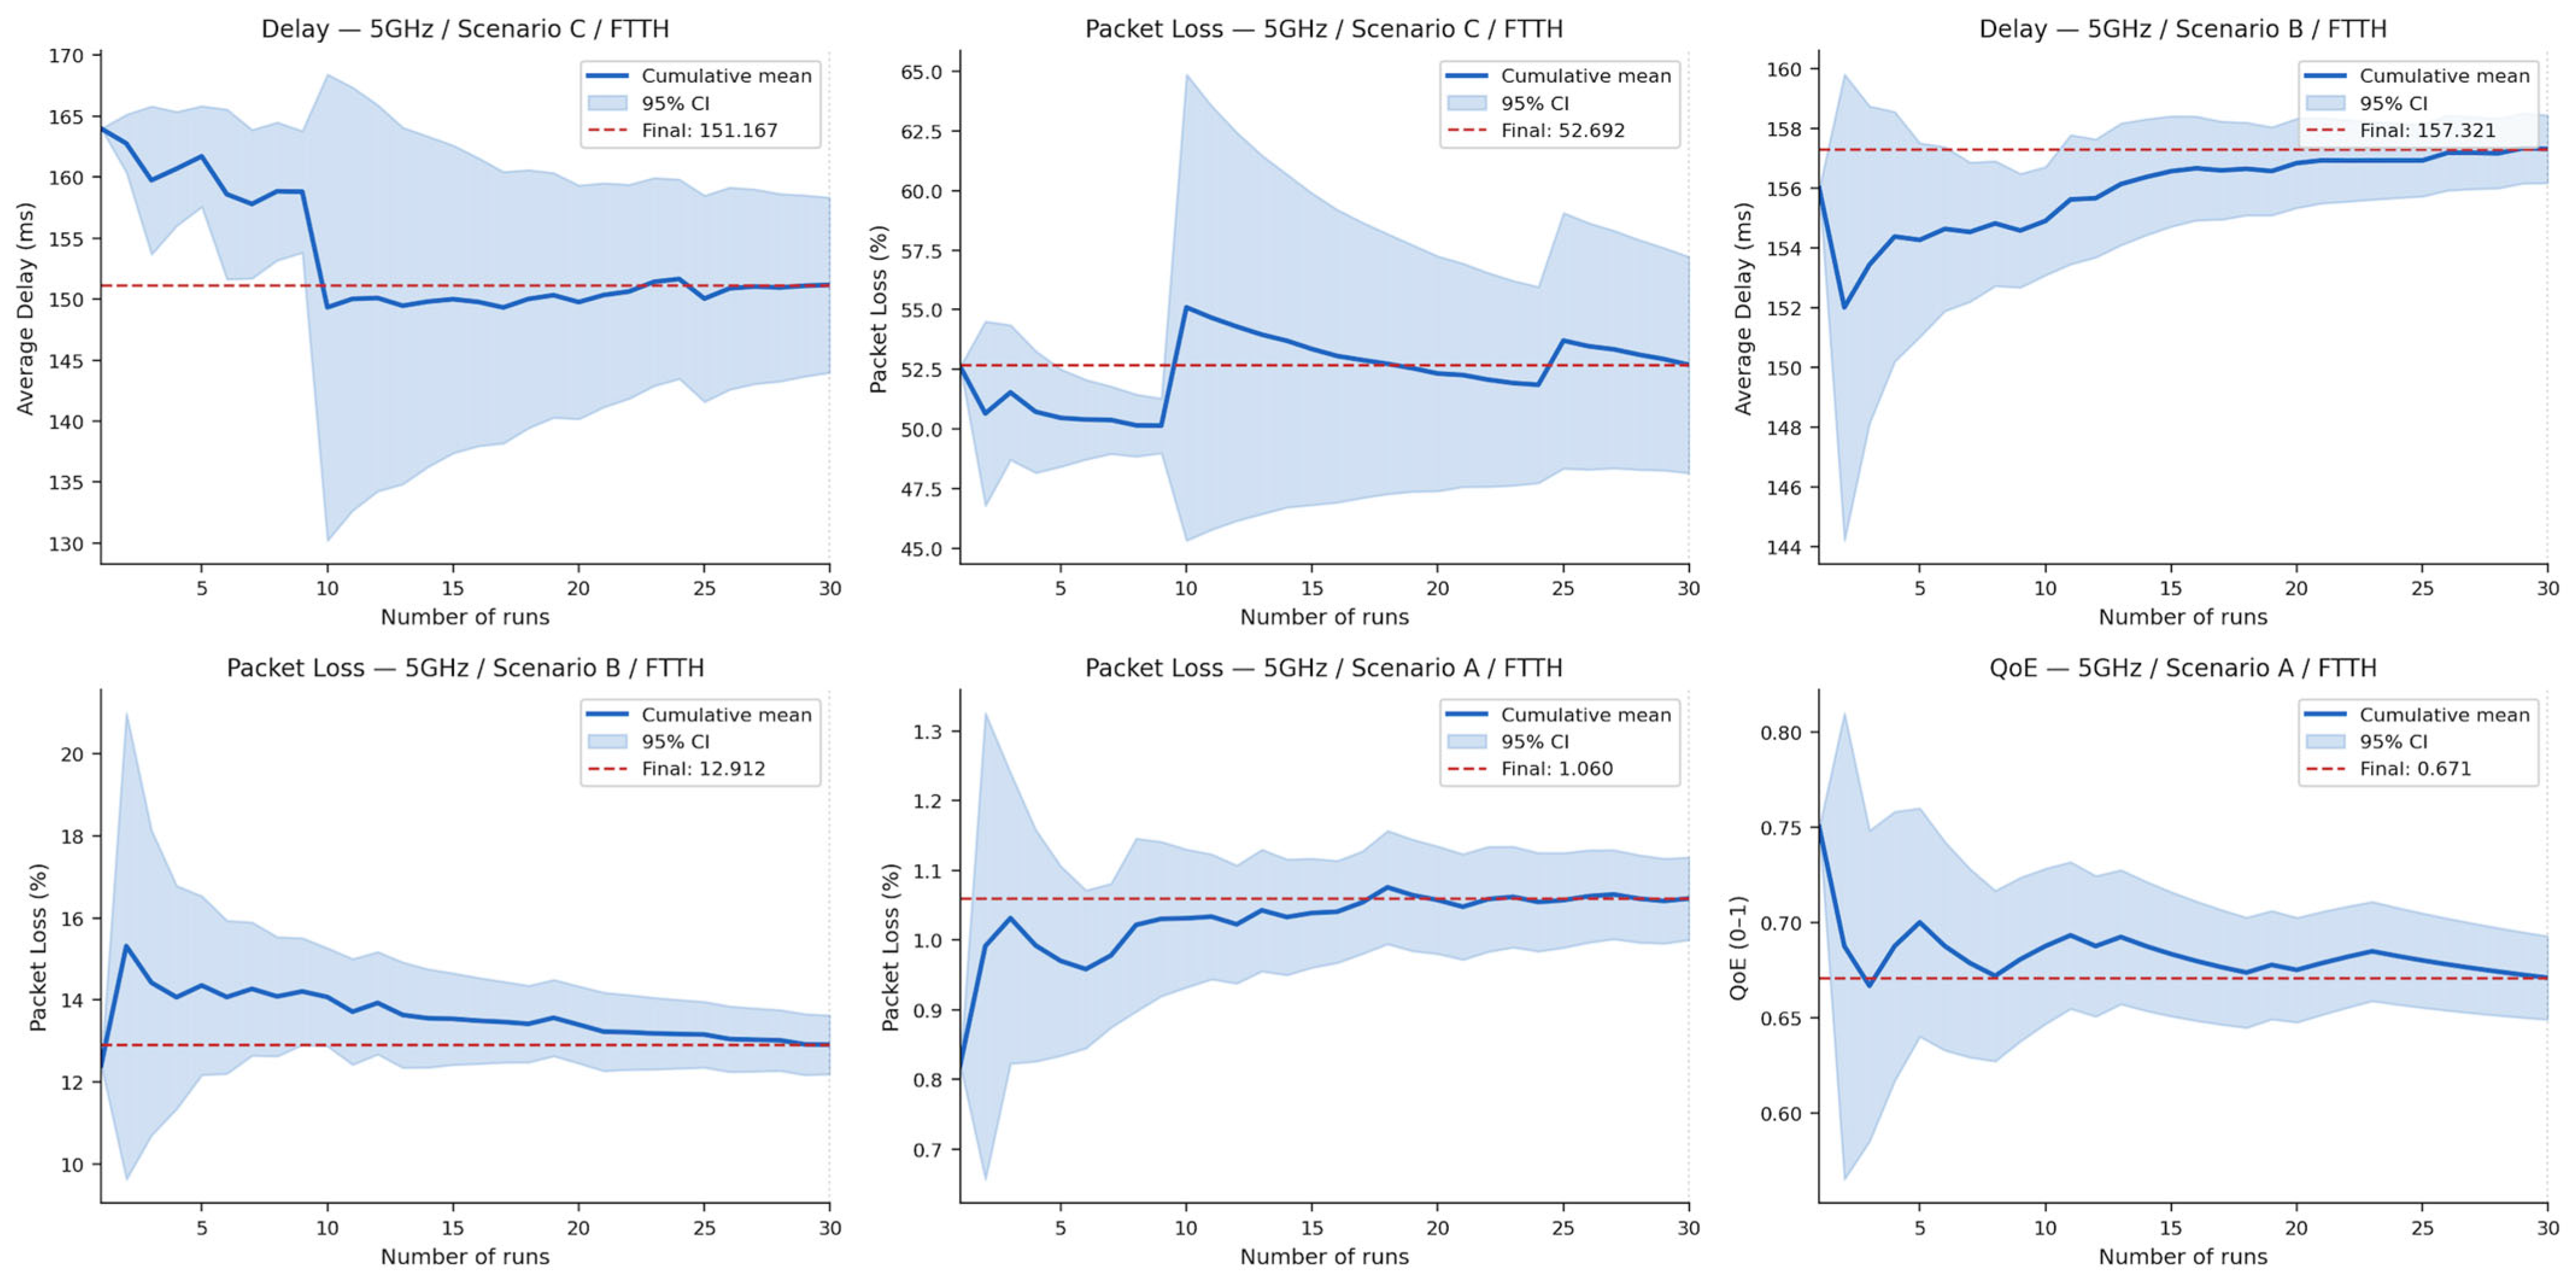
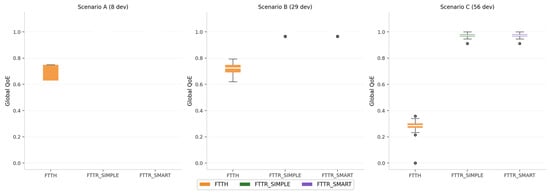
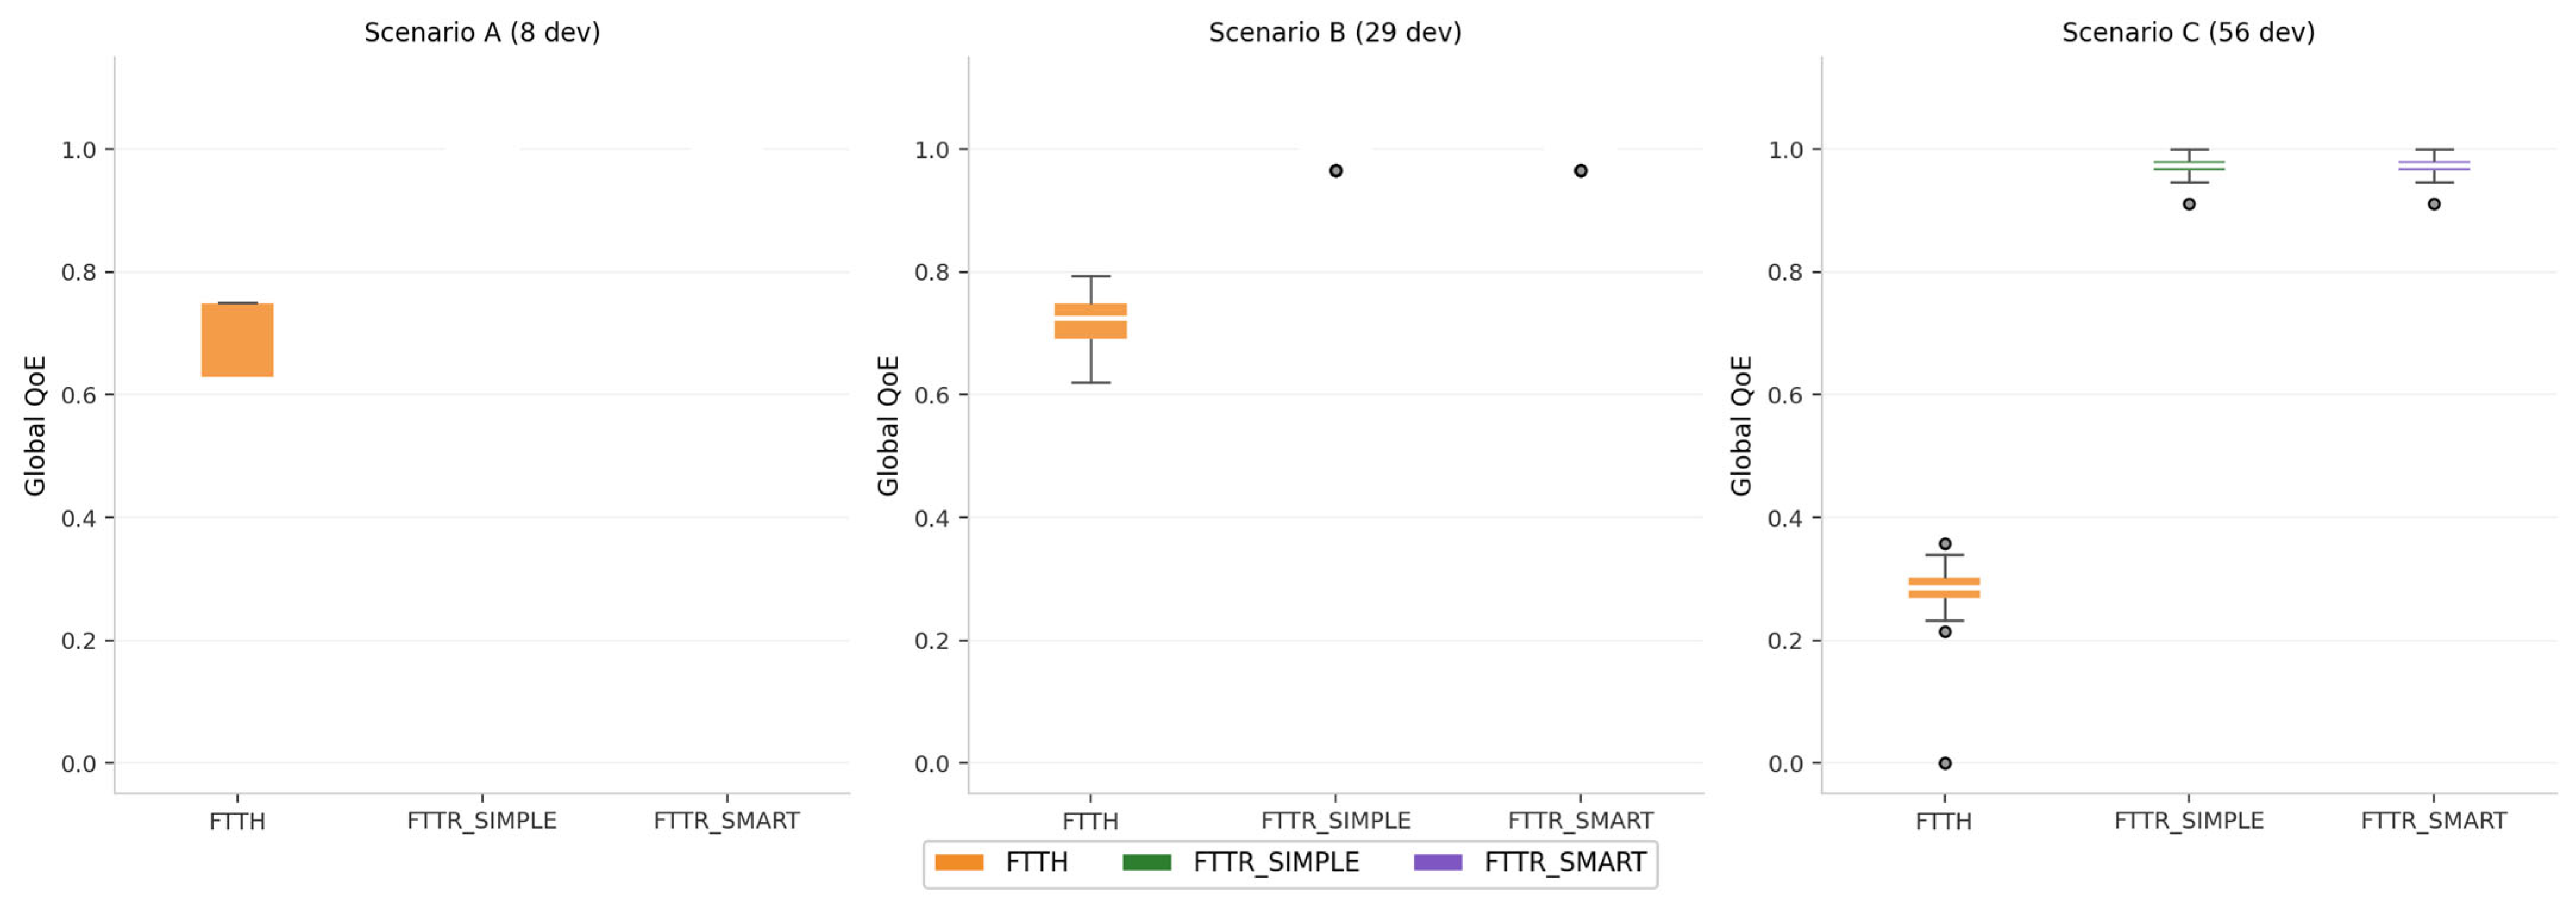
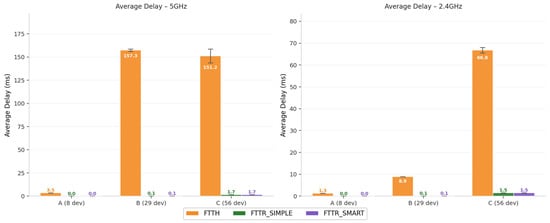
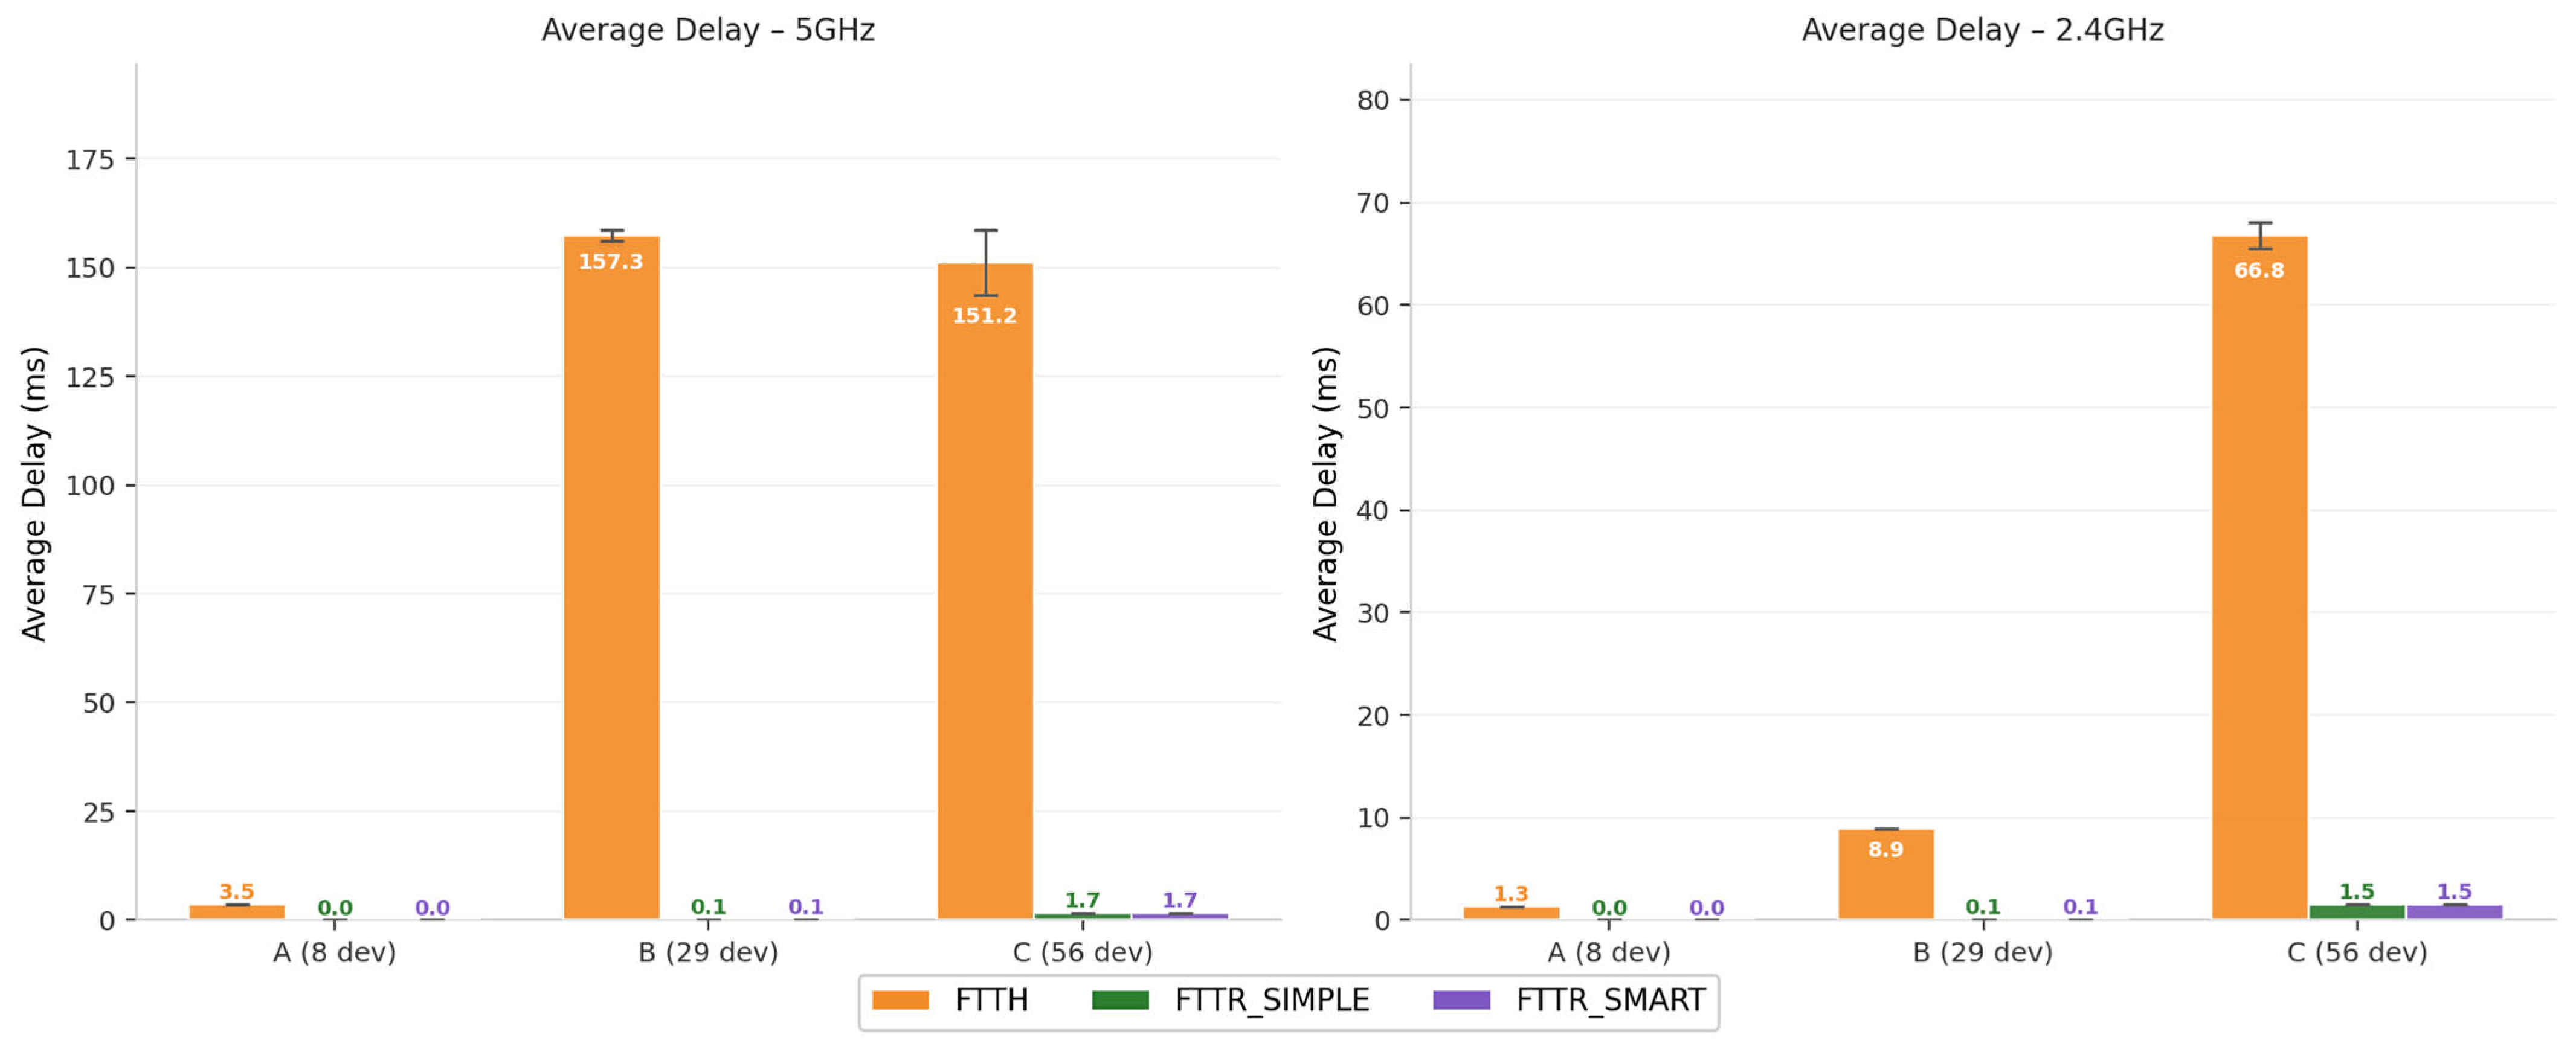
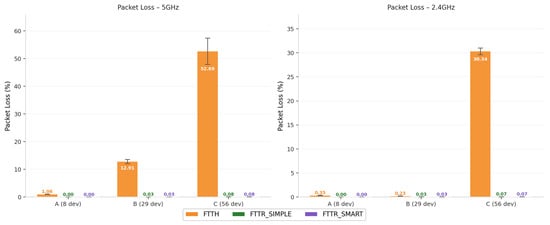
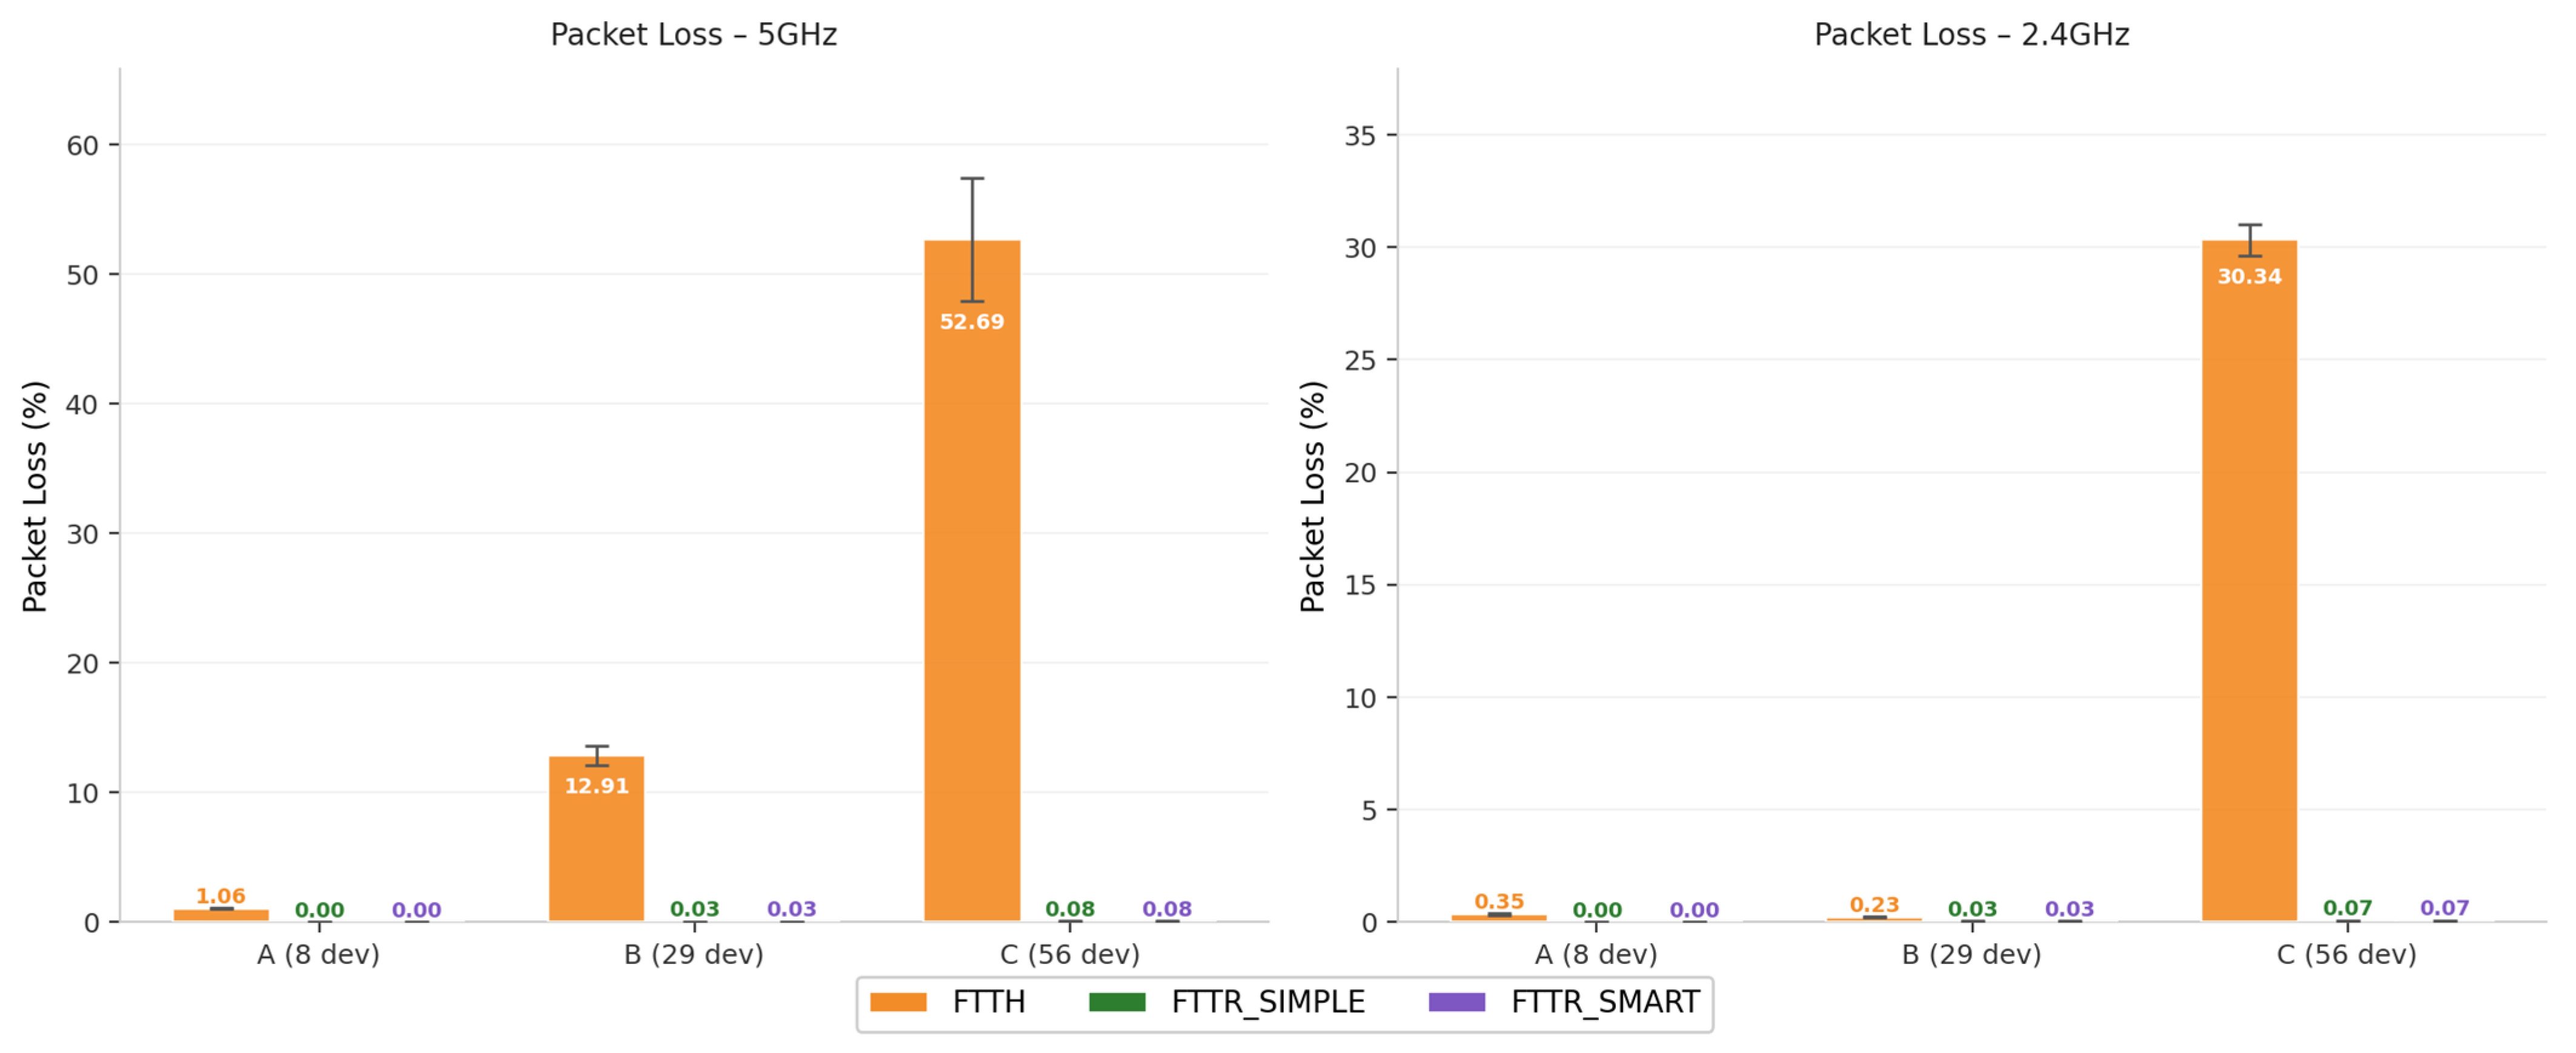
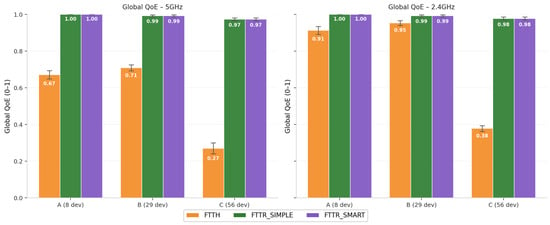
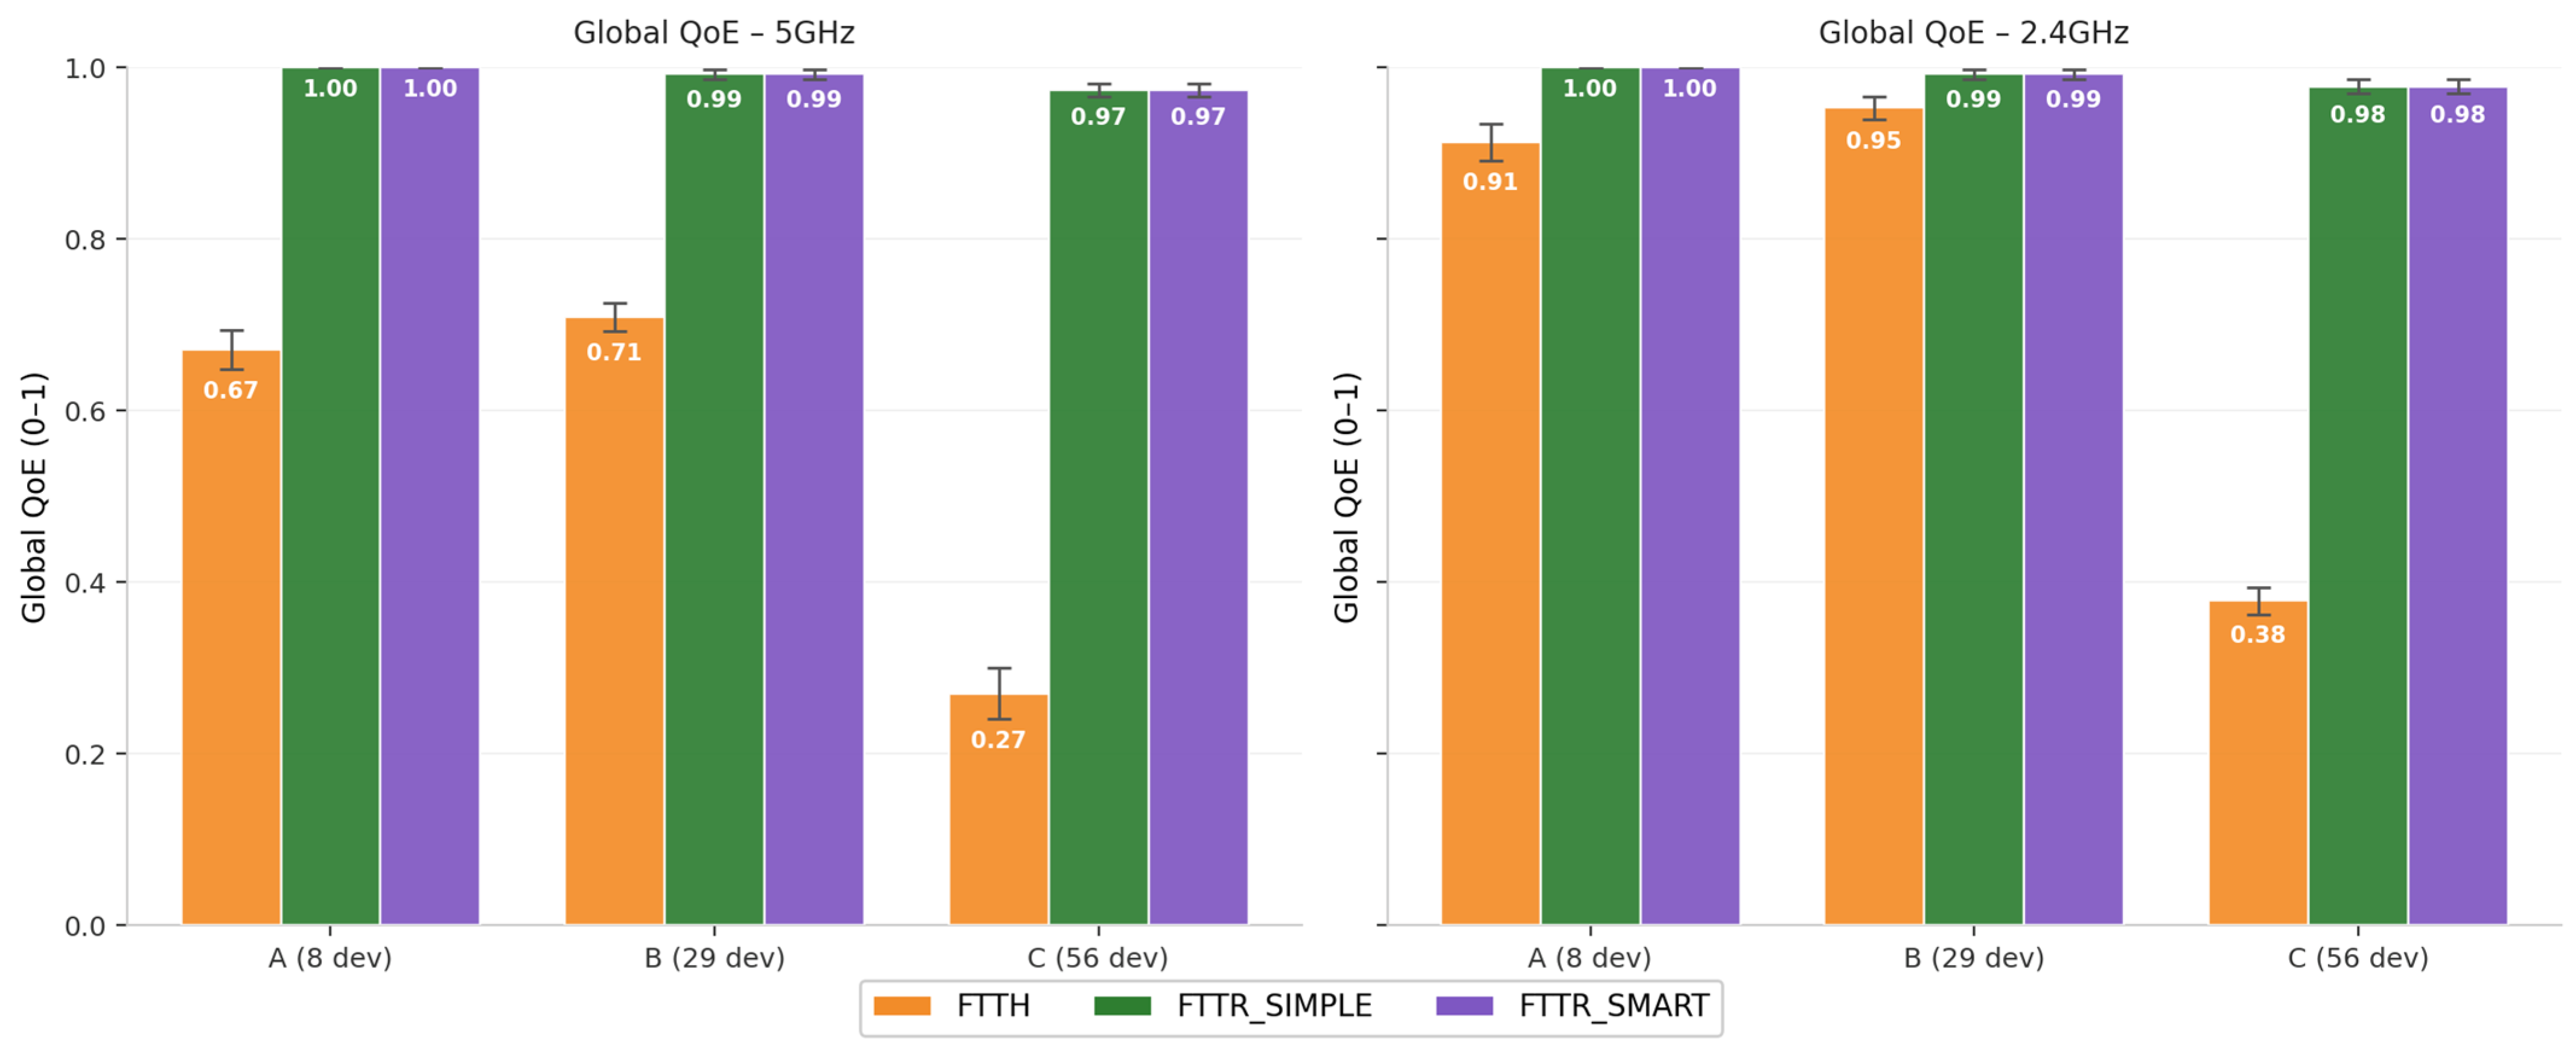
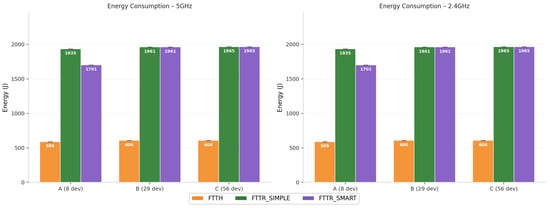
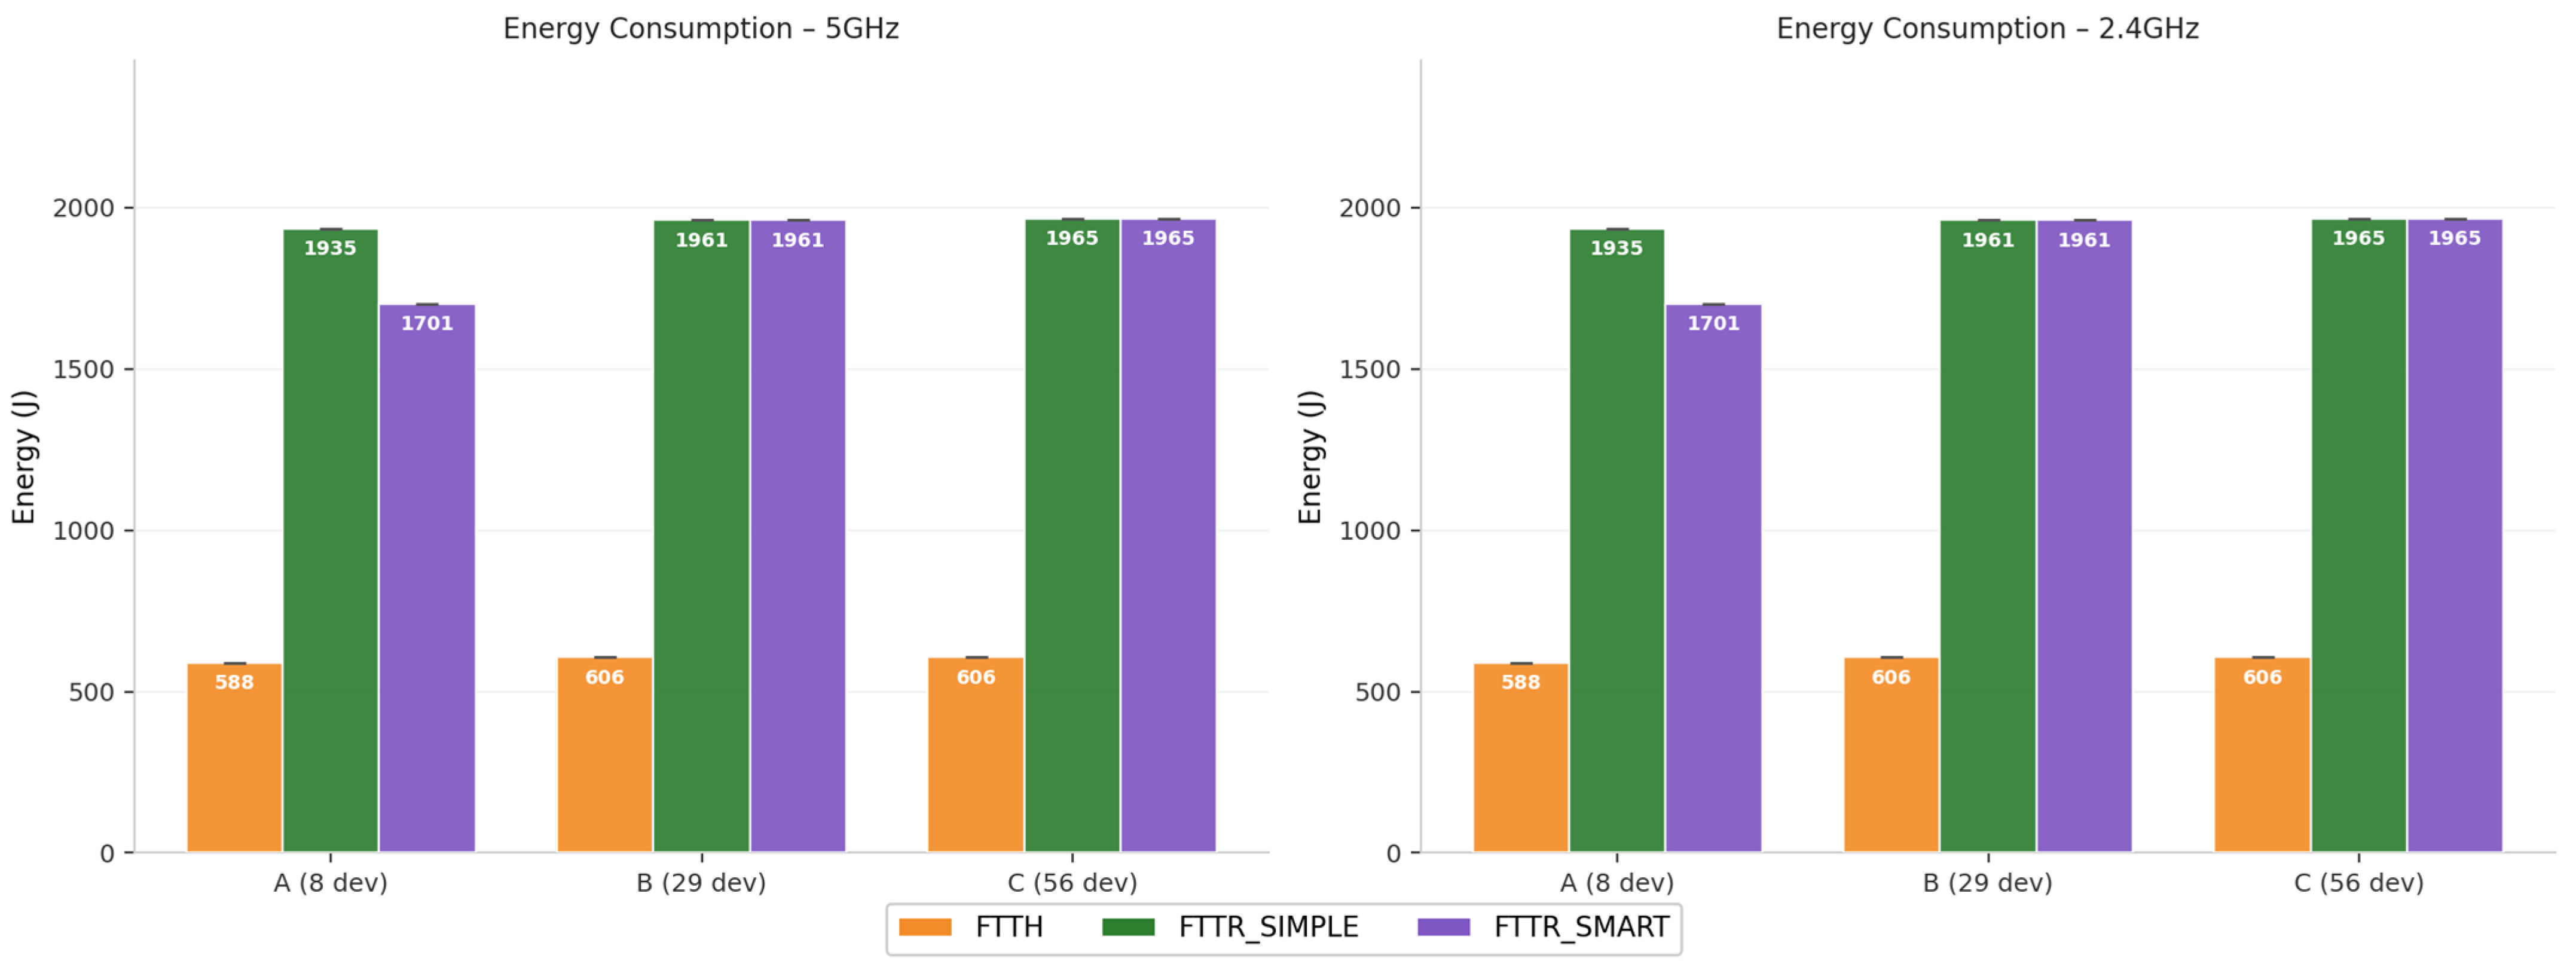
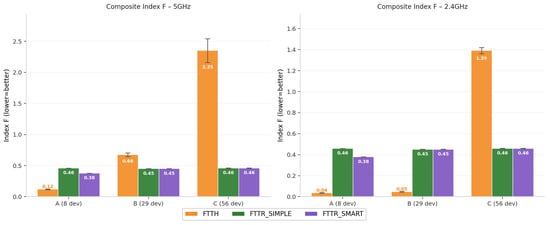
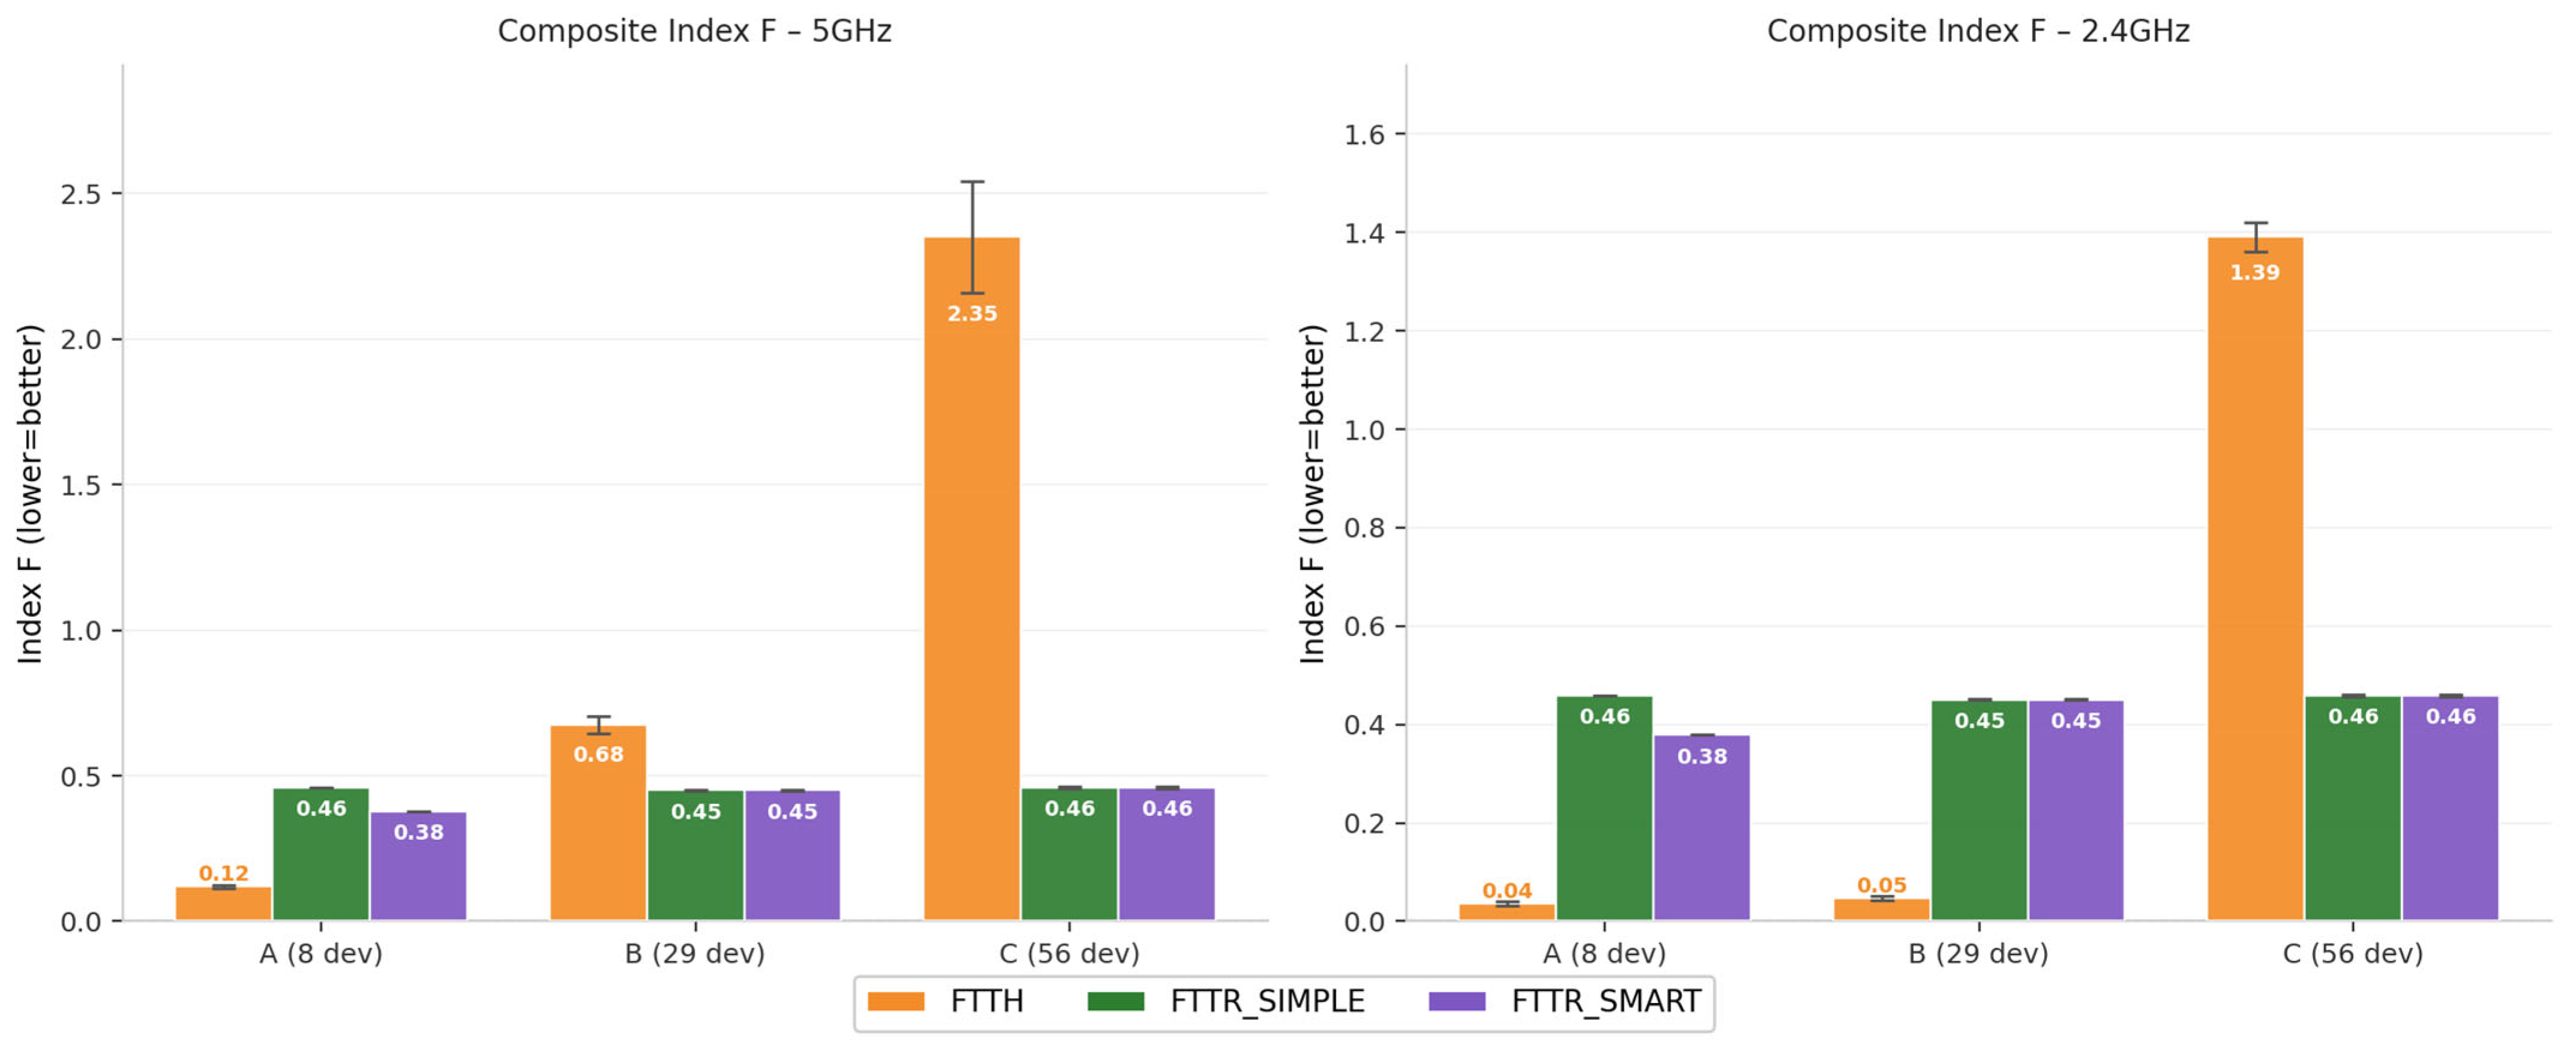

Disclaimer/Publisher’s Note: The statements, opinions and data contained in all publications are solely those of the individual author(s) and contributor(s) and not of MDPI and/or the editor(s). MDPI and/or the editor(s) disclaim responsibility for any injury to people or property resulting from any ideas, methods, instructions or products referred to in the content. |
© 2026 by the authors. Licensee MDPI, Basel, Switzerland. This article is an open access article distributed under the terms and conditions of the Creative Commons Attribution (CC BY) license.