


Abstract
Antenna selection is investigated as a means of reducing radio-frequency (RF) chain power in massive multiple-input multiple-output (MIMO) base stations under realistic channel state information (CSI) impairments. The study is motivated by the mismatch between conventional selection objectives and multi-cell operation with estimation error, pilot contamination, spatial correlation and inter-cell interference. APCS-Boost-R is introduced as the primary contribution. An interference-whitened D-optimal seed is combined with projected rank-one exchanges and a calibrated surrogate that incorporates a user-side interference-plus-noise report and a closed-form estimation-error correction. APCS-Boost-RG is retained as an optional graph neural network (GNN) refinement in which residual exchanges are ranked after the algebraic solution has been formed, while feasibility and non-degradation of the calibrated surrogate are verified deterministically. In a three-cell urban macro configuration derived from Third Generation Partnership Project (3GPP) TR 38.901 with 64 antennas, 16 active RF chains and eight users per cell, APCS-Boost-R achieves 19.364 bit/s/Hz over 200 paired realizations. Improvements of 2.58 percent over APCS-Boost, 6.76 percent over greedy search and 10.16 percent over a genetic algorithm are obtained. APCS-Boost-RG adds 0.019 bit/s/Hz but is treated as an optional refinement because it requires a second-stage neighborhood evaluation and offline model maintenance. In the archived common timing record, APCS-Boost-R requires 20.376 ms per three-cell realization, compared with 12.728 ms for APCS-Boost, 57.775 ms for norm-initialized greedy search and 41.302 ms for the genetic algorithm, while APCS-Boost-RG requires 24.0 ms versus 20.4 ms for APCS-Boost-R in the separate archived learned-stage record. Separate reconstructions on the documented reproducibility host require ms for APCS-Boost-R and ms for a complete APCS-Boost-RG rebuild. Additional paired examinations confirm robustness across stronger search budgets, report imperfections, regularized precoding, coordination, near-field sensitivity, hardware perturbations, and configurations ranging from 32 to 128 antennas and one to seven cells.
1. Introduction
This section provides the motivation, scientific positioning and main contributions of the proposed framework. In massive multiple-input multiple-output (MIMO) systems, a large base-station array is used to spatially multiplex many users on the same time-frequency resource [1,2]. The array gain can increase spectral efficiency and reduce the radiated energy required per information bit [3]. In a fully digital array, each active antenna is nevertheless associated with a radio-frequency (RF) chain, a converter pair, a filtering path and a baseband-processing load. Circuit power can therefore move the energy-efficient operating point away from the maximum-array operating point [4]. This issue is addressed through antenna selection in which a smaller RF-chain pool is connected to a larger physical array. It has also been confirmed through measurement campaigns that the physical antennas of a large array do not contribute equally [5].
The resulting subset problem is combinatorial. Selecting antennas from candidates produces approximately possible subsets. Norm-based ranking is inexpensive but ignores inter-column dependence. Stronger subsets can be provided by greedy search and genetic-algorithm (GA) search, although repeated complete zero-forcing (ZF) evaluations increase selection latency [6,7,8]. Part of the computational burden can be transferred offline through learning-based methods, but generalization may be impaired by incomplete channel state information (CSI) and changes in the propagation distribution [9,10,11].
A central challenge is that antenna-selection results are often established under independent Rayleigh fading and perfect CSI. Practical cellular links are affected by distance-dependent attenuation, line-of-sight transitions, shadow fading and angular concentration. CSI is obtained from finite-power pilots, and coherent contamination across cells is created by pilot reuse. Additional interference is produced by downlink signals from neighboring base stations. Spatial correlation is not merely a nuisance because its covariance structure can sometimes be exploited, but it changes the rank and conditioning of the selected channel [12,13]. The effect of the selector must therefore be separated from the effects of channel estimation and interference in a credible assessment.
The study is motivated by the interaction between the selector objective and the impairments applied during evaluation. When a selection method is developed under perfect CSI and isolated-cell operation, those assumptions are inherited by its internal objective even when they are not adopted in the evaluation. Substantial improvement is exposed by direct refinement of the achieved rate in a controlled diagnostic, whereas no corresponding gain is obtained when only the estimated search input is replaced by the true channel. Objective calibration is therefore identified as the principal opportunity beyond increased search effort.
Algebraically projected antenna selection (APCS)-Boost is defined in this work as the uncalibrated algebraic baseline formed by D-optimal initialization, feasibility projections and algebraic rank-one exchanges. Throughout the paper, the suffix R denotes the interference-calibrated algebraic stage, the suffix G denotes the certified graph learning stage, RG denotes their integration and EE denotes the adaptive energy-efficiency mode. The primary engineering contribution is APCS-Boost-R, in which the surrogate objective and D-optimal seed are calibrated to measured interference and estimated channel conditions within a three-cell system-level examination derived from Third Generation Partnership Project (3GPP) TR 38.901 [14]. APCS-Boost-RG is retained as an optional certified refinement for network-informed exchange ranking. APCS-Boost-R remains the default operating point when latency and model-maintenance budgets dominate, while APCS-Boost-RG is intended for deployments that can accommodate the additional stage-two computation and offline training.
The proposed framework is distinguished within multi-cell antenna selection by the joint treatment of pilot error, pilot contamination, spatial correlation and inter-cell interference in a common 3GPP-derived layout. The external state-of-the-art comparison covers thirteen external approach families represented by fourteen published studies spanning energy-efficient ranking, genetic and graph search, supervised and unsupervised deep learning, incomplete-CSI optimization, learned transmitter configuration and certified neural selection. The internal APCS stages are not counted as external comparators and are evaluated separately through controlled ablations. The algebraic contribution is formed by the interference-calibrated surrogate and whitened D-optimal geometry. The machine learning contribution is formed by network-level partial-response labels, graph-based residual exchange ranking and a calibrated stage-one utility floor within the same multi-cell selection framework. Under the adopted rule, the certified surrogate utility is preserved at or above the robust stage-one value. Exact surrogate ranking is included as a controlled attribution reference for the learned residual key.
The contributions are as follows.
- The antenna-selection problem is reformulated for estimated multi-cell channels. Selection is performed on , while actual downlink rates are computed from the true channel and include residual intra-cell leakage and inter-cell interference. Reported gains therefore correspond to rates measured on the simulated true channels under the stated assumptions.
- A diagnosis is performed that separates search quality from objective quality and attributes the residual gap of APCS-Boost to the surrogate rather than to the neighborhood. An achieved-rate hill climb started from APCS-Boost reveals approximately 6% improvement within the diagnostic budget, which confirms substantial objective headroom.
- APCS-Boost-R, the interference-calibrated algebraic contribution, is developed. The per-user surrogate signal-to-interference-plus-noise ratio (SINR) is divided by an effective noise term that combines a measured interference-plus-noise report with a closed-form estimation-error correction available from large-scale gains, the pilot map and the pilot signal-to-noise ratio (SNR). The D-optimal seed is additionally constructed on the interference-whitened estimate. Both corrections are per-user scalars, so the rank-one exchange machinery and its complexity order are preserved. Under the joint impairments, 19.364 bit/s/Hz is achieved by APCS-Boost-R, exceeding APCS-Boost by 2.58%, greedy search by 6.76% and GA by 10.16%. In the archived common timing record, APCS-Boost-R requires 20.376 ms per three-cell realization, compared with 12.728 ms for APCS-Boost, 57.775 ms for norm-initialized greedy search and 41.302 ms for GA. A separate reconstruction on the documented reproducibility host gives ms for APCS-Boost-R over 20 reference scenes, so timing is reported with explicit execution-environment provenance.
- The transfer of calibrated information beyond APCS is demonstrated by the Greedy-R and GA-R controls, but those controls are not used to causally partition the APCS-Boost-R gain because their search mechanisms differ. A separate APCS factorial examination independently toggles calibrated scoring, interference-whitened seeding and refinement depth while holding the APCS exchange machinery fixed; the resulting marginal effects and interactions are reported as a controlled examination.
- APCS-Boost-RG is developed as an optional certified learning extension rather than a replacement for APCS-Boost-R. A physics-derived heterogeneous graph neural network is trained by imitation of a network-level partial-response teacher and is used only to rank candidate exchanges. Every accepted proposal is validated against the calibrated algebraic surrogate. The observed additional mean gain is statistically resolved but small in engineering magnitude, so emphasis is placed on the certified integration, the network-level supervision signal and the conditions under which the extra stage-two budget is justified.
- The joint stress comparison is obtained from five independent replications of 40 paired realizations, while each controlled sweep uses five replications of 20 paired realizations. Across-replication spread is reported so that the stability of the ranking can be judged.
The manuscript develops the argument from antenna-selection, imperfect-CSI, standardized-channel and learning literature to the multi-cell model and the proposed selector. The evidence combines the principal paired comparison with controlled ablations and additional robustness examinations before the main conclusions and remaining research directions are presented.
2. Literature Review and Background Work
This section provides the research background and positions the proposed approach against energy-aware RF-chain activation, combinatorial search, incomplete-CSI optimization, standardized propagation models and learning-augmented selection. These strands establish the methodological context for impairment-aware multi-cell selection with a certified learned refinement.
2.1. RF-Chain Activation and Antenna Selection
The background summarized in Section 2 begins with RF-chain activation and antenna selection in Section 2.1. The motivation introduced in Section 1 is reflected in the energy efficiency of a massive-MIMO base station, which depends on the transmit power, active array size, user load and processing architecture [3,4]. Received-power ranking and energy-aware subset selection have been used to retain array gain while reducing RF-chain power [15,16]. Genetic and quasi-distributed search have been developed for extra-large arrays [7], while exact graph search has been investigated for moderate dimensions [8]. Joint antenna selection and precoding has also been addressed through low-complexity heuristic optimization [17]. More recent formulations have incorporated incomplete CSI through a risk-aware constraint [10]. These studies establish strong optimization foundations, although joint evaluation under pilot error, pilot contamination, spatial correlation and downlink inter-cell interference is not provided within a common 3GPP-derived setting. These optimization results are complemented by the imperfect-CSI evidence summarized in Section 2.2.
2.2. Imperfect CSI and Pilot Contamination
In time-division duplex (TDD) systems, uplink pilots are used to infer downlink channels through reciprocity. The number of mutually orthogonal pilots is limited by the coherence interval. When pilots are reused across cells, the estimate of a desired user is contaminated by channel components from pilot-sharing users [1]. Pilot contamination is not necessarily an asymptotic capacity limit when covariance matrices are sufficiently distinct and appropriate processing is available [12]. It remains a finite-dimensional concern for ZF precoding because residual intra-cell leakage and misdirected beams are produced by an inaccurate estimate. Antenna selection under incomplete CSI has recently been treated through risk-aware optimization [10], while correlated-channel capacity approximations have shown that estimation error and spatial dependence must be considered jointly [13]. The approach adopted here differs in that the uncertainty is not carried as a distributional risk constraint but is condensed into a per-user scalar that leaves the algebraic update structure of the search intact.
2.3. 3GPP Spatial Channels and Research Gap
Channel-model components for frequencies from 0.5 to 100 GHz are defined in 3GPP TR 38.901, including deployment scenarios, line-of-sight (LOS) probabilities, distance-dependent path loss, shadow fading, spatial consistency and link-level tapped delay line (TDL) and clustered delay line (CDL) models [14]. Its urban macro (UMa) model is appropriate for a macro-cell examination at 3.5 GHz. A narrowband spatial realization of the standardized UMa large-scale equations and geometry is used in the evaluation. A unified antenna-selection assessment is therefore required in which imperfect estimation, pilot reuse, angular concentration and downlink multi-cell interference are introduced separately and jointly under a common 3GPP-derived layout. The selection objective must also be calibrated to these impairments rather than constructed under isolated perfect-CSI assumptions. The standardized propagation assumptions provide the context used later in the system model.
The standardized-channel research gap established in Section 2.3 is reflected in the default array manifold of Equation (7), which is a plane-wave narrowband model, so near-field and spatially non-stationary channel-estimation work defines an important boundary of the principal evaluation. In particular, MBPD develops robust polar-domain estimation for near-field wideband extra-large-scale MIMO (XL-MIMO) [18], while the hierarchical pre-selection and multi-level dynamic-threshold strategy of Wang et al. addresses near-field spatial non-stationary estimation [19]. These methods solve channel-estimation problems rather than antenna-selection problems and are therefore not direct numerical baselines here. They nevertheless motivate the additional spherical-wave sensitivity examination in Section 5.6, where the proposed selector is re-applied after injecting range-dependent phase curvature without replacing the principal 3GPP-derived evaluation.
2.4. Learning-Augmented Selection
Convolutional and deep neural networks have been used for joint antenna selection and hybrid beamforming [20,21], while multi-label learning has been used to predict massive-MIMO antenna subsets directly [9]. Label-free joint selection and beamforming have been developed through deep unsupervised learning [22], and learned transmitter configurations have been optimized for energy-efficient massive-MIMO beamforming [23]. Boosted learned selection provides another recent low-complexity direction [24]. Certified robustness has also been studied for neural antenna selectors under bounded input perturbations [25]. In cell-free MIMO, graph neural networks have been used for access-point selection [26], while distributed convolutional antenna selection and graph-based precoding have been combined using locally estimated CSI [11]. These learning-based approaches motivate the residual-ranking design considered here.
The learning-specific context summarized in Section 2.4 motivates a graph component whose novelty is not the use of a graph neural network (GNN) by itself. Learning is deliberately restricted to residual exchange ranking after APCS-Boost-R has already produced a complete feasible algebraic subset. The graph output neither directly selects the final antenna set nor replaces the algebraic optimizer. Feasibility, exact candidate evaluation and the acceptance floor remain deterministic. This differs from direct learned subset predictors, from graph-based access-point selection in cell-free networks [26] and from the cell-free convolutional neural network (CNN) and GNN architecture of Wang et al. [11], in which learning performs antenna selection and precoding, respectively. It also differs from the formal neural-network robustness certificate of Kim et al. [25]. In the present work, the term “certified” refers only to deterministic verification of the calibrated selection utility and feasibility constraints around a learned residual-ranking proposal. The distinction among direct learned selection, residual ranking and certification semantics is summarized in Table 1.
Table 1.
Comparison of learning roles and certification semantics in representative antenna-selection approaches.
The comparison in Table 2 contains thirteen external approach families represented by fourteen state-of-the-art studies and one row for the complete proposed framework. Internal stages such as APCS-Boost, APCS-Boost-R and the controlled APCS-Boost-RG variants are deliberately excluded as independent literature comparators because they belong to the same framework. The comparison is methodological because the cited studies use different array dimensions, channel models, precoders, power models and optimization objectives. Direct numerical evaluation is therefore performed only for baseline families that are reimplemented under the identical three-cell model and common realizations in Section 5. Within the external literature summarized in Table 2, the present framework is distinguished by the combination of estimated multi-cell CSI, jointly modeled 3GPP-derived impairments, network-informed graph proposals and a certified calibrated-surrogate floor.
Table 2.
Comparison of thirteen external antenna-selection approach families with the proposed framework.
3. System Description and Problem Formulation
This section provides the multi-cell system, channel-estimation and antenna-selection problem formulation used throughout the evaluation. A three-cell time-division duplex downlink model is used to couple the 3GPP-derived propagation layer, pilot-based channel estimation, true-channel transmission metrics and the surrogate antenna-selection objective. The same model supplies the estimated channels used for selection and the true multi-cell channels used for final performance evaluation.
3.1. Three-Cell Downlink Architecture
A TDD network with cells is considered. At each base station (BS), M physical antennas are deployed, of which a subset is connected to active RF chains. In each cell, K single-antenna users are served. The serving cell is indexed by , while denotes the neighboring cells. The base stations are separated by an inter-site distance of 500 m. User locations are sampled independently at distances between 35 m and 220 m from the serving base station. The processing and interference paths are illustrated in Figure 1. A 64-element uniform linear array is shown at each base station, the local estimate is affected by pilot reuse and the selected subset is evaluated through normalized ZF on the true channel with residual intra-cell leakage and neighbor-cell interference. The principal symbols used throughout the paper are collected in Appendix C, while the abbreviations are expanded in the list at the end of the paper.
Figure 1.
Three-cell massive-MIMO architecture used for the 3GPP-derived robustness evaluation.
Let denote the channel from base station b to user k in cell c. Here b indexes the transmitting base station and c indexes the cell in which the served user resides, so the central desired link corresponds to while cross-cell interference contributions have . The corresponding matrix is
The central-cell users are considered in the analysis, but the local channels are independently estimated at every base station, after which antennas are selected and a precoder is formed. The architecture defined in Section 3.1 is retained throughout the subsequent channel-estimation and selection derivations.
3.2. 3GPP TR 38.901-Derived Channel Layer
For each BS-user link entering Equation (1), the three-dimensional distance is
The UMa LOS probability is applied as specified by TR 38.901 and is evaluated with the two-dimensional distance . For the adopted user height m, the height-correction term becomes zero, so Equation (3) is obtained as
For a carrier frequency expressed in GHz, the LOS path loss before the breakpoint is obtained using the three-dimensional distance defined in Equation (2) as
while the post-breakpoint expression is
The breakpoint distance is defined as with the carrier frequency expressed in Hz, the speed of light c and the effective heights m and m. The non-line-of-sight (NLOS) candidate is
The final NLOS loss is selected as the maximum of the applicable LOS value from Equations (4) and (5) and the NLOS candidate in Equation (6). Continuity at the breakpoint is thereby preserved. Log-normal shadow fading with standard deviations of 4 dB for LOS links and 6 dB for NLOS links is added.
In the default small-scale backend, rays are used. Their departure angles are drawn from a Laplace distribution around the geometric BS-user direction with configurable azimuth spread of departure (ASD). For a half-wavelength uniform linear array, the steering vector is
The channel layer defined in Section 3.2 uses an NLOS channel formed as a weighted sum of the steering vectors in Equation (7). A 9 dB Rician component is included for LOS links. The standardized UMa large-scale ratios are preserved by this construction, while a controlled spatial-correlation parameter is provided. The adopted channel layer is a narrowband system-level realization. For , half-wavelength spacing and GHz, the physical aperture is approximately m and the conventional Fraunhofer boundary is approximately 170 m. Because the principal 35 to 220 m user range crosses this boundary, strict far-field operation is not assumed for every realization. The plane-wave results are retained as the principal standardized system-level benchmark, and an additional spherical-wave phase-curvature sensitivity examination is reported in Section 5.6. Complete wideband spatial non-stationarity, polarization and waveform-level mobility procedures remain outside the principal model.
3.3. Pilot-Based Channel Estimation
Within each cell, K orthogonal pilots are assigned. The cells in which the same pilot set is reused are determined by a cell-level reuse factor . After the received pilot signal is correlated with the pilot of user k, the normalized observation at base station b is obtained as
where contains the cells sharing the same pilot group. The reuse factor sets the number of distinct pilot groups formed across the cells, so cell c is assigned to pilot group . A factor of one places all cells in one shared group, whereas a factor of three assigns a unique group to each cell. For the three-cell layout, a factor of two places the serving cell and neighbor cell 2 in a shared group, while neighbor cell 1 uses an orthogonal group. Two cells are contaminating whenever they share a group index. Pilot contamination is created in the uplink observation by pilot reuse and the corresponding propagation channels. A downlink antenna subset chosen after channel estimation does not enter Equation (8) and therefore cannot create additional pilot contamination. Cross-cell coupling caused by independent antenna selection instead appears through the downlink interference term of Equation (14); this distinction is examined explicitly in Section 5.5. The pilot noise is modeled as zero-mean circularly symmetric complex Gaussian. With the normalization applied in Equation (8) its per-antenna variance equals , so is the pilot SNR referenced to the desired large-scale gain. With the large-scale coefficient , the adopted scalar linear minimum mean-square error (LMMSE)-like shrinkage is
where the shrinkage coefficient is retained explicitly because it is reused in Section 4.3. The normalized mean-square error (NMSE) is
Perfect CSI is represented by and a reuse factor that assigns a unique pilot group to every simulated cell.
3.4. ZF Transmission and Selection Objective
Given a subset , normalized ZF is formed from the estimated subchannel as
Each column of Equation (11) is then normalized to unit norm. The numerical regularization is set to . The actual SINR of central-cell user k is
where
The intra-cell term of Equation (13) and the inter-cell term of Equation (14) enter Equation (12) together with the true channels. Neighboring-cell load is controlled by the activity factor , while p denotes the normalized data-transmit SNR. The rate is , the sum rate is and Jain fairness [27] is
The central-cell power model is
and energy efficiency is defined as , where is given by Equation (16).
The true rates above are not available to the selector. The estimated channel is used to maximize the surrogate utility
in which the sum rate , minimum rate and Jain index J are evaluated from the surrogate SINRs of the estimated ZF solution. The normalization reference is , where is the mean per-user noise of the surrogate in use. Equation (17) is maximized under the fixed cardinality , full user rank and the per-user channel-energy coverage constraint. The user-rate floor bit/s/Hz is represented by the capped soft term in Equation (17). At the returned subset, the spectral condition-number limit is also enforced, where is the ratio of the largest to the smallest eigenvalue of the estimated subchannel Gram matrix and . If this final validation fails, the feasible stage-one seed is returned. The condition-number threshold is used as a terminal numerical guard rather than as an optimization objective. In the full-row-rank case, , so a Gram threshold of corresponds to a singular-value ratio of about in the selected subchannel. In double precision, the first-order relative-error scale remains on the order of at this guard. Sensitivity to and its binding frequency are quantified in Section 5.5. Final performance is evaluated on the true multi-cell channel, so estimation and interference losses are not concealed within the selection objective.
4. Methodology
This section presents the algebraic selector, interference calibration, optional graph-based residual ranking and the associated feasibility and acceptance rules. The proposed framework combines D-optimal algebraic initialization, feasibility projections and rank-one subset exchanges with interference-aware objective calibration. A certified graph-learning refinement is then coupled to the algebraic verifier so that learned rankings can guide candidate exploration without replacing the robust utility floor. Within this hierarchy, APCS-Boost-R is treated as the principal engineering method because it delivers the substantive performance improvement while retaining the original algebraic complexity structure, whereas APCS-Boost-RG is positioned as a methodological extension that demonstrates how graph-learned residual rankings can be incorporated under deterministic feasibility and surrogate non-degradation certification; its currently observed 0.019 bit/s/Hz increment is therefore interpreted as evidence of the viability of the certified learning augmentation rather than as a claim of a large practical throughput advantage.
4.1. Algebraic Initialization, Projections and Exchanges
For a given base station, estimated channel column m is denoted by . The regularized information matrix of subset is
where regularizes Equation (18). The incremental log-determinant gain is maximized by a D-optimal seed. For a candidate antenna m, the matrix determinant lemma [28] is used to obtain
Users for whom substantial energy has already been accumulated can be overemphasized by a determinant-only seed. Therefore, the selected energy of user k is maintained by APCS-Boost as
and is compared with the total available energy . The weak-user weight is computed as and is normalized to unit mean across the users, so Equation (20) drives the coverage pressure. The array is also divided into four aperture blocks, where denotes the block containing antenna m. The score is
with and . When the number of remaining slots equals the number of uncovered blocks, only antennas from uncovered blocks are eligible. After insertion, the inverse is updated by
A deterministic seed is used, with no population initialization or training data required. Appendix A gives the missing bridge to ZF. After interference whitening, the calibrated ZF surrogate is exactly the ordinary inverse-Gram ZF surrogate on the whitened channel, while the cofactor identity expresses each per-user inverse-Gram factor as a determinant ratio. A numerical correlation study is reported in Section 5.5.
The projection machinery and the shortlist rule are presented next. The completed seed is screened before refinement. It must contain at least one selected antenna in every aperture block and must satisfy
where and the coverage energy of Equation (20) is evaluated on the raw estimated channel rather than on the whitened energy used for seed scoring. The removal of an excessive share of the selected channel energy from a weak user during a swap is prevented by the projection in Equation (23). Candidates that produce a nonpositive inverse-downdate denominator are rejected because the resulting matrix would approach rank deficiency.
The leverage of selected antenna i is
Only the selected antennas with the smallest leverage are considered for removal. They contribute the least unique information under the current inverse and are the most plausible replacement candidates. The neighborhood is thereby reduced from to exchanges per round.
The exchange step and its low-rank updates complete the machinery. Let denote the inverse Gram matrix of the current estimated subchannel. Removing selected antenna i gives
For an outside antenna j, the vector is defined. The candidate inverse is
Equal-power estimated ZF rates only require . All feasible outside antennas for a fixed removal are therefore evaluated in one vectorized update. The candidate with the largest strictly positive utility increment is accepted. Each accepted exchange increases the surrogate utility, so cycling is impossible. One complete ZF solution and one condition-number check are performed for the final subset. If the final validation fails, the feasible stage-one seed is returned.
4.2. Diagnosis of the Objective Rather than the Search
The surrogate used above assigns to user k the estimated SINR
The selection objective introduced in Section 3.4 contains two assumptions in Equation (27). The denominator of the true SINR is replaced by unity, so interference is treated as absent. In addition, is treated as exact, so estimation error is treated as absent. Neither assumption holds at the operating point examined in Section 5, where a mean NMSE of 0.107 is measured.
The algebraic initialization and exchange machinery of Section 4.1 is examined before calibration. Two controlled diagnostics were performed at the joint stress point to determine whether the residual gap was caused by the neighborhood or by the objective. In the first diagnostic, selection was repeated with the true channel supplied to the selector instead of the estimate. No improvement in the achieved sum rate was observed, which indicates that estimation noise in the search input was not the binding constraint. In the second diagnostic, hill-climbing was performed directly on the own-cell achieved sum rate from the APCS-Boost subset. A gain of approximately 6% was obtained before the non-converged procedure was stopped. This value is a partial diagnostic trajectory rather than an upper bound. The 21.6% per-cell and 7.2% network figures reported later are produced by different oracle objectives, both initialized from APCS-Boost-R and are therefore not directly comparable with the 6% diagnostic. The three definitions are summarized in Table 3. Substantial headroom is present within the exchange neighborhood, but it is not exposed by the uncalibrated surrogate. The residual limitation of APCS-Boost is therefore attributed to the objective rather than to the availability of candidate exchanges.
Table 3.
Definitions of the three optimization-headroom quantities used in the evaluation.
4.3. APCS-Boost-R for Interference-Calibrated Selection with an Estimation-Error Correction
In APCS-Boost-R, Equation (27) is replaced by
where the effective noise of user k is
The measurement-based term and the analytic estimation-error term are defined below.
The term represents the interference plus noise experienced by user k on the unwhitened coverage-aware D-optimal sounding seed. To make its construction explicit, let denote the sounding subset and let be the normalized ZF sounding precoder constructed from . All three cells sound simultaneously on their own seeds in the simulation. With unit thermal-noise variance, the reported linear-power quantity is
The channel-estimation model of Section 3.3 supplies the quantities used by the calibration. The baseline simulator evaluates Equation (30) once on the quasi-static sounding realization ( system-level sample), feeds back the unquantized linear value without additional delay and then holds it fixed during the algebraic exchanges. The phrase “measurement report” therefore denotes a user-equipment (UE)-side scalar interference-plus-noise report rather than a claim that a particular standardized channel quality indicator (CQI) encoding is implemented. The abstraction is compatible with measurement-assisted cellular operation at the level of a scalar UE report, but it is not mapped one-to-one to a specific 3GPP NR CQI/CSI field, reporting periodicity or feedback codebook. Quantization, multiplicative error and staleness are imposed only in the separate sensitivity study of Section 5.5, while seed-to-final-subset mismatch and a one-refresh procedure are examined in Section 5.6. Because the report reflects residual intra-cell leakage, partial overlap with the analytic error term of Equation (32) is possible. The two components are interpreted as complementary calibration signals rather than as a disjoint decomposition. Cross-cell channel knowledge, covariance exchange and backhaul coordination are not required by the deployed selector.
The term is the per-antenna variance of the estimation error of user k. From Equations (8) and (9), the error is
whose per-antenna variance is obtained from Equation (31) in closed form as
Only large-scale gains, the pilot map and the pilot SNR are included in Equation (32). For the normalized local-scattering covariance used by the adopted estimator, every steering-vector entry has unit modulus and the covariance diagonal is unity to numerical precision for all tested angular spreads. Consequently, Equation (32) remains the exact marginal per-antenna error variance of this scalar shrinkage model after correlation is introduced. Spatial correlation changes the covariance eigenstructure, however, so the approximation enters when that marginal variance is treated as isotropic in the residual-leakage projection onto the interfering ZF directions. An offline covariance-aware benchmark therefore propagates through the selected ZF columns and compares the resulting directional leakage with the scalar correction. The scalar form remains the deployed correction because it preserves the rank-one algebra and requires no covariance feedback. Residual intra-cell leakage across the interfering streams, which is produced by an erroneous estimate, is represented by the factor in Equation (29).
The essential property of Equation (28) is structural. Both corrections enter as a single positive per-user scalar multiplying the inverse-Gram diagonal. The quantity required by the vectorized exchange in Equation (26) therefore remains and the Sherman–Morrison downdate and update in Equations (25) and (26) are unchanged. The complexity order of the refinement is consequently preserved.
The seed construction is also modified. Rather than applying Equation (21) to , it is applied to the interference-whitened estimate
Volume is then measured by the determinant recursion in Equations (19) and (22) in a metric where each user axis is scaled by the reliability with which that user can actually be served. Aperture is thereby spent on users able to benefit from it rather than on users that are interference limited or poorly estimated. Since is diagonal and fixed within a selection, Equation (33) costs and leaves the recursion unaltered.
The refinement depth is increased from three rounds to . The deeper budget is justified in Section 5 by the observation that the calibrated surrogate continues to yield accepted exchanges beyond the third round, whereas the uncalibrated surrogate saturates. The complete robust selection procedure is summarized in Algorithm 1.
| Algorithm 1 Execution of APCS-Boost-R with estimated multi-cell CSI |
Require: , , pilot map , , L, , q,
|
Extension to Regularized ZF
For regularized zero forcing (RZF), the inverse used by the selector can be replaced by the loaded matrix
where is used in the numerical extension. The Sherman–Morrison rank-one downdate and update remain valid because antenna addition or removal still changes the loaded Gram matrix by a rank-one term. The diagonal of Equation (34) therefore provides a loaded selection surrogate at unchanged asymptotic complexity. This loaded diagonal is a ranking surrogate rather than an exact RZF SINR expression because residual inter-user terms remain after regularization. Section 5.5 consequently reports both a precoder-mismatch test, in which ZF-selected subsets are evaluated with RZF, and a loaded-selection variant evaluated with RZF.
4.4. APCS-Boost-RG with Certified Learned Exchange Rankings
A best-improvement search over the shortlisted neighborhood is performed in APCS-Boost-R, so a surrogate-local optimum is reached within the complete combinatorial space. A simulation oracle identifies further network-level opportunities. When an achieved network sum-rate hill climb is started from the APCS-Boost-R subset with true channels, the network objective is increased by 7.2% on average. Among the beneficial oracle exchanges, 83.4% fall outside the surrogate-monotone path and the median relative surrogate reduction is 1.31%. This result establishes the need for a residual ranking signal that represents network-level information beyond the per-cell surrogate. The 7.2% network-level value is measured from the APCS-Boost-R subset and is distinct from the approximately 6% own-cell diagnostic reported for APCS-Boost in Section 4.2. Algebraic certification is retained for every accepted learned exchange.
For each cell, a heterogeneous bipartite graph is constructed from quantities available at the base station. Twelve engineered features are assigned to each of the M antenna nodes, and seven are assigned to each of the K user nodes, all derived from the physical quantities of Section 3 and listed in Table 4, while the architecture that processes the graph is shown in Figure 2. The exchange potentials are group-centered within the current subset and within its complement, so only relative rankings are expressed and constant offsets between the two groups are removed.
Table 4.
Engineered node and coupling features used by the heterogeneous graph model.
Figure 2.
Physics-derived heterogeneous graph architecture used to rank residual antenna exchanges.
The feature engineering follows three principles. Energies, noise terms and variances are compressed by logarithms and standardized per graph, so the model observes normalized feature shapes rather than absolute scales, and the same trained network is evaluated at the tested impairment levels. Quantities that already drive the algebraic stage, namely the whitened energies of Equation (33), the determinant recursion of Equation (19), the coverage pressure of Equation (23) and the uncertainty terms of Equations (32) and (29), are exposed directly, so the residual learns corrections to a representation it shares with the algebra. Finally, the two subset-conditioned features are centered to zero mean, so the identical network processes unconditioned seed graphs and conditioned exchange graphs without a distribution shift between the two uses.
The processing follows the message-passing paradigm [29] in the heterogeneous bipartite form that has proven effective for radio resource graphs [30]. Let and collect the antenna and user features, let denote the matrix of whitened per-user energy fractions that weights the bipartite edges and let denote the antenna-coherence coupling. The embeddings are initialized as and and are updated over two rounds by
for rounds with parameters that are not shared across the rounds, where bias terms are omitted for brevity and every hidden dimension equals 16. After the two rounds of Equation (35) and Equation (36), the user embeddings are averaged into a context vector . The two heads are then obtained for each antenna as
where || denotes concatenation. The seed head is trained as an auxiliary output and is used only by the seed-residual and direct GNN-Top-L ablations. The principal APCS-Boost-RG inference path retains the complete APCS-Boost-R stage-one subset and uses the exchange head of Equation (37) to supply the residual term of the hybrid key. The complete parameter count is 3024, obtained as and for the two embeddings with biases, for the two unshared rounds and for the two heads. The architecture is summarized in Figure 2, where the engineered features are embedded, exchanged through two message-passing rounds, pooled into a user context and read out by the auxiliary seed head and residual exchange head. The principal path retains the complete APCS-Boost-R subset and uses only the exchange head under the certification rule.
Training is performed by imitation of a network-level partial-response oracle in which the subset of one cell is varied while the precoders of the neighboring cells are held fixed. This cellwise response construction isolates the rate externality exported by each candidate subset. For a user k of a neighboring cell , the achieved SINR under a candidate subset of cell c is defined as
where the desired power and the interference received from all cells other than c are held fixed at the values induced by the precoders in use, while is the power radiated at that user by the ZF precoder that cell c forms on . The own-cell SINR follows Equation (12) with the candidate subset. For a candidate subset of cell c, the oracle objective is
where the first sum runs over the users of cell c with true channels and the second sum evaluates Equation (38) for the users of every other cell. A best-improvement hill climb on Equation (39) is started from the APCS-Boost-R subset of every cell, so the externality that the per-cell surrogate cannot represent is thereby internalized in the labels, while the trained network still reads only base-station inputs. The partial-response construction is an offline counterfactual teacher and is not a deployable network procedure. Neighboring precoders are frozen only while a label for one candidate cell is computed. This frozen-neighbor objective can be optimistic because it omits simultaneous reactions, but it is not asserted to be a formal mathematical upper bound. Re-optimization by neighboring cells can either increase or decrease the realized network utility. It is not used at inference, and it does not enter the reported achieved-rate calculation. Section 5.5 therefore quantifies its empirical bias directly by comparing the independently optimized frozen-neighbor subsets with their simultaneous realization and separately reports the gap to a coordinated network reference.
The corpus contains 160 independently generated scenes, corresponding to 480 cell instances, all drawn from a seed stream that is disjoint from every evaluation seed. The 130 scenes with 390 cell instances are used for optimization, and the remaining 30 scenes with 90 cell instances are held out for validation. From each cell instance, one subset-free graph is extracted for the seed head. One graph conditioned on the APCS-Boost-R subset together with its dense first-round oracle table is also extracted. The 390 training-conditioned graphs alone therefore contain dense exchange labels and approximately 99 dense first-round targets per trainable parameter before the trajectory ranking constraints are counted. Across all 480 conditioned graphs, 368,640 dense exchange entries are available. Additional graphs are extracted along the oracle exchange trajectory for at most five rounds, and the complete corpus contains 2319 trajectory graphs. Optimization is performed with Adam [31] for 400 epochs using full-batch steps and a learning rate of . The checkpoint with the lowest validation loss is retained. At that checkpoint, a correlation of 0.479 with the oracle potentials and a trajectory ranking accuracy of 0.648 are attained on the validation scenes. An independent scene-scaling diagnostic, reported in Section 5.5, extends the scene count to 320 and retrains the same 3024-parameter architecture from five random initializations. The diagnostic is used to assess stability rather than to claim broad out-of-distribution generalization.
The loss is composed as
The individual losses in Equation (40) are defined as follows. The standardized seed head is regressed onto a least-squares nodal potential by , while the group-centered exchange head is regressed onto the group-centered potential by . Magnitude-weighted exchange signs are learned through and pairwise ordering along the oracle trajectory is learned through . The raw output scale is controlled by . Exact definitions are provided in Appendix B. The centered regression and ranking terms are invariant to the group offsets removed at inference, which prevents a membership shortcut from replacing exchange ranking. Hyperparameter calibration is confined to the validation scenes. The parameter is searched over , is searched over zero and and is searched over . The operating point is selected from the validation network objective before any evaluation seed is used.
At inference, the trained model is evaluated on base-station inputs alone, and its outputs enter selection only through the certified key, so the deployment interface of the algebraic stage is unchanged. Stage one of APCS-Boost-RG is identical to APCS-Boost-R. Stage two performs at most additional exchange rounds over the complete single-exchange neighborhood of swaps. Their surrogate utilities are evaluated exactly through the same Sherman–Morrison updates. For removal antenna and addition antenna , the candidate subset is defined as
The candidate is ranked by the dimensionless hybrid key
where is the utility evaluated on the calibrated surrogate SINRs, is the current subset, is the stage-one subset and prevents division by a numerically zero reference. The quantities and are the group-centered exchange potentials after normalization to unit standard deviation within the current subset and its complement. A ranked exchange is considered only when , where suppresses numerically neutral swaps. The certified floor is defined by
Throughout this work, “certified graph learning” has this deliberately narrow mathematical meaning. The learned proposal is accepted only after deterministic feasibility checks and verification of the calibrated surrogate floor in Equation (43). The certificate does not assert that the unknown true-channel sum rate, energy efficiency, outage probability or robustness metric is non-decreasing for every accepted exchange. Those quantities are evaluated separately on the true multi-cell channels. An additional certificate-consistency examination therefore measures how often surrogate-certified exchanges also improve realized true-channel metrics. Only candidates that satisfy the coverage, rank and condition-number constraints are eligible. The final subset is validated against the same utility floor and the same feasibility constraints, with a fallback to otherwise. When , the explicit reduction rule in Algorithm 2 returns and APCS-Boost-RG reduces exactly to APCS-Boost-R. When , every accepted subset satisfies , so the certified surrogate utility cannot fall below the APCS-Boost-R stage-one value. The configuration with , and is adopted. A cost of is added for complete candidate evaluation. With hidden dimension , graph inference requires per round because the antenna coupling is dense, while construction of is performed once per selection. At the studied dimensions, the measured selection computation time of APCS-Boost-R is raised by 18%.
| Algorithm 2 Execution of APCS-Boost-RG at one base station |
Require: , , pilot map , , L, model parameters , weight , tolerance , rounds , margin
|
4.5. Adaptive Mode, Complexity and Overall Execution
APCS-Boost-EE begins from the fixed-L solution and performs projected rank-one removals. Every visited cardinality is retained. The final subset is the point with the highest estimated energy efficiency subject to a minimum estimated user rate and a configurable fraction of the fixed-L estimated sum rate. In the present study this mode is not treated as a principal contribution. The additional gate sweep in Section 5.5 shows that, under the stated W power model and the tested quality-of-service (QoS) gates, the energy-efficiency optimum remains at all 16 active chains. The adaptive mode is therefore retained only to document this negative operating-point result.
The D-optimal seed has order . Refinement evaluates at most rank-one candidates and has order . The final solve has order . The whitening in Equation (33) and the error variances in Equation (32) add and respectively, so the asymptotic order of APCS-Boost-R matches that of APCS-Boost.
The complete two-stage execution, which is performed independently at every base station, is summarized in Algorithm 2. Stage one consists of Algorithm 1 and returns the certified subset together with its robust utility. Stage two constructs the physics-derived graph of Section 4.4, evaluates the learned exchange potentials once per round, ranks the complete certified single-exchange neighborhood by the hybrid key of Equation (42) and accepts an exchange only under the certification of Equation (43). At the adopted operating point with the floor equals the stage-one utility, so every accepted subset and the returned subset satisfy and the learned stage can refine but never degrade the certified solution. No information is exchanged across base stations at run time, so the network-level behavior reported in Section 5 emerges from three independent executions of the same procedure. This does not remove cross-cell coupling. All three selected subsets jointly determine the downlink interference in Equation (14). Section 5.5 therefore compares simultaneous independent execution with dynamic best-response and centralized true-network coordinate-ascent references under pilot reuse one.
5. Evaluation Results
This section provides the paired evaluation, controlled ablations, sensitivity studies and additional robustness examinations. The evaluation uses common channel realizations and matched resource constraints to compare the proposed selectors with the reimplemented external baseline families. Joint-impairment results are complemented by controlled attribution and learning ablations, replication analysis, impairment sweeps and additional robustness examinations.
5.1. Protocol, Assumptions and Evaluation Metrics
The main parameters are listed in Table 5. The UMa geometry, carrier-dependent propagation assumptions and LOS model are derived from 3GPP TR 38.901 [14], while the active-chain power accounting follows the massive-MIMO energy-efficiency literature [3,4]. Channels are normalized by the median desired-link gain of the central cell, so the stated data SNR is a normalized quantity, while the physical transmit power enters only the power model of Equation (16). The same user locations, LOS states, shadowing realization and small-scale channel realization are supplied to every method within each Monte Carlo realization. Pilot and impairment sweeps are paired across values by reusing the same geometry seed. Five independent replications are used for the complete study. The joint stress comparison uses 40 realizations per replication, giving 200 paired samples, while each controlled sweep uses 20 realizations per replication. Means are accompanied by 95% confidence intervals.
Table 5.
Simulation parameters used for the 3GPP-derived system-level evaluation.
The broader comparison in Table 2 covers thirteen external approach families represented by fourteen state-of-the-art studies. A direct numerical comparison is performed with three established external algorithm families that can be reimplemented under the identical system model and resource constraints. The 16 largest estimated column norms are retained by norm selection [32]. A norm-initialized greedy comparator, consistent with the greedy transmit-antenna selection family [6], begins with the eight strongest columns and evaluates every feasible exact addition. A population of 16 chromosomes, eight generations, four elites and a mutation probability of 0.15 are used by the genetic search family [7]. These values define the principal-table baseline only; Section 5.5 adds a compute-budget sweep up to 64 chromosomes and 32 generations and compares the eight-column greedy start with full greedy construction from the empty set. All 64 antennas are activated by full-array ZF, and no subset search is performed. Greedy-R and GA-R are controlled ablations in which the robust surrogate of Equation (28) replaces Equation (27) inside the corresponding external search family, while the search procedure is otherwise unchanged. These ablations separate the value of calibrated information from the value of the whitened seed geometry.
The utility weights , and , the weak-user offset , the seed weights and , the coverage factor and the shortlist size were fixed before evaluation and were not optimized on the 200 test realizations. These constants define the principal operating point, while robustness is assessed through the separate budget, impairment and dimensional sensitivity examinations. The principal joint comparison remains anchored at , and with the stated norm-initialized greedy and fixed-budget GA comparators. Separate extension examinations subsequently vary the search budgets and the dimensions M, L, K, and cell count; those extension streams are interpreted independently and do not replace the principal headline configuration.
Computational Implementation and Reproducibility
The methodology of Section 4 is implemented through the reproducibility pipeline in Python 3.13.5 using NumPy 2.3.5, SciPy 1.17.0, pandas 2.2.3, Matplotlib 3.10.8 and PyTorch 2.10.0+cpu. The internal validation codebase contains the algebraic reference core, validation examinations, fixed seed streams, raw result tables and figure-generation scripts. The internal validation workflow is orchestrated by python run_complete_validation_suite.py, whose dry-run mode prints the complete execution plan without launching the experiments. Dependencies are listed in simulation/requirements.txt. The reference implementation reproduces the validation studies and provides a separate cross-check of the principal method ordering without replacing the principal reported measurements.
The norm-initialized greedy comparator performs 420 candidate objective evaluations per base station for , and , followed by one final validation evaluation, which gives 421 complete evaluations. Full greedy construction from the empty set performs 904 candidate evaluations followed by the same final validation step. The fixed-budget genetic comparator performs 128 candidate evaluations per base station using 16 chromosomes and eight generations. The corresponding three-cell counts for the principal norm-initialized greedy and genetic searches are 1263 and 384 complete evaluations respectively. Runtimes for the algebraic methods and the external search baselines were measured on one processor core within one process. Learned-stage runtimes were measured in a separate software environment and were normalized through the ratio of the APCS-Boost-R runtimes obtained in both environments. Selection computation time is reported separately because vectorized low-rank scores and complete objective evaluations have different execution costs.
The computational environment and reproducibility data are summarized in Table 6.
Table 6.
Computational environment and reproducibility data.
Reproducibility is supported by fixed configuration files, deterministic seed definitions and executable scripts maintained with the research workflow. The scenario, channel backend, pilot SNR, reuse factor, angular spread, cell activity, RF-chain power and algorithm budgets can be configured. Random seeds are reset so that the same channel is supplied to every method in each realization, and the same user locations and channel realizations are used at every sweep value. This paired design is necessary because unpaired user locations can obscure monotonic impairment trends, as Section 5 demonstrates quantitatively.
The assumptions of the principal comparison are collected next, following the computational implementation described in Section Computational Implementation and Reproducibility. The channel is quasi-static within one selection interval, and single-antenna users are served through the uniform linear array of Equation (7). The baseline measurement report is error-free and fixed within that interval, while separate sensitivity examinations add finite quantization, multiplicative report error, staleness and post-selection refresh. Exact knowledge of the large-scale gains and pilot map is assumed for the scalar error variance of Equation (32); a covariance-aware benchmark and the additional very-small-ASD examination quantify the effect of relaxing the isotropic leakage approximation. The partial-response teacher freezes neighboring precoders only during offline label construction, whereas final network performance is evaluated after all selected subsets are applied; dynamic-neighbor and centralized coordination references are supplied separately.
The metrics reported throughout the evaluation are defined next. Each metric is measured on the true channels of the central cell in every realization.
The sum spectral efficiency is the primary metric. It is computed as with the achieved SINR of Equation (12), so residual intra-cell leakage caused by the estimation error and the interference radiated by the neighboring cells reduce it directly. It measures the aggregate throughput per hertz that the selected subset actually delivers.
The minimum-user rate is the smallest of the K per-user rates. It isolates the worst-served user, who is typically located near the cell edge and is dominated by inter-cell interference, so it is the metric least amenable to improvement through antenna selection alone.
The Jain index of Equation (15), following the standard fairness measure in [27], summarizes rate fairness. It ranges from when a single user captures the entire sum to one when all users are served equally, so the aggregate and worst-case views are complemented with a distributional perspective.
The outage fraction is the share of users whose achieved rate falls below the service floor of bit/s/Hz. It converts the rate distribution into a coverage statement and is reported alongside the minimum rate because the two react differently when a single user degrades.
The energy efficiency is with the power model of Equation (16), consistent with standard massive-MIMO energy accounting [3,4], which includes amplifier consumption adjusted by its efficiency, active RF-chain consumption and baseband-processing consumption. It is the metric through which a smaller active subset can outperform the full array.
The active-chain count and the total power report the resource side of the trade-off. Sixteen active chains are used and 38 W is consumed by the fixed-cardinality selected-array methods under the joint configuration. The adaptive mode uses a mean of 15.98 chains and 37.99 W, while the full-array reference consumes 62 W.
The estimation quality is tracked by the NMSE of Equation (10). It is not an objective of the selection but a context variable that quantifies how strongly the pilot SNR and the pilot reuse corrupt the input on which every selector operates.
Selection computation time is defined as the complete per-network runtime of seed construction and refinement. It excludes the acquisition, measurement and feedback latency of the interference report. For the learned stage, graph inference and certified exchanges are also included. The Time columns in Table 7 and Table 8 are retained as archived comparison records. The archived and reconstructed records follow different implementation paths and are therefore reported separately. Sounding and report feedback occur before selection and are excluded from this runtime. Finally, all method comparisons are reported as paired differences over the common realizations with 95% confidence intervals, t statistics and win rates, because the across-replication spread documented in Section 5.4 exceeds the effect sizes and an unpaired comparison would not resolve them.
Table 7.
Joint 3GPP-derived stress comparison at 10 dB data SNR over 200 paired realizations.
Table 8.
Learned-ranking ablation over the same 200 paired realizations.
Execution-time reporting distinguishes the archived, optimized, and environment-normalized comparison record, whose original hardware metadata were not retained, from separately reconstructed measurements on the documented reproducible host; no cross-record speed, overhead or latency advantage is claimed.
5.2. Joint Impairment Comparison and Attribution of the Gain
The joint comparison defined in Section 5.2 uses noisy channel estimation, pilot reuse factor one, 10-degree ASD and fully active neighboring cells and is reported in Table 7. All external comparator families use the same channel realizations, power model and 16-chain budget. The full-array row is retained only as a different-power reference, while the time column reports selection computation and excludes interference-report acquisition and feedback. A mean NMSE of 0.107, defined in Equation (10), is measured at this point. A sum spectral efficiency of 19.364 bit/s/Hz is obtained by APCS-Boost-R. Its gain is 0.488 bit/s/Hz or 2.58% over APCS-Boost, 1.226 bit/s/Hz or 6.76% over greedy search, 1.785 bit/s/Hz or 10.16% over GA and 3.138 bit/s/Hz or 19.34% over norm selection.
Under the paired protocol of Section 5.1, testing over the 200 common realizations supports these differences, and the corresponding mean values are visualized in Figure 3. Full-array ZF is omitted from the figure because its power and active-chain budgets differ, while it remains available as a reference in Table 7. The mean paired advantage of APCS-Boost-R over APCS-Boost is bit/s/Hz with and a win rate of 62.0%. Against greedy search, a paired advantage of is obtained with a win rate of 88.0%, and against GA, it is with a win rate of 89.5%. Every one of these intervals excludes zero. It is noted that the corresponding advantage of APCS-Boost over greedy search, , also excludes zero at the present sample size, so the comparison is statistically resolved at the present 200-sample evaluation size.
Figure 3.
Paired sum spectral efficiency of the selected-array methods under the joint-stress condition.
Secondary metrics confirm that the aggregate gains are obtained while weak-user behavior remains stable within statistical uncertainty. Energy efficiency rises significantly from 0.497 to 0.510 bit/J/Hz, corresponding to a paired gain of bit/J/Hz. Jain fairness, computed by Equation (15), rises significantly from 0.675 to 0.678. The minimum-user rate changes from 0.221 to 0.208 bit/s/Hz, with a paired difference of bit/s/Hz whose interval includes zero. The outage difference of also includes zero. Sum spectral efficiency and energy efficiency are therefore improved without a statistically resolved degradation in minimum-user rate or outage. Complementary coordination mechanisms are identified as a direct path to further cell-edge gains.
A sum spectral efficiency of 28.702 bit/s/Hz is produced by full-array ZF because greater spatial gain is provided by 64 active antennas. Its total power consumption of 62 W results in an energy efficiency of 0.463 bit/J/Hz, which is 9.22% below APCS-Boost-R when the gap is normalized by the APCS-Boost-R value. Full-array operation is not a search method, so selection computation time is reported as not applicable in Table 7. The Time metric in Table 7 reports the archived common optimized software timing record for all selection approaches: norm ranking requires 0.504 ms, norm-initialized greedy 57.775 ms, genetic search 41.302 ms, APCS-Boost 12.728 ms, APCS-Boost-EE 21.251 ms, Greedy-R 75.431 ms, GA-R 48.494 ms and APCS-Boost-R 20.376 ms per three-cell realization. The original hardware metadata for this archived record were not retained. Within this record only, the 20.376 ms APCS-Boost-R value is 50.7% lower than the genetic-search value and 64.7% lower than the norm-initialized-greedy value, while the additional 7.648 ms relative to APCS-Boost reflects the second seed construction and deeper refinement budget; these percentages are record-specific computational comparisons rather than hardware-independent latency claims. On the documented AMD EPYC 9V74 one-core reproducibility host, as shown in the Computational environment and reproducibility data (Table 6), a separate reconstruction gives a APCS-Boost-R runtime of ms over 20 reference scenes. Because this reconstruction follows a different implementation path, it is not substituted into the Table 7 Time column and is not numerically combined with the archived timing record.
The adaptive-chain outcome is also informative. APCS-Boost-EE retains 16 chains in almost every realization because the fixed 1 bit/s/Hz retention gate is conservative under joint multi-cell stress. The robust adaptive mode therefore coincides with APCS-Boost-R under the present gate, and only distinct methods are included in Table 7. This result motivates a relative rate-retention gate for adaptive pruning under interference-coupled operation.
Attribution of Calibrated Information and Whitened Seed
The outcome of supplying the identical surrogate to each search strategy is reported through the Greedy-R and GA-R rows of Table 7. An increase from 18.137 to 18.315 bit/s/Hz is obtained by greedy search, corresponding to a paired gain of or 0.98%. An increase from 17.578 to 17.781 bit/s/Hz is obtained by GA, corresponding to a paired gain of or 1.16%. An increase from 18.876 to 19.364 bit/s/Hz is obtained when APCS-Boost is replaced by APCS-Boost-R, corresponding to a paired gain of or 2.58%.
The calibrated surrogate improves both robust external search baselines, as visualized in Figure 4. The advantage of APCS-Boost-R over Greedy-R and GA-R remains 1.049 and 1.582 bit/s/Hz respectively. These cross-algorithm controls establish that calibration information is useful beyond APCS, but they do not isolate the causal contribution of whitening because greedy, GA and APCS follow different search trajectories. A fractional causal split between calibration and whitened geometry is therefore not derived from these cross-family controls. The controlled partition is provided by the APCS-only factorial examination in Section 5.6, which holds the exchange mechanism fixed while independently toggling calibrated scoring, whitened seeding and the three-versus-eight-round refinement depth.
Figure 4.
Paired sum spectral efficiency gains produced by calibrated information across the three search families.
A separate effective-noise decomposition ablation was performed over five replications of 20 paired joint-stress scenes. Mean sum spectral efficiencies of 19.653, 19.411 and 19.642 bit/s/Hz were obtained with the report-only, analytic-only and combined formulations respectively. These values are obtained on a separate set of 100 scenes, so their absolute level is not directly comparable with the 200-realization joint comparison of Table 7 and only the paired differences within this set are interpreted. The paired difference between the combined and report-only formulations was bit/s/Hz, while the difference between the combined and analytic-only formulations was bit/s/Hz. The report-only and combined formulations are statistically aligned in this decomposition, while the combined formulation exceeds the analytic-only point estimate by 0.231 bit/s/Hz. The two components serve complementary roles. The measurement report captures experienced interference, while the analytic correction introduces explicit dependence on the pilot SNR and reuse map from quantities already available at the base station. The low-pilot-SNR sweep further exercises this uncertainty dependence together with the whitened seed and the remaining robust mechanism. The present three-way ablation tests the interaction between the two calibration signals but does not identify a latent shared component explicitly. Because the measured report can contain residual intra-cell leakage generated by estimation error, future work will add an overlap-aware ablation with report-only, analytic-only, combined and overlap-subtracted variants across pilot quality, pilot reuse, quantization and report aging. This extension will quantify possible double counting between measured interference and the analytical estimation-error correction.
5.3. Certified Learned Rankings, Outcomes, Variants and Shifted Conditions
The learned extension is evaluated on the identical 200 paired realizations, with the network trained and validated exclusively on scenes drawn from a disjoint seed stream and every hyperparameter frozen before the evaluation seeds were touched. The outcome is reported in Table 8. A sum spectral efficiency of 19.383 bit/s/Hz is attained by APCS-Boost-RG, corresponding to a paired gain over APCS-Boost-R of bit/s/Hz with . The interval excludes zero, and the per-replication means are positive in all five replications, ranging from 0.017 to 0.021 bit/s/Hz. Measured against the external baselines over the same realizations, the paired advantages of the complete approach are bit/s/Hz over APCS-Boost with a win rate of 66.0%, over greedy search with a win rate of 88.0% and over GA with a win rate of 91.5%. Certified refinement is activated selectively and the surrogate performance floor is preserved. Certified exchanges beyond the APCS-Boost-R stage-one solution are found in 55 of the 200 network realizations. This 27.5% activation rate provides a direct scenario-level characterization of the learned refinement under the trained 10 dB joint-stress operating point; shifted 6 dB and 14 dB pilot-SNR conditions are statistically neutral, so the learned stage is not promoted outside the trained operating distribution. Averaged over all 200 realizations, 1.68 exchanges are accepted per network. The conditional gain on the 55 changed networks is 0.070 bit/s/Hz, and the validation fallback is never triggered. In the remaining 145 networks, no admissible exchange with a positive hybrid key is selected, and those networks are returned unchanged. The returned subsets are determined by the learned hybrid key rather than by surrogate ranking alone, so the comparison with exact surrogate ranking is reported separately. Because the operating point applies Equation (43) with , the certified utility of every returned subset is at least the APCS-Boost-R stage-one value by construction. Secondary metrics are preserved near their APCS-Boost-R levels, with paired changes of bit/s/Hz for the minimum rate, for Jain fairness, for the outage fraction and bit/J/Hz for energy efficiency. The learned-stage contribution is therefore assessed primarily through the statistically resolved sum-rate gain and preservation of the certified surrogate floor. The Time metric in Table 8 is interpreted together with the learned-stage performance results and belongs to the archived environment-normalized learned-stage record. GNN-Top-L requires 4.4 ms but incurs the largest sum-SE loss, APCS-Boost-R with seed residual requires 24.8 ms, APCS-Boost-RG with requires 30.0 ms, the per-cell-label variant requires 23.4 ms, the APCS-Boost-R reference requires 20.4 ms, the exact-surrogate-ranking control requires 23.4 ms and the complete APCS-Boost-RG requires 24.0 ms per network. The original hardware metadata for this archived record were not retained. Within this record only, the complete learned refinement increases the normalized selection time from 20.4 to 24.0 ms, corresponding to approximately 18%, while its sum-SE gain remains bit/s/Hz; this is a within-record computational comparison and not a hardware-independent latency or overhead claim. The 23.4 ms exact-surrogate-ranking control shows that most of the within-record increment is associated with certified neighborhood evaluation rather than the learned key. On the documented AMD EPYC 9V74 one-core reproducibility host, as shown in the Computational environment and reproducibility data (Table 6), the separately reconstructed complete APCS-Boost-RG rebuild requires ms over 20 reference scenes. Because the complete rebuild and the archived environment-normalized record follow different implementation paths, this absolute reconstruction is not combined with the Table 8 Time values and no cross-record overhead factor is inferred. The same exhaustive certified stage-two neighborhood without the learned key requires 23.4 ms. Thus, about 3.0 ms of the 3.6 ms increment over APCS-Boost-R is already incurred by the complete stage-two candidate evaluation, while the observed difference between the learned and exact-ranking implementations is 0.6 ms. The latter is an upper bound on the incremental graph-construction and inference contribution because it also includes implementation-level differences. The 3024 single-precision parameters occupy approximately 12 kB. In the reconstructed training pipeline used for the additional validation, a reference retraining on the deterministic 160-scene fixed-10-dB diagnostic corpus with a 400-epoch cap selects its best checkpoint at epoch 101 and takes 2.64 s wall time on the documented x86-64 CPU/PyTorch 2.10 environment. This reference measurement quantifies the one-time offline software cost and is reported independently from the archived selection-time records. Consequently, APCS-Boost-R is the recommended operating point when a strict selection-latency budget dominates; APCS-Boost-RG is an optional slower-timescale refinement when the extra certified neighborhood evaluation and offline model maintenance are acceptable.
Selection latency is interpreted jointly with channel coherence and the intended implementation timescale. Because the original hardware metadata for the archived 20.4–24.0 ms record were not retained, those values are not used to claim hardware-specific compliance with a physical coherence interval. The documented-host reconstructions are likewise treated as one-core software reference measurements rather than deployment-latency guarantees. Accordingly, no real-time vehicular latency advantage is claimed from either timing record. The intended engineering interpretation is a two-timescale implementation in which the antenna/RF-chain subset is updated on a slower configuration timescale while the ZF precoder can be refreshed more frequently on the selected columns. The mobility experiment is used only as an auxiliary sensitivity examination rather than as a dedicated high-mobility study. A mobility-specific refresh or adaptation mechanism is therefore outside the present scope. Candidate evaluations are independent across the exchange neighborhood and use small rank-one updates, so parallel graphics processing unit (GPU), field-programmable gate array (FPGA) or application-specific integrated circuit (ASIC) mapping is a natural implementation direction. The current measurements nevertheless remain a general-purpose, one-core software reference; accelerator speedup is not claimed because no accelerator implementation is measured here.
The operational cost of the learned refinement is considered separately from its statistical significance. The bit/s/Hz mean increment of APCS-Boost-RG is not presented as sufficient justification for mandatory GNN deployment. The 3024-parameter model is small, but deployment still adds offline data generation, model validation, versioning and monitoring responsibilities. The design therefore keeps the learned stage operationally optional. The explicit reduction rule returns the stage-one subset and recovers APCS-Boost-R exactly, so the learning path can be disabled without changing the principal selector. No new cross-cell signaling or measurement interface is introduced by the model. The acceptance rate and fallback counter can be monitored as operational diagnostics, while the zero-tolerance certificate limits any accepted proposal to the stage-one calibrated surrogate floor; this protection is deliberately not described as a formal true-throughput guarantee. For strict latency or maintenance budgets, APCS-Boost-R remains the recommended configuration. The learned refinement is most relevant when offline model maintenance is already acceptable, and the additional certified stage-two neighborhood budget can be absorbed at the antenna-configuration timescale.
Variant Attribution and Shifted Conditions
Controlled variants of the learned stage and its behavior under shifted conditions are examined next and are visualized in Figure 5. Table 2 presents the complete APCS-Boost-RG framework, while its internal stages, from APCS-Boost through the robust core APCS-Boost-R to the learned variants, are examined here through Table 8. The source of the gain is examined through three controlled variants, whose central-cell outcomes are included in Table 8. Bold entries identify the best point estimate: exact surrogate ranking evaluates every feasible exchange in the current neighborhood, and the reported times are normalized through the APCS-Boost-R runtime measured in both software environments. First, when the learned term of Equation (42) is removed and the identical certified stage ranks exchanges by the exact surrogate change over the complete single-exchange neighborhood, a paired gain of bit/s/Hz with is obtained and 73% of the networks return identical subsets under the two rankings. The learned and exact rankings are statistically aligned, while the learned key produces a tighter paired interval whose gain relative to APCS-Boost-R excludes zero. Most of the additional gain is enabled by the exhaustive certified single-exchange neighborhood and the learned residual concentrates that gain into more stable paired outcomes. Second, when the identical architecture is trained on labels from a per-cell oracle that maximizes each cell’s own achieved rates while the neighboring subsets are held fixed, the same certified stage accepts a comparable 1.62 exchanges per network, yet the paired change is reduced to bit/s/Hz. Under the tested model, training split and interference-coupled operating point, network-level labels provide the effective training signal. With equal exchange budgets, the network-labeled ranking selects exchanges that preserve a positive paired gain after interference coupling, while the per-cell ranking produces a neutral outcome. Third, when both oracle procedures are started from the same APCS-Boost-R subset, the measured headroom is 21.6% for the per-cell objective and 7.2% for the network partial-response objective. These values share a starting subset but optimize different quantities, while the approximately 6% value in Section 4.2 is an own-cell diagnostic started from APCS-Boost and evaluated within its allotted hill-climb budget. The three objectives and starting points are summarized in Table 3.
Figure 5.
Paired central-cell sum spectral efficiency changes of the learned-stage variants relative to APCS-Boost-R.
Under the tested learned variants, preservation of the surrogate floor is provided directly by the certification rule. When the tolerance is widened to and limited surrogate descent is admitted, the paired change becomes bit/s/Hz with ; the per-cell-labeled variant produces . The learned residual attains a magnitude-weighted directional accuracy of 0.851 on held-out first-round exchange tables and an unweighted sign accuracy of 0.608, as defined in Appendix B. These values support verification before learned proposals are accepted. A loss of 0.8% is observed for the one-percent certification-band variant. A larger loss is observed for GNN-Top-L, in which the algebraic seed, projected exchanges and certification are bypassed together. This direct selector loses bit/s/Hz or 8.6% and requires 4.4 ms. Because the direct selector bypasses the seed, projected refinement and certification together, its result quantifies the value of the integrated architecture. The seed-residual ablation produces a paired change of . Together, the variants support the proposed integration in which network-level learned ranking is combined with algebraic feasibility and a calibrated utility floor.
Shifted-condition robustness is examined at pilot SNRs of 6 dB and 14 dB, which were not used in the fixed 10 dB training corpus. The paired changes of and bit/s/Hz both include zero, with 0.88 and 1.54 exchanges accepted per network and 90% and 78% of the networks returned unchanged. These results demonstrate protection by the certified floor, not positive out-of-distribution generalization. Accordingly, no broader generalization interpretation is adopted. After complete regeneration of the fixed-10-dB and mixed-SNR corpora, the fixed-condition and mixed-condition validation correlations at 6, 10 and 14 dB are 0.493/0.499, 0.498/0.500 and 0.483/0.492, respectively; the corresponding directional ranking accuracies are 0.752/0.752, 0.768/0.768 and 0.784/0.790. The differences are small and are not consistently favorable across both metrics, so mixed-SNR retraining does not establish a practically meaningful broad-distribution gain and learned performance claims remain restricted to the trained operating distribution.
5.4. Replication Stability and Single-Impairment Sweeps
The five replication means of APCS-Boost-R are 20.146, 19.718, 19.214, 19.121 and 18.619 bit/s/Hz, with a standard deviation of 0.586. The corresponding means of APCS-Boost are 19.536, 19.212, 18.694, 18.699 and 18.239, with a standard deviation of 0.505. The absolute level varies by approximately 1.5 bit/s/Hz across replications, while the ordering is preserved in every replication. The paired design isolates the method effect from scene-level variation and resolves the APCS-Boost-R advantage with . Across-replication spread is therefore reported together with the paired significance of the comparison.
The estimation and contamination impairments are examined next in isolation. Each panel of Figure 6 uses 100 paired realizations with common geometry, LOS state, shadowing and small-scale random variables, while impairments not under examination are disabled. Error bars denote 95% confidence intervals over the paired realizations. In Figure 6a, the pilot SNR is varied while inter-cell data interference is disabled and pilot sets are orthogonal across the three cells. APCS-Boost-R increases from 5.630 bit/s/Hz at dB to 33.102 bit/s/Hz at 20 dB. Over the same range, NMSE decreases from 0.767 to 0.0103. At a pilot SNR of 10 dB, 23.642 bit/s/Hz is achieved by APCS-Boost-R, compared with 23.362 for APCS-Boost, 22.549 for greedy selection and 21.958 for GA. The advantage of APCS-Boost-R over APCS-Boost is between 0.9% and 1.5% across the isolated estimation sweep and increases to 2.58% at the joint operating point. With neighbor activity disabled, approaches the normalized noise floor while the estimation-error correction in Equation (29) varies with pilot quality. The stronger joint-point gain therefore confirms the value of calibration when the modeled impairments interact.
Figure 6.
Controlled single-impairment sensitivity of APCS-Boost-R under the paired evaluation protocol. (a) Imperfect channel estimation; (b) Pilot contamination; (c) Spatial correlation; (d) Multi-cell interference.
Pilot contamination is isolated in Figure 6b using 20 dB pilot SNR and disabling downlink inter-cell interference. A sum spectral efficiency of 29.774 bit/s/Hz is obtained by APCS-Boost-R with a reuse factor of one, while 33.102 bit/s/Hz is obtained with a reuse factor of three. The 11.2% sum-rate increase is accompanied by a larger relative minimum-rate improvement from 0.496 to 1.064 bit/s/Hz. The weakest user is therefore affected more strongly by pilot-sharing channels than the cell aggregate. NMSE falls from 0.0244 to 0.0103 when the contaminating cells are separated into distinct pilot groups. APCS-Boost-R remains above both search baselines for each reuse factor. The results indicate that the proposed antenna selector and pilot coordination provide complementary mechanisms for improving aggregate and weak-user performance.
The correlation and interference impairments are examined next in isolation. In Figure 6c, ASD is varied from to under perfect CSI, unique pilot groups and no neighbor-cell data interference. Energy is concentrated into fewer angular directions by a small ASD and inter-column dependence is increased. APCS-Boost-R changes from 39.090 bit/s/Hz at to 41.088 bit/s/Hz at , corresponding to only a 4.86% loss at the most concentrated point. The minimum-user rate changes from 0.962 to 1.166 bit/s/Hz. The intended role of D-optimal selection is supported by the moderate degradation. Redundant high-norm antennas are not automatically retained because determinant gain favors columns that expand the user-channel volume.
In Figure 6d, the neighbor-cell activity factor is varied under perfect CSI. APCS-Boost-R decreases monotonically from 40.344 bit/s/Hz with inactive neighbors to 35.984 bit/s/Hz at full activity, a 10.81% reduction. The minimum-user rate falls more sharply from 1.105 to 0.573 bit/s/Hz. At full load, APCS-Boost-R remains above greedy search by 1.284 bit/s/Hz and GA by 1.794 bit/s/Hz. The cell-edge user remains the most interference-sensitive case. The current selector operates without cross-cell channel exchange, while the measurement report supplies user-specific interference information locally. Coordinated cross-cell information could enable additional interference nulling and therefore remains a meaningful extension.
5.5. Additional Practicality, Sensitivity and Coordination Examinations
The following checks examine whether the principal conclusions depend on baseline budget, ideal measurement reports, a particular conditioning guard or ZF-only evaluation. Unless otherwise stated, the same equations and system parameters are used. The baseline-budget, EE, report, condition-number, RZF and dynamic-neighbor coordination studies use five deterministic replications of 20 paired scenes, giving 100 scenes per reported configuration; the D-optimal correlation study uses 50 scenes with 200 random feasible subsets per scene.
The baseline search budget is examined by strengthening both external search families over 100 paired scenes, as reported in Table 9. The 64-by-32 GA closes much of the quality gap but remains below APCS-Boost-R and requires approximately 11.72 times the reference implementation runtime of APCS-Boost-R. Full greedy construction from the empty set also improves over the eight-column start, but remains below APCS-Boost-R and requires approximately 2.13 times its runtime. The principal-table budgets are therefore not the sole reason for the reported ordering. All six sum-SE point estimates in Table 9 are reproduced by the reference implementation to the reported precision. The normalized runtime ratios in this additional examination are wall-clock measurements from the documented reference host and are therefore not used to replace the principal environment-normalized times in Table 7.
Table 9.
Baseline search-budget sensitivity over 100 paired scenes.
Measurement-report imperfections are examined by perturbing the scalar report under controlled conditions. The ideal report is replaced by a log-domain quantized report, a multiplicative log-normal error and a stale first-order report. Four-bit quantization changes the mean sum SE from 19.963 to 19.909 bit/s/Hz on the 100-scene sensitivity set. A 3 dB report-error standard deviation gives 19.966 bit/s/Hz and a staleness correlation of 0.90 gives 20.059 bit/s/Hz. The changes are small relative to the corresponding 95% uncertainty widths of approximately 0.64 to 0.67 bit/s/Hz. These results support tolerance within the tested report-error model only; they are not a substitute for waveform-level feedback-delay evaluation.
The condition-number guard is examined to determine whether it acts as a numerical safeguard or a design driver. Table 10 shows that the threshold acts as a guard rather than a design driver once it exceeds about . Tight thresholds trigger frequent fallback and reduce the achieved rate, whereas , , and the unbounded case lie on a broad performance plateau. The median and 95th-percentile Gram condition numbers of the unconstrained returned subsets are and , respectively.
Table 10.
Sensitivity to the final Gram condition-number guard over 100 paired scenes.
The adaptive execution rule of Section 4.5 is examined through a gate sweep with sum-rate retention values from 0.75 to 0.95 and minimum estimated-rate gates of 0.5 and 1 bit/s/Hz at the joint operating point. The selected cardinality remained 16.0 for every tested gate. Additional checks at neighbor activities 0, 0.25 and 0.5 and pilot SNRs 15 and 20 dB also retained 16 chains under the stated W power model. The adaptive mode therefore does not demonstrate a useful cardinality trade-off in the present hardware and quality-of-service (QoS) regime. APCS-Boost-EE is consequently removed from the principal contribution claims and is retained only as a negative ablation showing that RF-chain deactivation is not automatically beneficial.
The regularized ZF extension of Section Extension to Regularized ZF is examined using the same returned antenna subsets and a loaded selection variant. Table 11 evaluates the final subsets with RZF using . RZF raises all methods, while the ordering of the principal selectors is preserved. The loaded APCS-Boost-R extension of Equation (34) provides the best mean on this sensitivity set. This demonstrates that the framework is not tied to evaluating the returned subset with strict ZF, while the manuscript does not claim that the diagonal loaded surrogate is an exact minimum mean-square-error or RZF SINR.
Table 11.
ZF and RZF compatibility over 100 paired scenes.
The relationship between D-optimality and ZF is assessed through both the algebraic derivation and a numerical correlation study. The exact algebraic bridge is given in Appendix A. Numerically, over 50 scenes with 200 random feasible subsets per scene, the mean Spearman correlation between the whitened log determinant and the calibrated surrogate sum rate is . The corresponding correlation with the achieved true-channel ZF sum rate is . D-optimality is therefore not asserted to be equivalent to ZF rate maximization; it is supported as a high-quality conditioning and volume initializer for the subsequent ZF-oriented refinement.
Dynamic neighboring decisions, centralized coordination and pilot reuse are examined to quantify the effect of cross-cell coupling without altering the distributed headline method. All principal multi-cell results already select all three cells before the true-channel downlink evaluation, so the reported deployed gain is not evaluated with frozen neighboring precoders. The partial-response oracle freezes neighbors only when producing offline labels. A direct frozen-neighbor bias diagnostic independently optimizes each cell from the same APCS-Boost-R network state and then applies the three resulting subsets simultaneously. Over 100 exact-oracle scenes, the sum of the independently predicted improvements is % of the starting network utility, while the simultaneously realized improvement is %. The retained fraction is and the measured optimism is percentage points. The retained fraction and percentage diagnostics are computed per scene and then averaged, so they need not equal ratios formed from the printed aggregate means. This network-level frozen-neighbor diagnostic is distinct from the local headroom quantities reported in Table 3. Thus, the frozen-neighbor teacher does not exhibit positive optimistic bias in this study; the small negative value indicates that simultaneous realization is slightly better than the sum of independently predicted gains. Dynamic coupling is evaluated separately by comparing simultaneous distributed APCS-Boost-R, iterated own-cell best response and centralized cyclic coordinate ascent on the true network sum rate under reuse one. The distributed network sum rate is bit/s/Hz, and the coordinated reference is bit/s/Hz, giving a coordination gap of %. The coordination gap is computed per scene and then averaged, rather than being formed from the ratio of the two printed mean network rates. Iterated best response reaches bit/s/Hz. In the unilateral-deviation test, the mean own-cell gain is bit/s/Hz, and the associated network change is also positive, bit/s/Hz; no prisoner’s-dilemma cases are observed in the 100-scene exact-oracle sample. The results show a coordination gap, but they do not support either a systematic optimistic-label bias or a prisoner’s-dilemma failure mode under the tested sample.
Learned-stage data sufficiency and scope are assessed through corpus scaling, multiple initializations and shifted-condition diagnostics. The training split contains 299,520 dense first-round exchange labels before trajectory constraints are counted. A validation scaling diagnostic using the same 3024-parameter message-passing architecture and independently generated central-cell graphs was run at 40, 80, 160 and 320 scenes. Validation correlation is 0.425, 0.565, 0.525 and 0.545, while validation directional ranking accuracy is 0.776, 0.817, 0.782 and 0.801, respectively. The 320-scene five-initialization diagnostic gives validation correlations from 0.488 to 0.537 and ranking accuracies from 0.778 to 0.797 at 40 training epochs. These results do not show a collapse with increasing scene count or initialization. After the final corpus regeneration, mixed-SNR retraining produces only small, metric-dependent changes at 6, 10 and 14 dB and does not establish a practically meaningful broad-distribution gain. The learned-stage performance assessment is therefore scoped to the trained distribution, and zero-tolerance certification is treated as surrogate-level protection rather than evidence of broad generalization.
5.6. Additional Robustness and Generalization Examinations
The following examinations are deliberately additive. They do not regenerate, replace or retune the 200-realization principal comparison in Table 7; instead, each uses an independent deterministic seed stream to test one modeling assumption without altering the principal evaluation. Unless noted otherwise, 100 paired extension scenes are used and 95% confidence intervals are reported. Absolute sum-SE levels from different extension streams are not compared across streams. The practical-sensitivity stream is anchored near 19.963 bit/s/Hz, the factorial stream near 19.915 bit/s/Hz and the scalability endpoint control near 20.426 bit/s/Hz; only paired differences within the corresponding stream are interpreted.
The attribution analysis of Section Attribution of Calibrated Information and Whitened Seed is extended by a factorial examination that keeps the APCS search family unchanged while isolating calibrated scoring, interference whitening and refinement depth. To separate changes that occur simultaneously in APCS-Boost-R, an APCS-only examination independently toggles calibrated scoring , interference-whitened D-optimal seeding and refinement depth . The exchange shortlist, projections, utility weights and terminal validation are otherwise unchanged. Figure 7 reports the eight resulting operating points. Averaged over the other two factors, the paired marginal effects on sum SE are bit/s/Hz for calibration, bit/s/Hz for whitening and bit/s/Hz for increasing the depth from three to eight rounds. The paired Shapley decomposition of the total change of bit/s/Hz assigns bit/s/Hz to calibration, bit/s/Hz to whitening and bit/s/Hz to refinement depth. At the fully enabled operating point, removing calibration changes 19.915 to 19.623 bit/s/Hz, removing whitening changes 19.915 to 19.902 bit/s/Hz and reducing the depth changes 19.915 to 19.844 bit/s/Hz on this independent extension stream. The factors therefore interact: the whitening Shapley interval includes zero, and no fixed percentage split between calibration and geometry is claimed. Whitening is nevertheless retained because it defines the interference-aware seed metric, and the whitened log determinant has a measured correlation of with the calibrated surrogate across random feasible subsets.
Figure 7.
APCS-only factorial attribution of calibrated scoring, whitened seeding and refinement depth.
Report consistency is examined by comparing the sounding report with the returned-subset report and by evaluating optional post-selection refreshes. Equation (30) specifies the sounding subset, ZF sounding precoder, simultaneous neighboring-cell configuration and normalization used by the baseline report. Quantization, error and staleness are examined in Section 5.5. The report is also recomputed after the returned subset, and one or two additional selection passes are evaluated, while the principal one-pass algorithm remains unchanged. The seed-to-final report changes by a mean relative distance of and a mean absolute difference of dB, while the subset Jaccard similarity after one refresh is . Despite this measurable report change, one refresh changes the additional-set sum SE by only bit/s/Hz relative to the fixed-report selector and a second refresh by bit/s/Hz. Thus, the fixed report is not numerically identical to the final-subset report, but refreshing it does not provide a statistically resolved rate benefit in this examination.
For the estimation-error term, an offline covariance-aware reference uses
The covariance-aware leakage of Equation (44) is evaluated with a Gaussian local-scattering covariance normalized to the same per-antenna error variance as Equation (32). On the sounding seed, the covariance-aware and scalar leakage corrections have a mean correlation of . Their mean relative magnitude difference is 0.161, but replacing the scalar correction by the covariance-aware seed-level scalar changes sum SE by only bit/s/Hz. This result supports the scalar term as a low-overhead approximation for the tested correlated channel while leaving arbitrary covariance structures outside the present scope.
Extreme spatial correlation is examined specifically to determine whether the scalar leakage projection remains adequate when the angular spread becomes very small. A separate 100-scene-per-point extension concentrates on ASD values of , , , and . The normalized angular covariance used by the covariance-aware benchmark has a maximum diagonal deviation from unity below over the tested angles, confirming that the marginal per-antenna variance in Equation (32) is unaffected by ASD within this model. The quantity that changes is the directional projection of the correlated error. Defining the directional-inflation factor as covariance-projected residual leakage divided by the isotropic scalar prediction, the mean factors are 0.956, 0.961, 0.963, 0.979 and 0.993 as ASD increases from to . Table 12 shows that the covariance-aware selector does not improve the achieved sum SE at the most concentrated point. At it changes the scalar-selector result by bit/s/Hz with . Very small ASD therefore produces a measurable anisotropic projection mismatch, but the additional covariance information does not justify replacing the scalar correction at the evaluated operating point.
Table 12.
Small-ASD comparison of scalar and covariance-aware residual error corrections.
Spherical-wave sensitivity is examined because the principal user-distance range crosses the conventional Fraunhofer boundary of the full array. Accordingly, a separate spherical-wave sensitivity operator is applied to every BS-to-UE link while preserving the principal large-scale coefficients and scattering realization. For element coordinate , range r and azimuth , the additional range-dependent manifold is defined in Equation (45) as
The principal plane-wave results are retained. Instead, three distance bands are regenerated as independent extension sets, and the selector is re-applied using spherical-wave CSI. As shown in Figure 8, the far-field/spherical-wave reselected means are 21.614/21.740 bit/s/Hz at 35 to 80 m, 21.421/21.414 at 80 to 170 m and 16.387/16.516 at 170 to 220 m. If the far-field-selected subset is frozen and evaluated after spherical-wave re-estimation, the corresponding means fall to 20.789, 20.563 and 15.952 bit/s/Hz. The result therefore supports re-applying the algebraic selector to the available near-field CSI rather than assuming that a subset selected under a plane-wave manifold is invariant to range curvature.
Figure 8.
Spherical-wave sensitivity of reselected and frozen antenna subsets across three distance bands.
Aperture-block design and sparse-array behavior are examined through block-count ablations and array-manifold diagnostics. The four-block projection is generalized only for this extension by partitioning the M elements into contiguous blocks and requiring at least one selected element in every block, with . Values are tested at ASD values of , , and . At the nominal ASD, the mean sum SE values for one, two, four, eight and sixteen blocks are 19.968, 20.037, 20.003, 19.764 and 18.790 bit/s/Hz, respectively. The corresponding mean normalized effective apertures are 0.887, 0.888, 0.907, 0.928 and 0.953. The two- and four-block cases are statistically aligned, while forcing sixteen blocks sacrifices rate despite maximizing physical spread. Figure 9 visualizes representative layouts. Across the ASD sweep, the extension also records normalized effective aperture, 10-degree-grid manifold coherence, broadside 3-dB beamwidth and peak sidelobe level in the underlying validation outputs. Four blocks are therefore retained as a moderate coverage prior for , not as a universally optimal partition.
Figure 9.
Representative central-cell antenna layouts for the aperture-block ablation at ASD. Marker colors denote the coverage-block setting: blue for , orange for , green for , red for and purple for .
To make the dependence on M and L explicit without changing the principal configuration, a separate 50-scene scaling extension evaluates with . For , the corresponding mean sum SE values are 9.856, 19.686 and 26.636 bit/s/Hz; for , they are 7.923, 19.648 and 26.647 bit/s/Hz. Thus, a very restrictive block count is harmful when L is small, whereas moderate block counts are nearly aligned for the larger configurations. A second 50-scene extension fixes and conditions the channel generation on LOS or NLOS while sweeping ASD from to . At ASD, the LOS/NLOS normalized apertures are 0.903/0.920, coherence values are 0.471/0.466, broadside 3-dB beamwidths are and peak sidelobe levels are −5.663/−5.700 dB. The complete ASD-conditioned values are retained in the underlying validation outputs, so the block rule is characterized under both propagation conditions rather than being justified only by spectral efficiency.
Hardware, mobility and frequency-selective effects are examined as additional robustness checks without redefining the principal channel model. A final auxiliary study keeps the deployed selector and its returned subset fixed and perturbs only the evaluation layer. Independent element gain errors, element phase errors, a controlled Toeplitz mutual-coupling operator and switch insertion loss are applied to the true downlink channel without retraining or retuning. On the independent 100-scene hardware stream, the ideal extension reference is bit/s/Hz. Representative values are 18.539 for 1 dB gain-standard-deviation error, 17.924 for phase-standard-deviation error, 18.293 for coupling coefficient 0.06 and 18.521 bit/s/Hz for 1 dB insertion loss. A combined moderate point (1 dB gain error, phase error, coupling 0.06 and 1 dB insertion loss) yields bit/s/Hz. RF-chain mismatch is examined separately on 50 paired extension scenes by applying independent gain/phase perturbations only to the selected active ports; the mean sum SE values are 19.453, 18.083 and 14.540 bit/s/Hz for , and mismatch levels, respectively. These are sensitivity-model results rather than hardware-in-the-loop measurements, and the learned residual is not claimed to generalize to untrained hardware shifts.
Mobility is included only as an additional channel-aging sensitivity examination and does not change the quasi-static headline evaluation. At 3.5 GHz, Jakes correlation is mapped from velocity and report/selection delay. With a 1 ms delay, the correlations for 3, 30, 60 and 120 km/h are approximately 0.999, 0.909, 0.660 and , respectively. When the selected subset and CSI are held fixed while the true channel is evolved with these correlations, the corresponding additional-set sum SE values are 19.724, 14.279, 7.010 and 1.160 bit/s/Hz, compared with 19.770 for zero mobility. This examination is not designed as a dedicated high-mobility robustness study. The principal evaluation is quasi-static and therefore does not invoke a mobility-specific refresh or adaptation mechanism. Dedicated high-mobility operation together with adaptive CSI/report refresh and tracking is reserved for future work.
Frequency selectivity is examined with an auxiliary four-tap, eight-subcarrier channel generated from the same large-scale scene, while one common subset is retained across frequency. The mean subcarrier sum SE values are for APCS-Boost-R, for APCS-Boost, for greedy selection and bit/s/Hz for GA on 100 extension scenes. The ordering is therefore preserved in this controlled common-subset stress test, but the paper does not claim a complete wideband beam-squint or polar-domain channel-estimation solution.
Configuration scalability is examined without changing the principal operating point by varying the array size, RF-chain count, user count and number of cells independently. The principal , , , three-cell comparison remains unchanged. A separate 100-scene-per-point extension varies one dimension at a time over with , at , at and the number of cells . APCS-Boost-R returns a feasible subset at every tested point. Figure 10 reports the paired APCS-Boost-R-minus-APCS-Boost sum-SE differences. The strongest gains occur in the most RF-chain-constrained cases, for example bit/s/Hz at , whereas the point gives bit/s/Hz. Several loose-chain or large-array intervals include zero, so a configuration-independent positive gain is not claimed. Across the cell-count sweep, the paired gains remain positive by point estimate from one to seven cells and range from to bit/s/Hz. Endpoint controls in Table 13 retain APCS-Boost-R above greedy and GA at the principal-dimensional anchor, at , at and at seven cells. These results extend the tested scope without replacing the principal operating point.
Figure 10.
Configuration scalability of APCS-Boost-R relative to APCS-Boost across antenna, RF-chain, user and cell dimensions.
Table 13.
External-baseline endpoint controls for the configuration-scalability examination.
The relationship between the deterministic surrogate certificate and realized-channel performance is examined separately so that the guarantee is not interpreted more broadly than intended. A separate 100-scene diagnostic is used only to test what the deterministic certificate does and does not imply. The same 3024-parameter architecture is retrained on 160 independently generated central-cell scenes for this diagnostic, and 37 exchanges are accepted across seven of the 100 evaluation scenes. All accepted exchanges satisfy the calibrated surrogate floor by construction. However, only 54.1% also produce a non-decreasing central-cell true-channel rate, and 51.4% produce a non-decreasing true network rate. The Spearman correlations between surrogate change and true central-cell/network changes are 0.565 and 0.520. Averaged over the final returned subsets, the true central-cell and network changes are and bit/s/Hz, respectively. Table 14 therefore confirms empirically that the certificate is a surrogate-and-feasibility guarantee, not a per-exchange throughput, energy-efficiency or robustness guarantee. This diagnostic uses an independent retrain on a separately generated corpus, so its concordance statistics do not calibrate the principal learned model. It is separate from the principal learned-stage result of bit/s/Hz and does not replace it. The engineering implications are consolidated in Section 5.7.
Table 14.
Empirical relationship between the surrogate certificate and realized true-channel changes.
5.7. Interpretation and Evaluation Scope
Four conclusions are supported by the results. First, under the tested conditions, the quality advantage of APCS-Boost and APCS-Boost-R over GA and greedy search is retained without independent Rayleigh fading or perfect CSI. Second, the results demonstrate that calibration of the selection objective to estimation uncertainty and inter-cell interference is more consequential than simply increasing the search effort. Third, when a selection method is developed under idealized assumptions, the residual gap is more likely to reside within the objective than within the search procedure. Objective correction remains inexpensive when the correction can be expressed as a per-user scalar. Fourth, weak-user metrics expose impairment effects that are partially hidden by the sum rate and indicate that antenna selection should be combined with pilot assignment, user scheduling and inter-cell coordination to obtain further cell-edge improvements.
The optional graph-learning stage provides a small statistically resolved improvement at the principal operating point while preserving the stage-one calibrated surrogate floor. The certificate applies to this surrogate-and-feasibility floor only; the realized true-channel diagnostic shows that it is not a per-exchange throughput or robustness guarantee. The variant analysis of Section Variant Attribution and Shifted Conditions includes the shifted pilot-SNR tests and the regenerated mixed-condition diagnostic. These tests do not establish a practically meaningful broad-generalization result. The learned stage is therefore positioned as a certified in-distribution refinement, while APCS-Boost-R remains the preferred engineering operating point when computation and model-maintenance budgets dominate. Cross-cell channels are used only during offline label generation, and deployment inference requires own-cell inputs with no runtime cross-cell signaling. The additional M, L, K and cell-count sweep shows that the algebraic robust stage remains feasible across all tested configurations and generally retains a positive paired point estimate, while the magnitude depends strongly on RF-chain tightness and some wide-chain/large-array confidence intervals include zero.
The evaluated principal backend remains a narrowband spatial realization of the 3GPP UMa large-scale equations and targets system-level spectral efficiency, user fairness, outage and energy efficiency. Independent per-link shadow fading and a quasi-static user layout are used so that antenna-subset effects can be isolated. Distributed execution is preserved because antennas are selected independently by the base stations from local information without interference-price or covariance exchange. ZF precoding and equal per-user power remain fixed in the principal comparison. The spherical-wave, mobility, hardware and frequency-selective examinations in Section 5.6 are intentionally auxiliary sensitivity examinations and do not replace the principal channel backend or its reported values.
The controlled evaluation establishes the reported ordering for the utility and seed constants listed in Section 5, with , and . Budget, report, condition-number, RZF, coordination, causal-attribution, report-refresh, covariance, near-field, aperture, hardware, mobility and common-subset frequency-selective checks are reported as additional examinations. Standardized CQI/CSI feedback procedures, full wideband polar-domain spatial non-stationarity, explicit electromagnetic coupling measurements, beam squint and hardware-in-the-loop timing remain outside the present evidence. The implications of these boundaries are synthesized in Section 6.
6. Conclusions and Future Work
This section summarizes the principal findings, their scope and the directions retained for future work. Antenna selection has been examined under a 3GPP TR 38.901-derived three-cell massive-MIMO model that combines imperfect pilot-based estimation, pilot contamination, spatial correlation and multi-cell downlink interference. A diagnosis established that objective calibration provides the principal opportunity beyond additional search effort because achieved-rate hill climbing exposed approximately 6% improvement while true-channel substitution alone did not alter the selected outcome. APCS-Boost-R was consequently developed. In the proposed method, the per-user surrogate is divided by an effective noise term that combines a measured interference report with a closed-form estimation-error correction, while the D-optimal seed is constructed from the interference-whitened estimate. Since both corrections are per-user scalars, the Sherman–Morrison exchange machinery and the complexity order are preserved.
Over 200 paired realizations under joint stress, sum spectral efficiency is improved by 2.58% with APCS-Boost-R over APCS-Boost, 6.76% over greedy selection and 10.16% over GA. Energy efficiency is improved from 0.497 to 0.510 bit/J/Hz. Execution-time results are reported and interpreted with the corresponding principal-selector and learned-stage evaluation results. The original hardware metadata for the archived optimized/environment-normalized Time records were not retained, so their comparisons are restricted to within-record interpretation. The documented-host reconstructions are reported separately, and no cross-record speed, latency or overhead factor is inferred. The cross-algorithm ablation confirms that calibrated information benefits greedy and genetic search as well as APCS, but those different search procedures are not converted into a fractional causal attribution. The APCS-only factorial examination instead shows a positive average marginal calibration effect, a smaller interaction-dependent whitening effect and a modest depth effect on its independent extension stream. Minimum-rate and outage performance are preserved within statistical uncertainty in the principal comparison, while complementary pilot assignment, user scheduling and inter-cell coordination remain direct extensions for further weak-user gains.
APCS-Boost-RG is retained as an optional certified learning extension. Its paired gain of bit/s/Hz is statistically resolved but corresponds to only about 0.1% of the APCS-Boost-R mean. Within the archived environment-normalized learned-stage record, the selection time increases from 20.4 to 24.0 ms, corresponding to an 18% within-record increase. Because the original hardware metadata for that record were not retained, the 18% value is not presented as a hardware-independent latency or overhead factor. The documented-host reconstructions are interpreted separately. The exact-surrogate control indicates that most of the 20.4-to-24.0 ms within-record increment is associated with certified second-stage neighborhood evaluation rather than inference by the 3024-parameter model. The learned stage is therefore not claimed to dominate APCS-Boost-R in engineering efficiency. Training stability is supported by the scene-scaling and multi-initialization diagnostics. The fully regenerated mixed-condition experiment does not establish a practically meaningful broad positive generalization result, so learned-stage performance claims are restricted to the trained distribution. The deterministic certificate is explicitly limited to the calibrated surrogate and feasibility constraints. A separate true-channel diagnostic satisfies the surrogate floor for every accepted swap but does not provide per-exchange guarantees on realized throughput or network performance.
The additional checks show that stronger GA and greedy budgets do not reverse the ordering without substantial extra computation. The conditioning guard is located on a broad performance plateau, while report quantization, report error and report aging remain well tolerated within the tested system-level sensitivity model. No statistically resolved benefit is produced by one report refresh; the scalar error correction remains closely aligned with the covariance-aware benchmark and the selector ordering is preserved under RZF. Viable re-selection is also retained with spherical-wave CSI, while four aperture blocks provide a moderate coverage constraint rather than an extreme geometric restriction. Gradual degradation is observed under controlled hardware perturbations, and the selector ordering is retained in the auxiliary eight-subcarrier common-subset examination. Mobility is considered only through an auxiliary sensitivity mapping, while the quasi-static principal evaluation does not invoke a dedicated high-mobility mechanism. The adaptive RF-chain examination retains all chains under the evaluated power and QoS regime, which identifies the fixed-cardinality selector as the appropriate operating point for the tested hardware assumptions. A centralized true-network reference exposes a measurable coordination gap under reuse one, whereas the tested unilateral deviations do not exhibit a prisoner’s-dilemma pattern. Feasibility is retained across the additional sweep from 32 to 128 antennas, 8 to 32 RF chains, 4 to 12 users and 1 to 7 cells. Positive point estimates are generally preserved, although smaller effects are observed when the RF-chain constraint is relaxed and some confidence intervals include zero. Future work will address dedicated high-mobility operation through adaptive CSI and report refresh with tracking, standardized feedback procedures, full wideband near-field spatial non-stationarity, measured RF and coupling calibration, hardware-in-the-loop timing with parallel FPGA, GPU or ASIC acceleration and stronger distribution-shift adaptation for the learned residual. A dedicated overlap-aware ablation will also be added to separate the portion of the measured interference report that may already contain estimation-error-induced residual leakage from the analytical estimation-error correction, including report-only, analytic-only, combined and overlap-subtracted variants so that possible double counting can be quantified directly.
Although APCS-Boost-RG currently provides an additional gain of only 0.019 bit/s/Hz over APCS-Boost-R, its principal value is methodological because it demonstrates that graph-learned residual ranking can be integrated with the algebraic selector under deterministic feasibility and surrogate non-degradation checks, while APCS-Boost-R remains the more attractive practical operating point when computational and model-maintenance costs are prioritized.
A limitation of the principal results is that they are obtained with a narrowband plane-wave array manifold. For at 3.5 GHz, the approximate Fraunhofer boundary is 170 m while the evaluated user distances span 35–220 m, so part of the deployment lies in a region where spherical-wave effects may be relevant. The reported spherical-wave sensitivity analysis shows that viable performance is retained when the selector is re-applied using near-field CSI, but this auxiliary examination is not a substitute for a complete near-field wideband model. Consequently, the headline conclusions are scoped to the stated narrowband 3GPP-derived system model, and future work will extend the framework to full wideband spherical-wave and spatially non-stationary channels with near-field-aware CSI acquisition and antenna selection.
Author Contributions
Conceptualization, I.I.; methodology, I.I.; software, I.I.; validation, I.I.; formal analysis, I.I.; investigation, I.I.; writing, original draft preparation, I.I.; writing, review and editing, I.I.; supervision, V.V. All authors have read and agreed to the published version of the manuscript.
Funding
This research received no external funding.
Institutional Review Board Statement
Institutional review board approval was not required because no human participants or animals were involved in the simulation study.
Informed Consent Statement
Informed consent was not required because no human participants were involved in the study.
Data Availability Statement
The data and source code supporting the findings of this study will be made available after acceptance upon reasonable request to the corresponding author.
Conflicts of Interest
The authors declare no conflicts of interest.
Abbreviations
The following abbreviations are used in this manuscript:
| 3GPP | Third Generation Partnership Project |
| APCS | algebraically projected antenna selection |
| ASD | azimuth spread of departure |
| BS | base station |
| CSI | channel state information |
| CDL | clustered delay line |
| EE | energy efficiency |
| GA | genetic algorithm |
| GNN | graph neural network |
| LMMSE | linear minimum mean square error |
| LOS | line of sight |
| MIMO | multiple-input multiple-output |
| NLOS | non-line of sight |
| NMSE | normalized mean-square error |
| RF | radio frequency |
| RZF | regularized zero forcing |
| SINR | signal-to-interference-plus-noise ratio |
| SNR | signal-to-noise ratio |
| TDD | time-division duplex |
| TDL | tapped delay line |
| UE | user equipment |
| UMa | urban macro |
| ZF | zero forcing |
Appendix A. Relation Between the Whitened D-Optimal Seed and ZF Surrogate Rates
This section provides the algebraic relation between the whitened D-optimal initializer and the ZF-oriented surrogate. Let and let be the Gram matrix after the whitening of Equation (33). Since is positive diagonal,
Combining Equation (A1) with Equation (28) gives the exact identity
Equation (A2) shows that the calibrated ZF surrogate is exactly the ordinary inverse-Gram ZF surrogate evaluated in the whitened metric used by the D-optimal seed.
The cofactor identity gives a second connection. If denotes the principal minor formed by removing row and column k, then
Equation (A3) shows that each per-user calibrated surrogate SINR is proportional to a determinant ratio. By Hadamard’s inequality,
The bound in Equation (A4) shows that, when the whitened row energies are bounded by the coverage projection, increasing the determinant raises a common lower bound on the inverse-noise-amplification factor that controls the ZF surrogate. This does not make D-optimality equivalent to sum-rate maximization; it explains why determinant volume is a meaningful initializer before direct ZF-oriented exchange refinement.
A complementary spectral bound follows when . Writing the eigenvalues as yields
Equation (A5) therefore shows that determinant growth under controlled conditioning decreases an upper bound on aggregate ZF inverse amplification. Section 5.5 supplements these identities with the measured log-determinant correlations to the calibrated surrogate and true-channel ZF rates.
Appendix B. Loss Term Definitions
This section provides the exact seed, potential, dense-sign and trajectory ranking losses together with the directional-accuracy diagnostics used to train and evaluate the learned exchange potentials.
The exact form of every term in Equation (40) is provided in this appendix. Let standardize a score vector to zero mean and unit variance within one graph, let subtract the in-subset mean from the in-subset entries and the out-subset mean from the out-subset entries and let denote the least-squares nodal potential fitted to the dense first-round oracle table of the graph. Averages are taken over the graphs of the respective kind.
The standardized auxiliary seed head is regressed onto a least-squares nodal potential on the subset-free graphs through the seed term in Equation (A6).
The group-centered exchange head is regressed onto the group-centered oracle potential on conditioned graphs through the potential term in Equation (A7). Normalization is performed using the standard deviation of the centered potential.
For the dense table with achieved-rate changes over in-subset antennas i and out-subset antennas j, the sign term of Equation (A8) uses the weights normalized to unit mean per graph.
where is the softplus function. Along the oracle trajectory with executed exchanges , the ranking term of Equation (A9) is
and the output penalty of Equation (A10) controls the raw scale of both heads.
The centered terms are invariant to the group offsets removed by at inference, while the output penalty of Equation (A10) controls the absolute scale, so the optimized rankings coincide with the quantities used by the certified key.
The diagnostic accuracies reported in Section 5.3 are read from the same dense first-round tables. With the sign convention of Equation (A8), the magnitude-weighted directional accuracy is defined in Equation (A11).
The unweighted sign accuracy replaces by unit weights. Both are averaged over the held-out first-round tables of the validation scenes. The reported values are and .
Appendix C. Symbols
This section provides the principal notation for the system model, algebraic selector, calibrated surrogate and certified graph-learning stage in a consolidated form.
The principal symbols are listed in Table A1 in the order in which the corresponding quantities are introduced, from the system dimensions through the channel and estimation quantities to the selection utilities and the parameters of the learned stage. Symbols that appear only once and are defined at their point of use are omitted for brevity.
Table A1.
Principal mathematical symbols used throughout the paper.
References
- Marzetta, T.L. Noncooperative Cellular Wireless with Unlimited Numbers of Base Station Antennas. IEEE Trans. Wirel. Commun. 2010, 9, 3590–3600. [Google Scholar] [CrossRef] [Scilit]
- Larsson, E.G.; Edfors, O.; Tufvesson, F.; Marzetta, T.L. Massive MIMO for Next Generation Wireless Systems. IEEE Commun. Mag. 2014, 52, 186–195. [Google Scholar] [CrossRef] [Scilit]
- Ngo, H.Q.; Larsson, E.G.; Marzetta, T.L. Energy and Spectral Efficiency of Very Large Multiuser MIMO Systems. IEEE Trans. Commun. 2013, 61, 1436–1449. [Google Scholar] [CrossRef] [Scilit]
- Björnson, E.; Sanguinetti, L.; Hoydis, J.; Debbah, M. Optimal Design of Energy-Efficient Multi-User MIMO Systems: Is Massive MIMO the Answer? IEEE Trans. Wirel. Commun. 2015, 14, 3059–3075. [Google Scholar] [CrossRef] [Scilit]
- Gao, X.; Edfors, O.; Tufvesson, F.; Larsson, E.G. Massive MIMO in Real Propagation Environments: Do All Antennas Contribute Equally? IEEE Trans. Commun. 2015, 63, 3917–3928. [Google Scholar] [CrossRef] [Scilit]
- Konar, A.; Sidiropoulos, N.D. A Simple and Effective Approach for Transmit Antenna Selection in Multiuser Massive MIMO Leveraging Submodularity. IEEE Trans. Signal Process. 2018, 66, 4869–4883. [Google Scholar] [CrossRef] [Scilit]
- de Souza, J.H.I.; Amiri, A.; Abrão, T.; de Carvalho, E.; Popovski, P. Quasi-Distributed Antenna Selection for Spectral Efficiency Maximization in Subarray Switching XL-MIMO Systems. IEEE Trans. Veh. Technol. 2021, 70, 6713–6725. [Google Scholar] [CrossRef] [Scilit]
- He, K.; Vu, T.X.; Chatzinotas, S.; Ottersten, B. Fast Optimal Antenna Selection for Massive MIMO. In Proceedings of the IEEE 24th International Workshop on Signal Processing Advances in Wireless Communications (SPAWC), Shanghai, China, 25–28 September 2023; pp. 186–190. [Google Scholar] [CrossRef] [Scilit]
- Yu, W.; Wang, T.; Wang, S. Multi-Label Learning Based Antenna Selection in Massive MIMO Systems. IEEE Trans. Veh. Technol. 2021, 70, 7255–7260. [Google Scholar] [CrossRef] [Scilit]
- He, K.; Vu, T.X.; Hoang, D.T.; Nguyen, D.N.; Chatzinotas, S.; Ottersten, B. Risk-Aware Antenna Selection for Multiuser Massive MIMO Under Incomplete CSI. IEEE Trans. Wirel. Commun. 2024, 23, 11001–11014. [Google Scholar] [CrossRef] [Scilit]
- Wang, L.; Chen, C.; Zhang, J.; Fischione, C. Learning-Based Joint Antenna Selection and Precoding Design for Cell-Free MIMO Networks. IEEE Trans. Veh. Technol. 2026, 75, 579–592. [Google Scholar] [CrossRef] [Scilit]
- Björnson, E.; Hoydis, J.; Sanguinetti, L. Massive MIMO Has Unlimited Capacity. IEEE Trans. Wirel. Commun. 2018, 17, 574–590. [Google Scholar] [CrossRef] [Scilit]
- Al-Hussaibi, W.A.; Ali, F.H. A Closed-Form Approximation of Correlated Multiuser MIMO Ergodic Capacity with Antenna Selection and Imperfect Channel Estimation. IEEE Trans. Veh. Technol. 2018, 67, 5515–5519. [Google Scholar] [CrossRef] [Scilit]
- GPP. Study on Channel Model for Frequencies from 0.5 to 100 GHz. Technical Report TR 38.901, Version 19.2.0, Release 19, 3rd Generation Partnership Project. 2026. Available online: https://cdn.standards.iteh.ai/samples/etsi/etsi-tr-138-901-v19-2-0-2026-02-/ef05f3f8aaf648d0a3872e53cd719609/etsi-tr-138-901-v19-2-0-2026-02-.pdf (accessed on 19 August 2026).
- Arash, M.; Yazdian, E.; Fazel, M.S.; Brante, G.; Imran, M.A. Employing Antenna Selection to Improve Energy Efficiency in Massive MIMO Systems. Trans. Emerg. Telecommun. Technol. 2017, 28, e3212. [Google Scholar] [CrossRef] [Scilit]
- Marinello, J.C.; Abrão, T.; Amiri, A.; de Carvalho, E.; Popovski, P. Antenna Selection for Improving Energy Efficiency in XL-MIMO Systems. IEEE Trans. Veh. Technol. 2020, 69, 13305–13318. [Google Scholar] [CrossRef] [Scilit]
- Abbas, W.B.; Khalid, S.; Ahmed, Q.Z.; Khalid, F.; Alade, T.; Sureephong, P. Heuristic Antenna Selection and Precoding for a Massive MIMO System. IEEE Open J. Commun. Soc. 2024, 5, 83–96. [Google Scholar] [CrossRef] [Scilit]
- Wang, H.; Guo, P.; Li, X.; Wen, F.; Wang, X.; Nallanathan, A. MBPD: A Robust Algorithm for Polar-Domain Channel Estimation in Near-Field Wideband XL-MIMO Systems. IEEE Internet Things J. 2025, 12, 18461–18470. [Google Scholar] [CrossRef] [Scilit]
- Wang, H.; Wen, F.; Wang, X.; Du, W.; Gui, G. Hierarchical Channel Estimation for Near-Field Spatial Non-Stationary Channels: A Pre-Selection and Multi-Level Dynamic Threshold Strategy. IEEE Trans. Cogn. Commun. Netw. 2026, 12, 4174–4185. [Google Scholar] [CrossRef] [Scilit]
- Elbir, A.M.; Mishra, K.V. Joint Antenna Selection and Hybrid Beamformer Design Using Unquantized and Quantized Deep Learning Networks. IEEE Trans. Wirel. Commun. 2020, 19, 1677–1688. [Google Scholar] [CrossRef] [Scilit]
- Vu, T.X.; Chatzinotas, S.; Nguyen, V.D.; Hoang, D.T.; Nguyen, D.N.; Di Renzo, M.; Ottersten, B. Machine Learning-Enabled Joint Antenna Selection and Precoding Design: From Offline Complexity to Online Performance. IEEE Trans. Wirel. Commun. 2021, 20, 3710–3722. [Google Scholar] [CrossRef] [Scilit]
- Liu, Z.; Yang, Y.; Gao, F.; Zhou, T.; Ma, H. Deep Unsupervised Learning for Joint Antenna Selection and Hybrid Beamforming. IEEE Trans. Commun. 2022, 70, 1697–1710. [Google Scholar] [CrossRef] [Scilit]
- Hojatian, H.; Mlika, Z.; Nadal, J.; Frigon, J.F.; Leduc-Primeau, F. Learning Energy-Efficient Transmitter Configurations for Massive MIMO Beamforming. IEEE Trans. Mach. Learn. Commun. Netw. 2024, 2, 939–955. [Google Scholar] [CrossRef] [Scilit]
- Yang, X.; Qiu, J.; Mo, D. Energy-Efficient Transmit Antenna Selection with Fast-ABC-Boost. Sci. Rep. 2025, 15, 38735. [Google Scholar] [CrossRef] [Scilit] [PubMed]
- Kim, J.; Lim, H.S.; Choi, K. Certified Robustness of Antenna Selecting Neural Networks for Massive MIMO Wireless Communications. IEEE Access 2025, 13, 88609–88622. [Google Scholar] [CrossRef] [Scilit]
- Ranasinghe, V.; Rajatheva, N.; Latva-aho, M. Graph Neural Network Based Access Point Selection for Cell-Free Massive MIMO Systems. In Proceedings of the 2021 IEEE Global Communications Conference (GLOBECOM), Madrid, Spain, 7–11 December 2021; pp. 1–6. [Google Scholar] [CrossRef] [Scilit]
- Jain, R.; Chiu, D.M.; Hawe, W.R. A Quantitative Measure of Fairness and Discrimination for Resource Allocation in Shared Computer Systems; Technical Report DEC-TR-301; Digital Equipment Corporation: Maynard, MA, USA, 1984. [Google Scholar]
- Golub, G.H.; Van Loan, C.F. Matrix Computations, 4th ed.; Johns Hopkins University Press: Baltimore, MD, USA, 2013. [Google Scholar]
- Gilmer, J.; Schoenholz, S.S.; Riley, P.F.; Vinyals, O.; Dahl, G.E. Neural Message Passing for Quantum Chemistry. In Proceedings of the 34th International Conference on Machine Learning (ICML), Sydney, Australia, 6–11 August 2017; Proceedings of Machine Learning Research (PMLR). Volume 70, pp. 1263–1272. [Google Scholar]
- Shen, Y.; Shi, Y.; Zhang, J.; Letaief, K.B. Graph Neural Networks for Scalable Radio Resource Management: Architecture Design and Theoretical Analysis. IEEE J. Sel. Areas Commun. 2021, 39, 101–115. [Google Scholar] [CrossRef] [Scilit]
- Kingma, D.P.; Ba, J. Adam: A Method for Stochastic Optimization. In Proceedings of the International Conference on Learning Representations, San Diego, CA, USA, 7–9 May 2015. [Google Scholar]
- Jin, G.; Zhao, C.; Fan, Z.; Jin, J. Antenna Selection in TDD Massive MIMO Systems. Mob. Netw. Appl. 2021, 26, 1831–1837. [Google Scholar] [CrossRef] [Scilit]
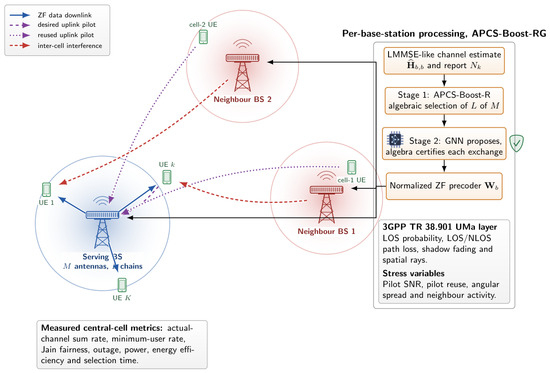
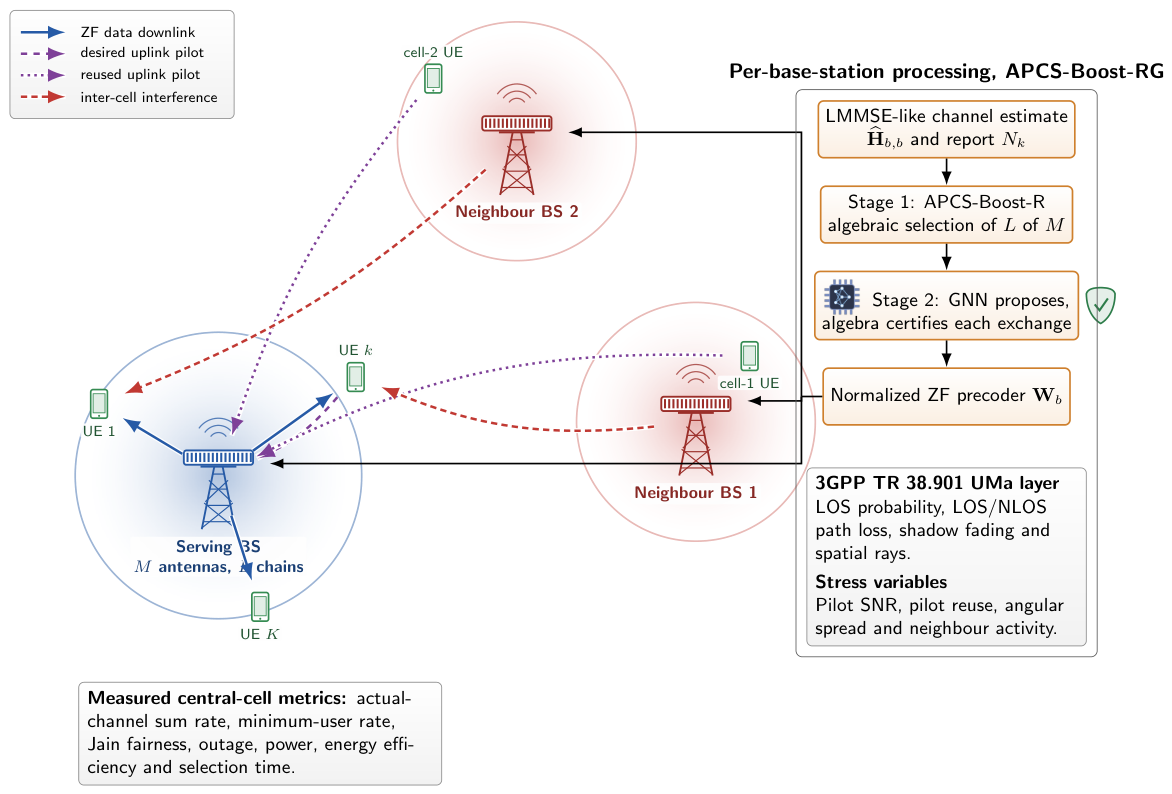
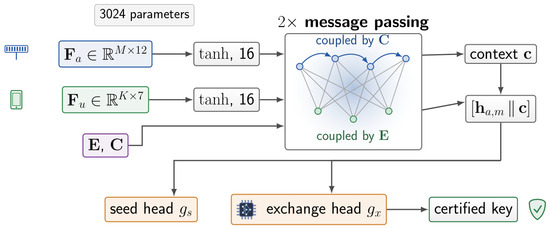
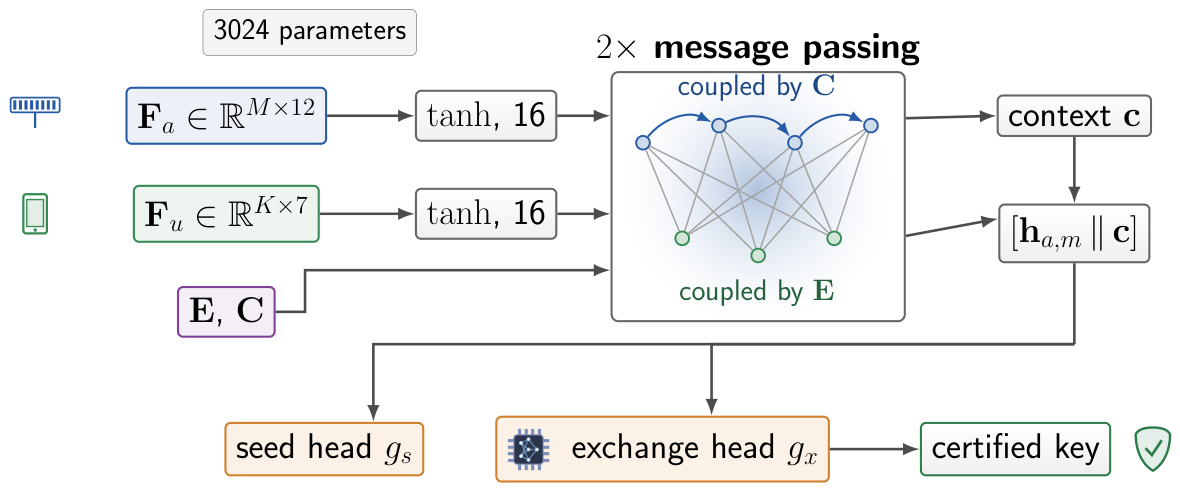
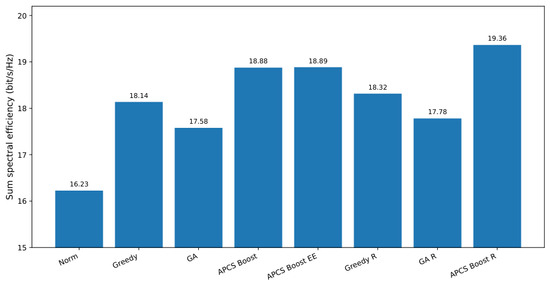
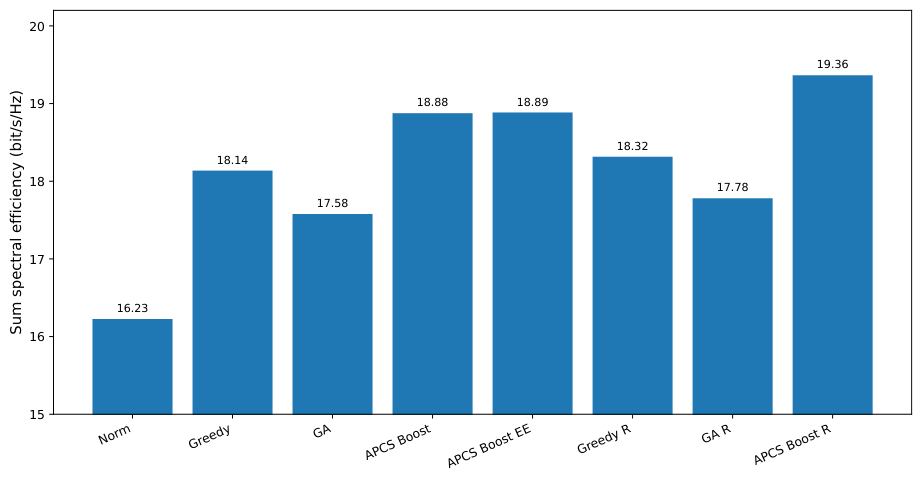
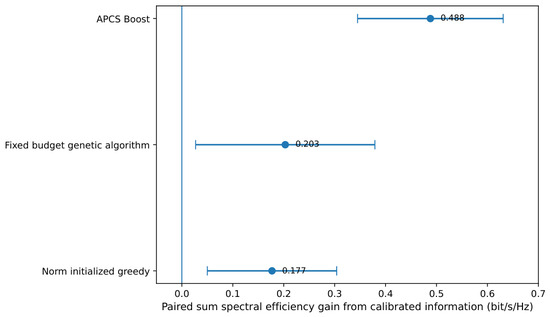
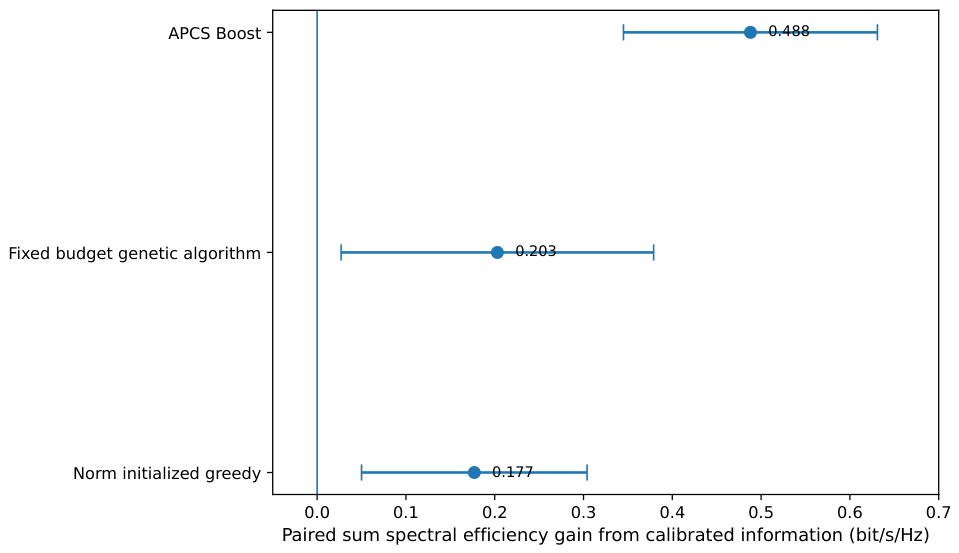
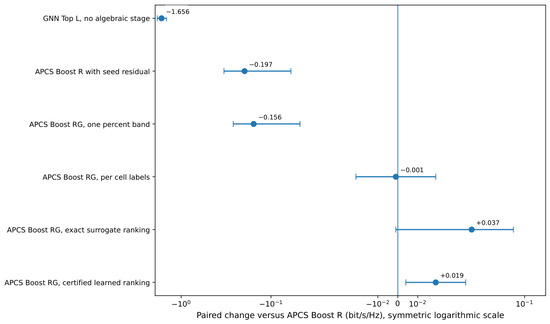
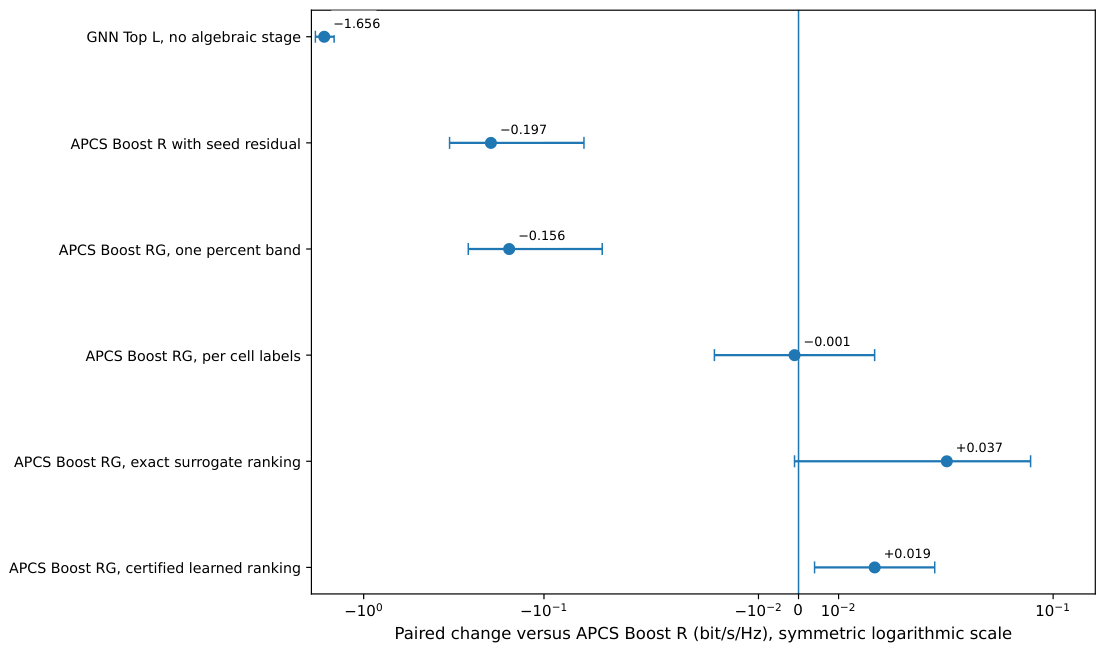
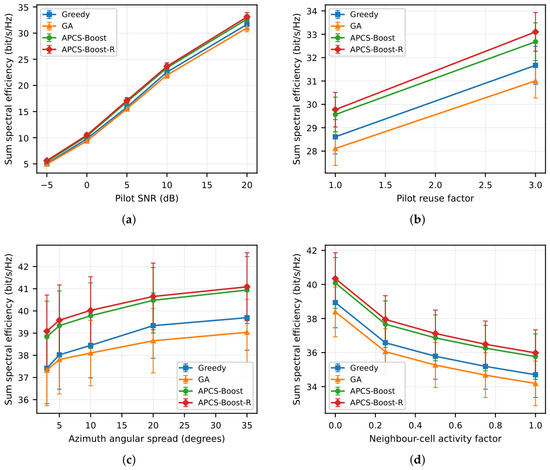
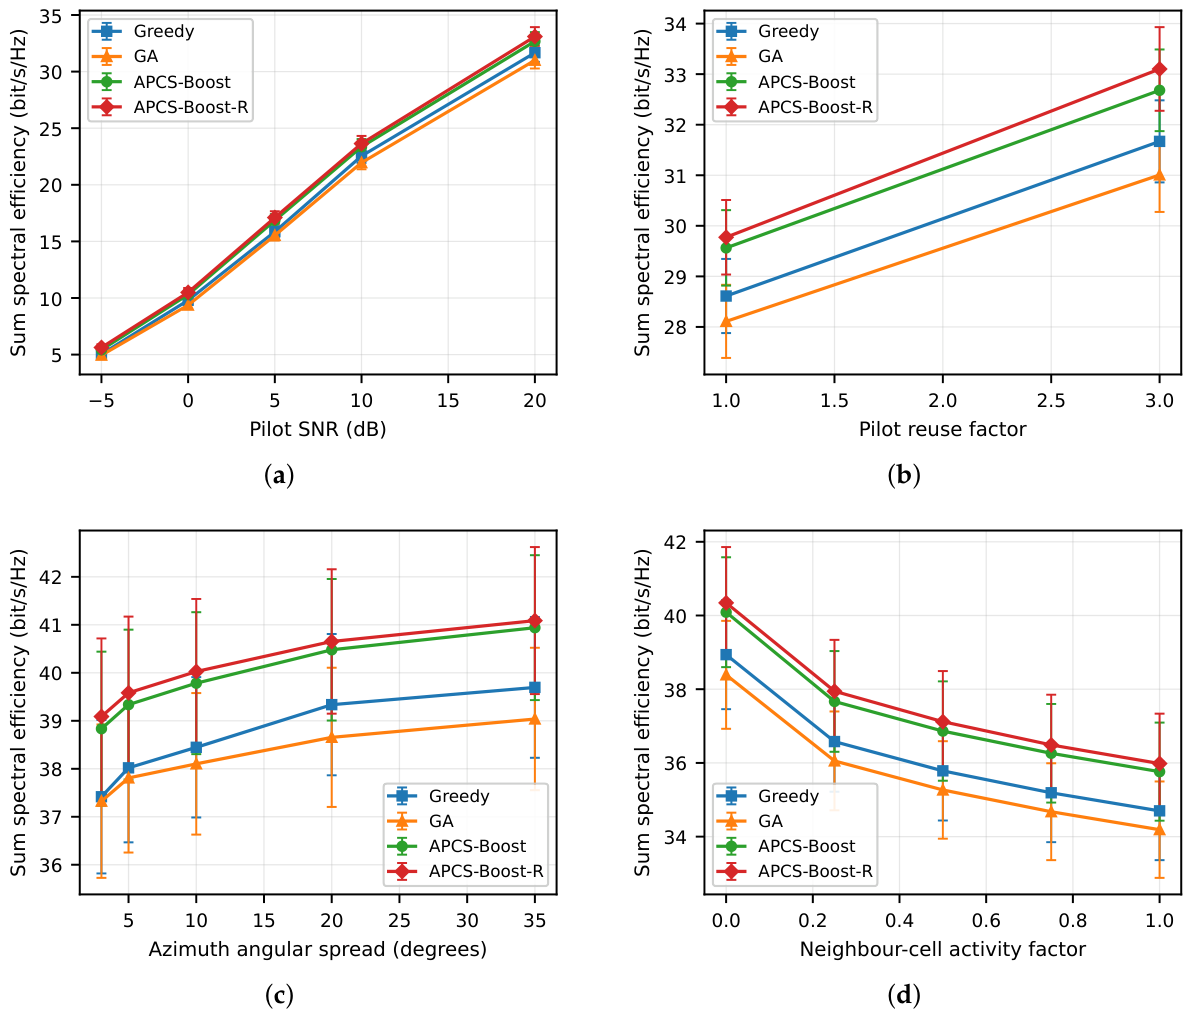
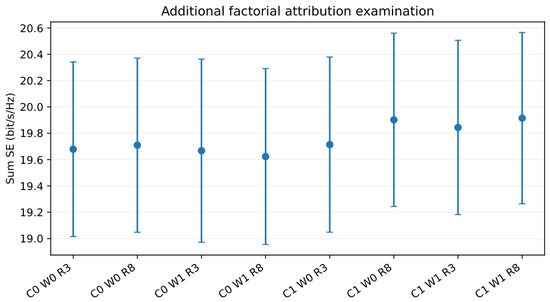
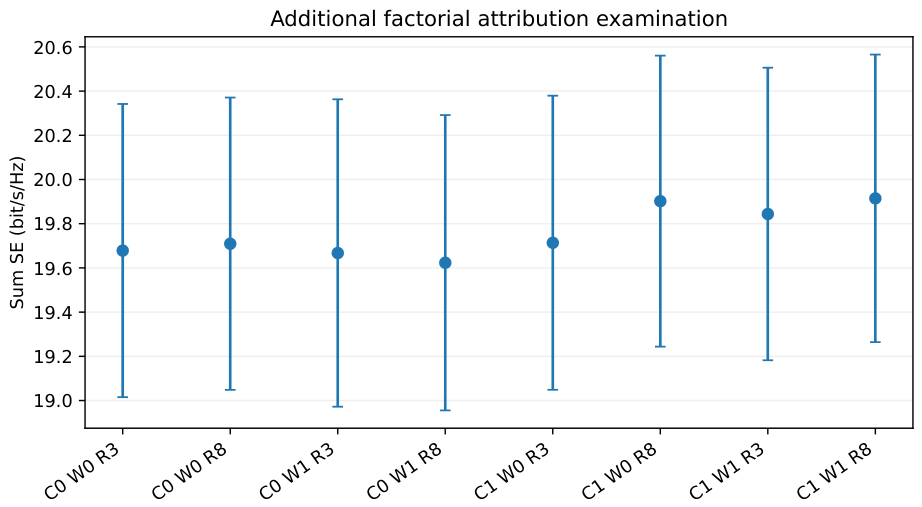
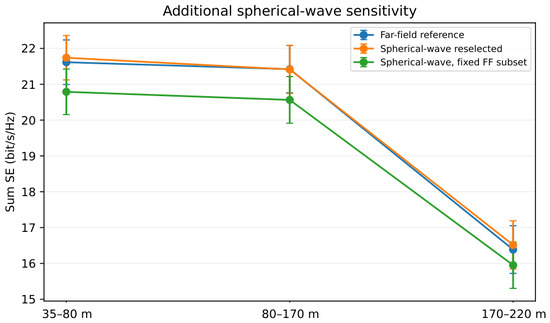
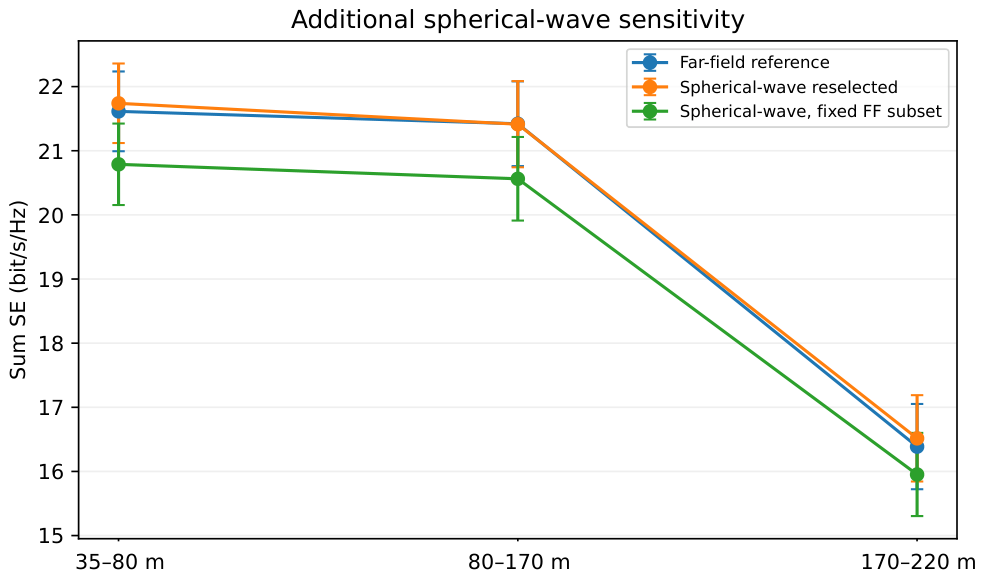
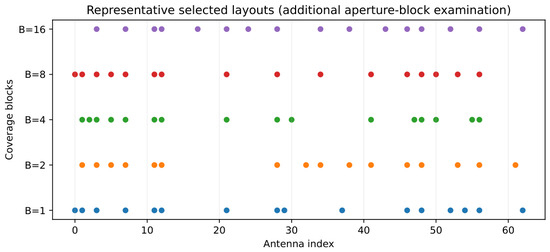
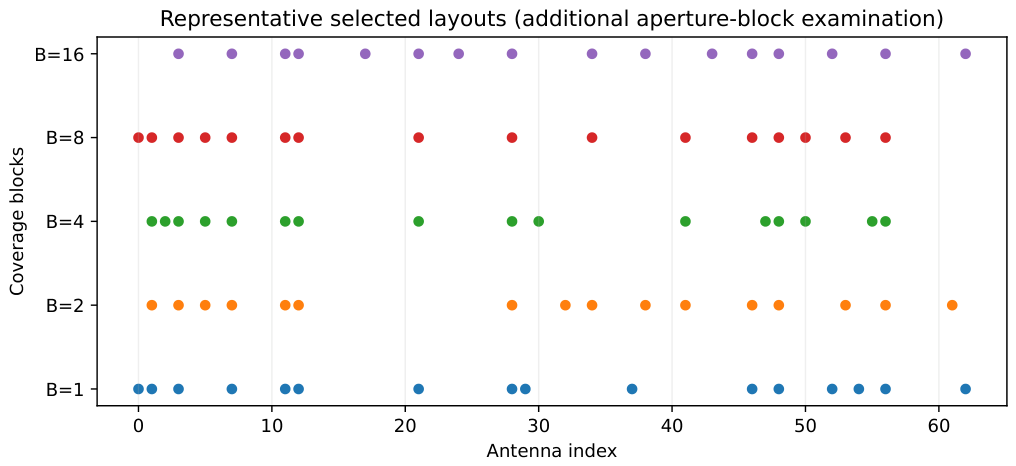
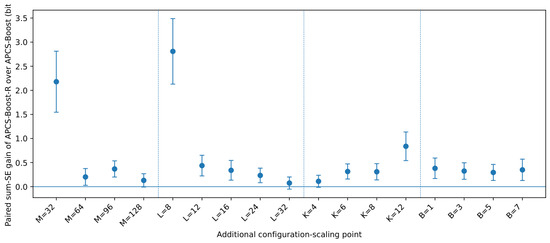
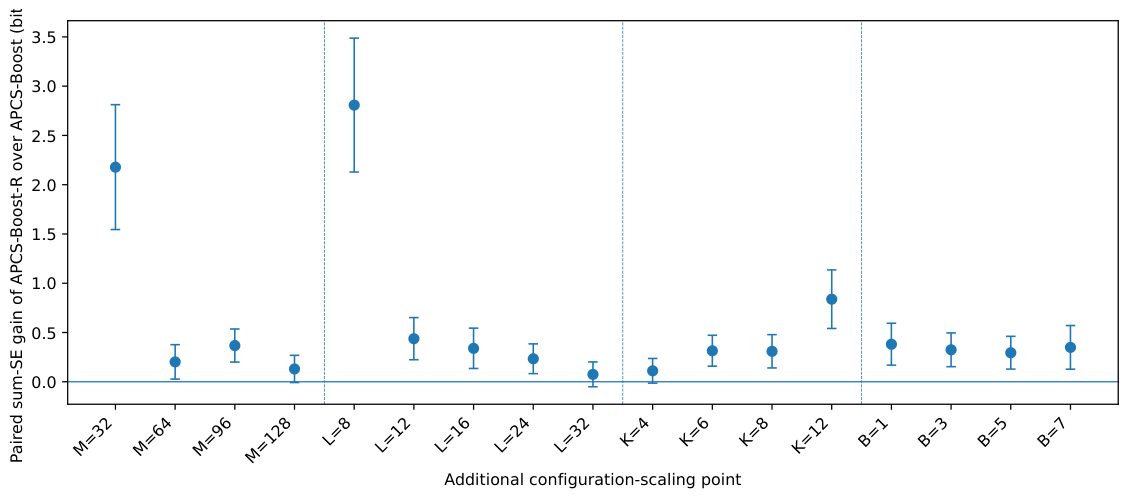

Disclaimer/Publisher’s Note: The statements, opinions and data contained in all publications are solely those of the individual author(s) and contributor(s) and not of MDPI and/or the editor(s). MDPI and/or the editor(s) disclaim responsibility for any injury to people or property resulting from any ideas, methods, instructions or products referred to in the content. |
© 2026 by the authors. Licensee MDPI, Basel, Switzerland. This article is an open access article distributed under the terms and conditions of the Creative Commons Attribution (CC BY) license.