


Abstract
Urban mobility is increasingly conceptualized as a multidimensional, user-centered domain of transport system evaluation with potential implications for population health. This study examined the association between user-reported urban mobility experiences and perceived stress among adults using a high-intensity corridor in Nogales, Sonora, Mexico. A quantitative cross-sectional analytical study was conducted with 423 participants using the Urban Mobility Experiences Scale (UMES) and the Perceived Stress Scale (PSS-14). Spearman’s correlation analyses showed inverse associations between perceived stress and several mobility dimensions, although only Sustainability and Urban Environment remained statistically significant after Bonferroni correction (ρ = −0.266; p < 0.001). In multivariate analysis, Sustainability and Urban Environment, Accessibility and Connectivity, and Travel Time and Efficiency were retained as significant predictors, jointly explaining 14.1% of the variance in perceived stress (R2 = 0.141; f2 = 0.152). These findings suggest that multidimensional urban mobility experiences, particularly environmental and accessibility conditions, are associated with perceived stress beyond traditional operational indicators in high-intensity urban corridors.
1. Introduction
Urban mobility is a fundamental component of contemporary urban systems, shaping access to goods, services, and opportunities while influencing territorial cohesion and everyday life [1,2]. In recent decades, global agendas on sustainable mobility have emphasized the need to promote multimodal transport systems that prioritize public and active transportation, reduce socio-spatial inequalities, and improve environmental conditions [3,4,5]. Within this framework, urban mobility is increasingly recognized not only as a technical and infrastructural issue but also as a determinant of population health and well-being, given its links to environmental exposures, safety, physical activity, and psychosocial outcomes [6,7,8].
Beyond operational indicators such as travel time, frequency, and capacity, recent research has highlighted the importance of understanding mobility as a lived and user-centered experience [9,10,11]. This perspective emphasizes how individuals perceive and evaluate their daily travel across multiple dimensions, including accessibility, comfort, safety, and environmental quality. Empirical evidence suggests that adverse travel conditions—such as congestion, unreliability, overcrowding, noise, and perceived insecurity—are associated with lower travel satisfaction and poorer subjective well-being [12,13,14,15,16]. In this context, constructs such as perceived accessibility and travel satisfaction have gained prominence as complementary indicators for transport system evaluation [9,10].
Parallel to this line of research, studies in environmental health and transportation have identified commuting conditions as potential sources of psychological strain. Long or unpredictable travel times, exposure to environmental stressors, and constrained mobility conditions have been associated with increased stress levels, reduced perceived control, and diminished quality of life [17,18,19]. However, these domains—mobility experience and psychological outcomes—have often been examined separately, limiting the understanding of how multidimensional mobility experiences may relate to broader psychosocial responses in real-world urban contexts.
From a theoretical perspective, the relationship between urban mobility experiences and perceived stress can be understood through the transactional model of stress proposed by Lazarus and Folkman [20]. This model conceptualizes stress as the result of a dynamic interaction between environmental demands and individual appraisal processes. In the context of urban mobility, daily travel conditions may function as environmental stressors that are cognitively evaluated in terms of predictability, control, safety, comfort, and environmental burden. When these conditions are perceived as demanding relative to available coping resources, they may contribute to higher levels of perceived stress. This framework provides a robust conceptual basis for integrating experiential dimensions of mobility with psychosocial outcomes.
Accordingly, urban mobility can be conceptualized as a multidimensional experiential domain in which accessibility, transport quality, safety, efficiency, and environmental conditions jointly shape how individuals appraise their daily travel. More favorable mobility experiences may function as protective factors, whereas unfavorable conditions may act as stressors. Recent studies have emphasized the importance of incorporating user-reported indicators into transport evaluation frameworks, including subjective experiences and well-being outcomes [9,21]. Nevertheless, the extent to which multidimensional urban mobility experiences are associated with general perceived stress remains insufficiently explored, particularly in integrated analytical approaches that simultaneously consider multiple experiential dimensions.
This gap is particularly relevant in Latin America, where urban mobility is often shaped by territorial inequality, infrastructural limitations, and heterogeneous travel conditions that may intensify daily mobility burdens [22,23,24]. In Mexico, mobility systems are characterized by marked disparities in accessibility, service quality, and environmental conditions, which may influence how individuals experience and evaluate their daily travel [2,25]. Border cities represent a particularly critical context for examining these dynamics, as they are characterized by intense cross-border interactions, socio-spatial asymmetries, and high mobility demand [26].
Within this context, Nogales, Sonora, constitutes a strategic case study. Its cross-border dynamics, complex topography, and high-intensity urban corridors create demanding mobility conditions that may shape how daily travel is experienced. Understanding urban mobility from a user-centered perspective may provide valuable insights for corridor-level transport evaluation and planning, particularly in constrained border urban environments.
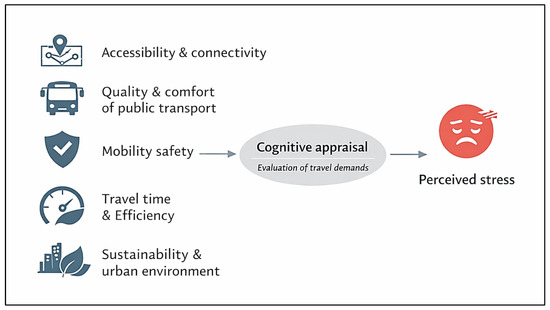
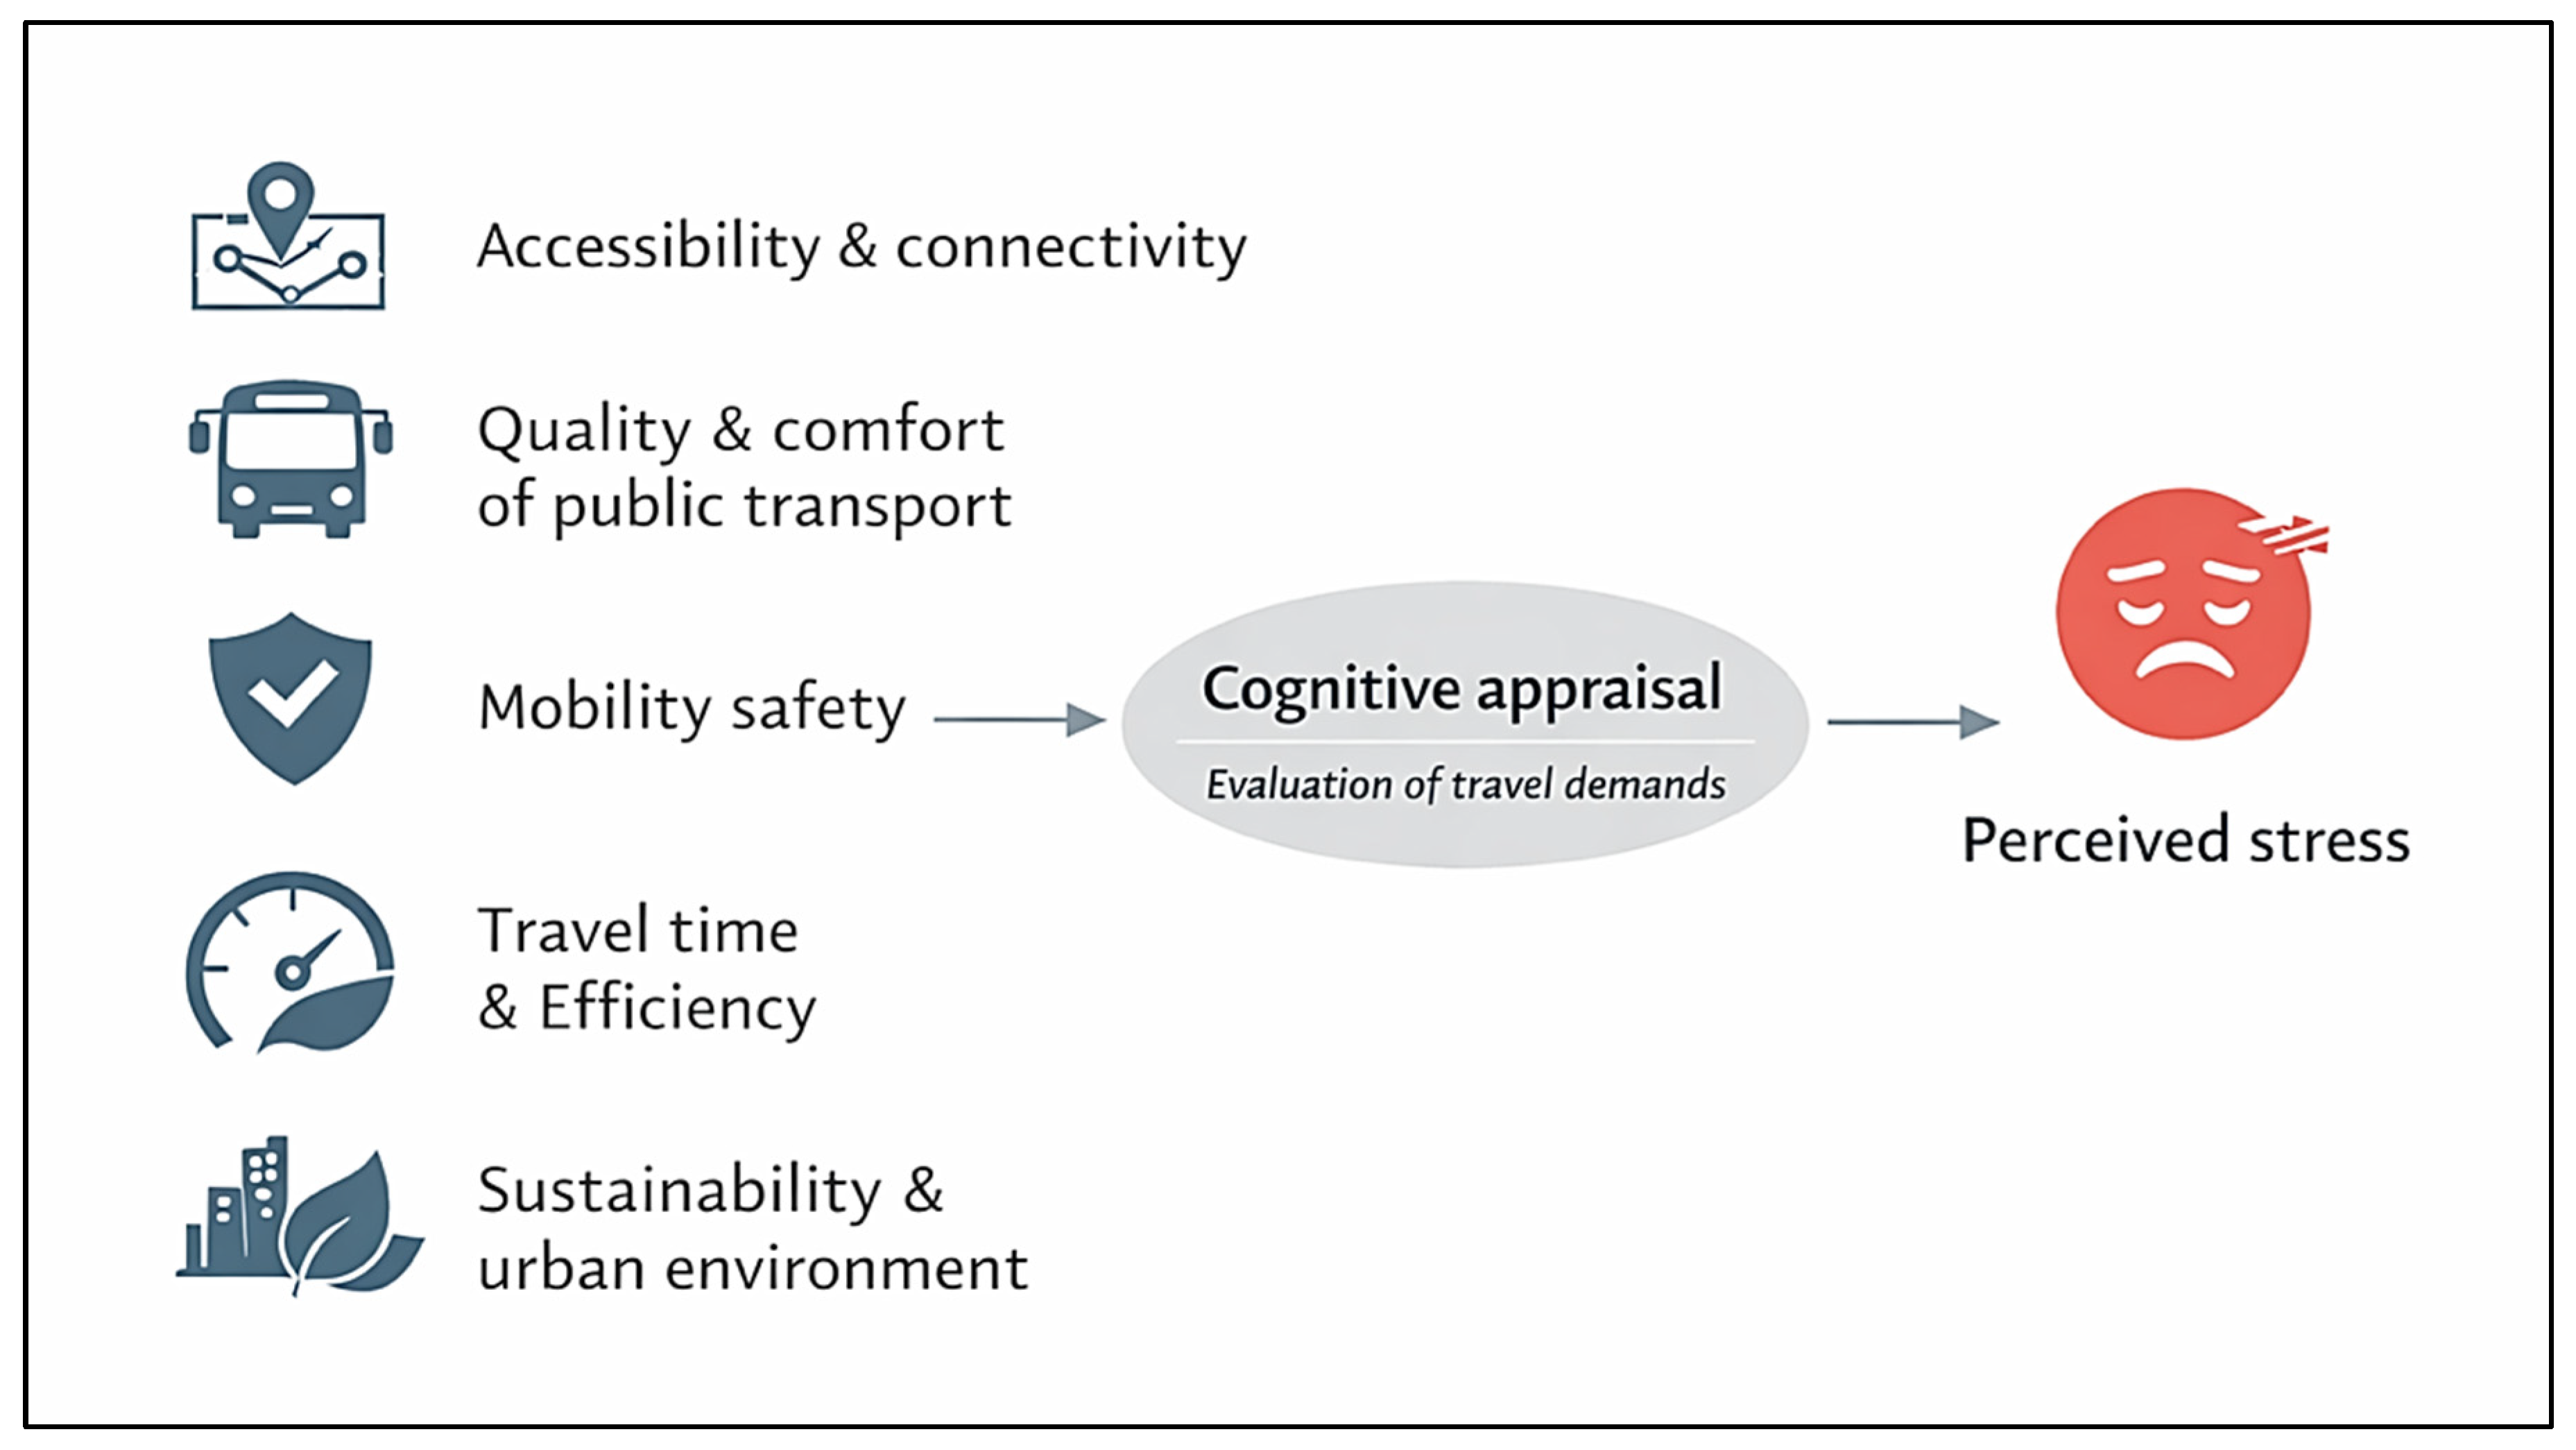
Drawing on the transactional model of stress [20], this study proposes a conceptual framework in which urban mobility experiences are associated with perceived stress as a user-reported psychosocial outcome. In this framework, dimensions such as accessibility and connectivity, quality and comfort of public transportation, mobility safety, travel time and efficiency, and sustainability and urban environment are conceptualized as interrelated aspects of everyday mobility that may shape how individuals cognitively appraise travel-related demands (Figure 1).
Figure 1.
Conceptual framework of the association between urban mobility experiences and perceived stress. Note: Conceptual framework developed by the authors based on the transactional model of stress [20]. The model illustrates the hypothesized association between urban mobility experiences and perceived stress as a user-reported psychosocial outcome.
These associations are examined while accounting for relevant sociodemographic and mobility-related factors. Accordingly, this study aims to examine the association between multidimensional urban mobility experiences and perceived stress among adults using a high-intensity urban corridor in a Mexican border city.
2. Materials and Methods
2.1. Study Design
This study followed the recommendations of the Strengthening the Reporting of Observational Studies in Epidemiology (STROBE) guidelines [27]. A quantitative, observational, cross-sectional analytical study was conducted during the third quarter of 2025 to examine the association between urban mobility experiences and perceived stress among adults using a high-intensity urban corridor. From a transportation research perspective, the study focused on user-reported mobility experiences as indicators of how corridor conditions are perceived under everyday travel demands. Perceived stress was included as a general user-reported outcome potentially associated with these mobility experiences. Additional mobility-related variables included frequency of corridor use, average travel time, and usual commuting schedule. Given the cross-sectional nature of the study, causal inferences were not intended. Accordingly, the study was designed to identify associations rather than causal relationships between variables.
2.2. Study Setting
The study was conducted on Plutarco Elías Calles Avenue in Nogales, Sonora, Mexico, a strategic urban corridor characterized by high pedestrian and vehicular traffic, a concentration of commercial and work-related activities, and intensified cross-border flows due to its proximity to the United States. These characteristics generate heterogeneous exposure to congestion, environmental stressors, and infrastructural constraints, making the site a relevant setting for examining user-reported mobility experiences under demanding corridor conditions in a northern Mexican border context.
2.3. Participants and Selection Criteria
The target population consisted of adults residing in Nogales who regularly traveled along the corridor, regardless of transportation mode. Inclusion criteria were being 18 years of age or older, residing in the city, having traveled along the avenue during the data collection period, and providing verbal informed consent. To ensure accessibility, support was provided to participants with physical or sensory limitations in order to facilitate comprehension of the questionnaire without influencing their responses.
2.4. Sampling Strategy and Sample Size
A non-probability convenience sampling strategy was employed. Participants were recruited based on accessibility and availability during peak commuting periods to capture mobility experiences under conditions of high traffic intensity and corridor use. To reduce the risk of overrepresenting homogeneous mobility profiles, data collection was conducted at multiple points along the corridor, allowing for greater variability in user-reported experiences. A total of 423 completed questionnaires were obtained. Although no formal a priori sample size calculation was conducted, sample adequacy was evaluated based on established statistical criteria.
According to previous statistical power analyses [28,29], the detection of small to moderate correlation effects (r ≈ 0.10–0.30), under a significance level of α = 0.05 and statistical power (1 − β) = 0.95, typically requires sample sizes of approximately 400 participants or more. This provides adequate sensitivity to detect effects of interest while minimizing the risk of Type II error. Additionally, sample sizes exceeding 200 observations are generally considered sufficient for multivariate analyses [30], supporting the adequacy of the sample for the regression models applied in this study.
2.5. Instruments and Variables
2.5.1. Urban Mobility Experiences Scale (UMES)
Urban mobility experiences were assessed using the Urban Mobility Experiences Scale (UMES) [31]. The scale conceptualizes urban mobility as a multidimensional social experience comprising five dimensions: Accessibility and Connectivity (AC), Quality and Comfort of Public Transportation (QC), Mobility Safety (MS), Travel Time and Efficiency (TTE), and Sustainability and Urban Environment (SUE). Items were scored on a 5-point Likert scale ranging from 1 (never) to 5 (always), with higher scores indicating a greater perceived presence of positive urban mobility experiences. Mean scores were calculated for each dimension and for the overall construct. Internal consistency was estimated using McDonald’s omega coefficient (ω), with values ranging from 0.752 to 0.853 across dimensions and 0.912 for the total scale, indicating adequate reliability.
2.5.2. Perceived Stress Scale (PSS-14)
Perceived stress was assessed using the validated Mexican version of the 14-item Perceived Stress Scale (PSS-14) [32]. The PSS-14 is a measure of general perceived stress and was included in this study as a user-reported psychosocial outcome potentially associated with everyday mobility experiences under demanding corridor conditions. The scale consists of 14 items scored on a 5-point Likert scale ranging from 0 (never) to 4 (always). Items 4, 5, 6, 7, 9, 10, and 13 were reverse scored according to the instrument’s scoring guidelines. A mean item score was computed by averaging the 14 items, yielding a scale range from 0 to 4, where higher values indicate greater perceived stress. In this study, the scale demonstrated satisfactory internal consistency (Cronbach’s α = 0.84).
2.5.3. Sociodemographic and Mobility Variables
Sociodemographic variables included age, sex, marital status, educational level, and occupation. Mobility-related variables included primary mode of transportation, reason for travel, frequency of corridor use, average travel time, and usual commuting schedule. These variables were additionally considered as potential confounders in multivariate analyses.
2.6. Data Collection Procedure
Data collection was carried out between July and September 2025 using printed questionnaires distributed and supervised by previously trained personnel. Surveys were conducted at strategic points along the avenue during peak commuting hours (07:00–11:00 and 16:00–19:00), with an approximate duration of 15 min per participant. No personally identifiable information was collected, and confidentiality of responses was guaranteed. To reduce information bias and inter-interviewer variability, a standardized training and administration protocol was implemented, and the data collection process was continuously monitored. No questionnaires contained missing data at the time of collection; therefore, all cases were included in the analysis.
2.7. Statistical Analysis
Statistical analyses were performed using IBM SPSS Statistics version 30 (IBM Corp., Armonk, NY, USA). Descriptive statistics were calculated to characterize the sample and study variables. Continuous variables were summarized using means and standard deviations, whereas categorical variables were presented as frequencies and percentages. The distribution of UMES dimension scores, total UMES score, and the PSS-14 mean item score was assessed using the Kolmogorov–Smirnov test. Given that several variables showed significant departures from normality, and considering the ordinal nature of Likert-type measures, non-parametric procedures were used for initial inferential analyses. Spearman’s rank-order correlation coefficient (ρ) was used to examine bivariate associations between urban mobility experiences and perceived stress. Correlation coefficients were reported together with their corresponding p-values, adopting a statistical significance level of p < 0.05. To control for type I error inflation due to multiple comparisons, a Bonferroni correction was applied based on six correlation tests (adjusted α = 0.05/6 = 0.0083). Given the conservative nature of the Bonferroni correction, results were interpreted considering both statistical significance and effect size estimates.
Effect size was estimated using the coefficient of determination (r2). Group differences according to sociodemographic and mobility-related variables were analyzed using the Mann–Whitney U test for two-group comparisons and the Kruskal–Wallis test for variables with more than two categories. Given the number of comparisons performed, results were interpreted with caution, emphasizing consistency and effect size estimates rather than sole reliance on statistical significance. Prior to selecting the multivariate analytical approach, the relationship between the main variables was examined. The correlation between overall urban mobility experience and perceived stress was low (r = −0.162), indicating a weak association. Therefore, multivariate analysis of variance (MANOVA) was not considered appropriate, and independent univariate analyses were conducted in accordance with methodological recommendations [30]. To further address potential confounding and extend beyond bivariate associations, a multiple linear regression model was performed. The dependent variable was perceived stress (PSS-14 mean item score), and the independent variables included the five dimensions of urban mobility experiences: Accessibility and Connectivity (AC), Quality and Comfort of Public Transportation (QC), Mobility Safety (MS), Travel Time and Efficiency (TTE), and Sustainability and Urban Environment (SUE).
The model additionally controlled for relevant covariates, including age, sex, educational level, transportation mode, frequency of corridor use, and travel time. The assumptions of multiple linear regression were evaluated following established methodological criteria [30], including linearity (assessed through scatterplots), normality of standardized residuals (p > 0.05), independence of errors (evaluated using the Durbin–Watson statistic; acceptable range: 1.5–2.5), and homoscedasticity (assessed through visual inspection of residual plots). Model fit was evaluated using the coefficient of determination (R2). Effect size was calculated using Cohen’s 2 (), with values of 0.02, 0.15, and 0.35 interpreted as small, medium, and large effect sizes, respectively [28]. Given the cross-sectional design, all findings were interpreted as associative rather than causal. Additionally, a multiple linear regression model using the ENTER method was performed, in which all independent variables were simultaneously included based on theoretical considerations. This approach was used to assess the robustness and consistency of the predictors identified in the regression analysis.
2.8. Ethical Considerations
The study was conducted in accordance with the Declaration of Helsinki and with applicable institutional and national regulations governing research involving human participants. The protocol was approved by the Research Committee of Montemorelos University (Registration No. 2025-001). All participants received a clear explanation of the study objectives and procedures and provided informed consent prior to participation. Participation was voluntary, and participants could withdraw at any time without consequences. Anonymity and confidentiality were ensured throughout the study.
3. Results
3.1. Sample Characteristics
With respect to mobility characteristics, the city bus was the most frequently used mode of transportation (49.2%), followed by private car (35.2%). The corridor was used daily by 64.1% of participants, and commuting was primarily work-related (58.6%). The most frequent travel time categories were 16–20 min (20.3%) and 21–25 min (17.5%). The most commonly reported commuting period was 7:01–9:00 a.m. (42.6%). Detailed distributions are presented in Table 1 and Table 2.
Table 1.
Sociodemographic characteristics of the study population (n = 423).
Table 2.
Urban mobility characteristics of the study population (n = 423).
3.2. Descriptive Statistics of Study Variables
3.2.1. Urban Mobility Experiences
The overall mean score of the Urban Mobility Experiences Scale (UMES) was 2.58 (SD = 0.58). At the dimensional level, Accessibility and Connectivity (AC) showed the highest mean score (2.78), whereas Sustainability and Urban Environment (SUE) showed the lowest (2.22). Mobility Safety (MS) (2.70), Travel Time and Efficiency (TTE) (2.65), and Quality and Comfort of Public Transportation (QC) (2.54) showed intermediate mean scores. Full descriptive statistics are presented in Table 3.
Table 3.
Descriptive statistics of the Urban Mobility Experiences Scale (UMES) by item, dimension, and total score (n = 423).
3.2.2. Perceived Stress
The mean item score on the PSS-14 was 1.97 (SD = 0.32) on a 0–4 scale. Detailed item-level descriptive statistics are presented in Table 4.
Table 4.
Descriptive statistics of the Perceived Stress Scale (PSS-14) by item and mean item score (n = 423).
3.2.3. Distributional Characteristics
The Kolmogorov–Smirnov test indicated significant deviations from normality for all UMES dimensions and for the PSS-14 mean item score (p < 0.05), whereas the UMES total score did not show a significant deviation from normality (p = 0.145). Given the ordinal nature of the scales and the observed distributional characteristics, non-parametric statistical procedures were used in the inferential analyses (Table 5).
Table 5.
Normality assessment of UMES dimensions, UMES total score, and PSS-14 mean item score using the Kolmogorov–Smirnov test (n = 423).
3.2.4. Association Between Urban Mobility Experiences and Perceived Stress
Spearman’s rho coefficients indicated statistically significant inverse associations between the PSS-14 mean item score and several dimensions of the UMES. Significant negative correlations were observed for Accessibility and Connectivity (ρ = −0.158; p = 0.001), Quality and Comfort of Public Transportation (ρ = −0.099; p = 0.042), and Mobility Safety (ρ = −0.101; p = 0.038), all with small effect sizes. Sustainability and Urban Environment (SUE) showed the strongest inverse association with perceived stress among the UMES dimensions (ρ = −0.266; p < 0.001; r2 = 0.07). No statistically significant association was observed for Travel Time and Efficiency (ρ = −0.011; p = 0.828). The total UMES score was also negatively correlated with perceived stress (ρ = −0.162; p < 0.001; r2 = 0.03). After applying a Bonferroni correction for multiple comparisons (α = 0.0083), only the associations for Accessibility and Connectivity, Sustainability and Urban Environment, and the total UMES score remained statistically significant. The associations for Quality and Comfort of Public Transportation and Mobility Safety were nominally significant but did not survive correction for multiple comparisons. Detailed correlation coefficients are presented in Table 6. To further assess whether these associations persisted after accounting for potential confounding factors, a multiple regression analysis was performed.
Table 6.
Spearman correlations between UMES dimensions, total UMES score, and perceived stress (PSS-14 mean item score) (n = 423).
3.2.5. Multiple Regression Analysis
A multiple linear regression analysis was conducted to examine the independent association between urban mobility experience dimensions and perceived stress. Prior to the analysis, 10 outliers were identified and excluded based on standardized residuals exceeding the ±3 threshold, resulting in a final sample of 413 observations.
All assumptions of multiple linear regression were evaluated and met. Linearity between independent variables and the dependent variable was confirmed through scatterplot inspection. The normality of standardized residuals was supported (p > 0.05). Independence of errors was verified using the Durbin–Watson statistic, which was close to 2. Homoscedasticity was confirmed through visual inspection of residual plots, indicating constant variance of the error terms. Additionally, variance inflation factor (VIF) values were below 2 for all predictors, indicating no evidence of multicollinearity.
A stepwise multiple regression analysis was performed to identify the most relevant predictors of perceived stress. The Sustainability and Urban Environment (SUE) dimension emerged as the strongest predictor, explaining approximately 8% of the variance in perceived stress in the initial step (R2 ≈ 0.08). In the final model, the dimensions Sustainability and Urban Environment (SUE), Accessibility and Connectivity (AC), and Travel Time and Efficiency (TTE) were retained, jointly explaining 14.1% of the variance in perceived stress (R2 = 0.141). Quality and Comfort of Public Transportation (QC) was not retained as a significant predictor in the final model.
As shown in Table 7, SUE presented the highest standardized regression coefficient among the retained predictors.
Table 7.
Multiple regression analysis predicting perceived stress.
The model yielded an effect size of f2 = 0.152, corresponding to a medium magnitude according to Cohen’s criteria [28].
An additional multiple linear regression analysis was performed using the ENTER method, in which all UMES dimensions were simultaneously included as predictors. The model explained 14.9% of the variance in perceived stress (R2 = 0.149). In this model, Sustainability and Urban Environment (β = −0.236, p < 0.001), Accessibility and Connectivity (β = −0.227, p < 0.001), and Travel Time and Efficiency (β = 0.235, p < 0.001) remained statistically significant predictors. In contrast, Quality and Comfort of Public Transportation (p = 0.159) and Mobility Safety (p = 0.708) were not significantly associated with perceived stress. These findings were consistent with those obtained from the stepwise regression analysis, supporting the robustness of the identified predictors.
An additional regression model incorporating sociodemographic variables (age, sex, marital status, educational level, and occupation) was conducted. Categorical variables were dummy coded prior to inclusion in the model. None of the sociodemographic variables showed a statistically significant association with perceived stress.
3.2.6. Comparisons According to Sociodemographic and Mobility Variables
Comparisons of total UMES scores across sociodemographic and mobility-related variables are presented in Table 8. No statistically significant differences were observed according to age, sex, educational level, occupation, mode of transportation, reason for travel, or frequency of corridor use (p > 0.05). Significant differences were identified according to marital status (p = 0.001), travel time (p < 0.001), and time of day (p < 0.001). Comparisons of perceived stress scores are presented in Table 9. No statistically significant differences were observed across most sociodemographic and mobility-related variables (p > 0.05). However, perceived stress scores differed significantly according to frequency of corridor use (p = 0.005).
Table 8.
Comparison of UMES total scores according to sociodemographic and mobility-related variables (n = 423).
Table 9.
Comparison of perceived stress levels (PSS-14 mean item score) according to sociodemographic and mobility-related variables (n = 423).
4. Discussion
This study examined the association between multidimensional urban mobility experiences and perceived stress among adults using a high-intensity urban corridor in a Mexican border city. Overall, the findings indicate that several dimensions of urban mobility experiences—particularly Sustainability and Urban Environment (SUE) and Accessibility and Connectivity (AC)—were significantly associated with perceived stress, whereas Mobility Safety (MS) showed an association that did not remain statistically significant after correction for multiple comparisons, although the magnitude of these associations was generally small. These results support the conceptualization of urban mobility as Significant associations were also observed a multidimensional experiential construct that may be linked to psychosocial outcomes, extending previous research that has largely examined travel conditions and well-being separately [8,19]. Importantly, the multivariate analysis provided a more comprehensive understanding of these relationships.
The regression model explained 14.1% of the variance in perceived stress (R2 = 0.141), with an effect size of f2 = 0.152, corresponding to a medium magnitude according to Cohen’s criteria [28]. While several associations reached statistical significance, the overall explanatory power of the model remained modest. This distinction between statistical significance and practical significance is critical. In complex behavioral and environmental contexts such as urban mobility, perceived stress is influenced by multiple interacting factors beyond mobility experiences alone. Therefore, the observed effect sizes, although relatively small at the individual level, may still be meaningful at the population level, particularly in urban environments where large numbers of individuals are exposed to similar mobility conditions [6].
Among the analyzed dimensions, Sustainability and Urban Environment (SUE) emerged as the strongest predictor of perceived stress. This finding suggests that environmental and contextual characteristics of mobility—such as perceived environmental quality, congestion, and exposure to urban stressors—may play a particularly relevant role in shaping how individuals experience daily travel. This interpretation is consistent with previous evidence indicating that environmental exposures, including noise and traffic-related conditions, are associated with psychological stress and reduced well-being [6,18,19]. In high-intensity border contexts such as Nogales, where mobility occurs under conditions of infrastructural pressure and socio-spatial complexity, these environmental factors may be especially salient.
Accessibility and Connectivity (AC) also showed a significant inverse association with perceived stress. This finding aligns with research highlighting perceived accessibility as a key determinant of travel experience and subjective well-being [9]. When individuals perceive mobility systems as accessible and well connected, travel may be experienced as more predictable and manageable. Conversely, limited accessibility may be associated with increased uncertainty and reduced perceived control, which are recognized contributors to stress in daily travel contexts [13]. Quality and Comfort of Public Transportation (QC) and Mobility Safety (MS) showed weaker associations with perceived stress; however, these did not remain statistically significant after Bonferroni correction for multiple comparisons, and QC was not retained as a significant predictor in the multivariate model. The consistency of these findings was further supported by the additional ENTER regression model, in which the same key predictors remained statistically significant. This may reflect the conservative nature of the Bonferroni correction, which reduces the likelihood of type I error while potentially limiting statistical power. This suggests that, although these dimensions are relevant for overall travel experience, they may not exert an independent effect on perceived stress when considered alongside other mobility factors. One possible explanation is that aspects of service quality and comfort may overlap conceptually with broader environmental or accessibility-related conditions, thereby reducing their unique contribution in the adjusted model. Previous studies have shown that service quality, comfort, and perceived safety are important components of travel satisfaction [11,16]; however, their relationship with broader psychosocial outcomes may be more complex and mediated by other contextual or individual factors.
A notable pattern was observed for Travel Time and Efficiency (TTE), which was not significantly associated with perceived stress in the bivariate analysis but emerged as a significant predictor in the multivariate model. This discrepancy suggests that travel time may not operate as an independent determinant of perceived stress but rather in interaction with other mobility dimensions. One possible explanation is that, in high-demand urban contexts, longer travel times may be normalized, reducing their direct association with stress. Alternatively, qualitative aspects of travel—such as environmental conditions and perceived control—may play a more prominent role than duration alone. Similar findings have been reported in the recent literature, indicating that commuting-related stress is influenced by multiple experiential factors rather than travel time in isolation [8,19].
From a theoretical perspective, these findings can be interpreted within the framework of the transactional model of stress [20], which emphasizes the role of cognitive appraisal in shaping stress responses. In this context, urban mobility experiences may represent environmental demands that are evaluated in terms of predictability, safety, comfort, and environmental burden. The observed associations suggest that more favorable mobility experiences may be linked to lower perceived stress through more positive appraisals of travel-related demands. However, it is important to emphasize that this interpretation is conceptual and does not imply causality. From a policy and practice perspective, the findings suggest that improving experiential dimensions of urban mobility may contribute to more favorable user-reported outcomes in high-demand corridors. In particular, the prominent role of Sustainability and Urban Environment (SUE) highlights the potential value of interventions aimed at improving environmental conditions, such as reducing noise exposure, enhancing air quality, and mitigating congestion-related stressors.
Similarly, the association observed for Accessibility and Connectivity (AC) underscores the importance of strengthening route integration, service coverage, and system coherence to improve perceived predictability and reduce travel-related strain. Although Travel Time and Efficiency (TTE) showed a more complex pattern, its contribution within the adjusted model suggests that travel duration may interact with qualitative aspects of the mobility experience rather than operate independently. Incorporating user-reported experiential indicators into transport evaluation frameworks may support more responsive and context-sensitive corridor management strategies, complementing traditional performance metrics focused on efficiency and capacity. This study has several strengths. It adopts a multidimensional and user-centered approach to urban mobility by integrating experiential indicators with a psychosocial outcome within a unified analytical framework.
The combined use of bivariate and multivariate analyses allowed for a more comprehensive examination of these associations while accounting for relevant covariates. In addition, the use of a recently developed and psychometrically validated instrument to assess urban mobility experiences enhances the robustness of the measurements. Finally, the focus on a high-intensity border corridor provides context-specific evidence from a setting characterized by complex mobility dynamics that remain underrepresented in the literature. The findings should be interpreted in light of important methodological considerations. Due to the cross-sectional design, the results reflect associations rather than causal relationships.
Accordingly, it cannot be determined whether urban mobility experiences are associated with perceived stress in a unidirectional manner or whether individuals with higher levels of stress tend to evaluate their mobility experiences more negatively. This possibility of reverse causality is consistent with the transactional model of stress, which posits that individual appraisal processes play a central role in shaping perceptions of environmental demands. Future longitudinal or experimental studies are needed to clarify the directionality of these relationships. Additionally, although statistically significant associations were identified, the effect sizes were generally small. This suggests that urban mobility experiences represent only one of multiple factors associated with perceived stress. Variables not included in the present study—such as baseline mental health status, occupational stress, or broader social determinants—may also contribute to perceived stress levels.
Therefore, the results should be interpreted as part of a broader, multifactorial framework. Additionally, given the exploratory nature of subgroup and multiple comparisons analyses, the results should be interpreted with caution, emphasizing consistency and effect size estimates alongside appropriate control for multiple testing. Finally, the use of a non-probability convenience sampling strategy may have introduced selection bias, as participants were recruited based on accessibility during peak commuting periods. This approach may have resulted in the overrepresentation of specific user profiles, particularly individuals with more frequent corridor use or those exposed to higher mobility demands. Consequently, the findings may not be fully representative of the broader urban population, limiting the external validity and generalizability of the results beyond similar high-intensity corridor contexts. Importantly, this sampling structure may have influenced the magnitude and direction of the observed associations, as individuals with higher exposure to demanding mobility conditions may also report distinct stress perceptions. These factors should be considered when interpreting the findings.
5. Conclusions
In conclusion, this study provides empirical evidence that user-reported urban mobility experiences are associated with perceived stress among adults using a high-intensity corridor in a Mexican border city. The findings support the inclusion of user-centered experiential indicators as a complementary component of corridor-level transport evaluation, highlighting the relevance of considering not only operational metrics but also how accessibility, comfort, safety, and environmental conditions are perceived by users.
Although the observed associations were modest, their consistency across multiple dimensions suggests that urban mobility experiences represent a meaningful component within a broader set of factors related to perceived stress. From a practical perspective, incorporating experiential indicators into mobility assessment frameworks may contribute to more responsive and context-sensitive urban planning, particularly in constrained and high-demand environments. Given the cross-sectional design, the results should be interpreted as associative rather than causal. Future research using longitudinal or experimental approaches is needed to better understand the directionality of these relationships and to further explore the role of contextual and individual factors.
Author Contributions
Conceptualization: F.I.R.-M. and J.W.P.-M.; Methodology: F.I.R.-M., J.L.J.-O. and O.A.F.-L.; Formal Analysis: J.L.J.-O. and G.C.-V.; Investigation: F.I.R.-M. and O.A.F.-L.; Data Curation: J.W.P.-M. and G.J.A.-R.; Writing—Original Draft: F.I.R.-M. and J.L.J.-O.; Writing—Review and Editing: G.C.-V. and J.W.P.-M.; Supervision: G.C.-V. and G.J.A.-R.; Project Administration: G.C.-V.; Funding Acquisition: G.C.-V. and G.J.A.-R. All authors have read and agreed to the published version of the manuscript.
Funding
This research received no external funding.
Institutional Review Board Statement
The study was conducted in accordance with the Declaration of Helsinki, and approved by Comité de Investigación de la Universidad de Montemorelos (protocol code 2025-001-CI-343 and date of approval 9 April 2025).
Informed Consent Statement
Informed consent was obtained from all subjects involved in the study.
Data Availability Statement
The original contributions presented in this study are included in the article. Further inquiries can be directed to the corresponding authors.
Acknowledgments
During the preparation of this manuscript, the authors used ChatGPT-5.2 (OpenAI) only for the purposes of the translation of the manuscript from Spanish to English. The authors carefully reviewed, edited, and approved the final English version and take full responsibility for the content, interpretation, and accuracy of the manuscript.
Conflicts of Interest
The authors declare no conflict of interest.
References
- Plataforma Urbana. Movilidad Urbana Sostenible: Beneficios Sociales, Ambientales y Económicos. Available online: https://plataformaurbana.cepal.org (accessed on 14 December 2025).
- Gobierno de México. Movilidad Urbana Sostenible. Available online: https://www.gob.mx (accessed on 14 December 2025).
- World Health Organization. Sustainable Transport for Health; WHO: Geneva, Switzerland, 2021. [Google Scholar]
- World Bank. Promoting Livable Cities by Investing in Urban Mobility; World Bank: Washington, DC, USA, 2024. [Google Scholar]
- Kasraian, D.; Murdock, H.E.; Imani, A.F.; Yu, Y.; de Nazelle, A.; Stead, D.; Kahlmeier, S. Health in mobility planning. J. Transp. Health 2024, 39, 101919. [Google Scholar] [CrossRef] [Scilit]
- Nieuwenhuijsen, M.J. Urban and transport planning pathways to carbon neutral, liveable and healthy cities; A review of the current evidence. Environ. Int. 2020, 140, 105661. [Google Scholar] [CrossRef] [Scilit]
- Conceição, M.A.; Monteiro, M.M.; Kasraian, D.; van den Berg, P.; Haustein, S.; Alves, I.; Azevedo, C.L.; Miranda, B. The effect of transport infrastructure, congestion and reliability on mental wellbeing: A systematic review of empirical studies. Transp. Rev. 2023, 43, 264–302. [Google Scholar] [CrossRef] [Scilit]
- Loo, B.P.Y.; Tsoi, K.H. Stressors for bus commuters and ways of improving bus journeys. Transp. Res. Part A 2024, 187, 104164. [Google Scholar] [CrossRef] [Scilit]
- Negm, H.; De Vos, J.; Pot, F.; El-Geneidy, A. Perceived accessibility: A literature review. J. Transp. Geogr. 2025, 125, 104212. [Google Scholar] [CrossRef] [Scilit]
- Mouratidis, K.; De Vos, J.; Yiannakou, A.; Politis, I. Sustainable transport modes, travel satisfaction, and emotions: Evidence from car-dependent compact cities. Travel Behav. Soc. 2023, 33, 100613. [Google Scholar] [CrossRef] [Scilit]
- Sukhov, A.; Lättman, K.; Olsson, L.E.; Friman, M.; Fujii, S. Assessing travel satisfaction in public transport: A configurational approach. Transp. Res. Part D 2021, 93, 102732. [Google Scholar] [CrossRef] [Scilit]
- Ettema, D.; Gärling, T.; Eriksson, L.; Friman, M.; Olsson, L.E.; Fujii, S. Satisfaction with travel and subjective well-being: Development and test of a measurement tool. Transp. Res. Part F 2011, 14, 167–175. [Google Scholar] [CrossRef] [Scilit]
- De Vos, J.; Witlox, F. Travel satisfaction revisited. On the pivotal role of travel satisfaction in conceptualising a travel behaviour process. Transp. Res. Part A 2017, 106, 364–373. [Google Scholar] [CrossRef] [Scilit]
- Singleton, P.A.; Clifton, K.J. Towards measures of affective and eudaimonic subjective well-being in the travel domain. Transportation 2021, 48, 303–336. [Google Scholar] [CrossRef] [Scilit]
- Abenoza, R.F.; Cats, O.; Susilo, Y.O. How does travel satisfaction sum up? An exploratory analysis in decomposing the door-to-door experience for multimodal trips. Transportation 2019, 46, 1615–1642. [Google Scholar] [CrossRef] [Scilit]
- Ruiz-Padillo, A.; de Oña, J. Analysis of the relationships among infrastructure, operation, safety, and environment aspects that influence public transport users: Case study of university small and medium sized cities in Brazil. Transp. Res. Part A 2024, 185, 104115. [Google Scholar] [CrossRef] [Scilit]
- Evans, G.W.; Wener, R.E. Rail commuting duration and passenger stress. Health Psychol. 2006, 25, 408–412. [Google Scholar] [CrossRef] [Scilit]
- Clark, C.; Paunović, K. WHO environmental noise guidelines for the European region: A systematic review on environmental noise and quality of life, wellbeing and mental health. Int. J. Environ. Res. Public Health 2018, 15, 2400. [Google Scholar] [CrossRef] [Scilit]
- De Vos, J. Analysing the relationship between commuting and stress. Future Transp. 2022, 2, 45–60. [Google Scholar]
- Lazarus, R.S.; Folkman, S. Stress, Appraisal, and Coping; Springer: New York, NY, USA, 1984. [Google Scholar]
- Friman, M. Transport system evaluation from user perspective. Future Transp. 2023, 3, 210–225. [Google Scholar]
- Alonso-Romero, G.; Lugo-Morín, D.R. El estado del arte de la movilidad del transporte en la vida urbana en ciudades latinoamericanas. Rev. Transp. Territ. 2018, 19, 133–157. [Google Scholar] [CrossRef] [Scilit]
- Aragón, M. Movilidad urbana y bienestar subjetivo: Reflexiones desde la ética. Salud Bienestar Colect. 2020, 4, 44–52. [Google Scholar]
- Castañeda-Meneses, P.L. Efectos de la movilidad urbana en la salud mental. El caso de Valparaíso Metropolitano, Chile. Prospectiva 2023, 36, e21712927. [Google Scholar] [CrossRef] [Scilit]
- García-Sepúlveda, S.A.; Ramírez-Viveros, A. Movilidad urbana como vía para el desarrollo sostenible: Caso Nuevo León. Rev. Pol. Glob. Ciudad 2023, 9, 5–23. [Google Scholar] [CrossRef] [Scilit]
- Hernández, A. La frontera México-Estados Unidos: La frontera México-Estados Unidos. Nueva Soc. 2020, 289, 59–69. [Google Scholar]
- von Elm, E.; Altman, D.G.; Egger, M.; Pocock, S.J.; Gøtzsche, P.C.; Vandenbroucke, J.P.; STROBE Initiative. The Strengthening the Reporting of Observational Studies in Epidemiology (STROBE) statement: Guidelines for reporting observational studies. BMJ 2007, 335, 806–808. [Google Scholar] [CrossRef] [Scilit]
- Cohen, J. Statistical Power Analysis for the Behavioral Sciences, 2nd ed.; Routledge: New York, NY, USA, 2013. [Google Scholar]
- Faul, F.; Erdfelder, E.; Lang, A.-G.; Buchner, A. G*Power 3: A flexible statistical power analysis program for the social, behavioral, and biomedical sciences. Behav. Res. Methods 2007, 39, 175–191. [Google Scholar] [CrossRef] [Scilit] [PubMed]
- Hair, J.F.; Black, W.C.; Babin, B.J.; Anderson, R.E. Multivariate Data Analysis, 8th ed.; Cengage: Boston, MA, USA, 2019. [Google Scholar]
- Parra-Moroyoqui, J.W.; Rivera-Meza, F.I.; Jiménez-Ortiz, J.L.; Flores-Laguna, O.A.; Cano-Verdugo, G.; Avilés-Rodríguez, G.J. Psychometric design and validation of the Urban Mobility Experiences Scale. Urban Sci. 2026, 10, 126. [Google Scholar] [CrossRef] [Scilit]
- González Ramírez, M.T.; Landero Hernández, R. Factor structure of the Perceived Stress Scale (PSS) in a sample from Mexico. Span. J. Psychol. 2007, 10, 199–206. [Google Scholar] [CrossRef] [Scilit] [PubMed]

Disclaimer/Publisher’s Note: The statements, opinions and data contained in all publications are solely those of the individual author(s) and contributor(s) and not of MDPI and/or the editor(s). MDPI and/or the editor(s) disclaim responsibility for any injury to people or property resulting from any ideas, methods, instructions or products referred to in the content. |
© 2026 by the authors. Licensee MDPI, Basel, Switzerland. This article is an open access article distributed under the terms and conditions of the Creative Commons Attribution (CC BY) license.