


Abstract
Urban infrastructure works conducted under live traffic conditions often face a persistent gap between approved traffic management plans and their actual field implementation. This gap remains underexplored in longitudinal studies, particularly in utility projects from low- and middle-income urban contexts. This study evaluates a risk-based supervisory approach that integrates daily monitoring of the Traffic Management Plan (TMP) with a corporate risk management framework aligned with ISO 31000. The dataset includes 288 supervised workdays over 16 months (November 2023–February 2025), 99 non-conformity tickets, 96 signal-theft events (137 units), and seven traffic incidents. The analysis combines descriptive statistics, hypothesis testing, logistic regression, segmented longitudinal analysis, count models, response-time evaluation, and a composite risk index. TMP non-compliance decreased from 18.8% to 6.9% between the first and second halves of the study period (). The odds of non-compliance were significantly higher during the staff transition period in April–May 2024 (OR = 3.50; 95% CI: 1.24–9.82), while day and night shifts showed comparable rates. Monthly patterns indicate that staff instability and signal theft contributed to non-compliance levels, and ticket resolution remained slow (mean response time: 69.9 days). These findings highlight the importance of supervisory continuity, contractor stability, and timely corrective actions in improving work zone safety.
1. Introduction
Urban work zones in active corridors are not only geometric or traffic control problems; they are socio-technical operating systems in which infrastructure works, temporary traffic control devices, road users, crews, and supervisory institutions interact under time pressure and changing field conditions. In these settings, crash risk depends not only on roadway geometry and exposure but also on how consistently temporary traffic control is installed, maintained, and corrected during operations [1,2,3].
This study focuses on what we call the compliance gap: the difference between the temporary traffic arrangement that is formally approved and the arrangement that is materially present, maintained, and functioning in the field during execution. Framing the problem in this way helps distinguish compliance from three related but different issues: whether the TMP was well designed, whether crashes occurred, and whether individual devices performed as intended. A plan may satisfy design requirements and still fail operationally because tapers are shortened, signs are missing, traffic marshals are poorly positioned, or crews work outside the authorized footprint [4,5]. These are implementation failures, and they are often under-recorded in the research literature.
The gap is especially important in utility projects. Unlike a single static work zone, utility works often involve moving workfronts, repeated setup and withdrawal cycles, mixed day and night operations, and tight interaction with local access, public transport, and pedestrian activity. In large Latin American cities, these challenges are compounded by institutional capacity constraints, congested corridors, and context-specific disruptions such as signal theft or abrupt staffing changes [2,6,7]. As a result, project owners often rely on experience and informal escalation rather than on evidence-based supervisory models.
This study addresses that problem through a longitudinal case from Medellín, Colombia. It examines an urban utility project in which daily supervision of the TMP was progressively integrated with a corporate risk-management approach aligned with ISO 31000 [8]. Rather than proposing a new design standard or a crash-prediction model, the paper evaluates how a supervisory framework works in practice by linking identified risks, TMP control points, daily verification, ticket-based escalation, documentary evidence, and organizational learning over time.
The objective of the study is to assess whether a risk-based supervisory framework was associated with better TMP implementation over time and to examine how shift type, staffing continuity, theft exposure, and corrective-action timing shaped that process. Specifically, the analysis asks whether non-compliance declined over the observation window, whether day and night operations differed materially, and whether the April–May 2024 staffing change corresponded to a measurable supervisory shock.
The paper makes four contributions. First, it provides longitudinal evidence based on 288 daily supervision records from an urban utility project, a type of evidence that remains scarce in the work-zone literature. Second, it evaluates whether the observed improvement over time was statistically meaningful and whether the expected night-shift penalty appeared in this case. Third, it quantifies the effect of a contractor staff-change period, highlighting the operational importance of supervisory continuity and personnel stability. Fourth, it introduces a practical monthly risk index that combines non-compliance, signal theft, and TMP-related ticketing activity, translating supervisory processes into a monitoring tool.
The remainder of the paper is organized as follows. Section 2 reviews the literature on work zone safety, supervision, staffing continuity, and project risk management. Section 3 describes the study context, data structure, supervisory framework, and statistical approach. Section 4 presents the results. Section 5 discusses implications for supervision and project governance. Section 6 concludes with recommendations for practice and future research.
2. Work Zone Safety, Supervision, and Risk Management in Urban Infrastructure
This section reviews the literature most relevant to the paper’s argument: work-zone safety beyond static plan design, supervision and the compliance gap, day–night operations and staffing continuity, and project risk management. The review is organized to position the present study against recent work that addresses dynamic control conditions rather than only device effects or crash outcomes.
2.1. Work Zone Safety Beyond Static Plan Design
The work zone safety literature has largely developed around crash causation, temporary traffic control devices, and exposure-based modeling. Recent reviews show that excessive speed, distraction, inconsistent lane guidance, and poor visibility are recurrent contributors to unsafe conditions in work zones [1]. Earlier studies reached similar conclusions, highlighting the role of site configuration, traffic conditions, and design choices in shaping crash risk [9,10]. More recent work has also emphasized the importance of transition areas and human factors, suggesting that safety outcomes depend on how drivers interpret and respond to temporary traffic control [1,11].
A second line of research examines how traffic control devices influence driver behavior. Studies on warning signs, dynamic message systems, and portable devices show that placement, clarity, and visibility can affect speed compliance and reduce risk [12,13,14]. Research on night-time conditions further indicates that visibility remains important, although its effect depends on the quality of the temporary traffic control arrangement and on driver response [3,15,16]. These contributions are important, but they tend to treat traffic control as a configuration rather than as a control system that must be maintained and corrected during operations.
In practice, work zones rarely operate under perfect implementation. Supervisors often encounter partial or degraded setups, such as shortened tapers, missing signs, or activities occurring outside the authorized area [17]. These conditions reflect implementation gaps rather than design failures, yet they are rarely captured in conventional datasets. As a result, the processes that sustain or undermine compliance remain underrepresented in the literature.
2.2. Supervision, Monitoring, and the Compliance Gap
A growing body of research suggests that the gap between approved plans and field implementation may be a critical determinant of work-zone safety. Al-Bayati et al. [4] argue that safety performance depends not only on device selection but also on enforcement and continuous field management. Similarly, Silveira et al. [5] show that consistent traffic guidance depends on day-to-day upkeep and corrective supervision rather than on plan quality alone. These studies move closer to the problem examined here, but they do not provide longitudinal evidence on how supervisory systems evolve over repeated utility-work operations.
Related work in transportation safety highlights the role of monitoring and feedback in managing dynamic risk. Infrastructure-based systems and traffic-monitoring approaches have been used to assess evolving traffic conditions and support proactive intervention [18,19]. However, in many construction and utility projects, especially in resource-constrained settings, supervision still relies on field inspections, photographic evidence, and formal ticketing rather than on automated systems. These practices are often treated as administrative processes, even though they function as mechanisms for detecting, documenting, and correcting risk [20,21].
In this paper, the compliance gap is treated as a measurable supervisory problem with three dimensions: a technical gap when field implementation departs from the approved plan, a temporal gap when corrective action is slow, and an organizational gap when supervision depends on personnel continuity and authority. This framing helps explain why a project can be compliant on paper and still remain fragile in operation.
2.3. Day–Night Operations and Staffing Continuity
Work zone operations are commonly assumed to be more hazardous at night due to reduced visibility and fatigue [3,15]. However, this assumption does not always hold in practice. Some projects concentrate disruptive activities at night, allowing crews to build experience in that operational format. In contrast, daytime operations in urban corridors often involve higher pedestrian exposure, more complex traffic interactions, and tighter time constraints for setup. The relative risk of day and night operations may therefore depend on experience, traffic composition, and supervisory conditions rather than on lighting alone [22].
Staffing continuity introduces an additional dimension. Construction safety research has long shown that turnover can degrade performance by disrupting coordination and reducing accumulated experience [23,24]. More recent studies confirm that staff replacement creates a vulnerable period during the learning phase of incoming personnel [25]. In work-zone traffic management, the contractor’s mobility specialist functions as the operational bridge between the approved TMP and field execution. Changes in that role can therefore affect implementation quality even when the formal plan remains unchanged.
The present study engages both issues empirically. It does not assume that night work is more problematic; instead, it evaluates whether that pattern appears in the daily records. It also examines whether the April–May 2024 staffing transition corresponded to a measurable break in compliance, thereby linking an organizational event to operational performance.
2.4. Risk Management in Construction and Infrastructure Projects
The study is conceptually grounded in project risk management. Research in construction management has shown that project outcomes depend on how risks are identified, allocated, and managed across organizational interfaces [26,27]. More recent work highlights the dynamic nature of risk, emphasizing the role of organizational processes and decision-making structures [28]. This perspective is particularly relevant in urban infrastructure, where risks extend beyond cost and schedule to include mobility disruption and public safety [29].
Empirical studies have linked risk-management practices with improved project performance and organizational learning [30,31]. What remains less developed is the connection between formal risk-management language and field-level work-zone supervision. In many projects, enterprise risk registers and daily operational control still operate in parallel rather than as one integrated system.
Taken together, the literature documents crash mechanisms, device effects, and the value of monitoring, but only a limited portion of it explains how supervisors sustain TMP fidelity across repeated operational cycles. Even fewer studies examine daily implementation records together with staffing continuity, context-specific disruptions such as sign theft, and a monitoring-oriented risk index in an urban utility setting. This is the specific niche of the present study: rather than focusing on crashes, device performance, or isolated inspections, it examines repeated supervisory cycles and their relation to staffing continuity, contextual disruption, and risk monitoring over time.
3. Materials and Methods
This section describes the study setting, data sources, variable construction, supervisory framework, and analytical strategy. The analytical sequence moves from daily operational records to monthly aggregation for a practical reason: the workday is the natural unit for TMP compliance, whereas the month is more suitable for describing broader operating conditions, theft intensity, and the composite risk index. Throughout, the daily logistic model is treated as the primary inferential specification, while the monthly segmented analysis is used descriptively to characterize the visible break in the series.
3.1. Study Setting
The case study was conducted along the Carrera 62 (Avenida Regional) corridor in Medellín, Colombia, where EPM carried out inspection, rehabilitation, and maintenance of major water and sewer trunk-system assets. The corridor is a high-volume urban arterial with strategic metropolitan connectivity. The contract involved repeated interventions over less than 5 km, including CCTV inspection, ground-penetrating radar, localized rehabilitation, construction of inspection structures, and preventive maintenance. These activities required partial or full lane closures, temporary channelization, traffic marshals, and coordination with the municipal mobility authority.
This corridor provides a demanding context for TMP supervision. First, workfronts were mobile rather than fixed, shifting across short segments as tasks progressed. Second, operations evolved over time, with early reliance on night shifts followed by broader daytime activity. Third, interventions took place in a complex traffic environment with mixed flows, access movements, and limited space for staging traffic control devices. Finally, compliance had to be maintained across a sequence of routine workdays rather than a single intervention event.
3.2. Data Sources
Three operational data sources were integrated. The first was the daily supervision database, which included 288 records from 3 November 2023 to 21 February 2025. Each record corresponded to a supervised workday and included date, shift type, workfront identifier, a binary TMP compliance indicator, incident reporting, and counts of tickets and stolen signals. These data supported day-level analysis. The second source was the non-conformity ticket register, containing 99 tickets issued when deviations were identified in TMP implementation, technical performance, safety, environmental, or administrative requirements. The dataset included issue dates, closure dates when available, deadlines, and category labels. A single clerical error was corrected during cleaning, and unresolved tickets were excluded from response-time calculations but retained for categorical analysis.
The third source was the signal-theft log, which recorded 96 theft events corresponding to 137 stolen units across 43 dates. Because this dataset captured multiple events per day, it was used for monthly aggregation and risk-index construction, while daily comparisons relied on the supervision dataset. A manually coded typology of TMP deficiencies was also used. The 37 non-compliant workdays were reviewed and classified into five categories based on field notes: transition/channelization, general implementation, vertical signage, traffic marshals, and night lighting. Multiple deficiencies could occur within a single workday, resulting in 64 classified instances.
3.3. Data Cleaning and Variable Construction
Daily records were ordered chronologically and indexed from 1 to 288. The observation window was divided into two equal halves of 144 workdays. The main outcome variable was binary TMP non-compliance ( if the workday was classified as deficient; 0 otherwise). Night shift was coded as 1 and day shift as 0. A period indicator captured the second half of the study. A staff-change indicator identified workdays between 1 April 2024 and 31 May 2024, corresponding to a change in the contractor’s mobility specialist.
The daily TMP field required professional judgment, but that judgment was not entirely discretionary. In practice, the owner-side supervisor completed a structured form after each supervised workday using the approved TMP, predefined control points, field photographs, and formal ticketing criteria. In addition, the records were available for review by the contract interventor, which reduced the scope for purely ad hoc coding. The archived dataset, however, retained TMP status as a binary field and did not preserve a separate borderline category. A formal ex post reclassification of ambiguous workdays was therefore not possible without introducing unsupported assumptions.
Monthly variables were constructed by aggregating daily records. These included non-compliance counts, total workdays, night-shift share, and incident counts. Monthly TMP-related ticket counts were derived from the ticket register, and theft measures were obtained from the cleaned theft log. April 2024 was defined as the start of the post-change period for segmented longitudinal analysis because it coincided with the contractor staff change and with the sharpest visible shift in the monthly series. Response time was defined as the number of calendar days between ticket issuance and closure. Only tickets with valid closure dates were used for response-time statistics. Mean, median, interquartile range, and the proportion of tickets closed within five days were calculated.
3.4. Supervisory Framework
The supervisory framework can be described in three layers. The first is a three-phase daily cycle: before (verification of permits and initial conditions), during (continuous monitoring of traffic control and crew activity), and after (removal of devices and residual-risk assessment). This structure extends supervision across the full workday rather than relying on isolated inspections.
The second layer follows a risk-management logic aligned with ISO 31000. Mobility risks are identified and linked to specific TMP control elements. Supervision verifies whether those controls are present and adequate, while evidence is documented through field records, photographs, and formal tickets. Recurrent issues inform updates to risk matrices and contractor feedback. The third layer is a traceability chain linking risk→control→supervision→evidence. This structure connects field observations with contractual mechanisms and organizational learning, allowing supervision outcomes to be analyzed as part of a risk-control system.
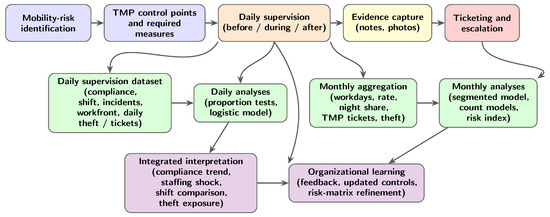
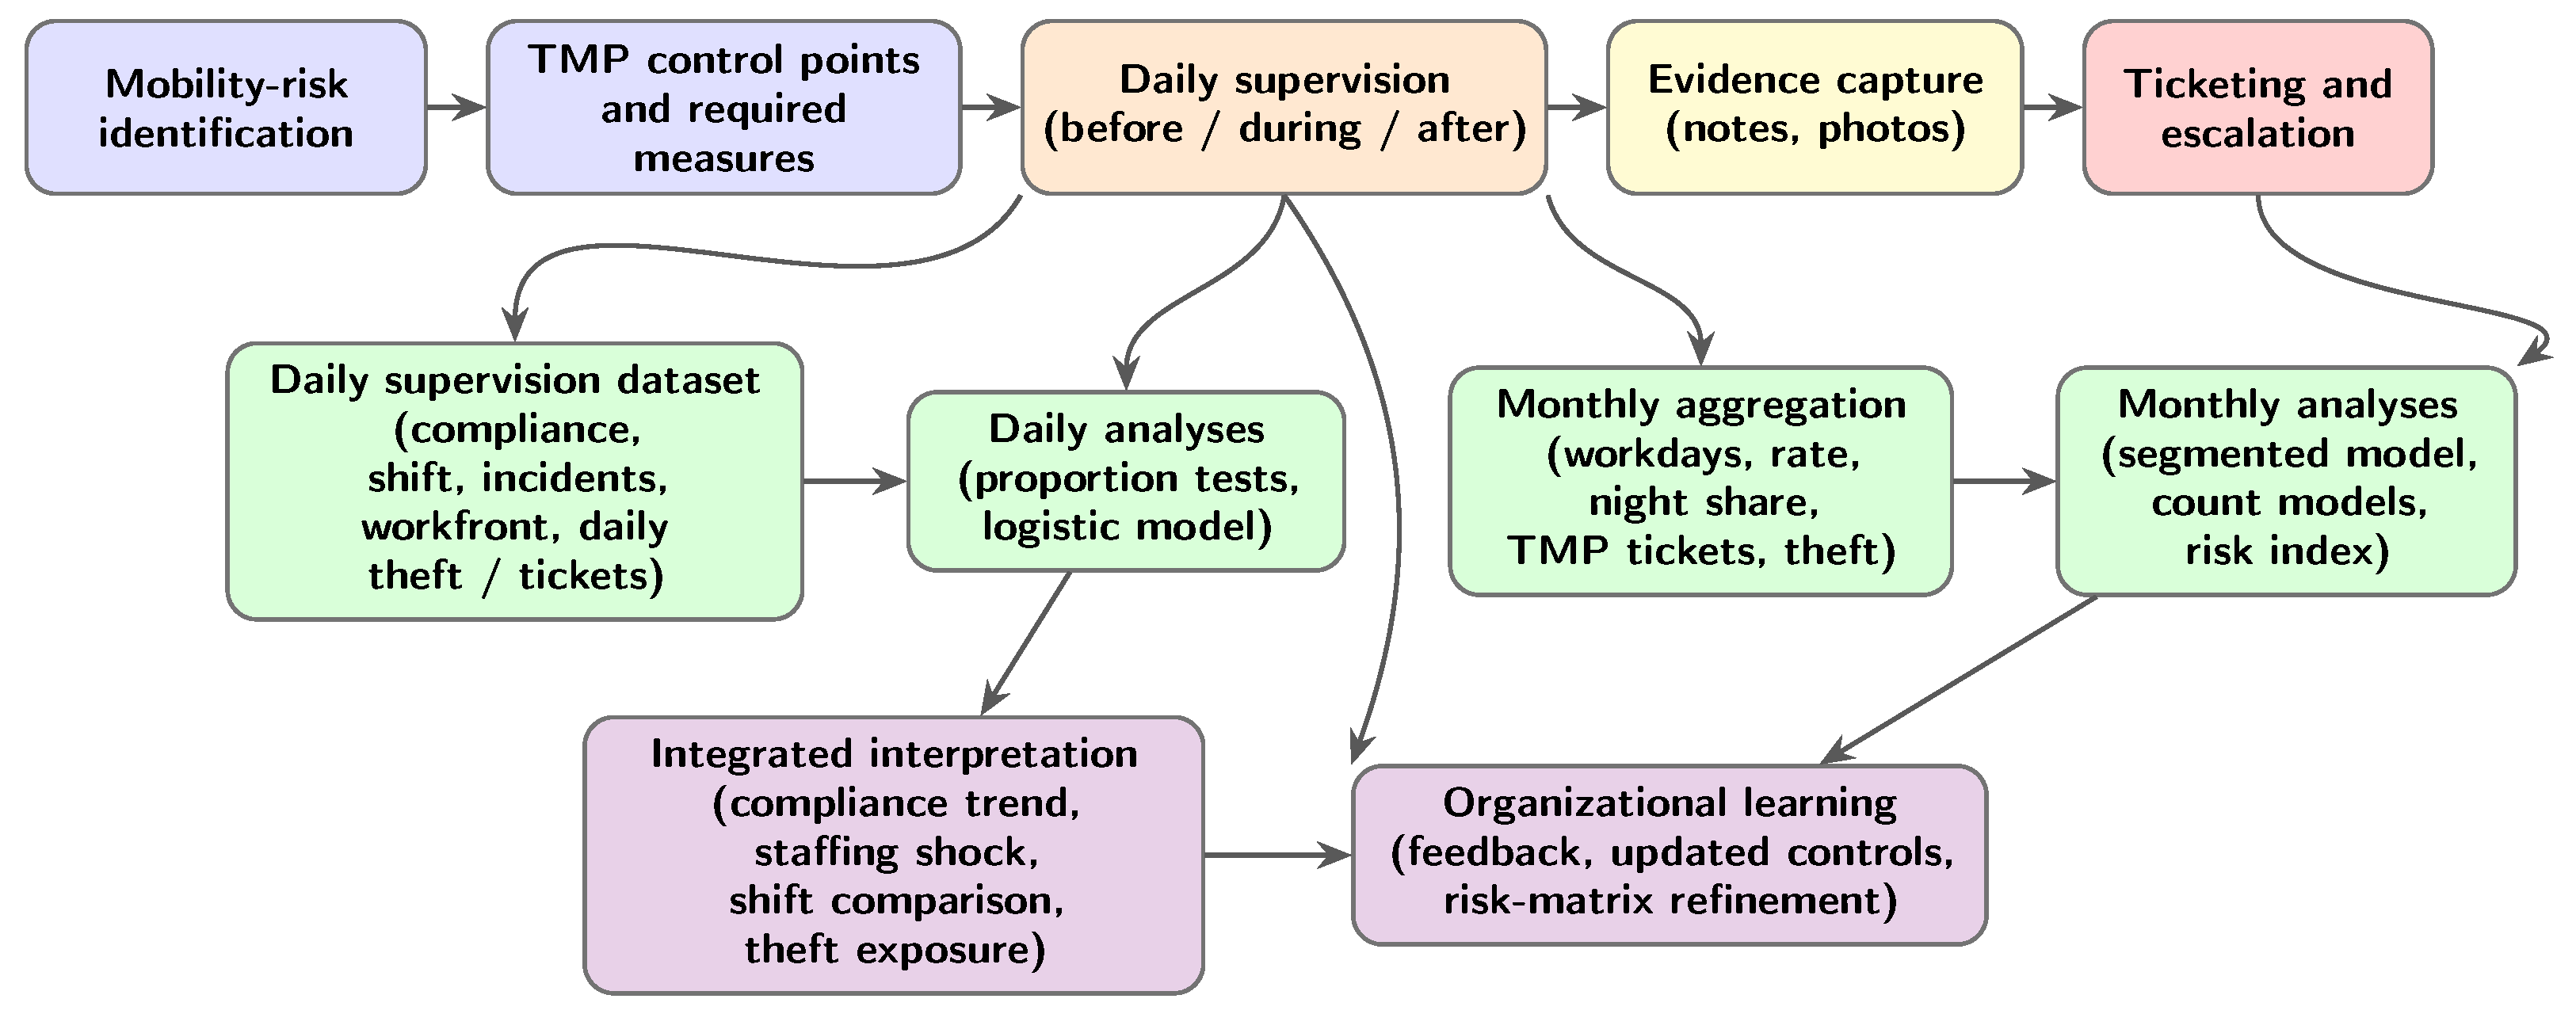
Figure 1 summarizes how the supervisory workflow connects risk identification, TMP control points, daily field verification, evidence capture, ticket-based escalation, monthly aggregation, statistical analysis, and feedback into project learning. The figure is intended to make the methodological sequence more transparent, especially the link between day-level supervision and month-level monitoring products.
Figure 1.
Research framework linking day-level supervision, daily and monthly analyses, and organizational learning. Note: The framework shows how mobility-risk identification and TMP control points are translated into daily supervision, evidence capture, ticketing, structured datasets, analytical outputs, and feedback for updated controls.
3.5. Statistical Analysis
The analytical components were designed to answer related but distinct questions. Descriptive statistics summarize the operational setting. Two-proportion tests assess whether the observed change over time and the day–night difference are large enough to distinguish from sampling variation. The daily logistic model is the main inferential model because TMP compliance is recorded at the workday level. Monthly aggregation is then used for two complementary purposes: to describe the April–May 2024 disruption with a segmented longitudinal model and to model event intensity for non-compliance and theft counts.
The composite risk index does not replace these models; instead, it provides a compact monitoring signal that combines several supervisory indicators in one monthly measure. In this sense, the daily and monthly components are analytically complementary: the first estimates workday-level associations, while the second characterizes broader temporal patterns and supervisory conditions that are not meaningful at the single-day scale. Following this logic, a logistic regression model was used to estimate the daily probability of non-compliance, as shown in Equation (1).
Odds ratios, 95% confidence intervals, and p-values were reported [7].
Fourth, a segmented longitudinal model was applied to monthly non-compliance rates, as shown in Equation (2).
where t is the monthly index, marks the period after the staff-change event, and captures changes in trend. Given the limited number of monthly observations, this model is interpreted as a structural description rather than a full time-series analysis. Fifth, monthly count models were estimated. A Poisson model with a workday offset was used for non-compliance counts, and a negative binomial model was used for theft counts due to overdispersion. Incidence-rate ratios (IRR) were reported.
Sixth, response-time analysis summarized ticket closure performance overall and by category. Seventh, a composite monthly risk index was developed as an exploratory methodological contribution to capture the joint behavior of supervisory signals over time. The index combined three standardized monthly variables: TMP non-compliance rate, theft units, and TMP-related ticket counts. Each component was transformed into a z-score and averaged with equal weights, as shown in Equation (3).
To improve interpretability, the resulting score was rescaled to a 0–100 range using min–max normalization, as shown in Equation (4).
Equal weights were used because the manuscript does not have prior evidence supporting a defensible differential weighting scheme and because the purpose of the index is operational monitoring rather than formal risk monetization. For transparency, the revised code supports alternative weighting scenarios when users reproduce the repository dataset, but the article reports only the equal-weight specification and interprets it as exploratory rather than fully validated. Higher index values indicate months in which multiple supervisory indicators deteriorated simultaneously.
A formal reclassification sensitivity test for borderline workdays could not be performed from the archived binary dataset because ambiguous cases were not stored as a separate category. The strongest defensible robustness check available from the retained records is therefore cross-specification consistency. In the revised manuscript, the main substantive findings are checked across proportion tests, the daily logistic model, and monthly count models to verify that they do not depend on a single aggregation choice. This does not replace a true recoding-based sensitivity analysis, but it is the strongest robustness assessment supported by the retained data structure. All analyses were conducted using cleaned operational data. The accompanying R script reproduces the full workflow [32], including data preparation, modeling, figure generation, and output tables.
4. Results
This section presents the empirical findings in a sequence that mirrors the analytical design. It begins with descriptive patterns and simple comparisons, then reports the daily logistic model as the main inferential result, and finally uses monthly models and the risk index to describe the broader operating environment. Unless otherwise stated, the month-level results are interpreted descriptively and in support of the day-level findings.
4.1. Descriptive Overview
Table 1 summarizes the cleaned dataset. The analytical file contained 288 supervised workdays, of which 37 were classified as TMP non-compliant, for an overall non-compliance rate of 12.8%. Night shifts represented 26.4% of supervised workdays. Seven traffic incidents were recorded during supervised operations, equivalent to 2.4% of workdays. The ticket register contained 99 formal non-conformity tickets, including 29 TMP-related tickets and 44 technical tickets. The cleaned theft log contained 96 item-level theft records corresponding to 137 stolen signal units, while the daily supervision sheets recorded theft on 35 workdays.
Table 1.
Descriptive overview of the analytical dataset.
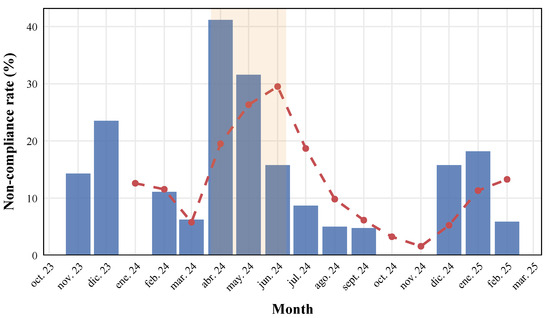
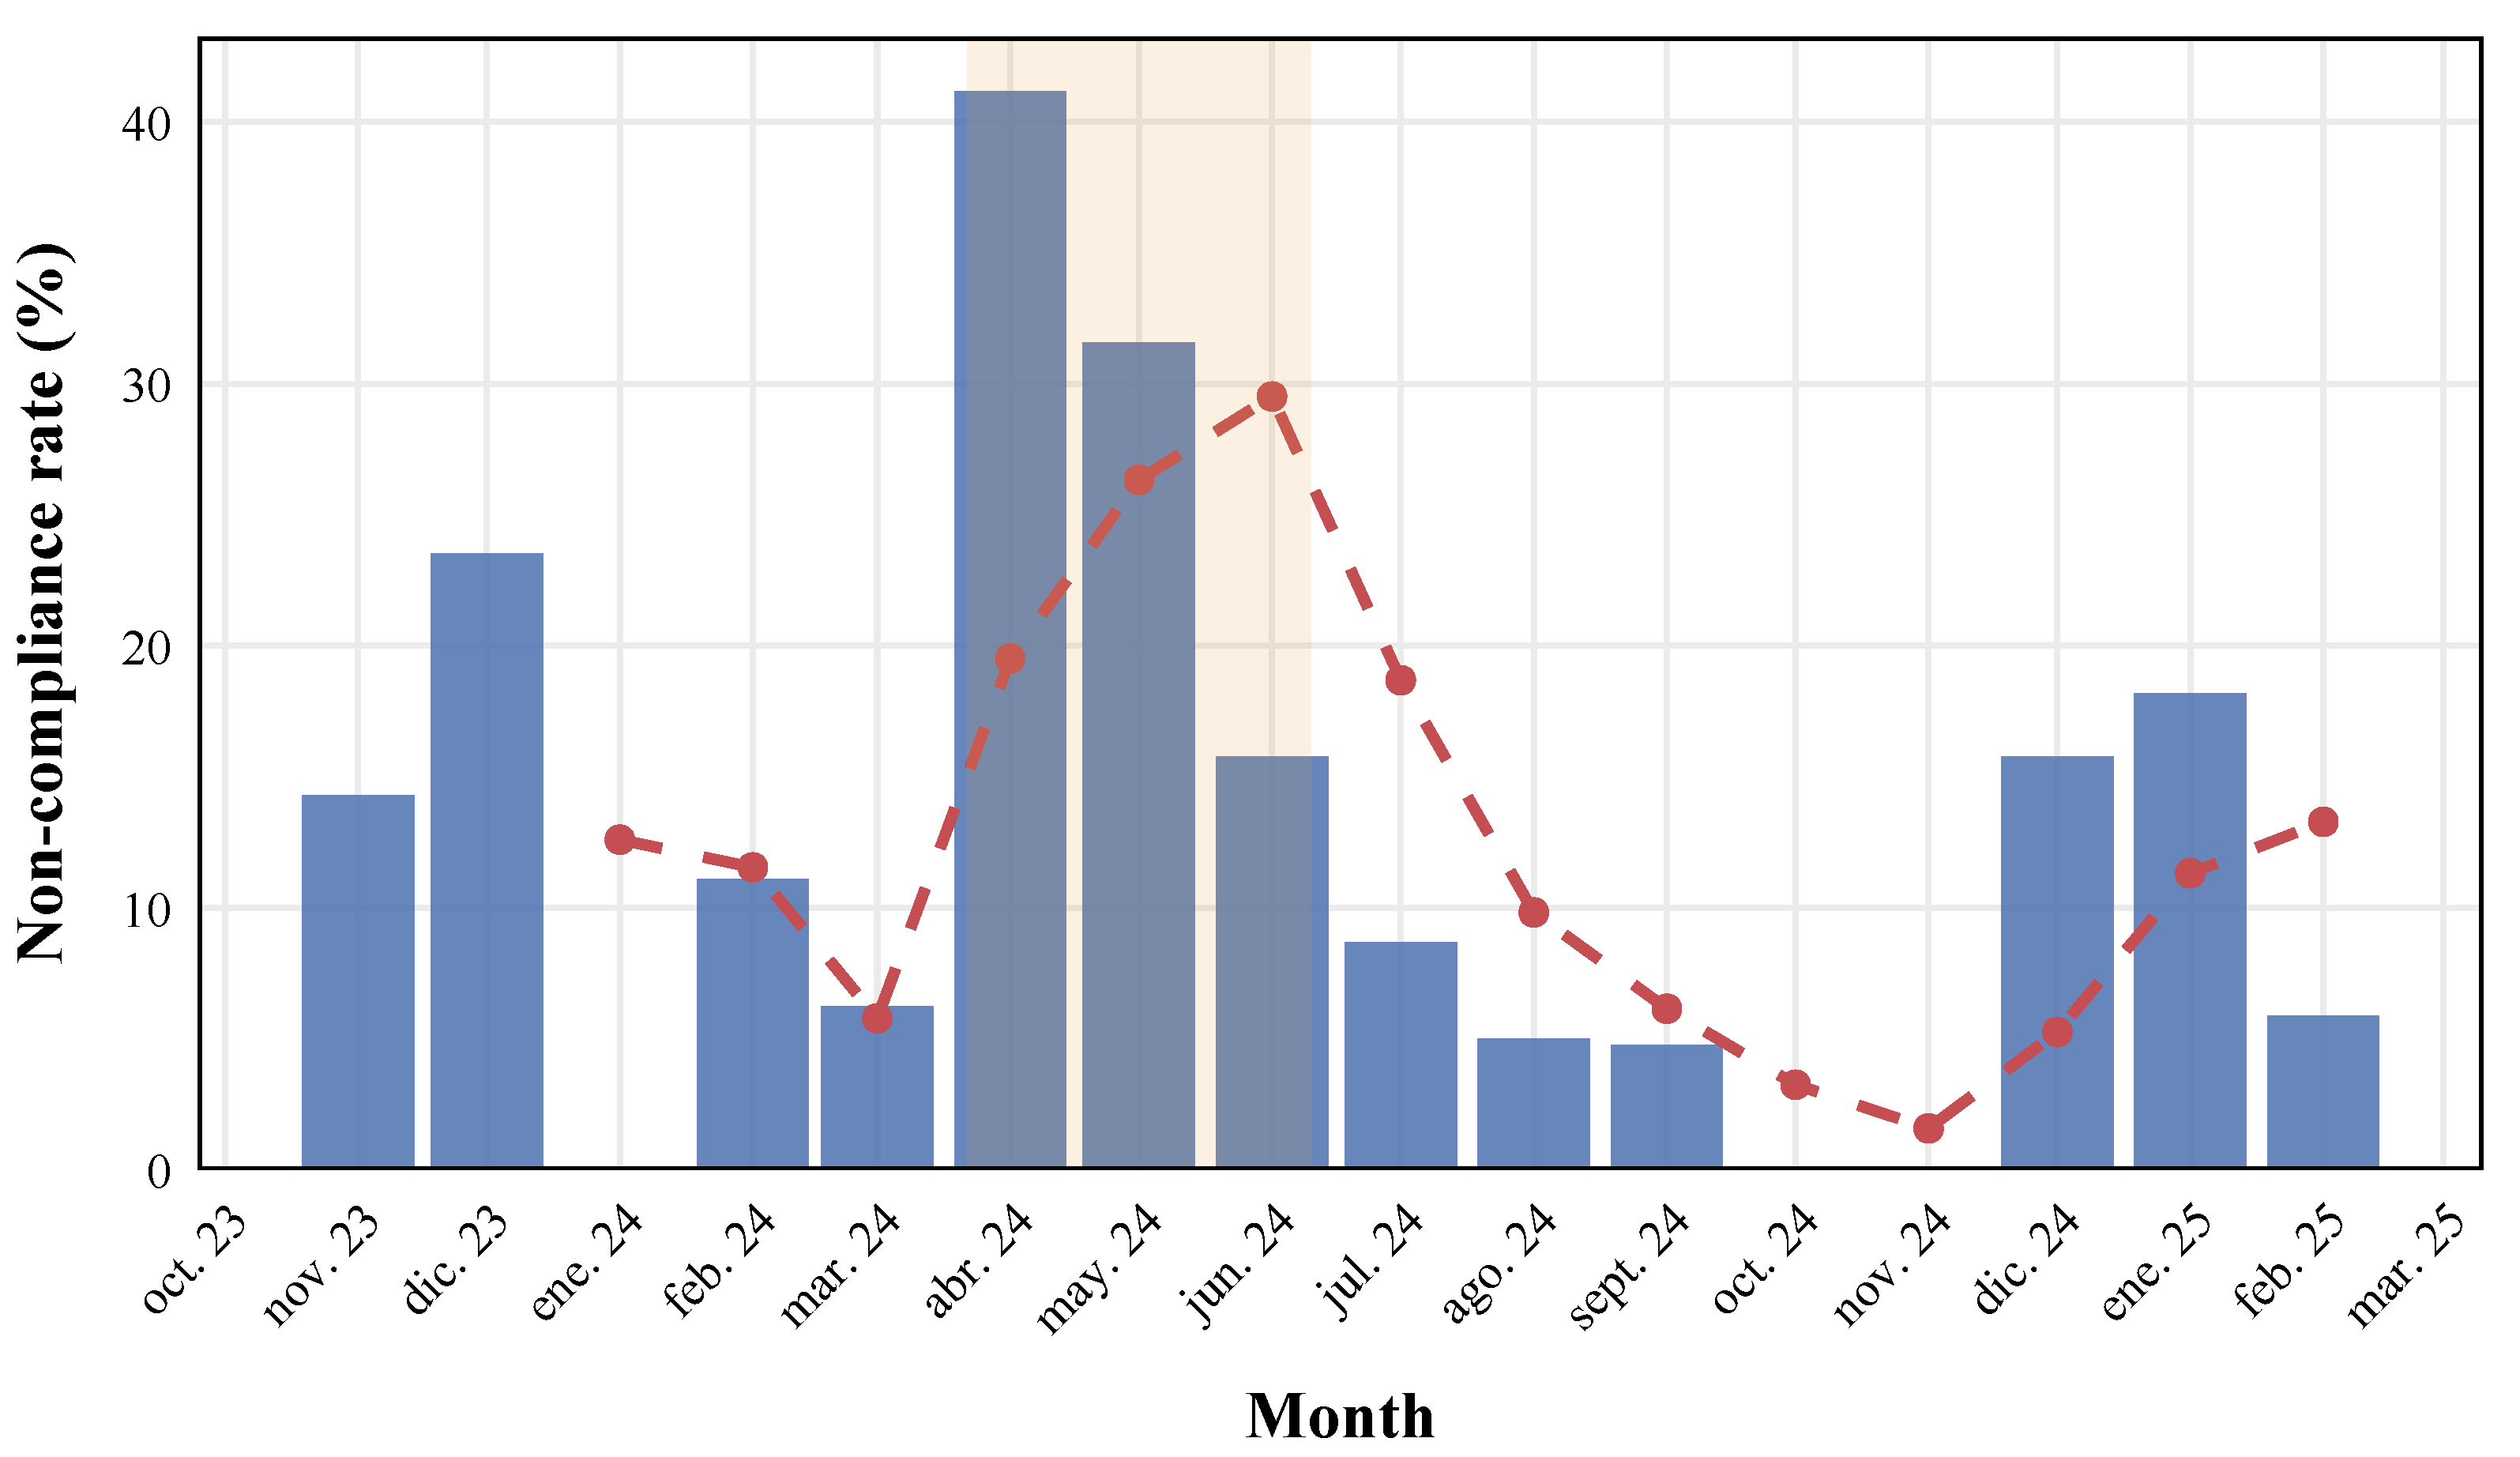
Figure 2 shows the monthly evolution of TMP non-compliance. The pattern is clearly non-linear. Rates were moderate at the start of the project (14.3% in November 2023 and 23.5% in December 2023), followed by a short period of improvement in early 2024. A sharp deterioration then occurred in April and May 2024, when monthly rates reached 41.2% and 31.6%, respectively. Performance improved again through the second half of 2024, including two consecutive months with zero non-compliance in October and November 2024, before a moderate rebound in December 2024 and January 2025. This pattern suggests that a simple before–after comparison captures only part of the underlying process.
Figure 2.
Monthly TMP non-compliance rate across the 16-month observation window. Note: Bars show the observed monthly rates, the dashed line shows the three-month moving average, and the shaded band marks the April–May 2024 staff-change period. The figure highlights the non-linear sequence of early improvement, abrupt disruption, and later recovery.
4.2. Change Between the First and Second Halves of the Observation Window
Table 2 reports the main proportion comparisons. TMP non-compliance declined from 27 of 144 workdays in the first half of the observation window (18.8%) to 10 of 144 workdays in the second half (6.9%). The two-proportion test confirmed that this reduction was statistically significant (, ). The absolute risk difference was 11.8 percentage points (95% CI: 4.2–19.4), indicating that the observed improvement was unlikely to be a chance fluctuation.
Table 2.
TMP non-compliance by period and shift type.
This comparison supports the descriptive conclusion that supervisory performance improved over the course of the project. At the same time, the monthly series shows that the improvement was not gradual. The overall change reflects a sequence of early adjustment, a short period of disruption, and later recovery.
4.3. Night Versus Day Shifts
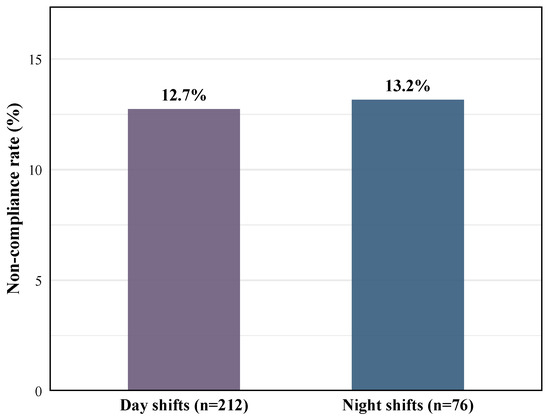
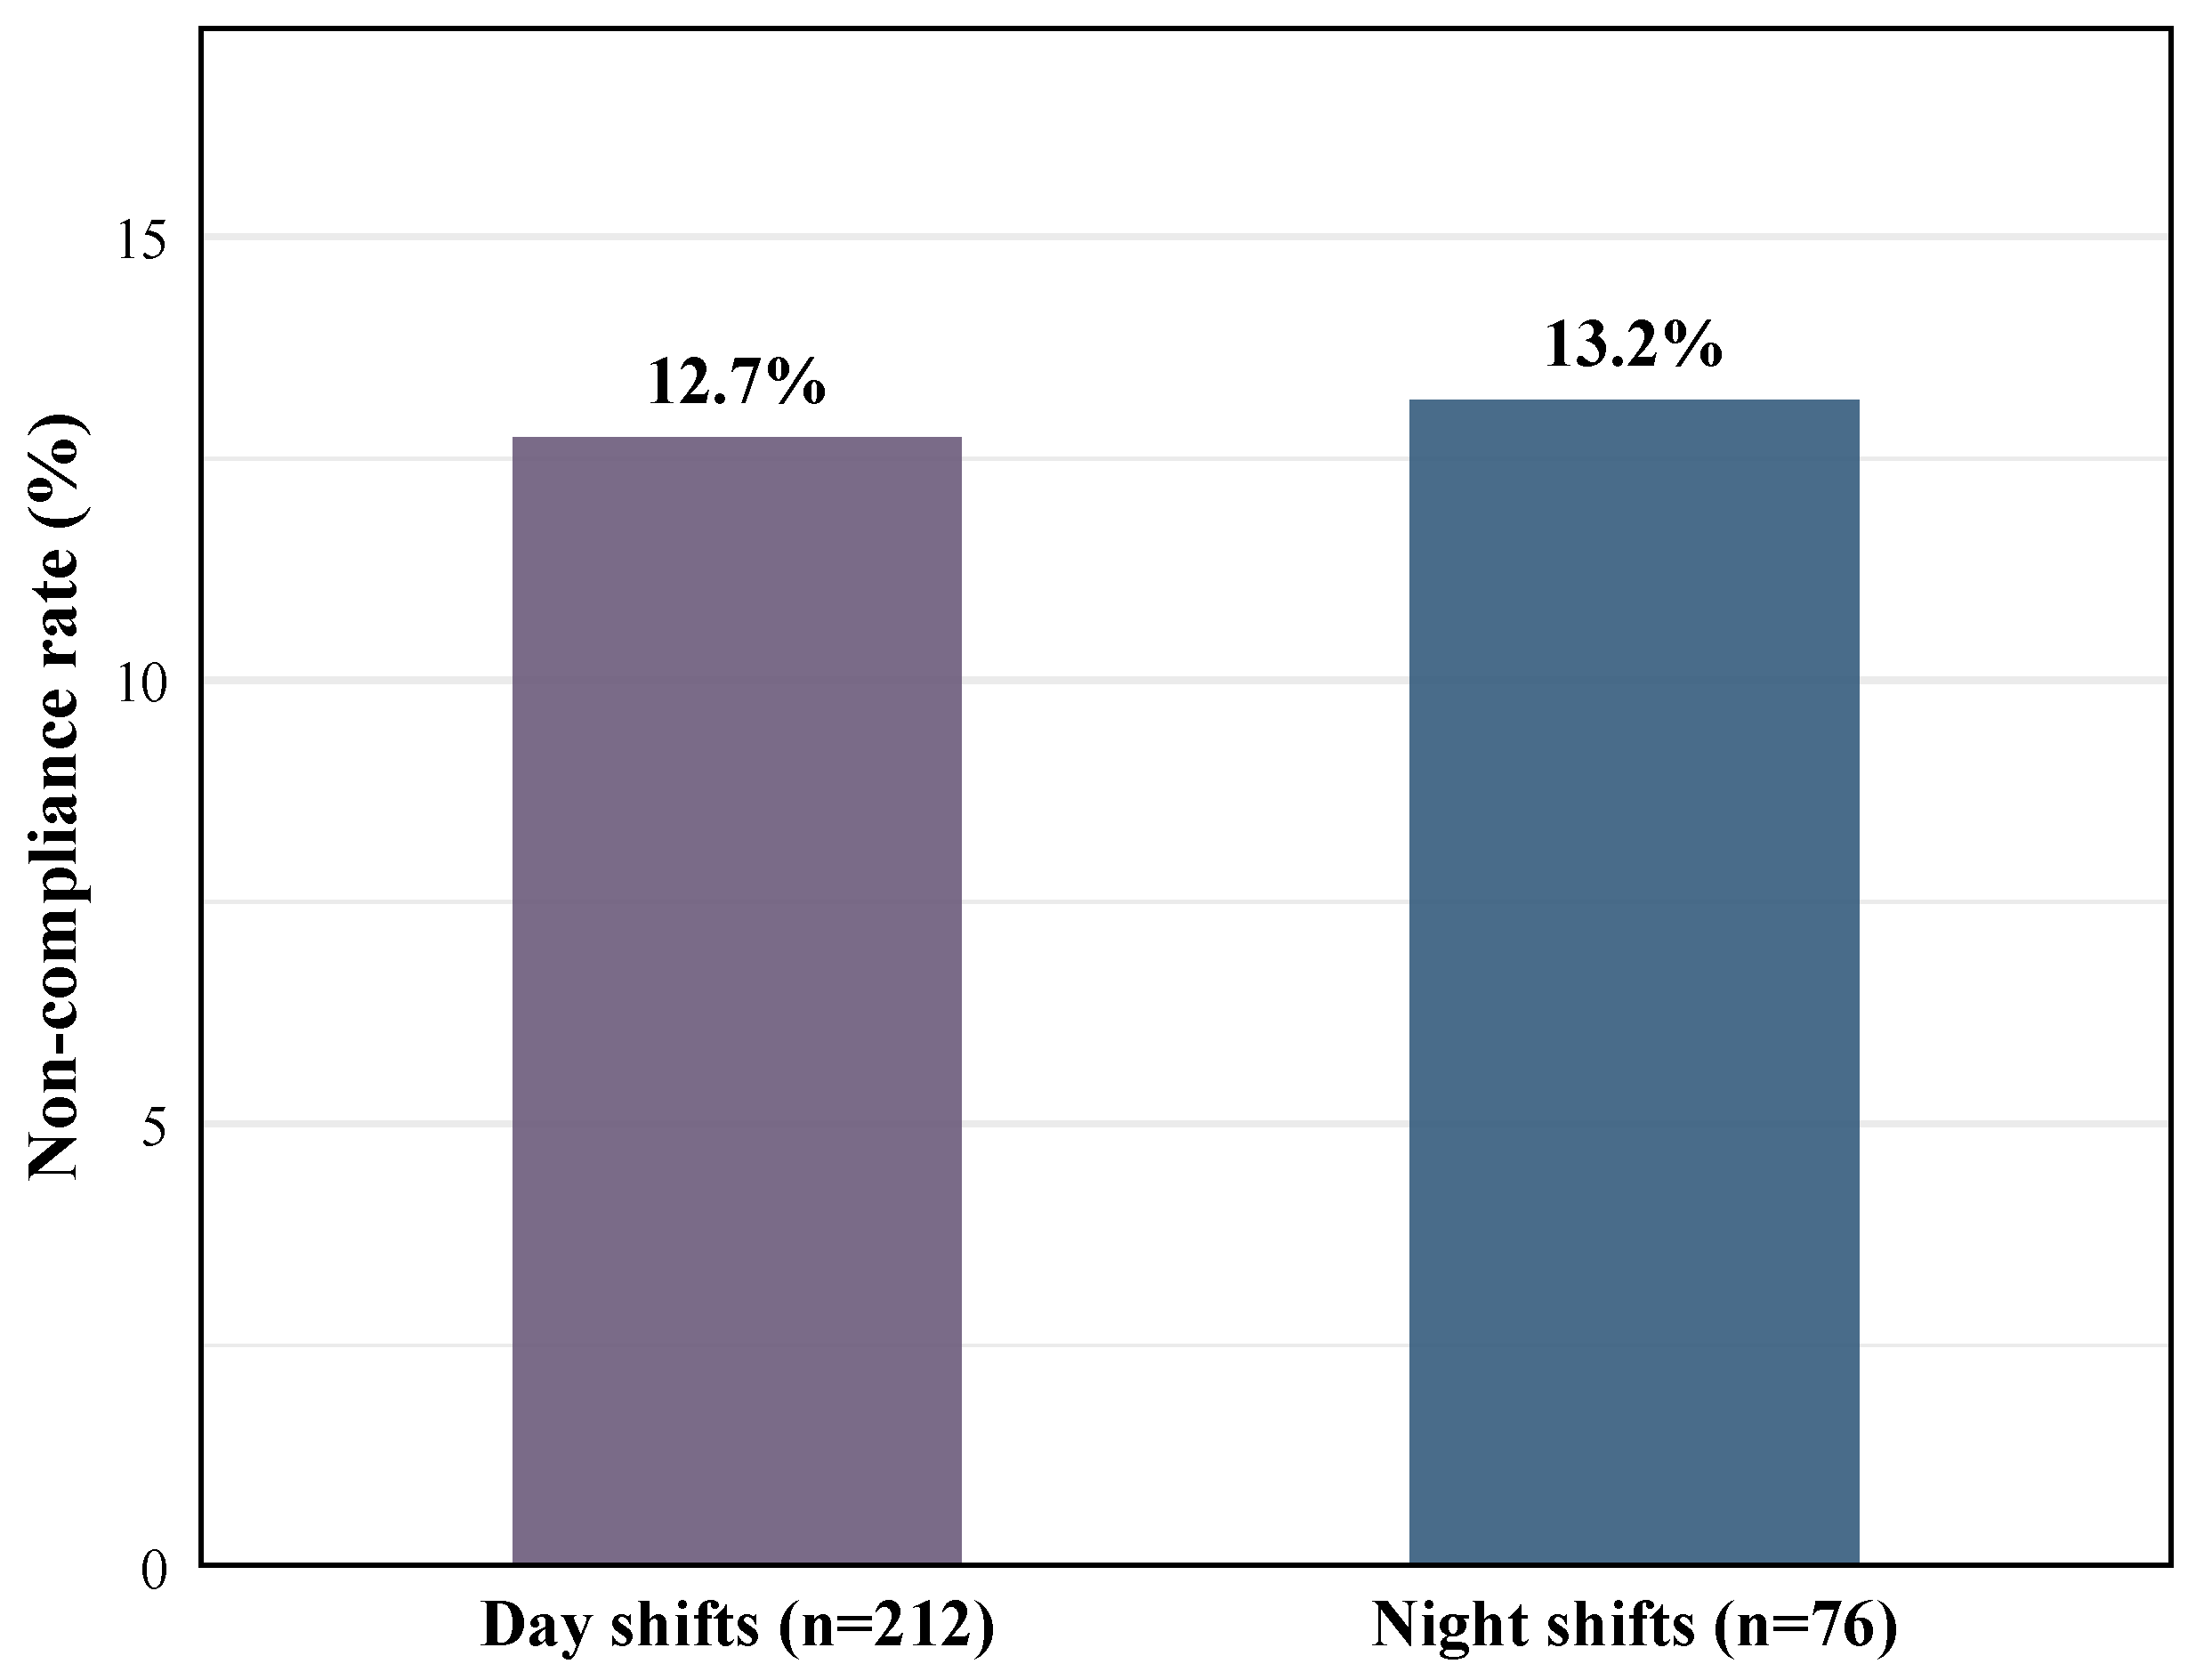
Contrary to the common assumption that night work is inherently more prone to non-compliance, the shift comparison showed nearly identical rates: 13.2% for night workdays and 12.7% for day workdays (Table 2). The difference of 0.4 percentage points was negligible (). Figure 3 illustrates this overall parity.
Figure 3.
Comparable TMP non-compliance rates in night and day shifts. Note: The vertical dotted line represents the start of the Traffic Management Plan (TMP) implementation (April 2024).
This result becomes more informative when read together with the monthly pattern. During the April–May 2024 disruption, daytime workdays were more frequently non-compliant than night workdays. The overall parity therefore does not mean that both shift types performed equally well at all times. Instead, it suggests that the main source of variation was operational disruption rather than shift timing alone.
4.4. Daily Logistic Regression
Table 3 presents the main daily logistic regression. The model had a statistically significant likelihood-ratio test () and a McFadden pseudo- of 0.081, indicating modest but meaningful explanatory power for an operational binary outcome. The staff-change period was the only clearly significant predictor. Workdays in April–May 2024 had 3.50 times the odds of TMP non-compliance relative to the rest of the study period (95% CI: 1.24–10.03; ). Night shifts were not associated with higher odds of non-compliance (OR = 0.85; ). The second-half indicator and the monthly time index both pointed toward improvement, but neither was statistically significant in the multivariable model.
Table 3.
Daily logistic regression for TMP non-compliance.
From an operational perspective, the model points to a specific vulnerability: disruption in specialist continuity. The results suggest that the most important predictor of non-compliance was not whether the work was carried out during the day or at night, but whether the contractor was going through a transition in a key traffic-management role.
4.5. Segmented Longitudinal Analysis of Monthly Non-Compliance
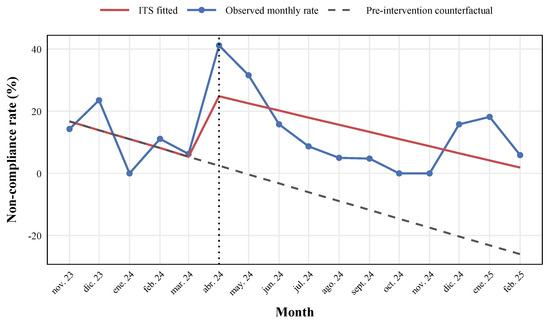
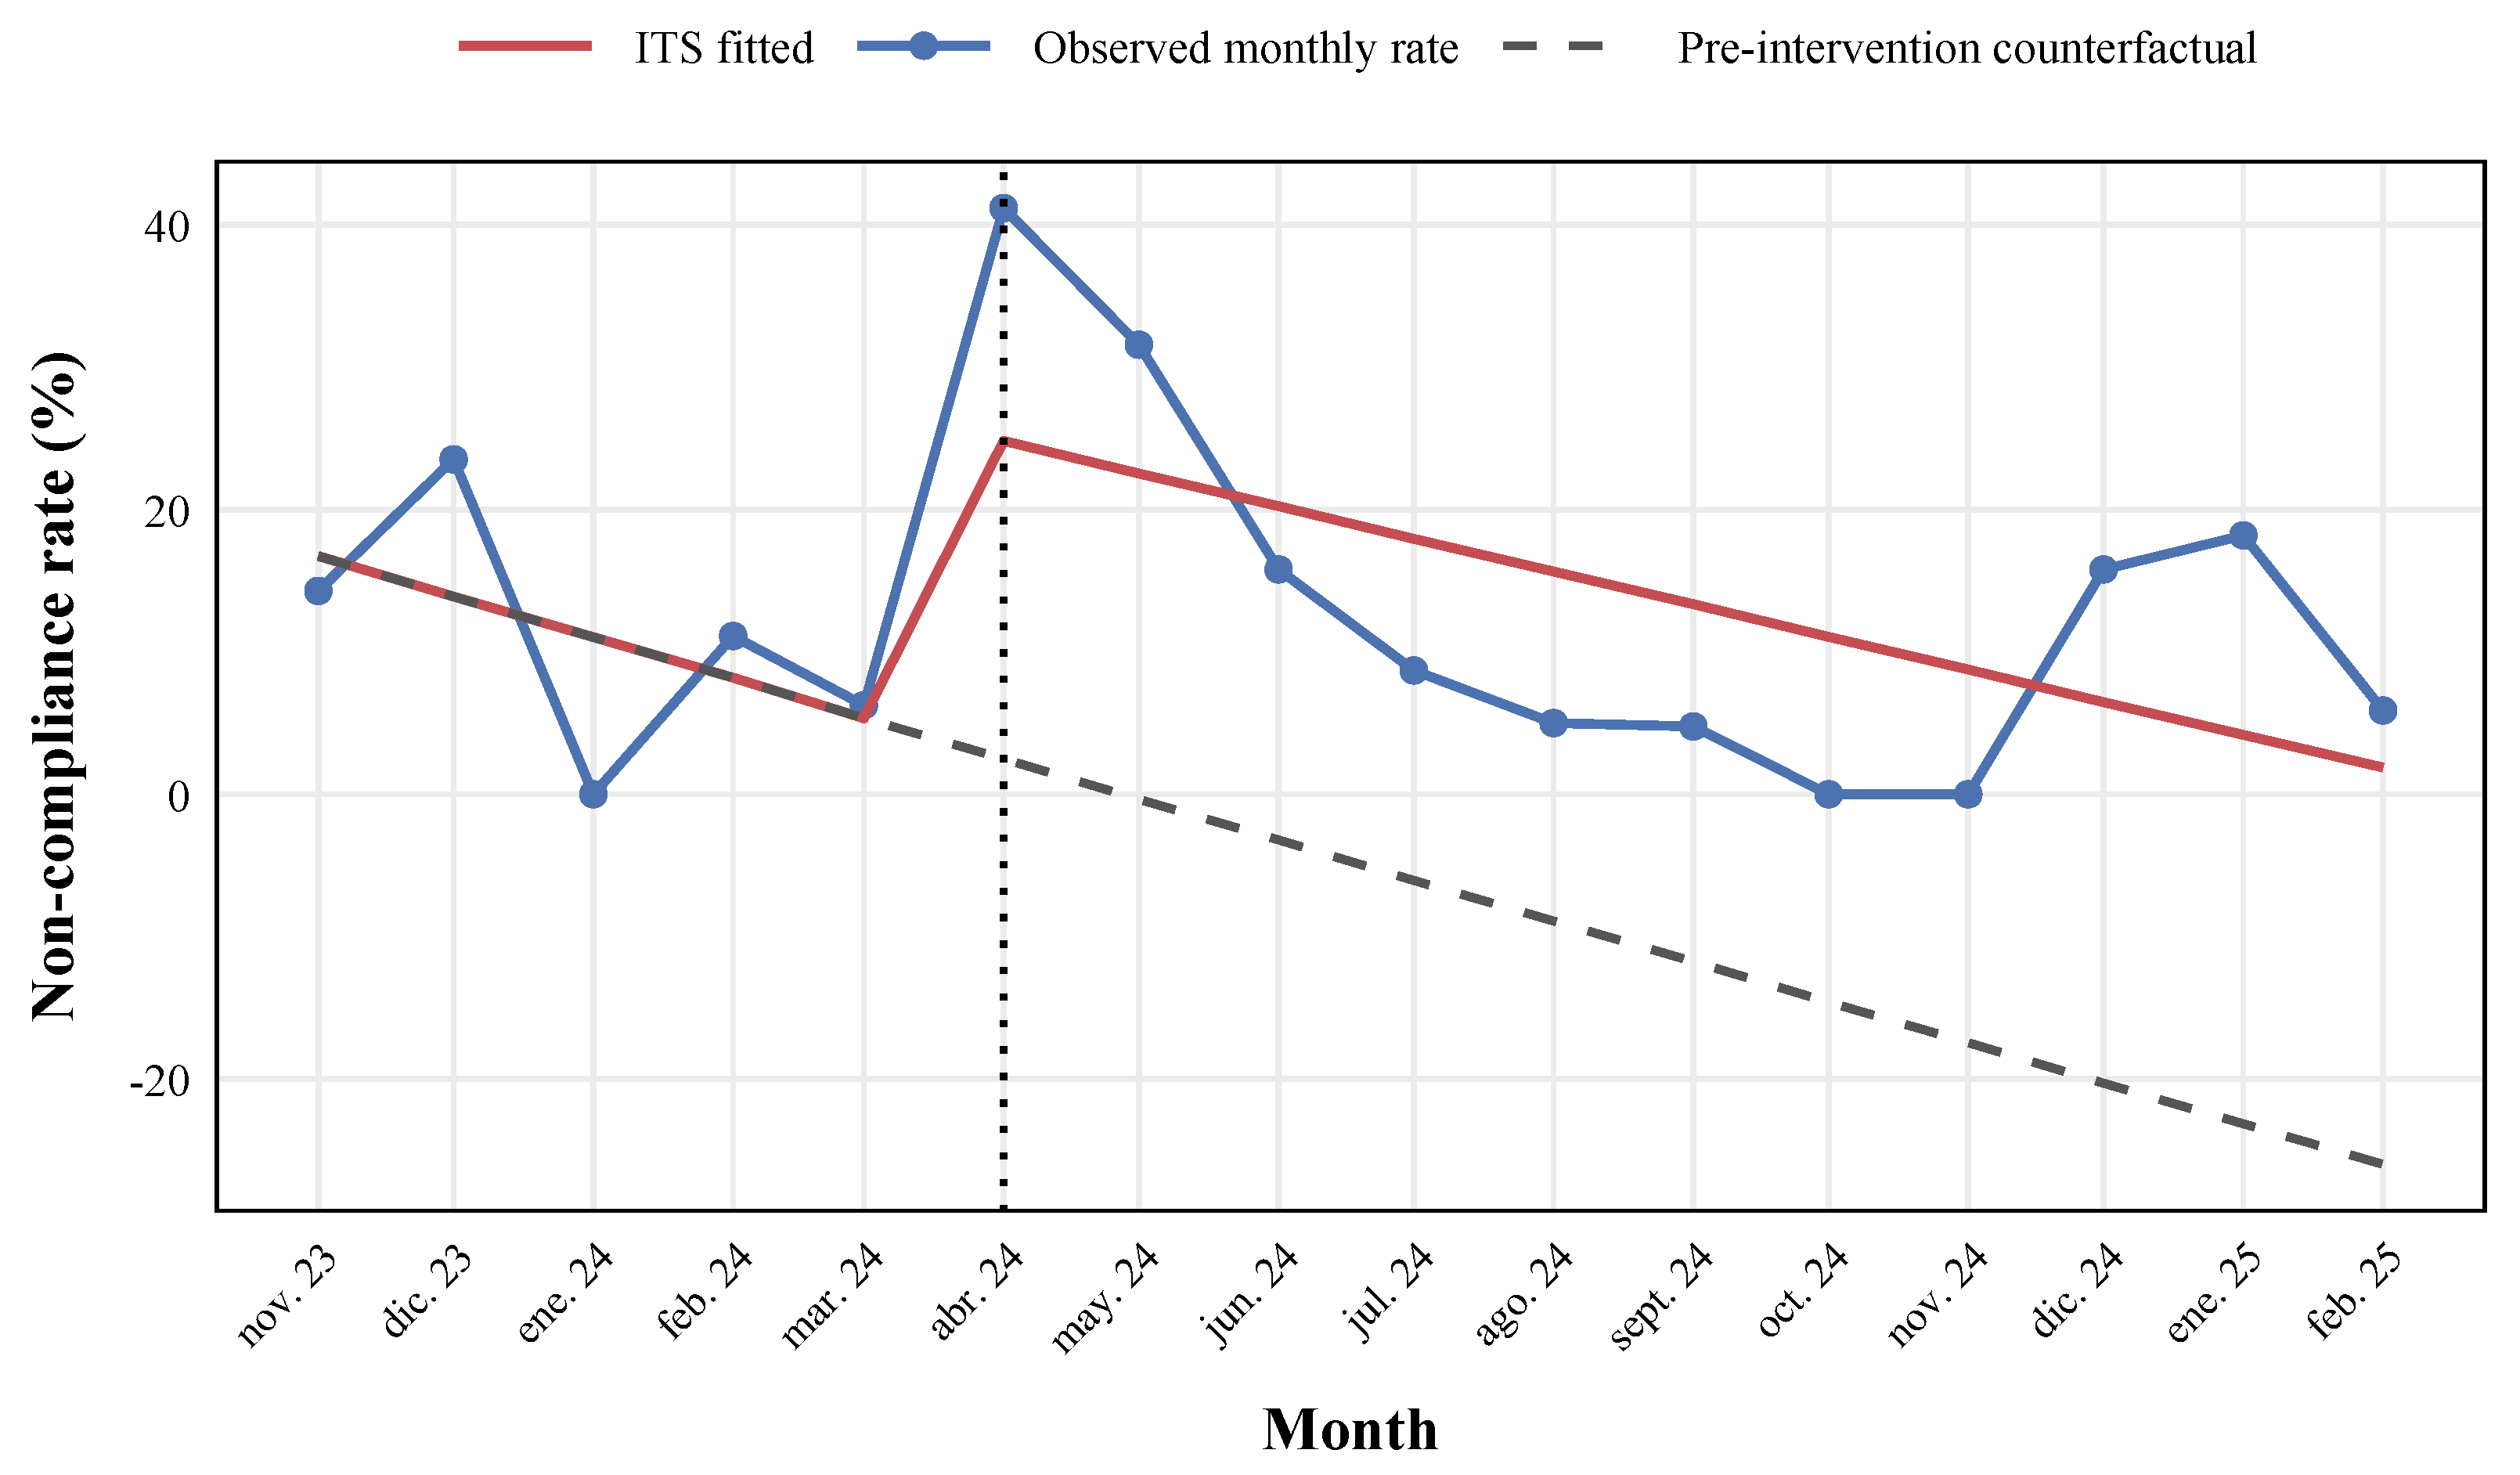
A segmented longitudinal model was used to describe the structural break visible in the monthly series. Figure 4 shows the observed monthly non-compliance rate, the fitted segmented line, and the counterfactual extension of the pre-April 2024 trend. The model estimated an immediate level increase of 21.8 percentage points at the start of the post-change period (), while the post-change slope term was close to zero (). The pre-change slope was negative but not statistically significant ().
Figure 4.
Segmented longitudinal model of monthly TMP non-compliance. Note: Segmented longitudinal model of monthly TMP non-compliance. Blue points and the solid blue line show the observed monthly rates, the red line shows the fitted segmented model, the gray dashed line shows the extrapolated pre-change trend, and the vertical dotted line marks April 2024. Given the short monthly series, the figure is intended as a structural description of the disruption and recovery pattern rather than as a strong causal time-series result.
Substantively, the monthly pattern is more consistent with an abrupt disruption than with a sustained change in trend. Once the April–May 2024 disturbance was absorbed, non-compliance moved back toward lower levels. Given the limited number of monthly observations, this model should be interpreted as a structural description of the series rather than as a full time-series estimate.
4.6. Monthly Count Models
Table 4 reports the monthly count models. In the Poisson model for monthly non-compliant workdays, the staff-change month indicator had an IRR of 4.36 (95% CI: 1.48–14.15; ), meaning that the expected monthly count of non-compliant workdays was more than four times higher during April–May 2024 after accounting for exposure and the other predictors. Theft units also showed a borderline positive association with monthly non-compliance (IRR = 1.03 per additional unit; ). The Pearson dispersion statistic indicated no problematic overdispersion for this model.
Table 4.
Monthly count models.
For monthly theft records, the corresponding Poisson model was overdispersed, so a negative binomial specification was used. In that model, each additional non-compliant workday in a month was associated with a 79% higher expected theft-record count (IRR = 1.79; 95% CI: 1.20–2.79; ). The night-shift share coefficient was also positive and statistically significant (IRR = 19.64; 95% CI: 0.76–577.32; ), although the confidence interval was very wide, so the estimate should be interpreted with caution. Taken together, the two count models suggest that non-compliance and theft exposure were part of the same broader risk environment.
As a limited robustness assessment, and given that the archived dataset does not preserve a separate borderline category for formal recoding, the two main substantive findings remained directionally stable across independent specifications. The staff-change indicator remained positive in the daily logistic and monthly count models, while shift type remained weak in both the proportion comparison and the multivariable analysis. This cross-specification consistency is the strongest defensible robustness check available from the retained records.
Regarding safety outcomes, only seven traffic incidents were recorded during supervised workdays, and all involved material damage only. Five occurred on workdays classified as TMP compliant, whereas two occurred on workdays with documented TMP non-compliance. The association between daily non-compliance and daily incident occurrence was positive but unstable (Fisher exact odds ratio = 2.81; ). This result should be interpreted cautiously. The low number of incidents limits inferential power, and the incident field captures reported or observed events rather than the full universe of traffic conflicts. The result is still informative because it shows that TMP compliance is only one layer of safety performance; driver behavior, speed, and background traffic conditions remain important residual-risk sources even on compliant days.
4.7. Response-Time Performance of Formal Tickets
The ticket register reveals a second governance issue: slow closure performance. Of the 99 tickets, 68 had a valid closure date at the time of data extraction. Among those closed tickets, the mean response time was 69.9 days and the median was 40.0 days, while only 5.9% were closed within five days. Category-level performance is shown in Table 5. TMP tickets had a mean closure time of 65.1 days and an on-time closure rate of 7.4%. Technical tickets were slower on average (88.9 days), and environmental tickets showed the highest mean closure time (119.0 days). Administrative tickets remained unresolved.
Table 5.
Response-time statistics for formal non-conformity tickets.
These figures matter because they show that documentary traceability does not necessarily translate into rapid correction. A project may improve in the field while still relying on a slow formal closure process. This distinction becomes important in the discussion because it separates the detection of risk from the speed of formal resolution.
4.8. Typology of TMP Deficiencies and Composite Risk Index
Table 6 presents the coded typology of TMP deficiencies. Transition-zone and channelization deficiencies accounted for 43.8% of all coded instances, making them the dominant category in both phases of the study. General implementation deviations represented 25.0%, while vertical-sign problems accounted for 17.2%. Night-lighting deficiencies disappeared entirely in the second phase, which is consistent with the qualitative impression that this category responded relatively well to repeated supervisory feedback.
Table 6.
Typology of coded TMP deficiencies.
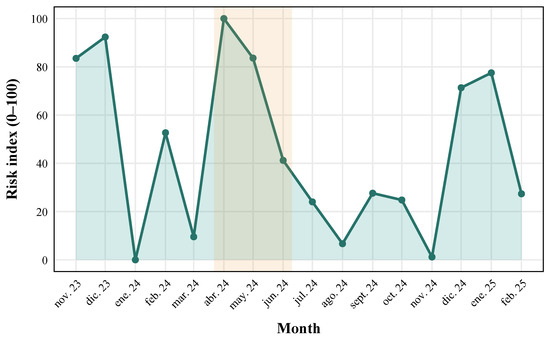
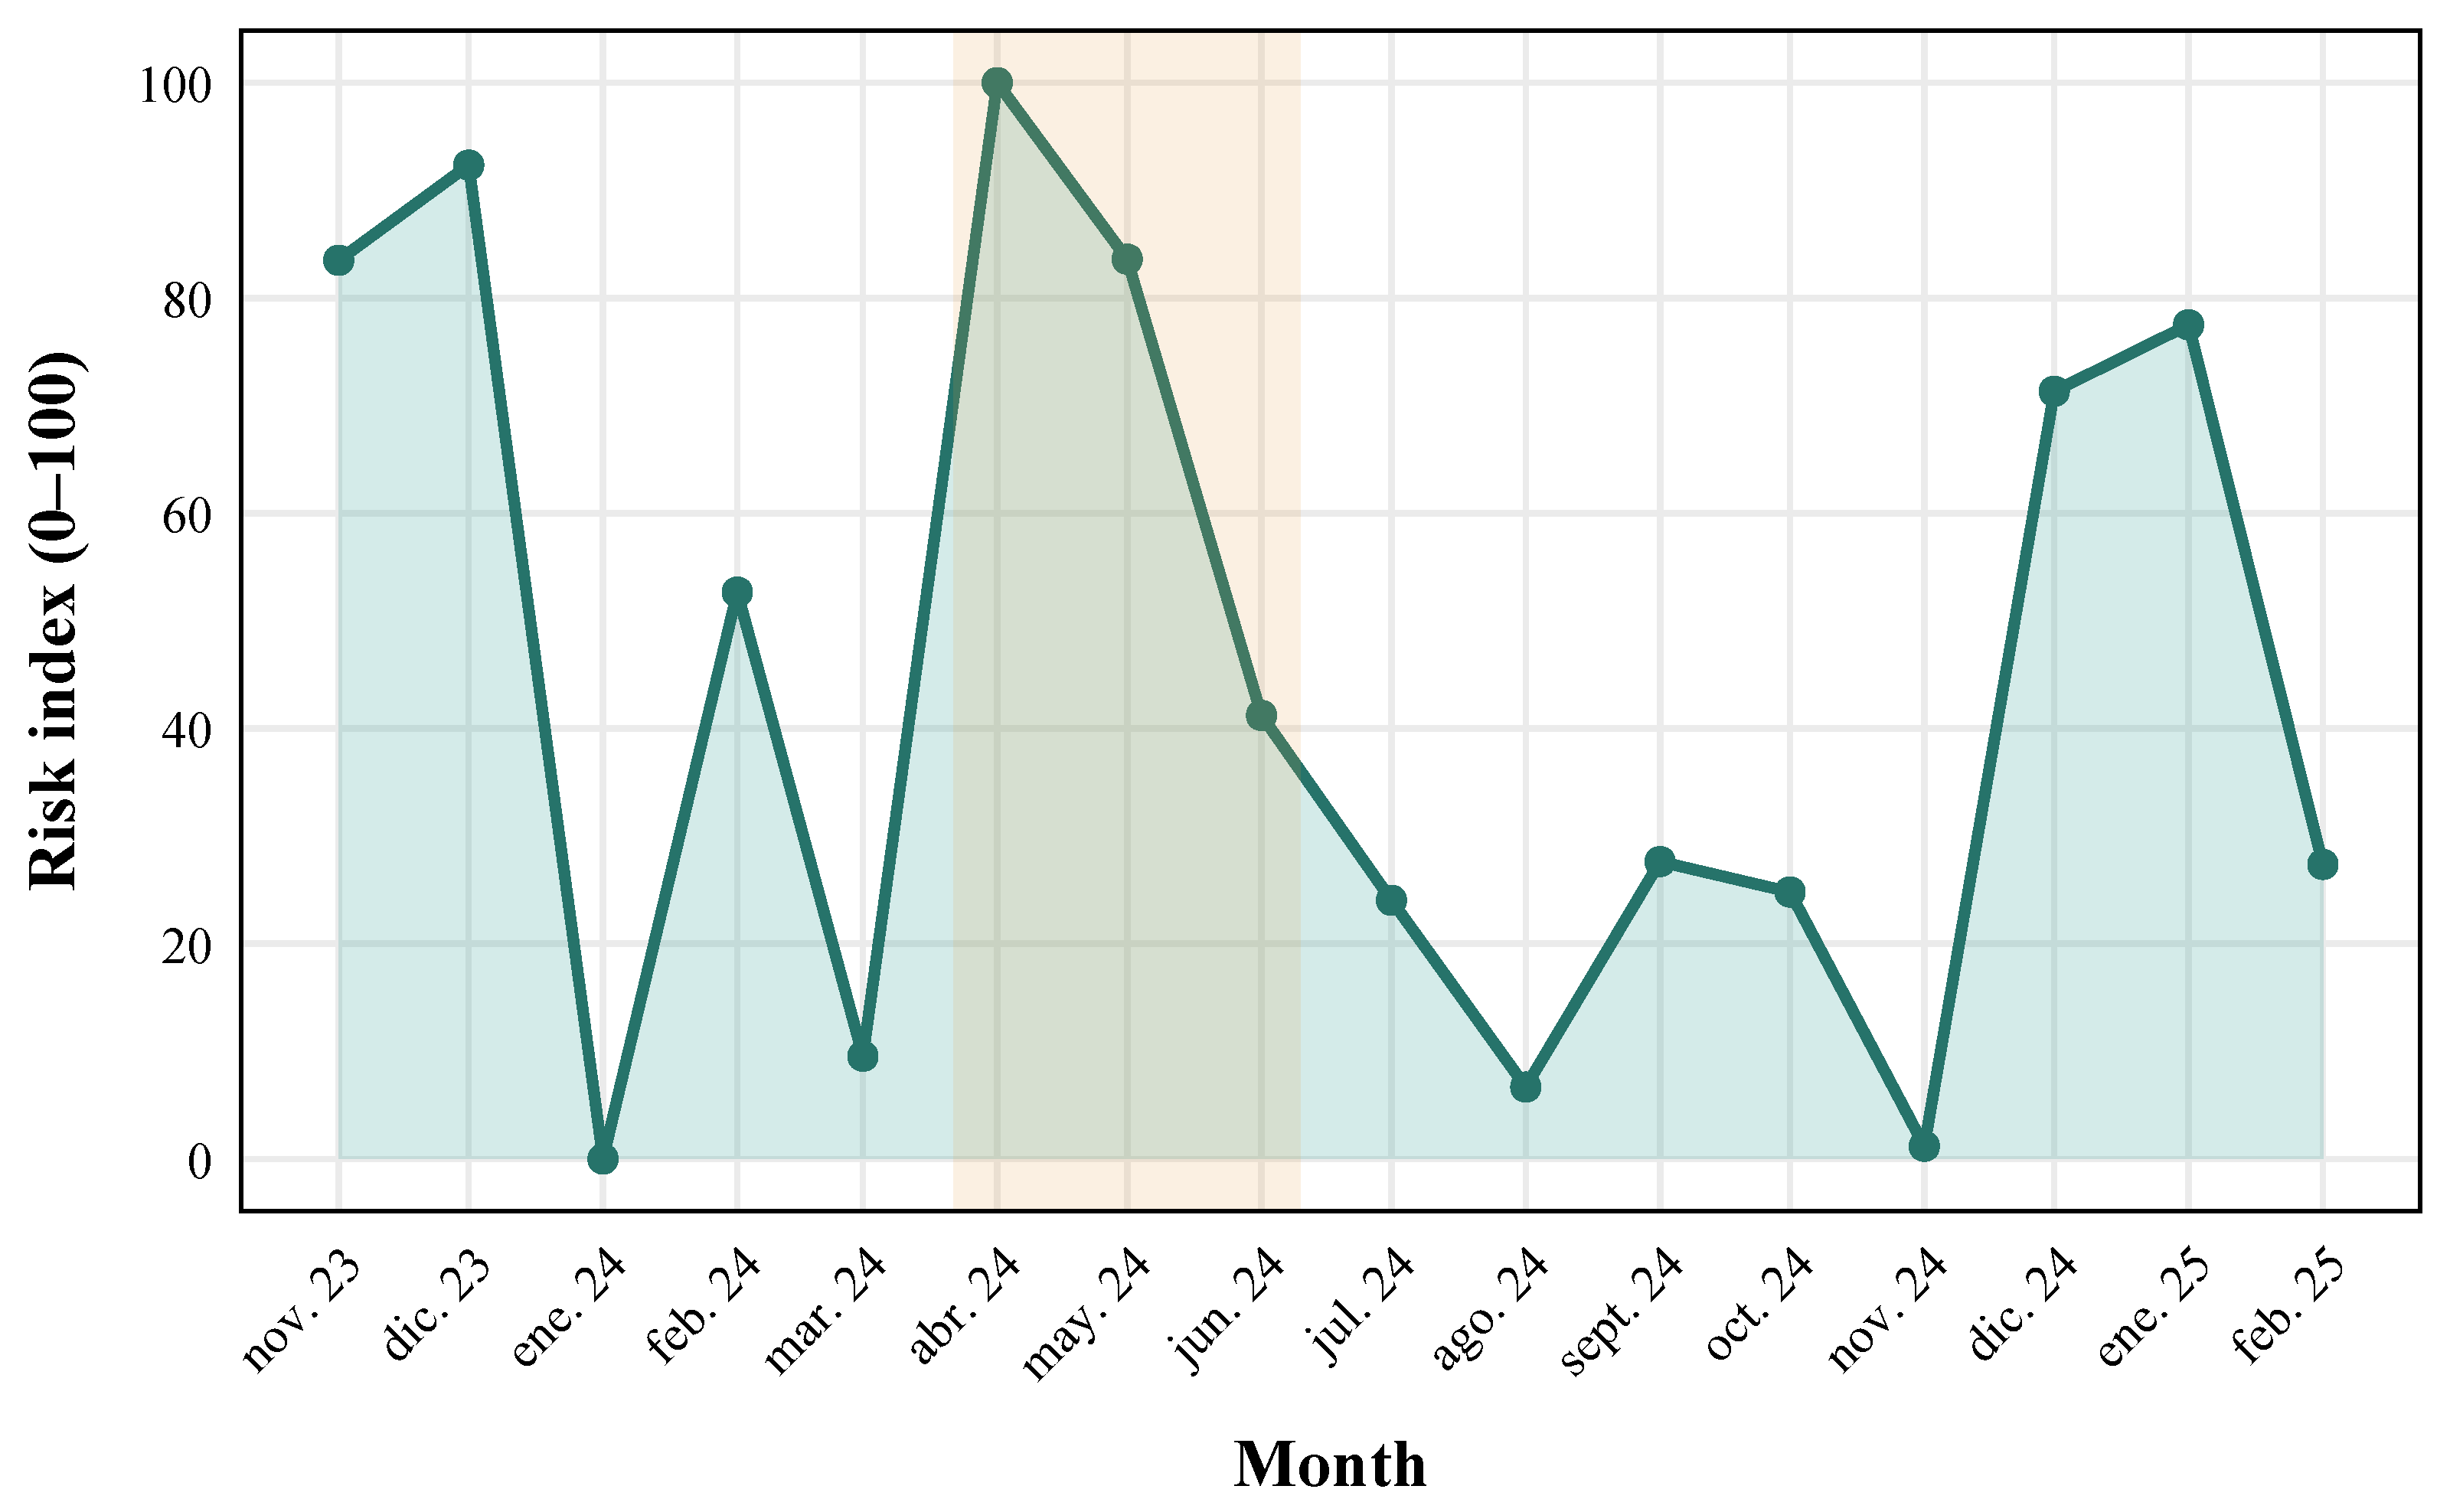
Figure 5 shows the exploratory monthly composite risk index. Because the index combines TMP non-compliance, theft units, and TMP-related ticket counts, it identifies months in which several supervisory indicators deteriorated at the same time. The highest value occurred in April 2024, followed by December 2023, May 2024, November 2023, and January 2025. This pattern distinguishes months dominated by acute TMP deterioration from months characterized by elevated theft or ticketing pressure even when non-compliance alone was not at its maximum.
Figure 5.
Composite monthly risk index derived from equal-weight standardized TMP non-compliance, theft units, and TMP-related ticket counts, rescaled to a 0–100 range. Note: The shaded band marks the April–May 2024 staff-change period. Peaks indicate months in which several supervisory signals deteriorated simultaneously rather than months with only one isolated problem.
Table 7 shows that the monthly risk signal remained stable under plausible alternative weighting schemes. Correlations with the equal-weight specification were high across all scenarios (Pearson –; Spearman –), and the top five high-risk months overlapped completely in the compliance-heavy and theft-heavy scenarios and in four of five months in the tickets-heavy scenario. These months should not be interpreted as statistically significant periods, but as the highest-ranked months in the monitoring index under each weighting scenario. Overall, the results indicate that the index is reasonably robust to moderate changes in weighting and can be used as a stable monthly monitoring signal.
Table 7.
Sensitivity of the composite monthly risk index to alternative weighting scenarios.
The index is not intended to replace detailed supervision or formal risk assessment. Its value lies in providing a compact monthly signal that can help prioritize management attention and flag periods when supervisory, contractual, and environmental stressors converged. The weighting sensitivity results support the use of the equal-weight specification as a transparent baseline for monitoring, while detailed monthly rankings under alternative scenarios are reported in Appendix A Table A1.
5. Discussion
The results point to a consistent pattern: in urban utility work zones, safety performance depends not only on the design of the traffic-management plan but also on how consistently it is implemented, maintained, and supervised in the field. The reduction in non-compliance from 18.8% to 6.9% suggests that the supervisory system improved over time. At the same time, the monthly pattern shows that this improvement was not gradual. Instead, it followed a sequence of early adjustment, short disruption, and later recovery, highlighting dynamics that are not captured by static compliance assessments.
5.1. Operational and Human Drivers of TMP Compliance
A first implication concerns the role of supervision. Much of the work-zone literature evaluates safety through crash outcomes, severity models, or device-level interventions [2]. While these approaches are essential, they often treat supervision as background activity. The results here suggest that supervision itself functions as a risk-control mechanism because it translates an approved TMP into a continuously verified system in the field [30,31].
The decline in non-compliance, together with the disappearance of night-lighting deficiencies in the second phase, indicates that repeated verification and feedback can improve execution. However, improvement was not uniform across deficiency types. Transition-zone and channelization problems remained the most frequent issues, even as overall performance improved [33]. This persistence suggests that some elements of TMP implementation are more sensitive to field conditions and time pressure. In practice, these recurring issues should be treated as training and deployment challenges rather than isolated errors. The traceability structure used in this project helped make these patterns visible and actionable.
Beyond the supervisory framework itself, the continuity of the technical team appears to be a decisive factor. The most robust statistical result is the effect of the April–May 2024 staff-change period. The logistic model shows that the odds of non-compliance were 3.50 times higher during that interval, and the monthly count model confirms a similar increase in expected non-compliance. This pattern is consistent with construction-safety research linking staff turnover to temporary declines in performance [25].
In this case, the effect is tied to a specific operational role: the contractor’s mobility specialist. This suggests that continuity in that role is critical for maintaining TMP implementation quality. From a governance perspective, this implies that staffing changes should not be treated as routine [34], as the impact of these transitions is often exacerbated by the inherent complexity of managing safety performance under operational stress [35]. Consequently, measures such as overlap periods, structured handovers, and temporary reinforcement of supervision are essential to mitigate the risks associated with such transitions [36].
This human-driven performance also helps contextualize our findings regarding shift timing. The results do not support the common assumption that night work is inherently more prone to non-compliance. Overall rates were nearly identical between night and day shifts. Prior studies have associated night work with higher risk due to visibility constraints [15], but the present findings suggest that operational context matters more than lighting alone.
A more plausible explanation is related to experience. Early in the project, crews accumulated more experience in night operations, while daytime work expanded later under more complex traffic conditions. The temporary increase in daytime non-compliance during the staff-change period reinforces this interpretation. Shift type, therefore, appears to be an incomplete proxy for risk. Supervisory attention should be adjusted based on crew experience and operational maturity rather than on day–night assumptions alone.
5.2. System Integrity: External Disruptions and Corrective Delays
The results point to a broader issue affecting work-zone performance: the gradual degradation of the traffic control system through both external disruptions and internal delays. Signal theft emerged as a relevant contextual factor. The dataset includes 96 theft events and 137 stolen units, and the count models show that theft intensity and non-compliance tended to increase together at the monthly level. This suggests that both processes are part of the same control environment rather than independent events. From a conceptual standpoint, theft can be understood as an external source of exposure that weakens the integrity of the traffic control system independently of contractor behavior [37]. In practical terms, supervision must extend beyond verifying correct installation to ensuring that control devices remain present and functional over time [4,5].
At the same time, the response-time results reveal an internal limitation of the control system. Although supervision improved the detection and documentation of non-conformities, it did not lead to rapid resolution. The average closure time exceeded two months, and only a small fraction of tickets were resolved within the contractual five-day window. This indicates that detection, documentation, and resolution operate as distinct stages, each with different performance constraints. A system may become more effective at identifying problems while still remaining slow in correcting them.
From a risk-management perspective, both mechanisms represent forms of sustained exposure. External disruptions such as theft reduce the effectiveness of installed controls, while delayed resolution prolongs the period during which known deficiencies remain uncorrected [38]. Together, these dynamics highlight that maintaining work-zone safety requires not only accurate implementation but also continuous system integrity and timely corrective action. In this context, tools such as the composite risk index can help identify periods when multiple control signals deteriorate simultaneously, providing a practical basis for prioritizing supervisory and managerial attention [39].
5.3. Scope, Transferability, and Safety Implications
The incident analysis calls for a cautious interpretation of TMP compliance as a safety indicator. Most incidents occurred on workdays classified as compliant, and the statistical association between non-compliance and incidents was weak. Given the small number of events, strong inference is not possible. However, this pattern aligns with a broader understanding of work-zone safety: compliance with temporary traffic control reduces one layer of controllable risk, but it does not eliminate residual exposure related to driver behavior, speed, and surrounding traffic conditions. The results therefore do not suggest that supervision alone prevents incidents, but rather that it improves the quality of implementation within the limits of project control.
The supervisory approach evaluated in this study is potentially transferable to other urban infrastructure contexts because it relies on elements that are feasible in many projects: structured daily records, explicit links between risks and controls, and systematic documentation of field conditions [40]. It does not require advanced sensing technologies to generate useful operational insight. At the same time, transferability does not imply identical effects. In corridors with lower theft exposure, stronger contractor management, or real-time digital monitoring, the relative importance of each component of the framework may differ. The value of the present case lies less in claiming a fixed effect size than in showing how supervision can be organized and analyzed as part of a broader risk-control system.
Several limitations should be acknowledged. The analysis is based on a single project, the number of recorded incidents is small, the monthly series is short, and the deficiency typology was manually coded from field observations. In addition, the archived daily dataset did not retain a separate borderline category for TMP coding, which prevented a formal ex post reclassification sensitivity test without introducing new subjective judgments. These factors limit causal inference and broad generalization. Nevertheless, the study provides detailed longitudinal evidence from a setting that remains underrepresented in the literature and shows how supervision, staffing continuity, theft exposure, and corrective-action timing interacted in real-world work-zone operations.
6. Conclusions
This study examined how a risk-based supervisory approach influenced the implementation of temporary traffic management in an urban utility corridor. Using longitudinal operational data from 288 supervised workdays, the analysis showed that TMP non-compliance declined substantially over time, although the improvement followed a non-linear pattern marked by disruption and recovery. The results indicate that day-to-day supervision plays a central role in maintaining the effectiveness of traffic control measures and in narrowing the compliance gap between approved plans and field implementation.
Across the models, the most consistent finding was the effect of staffing continuity. The period associated with a change in the contractor’s mobility specialist showed a clear increase in non-compliance, highlighting the importance of role stability and accumulated corridor-specific experience. By contrast, no systematic difference was observed between day and night shifts, suggesting that operational maturity and crew experience may be more relevant than shift timing alone. The study also showed that work-zone performance depends on the integrity of the control system over time. External disruptions, such as signal theft, and internal factors, such as delayed resolution of non-conformities, both contributed to periods of higher risk. The composite risk index was useful as a monitoring device because it brought these signals together in a compact monthly measure.
The results should be interpreted in light of the study design. This was a single-project observational case with a short monthly series and a small number of recorded incidents. Even so, the paper provides detailed longitudinal evidence from a context that is rarely represented in the international literature and offers a practical way to integrate supervision into risk-management practice. Future research could extend the framework to multiple projects and institutional settings and examine whether digital reporting tools can shorten the correction loop after non-conformities are detected. In practice, the findings suggest that strengthening supervision, protecting staffing continuity, and improving response mechanisms are key steps toward more reliable and safer work-zone operations.
Author Contributions
Conceptualization, J.S.C. and C.D.C.Á.; methodology, M.L.A.U.; formal analysis, J.S.C. and C.D.C.Á.; data curation, J.S.C.; writing—original draft preparation, J.S.C. and M.L.A.U.; writing—review and editing, C.D.C.Á.; visualization, M.L.A.U.; supervision, J.S.C. and C.D.C.Á. All authors have read and agreed to the published version of the manuscript.
Funding
This research received no external funding. The APC was not funded by any organization.
Institutional Review Board Statement
Not applicable.
Informed Consent Statement
Not applicable.
Data Availability Statement
The data and code used in this study are publicly available in Mendeley Data at https://doi.org/10.17632/tb2mhjssjj.1 [41]. The repository contains the full dataset, including daily supervision records, non-conformity tickets, and signal-theft logs, as well as the R script required to reproduce all analyses, tables, and figures presented in the manuscript.
Acknowledgments
The authors acknowledge Empresas Públicas de Medellín (EPM) for providing access to the operational data used in this study. The analyses and interpretations presented in this article are the sole responsibility of the authors and do not necessarily reflect the views of EPM. During the preparation of this manuscript, the authors used ChatGPT (5.2 version) for limited stylistic editing and language refinement. No generative AI tools were used for study design, data collection, data analysis, or interpretation of results. The authors have carefully reviewed and edited all AI-assisted outputs and take full responsibility for the content and conclusions of this publication.
Conflicts of Interest
The authors declare no conflicts of interest.
Appendix A. Sensitivity of the Composite Risk Index to Alternative Weighting Scenarios
This appendix provides supplementary detail on the sensitivity of the composite monthly risk index to alternative weighting schemes. The main text reports the equal-weight specification as the baseline monitoring measure for transparency and ease of interpretation. Table A1 complements that presentation by listing the five highest-ranked months under the equal-weight, compliance-heavy, theft-heavy, and tickets-heavy scenarios. The purpose is not to test statistical significance at the monthly level, but to demonstrate whether the identification of high-risk periods remains broadly stable across different weighting structures. For compactness, only the top five months are shown, allowing for a direct comparison of how each scenario prioritizes specific operational disruptions.
Table A1.
Top five months under alternative weighting scenarios for the composite risk index.
References
- Rathnasiri, N.; De Silva, N.; Wijesundara, J. State of the art in work zone safety: A systematic review. Int. J. Transp. Sci. Technol. 2024, 13, 14–28. [Google Scholar] [CrossRef] [Scilit]
- Nnaji, C.; Gambatese, J.; Lee, H.W.; Zhang, F. Improving construction work zone safety using technology: A systematic review of applicable technologies. J. Traffic Transp. Eng. 2020, 7, 61–75. [Google Scholar] [CrossRef] [Scilit]
- Wei, X.; Shu, X.; Huang, B.; Taylor, E.L.; Chen, H. Analyzing traffic crash severity in work zones under different light conditions. J. Adv. Transp. 2017, 2017, 5783696. [Google Scholar] [CrossRef] [Scilit]
- Al-Bayati, A.J.; Ali, M.; Nnaji, C. Managing work zone safety during road maintenance and construction activities: Challenges and opportunities. Pract. Period. Struct. Des. Constr. 2023, 28, 04022068. [Google Scholar] [CrossRef] [Scilit]
- Silveira, R.; Ferreira, S.; Cunha, L.; Rebelo, M. Driver behavior on road work zones: A systematic review. Transp. Res. Procedia 2023, 72, 1318–1325. [Google Scholar] [CrossRef] [Scilit]
- Raharjo, A.; Jannah, F.; Ariyanto, J.; Puspitaningtyas, L.D. The impact of organizational roles on hazard reporting and corrective action effectiveness in project management. Eur. Proj. Manag. J. 2025, 15, 76–89. [Google Scholar] [CrossRef] [Scilit]
- Uribe, M.L.A.; Corredor, J.S.; Correa-Álvarez, C.D. Social impacts and road safety in intermodality: Case study of the Ayacucho Tram in Medellín-Colombia. J. Urban Mobil. 2025, 8, 100154. [Google Scholar] [CrossRef] [Scilit]
- ISO 31000:2018; Risk Management—Guidelines. International Organization for Standardization: Geneva, Switzerland, 2018. Available online: https://www.iso.org/obp/ui#iso:std:iso:31000:ed-2:v1:es (accessed on 3 February 2026).
- Bai, Y.; Yang, Y.; Li, Y. Determining the effective location of a portable changeable message sign on reducing the risk of truck-related crashes in work zones. Accid. Anal. Prev. 2015, 83, 197–202. [Google Scholar] [CrossRef] [Scilit] [PubMed]
- Madarshahian, M.; Balaram, A.; Ahmed, F.; Huynh, N. Severity of Work Zone Truck-Involved Crashes in South Carolina for Interstates and Non-Interstates. Sustainability 2023, 15, 7188. [Google Scholar] [CrossRef] [Scilit]
- Sánchez-Corredor, J.; Arango-Uribe, M.L.; Correa-Alvarez, C.D. Quantifying the social burden and spatiotemporal concentration of fatal road traffic incidents in Medellín (2008–2025). Sustainability 2026, 18, 2628. [Google Scholar] [CrossRef] [Scilit]
- Banerjee, S.; Jeihani, M.; Khadem, N.K. Influence of work zone signage on driver speeding behavior. J. Mod. Transp. 2019, 27, 52–60. [Google Scholar] [CrossRef] [Scilit]
- Xu, W.; Zhao, X.; Chen, Y.; Bian, Y.; Li, H. Research on the relationship between dynamic message sign control strategies and driving safety in freeway work zones. J. Adv. Transp. 2018, 2018, 9593084. [Google Scholar] [CrossRef] [Scilit]
- Rahman, M.M.; Strawderman, L.; Garrison, T.; Eakin, D.; Williams, C. Work zone sign design for increased driver compliance and worker safety. Accid. Anal. Prev. 2017, 106, 67–75. [Google Scholar] [CrossRef] [Scilit]
- Zhang, K.; Hassan, M. Crash severity analysis of nighttime and daytime highway work zone crashes. PLoS ONE 2019, 14, e0221128. [Google Scholar] [CrossRef] [Scilit] [PubMed]
- Yu, M.; Ma, C.; Zheng, C.; Chen, Z.; Yang, T. Injury severity of truck-involved crashes in work zones on rural and urban highways: Accounting for unobserved heterogeneity. J. Transp. Saf. Secur. 2022, 14, 83–110. [Google Scholar] [CrossRef] [Scilit]
- Pahari, S.; Keshari, S.; Premo, S.; Cavka, M.; Overall, M.W.; Mahmud, M.S.; Racine, J.; Gates, T.J.; Savolainen, P.T. Evaluating driver response to a speed feedback trailer at median crossovers within freeway construction work zones. Transp. Res. Rec. J. Transp. Res. Board 2026, 2680, 921–933. [Google Scholar] [CrossRef] [Scilit]
- Mantouka, E.G.; Vakrinou, K.; Christidis, K.N.; Magoutas, B.; Kiousi, A.; Vlahogianni, E.I. Automated vehicle traffic: A review of operational challenges, infrastructure requirements and research directions. Sensors 2026, 26, 1232. [Google Scholar] [CrossRef] [Scilit]
- Zohir, H.M.; Ismael, I.M.; El-Gendy, E.M.; Saafan, M.M. Advancements in accident-aware traffic management: A comprehensive review of V2X-based route optimization. Sci. Rep. 2025, 15, 35041. [Google Scholar] [CrossRef] [Scilit]
- Larasati, M.; Nguyen, V.D. A digital information management framework for port facility maintenance: Integrating BIM, event-driven processing, and the COBie standard. Emerg. Front. Libr. Am. J. Eng. Technol. 2025, 7, 18–31. Available online: https://emergingsociety.org/index.php/efltajet/article/view/462 (accessed on 17 February 2026).
- IJEDR. A mobile and web-based civil inspection and management system using map-based visualization. Int. J. Eng. Dev. Res. 2026, 14, 442–452. [Google Scholar]
- Abdu Kunnah, H.; Hassan, H.M. An exploration of the effects of various street lighting conditions on driver behaviors and safety at stop-controlled intersections: A driving simulator experiment. J. Transp. Saf. Secur. 2024, 16, 611–632. [Google Scholar] [CrossRef] [Scilit]
- Sam-Mensah, R.; Bingab, B.B.B.; Boakye, K.O.; Boateng, R.K. Safety first, retention forever: Enhancing commitment and reducing turnover through safety practices. Future Bus. J. 2025, 11, 52. [Google Scholar] [CrossRef] [Scilit]
- Weeks, K.; Safa, M.; Zamiran, S. The productivity–safety nexus: The impact of human factors on operational efficiency in construction projects. Buildings 2026, 16, 87. [Google Scholar] [CrossRef] [Scilit]
- Abdolmaleki, G.; Naismith, N.; Ghodrati, N.; Poshdar, M.; Jelodar, M. An analysis of the literature on construction employee turnover: Drivers, consequences, and future direction. Constr. Manag. Econ. 2024, 42, 822–846. [Google Scholar] [CrossRef] [Scilit]
- Dyreborg, J.; Lipscomb, H.J.; Nielsen, K.; Törner, M.; Rasmussen, K.; Frydendall, K.B.; Bay, H.; Gensby, U.; Bengtsen, E.; Guldenmund, F.; et al. Safety interventions for the prevention of accidents at work: A systematic review. Campbell Syst. Rev. Better Evid. Better World 2022, 18, e1234. [Google Scholar] [CrossRef] [Scilit] [PubMed]
- Chang, C.M.; Hossain, A. A climate adaptation asset risk management approach for resilient roadway infrastructure. Infrastructures 2024, 9, 226. [Google Scholar] [CrossRef] [Scilit]
- Al Qudah, S.M.A.; Fuentes-Bargues, J.L.; Ferrer-Gisbert, P.S. Bibliometric analysis of the literature on risk management in the construction sector: Exploring current and future trends. Ain Shams Eng. J. 2024, 15, 102843. [Google Scholar] [CrossRef] [Scilit]
- Correa-Álvarez, C.D.; Sánchez-Corredor, J.; Arango-Uribe, M.L. Analysis of sustainable urban mobility in the Medellin-Colombia Ayacucho Tram-Road Corridor. Rev. EIA 2025, 22, 31. [Google Scholar] [CrossRef] [Scilit]
- Amoah, C.; Pretorius, L. Evaluation of the impact of risk management on project performance in small construction firms in South Africa: The case study of construction systems. J. Eng. Des. Technol. 2020, 18, 611–634. [Google Scholar] [CrossRef] [Scilit]
- Erfani, A.; Cui, Q.; Baecher, G.; Kwak, Y.H. Data-driven approach to risk identification for major transportation projects: A common risk breakdown structure. IEEE Trans. Eng. Manag. 2024, 71, 6830–6841. [Google Scholar] [CrossRef] [Scilit]
- R Core Team. R: A Language and Environment for Statistical Computing; R Foundation for Statistical Computing: Vienna, Austria, 2025; Available online: https://www.R-project.org/ (accessed on 21 March 2026).
- Sita, T.; Mulyono, A.T.; Utomo, S.H.T. Enhancing road service compliance: A robust penalty model for efficient maintenance management. Acta Logist. 2024, 11, 173–184. [Google Scholar] [CrossRef] [Scilit]
- Tseng, C.-C.; Yang, J.-B. The benefit evaluation framework of using performance-based contracting in urban road maintenance. J. Civ. Eng. Manag. 2024, 30, 133–148. [Google Scholar] [CrossRef] [Scilit]
- Li, X.; Li, C.; Yanfei, L.; Yu, S.; Guo, L.; Yang, F. Impacts of job stress on the safety management performance of construction safety managers. Int. J. Civ. Eng. 2025, 23, 1375–1392. [Google Scholar] [CrossRef] [Scilit]
- Yang, J.B.; Tseng, C.C.; Chang, J.R.; Liu, C.M. Key challenges and coping strategies for performance-based contracts in urban road maintenance. J. Chin. Inst. Eng. 2023, 46, 703–712. [Google Scholar] [CrossRef] [Scilit]
- Harrison, P.; Todes, A. Planning’s promises: Reflections on South African experiences in the African context. Plan. Perspect. 2025, 1–20. [Google Scholar] [CrossRef] [Scilit]
- Rahman, A. The role of cybersecurity in modern travel risk management: Challenges, opportunities, and policy implications. Am. J. Dev. Stud. 2025, 3, 57–65. [Google Scholar] [CrossRef] [Scilit]
- Rezvani, S.M.; Falcão, M.J.; Komljenovic, D.; de Almeida, N.M. A systematic literature review on urban resilience enabled with asset and disaster risk management approaches and GIS-based decision support tools. Appl. Sci. 2023, 13, 2223. [Google Scholar] [CrossRef] [Scilit]
- Okolo, F.C.; Etukudoh, E.A.; Ogunwole, O.; Osho, G.O.; Basiru, J.O. A conceptual model for enhancing regulatory compliance and risk controls in smart transportation networks. Deleted J. 2024, 4, 1740–1750. [Google Scholar] [CrossRef] [Scilit]
- Correa, C. Dataset and Code for Risk-Based Supervision of Work Zone Traffic Management in Medellín, Colombia. Mendeley Data 2026, V1. [Google Scholar] [CrossRef]

Disclaimer/Publisher’s Note: The statements, opinions and data contained in all publications are solely those of the individual author(s) and contributor(s) and not of MDPI and/or the editor(s). MDPI and/or the editor(s) disclaim responsibility for any injury to people or property resulting from any ideas, methods, instructions or products referred to in the content. |
© 2026 by the authors. Licensee MDPI, Basel, Switzerland. This article is an open access article distributed under the terms and conditions of the Creative Commons Attribution (CC BY) license.