


Abstract
The transition from diesel to electric trucks faces a critical adoption gap despite technological maturity and favorable economics. This study identifies multi-dimensional planning complexity, spanning technical, economic, operational, and organizational dimensions, as a primary barrier that existing decision support tools fail to address. Through systematic literature review and analysis of Danish transport sector data, we develop the AI-Readiness Framework for Fleet Electrification (ARFFE), a modular decision support system adapted to different organizational readiness levels. Our secondary data analysis illustrates that two frequently overlooked factors, the CO2-differentiated road tax savings of 430,000–465,000 DKK over five years and charging strategy decisions creating cost differences of 930,000 DKK, have greater economic impact than traditionally emphasized factors. The framework comprises five progressive modules mapped across four readiness stages and four planning dimensions, creating an integrated decision support system for evaluating an estimated 50,000+ scenarios. This research contributes theoretically by proposing AI as a “mediating technology” in socio-technical transitions and practically by providing an actionable framework illustrated through Danish transport sector analysis.
1. Introduction
1.1. The Electric Truck Transition Challenge
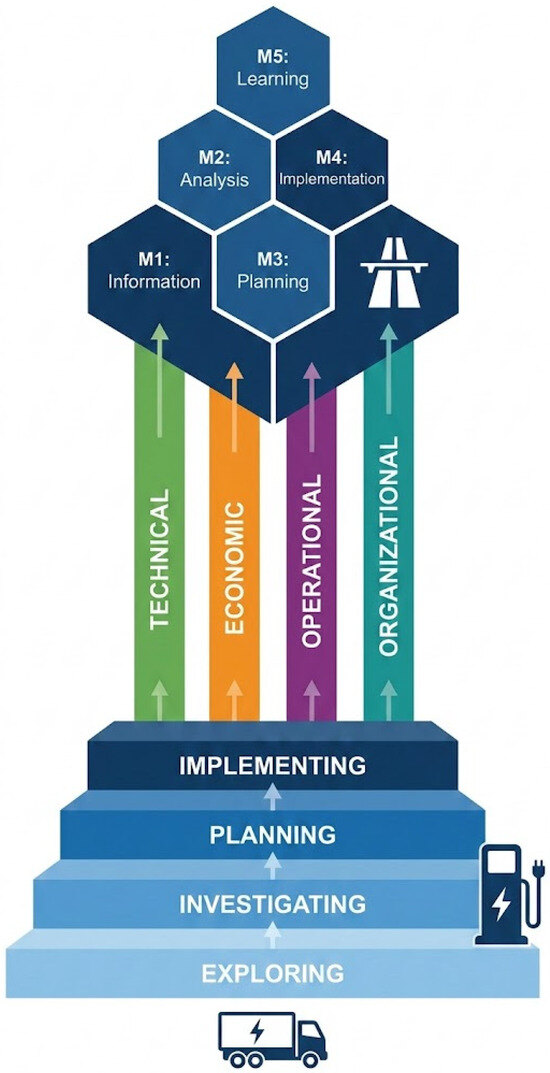
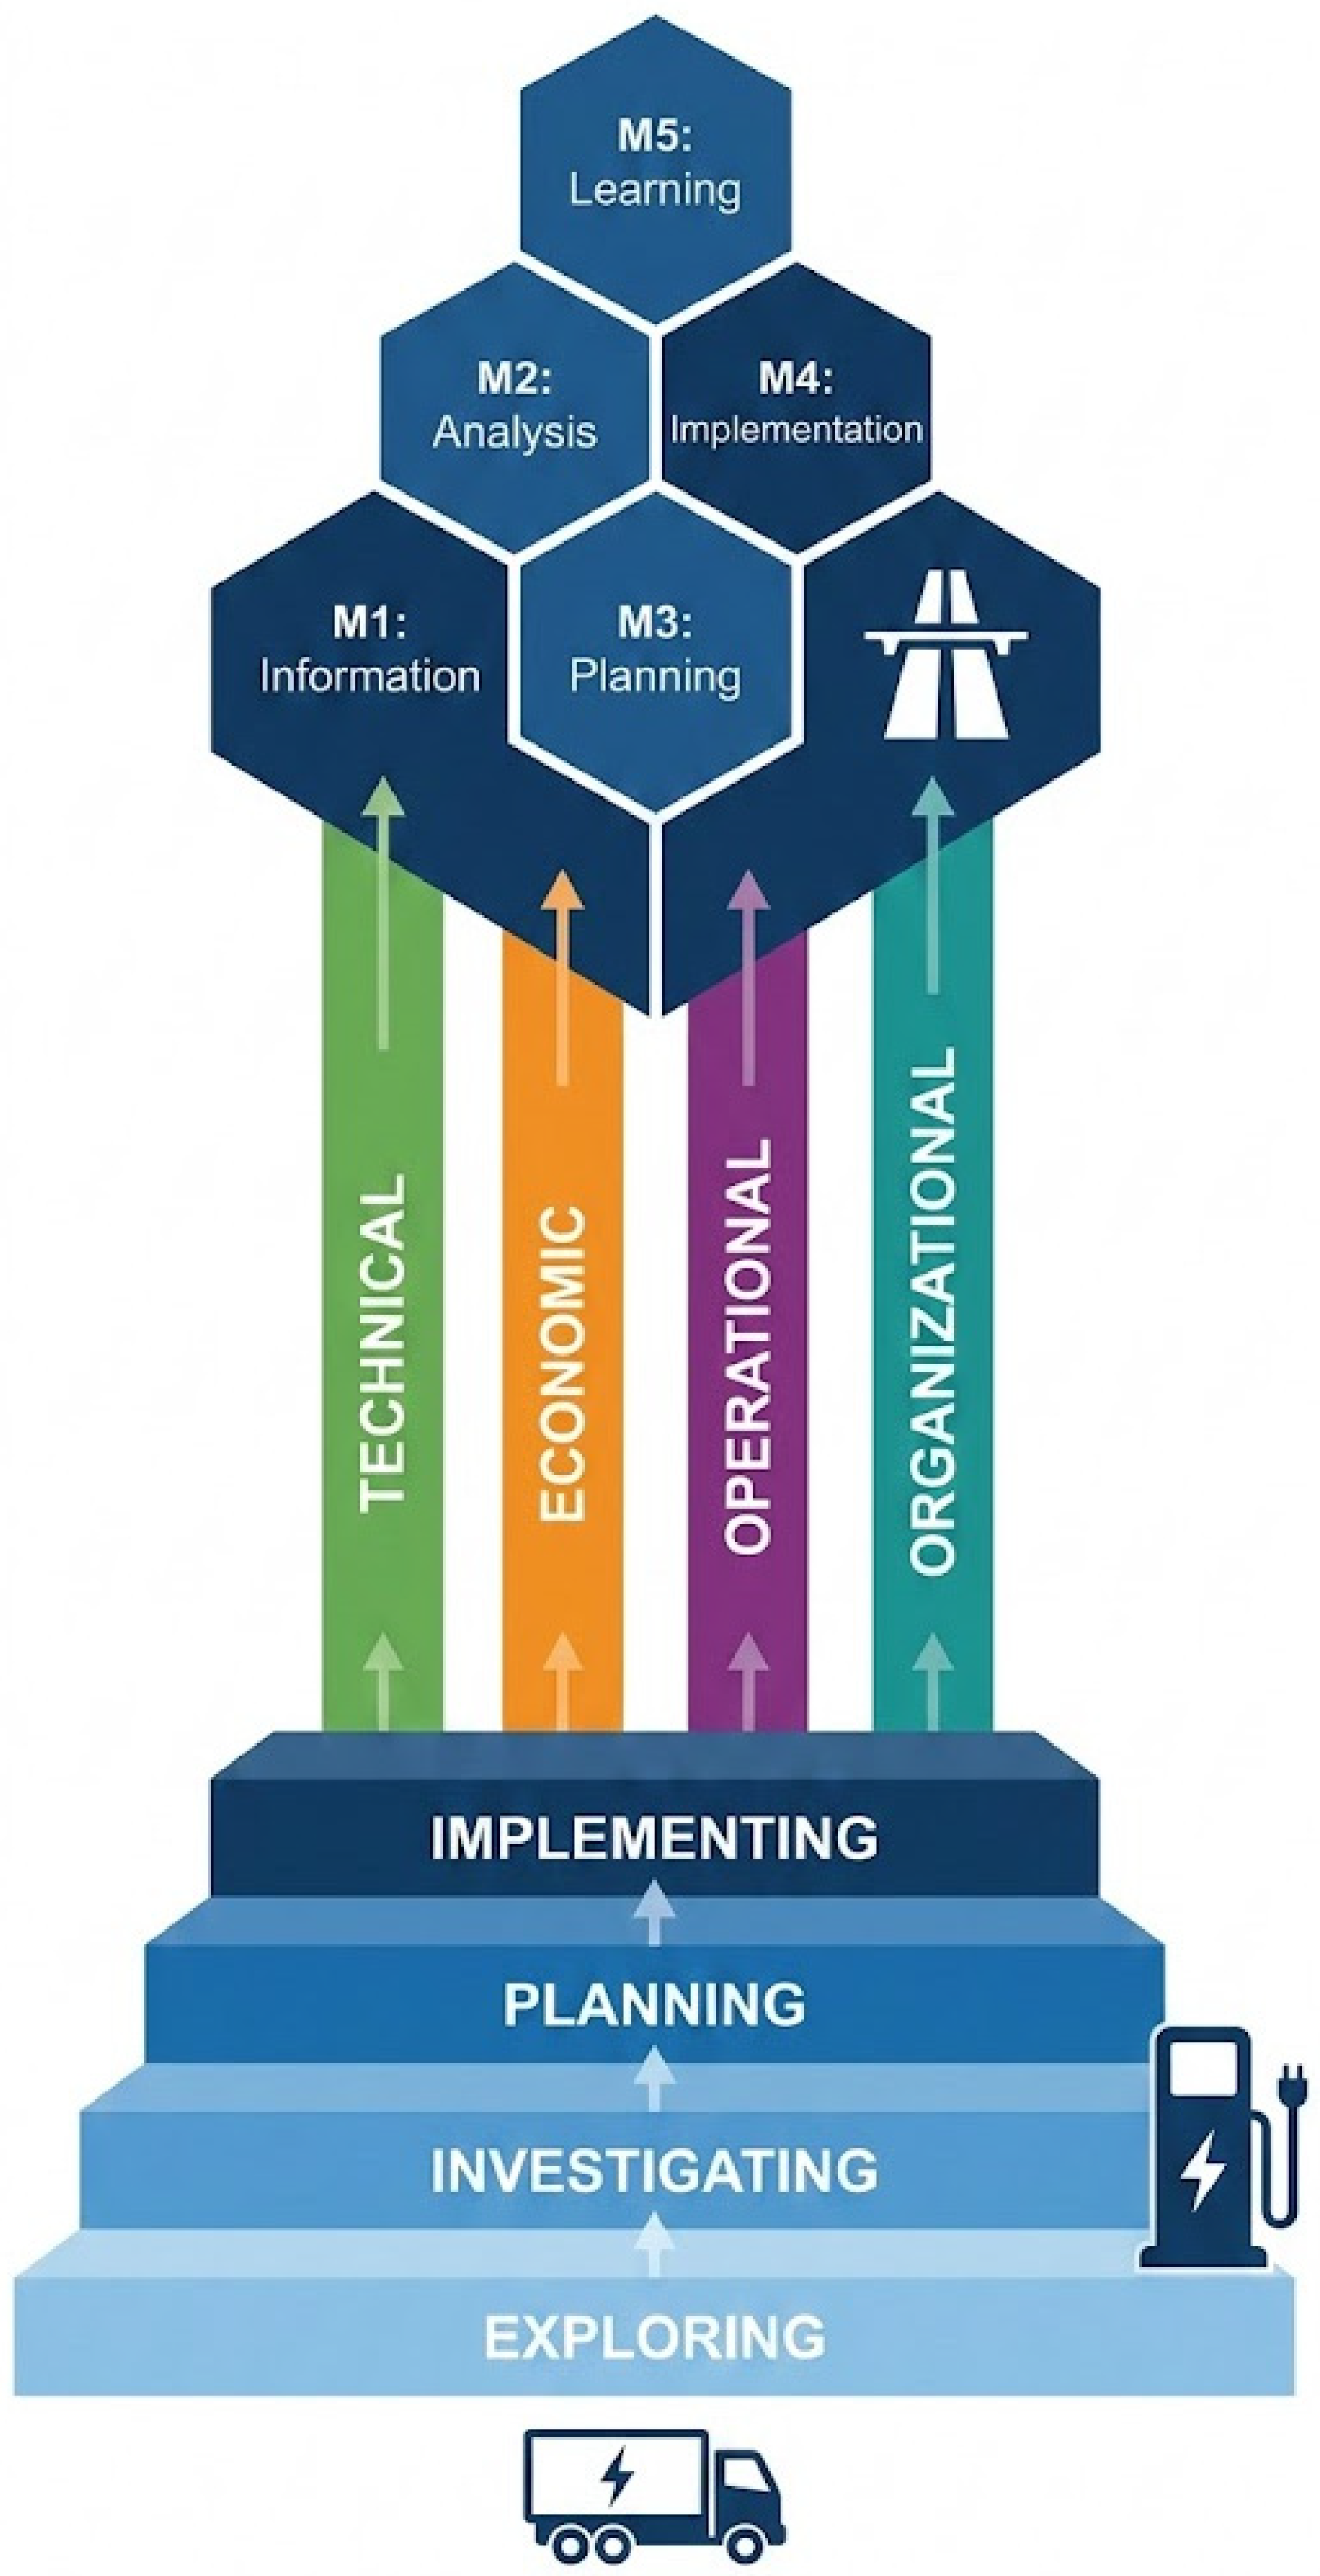
The electrification of heavy-duty road freight represents a critical pathway for climate change mitigation. In Denmark, electric trucks accounted for 9.3% of new registrations in 2024, yet adoption rates remain insufficient for 2030 climate targets [1]. This gap suggests barriers beyond technology and economics constrain the transition [Figure 1].
Figure 1.
An overview forAI-supported electric truck fleet transition.
Transport companies face a multi-dimensional planning problem encompassing technical constraints (400–500 km range, 75 min charging, 30% dynamic variability (under standard test conditions of 20 °C, nominal payload, and flat terrain; actual range may decrease by 20–30% in winter conditions)), economic complexity (acquisition costs 2–3× diesel equivalents, CO2-differentiated road taxes, uncertain residual values), operational requirements (route optimization with charging constraints, seasonal variations), and organizational adaptation (competence gaps, change resistance) [1,2,3,4,5].
The economic dimension proves particularly complex in Denmark [Appendix A]. The CO2-differentiated road tax system creates substantial cost differences: diesel trucks pay 1.00–1.65 DKK/km while electric trucks pay 0.13–0.20 DKK/km. For a typical 18-ton truck covering 80,000 km annually with 30% environmental zone driving, this generates annual savings of 79,200–106,000 DKK, totaling approximately 430,000–465,000 DKK (±15–20% depending on mileage and zone distribution) over five years [6]. Additionally, charging strategy decisions—private depot charging (0.75–1.07 DKK/kWh) versus public fast charging (3.00 DKK/kWh)—can create approximately 930,000 DKK (±20% depending on route profiles and charging patterns) cost differences over five years [7]. These factors, often overlooked in simplified analyses, determine economic viability.
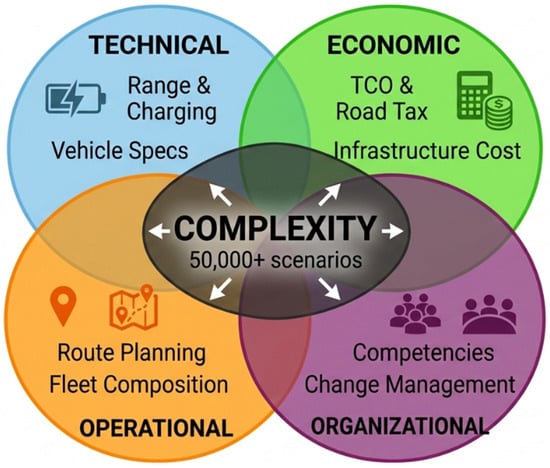
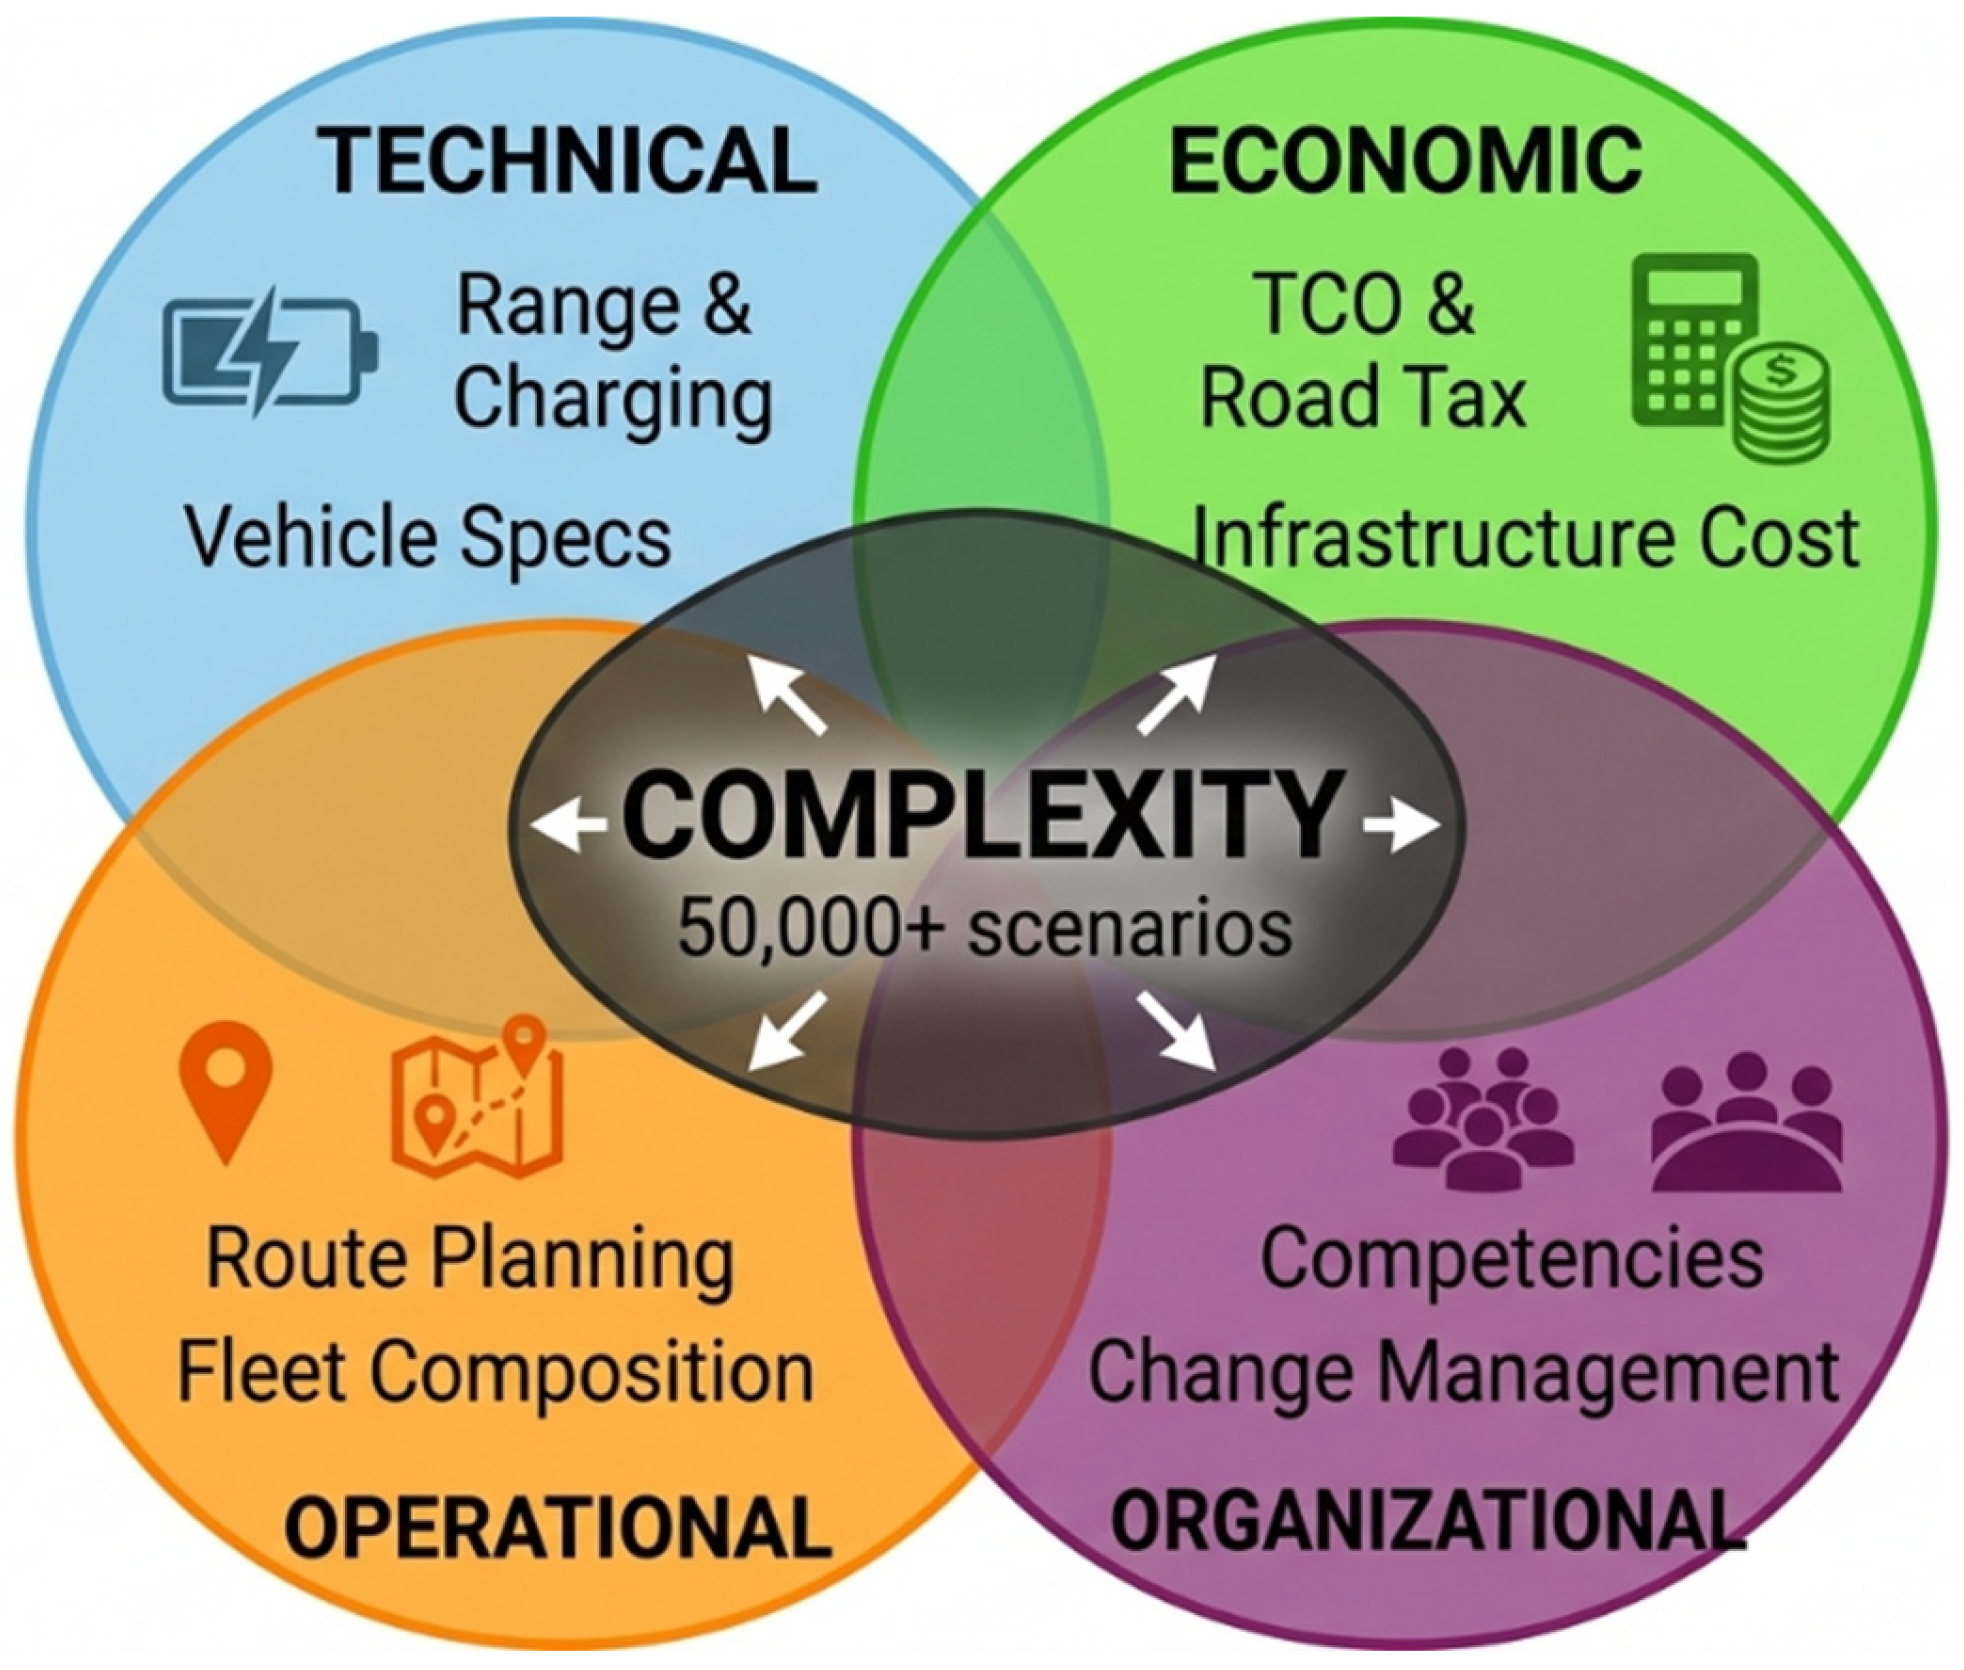
This multi-dimensional complexity [Figure 2], characterized by over 50,000 possible scenarios with non-linear interdependencies, exceeds human cognitive capacity for simultaneous optimization [8]. Traditional decision support tools address individual dimensions in isolation, creating decision paralysis, particularly for small and medium-sized enterprises [9].
Figure 2.
Multi-dimensional planning complexity in the electric truck fleet transition, showing the interplay between technical, economic, operational, and organizational dimensions.
1.2. AI as Complexity-Reducing Technology
Artificial intelligence offers unique capabilities for managing multi-dimensional complexity through data integration, pattern recognition, and optimization across interdependent variables [10,11]. However, existing AI applications focus primarily on operational optimization rather than strategic decision support for transformative change [12,13]. Moreover, current tools adopt a “one-size-fits-all” approach that fails to account for organizational readiness—defined as the capacity and willingness to adopt new technologies [14,15].
The ARFFE framework employs a spectrum of computational approaches that collectively contribute to its AI-augmented decision support: “Rule-based decision support” covers structured logic for well-defined decisions (Module 1 questionnaire routing); “Statistical analysis and simulation” covers Monte Carlo methods and probabilistic modeling for uncertainty quantification (Module 2); “Operations research optimization” covers facility location and vehicle routing algorithms (Module 3); “Machine learning” covers predictive models trained on operational data for real-time range prediction and anomaly detection (Module 4); and “Pattern recognition and knowledge extraction” covers unsupervised learning for best practice identification (Module 5). We use the term ‘AI-augmented’ to reflect that ARFFE combines these approaches, with true machine learning becoming increasingly central at higher readiness stages.
1.3. Research Gap and Objectives
Three critical gaps persist in existing literature. First, research treats electrification primarily as a technical-economic problem, underestimating organizational and cognitive dimensions [16,17]. Second, AI applications focus on operational optimization rather than strategic decision support for “wicked problems”—complex challenges with no clear optimal solutions [18,19]. Third, actionable frameworks bridging academic knowledge and practical implementation, particularly tools adapted to different organizational readiness levels, remain absent [20,21].
This article presents a conceptual framework with initial illustration rather than full empirical validation. The ARFFE framework is designed through systematic literature integration and secondary data analysis, with expert consultation informing iterative refinement. We deliberately distinguish between framework design (this study) and framework implementation and empirical testing (planned future research, Stage 6). This positioning is common in design science and framework development research.
This study addresses these gaps through the research question: How can AI-based systems effectively support the multi-dimensional planning challenge in the transition from diesel to electric trucks in the Danish transport sector? We examine: (1) critical complexity parameters across technical, economic, operational, and organizational dimensions; (2) adaptation of a modular AI framework to different readiness levels; and (3) specific AI functionalities necessary for each dimension and readiness stage.
1.4. Research Contributions
This research contributes: (1) theoretically, by proposing AI as a “mediating technology” in socio-technical transitions, suggesting an extension to Geels’ Multi-Level Perspective [22] with an explicit cognitive dimension; (2) methodologically, demonstrating systematic framework development through literature integration and operational data analysis; (3) practically, presenting ARFFE as a modular, actionable framework illustrated through Danish transport sector analysis; and (4) contextually, providing insights specific to the Danish environment applicable to broader European contexts.
2. Electrification of Heavy-Duty Transport
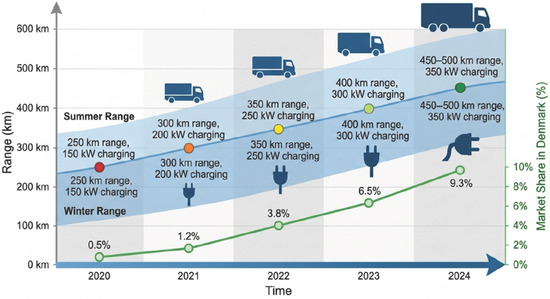
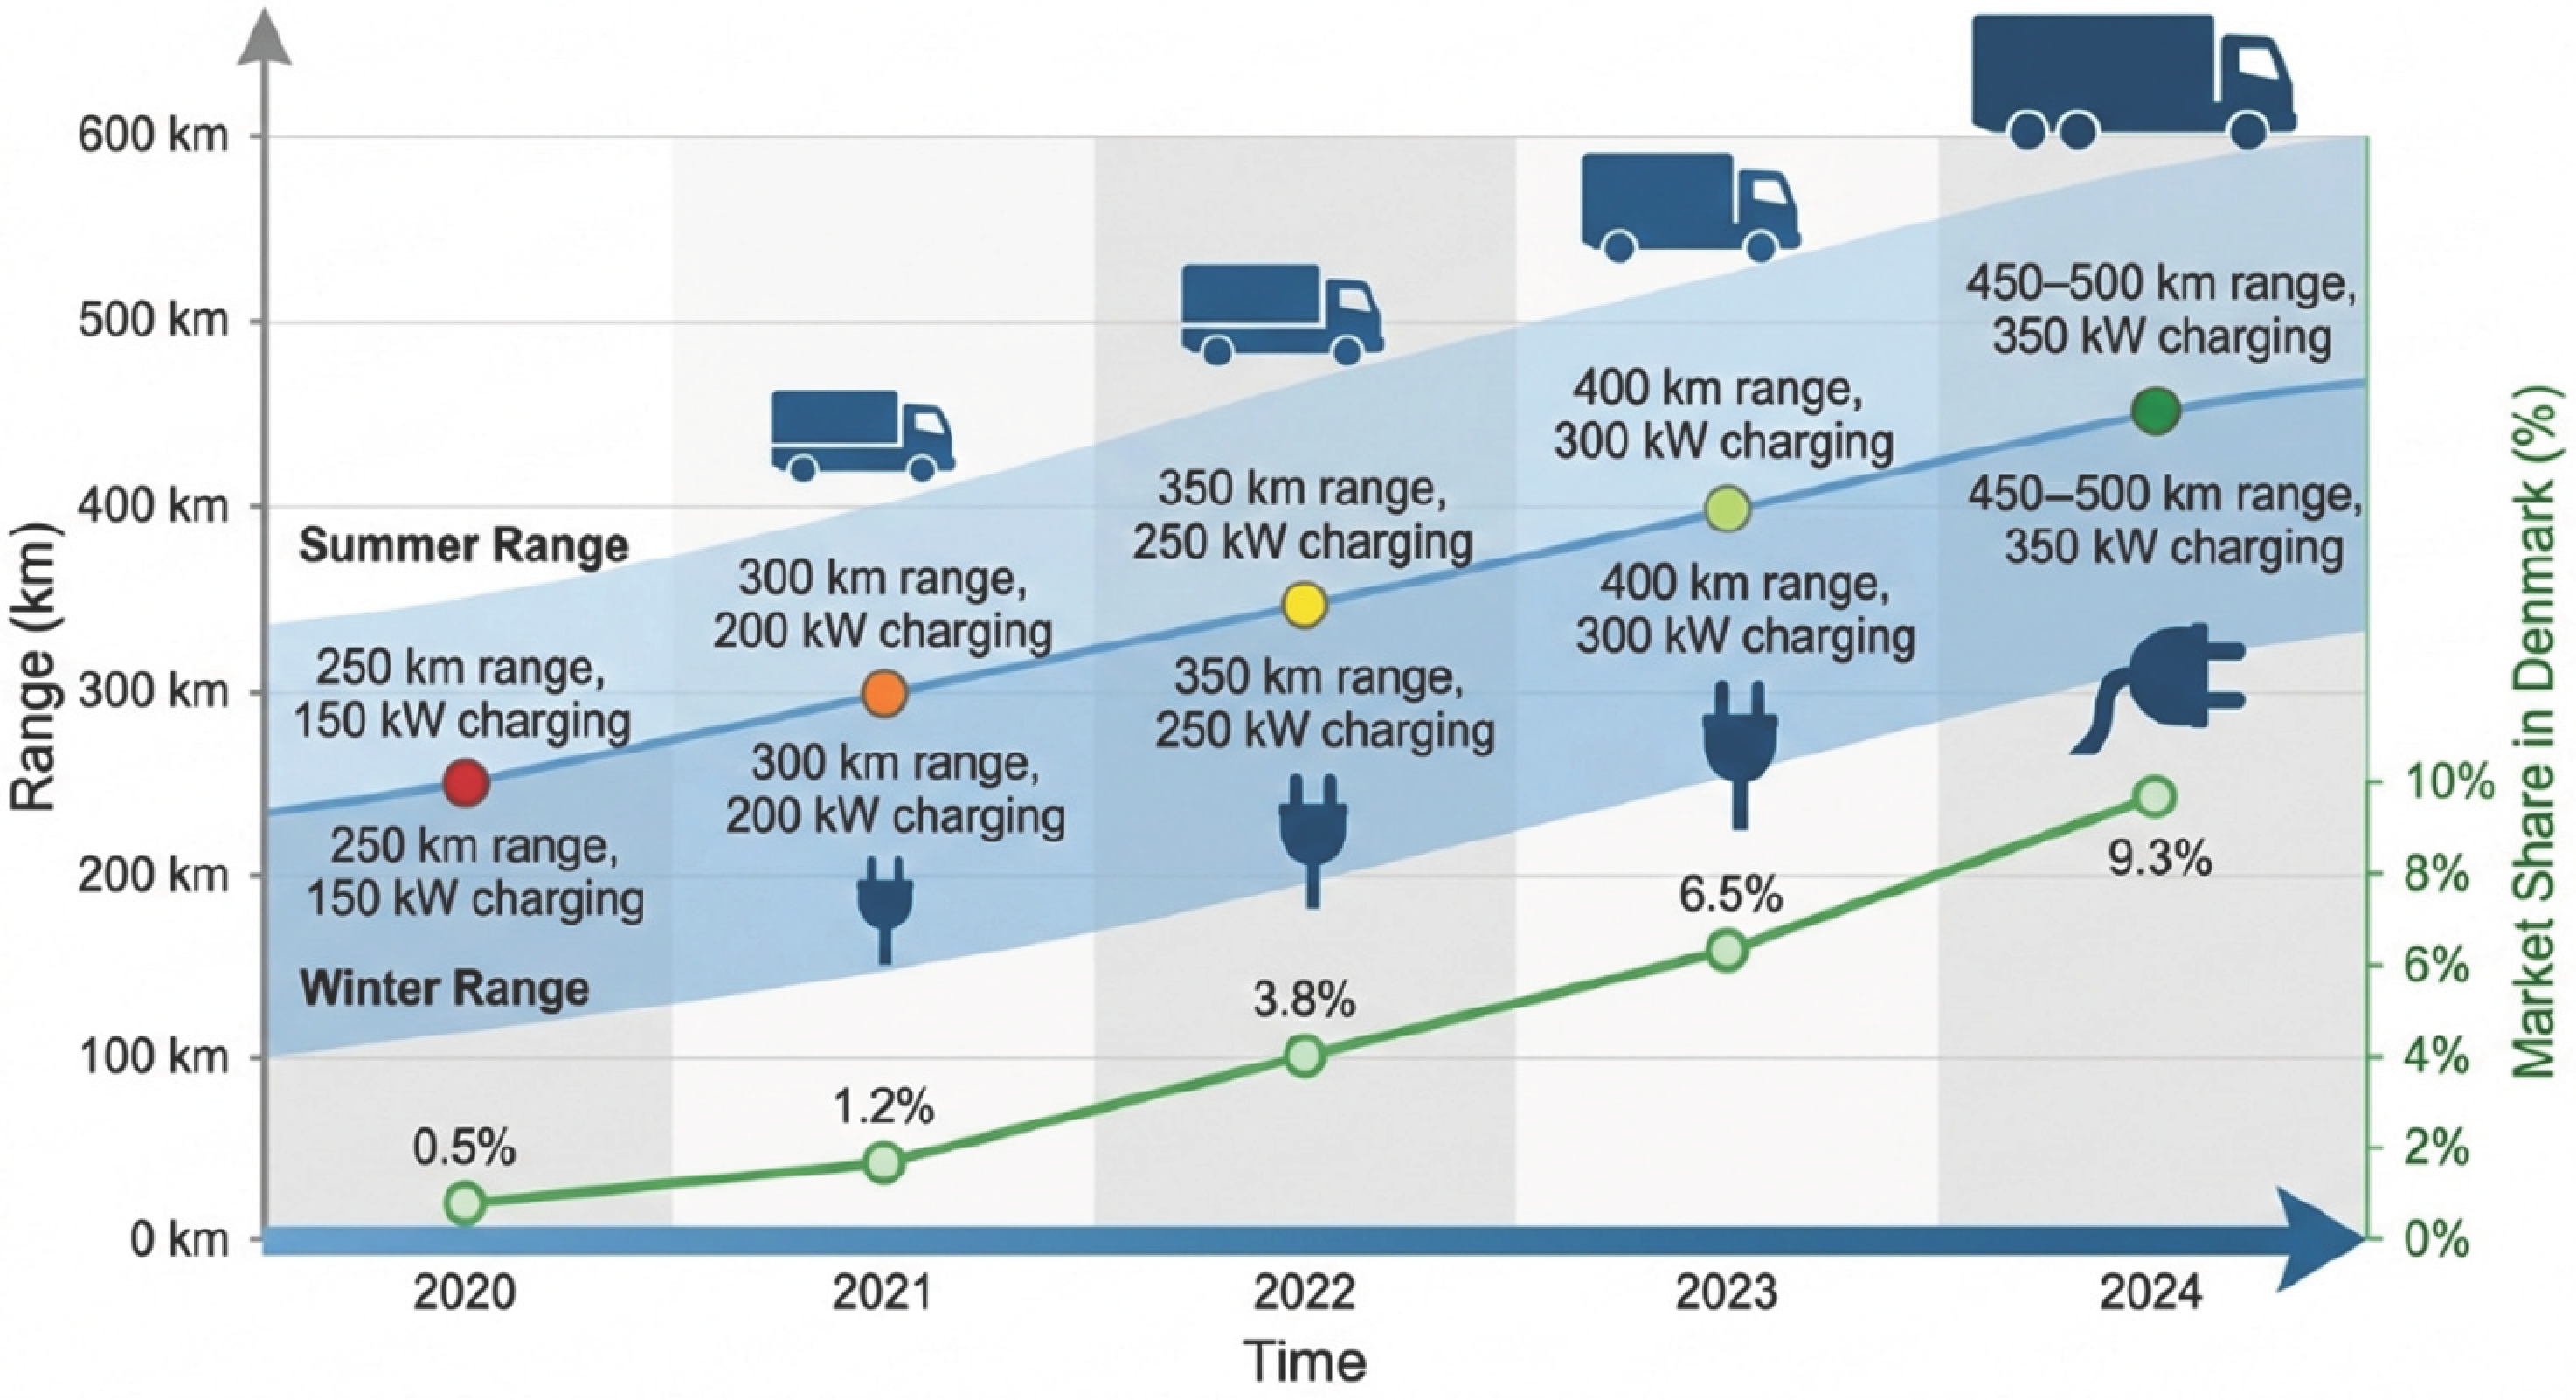
Electric trucks have reached technological maturity for regional distribution (400–500 km range), though dynamic range variability (20–30% seasonal variation, 10–15% load effects) persists [23,24]. Total cost of ownership analyses show mixed results [Figure 3], highly sensitive to assumptions including annual mileage, energy prices, subsidies, and residual values [25,26].
Figure 3.
Truck technology development from 2020–2024.
Organizational barriers often exceed technical challenges. Competence gaps emerge across drivers (energy-efficient driving), fleet managers (route planning under constraints), and maintenance personnel (high-voltage safety) [27]. Decision-making complexity creates “decision paralysis” in SMEs with limited analytical capacity [28].
2.1. Artificial Intelligence in Transport and Logistics
Current AI applications focus on route optimization (10–20% efficiency gains), demand forecasting, and predictive maintenance (20–30% downtime reduction) [29,30,31]. However, these tools optimize within single domains without integrating across dimensions, creating suboptimization risks [32].
2.2. Socio-Technical Transition Theory
Geels’ Multi-Level Perspective conceptualizes transitions as interactions between niche innovations (electric trucks), socio-technical regimes (diesel-based freight), and landscape pressures (climate policy) [22]. However, MLP provides limited insight into micro-level decision-making processes within organizations [33,34].
Organizational readiness theory identifies change commitment, efficacy, valence, and informational readiness as critical dimensions [35,36,37,38]. This heterogeneity suggests uniform approaches to supporting electrification will prove ineffective.
2.3. Decision Support Systems
Effective decision support systems require user-centricity, modularity, transparency, adaptability, and actionability [39,40,41,42,43]. These principles inform ARFFE’s design.
2.4. Synthesis
Existing approaches suffer from dimensional fragmentation (addressing dimensions in isolation), readiness blindness (assuming uniform capacity), and complexity amplification (providing overwhelming data without guidance). These gaps motivate ARFFE’s development as an integrated, modular, readiness-based framework.
3. Materials and Methods
3.1. Research Approach
This research employs a systematic, multi-stage framework development approach:
Stage 1: Comprehensive literature review examining electric truck adoption, AI applications, socio-technical transition theory, organizational readiness, and decision support systems.
Literature Review Methodology
The initial search returned 312 results. After screening titles and abstracts, 89 full-text articles were assessed for relevance. Of these, 21 were directly integrated into the literature synthesis that underpins this article. The remaining references support specific claims across all sections of the article—including the introduction, theoretical background, methods, and discussion—rather than being confined to a dedicated literature review section.
Inclusion criteria comprised: (a) peer-reviewed publications; (b) English language; (c) addressing fleet electrification OR AI in transport logistics OR socio-technical transitions in freight. Exclusion criteria comprised: (a) non-peer-reviewed sources; (b) studies focusing solely on passenger EVs; (c) purely technical battery chemistry papers.
The systematic literature review (Stage 1) followed a structured search protocol across two databases: Scopus and Web of Science. The search strings combined transportation electrification terms (“electric truck” OR “electric freight” OR “battery electric vehicle” AND “heavy duty”) with AI and decision support terms (“AI” OR “artificial intelligence” OR “machine learning” OR “decision support”). The search was limited to publications from 2019 to 2024.
Stage 2: Theoretical framework development through conceptualization of multi-dimensional planning challenges, organizational readiness stage modeling, and design principle formulation.
Stage 3: Operational data analysis from publicly available Danish sources, TCO model development incorporating road tax structures and charging economics, and route analysis using Danish transport characteristics.
Stage 4: ARFFE framework design through modular architecture development, AI functionality mapping, and implementation pathway specification.
Stage 5: Expert consultation with transport industry professionals, AI researchers, and sustainability consultants for iterative refinement.
Stage 6 (Planned): Empirical validation through case studies with Danish transport companies.
3.2. Data Sources and Analysis
Technical Data: Published electric truck specifications for Danish market [23,24], operational performance data from field studies [25,26], and charging infrastructure data from Danish energy sector sources [1,27].
Economic Data: Market prices for electric/diesel trucks, energy costs from Danish Energy Agency [1], TCO analyses from transport sector reports [28], road tax rate schedules (2025–2029) from Danish Ministry of Taxation [6], charging cost data [7], and subsidy schemes [29].
TCO Modeling Approach: Comprehensive model incorporating:
- Acquisition costs (electric: 2.5–3.5 M DKK; diesel: 1.0–1.3 M DKK for 18-ton);
- Energy costs (private: 0.75–1.07 DKK/kWh; public: 3.00 DKK/kWh).
TCO is calculated as Net Present Value (NPV) using a Weighted Average Cost of Capital (WACC) of 5% (midpoint of the 4–6% range) as the discount rate over the analysis period.
- Maintenance (electric 40% lower than diesel);
- Insurance (electric 10–15% higher);
- Infrastructure (300,000–500,000 DKK for 150 kW depot charger);
- Road tax (CO2-differentiated: 0.13–1.65 DKK/km depending on emission class and zone);
- Financing costs (4–6% WACC);
- Residual value estimates.
Scenario Analysis: Explored annual mileage (50,000–150,000 km), vehicle lifetime (5–10 years), energy price trajectories, subsidy scenarios (0–50%), charging strategies (0–100% public), and route mix variations.
3.3. Framework Validation Approach
Initial validation employed: (1) literature validation ensuring framework components address documented needs; (2) data validation demonstrating alignment with operational insights; (3) expert validation through semi-structured consultations with seven professionals: three transport industry managers from Danish freight companies (each with 10+ years of experience in fleet operations), two AI researchers from Danish universities specializing in applied AI and optimization, and two sustainability consultants advising transport companies on electrification strategies. Experts were selected based on their direct professional experience with fleet management or AI-based decision support, and their independence from the research team. Consultations followed a structured protocol covering framework completeness, practical applicability, and identification of overlooked factors. Key refinements resulting from expert feedback included: the addition of organizational readiness as a distinct dimension (suggested by two industry managers), the four-stage readiness model structure (refined through discussion with sustainability consultants), and the emphasis on charging strategy as a primary economic lever (highlighted by all three industry professionals); and (4) logical validation ensuring internal consistency.
3.4. Limitations
This study presents a conceptual framework with initial illustration rather than full empirical testing. Framework application is illustrated through secondary data analysis rather than tested in real organizational contexts. The single-context focus on Denmark requires further research for broader applicability. Technical feasibility of proposed AI functionalities is based on literature review rather than actual system development.
4. Illustrative Application: The Danish Electric Truck Context
4.1. Technical Analysis
Current 18-ton electric trucks offer 420–540 kWh battery capacity, 400–500 km nominal range, and 250–350 kW DC fast charging capability [23]. However, performance varies significantly: optimal conditions (20 °C, flat terrain, light load) achieve baseline range, while winter conditions (below −10 °C, full load, urban driving) reduce range by up to 30% to approximately 336 km [24,25].
For Danish operations, most domestic routes (under 400 km) prove technically feasible during summer, but winter performance creates challenges for routes exceeding 350 km, requiring charging strategy adaptations or diesel backup [Table 1].
Table 1.
Presents five-year TCO comparison (80,000 km/year, 18-ton truck).
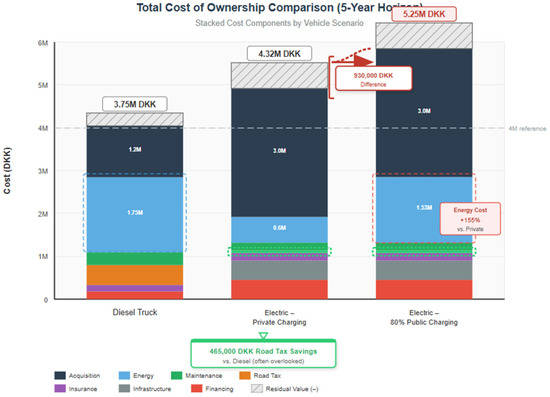
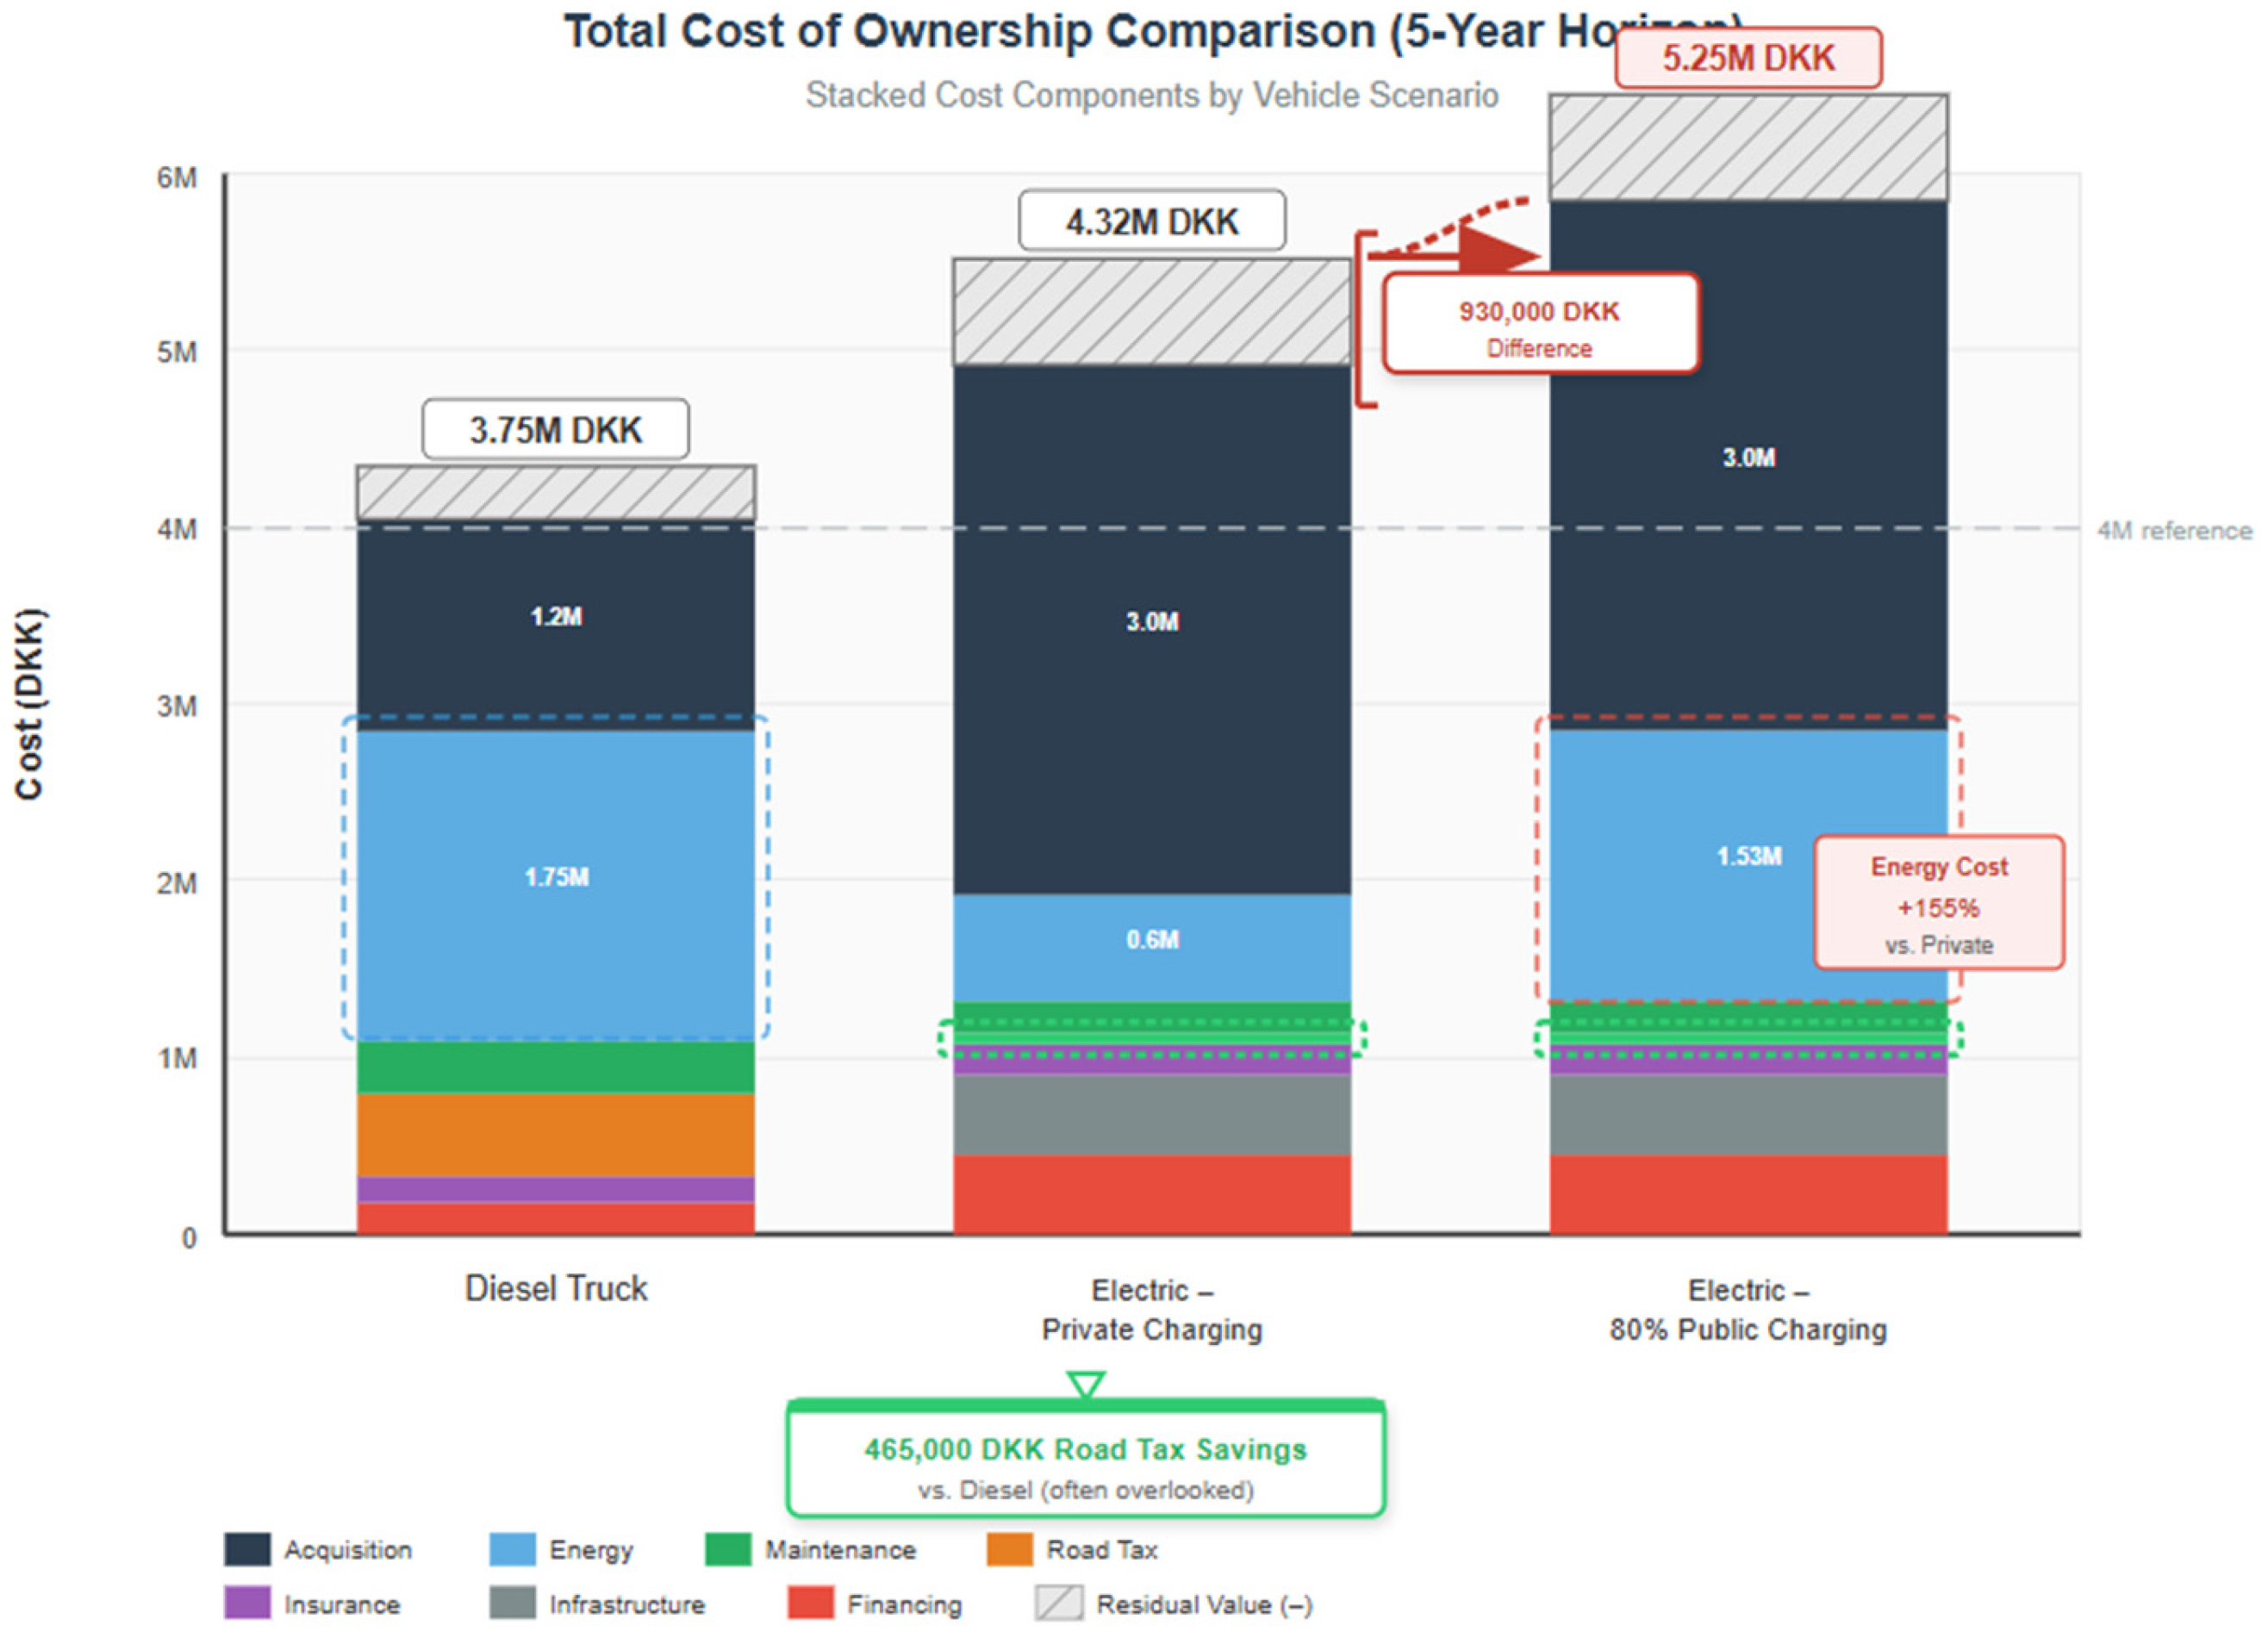
Denmark’s charging infrastructure comprises approximately 50 high-power locations (150 kW+) as of 2024, with 85–90% uptime reliability [Figure 4]. Planned development targets 250 locations by the end of 2025 [1,27,44].
Figure 4.
Five-year total cost of ownership comparison for an 18-ton truck under three scenarios: diesel, electric with private depot charging, and electric with predominantly public charging (80%).
4.2. Economic Analysis
Comprehensive TCO Findings:
Key Economic Insights:
- Road Tax Impact: Five-year savings of approximately 465,000 DKK (±15–20% depending on mileage and zone distribution) represent 26% of the acquisition cost premium, reducing break-even from 8.5 to 6.5 years. This factor is frequently excluded from simplified TCO analyses.
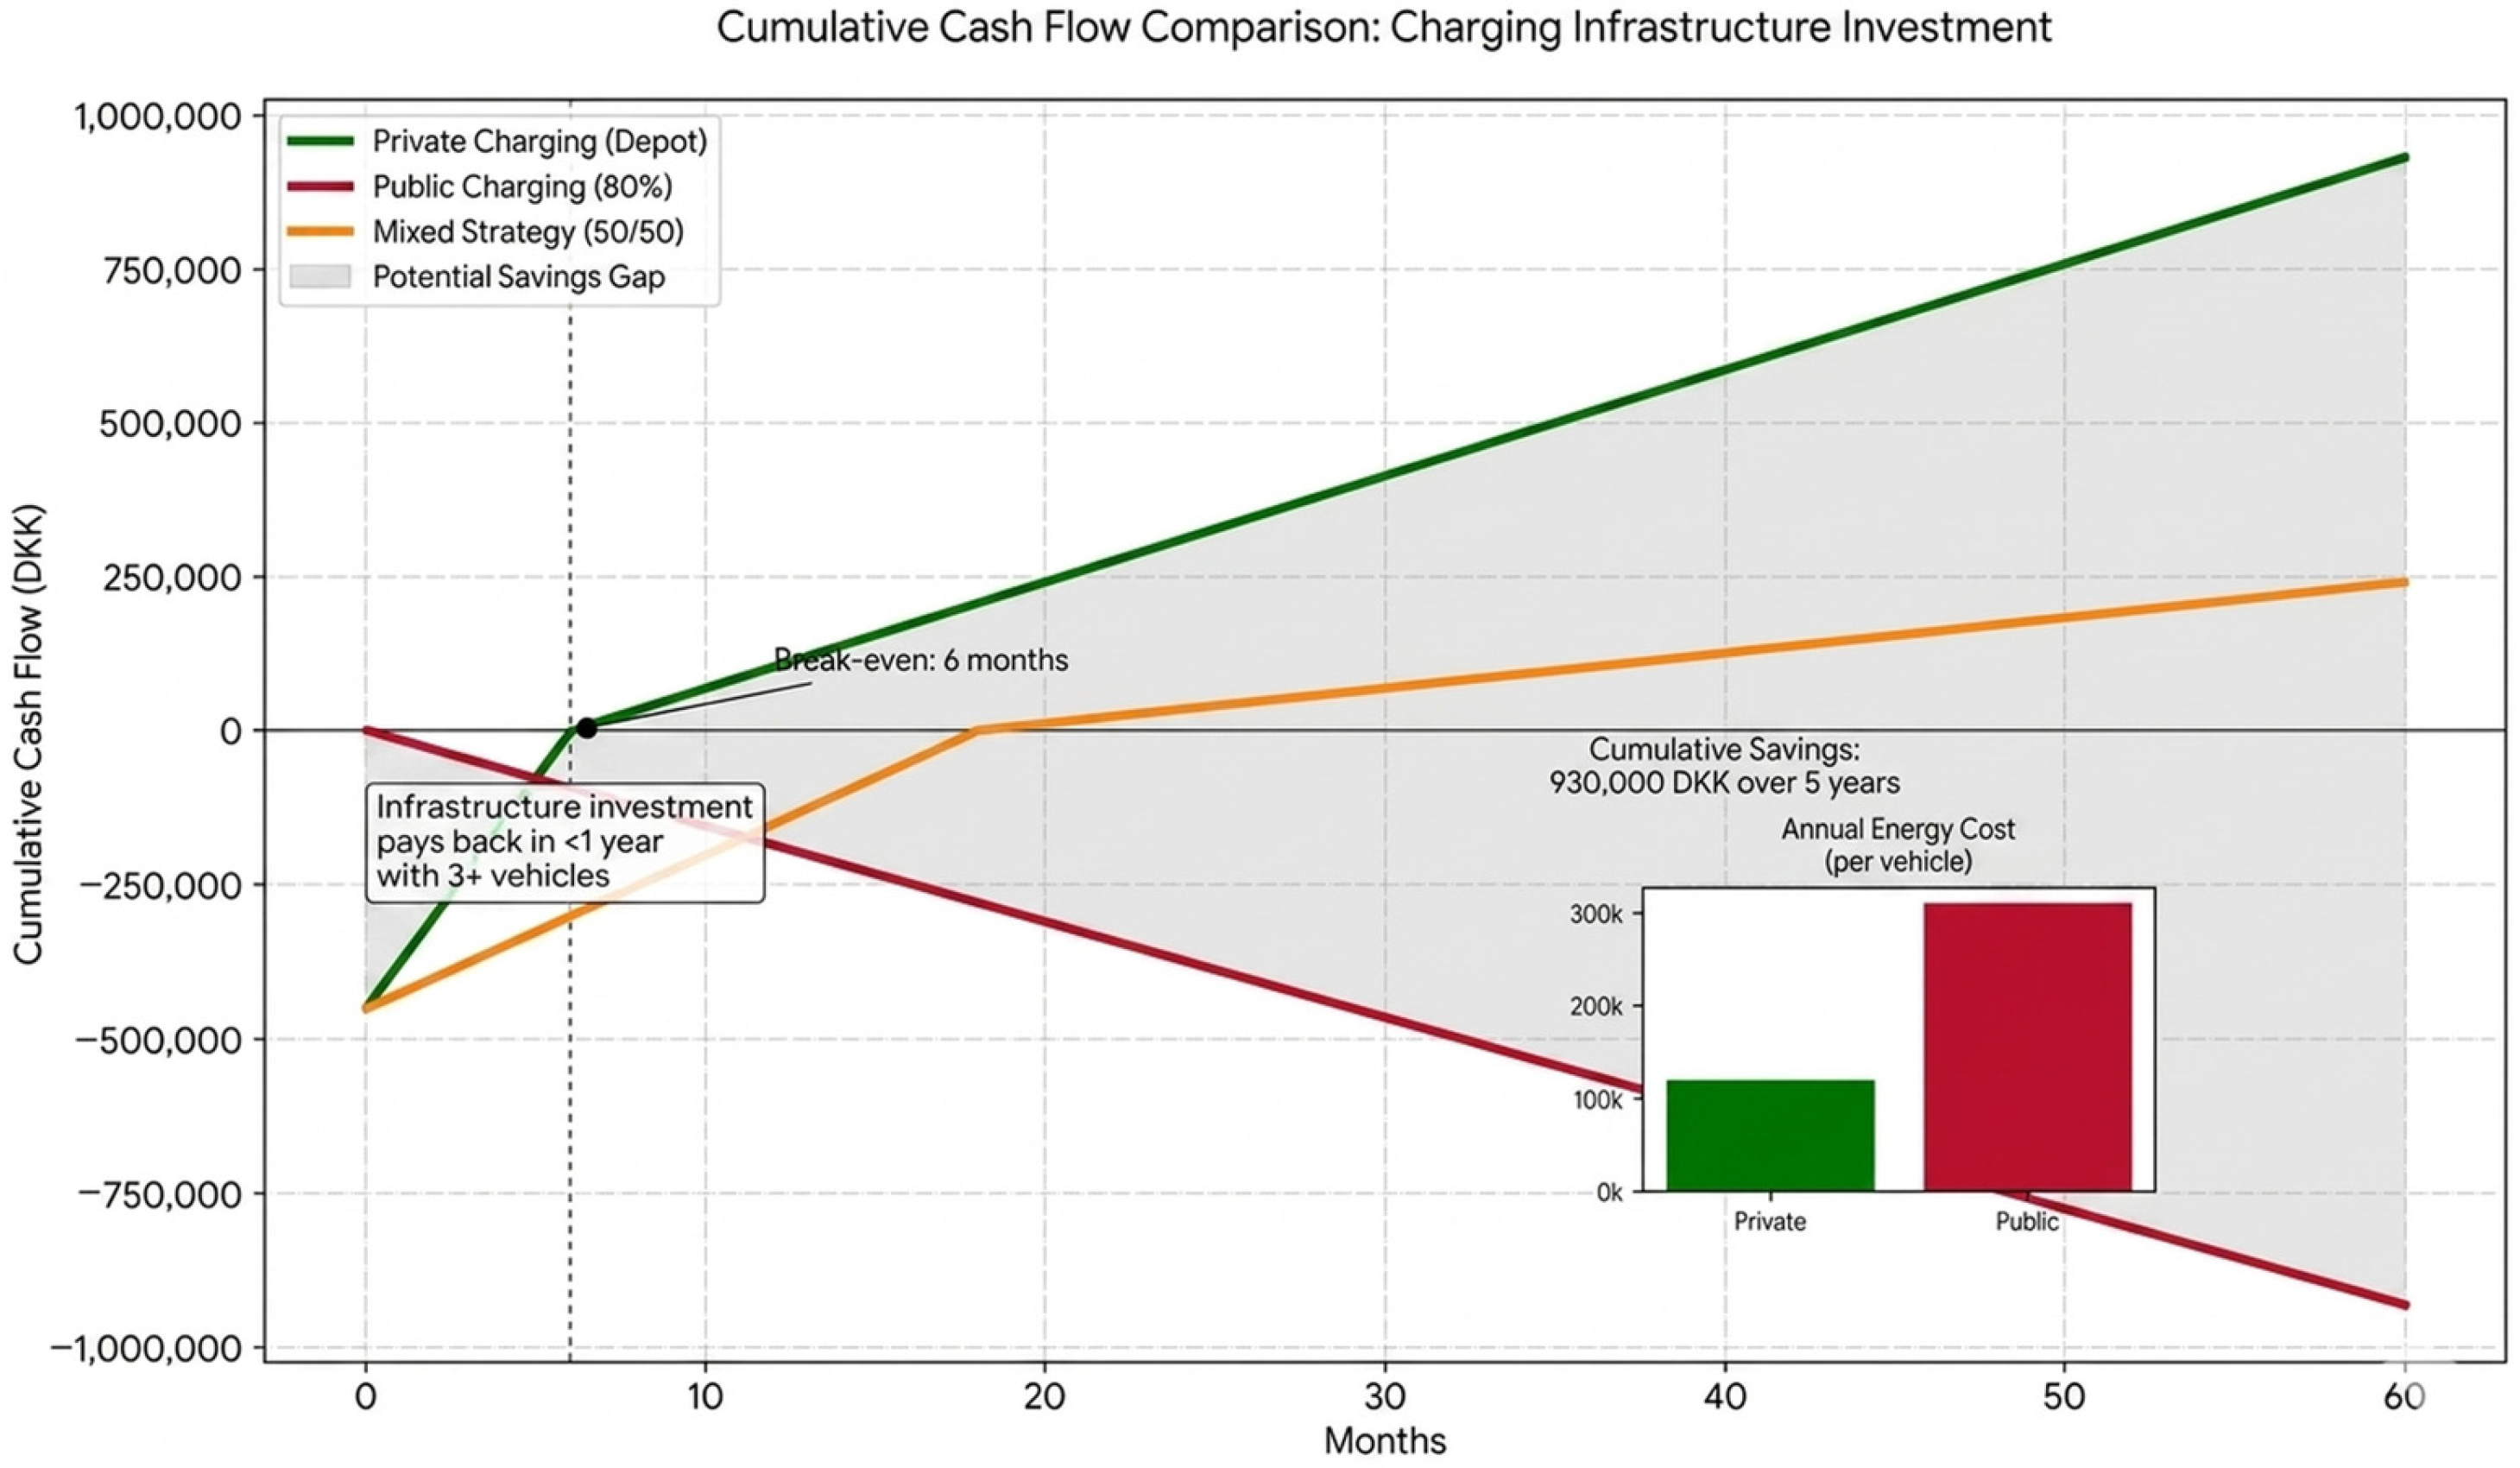
- Charging Strategy Decisiveness: Private charging creates approximately 930,000 DKK (±20% depending on route profiles and charging patterns) savings over five years compared to 80% public charging. Infrastructure investment of 450,000 DKK achieves payback in approximately 2.3 years for a single vehicle, or under one year if shared across multiple vehicles.
- Break-Even Analysis: With private charging and no subsidy, break-even occurs at approximately 6.5 years. With 50% subsidy, break-even reduces to approximately 2.8 years. However, with 80% public charging, break-even extends beyond 15 years, rendering electrification economically unviable.
- Ten-Year Perspective: With private charging, electric trucks achieve near cost-parity (only approximately 94,000 DKK or 1% premium over ten years), which can be eliminated through modest parameter improvements (higher mileage, diesel price increases, or small subsidies).
Sensitivity Analysis: Charging strategy ranks as the most sensitive parameter (8.5-year impact on break-even), followed by acquisition subsidies (3.5 years), annual mileage (2.5 years), and road tax (2.0 years).
4.3. Operational Analysis
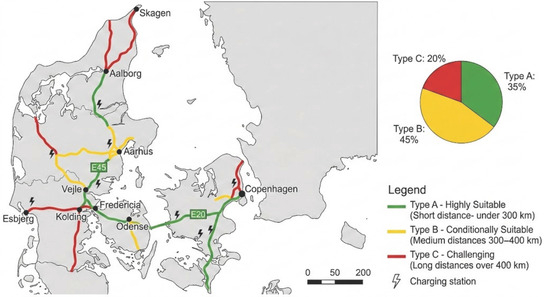
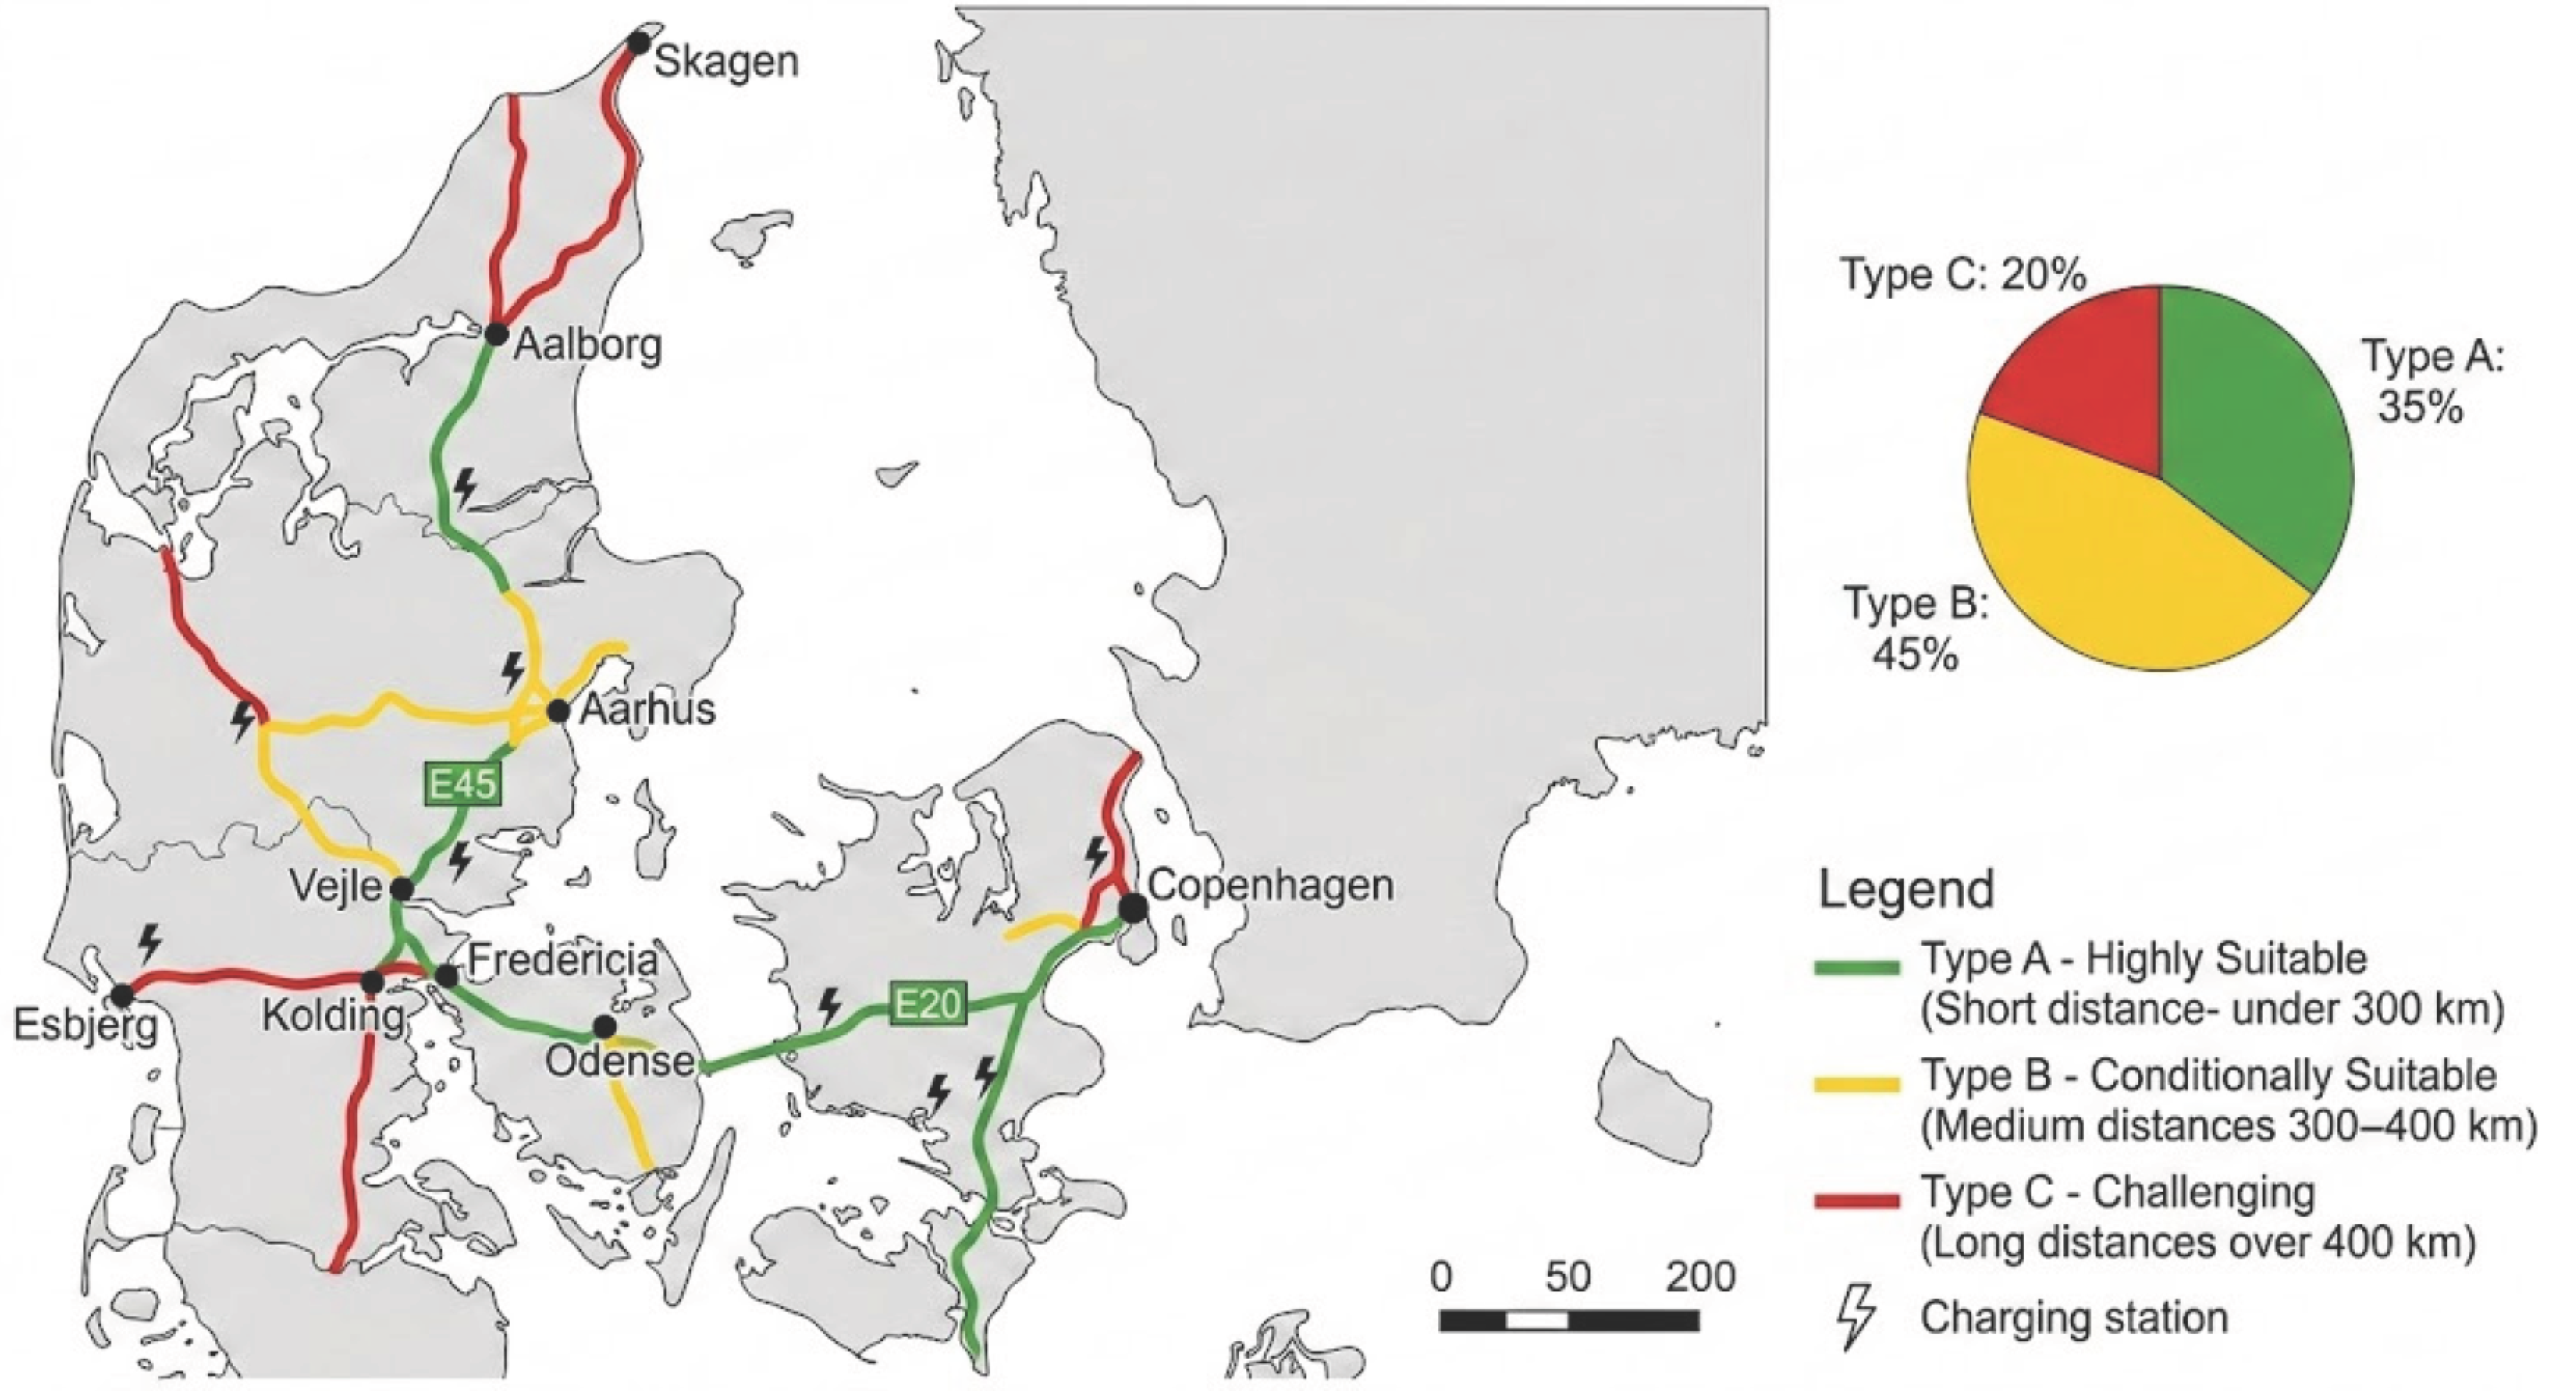
Route categorization by electrification suitability [Figure 5]:
Figure 5.
Routes and classifications.
- Type A (30–40% of routes): Under 300 km, daily frequency, depot return. Highly suitable for immediate electrification with depot-based charging, like Copenhagen–Odense.
- Type B (35–45% of routes): 300–400 km, regular frequency, charging opportunities. Conditionally suitable requiring opportunity charging or multi-vehicle relay strategies, like Copenhagen–Aarhus
- Type C (20–30% of routes): Exceeding 400 km, irregular frequency, lacking charging infrastructure. Challenging with current technology, like Esbjerg–Copenhagen.
Three charging strategies emerge: (1) Depot-based (“hjemmebase”)—lowest cost but range-constrained; (2) Opportunity charging (“mellemlanding”)—extended range but high public charging costs; (3) Multi-vehicle relay (“skiftestrategi”)- unlimited range but requires complex coordination.
4.4. Multi-Dimensional Planning Complexity
4.4.1. Technical Dimension
Encompasses vehicle specifications (range, charging capacity, payload), charging infrastructure requirements, dynamic performance factors (weather, topography, load), and technology maturity considerations. Key challenges include 20–30% seasonal range variability, 75 min charging requirements, and infrastructure gaps.
4.4.2. Economic Dimension
Comprises acquisition costs, energy costs (highly dependent on charging strategy), maintenance (40% lower for electric), insurance, infrastructure investment, road tax (CO2-differentiated), financing, and residual values. The Danish road tax system creates 200 distinct scenarios (5 emission classes × 4 weight categories × 2 zones × 5 years), while charging strategies create threefold cost differences.
4.4.3. Operational Dimension
Addresses route characteristics, fleet composition decisions, charging strategy selection, seasonal variability management, and contingency planning. Interdependencies exist where charging strategy affects energy costs, infrastructure investment, and operational time, while route patterns affect road tax exposure and charging requirements.
4.4.4. Organizational Dimension
Encompasses leadership commitment, organizational culture and change readiness, competencies and training needs, stakeholder engagement, and change management processes. These factors often prove decisive in determining implementation success.
4.4.5. Interdependencies
High interdependency creates non-linear complexity where technical feasibility constrains operational possibilities, economic viability depends on operational efficiency, organizational readiness affects implementation success across all dimensions, and operational experience generates learning that informs technical and economic projections.
The scale of this decision space can be estimated combinatorially. Considering 3 charging strategies × 3 vehicle lifetime options (5, 7, 10 years) × 5 emission/weight road tax classes × 2 zone types × 4 subsidy levels (0%, 15%, 30%, 50%) × 3 annual mileage bands (50,000, 80,000, 120,000+ km) × 2 energy price scenarios × 4 route types yields over 50,000 distinct parameter combinations. Each combination generates a unique TCO profile, break-even estimate, and risk assessment, creating a decision space that exceeds practical manual evaluation.
For example, a route of 350 km between Copenhagen and Aarhus may appear economically optimal due to low road tax rates on the E45 corridor, yet prove technically unfeasible during winter months when reduced range (potentially 280 km) requires a mid-journey charging stop, adding both time and cost that alter the economic calculation. Existing tools typically evaluate either the economic profile or the technical feasibility of such routes in isolation, failing to capture this interaction between temperature-dependent range, charging infrastructure availability, route-specific costs, and seasonal variability.
4.5. The ARFFE Framework
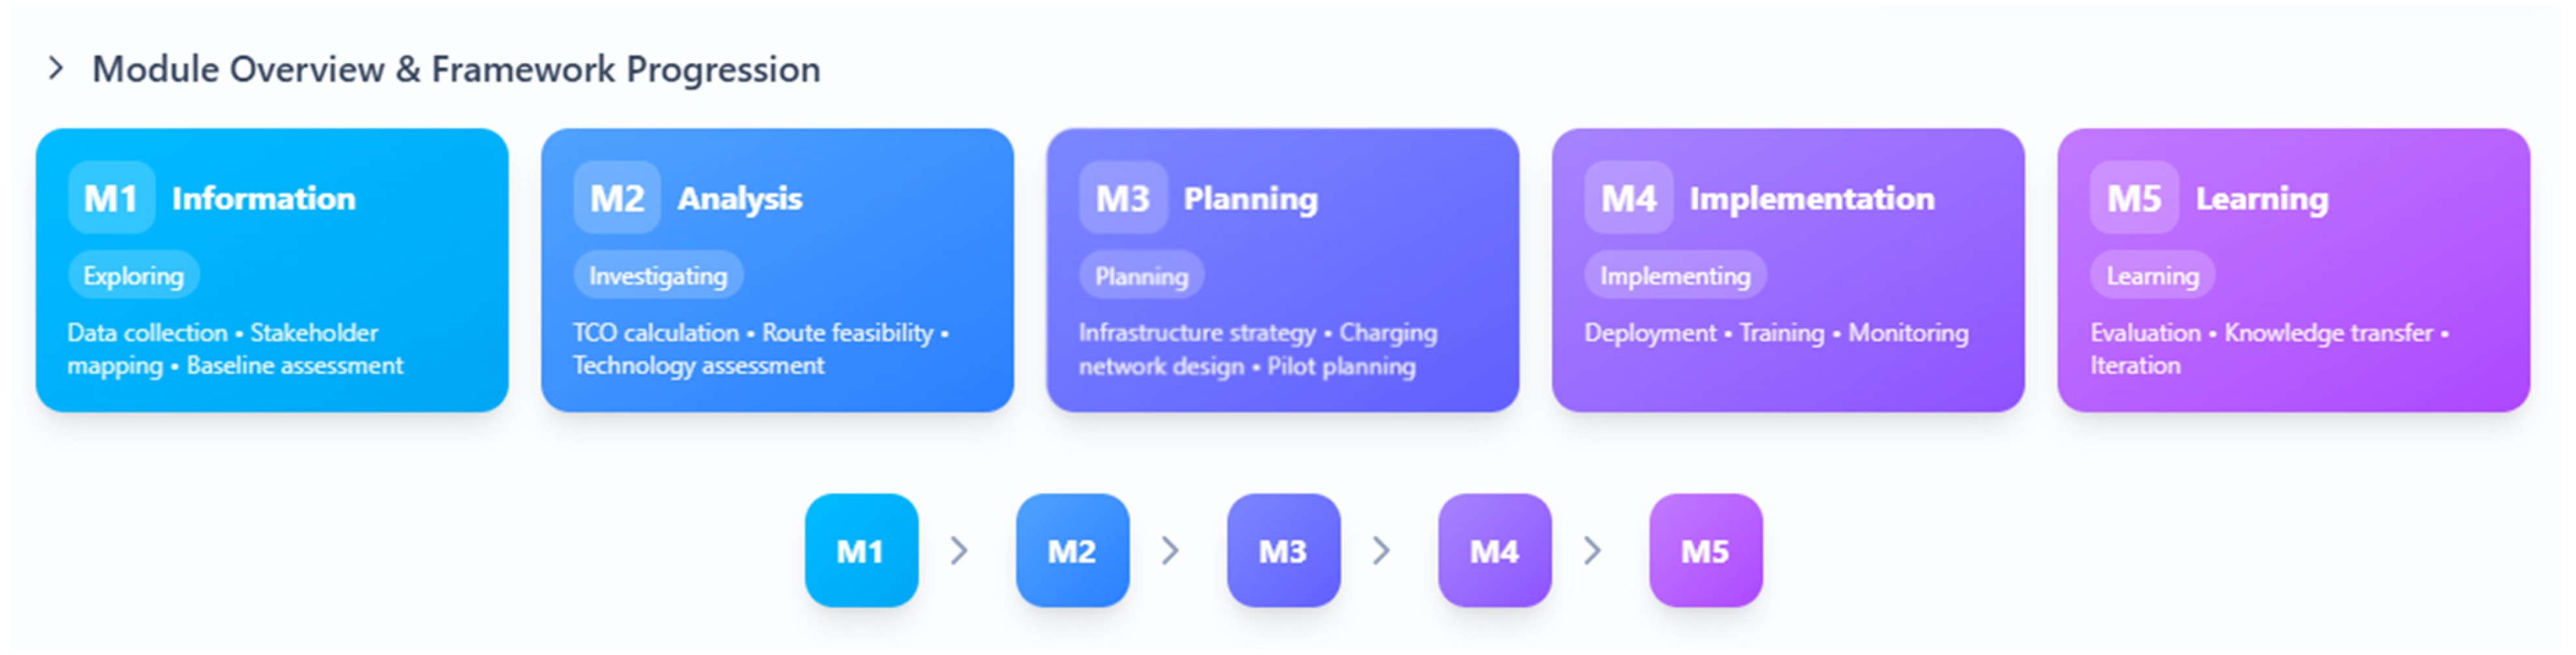
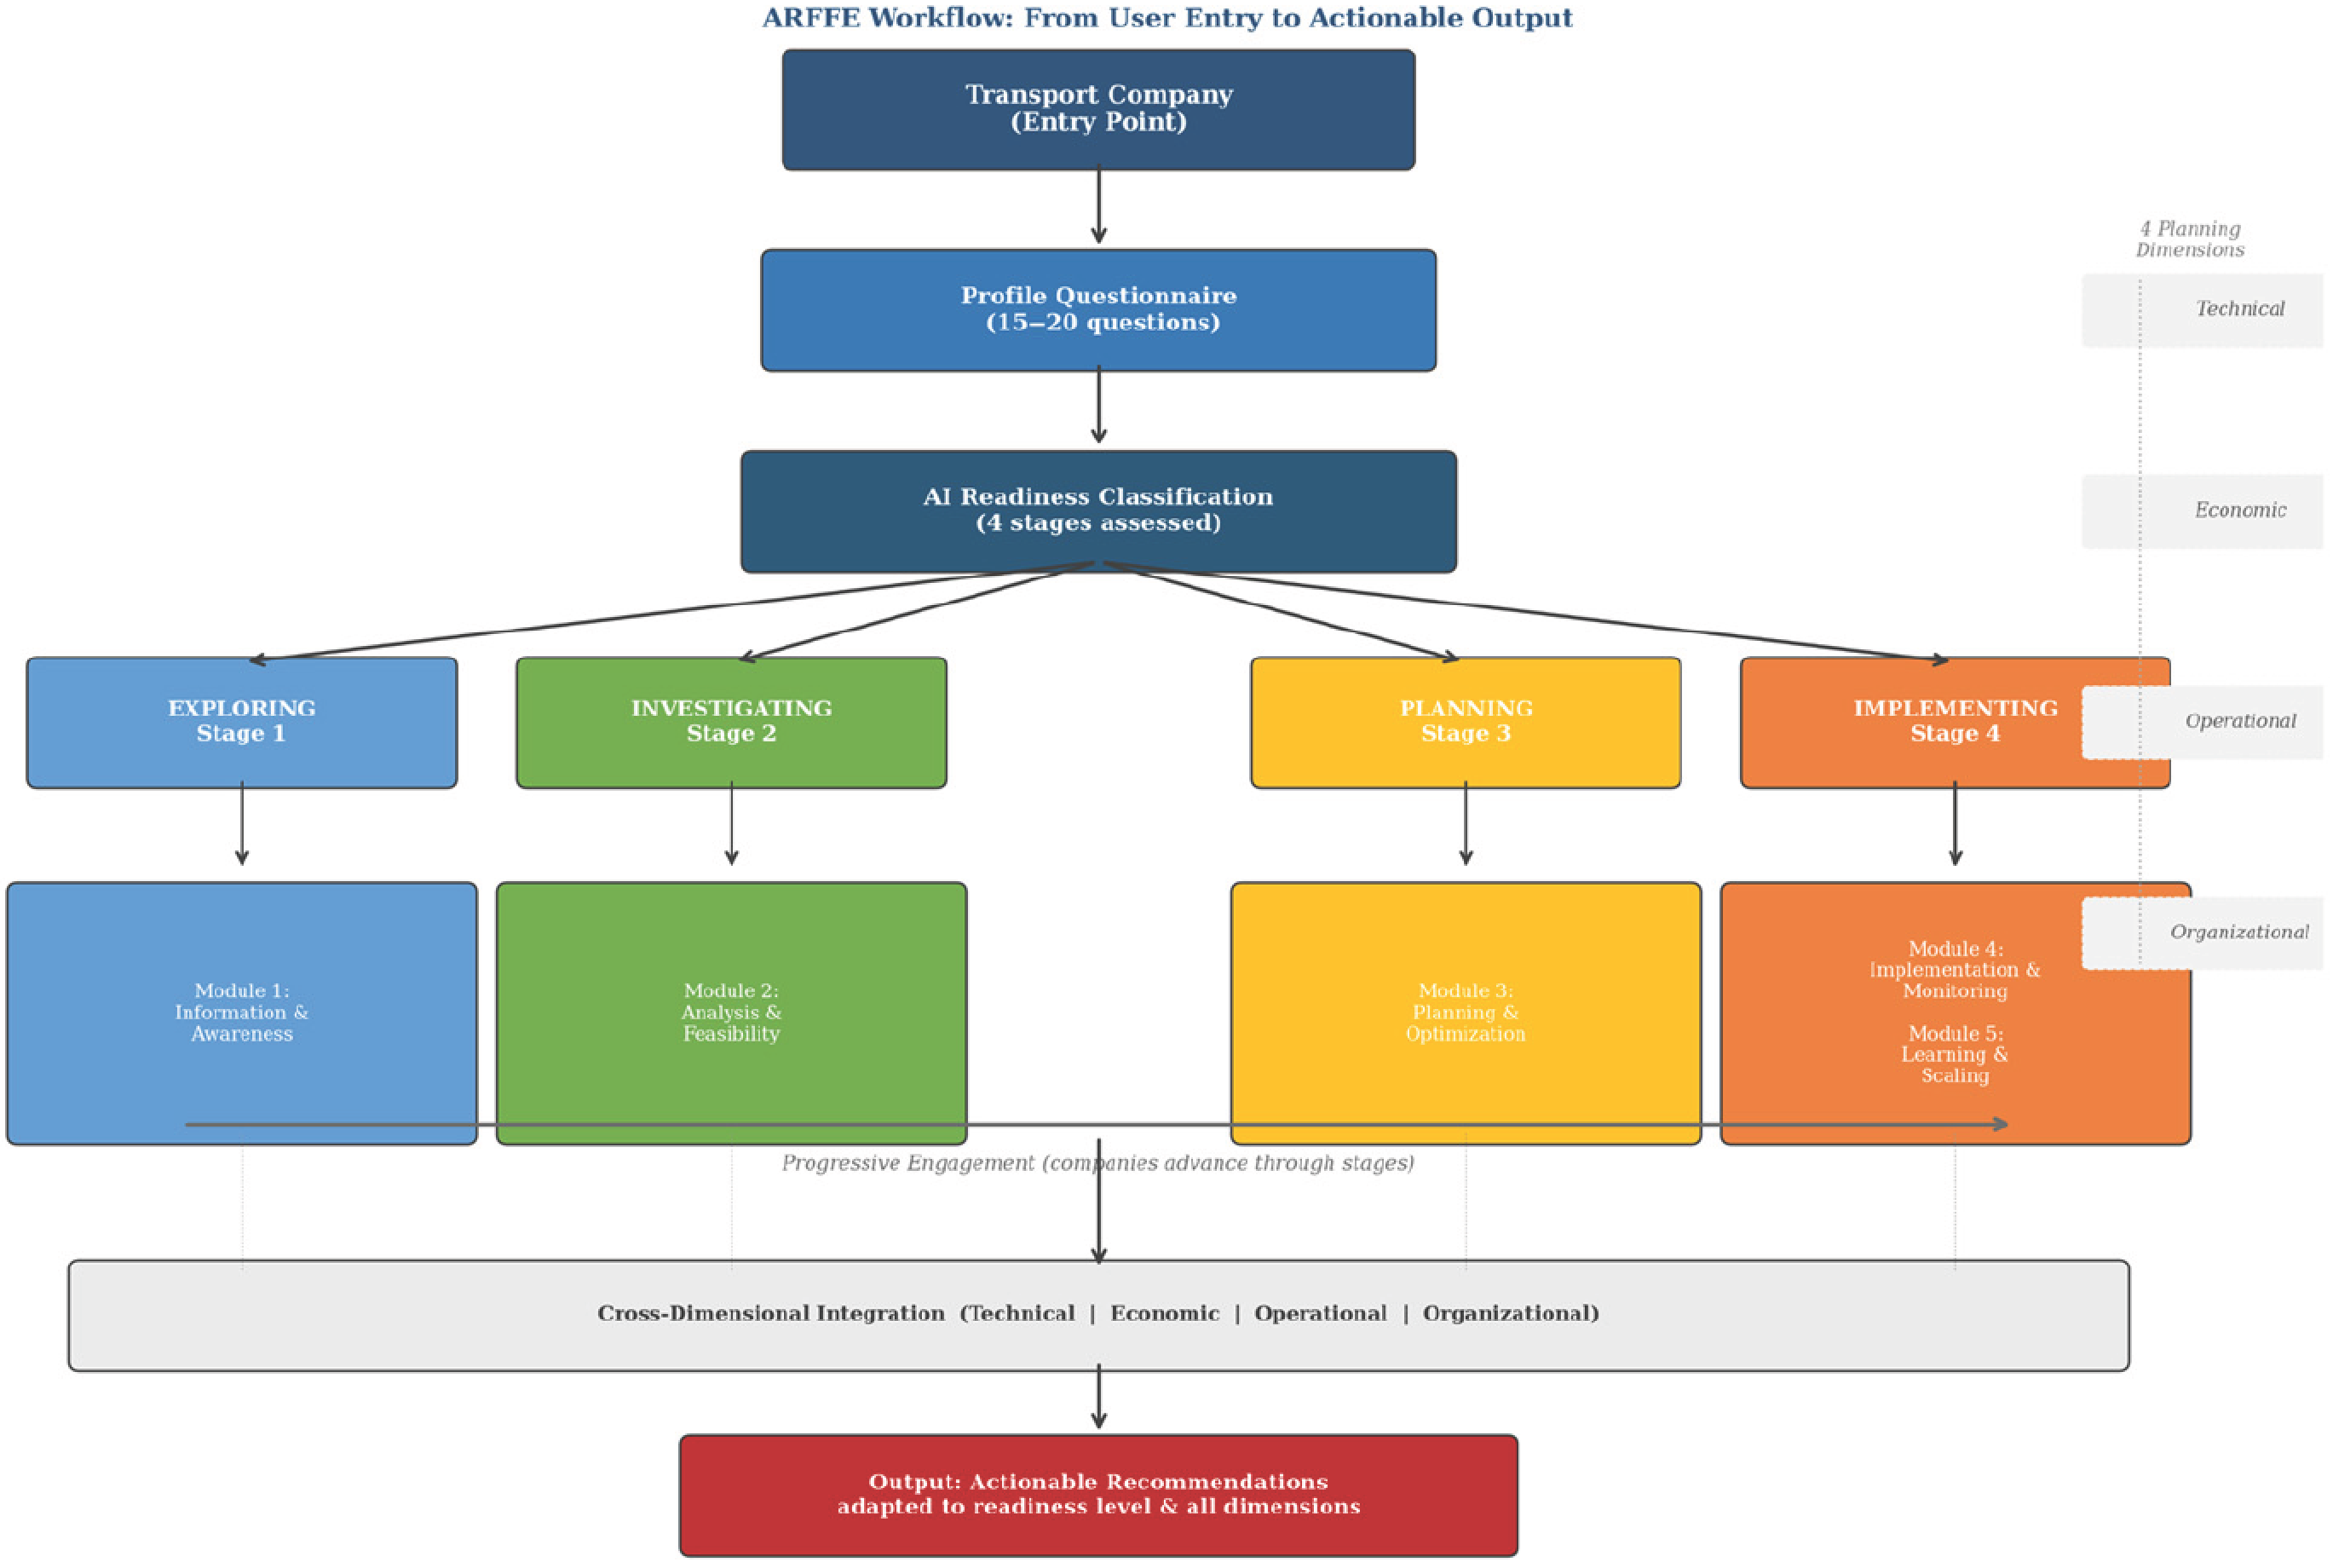
The AI-Readiness Framework for Fleet Electrification (ARFFE) comprises five progressive modules mapped to four organizational readiness stages (Exploring, Investigating, Planning, Implementing) and four planning dimensions (Technical, Economic, Operational, Organizational) [Figure 6].
Figure 6.
ARFFE module overview: five progressive modules mapped across four organizational readiness stages (Exploring, Investigating, Planning, Implementing) and four planning dimensions.
Design Principles:
- Readiness-based adaptation: Functionality matches user capacity;
- Multi-dimensional integration: Addresses all four dimensions holistically;
- Modular architecture: Progressive engagement without full system adoption;
- Progressive engagement: Supports advancement through stages;
- Transparency and explainability: Understandable decision logic;
- Actionability: Concrete, implementable recommendations.
Operationalizing Readiness
Each readiness stage can be characterized by observable indicators:
These indicators provide concrete reference points for both companies assessing their own readiness and for ARFFE’s readiness classification algorithm.
- -
- Exploring: Management has not yet conducted formal analysis of electrification; no dedicated budget or personnel assigned; knowledge primarily from media and industry events.
- -
- Investigating: At least one formal TCO or feasibility study initiated; management actively seeking information; initial infrastructure assessments conducted.
- -
- Planning: Electrification included in strategic planning horizon; budget allocated (at least preliminary); infrastructure procurement process initiated or completed; staff training needs identified.
- -
- Implementing: First electric vehicles in operation or ordered; charging infrastructure installed; dedicated fleet management processes for electric vehicles established; performance monitoring systems active.
4.6. The Five AI Modules
Module 1: Information and Awareness (Exploring Stage)
Targets companies with limited knowledge, employing intelligent information curation, automated benchmarking against similar companies, and readiness assessment through brief questionnaires. Generates personalized information packages, peer examples, and feasibility indicators requiring minimal data input.
Module 2: Analysis and Feasibility (Investigating Stage)
Provides comprehensive feasibility analysis including:
- Detailed TCO analysis: Company-specific calculations with Monte Carlo simulation for uncertainty and sensitivity analysis;
- Route suitability analysis: Multi-criteria categorization into Types A/B/C with electrification prioritization;
- Charging strategy economics: Comparison of total costs across approaches (showing 930,000 DKK differences);
- Gap analysis: Technical, economic, operational, and organizational gap identification;
- Risk assessment: Probabilistic quantification of technical, economic, operational, and organizational risks;
- Scenario comparison: Multi-objective optimization across cost, risk, environmental benefit, and operational impact.
Module 3: Planning and Optimization (Planning Stage)
Supports committed companies with:
- Vehicle selection optimization: Matching specifications to route requirements;
- Charging infrastructure design: Optimal locations, types, and capacities using facility location algorithms;
- Route-vehicle allocation optimization: Assignment algorithms considering range, infrastructure, and costs;
- Implementation sequencing: Phased plans with timelines and milestones;
- Training needs assessment: Competence gap identification and program design;
- Change management planning: Stakeholder engagement and communication strategies.
Module 4: Implementation and Monitoring (Implementing Stage)
Provides ongoing operational support:
- Real-time range prediction: Machine learning models with weather, load, and route integration;
- Dynamic route optimization: Adaptive routing based on current conditions;
- Charging optimization: When, where, and how long to charge balancing cost, time, and battery health;
- Performance monitoring: Statistical process control for energy efficiency, on-time delivery, and utilization;
- Anomaly detection: Identification of unusual patterns indicating potential problems;
- Continuous improvement: Pattern recognition for optimization opportunities.
Module 5: Learning and Scaling (Implementing Stage)
Facilitates organizational learning:
- Best practice identification: Pattern mining from operational experience;
- Knowledge management: Searchable repositories and automated documentation;
- Scaling optimization: Identification of optimal next routes for electrification;
- Performance benchmarking: Comparison against targets and industry standards;
- Technology monitoring: Tracking developments in electric truck technology.
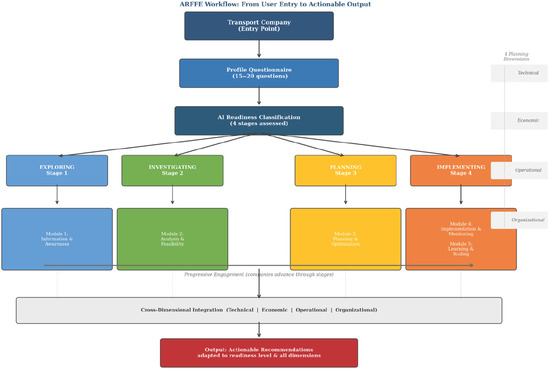
Illustrative Technology Stack. While ARFFE is designed as a technology-agnostic framework, the following examples illustrate how each module could be implemented using established computational approaches. Module 1 could employ rule-based logic and knowledge graphs for intelligent information curation and benchmarking against similar companies. Module 2 could utilize Monte Carlo simulation (e.g., Python 3.13-based with pandas and NumPy for probabilistic TCO modeling) combined with multi-criteria decision analysis for route suitability scoring. Module 3 could draw on operations research techniques, including mixed-integer programming for vehicle-routing problems and facility location algorithms for charging infrastructure optimization. Module 4 could leverage machine learning methods such as regression models or neural networks trained on historical operational data for real-time range prediction and anomaly detection, alongside reinforcement learning for dynamic charging optimization. Module 5 could employ unsupervised learning techniques (clustering, association rule mining) for best practice identification from cross-company operational data, combined with natural language processing for automated knowledge extraction and documentation. These examples are illustrative rather than prescriptive; actual implementation choices would depend on data availability, computational requirements, and user context [Figure 7].
Figure 7.
ARFFE workflow: from user entry through AI readiness classification to progressive module engagement and actionable output, integrating all four planning dimensions across the framework’s modular architecture.
4.7. Cross-Dimensional Integration
Integration occurs through shared data models, cross-dimensional constraints (technical limitations informing economic analysis), feedback loops (operational experience updating models), and holistic recommendations considering all dimensions simultaneously.
Module boundaries are defined by data requirements and output types: Module 1 requires minimal input (company profile) and produces awareness-level outputs; Module 2 requires detailed operational data (fleet composition, route patterns, energy costs) and produces quantitative feasibility assessments; Module 3 requires committed strategic decisions and produces implementation plans; and Modules 4 and 5 require live operational data streams and produce real-time optimization and learning outputs. Transition between modules is triggered by readiness progression: companies advance when their assessed readiness profile indicates sufficient engagement with the current module’s outputs.
4.8. Implementation Pathway
Companies engage through: (1) initial profile questionnaire (15–20 questions); (2) AI analysis generating readiness profile and module recommendation; (3) module-specific data provision and insight generation; and (4) progressive advancement through stages with accumulated learning.
5. Discussion
5.1. Theoretical Contributions
This research extends Geels’ Multi-Level Perspective [22] by introducing AI as a “mediating technology” that facilitates socio-technical transitions through complexity reduction. Traditional MLP focuses on niche innovation maturity, regime actor pressures, and landscape changes as transition drivers. Our analysis demonstrates that even when these conditions are met, as they are for electric trucks in Denmark, transitions may be constrained by regime actors’ cognitive capacity to navigate multi-dimensional complexity.
Our quantification of complexity, over 50,000 distinct scenarios requiring evaluation, reveals a decision space exceeding human cognitive capacity. The identification of critical but overlooked factors (road tax and charging strategy) demonstrates that analytical comprehensiveness, not merely information availability, determines adoption outcomes. AI addresses this through complexity reduction, information asymmetry reduction between SMEs and large corporations, risk mitigation through scenario analysis, and learning acceleration across organizations.
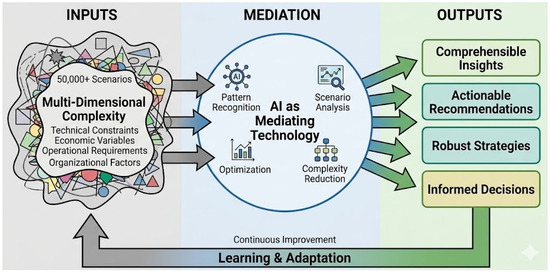
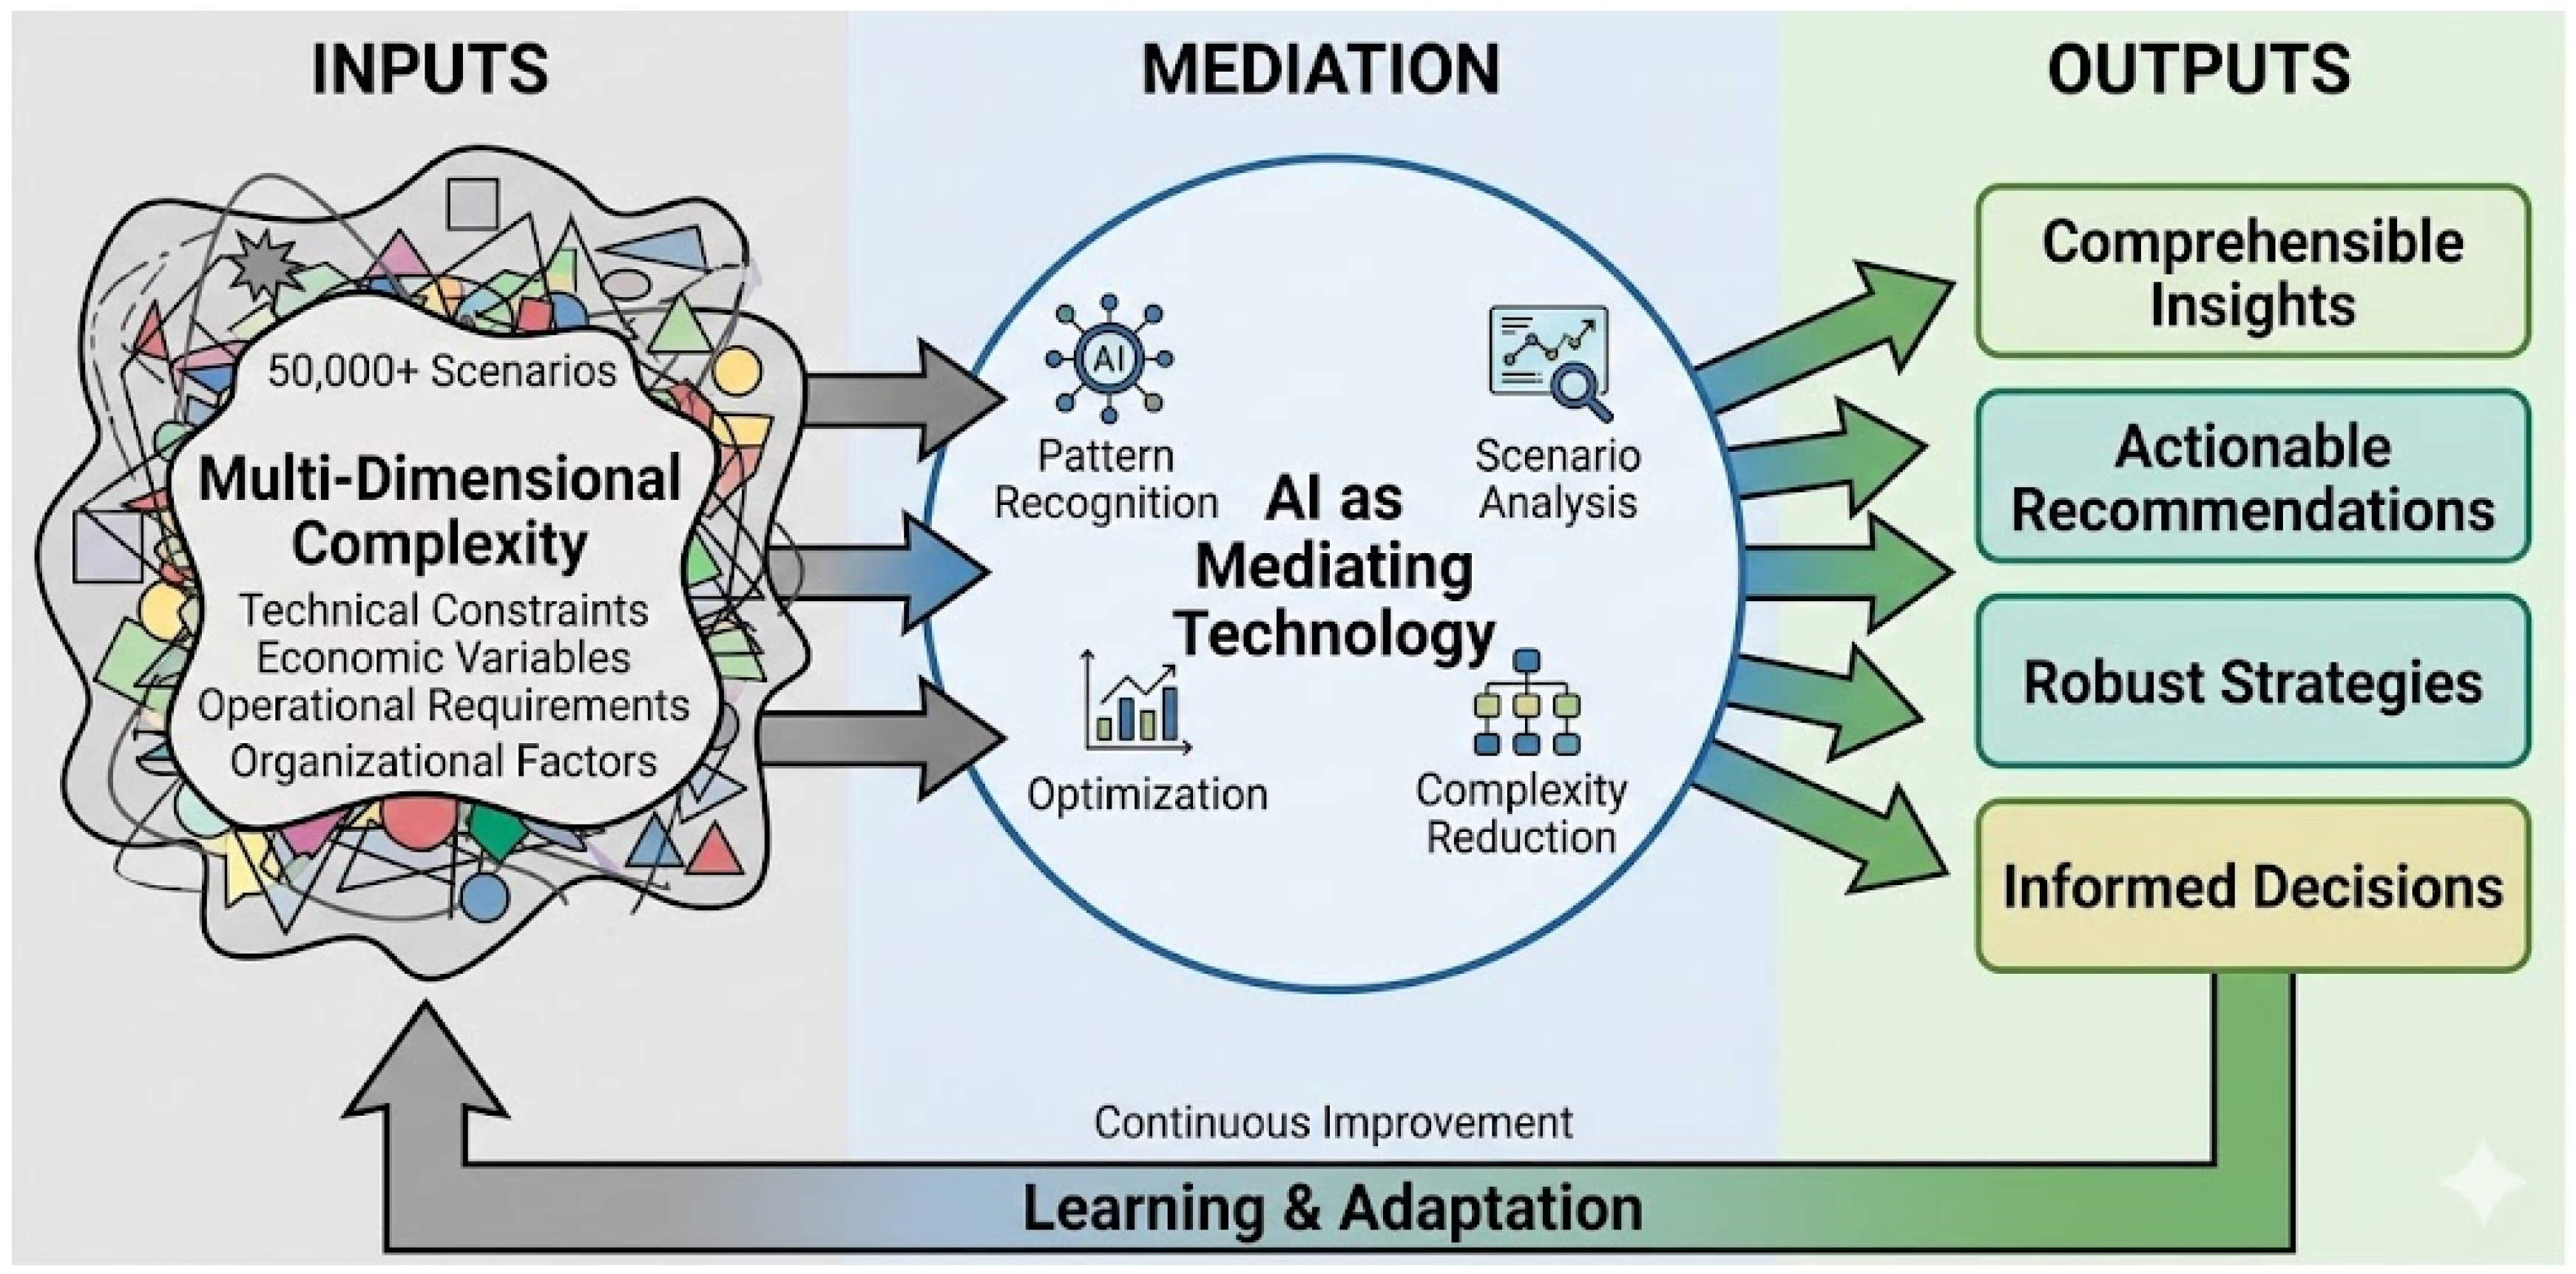
This positions AI not as mere optimization tool but as transition enabler. The theoretical proposition is that transition speed is constrained by cognitive capacity for comprehensive analysis, and AI accelerates transitions by reducing this barrier [Figure 8].
Figure 8.
AI as mediating technology in socio-technical transitions: extending the Multi-Level Perspective with a cognitive dimension that addresses regime actors’ capacity to navigate multi-dimensional complexity.
The concept of AI as mediating technology shares conceptual ground with several existing constructs in transition literature. Demir, E et al. [45] describe ‘bridging technologies’ as innovations that connect niches to regimes, while Taefi, T.T et al. [37] identify ‘intermediary organizations’ that facilitate knowledge exchange during transitions. Our proposition differs in focusing on AI’s cognitive function: rather than bridging technical domains or institutional actors, AI mediates by reducing the cognitive complexity that prevents regime actors from engaging with niche innovations even when landscape pressures create favorable conditions. In this sense, ARFFE’s ‘mediating technology’ concept complements rather than replaces these existing frameworks, adding a micro-level cognitive dimension to MLP’s macro-level structural analysis.
The relationship between MLP and ARFFE can be mapped as follows: MLP’s landscape level (climate policy, EU regulations) corresponds to the external boundary conditions within which ARFFE operates; MLP’s regime level (diesel-based freight sector) corresponds to the organizational context that ARFFE’s readiness assessment evaluates; and MLP’s niche level (electric truck technology) corresponds to the technical dimension of ARFFE’s planning framework. ARFFE’s unique contribution is the addition of a cognitive/decision-making layer that MLP does not explicitly address—the question of how individual organizations navigate the transition given the complexity of the choice space. This positions ARFFE as operating primarily at the regime–niche interface, where organizational actors must make concrete investment and operational decisions.
5.2. The Hidden Complexity Phenomenon
Our analysis reveals “hidden complexity” where factors critical to outcomes are systematically overlooked. Road tax savings (approximately 430,000–465,000 DKK over five years) and charging strategy impacts (approximately 930,000 DKK differences) are frequently excluded from TCO analyses, creating misleading conclusions that may reject electrification despite favorable underlying economics.
This hidden complexity arises from cognitive limitations (focusing on salient factors), information fragmentation, temporal discounting, and analytical tradition following outdated frameworks. AI framework design must identify and incorporate such hidden factors through comprehensive data integration, pattern recognition, and sensitivity analysis.
5.3. Organizational Readiness as Design Principle
Our four-stage readiness model operationalizes adoption theory by providing stage-specific characterization of cognitive states and information needs. Companies at different stages require fundamentally different support: Exploring-stage companies need awareness-building, while Implementing-stage companies need real-time operational tools.
The theoretical contribution positions readiness as a design principle rather than merely an adoption predictor. AI developers should conduct readiness assessment and adapt functionality accordingly, as uniform systems fail both low-readiness users (overwhelmed) and high-readiness users (under-served).
This design trade-off—between providing sufficient information for confident decision-making and avoiding information overload that causes paralysis—is central to ARFFE’s modular architecture. The progressive disclosure of complexity across readiness stages represents our proposed resolution: early-stage users receive simplified, high-level insights, while advanced users access comprehensive multi-dimensional analysis.
5.4. Practical Implications and Policy Recommendations
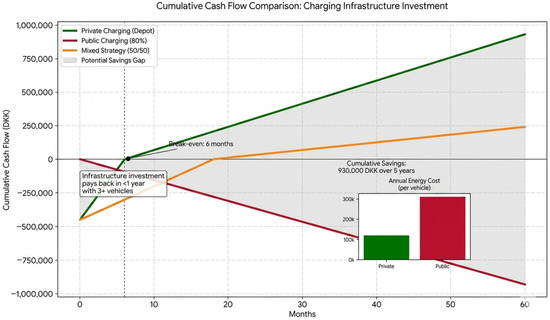
Our analysis establishes charging infrastructure investment as economically essential, not optional. As illustrated below in Figure 9, the 450,000 DKK depot infrastructure investment achieves payback in approximately six months through energy cost savings versus public charging. Companies deferring infrastructure investment to avoid upfront capital find that ongoing public charging costs eliminate the economic case for electrification, with ten-year cost increases of approximately 2,860,000 DKK.
Figure 9.
Five-year cost comparison of charging strategies, illustrating the substantial economic impact of private depot charging versus predominantly public fast charging.
Practical implications include: recognizing infrastructure decisions as simultaneous with vehicle acquisition; including infrastructure costs in initial financial planning; and reconsidering electrification timing if infrastructure investment is impossible.
Policy makers should recognize infrastructure barriers for SMEs and provide targeted support through subsidies, low-interest financing, or shared infrastructure programs.
5.5. Road Tax as Policy Lever
Denmark’s CO2-differentiated road tax creates substantial economic incentive (five-year savings of approximately 430,000–465,000 DKK) equivalent to approximately 15% acquisition subsidy. As an ongoing benefit rewarding high-mileage operations and environmental zone driving, it may prove more effective than one-time acquisition subsidies.
Policy recommendations include maintaining road tax differentials, communicating savings clearly, including road tax in official TCO tools, and considering additional environmental zone incentives.
5.6. Complexity as Adoption Barrier
Our research establishes complexity itself as a primary adoption barrier, distinct from technology immaturity or unfavorable economics. The 50,000+ scenario decision space creates decision paralysis even when underlying conditions are favorable.
Policy interventions addressing information and complexity barriers—providing decision support tools, simplifying administrative processes, offering technical assistance—may accelerate adoption more cost-effectively than equivalent subsidy increases.
5.7. Limitations and Boundary Conditions
ARFFE as presented is a conceptual framework with initial illustration rather than full empirical testing. Technical feasibility of proposed AI functionalities is based on literature review rather than actual system development. User experience and interface design require further development through iterative testing. Integration with existing company systems needs practical testing. Framework effectiveness is theoretically argued but not empirically demonstrated through real-world application.
Boundary conditions define ARFFE applicability: medium to heavy-duty trucks exceeding 7.5 tons; regional distribution operations under 500 km; companies with operational predictability; contexts with charging infrastructure availability or depot investment capacity; and companies willing to engage with digital tools. ARFFE may be less applicable for long-haul transport exceeding 500 km, highly variable ad hoc operations, contexts without infrastructure development, very small operators with under five trucks, or companies with low digital maturity.
Direct transferability to other European markets is limited by several factors: regulatory differences in road taxation (not all European countries operate CO2-differentiated systems), varying subsidy schemes (Germany’s environmental bonus, France’s tax credit, Sweden’s climate bonus), and infrastructure inequalities (Nordic countries have significantly higher charging density per capita than Southern Europe). Furthermore, electricity price structures vary substantially, from Denmark’s relatively low industrial rates to Germany’s higher commercial tariffs, directly affecting TCO calculations. Cross-context application of ARFFE therefore requires systematic recalibration of the economic parameters, while the framework’s structural design—readiness-based modularity and multi-dimensional integration—may remain broadly applicable.
5.8. Future Research Directions
Immediate priorities include multiple case studies with Danish transport companies at different readiness stages, longitudinal observation following companies through readiness progression, interview research with management and operational staff, and quantitative validation of TCO models and route assessments against actual outcomes.
A phased validation plan is envisioned: Phase 1 (months 1–6) involves three exploratory case studies with Danish transport companies at different readiness stages, combining document analysis, management interviews, and framework walk-throughs. Phase 2 (months 6–12) extends to longitudinal observation of 5–8 companies actively using Modules 1–3 of the framework. Phase 3 (months 12–24) targets benchmarking of framework-assisted decisions against unassisted decisions in comparable companies, employing A/B comparison where feasible. Benchmarking metrics include time-to-decision, decision quality (measured by alignment between projected and actual TCO outcomes), and user satisfaction.
Prototype development should proceed through phased implementation beginning with Modules 1 and 2 as web-based tools, progressing to Module 3 with optimization algorithms, adding Module 4 with real-time integration, and completing with Module 5.
Cross-context validation should test ARFFE in other Nordic countries, larger European contexts, and non-European environments. Sector expansion research should explore applicability to buses, construction vehicles, and other sustainability transitions such as building electrification.
Theoretical development should further elaborate AI as mediating technology, explore cognitive dimensions of transition processes, and investigate trade-offs between AI support and organizational learning.
6. Conclusions
6.1. Principal Findings
This research addressed how AI-based systems can effectively support multi-dimensional planning challenges in transitioning from diesel to electric trucks. Our analysis establishes that multi-dimensional complexity spanning technical, economic, operational, and organizational dimensions—with over 50,000 distinct scenarios—represents the primary adoption barrier, creating decision paralysis despite favorable underlying conditions.
Two often-overlooked economic factors have decisive impact: road tax savings of approximately 430,000–465,000 DKK over five years reduce break-even by approximately two years, while charging strategy decisions creating cost differences of approximately 930,000 DKK determine whether electrification is economically viable or prohibitively expensive.
Our four-stage organizational readiness model—Exploring, Investigating, Planning, Implementing—demonstrates that companies at different stages require fundamentally different support. The ARFFE framework’s modular design, with five progressive modules mapped across readiness stages and planning dimensions, provides structured decision support adapted to organizational context.
We propose AI’s role as a mediating technology in socio-technical transitions, reducing cognitive complexity and enabling regime actors to navigate sustainability transitions that would otherwise be cognitively overwhelming.
6.2. Theoretical Implications
Socio-technical transition theory should incorporate cognitive dimensions alongside technical, economic, and institutional factors, with AI’s potential as a transition accelerator through complexity reduction receiving greater attention. Organizational change theory benefits from operationalizing readiness as a design principle for technology systems, while AI and sustainability research should position AI as an enabler of sustainability transitions through complexity reduction and decision support, prioritizing actionability and organizational learning.
6.3. Practical Implications and Recommendations
For transport companies:
- Recognize infrastructure investment as economically essential, not optional, with decisions made simultaneously with vehicle acquisition;
- Treat charging strategy as a strategic economic decision with multi-million DKK implications;
- Employ structured frameworks like ARFFE to manage complexity.
For AI developers:
- Tailor functionality to user capacity and needs through readiness-based adaptation;
- Prioritize transparency and explainability over black-box optimization;
- Enable progressive engagement through modular architecture.
For policy makers:
- Support decision support tool development and dissemination to address complexity barriers;
- Provide infrastructure investment support through subsidies or low-interest financing
- Tailor assistance to different organizational stages through readiness-based support programs
Author Contributions
Conceptualization: C.R. and L.B.I.; Methodology: C.R. and L.B.I.; Formal analysis: C.R. and L.B.I.; Investigation: C.R.; Data curation: C.R. and L.B.I.; Writing—original draft preparation: C.R.; Writing—review and editing: C.R. and L.B.I.; Visualization: C.R.; Framework development: C.R. and L.B.I. All authors have read and agreed to the published version of the manuscript.
Funding
This research received no external funding.
Institutional Review Board Statement
Not applicable.
Informed Consent Statement
Not applicable.
Data Availability Statement
The original contributions presented in this study are included in the article. Further inquiries can be directed to the corresponding authors.
Acknowledgments
We thank the transport industry professionals, AI researchers, and sustainability consultants who provided feedback on the ARFFE framework during its development. We also acknowledge the valuable insights from industry reports and case studies that informed this research.
Conflicts of Interest
The authors declare no conflicts of interest.
Appendix A
Key Assumptions:
Sensitivity ranges are derived from Monte Carlo simulation with 10,000 iterations, varying energy prices (±30%), annual mileage (±25%), subsidy levels (0–50%), and residual values (±20%). Results are presented as median values with interquartile ranges where applicable.
| Parameter | Value | Source/Justification |
| Annual mileage | 80,000 km | Danish sector average [1] |
| Diesel price | 14 DKK/L | Danmarks Nationalbank forecast |
| Electricity (private) | 0.91 DKK/kWh (median) | Danish Energy Agency, 2024 [2] |
| Electricity (public) | 3.00 DKK/kWh | Danish Energy Agency, 2024 [2] |
| Residual value (diesel) | 20% of acquisition | Market survey, 2024 [3] |
| Residual value (electric) | 5% of acquisition | Industry estimates [4,5] |
| WACC | 5% | Midpoint of 4–6% range |
| Vehicle lifetime | 5/10 years | Industry estimates [1] |
| Inflation | 2.5% | Per official forecast |
| Road tax rates | 2025–2029 schedule | Ministry of Taxation [6] |
References
- DTU Transport. Elektrificering af Tung Transport i Danmark: Status og Fremtidsperspektiver; Technical Report; Danmarks Tekniske Universitet: Lyngby, Denmark, 2023. [Google Scholar]
- Energistyrelsen. Analyse af Infrastrukturbehov til Elektrificering af Tung Transport; Technical Report; Energistyrelsen: København, Denmark, 2023.
- International Energy Agency. Global EV Outlook 2023; IEA: Paris, France, 2023. [Google Scholar]
- Dansk Energi. El-og Brint til Fremtidens Vare-og Lastbiler; Dansk Energi: København, Denmark, 2022. [Google Scholar]
- Sørensen, H.; Petersen, A.; Andersen, J. Elektrificering af den Danske Transportsektor: Muligheder og Barrierer; Aarhus Universitet: Aarhus, Denmark, 2022. [Google Scholar]
- Skatteministeriet. Kilometerbaseret Vejafgift for Lastbiler—Dokumentation af Regnemetoder for Provenu, CO2-Reduktion og Samfundsøkonomisk Virkning; Technical Report; Skatteministeriet: København, Denmark, 2024.
- Rehmeier, C.; Iversen, L.B. Ellastbiler: Opladningsstrategien Kan Fordoble Dine Driftsomkostninger. Transport Magasinet. 2024. Available online: https://www.transportmagasinet.dk/ (accessed on 15 January 2025).
- Simon, H.A. Administrative Behavior: A Study of Decision-Making Processes in Administrative Organizations, 4th ed.; Free Press: New York, NY, USA, 1997. [Google Scholar]
- Daugaard, H. AI i Ruteplanlægning: Sådan Transformerer Kunstig Intelligens Transport og Logistik. Contentway. 2023. Available online: https://contentway.eu/da/articles/h-daugaard-ai-ruteplan (accessed on 15 January 2025).
- Madsen, L. AI-Baserede Beslutningsstøttesystemer i Logistik; Aalborg Universitetsforlag: Aalborg, Denmark, 2022. [Google Scholar]
- Dansk Transport og Logistik. Analyse af Omkostninger ved Omstilling til Nulemissionskøretøjer i Vejgodstransporten; DTL: København, Denmark, 2023. [Google Scholar]
- European Commission. Artificial Intelligence Unlocking a Smarter, Greener Energy Future; Publications Office of the European Union: Brussels, Belgium, 2025; Available online: https://digital-strategy.ec.europa.eu/en/library/artificial-intelligence-unlocking-smarter-greener-energy-future (accessed on 15 January 2025).
- Russell, S.; Norvig, P. Artificial Intelligence: A Modern Approach, 4th ed.; Pearson: London, UK, 2020. [Google Scholar]
- Barth, M.; Jugert, P.; Fritsche, I. Still underdetected—Social norms and collective efficacy predict the acceptance of electric vehicles in Germany. Transp. Res. Part F Traffic Psychol. Behav. 2016, 37, 64–77. [Google Scholar] [CrossRef] [Scilit]
- Nielsen, S.; Jensen, K. Modulære AI-systemer til planlægning af transportomstilling. Dan. Tidsskr. Transp. 2023, 18, 112–128. [Google Scholar]
- Weiner, B.J. A theory of organizational readiness for change. Implement. Sci. 2009, 4, 67. [Google Scholar] [CrossRef] [Scilit] [PubMed]
- Holt, D.T.; Armenakis, A.A.; Feild, H.S.; Harris, S.G. Readiness for organizational change: The systematic development of a scale. J. Appl. Behav. Sci. 2007, 43, 232–255. [Google Scholar] [CrossRef] [Scilit]
- Pfoser, S.; Treiblmaier, H.; Schauer, O. Critical success factors of synchromodality: Results from a case study and literature review. Transp. Res. Procedia 2016, 14, 1463–1471. [Google Scholar] [CrossRef] [Scilit]
- Taefi, T.T.; Kreutzfeldt, J.; Held, T.; Jacobsson, N.; Nyquist, C.; Macharis, C.; Vierth, I.; Flodén, J.; Williamsson, J.; Bohne, T.; et al. Comparative analysis of European examples of freight electric vehicles schemes—A systematic case study approach with examples from Denmark, Germany, the Netherlands, Sweden and the UK. In Dynamics in Logistics; Springer: Cham, Switzerland, 2016; pp. 495–504. [Google Scholar] [CrossRef] [Scilit]
- Teoh, T.; Kunze, O.; Teo, C.C.; Wong, Y.D. Decarbonisation of urban freight transport using electric vehicles and opportunity charging. Sustainability 2018, 10, 3258. [Google Scholar] [CrossRef] [Scilit]
- Geels, F.W. Socio-technical transitions to sustainability: A review of criticisms and elaborations of the Multi-Level Perspective. Curr. Opin. Environ. Sustain. 2019, 39, 187–201. [Google Scholar] [CrossRef] [Scilit]
- Kache, F.; Seuring, S. Challenges and opportunities of digital information at the intersection of Big Data Analytics and supply chain management. Int. J. Oper. Prod. Manag. 2017, 37, 10–36. [Google Scholar] [CrossRef] [Scilit]
- Rittel, H.W.J.; Webber, M.M. Dilemmas in a general theory of planning. Policy Sci. 1973, 4, 155–169. [Google Scholar] [CrossRef] [Scilit]
- Klimarådet. Elektrificering af Transporten: Veje til en Grønnere Fremtid; Klimarådet: København, Denmark, 2021. [Google Scholar]
- Teknologisk Institut. Teknologikatalog for Elektrificering af Tung Transport; Teknologisk Institut: Taastrup, Denmark, 2023. [Google Scholar]
- Zhao, Y.; Noori, M.; Tatari, O. Vehicle to grid regulation services of electric delivery trucks: Economic and environmental benefit analysis. Appl. Energy 2016, 170, 161–175. [Google Scholar] [CrossRef] [Scilit]
- Mareev, I.; Becker, J.; Sauer, D.U. Battery dimensioning and life cycle costs analysis for a heavy-duty truck considering the requirements of long-haul transportation. Energies 2018, 11, 55. [Google Scholar] [CrossRef] [Scilit]
- Vepsäläinen, J.; Kivekäs, K.; Otto, K.; Lajunen, A.; Tammi, K. Development and validation of energy demand uncertainty model for electric city buses. Transp. Res. Part D Transp. Environ. 2018, 63, 347–361. [Google Scholar] [CrossRef] [Scilit]
- Jefferies, D.; Göhlich, D. A comprehensive TCO evaluation method for electric bus systems based on discrete-event simulation including bus scheduling and charging infrastructure optimisation. World Electr. Veh. J. 2020, 11, 56. [Google Scholar] [CrossRef] [Scilit]
- Franke, T.; Neumann, I.; Bühler, F.; Cocron, P.; Krems, J.F. Experiencing range in an electric vehicle: Understanding psychological barriers. Appl. Psychol. 2012, 61, 368–391. [Google Scholar] [CrossRef] [Scilit]
- Nykvist, B.; Olsson, O. The feasibility of heavy battery electric trucks. Joule 2021, 5, 901–913. [Google Scholar] [CrossRef] [Scilit]
- Liimatainen, H.; van Vliet, O.; Aplyn, D. The potential of electric trucks—An international commodity-level analysis. Appl. Energy 2019, 236, 804–814. [Google Scholar] [CrossRef] [Scilit]
- Pelletier, S.; Jabali, O.; Laporte, G. Goods distribution with electric vehicles: Review and research perspectives. Transp. Sci. 2016, 50, 3–22. [Google Scholar] [CrossRef] [Scilit]
- European Commission. Alternative Fuels Infrastructure Regulation; European Commission: Brussels, Belgium, 2022. [Google Scholar]
- Bakker, S.; Maat, K.; van Wee, B. Stakeholders interests, expectations, and strategies regarding the development and implementation of electric vehicles: The case of the Netherlands. Transp. Res. Part A Policy Pract. 2014, 66, 52–64. [Google Scholar] [CrossRef] [Scilit]
- Hardman, S.; Jenn, A.; Tal, G.; Axsen, J.; Beard, G.; Daina, N.; Figenbaum, E.; Jakobsson, N.; Jochem, P.; Kinnear, N.; et al. A review of consumer preferences of and interactions with electric vehicle charging infrastructure. Transp. Res. Part D Transp. Environ. 2018, 62, 508–523. [Google Scholar] [CrossRef] [Scilit]
- Taefi, T.T.; Stütz, S.; Fink, A. Assessing the cost-optimal mileage of medium-duty electric vehicles with a numeric simulation approach. Transp. Res. Part D Transp. Environ. 2017, 56, 271–285. [Google Scholar] [CrossRef] [Scilit]
- Rauh, N.; Franke, T.; Krems, J.F. Understanding the impact of electric vehicle driving experience on range anxiety. Hum. Factors 2015, 57, 177–187. [Google Scholar] [CrossRef] [Scilit] [PubMed]
- Lebeau, K.; Van Mierlo, J.; Lebeau, P.; Mairesse, O.; Macharis, C. The market potential for plug-in hybrid and battery electric vehicles in Flanders: A choice-based conjoint analysis. Transp. Res. Part D Transp. Environ. 2012, 17, 592–597. [Google Scholar] [CrossRef] [Scilit]
- Ghaderi, H.; Dullaert, W.; Amstel, W.P.V. Reducing lead-times and lead-time variance in cooperative distribution networks. Int. J. Shipp. Transp. Logist. 2016, 8, 51–65. [Google Scholar] [CrossRef] [Scilit]
- Transportministeriet. Handlingsplan for Grøn Omstilling af Vejtransport; Transportministeriet: København, Denmark, 2022.
- Energinet. System Perspective 2035; Energinet: Fredericia, Denmark, 2023. [Google Scholar]
- Regeringen. Klimaplan for en Grøn Affaldssektor og Cirkulær Økonomi; Regeringen: København, Denmark, 2020. [Google Scholar]
- Bektaş, T.; Laporte, G. The pollution-routing problem. Transp. Res. Part B Methodol. 2011, 45, 1232–1250. [Google Scholar] [CrossRef] [Scilit]
- Demir, E.; Bektaş, T.; Laporte, G. A review of recent research on green road freight transportation. Eur. J. Oper. Res. 2014, 237, 775–793. [Google Scholar] [CrossRef] [Scilit]


Disclaimer/Publisher’s Note: The statements, opinions and data contained in all publications are solely those of the individual author(s) and contributor(s) and not of MDPI and/or the editor(s). MDPI and/or the editor(s) disclaim responsibility for any injury to people or property resulting from any ideas, methods, instructions or products referred to in the content. |
© 2026 by the authors. Licensee MDPI, Basel, Switzerland. This article is an open access article distributed under the terms and conditions of the Creative Commons Attribution (CC BY) license.