


Abstract
Thermal properties, such as thermal conductivity (λ) and heat capacity (Cv), are important in understanding heat transport and the urban heat island (UHI) effect. While many studies focus on surface materials rather than roadbed materials, this study targeted roadbed materials using recycled concrete aggregates mixed with autoclaved aerated concrete (AAC) grains to experimentally measure and to predict the λ and Cv under varied moisture conditions. The results showed that both λ and Cv of all tested samples increased linearly with increasing volumetric water content (θ), and the increment of AAC was effective in reducing the λ values in the whole range of θ. The addition of AAC, on the other hand, did not affect the measured Cv significantly and gave a linear increase in Cv with the increase in θ. The performance of predictive models showed that Archie’s-second-law-based model captured the measured λ values for all tested samples well by modifying the saturation exponent (n = 0.7), and the classic de Vries model predicted the measured Cv well, suggesting that Archie’s-second-law-based model would be useful to evaluate heat transport parameters for roadbed materials in this study.
1. Introduction
In Vietnam, urban heat island (UHI) areas are expanding rapidly as a consequence of urbanization, especially in large cities such as Hanoi and Ho Chi Minh. Long-term observations and satellite-based analyses have consistently reported increasing trends in urban air and surface temperatures, together with the spatial expansion of UHI-affected areas (e.g., [1,2,3,4,5]). For example, in Hanoi, Vietnam, the average annual air temperature recorded at the Lang station (located in an urban area) from 1980 to 2010 showed an increase of about 1.5 °C [6], while less urbanized cities such as Da Nang City, Vietnam, also reported an increase of 4 °C in the nearly two decades from 1990 to 2009 [7]. The UHI effect has caused various serious problems [8,9]. In Ho Chi Minh City, Vietnam, it is reported that the number of mortalities resulting from the UHI effect accounted for 30% of the total mortalities resulting from heat [10].
The urban energy balance plays an important role in developing technologies for reducing UHI effects (e.g., [11,12,13,14]). For example, reducing the fraction of energy partitioned into latent heat flux might lead to exacerbating heating, indicating that UHI mitigation technologies could aim to improve the water retention capacity of the materials used [14]. In surface energy balance models, the ground heat flux component is governed by the thermal conductivity (λ), while the source/sink term in the heat balance equation is governed by the volumetric heat capacity (Cv). In general, mitigation strategies should either increase effective albedo, increase latent heat flux processes, and/or reduce anthropogenic heating of the urban environment [15,16]. Specifically, for road structures, actions to mitigate the UHI effect have focused on using finishing surface materials such as reflective pavements (i.e., to increase albedo; e.g., [17,18,19,20]) and water-retentive materials (i.e., to enhance the latent heat flux; e.g., [21,22,23]) for the surface layer. These approaches have demonstrated measurable reductions in road surface temperature under field conditions. However, comprehensive evaluation of the effectiveness of a permeable pavement system in mitigating UHI effects requires more than merely observing the road surface temperature, but also the knowledge of thermal properties, such as thermal conductivity (λ) and volumetric heat capacity (Cv), as well.
For soils and sands, established thermal conductivity models, such as those of Woodside and Messmer [24] and de Vries [25], along with volumetric heat capacity models, such as de Vries [25] and Farouki [26], are well documented. Concerning roadbed materials, one of the established thermal conductivity models is the Cote–Konrad thermal conductivity model [27], specifically devised for gravels. However, this model has been shown to overestimate the thermal conductivity of roadbed materials that include recycled concrete aggregates (RCAs) [28]. Thai et al. [28] conducted a set of thermal property measurements of RCAs and autoclaved aerated concrete (AAC) in the laboratory. Then, using a combination of Cote–Konrad [27], Johansen [29], and geometric mean thermal conductivity models, they developed a predictive model referred to as the J-CK-GM model for the thermal conductivity of these materials. This model involves a model parameter (denoted by κ, representing the material-type effect) that was highly correlated with the coefficient of uniformity (Cu) after compaction. It is noted that this model requires a hard-measurable parameter (Cu after compaction). For many cases that require the simultaneous integration of models of various properties (e.g., for the coupled liquid water, vapor, and heat transport problems [30]), the unified model concept is more easily applicable.
The above literature survey identified that important knowledge gaps are still present in the following areas: (i) the approach of incorporating a water-retentive base/subbase material to potentially increase the UHI effect mitigation (i.e., through latent heat flux processes) rarely appears compared to that for the finishing surface materials, and (ii) the applicability of predictive thermal conductivity models for roadbed materials has yet to be examined and well documented. For the aforementioned reasons, to further improve latent heat flux processes (i.e., by increasing water retention capacity), highly water-retentive material (i.e., AAC) mixed with RCA for a roadbed material was used. The research work conducted includes the following: (i) laboratory measurement of λ and Cv under controlled moisture conditions; and (ii) evaluation of existing models for λ and Cv.
2. Materials and Methods
At present, there are great efforts focused on developing a unified model concept (e.g., [31,32]). Hamamoto et al. [32] expanded the Archie’s-second-law approach, formulating a modified unified model for diffusive transport properties, such as gas and solute diffusivity and electrical and thermal conductivity, which was subsequently tested against various soil and sand types but has yet to be performed for coarse roadbed materials, such as RCA and AAC. In this study, therefore, the applicability of Archie’s-law is extended to the thermal conductivity for these coarse aggregates. This model is based on the principle of normalized thermal conductivity, employing a single model parameter known as the saturation exponent (n); hence, it can also be more easily applied to a simulation. For thermal conductivity, the selected models encompass the modified Archie’s second law [32], primarily due to its simple applicability; the J-CK-GM model [28], specifically because it was developed for RCA and AAC; and well-known models, including those of Woodside and Messmer [24] and de Vries [25]. For volumetric heat capacity, the selected models include the well-known de Vries [25] and Farouki [26] models, and the recently developed Dissanayaka et al. [33] models. The details of the expressions of the selected models used in this study are presented below.
2.1. Existing Thermal Conductivity Models
2.1.1. Woodside and Messmer Model
The Woodside and Messmer model [24], using the geometric mean model for three phases (i.e., solid, water, and air), can be determined as:
where λs, λw, and λa are the thermal conductivities of the solid, water, and air phases, respectively, and Sr (%) is the degree of saturation. In this study, a λw of 0.59 W/m/K and a λa of 0.024 W/m/K [25] were used. Based on the measured thermal conductivity of samples of RCA100%, AAC100%, and NA100%, the corresponding λs are 2.63, 1.51, and 3.66 W/m/K. These λs values were obtained by using the measured data of RCA100%, AAC100%, and NA100% at full saturation (λsat). At saturation [i.e., Sr = 100 (%)], Equation (1) becomes:
For the samples of RCA mixed with AAC, the thermal conductivity of the solid phase is defined as [28]:
where λs1 and λs2 are the thermal conductivities of the solid phase of RCA and AAC, respectively; f (%) is the % AAC mixing proportion.
2.1.2. de Vries Model
The thermal conductivity model proposed by de Vries [25] considers the volumetric fractions of each phase (i.e., solid, water, and air) and the weighting factors that depend on the thermal conductivity of each phase as follows:
where θ, σ, and ε (cm3/cm3) are the volumetric fractions of the water, solid, and air phases, respectively. The ks and ka are the weighting factors for the geometric shape factor and the orientation of solid particles and air pores.
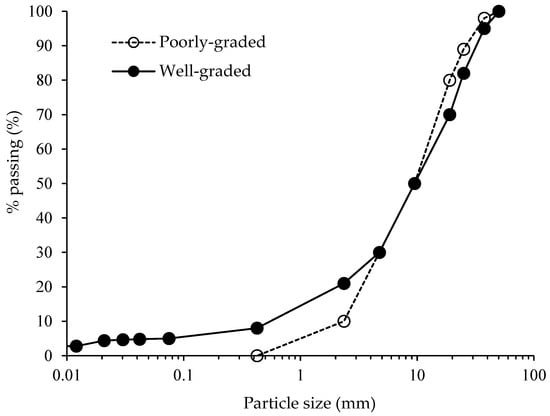
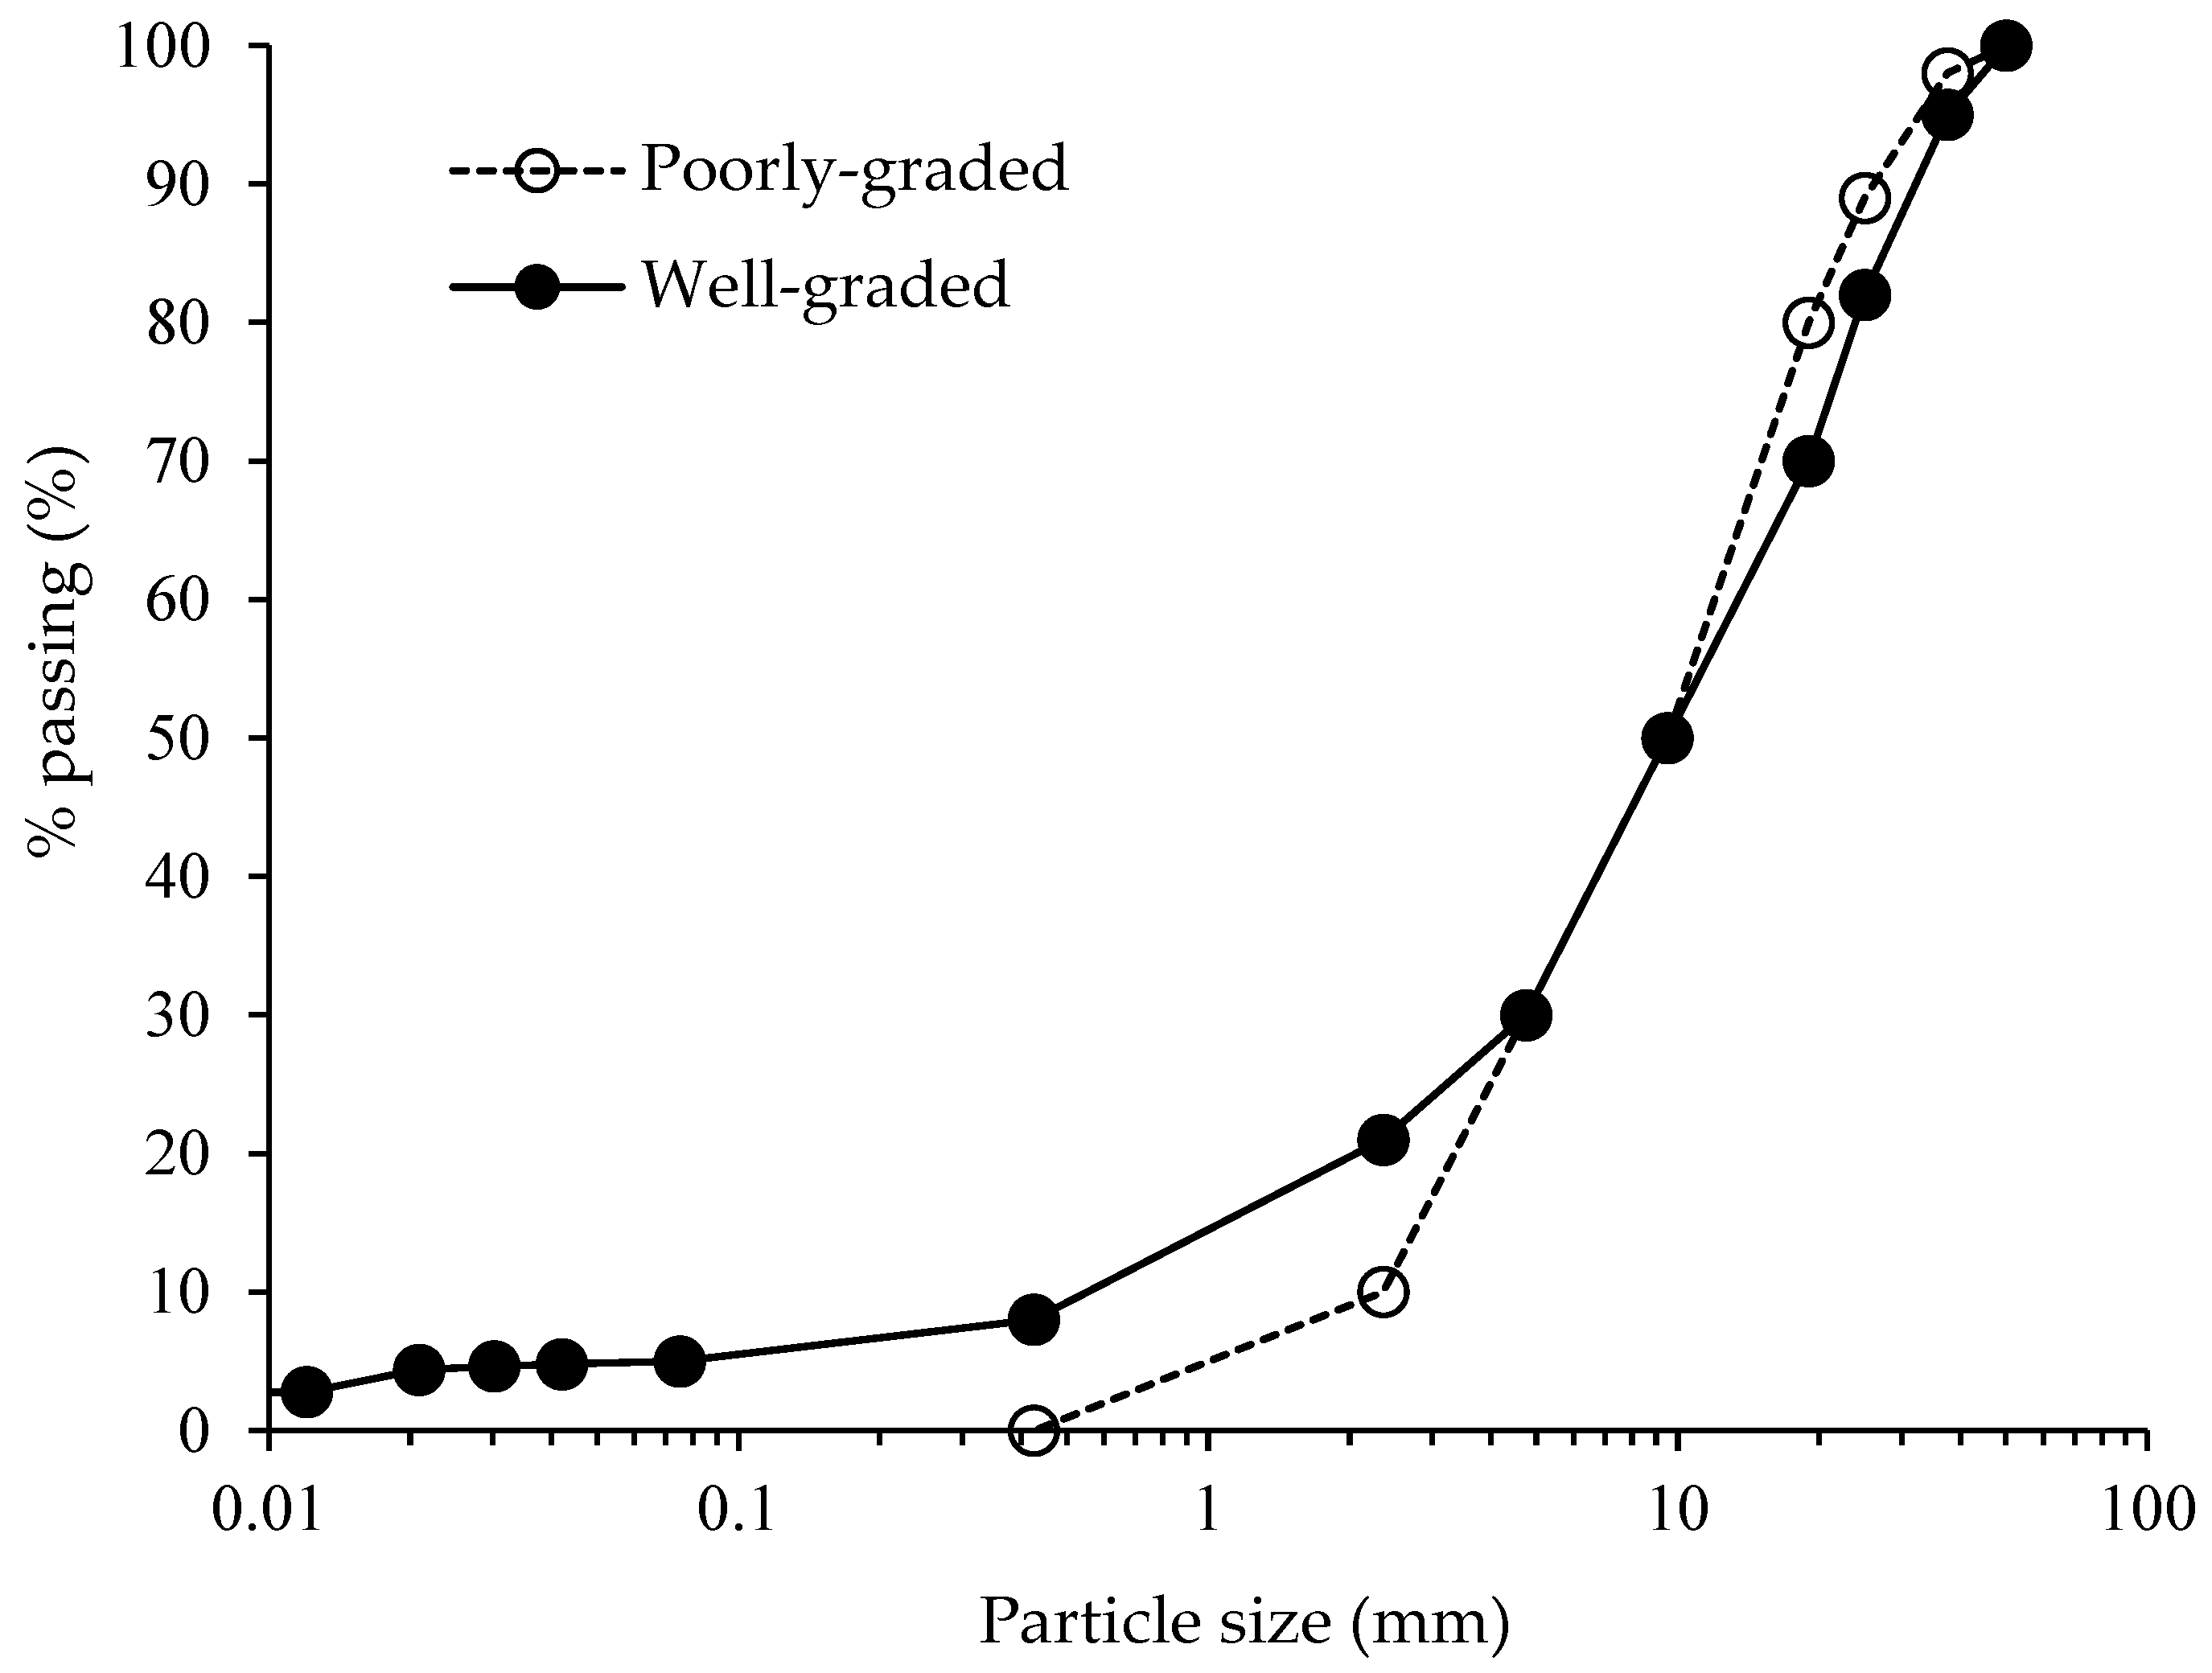
In this study, based on the PSD used (see Figure 1), it can be assumed that because the roadbed materials contained mainly sand particles (i.e., particle sizes of >0.075 mm), the geometric shape factors were set at ga = 0.125, gb = 0.125, and gc = 0.75 [34].
Figure 1.
Particle size distribution of tested samples.
2.1.3. J-CK-GM Models
Thai et al. [28] developed a thermal conductivity model for roadbed materials (RCA, recycled clay brick, and AAC) using the combination of Cote–Konrad [27], Johansen [29], and geometric mean thermal conductivity models (the J-CK-GM model). The J-CK-GM thermal conductivity model is as follows:
where λs1 and λs2 are described in Equation (1) and σ (cm3/cm3) is the volumetric solid content. The model parameter denoted by κ, representing the material-type effect, which was correlated with the coefficient of uniformity (Cu) after compaction, κ = 0.73 log(Cu)−0.67 [28].
2.1.4. Modified Archie’s-Law-Based Model
Hamamoto et al. [32] used the Archie’s-second-law approach, incorporating the percolation threshold of the transport parameter (i.e., percolation threshold for θ) to yield a modified thermal conductivity model, which subsequently well described the thermal conductivity of various soils and sand. The general modified thermal conductivity model after incorporating the percolation threshold for a bulk parameter (i.e., percolation threshold for λ) can be written as:
where n is the saturation exponent, λ and λsat are the thermal conductivity in water unsaturated and saturated conditions, respectively, while θ and θsat are the corresponding water contents; λth and θth are the percolation thresholds of thermal conductivity and volumetric water content, respectively. Thai et al. [28] examined the roadbed materials (i.e., RCA and AAC) and suggested using the λ and θ in the air-dried condition as the percolation threshold. In this study, the λth and θth values were employed at the air-dried condition.
2.2. Existing Volumetric Heat Capacity Models
2.2.1. de Vries Model
de Vries [25] proposed a predictive heat capacity model based on its different constituents (i.e., soil particles, soil water, soil air, and organic matter). The roadbed materials used in this study are assumed to contain no organic matter; hence, the general equation in such a case can be written as [35]:
where ρd (g/cm3) is the dry density of the soil, w (%) is the mass water content of the soil, and Cw and Cs (J/g/K) are the specific heat capacities of the water and dry materials used. In this study, the value of Cw of 4.18 J/g/K [25] was used. Since there was not much difference in the Cs of the samples used (in the range of 0.70–0.89 J/g/K), the average value of 0.79 J/g/K was taken for ease of interpretation.
2.2.2. Farouki Model
Farouki [26] proposed a function to estimate the volumetric heat capacity of unfrozen soil as follows:
2.2.3. Dissanayaka Model
Dissanayaka et al. [33] developed a simple volumetric heat capacity for peat soil, taking into account a parameter called the impedance factor, which represents the liquid-phase tortuosity for Cv as:
where Cv,AD is the volumetric water content at air-dried condition, and fc is the impedance factor. Dissanayaka et al. [33] suggested that Cv,AD = 2.5σ and fc = 0.88; hence, the above equation became
2.3. Thermal Conductivity in the Air-Dried Condition
There have been several empirical thermal conductivity functions proposed for the thermal conductivity in the dry condition (e.g., oven-dried condition) of soil and/or sand. In this study, these proposed functions were employed to test and estimate the thermal conductivity of roadbed materials in the air-dried condition (λAD).
2.3.1. Johansen Model
Johansen [29] proposed a function to estimate the thermal conductivity under the dry condition. This function was used to estimate the λAD in this study as follows:
where ρs is the particle density (specific gravity), and wet ρs equals 2.65 as an average value based on the ρs of the RCA and the RCA–AAC mixed samples.
2.3.2. Cote and Konrad Model
Cote and Konrad [27] proposed a generalized exponential relationship to estimate the thermal conductivity under the dry condition. In this study, this proposed equation was employed to estimate the λAD as follows:
where χ (W/m/K) and η are material parameters accounting for the particle shape, and Φ (cm3/cm3) is the total porosity. χ = 1.7 W/m/K and η = 1.8 for crushed rocks, χ = 0.75 W/m/K and η = 1.2 for natural mineral soils, and χ = 0.3 W/m/K and η = 1.8 for organic fibrous soil (peat). In this study, χ = 1.7 W/m/K and η = 1.8 were used for roadbed materials.
2.3.3. Lu Model
Lu et al. [36] introduced a simple linear function for the thermal conductivity of mineral soil in the dry condition. Their proposed equation was used for estimating the λAD as follows:
2.4. Volumetric Heat Capacity in the Air-Dried Condition
The volumetric heat capacity in the dry condition is frequently plotted as a function of the volumetric solid content (σ), such as that in de Vries [25]. In this study, we applied the proposed equations for estimating the volumetric heat capacity in the air-dried condition (Cv,AD). In addition, an equation proposed by Thai et al. [28] for estimating the Cv,AD of roadbed materials was selected. The equations proposed by de Vries [25] and Thai et al. [28] are as follows:
2.5. Preparation of the Samples
Waste concrete was taken from construction and demolition waste dumping sites in Hanoi, Vietnam, and scrap AAC was collected from Viglacera Corp. in Hanoi, Bac Ninh Province, Vietnam. First, the raw materials of recycled concrete block and AAC scrap were crushed, then AAC grains were mixed with the RCA with % substitution on the mass basis (f) varying from 0% to 50%, namely, RCA100%, RCA95% + AAC5%, RCA90% + AAC10%, RCA70% + AAC30%, and RCA50% + AAC50% were prepared for the laboratory tests. The natural aggregates (NAs) were used as a reference material.
The samples were prepared to have two different initial moisture contents [i.e., at optimum moisture content, represented by the degree of saturation, Sr (%) = 80–90% for well-graded and 60–70% for poorly-graded; and air-dried conditions, Sr < 15% for well-graded and <10% for poorly-graded]; however, preliminary tests showed that the thermal properties were not affected much by the initial water content in the compaction test.
The particle size distributions (PSDs) for the tested samples are given in Figure 1. It is noted that, in this study, the AAC grains were fully substituted for the RCA on a mass basis (i.e., the initial PSD was kept unchanged). A well-graded material has a wide range of particle sizes (by adding a certain percent of fines), which ensures minimal void spaces between particles when compacted. A poorly-graded material, on the other hand, has particles that are either predominantly of one size (uniformly graded) or missing key particle sizes in the PSD (gap-graded). In this study, both well-graded and poorly-graded particles were used. From the viewpoint of bearing capacity requirements for roadbed materials, a maximum AAC mixing proportion of 30% can be considered based on experimental observation [37]. The basic physical properties of the materials used to produce various mixtures tested in this study are summarized in Table 1.
Table 1.
Basic physical properties of RCA, AAC, and NA materials tested in this study (after Pham et al. [37]).
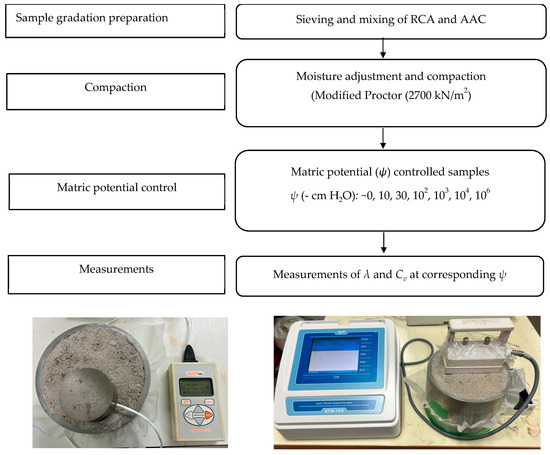
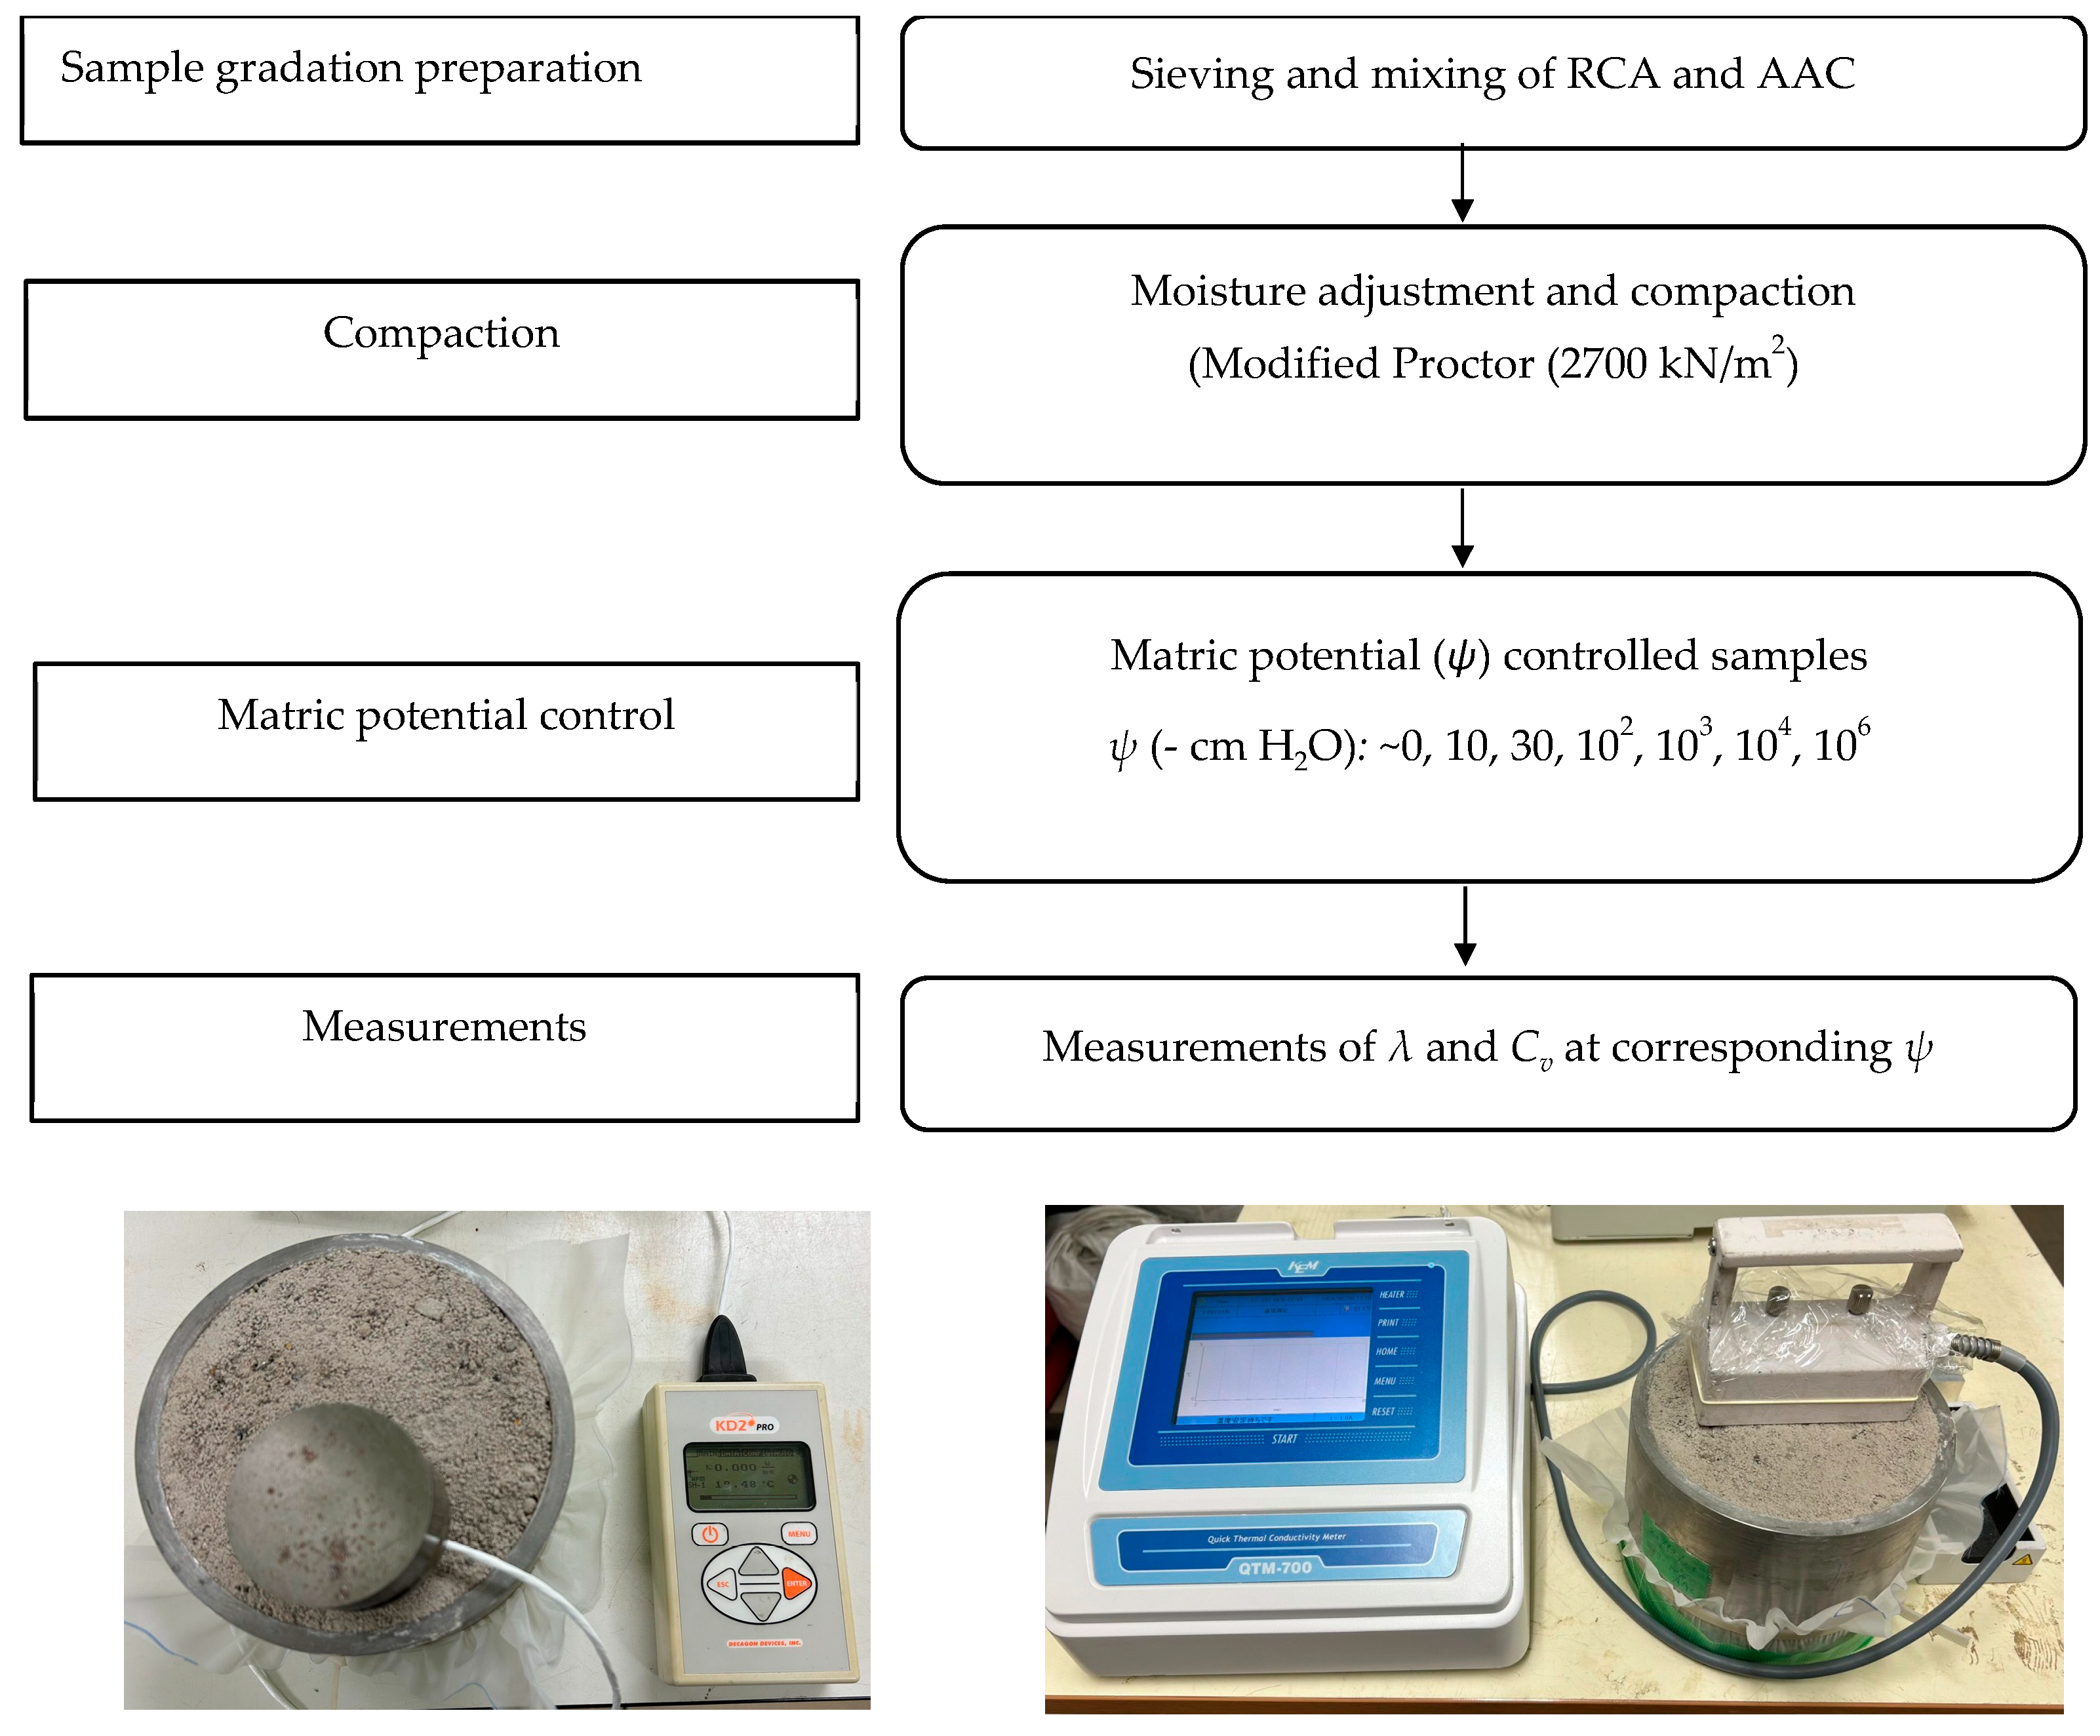
In this study, two typical PSDs, well-graded and poorly-graded, were adopted because, in practical terms, the roadbed materials used are often either well-graded or poorly-graded, depending on the design target (e.g., structural and hydrological performances). The samples were mixed at the pre-determined fractions and compacted in a cylindrical mold (inner diameter of 15 cm and height of 12 cm). Five layers in each sample were compacted using a rammer with a weight of 4.54 kg, falling from a height of 457 mm. After compaction, the prepared samples were fully water-saturated under the capillary saturation condition for at least one week. Then the samples were subjected to desaturation at desired matric water potentials (ψ, -cm H2O) to simulate the main drying process. This was accomplished using a combination of a hanging water method (at |ψ| = 10, 30 cm H2O), a pressure plate method (at |ψ| = 102, 103, 104 cm H2O), and a dewpoint potentiometer (at |ψ| ~ 106 cm H2O). At each desired |ψ|, the corresponding volumetric water content (θ, cm3/cm3) was determined based on the residual mass of the sample; the thermal conductivity (λ) and the volumetric heat capacity (Cv) were simultaneously measured. The experimental procedure is illustrated in Figure 2.
Figure 2.
Flow chart of sample preparation, treatment, and measurement of λ and Cv. Photographs of λ measurement using QTM-700 (left), and of λ and Cv using KD2 Pro (right).
2.6. Measurements of Thermal Conductivity and Volumetric Heat Capacity
In this study, two methods were used to measure the thermal properties, that is, a heat pulse needle probe method, using the KD2 Pro Thermal Analyzer (Decagon Devices, Pullman, WA, USA), and a hot-wire method, using the QTM-700 (Kyoto Electronics Manufacturing Co., Ltd., Kyoto, Japan). The needle probe method, using a KD2 Pro Thermal Analyzer together with the dual needle-sensor (SH-1), simultaneously measured the λ and Cv, while the hot-wire method using QTM-700 only measured the λ. These two methods have successfully been used to measure the thermal properties of roadbed materials (i.e., RCA and AAC) [28].
During the compaction process, the top surface of the samples was meticulously leveled to ensure a flat finish, enabling optimal contact with the probe for measurements using the QTM-700. For QTM-700 measurements, at least five repeated measurements were conducted at each desired |ψ|, ensuring that the probe was evenly distributed across the sample surface. For measurements using the KD2 Pro, the measuring position was carefully pre-assessed and aligned after the final layer of compaction to allow for the proper insertion of the dual-needle sensor. Measurements were then performed at a minimum of three different positions on the sample surface at each desired |ψ|. The values of λ and Cv at each desired |ψ| were calculated as the average of the recorded measurements.
3. Results and Discussion
3.1. Measured Thermal Conductivity
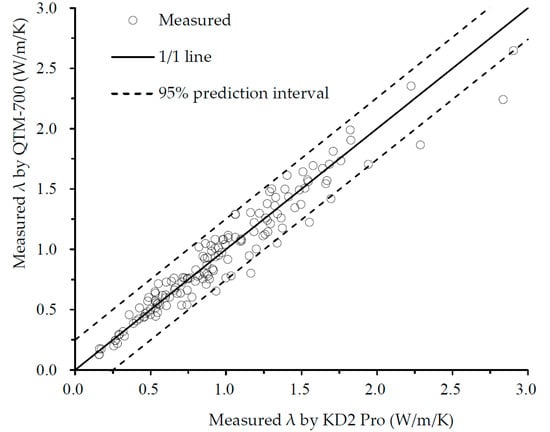
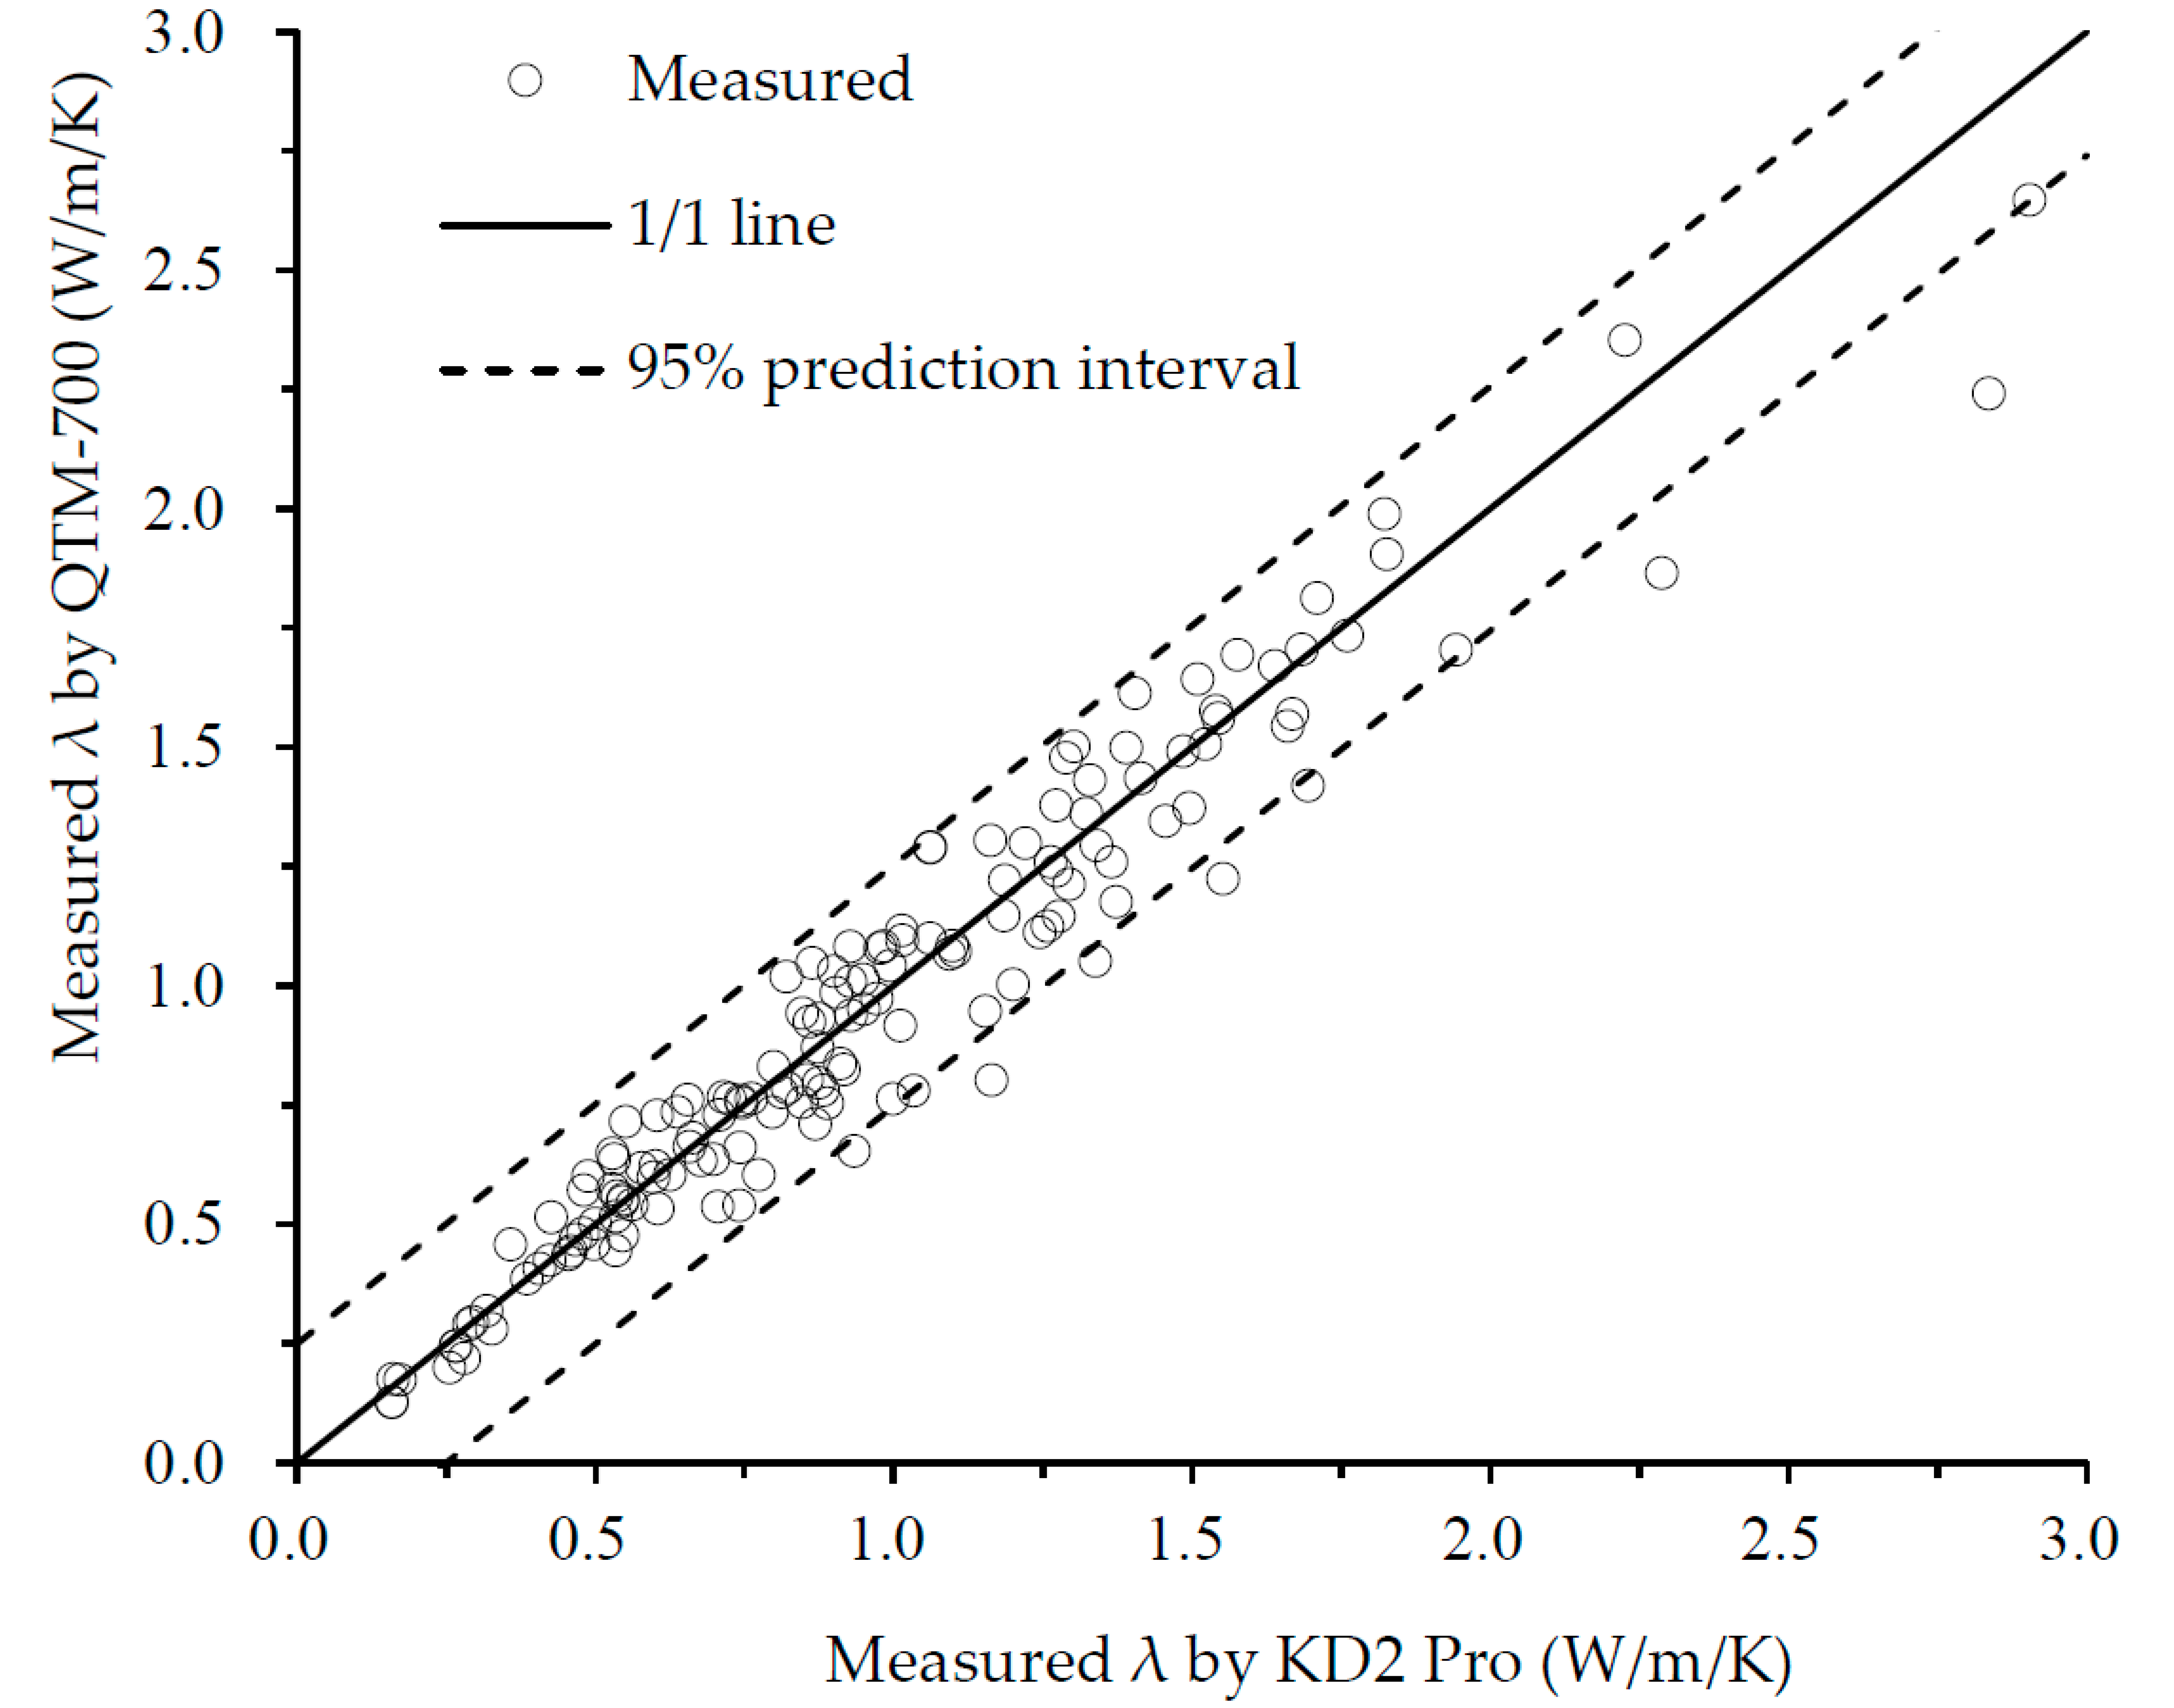
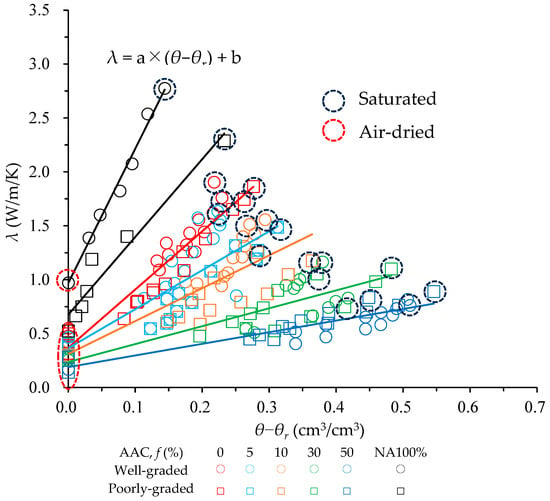
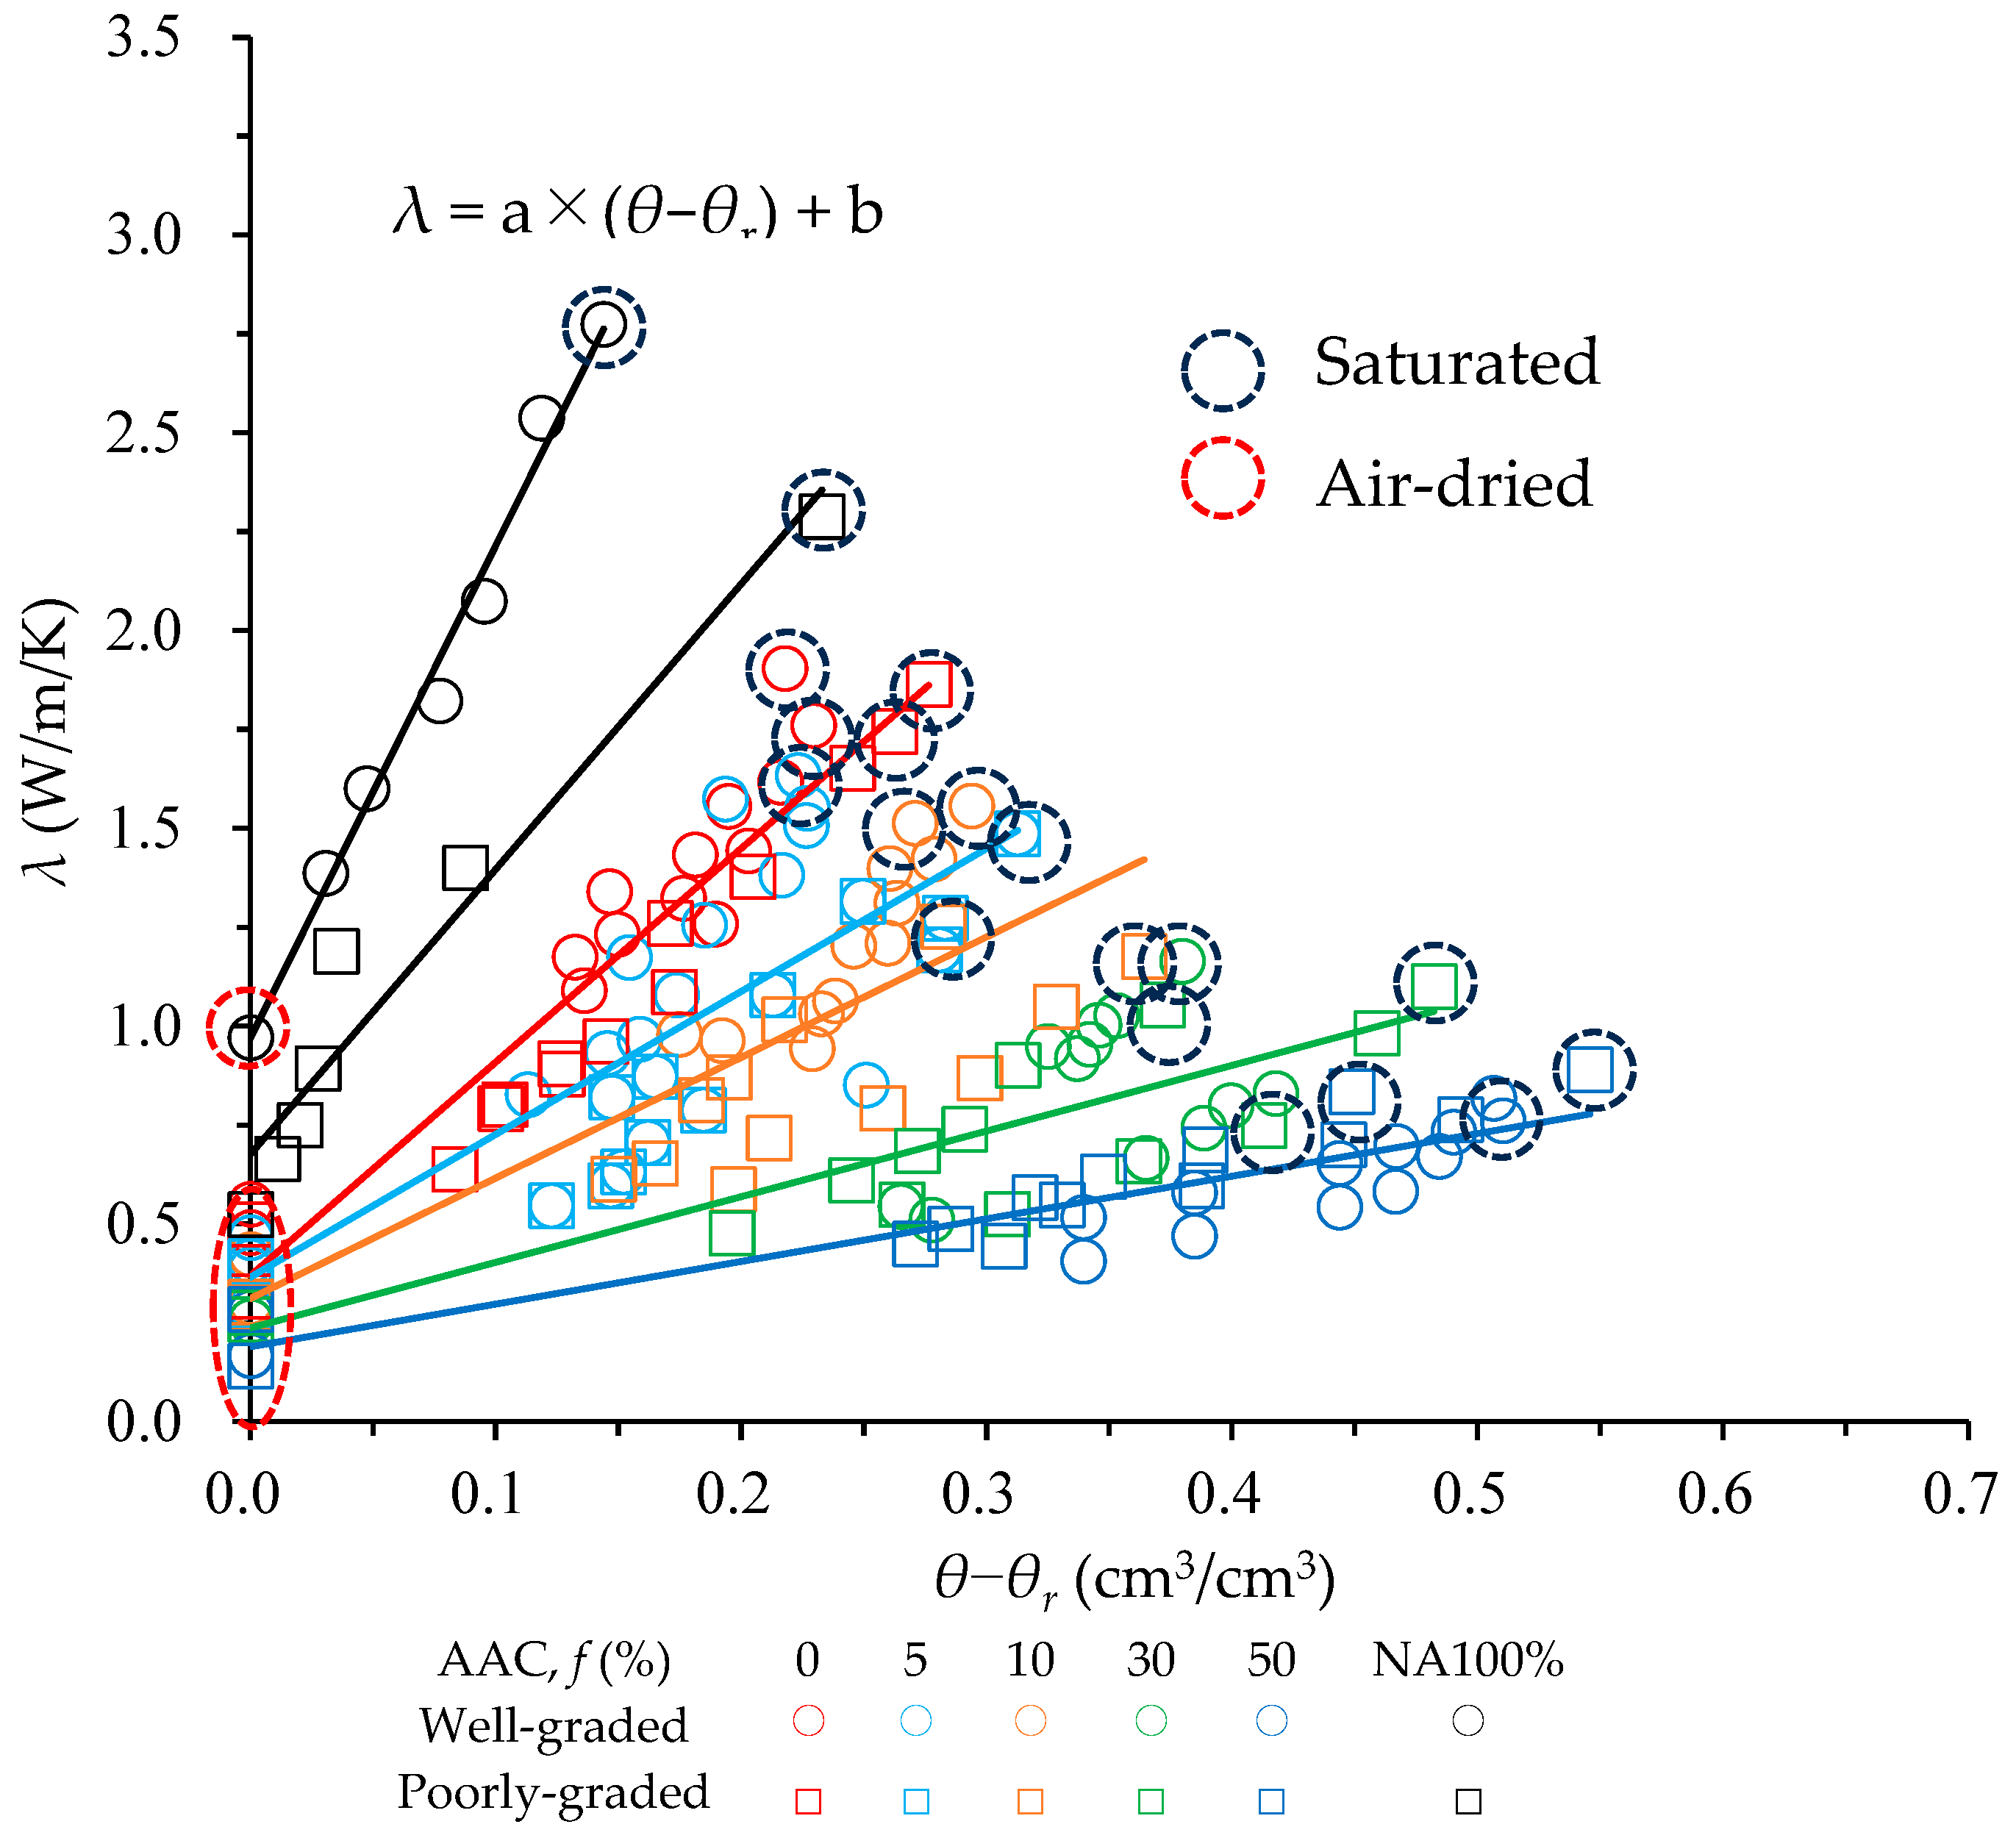
First of all, the thermal conductivity values were verified by cross-checking the results obtained by the above-mentioned two methods. In Figure 3, those measured by the heat pulse needle were plotted against those by the hot-wire method. It was observed that most of the scatterplot points fell within the 95% confidence intervals, ensuring a high reliability of the measured λ values. The measured λ was then plotted as a function of θ − θr, as shown in Figure 4. The coefficients of the best-fit functions are summarized in Table 2. In this figure, the linear trendline was fitted for each sample used. Overall, the measured thermal conductivity was highly correlated to the volumetric water content (r2 in the range of 0.66 to 0.99). Regardless of the type of PSD used, the measured λ linearly increased with increasing θ − θr but depended highly on the % AAC mixing proportion (f). At the same θ − θr, the lower f exhibited a higher λ (higher slope, represented by the fitting parameter a). Thai et al. [28] also reported a similar observation. The sample of NA100% showed the highest λ at the same θ − θr. Having a closer look at this figure, the λ decreased with increasing f (represented by the intercept b) in the air-dried condition (i.e., at θ − θr = 0).
Figure 3.
Comparison of measured thermal conductivity (λ) by two different methods.
Figure 4.
Measured thermal conductivity (λ) as a function of θ − θr.
Table 2.
Summary of the regression coefficients of the linear relationship between the thermal conductivity l and effective water content q − qr.
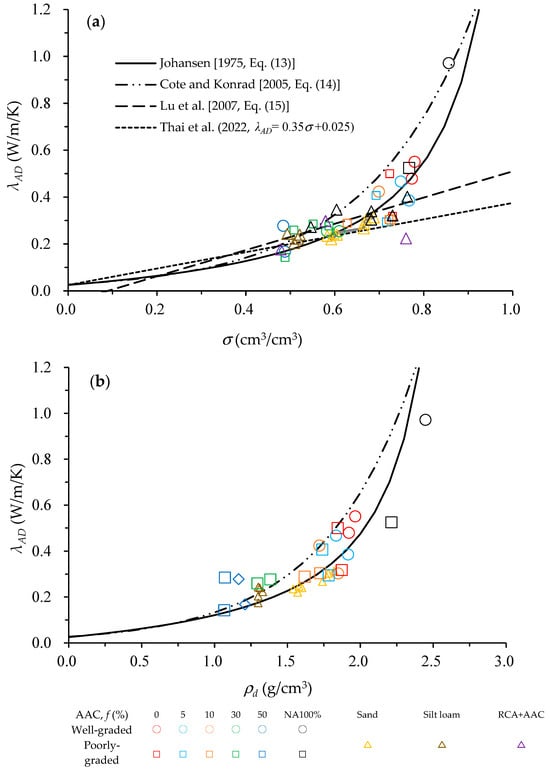
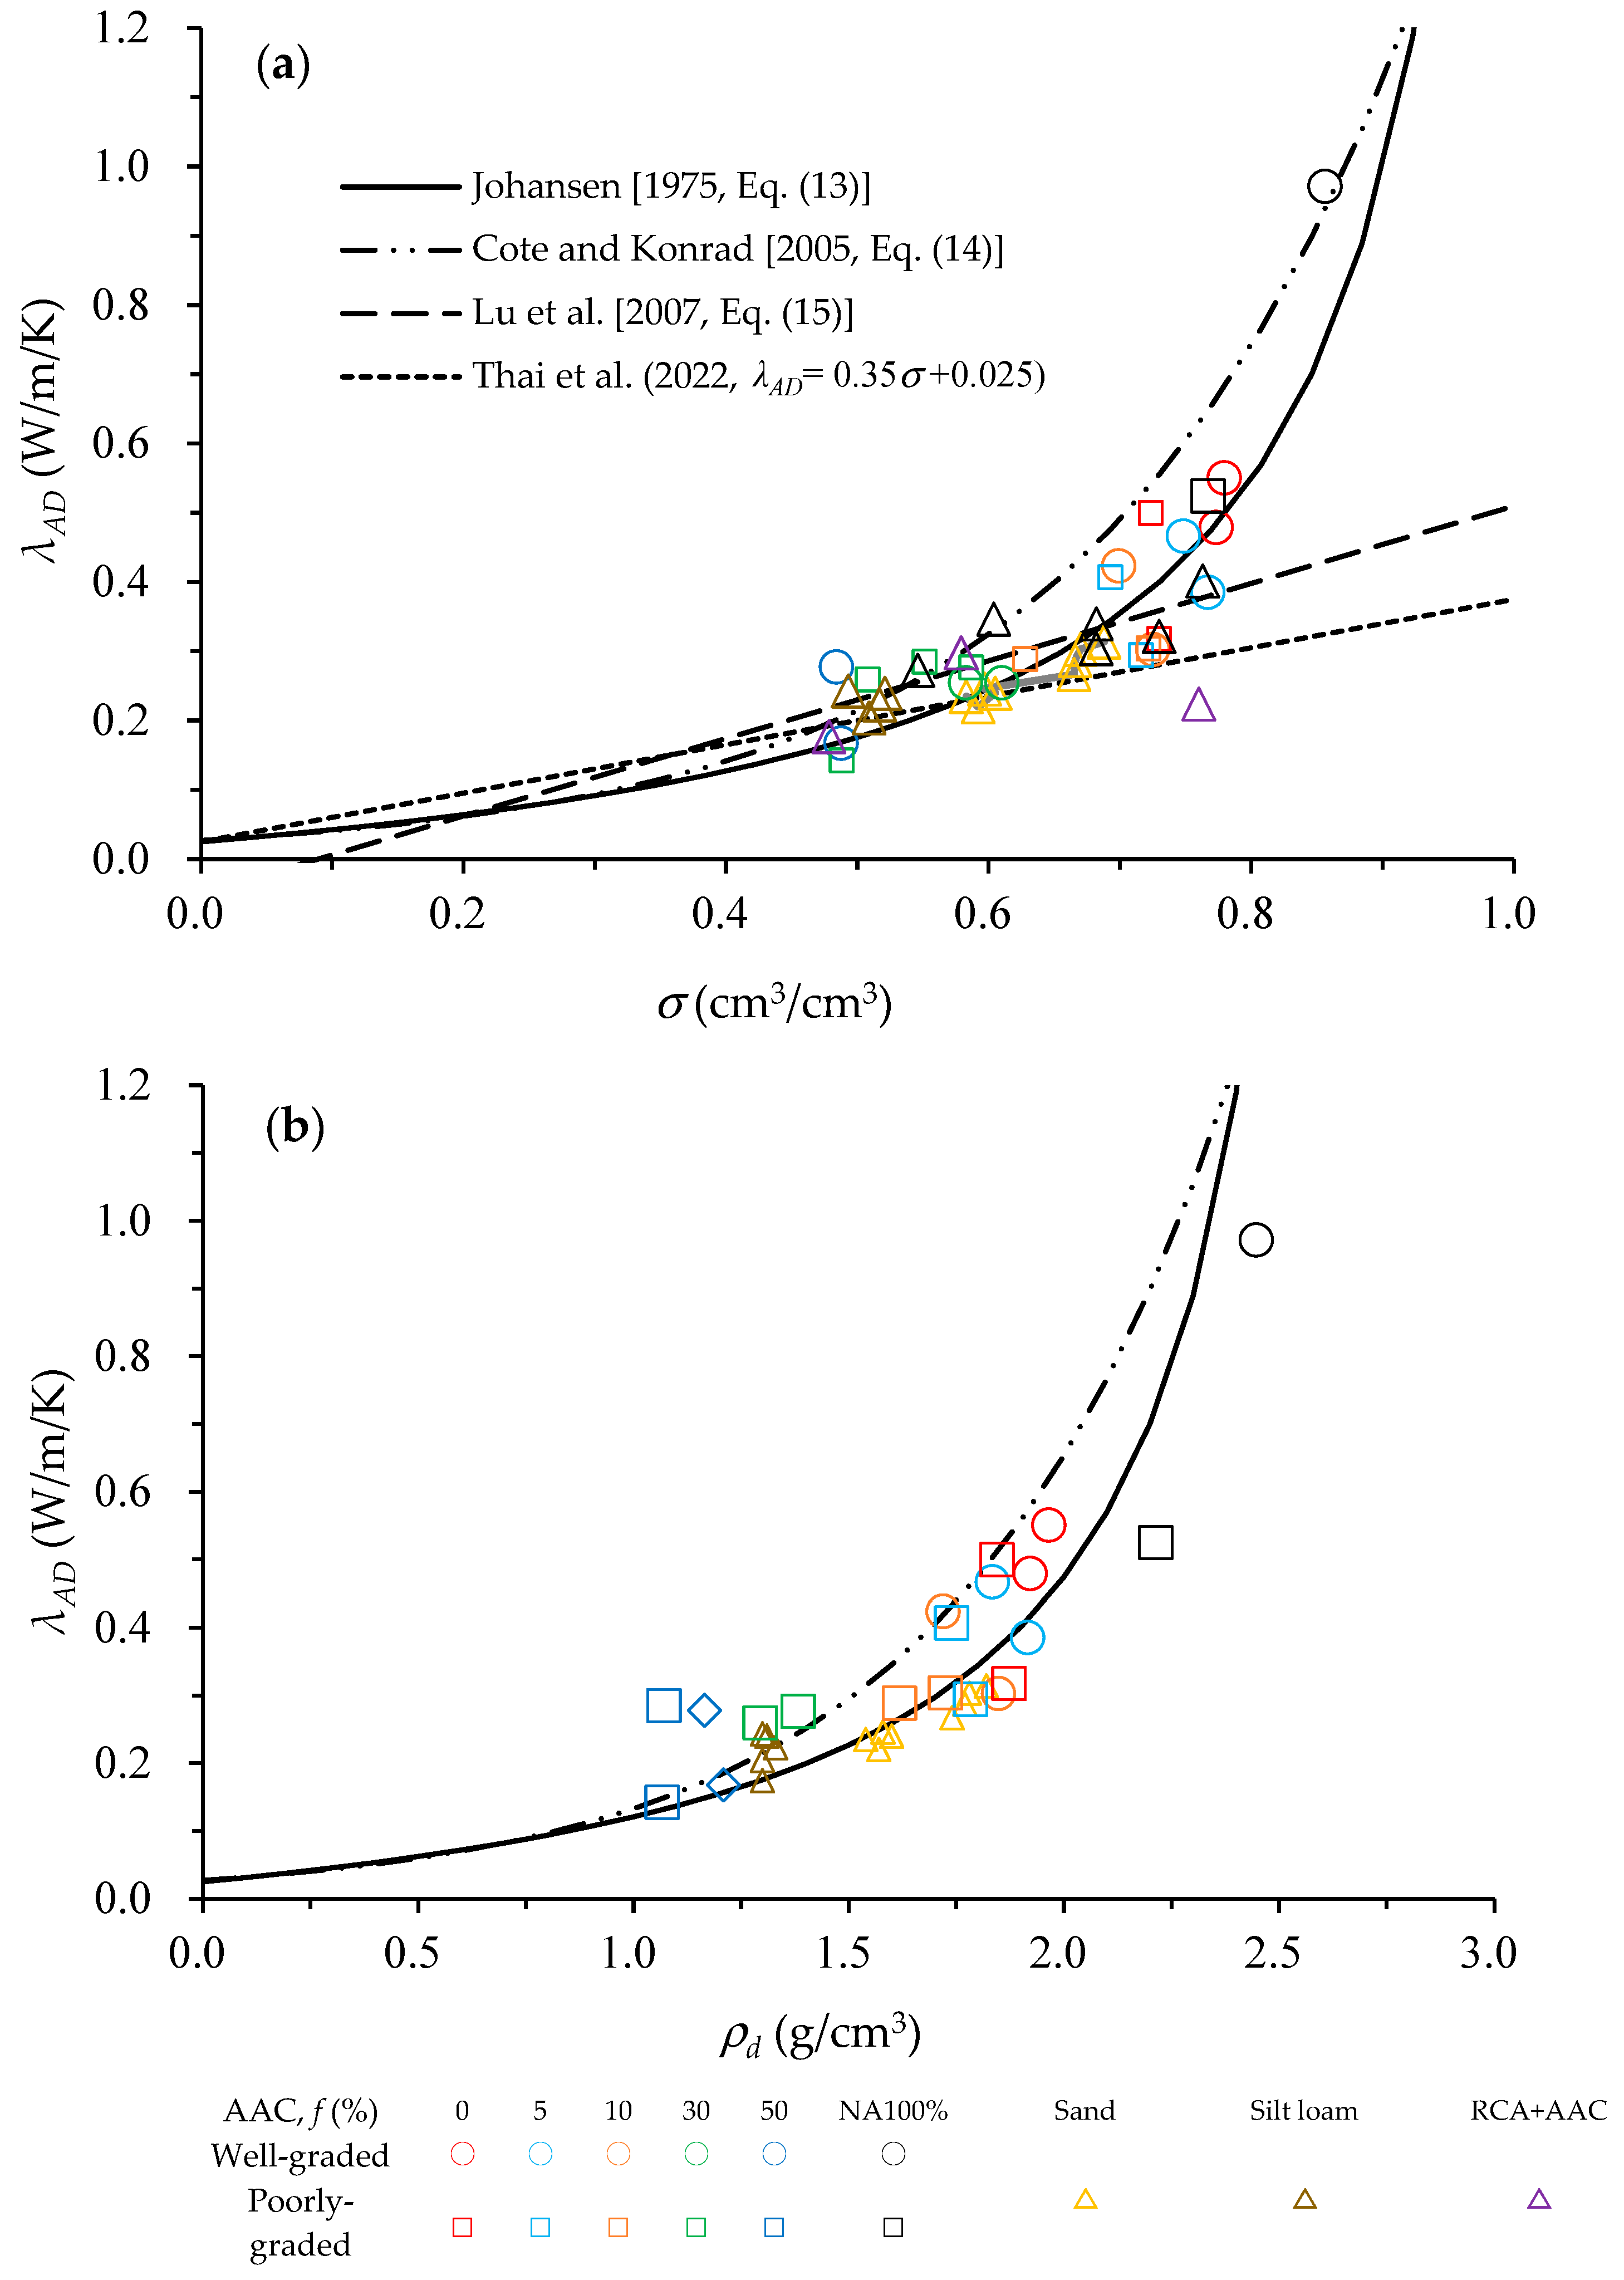
The measured λAD, as functions of volumetric solid content (σ) and dry density (ρd), are given in Figure 5a,b. It is clear that the λAD increased with both increasing σ and ρd. Previous studies either reported that the λAD linearly (e.g., [23,32]) or nonlinearly increased with increasing σ (e.g., [27,29]). In Figure 5a,b, the λAD values for materials, such as sand [38], silt loam [39], as well as those for the roadbed materials in a previous study (i.e., RCA and AAC [28]), were plotted. The results showed that the nonlinear equation types (e.g., [27,29]) seemed to capture more accurately the general trend in the measured λAD. The linear equation type (e.g., [28,36]) also captured the λAD and σ relationship for the materials well, with a σ of less than 0.7 cm3/cm3 (Figure 5a). Figure 5b indicates that the predictive models proposed by Johansen [29] and Cote–Konrad [27] well describe the λAD and ρd relationship. It is noted here that, in this study, the Johansen [29] equation that was employed for estimating the λAD as ρd is an easily measurable parameter compared to σ.
Figure 5.
Thermal conductivity in air-dried condition (λAD) as a function of (a) volumetric solid content (σ) and (b) dry density (ρd) [27,28,29,36]. The reference sand [38], silt loam [39], and RCA + AAC [28] were used.
3.2. Measured Volumetric Heat Capacity
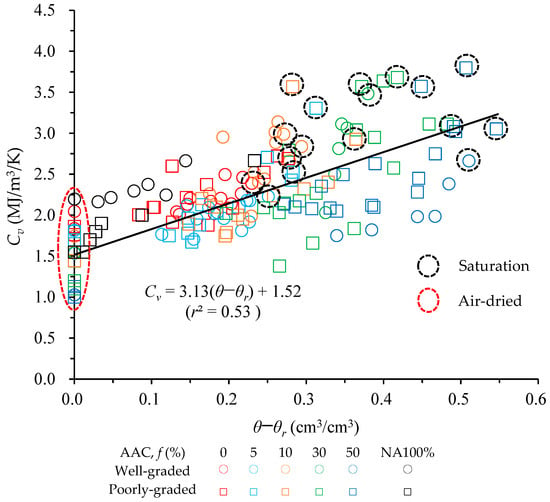
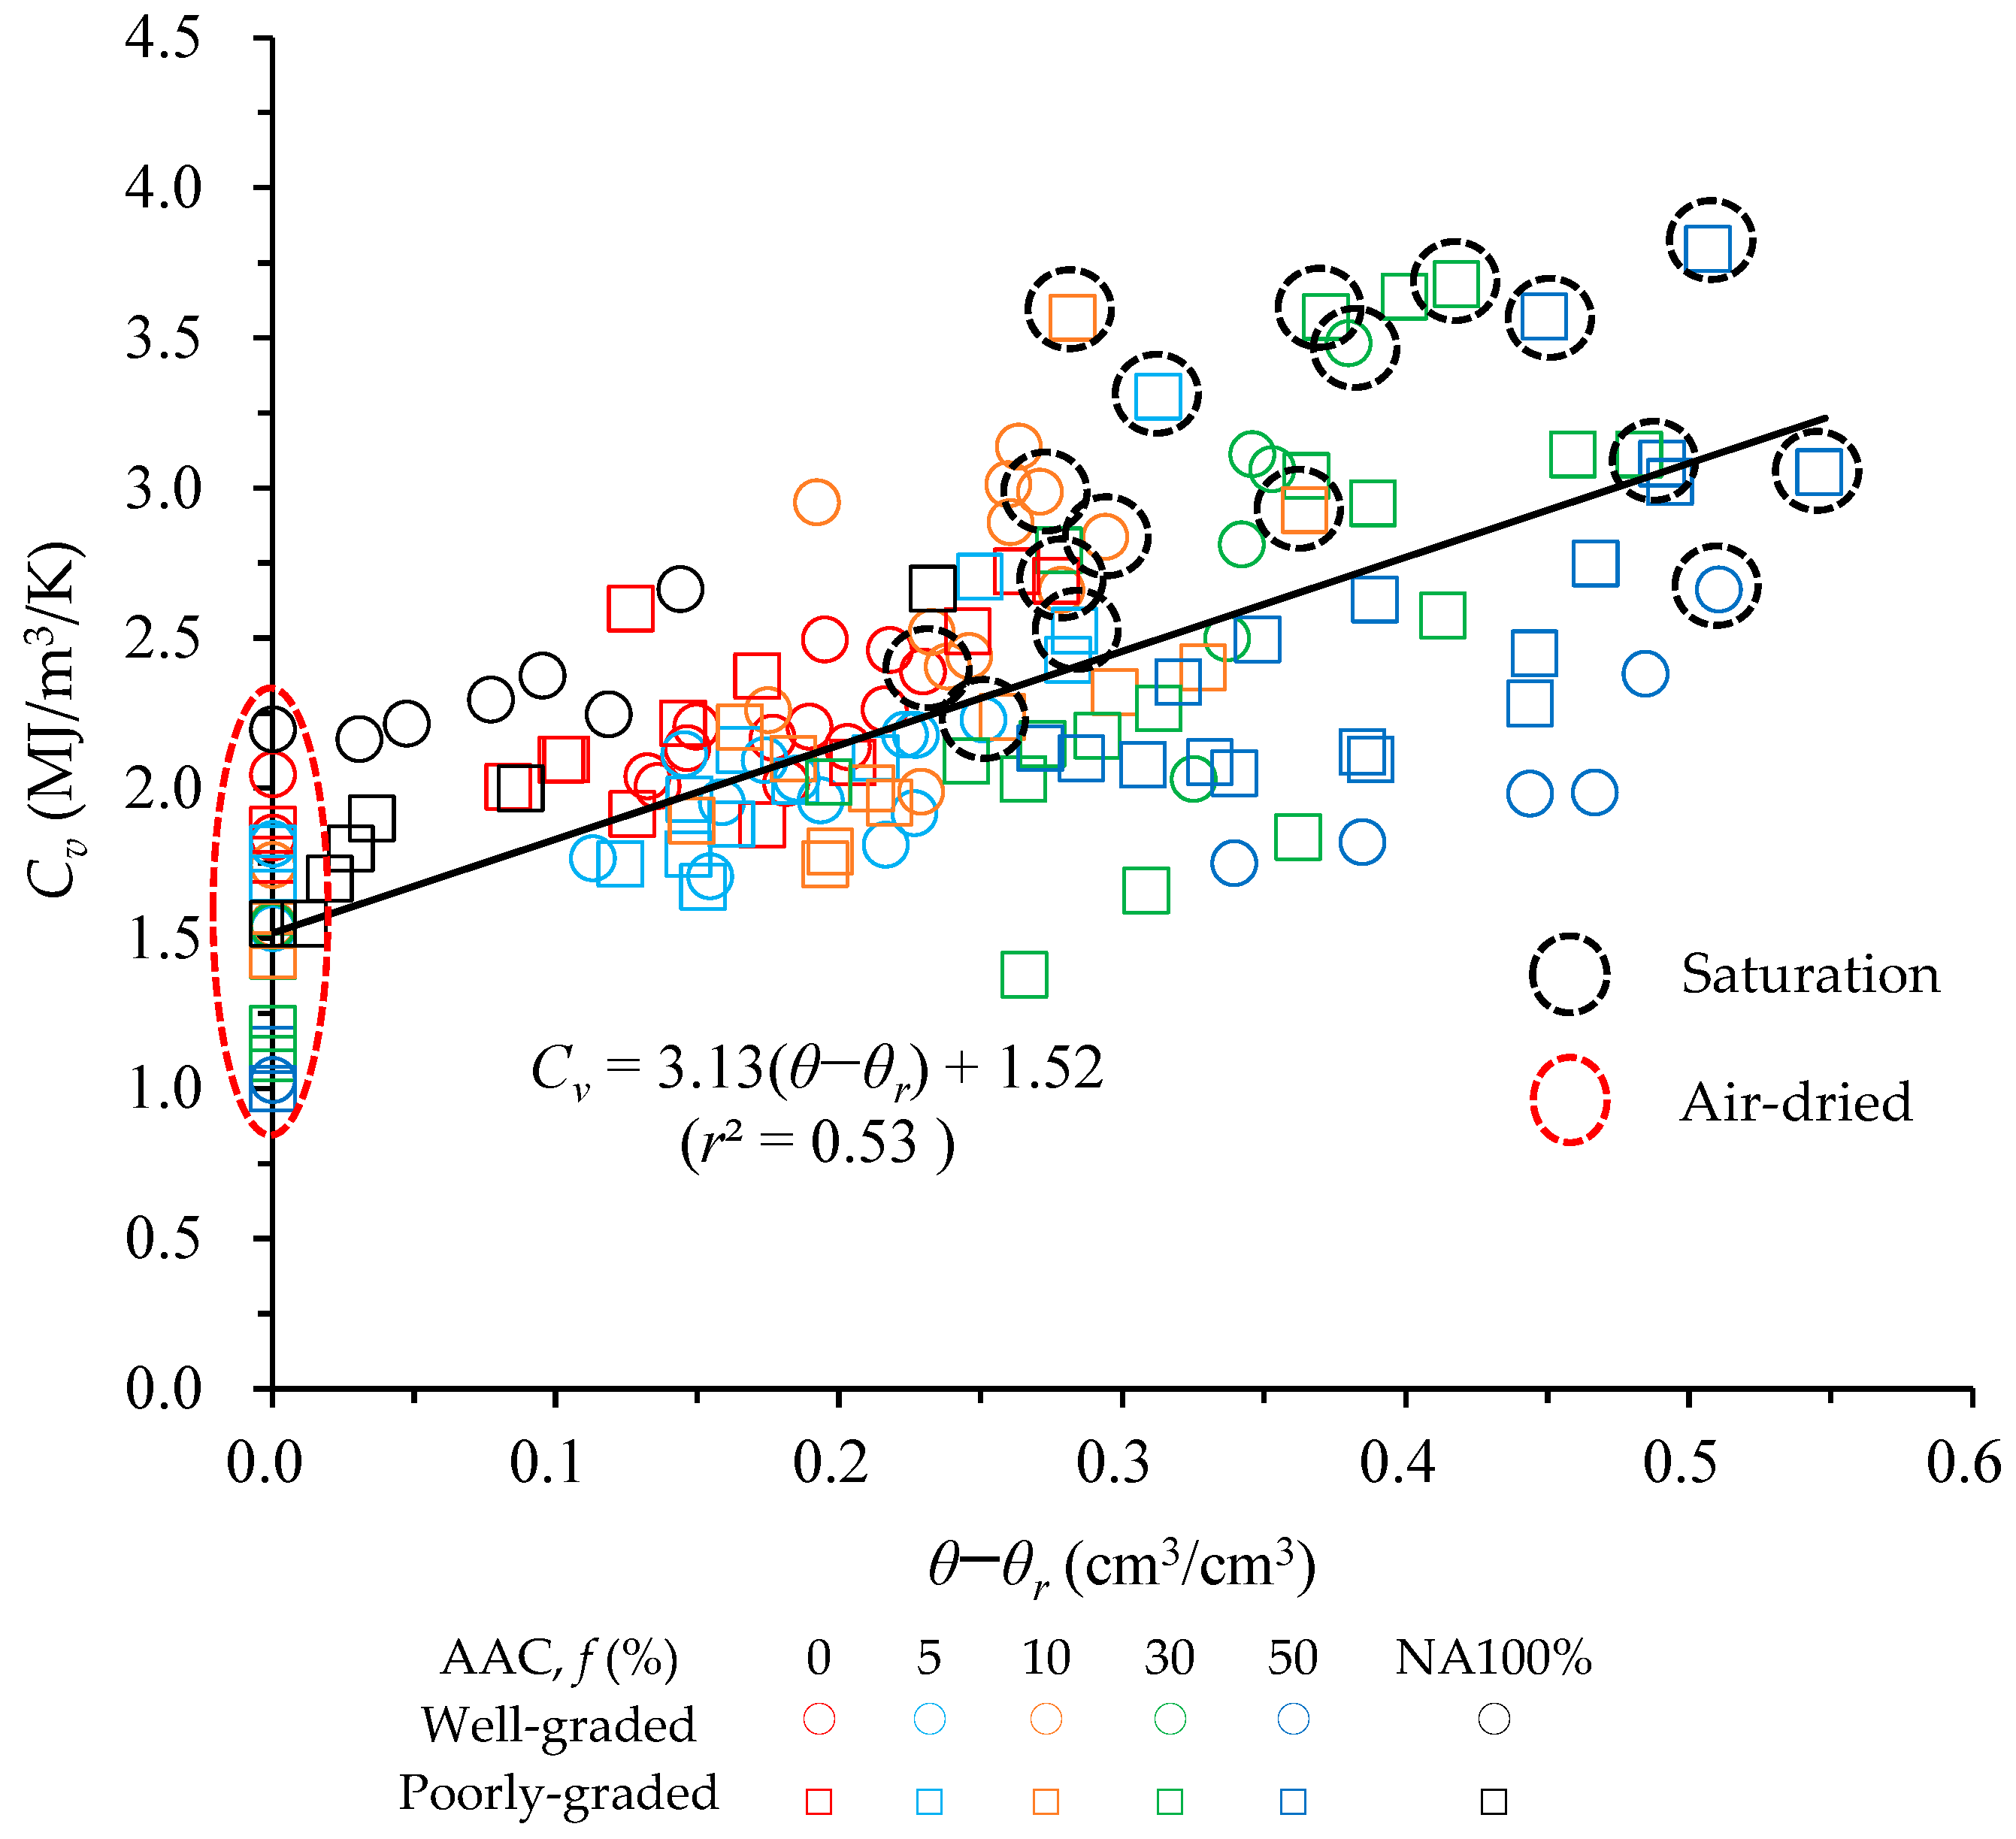
The measured Cv was plotted as a function of θ − θr, as shown in Figure 6. Similarly to λ, the measured Cv also increased with increasing θ − θr. There was no significant effect of the PSD used on the Cv, unlike the λ and θ − θr relationship, in which the increase in the % AAC mixing proportion f clearly decreased the λ at the same θ − θr; however, for the Cv and θ − θr relationship, the effect of f on the Cv was not clearly observed except in the air-dried and water-saturated condition. It can be observed in this figure that the Cv increased with decreasing f in the air-dried condition, probably because the AAC grains caused a decrease in dry density. It is well noted that dry density highly affects Cv; that is, the higher dry density might give a higher Cv [see Equations (9) and (10), and Figure 7b]. It was also observed in this figure that the Cv in the water-saturated condition increased with increasing f (i.e., increase in volumetric water content θ [37]). This is probably due to the high Cv of water (4.18 MJ/m3/K [25]).
Figure 6.
Measured volumetric heat capacity (Cv) as a function of θ − θr.
Figure 7.
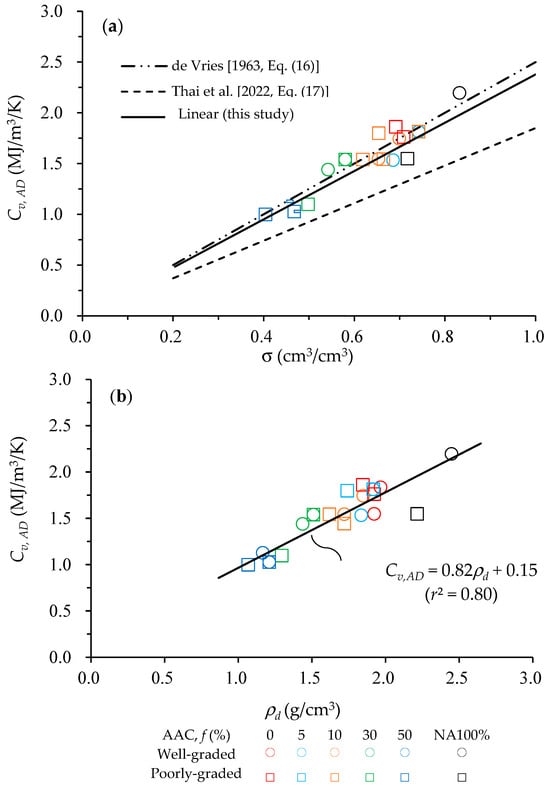
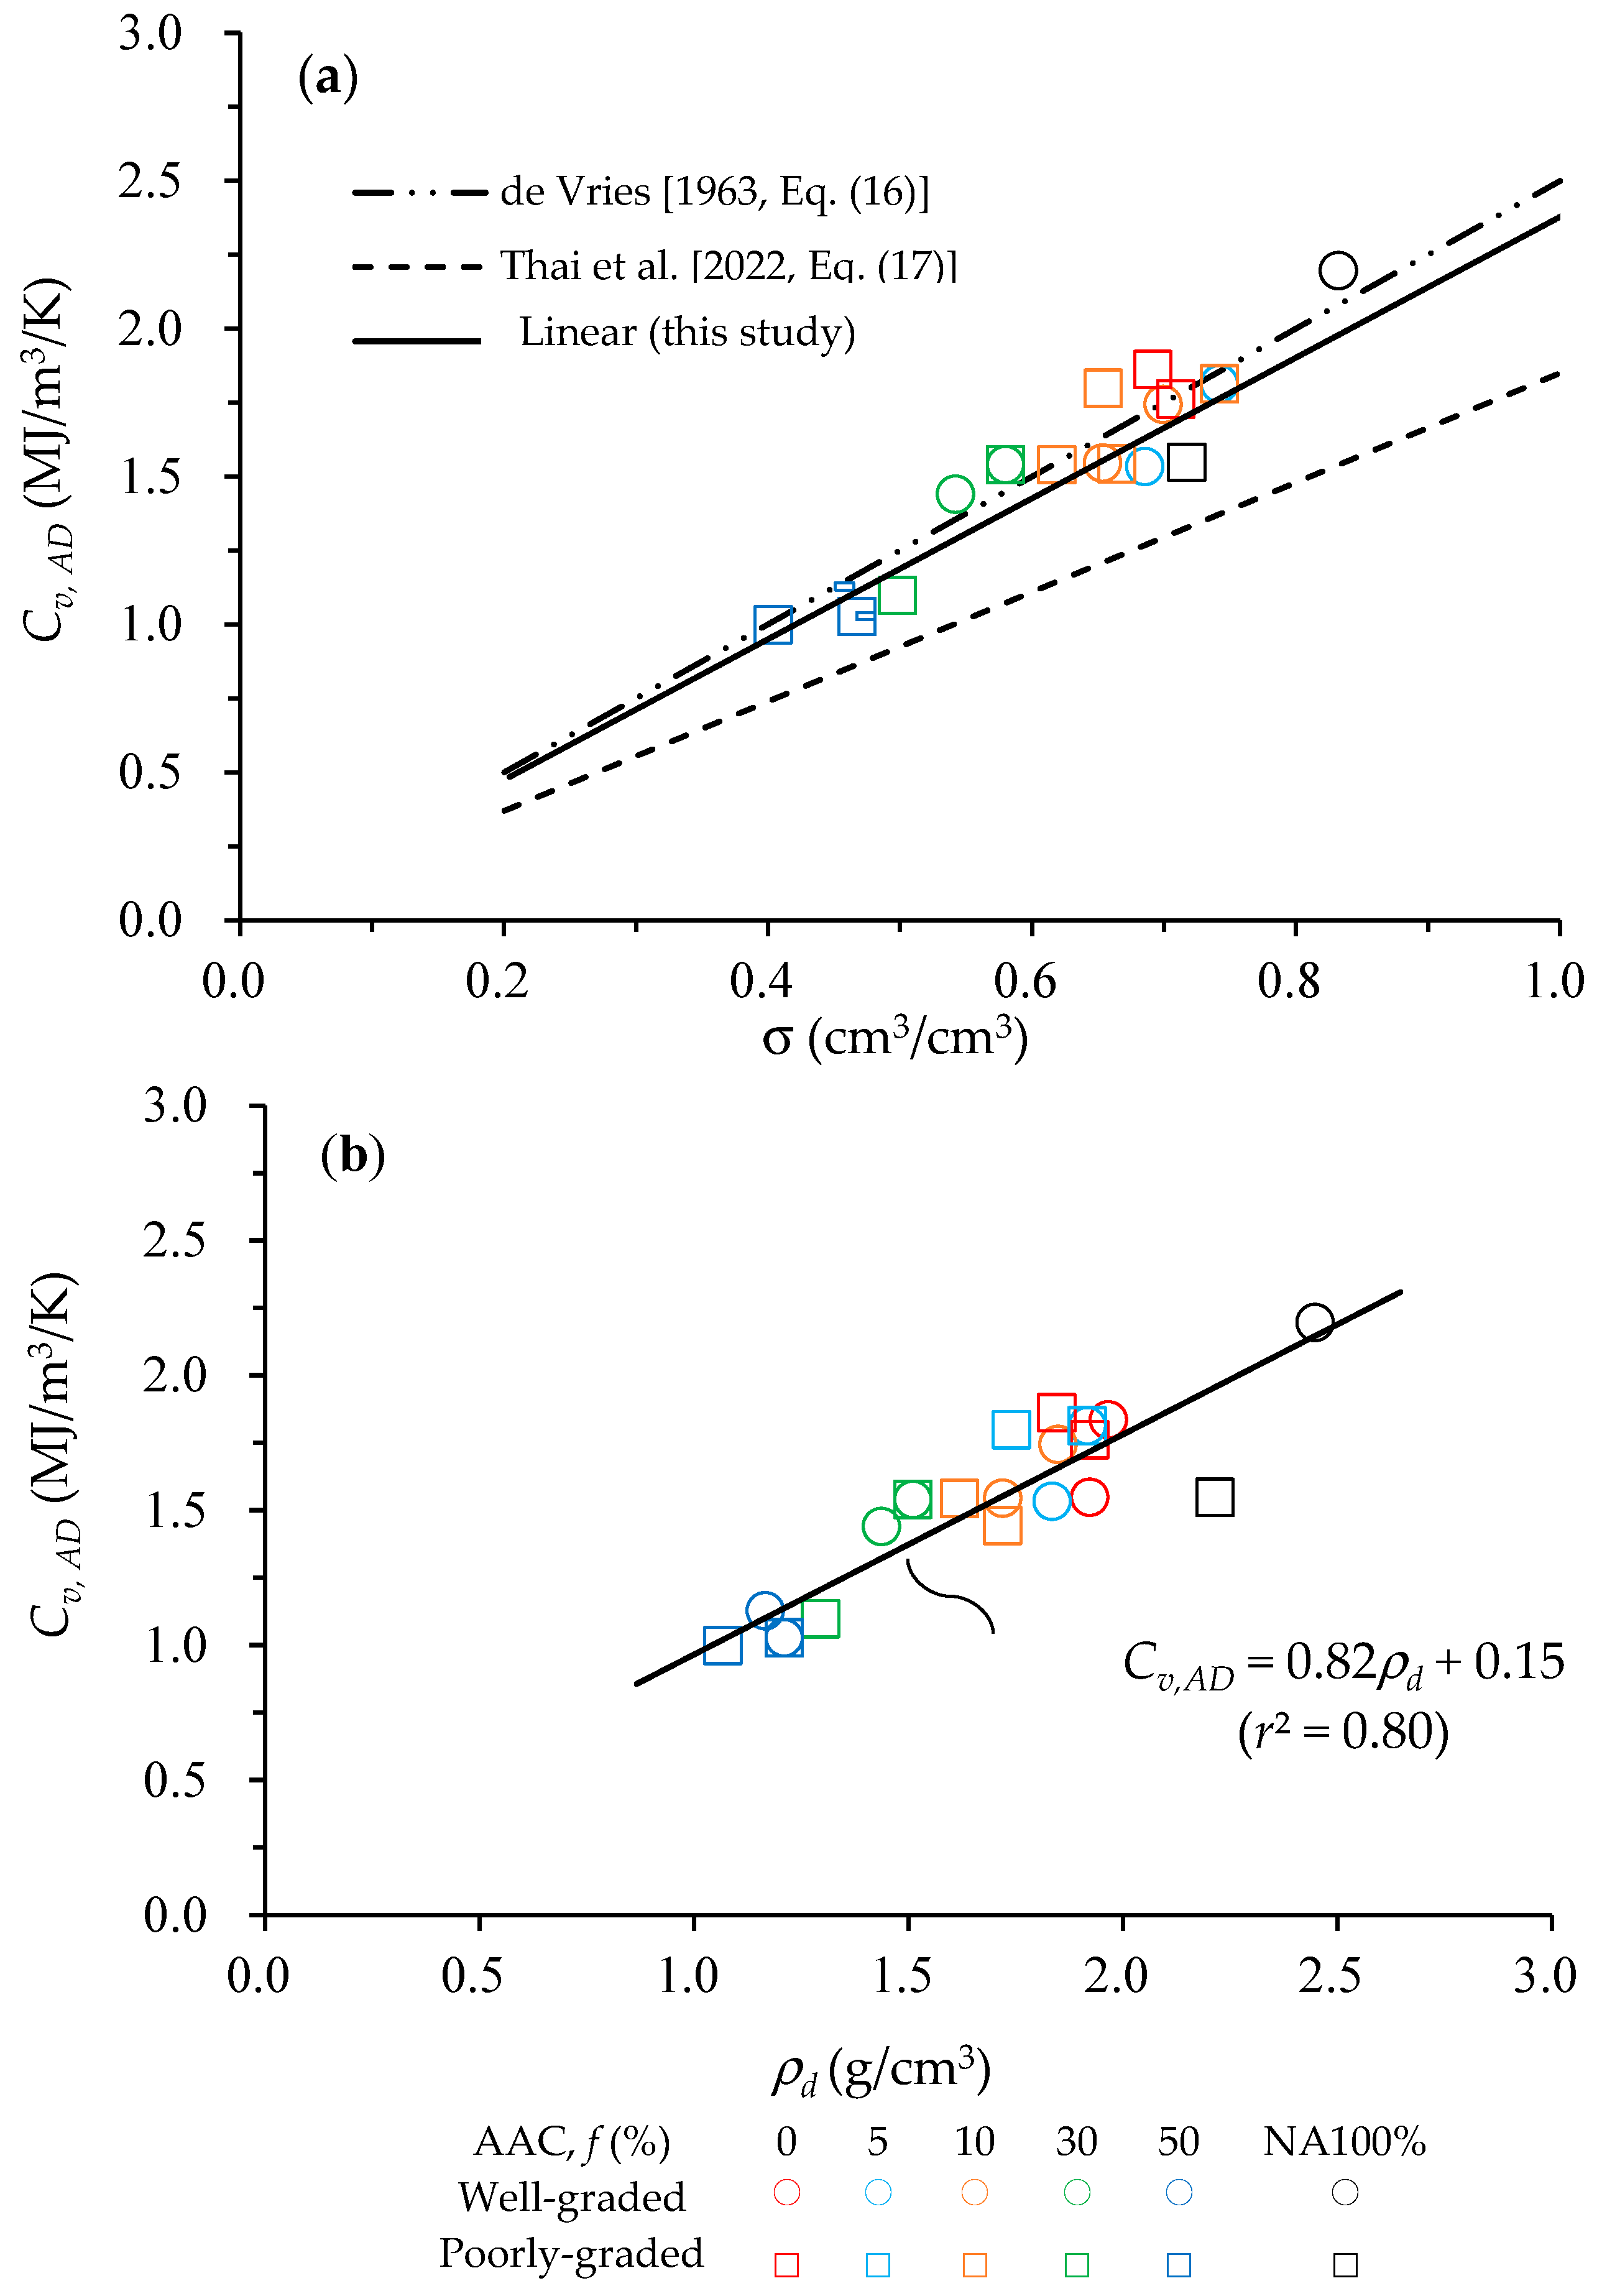
Measured volumetric heat capacity in air-dried condition (Cv,AD) as a function of (a) volumetric solid content (σ), and (b) dry density (ρd) [25,28].
A linear function was fitted to the entire data. The best-fit regression line was found to be the following equation (shown in Figure 6):
The measured Cv,AD as a function of volumetric solid content (σ) and dry density (ρd) are given in Figure 7a,b. Similarly to the λ, the Cv,AD also increased with increasing both the σ and dry density ρd. However, Cv,AD seemed to be proportional to σ and ρd. Figure 7a shows that the estimation equation proposed by de Vries [25] [Equation (16)] captured the measured Cv,AD well, while the regression equation proposed by Thai et al. [28] [Equation (17)] underestimated it in this study, although it was developed specifically for roadbed materials similar to those considered in this study; this was probably because they included recycled clay brick in their regression equation. There was a good correlation between the Cv,AD and ρd, and the regression line was as follows (shown in Figure 7b):
3.3. Applicability of Archie’s Law Approach for Thermal Conductivity
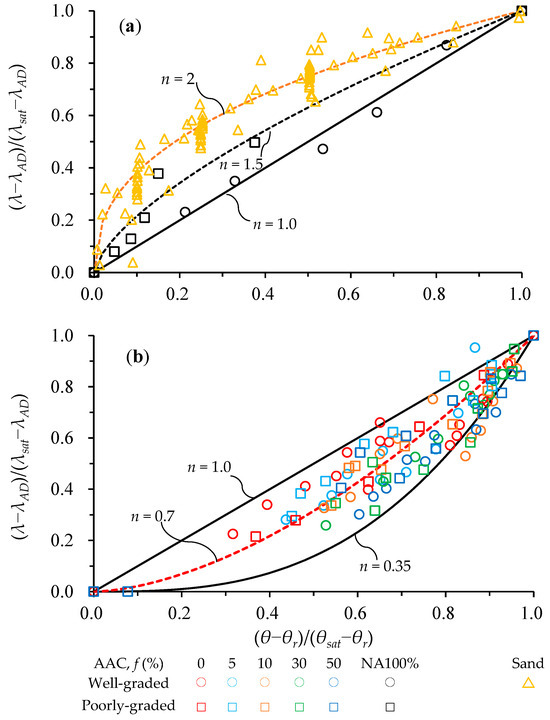
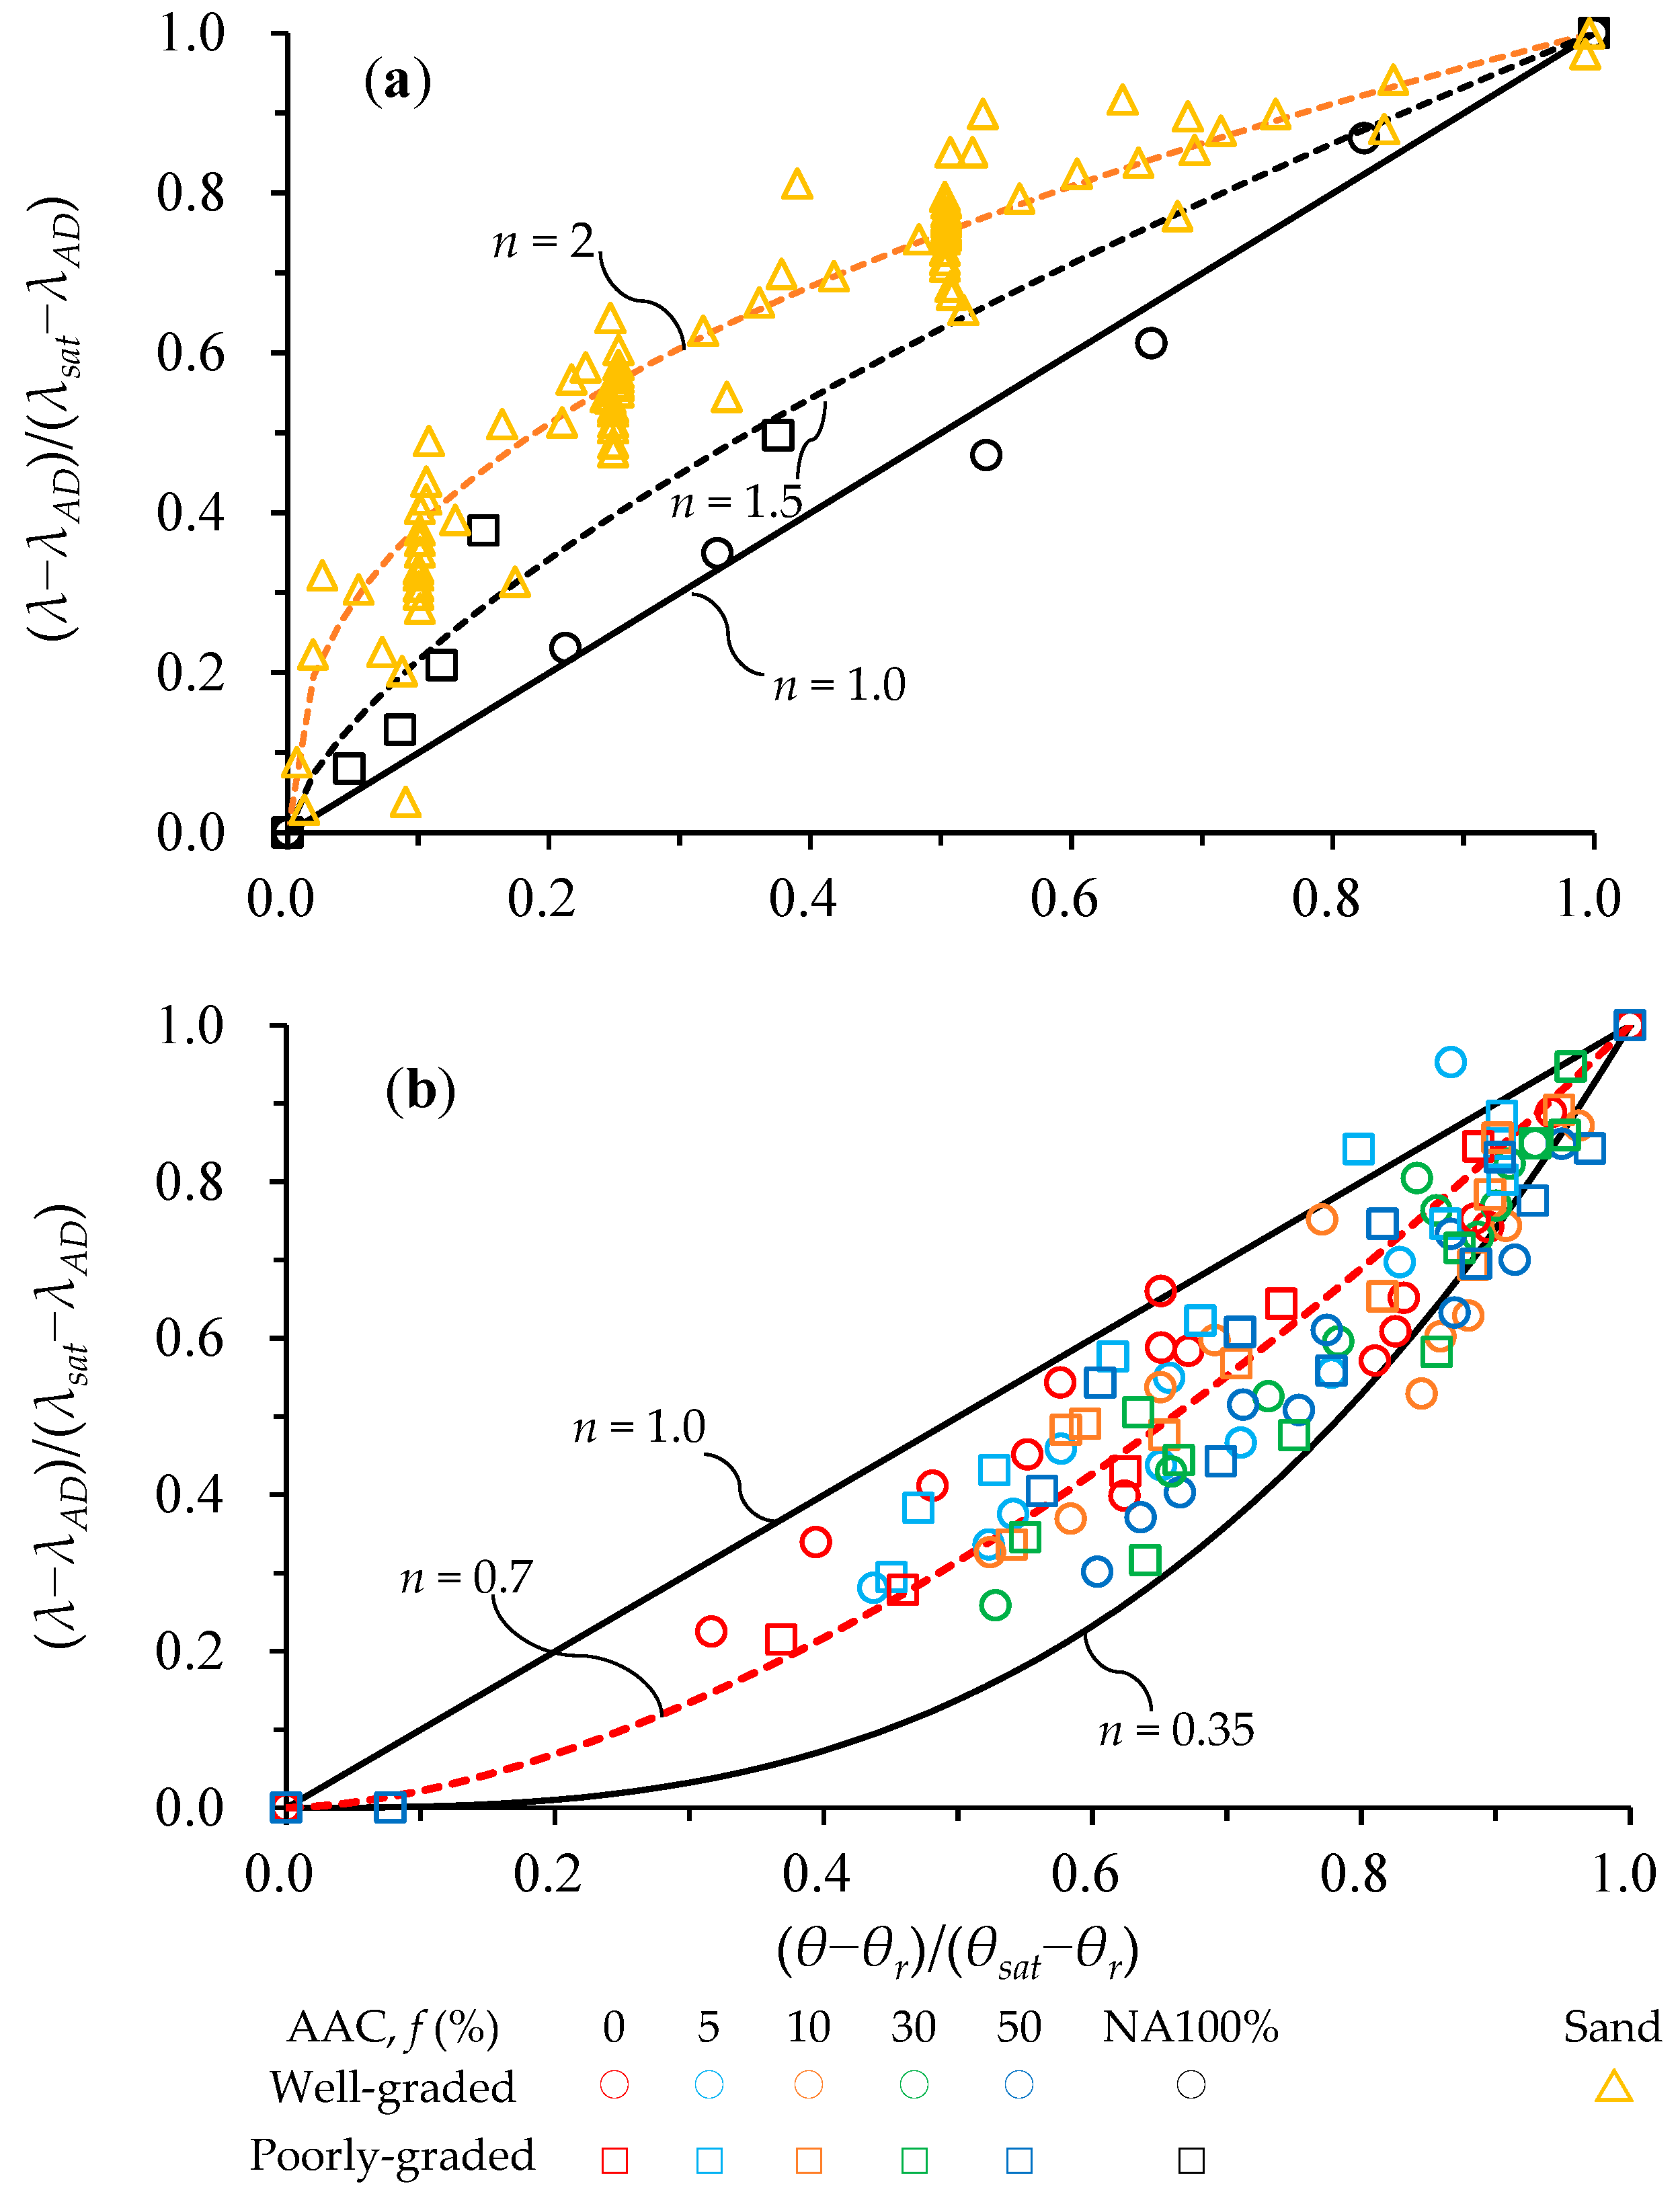
The performance of Archie’s-law-based model is depicted in Figure 8a,b. The RCA and RCA mixed with AAC samples (n < 1, Figure 8b) showed the opposite behavior (concave up) to that of NA100% and sand (concave down, n ≥ 1, Figure 8a). Thai et al. [28] also examined the thermal conductivity of RCA and AAC materials using the concept of normalized thermal conductivity [i.e., Equation (5)] and reported a similar concave-up observation. For sand, the normalized λ increased rapidly at lower θ (i.e., dry condition), and the incremental increase in the normalized λ decreased at higher λ. For the RCA and the RCA mixed with AAC samples, on the other hand, λ rapidly decreased at a higher θ (i.e., wet condition), indicating that the disconnected water bridges were more pronounced in the wet condition. In the dry condition (i.e., lower θ), the λ decreased less rapidly, indicating that the further decrease in water content in the dry condition did not significantly affect the λ. The heat is probably transferred mainly through the contact between the solid and solid phases of the particles. The roadbed materials contained relatively coarse aggregates, which allowed for the water to be distributed less evenly compared to that of fine and uniform aggregates of sand, thus reducing the importance of the water bridge effect in the dry condition.
Figure 8.
Normalized thermal conductivity as a function of normalized volumetric water content using the Archie’s-law-based model for (a) NA100% and sand, (b) RCA 100% and RCA mixed with AAC. The sand (after Hamamoto et al. [32]) was used as the control material.
The original work of Hamamoto et al. [32] reported the value of n = 2; however, this value is not applicable to the roadbed materials made from RCA and AAC consisting of coarser aggregates. It is also well noted that the value of n = 2 did not hold for a wide range of soils. Some soils [e.g., Mor soil, organic soil, and peat soil (after [32])] can only be described well using the n = 1, which is somewhat similar to the NA100% (i.e., well-graded samples, see Figure 8a). Based on the observation of the measured data, the majority of the measured λ values of the roadbed materials consisting of RCA and AAC fell between n = 0.35 and 1.0. We found that the value of n = 0.7 best-described the data when using the modified Archie’s-second-law-based model for the roadbed materials consisting of RCA and AAC. Regardless of variations in the particle size distribution and AAC mixing proportion (under the same compaction energy), a single representative value of n = 0.7 can be applied to all the samples, indicating that the model is robust with respect to these initial conditions.
3.4. Performance of Existing Predictive Models for Thermal Conductivity and Volumetric Heat Capacity
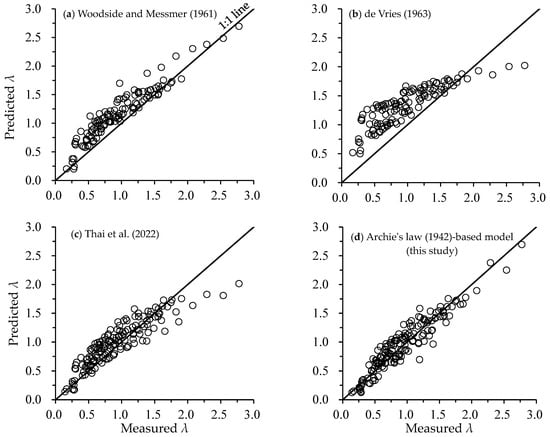
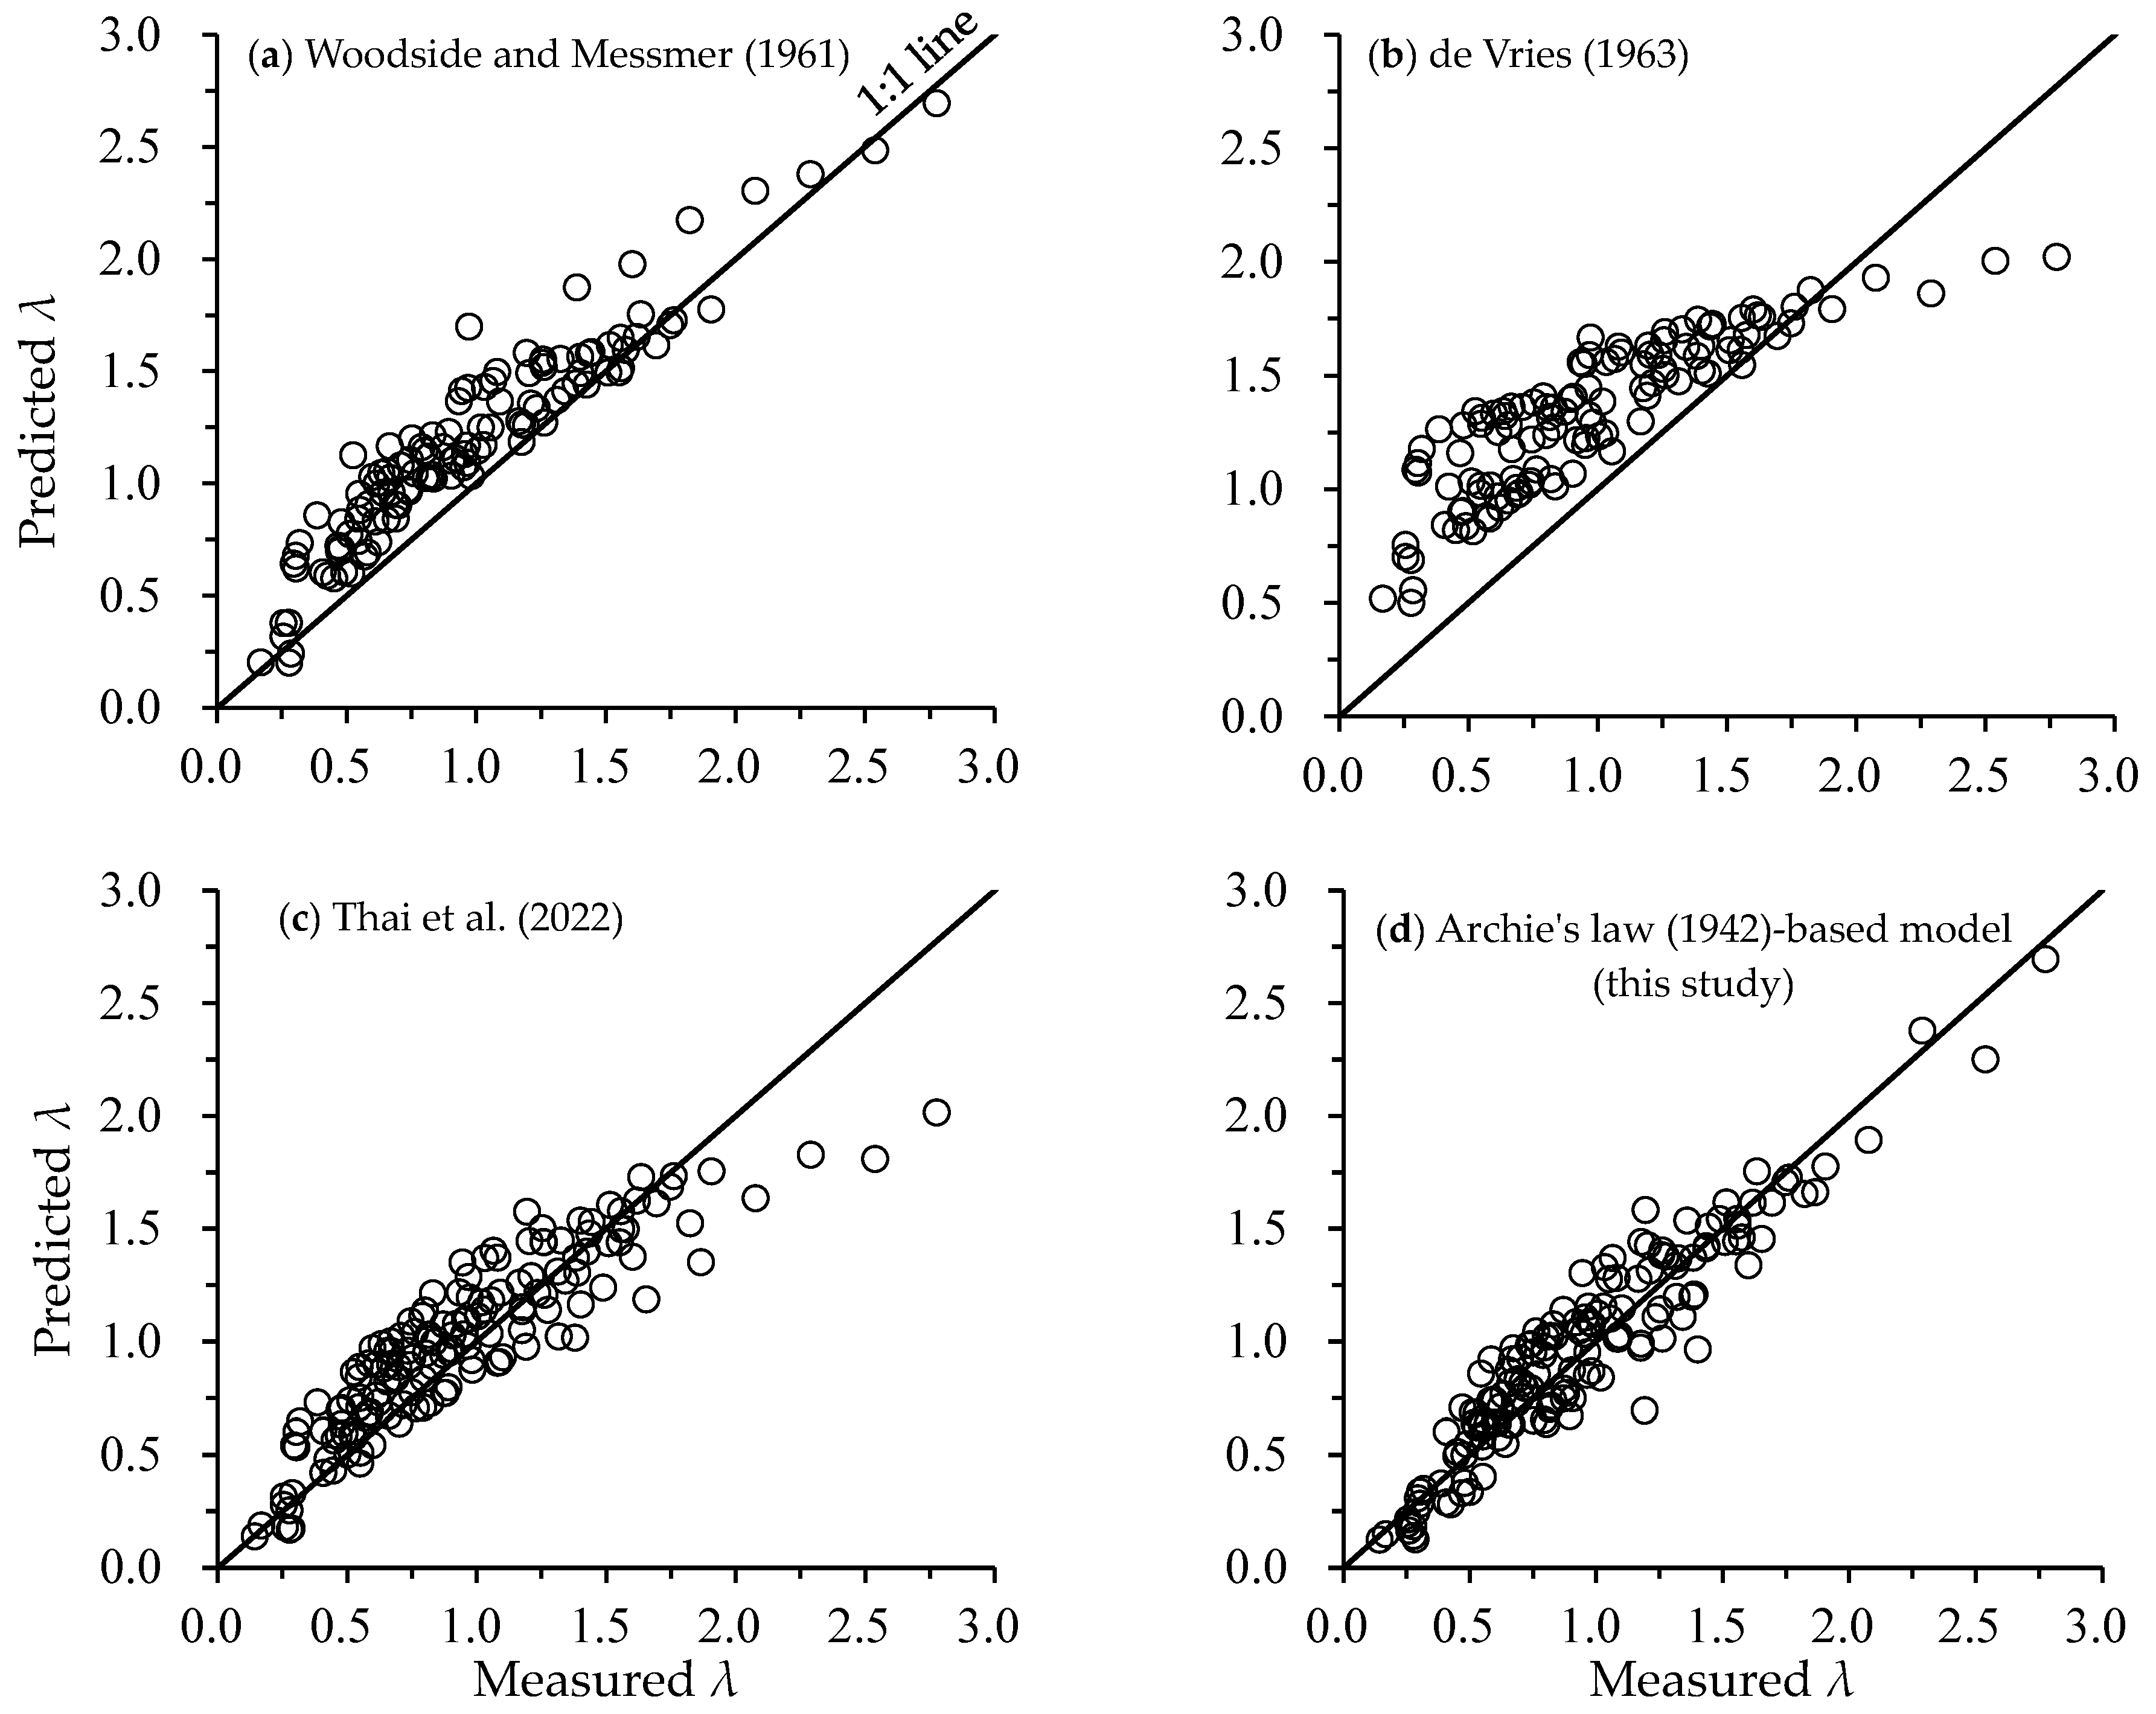
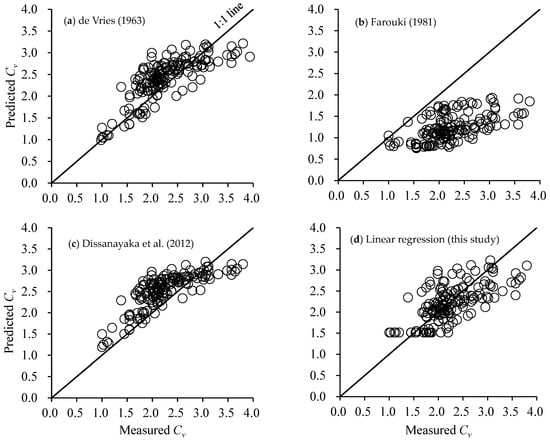
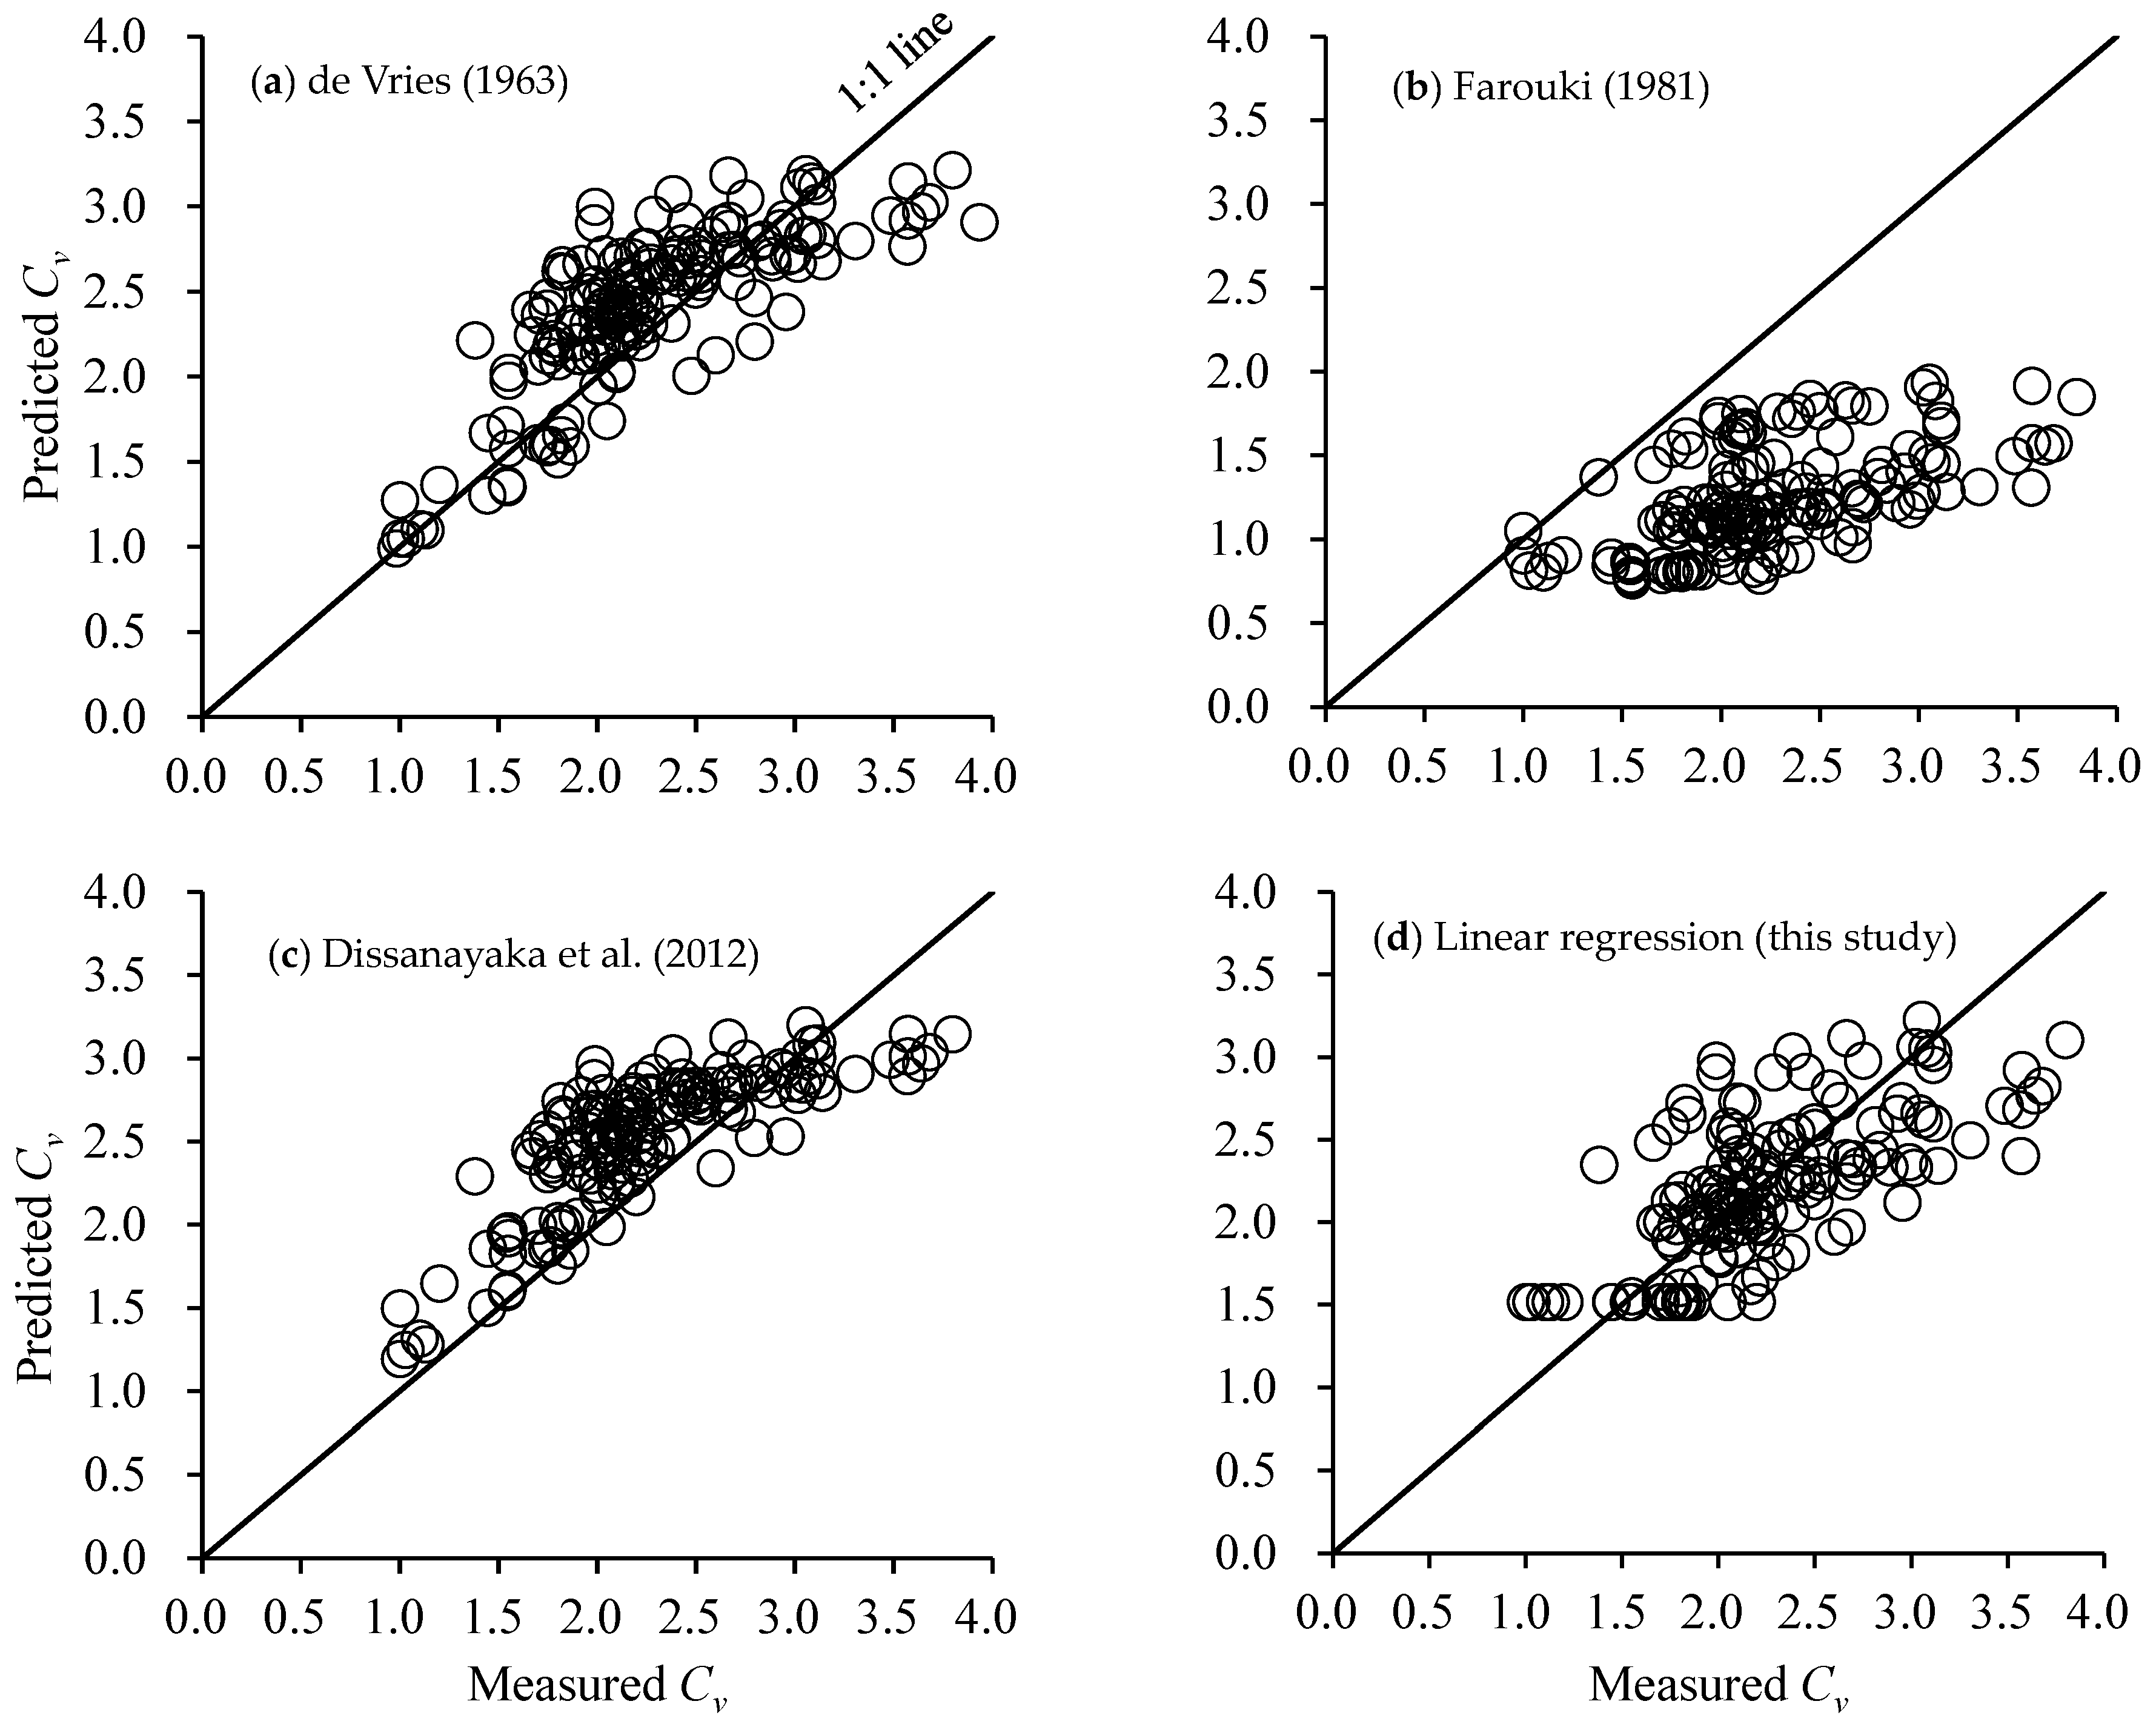
Ground heat flux, which is governed by λ, is one of the important components in surface energy balance, and the source/sink term in the heat balance equation is governed by Cv. Therefore, simple yet accurate models for predicting λ and Cv are essential for enhancing the accuracy of thermal transport simulations and for assessing UHI mitigation performance. The statistical indices of selected models are summarized in Table 3. The scatterplot comparison of the predicted and measured λ and Cv values of all the tested samples is depicted in Figure 9 and Figure 10. Based on the RMSE, bias, AIC indices, and also fully considering the figurative results presented in Figure 9 and Figure 10, the selected model’s performance was evaluated. The model was evaluated as follows: good, if it had a low RMSE, bias near zero, and low AIC; fair, if it had a moderate RMSE, bias slightly away from zero, and moderate AIC; and poor, if it had a high RMSE, large bias, and high AIC. The evaluation results are shown in Table 3.
Table 3.
Tests of predictive models for measured thermal conductivity (λ) and volumetric heat capacity (Cv) used in this study and calculated RMSE, bias, and AIC values.
Figure 9.
Scatterplot comparison of predicted and measured thermal conductivity (λ) of all tested samples (a) Woodside and Messmer (1961) [24], (b) de Vries (1963) [25], (c) Thai et al. (2022) [28], and (d) Archie’s law (1942)-based model (this study).
Figure 10.
Scatterplot comparison of predicted and measured volumetric heat capacity (Cv) of all tested samples (a) de Vries (1963) [25], (b) Farouki (1981) [26], (c) Dissanayaka et al. (2012) [33], (d) Linear regression (this study).
For selected predictive thermal conductivity models, the modified Archie’s law and Thai et al. (2022) [28] models were evaluated as good, and the predictive models of Woodside and Messmer (1961) [24] and de Vries (1963) [25] were evaluated as fair. Looking at Table 3, the modified Archie’s law model was evaluated as good (i.e., the best) because it had the lowest RMSE (0.160), the best bias (0.024), and the lowest AIC (−125). The Thai et al. (2022) [28] model was also evaluated as good (i.e., second best) because it had a low RMSE (0.216), low bias (0.062), and low AIC (−27). The two physically based predictive models of Woodside and Messmer (1961) [24] and de Vries (1963) [25] showed a moderate RMSE, bias, and AIC compared to those rated as good; along with a fairly good performance, as shown in Figure 9a and Figure 10b, we finally evaluated these two predictive models as fair.
Among the selected predictive volumetric heat capacity models, we classified the de Vries (1963) [25] model as good due to its combination of the lowest RMSE (0.393), moderate bias (0.173), and lowest AIC (155). The Farouki (1981) [26] model was rated as poor because this model had the highest RMSE (1.102) and lowest bias (−1.003). The model proposed by Dissanayaka et al. (2012) [33] was evaluated as fair due to moderate RMSE (0.444) and bias (0.284) compared to the other selected predictive models for Cv.
Having a closer look at Figure 9d, the modified Archie’s law model best predicted the whole range of λ (i.e., close alignment with the 1:1 line, minimal scatter). So far, the Archie’s-law-based model has been tested against various soils and sand [32], and evaluating its use on roadbed material in the present study verifies that this model is widely applicable.
Based on Figure 9c, the Thai et al. (2022) [28] model also predicted the λ well, except for some higher λ (i.e., λ > 2, wetter conditions), which was expected because this model was developed for roadbed materials. It is noted again, however, that the Thai et al. (2022) [28] model has yet to be tested on typical soils and sand. According to Figure 9a, the de Vries (1963) [25] model showed moderate predictive capability; however, for lower measured λ values (λ < 1), the predicted values tended to be overestimated (points above the 1:1 line), and for higher measured λ values (λ > 2), the predictions were consistently underestimated (as per points below the 1:1 line). Figure 9b shows that the majority of the λ lies close to the 1:1 line in the Woodside and Messmer (1961) [24] model; however, it slightly overestimates them (as per points above the 1:1 line). The fairly good performance of the Woodside and Messmer (1961) [24] and de Vries (1963) [25] models indicates that physically based models can be applied to a wide range of materials.
The overall best prediction for Cv in the de Vries (1963) [25] model can also be observed in Figure 9a. This indicates that the Cv of the physically based de Vries (1963) [25] model is also widely applicable. The Farouki (1981) [26] model significantly deviates from the 1:1 line, with predictions consistently underestimating the measured values (as per points below the 1:1 line). Although the most recently proposed model by Dissanayaka et al. (2012) [33] was developed for soils, it is still well applicable to roadbed materials (Figure 10c).
4. Conclusions
In this study, thermal conductivity and volumetric heat capacity were measured under a drying process from saturation to the air-dried condition in a laboratory using RCA and AAC with various mixing proportions. The measured λ and Cv were characterized, and the selected existing models for both λ and Cv were evaluated. The following conclusions are drawn.
For the measurements of λ and Cv, both λ and Cv of all tested samples exhibited a linear increase as θ increased. The mixing of AAC grains was found to reduce λ values across the entire range of θ. Overall, the inclusion of AAC grains did not have much effect on the Cv, except in the air-dried and water-saturated conditions. With an increase in the % AAC mixing proportion, the Cv gradually decreased in the air-dried condition, while the Cv significantly increased in the water-saturated condition. It is expected that improvements in the water retention capacity and volumetric heat capacity of roadbed materials prevent the rise in pavement surface temperature; hence, the higher the % AAC mixing proportion, the higher the UHI mitigation potential.
It was found that the empirical saturation exponent (n) for the applicability of the modified Archie’s-law-based model for predicting λ is material-dependent. The n for roadbed materials (typically consisting of coarse aggregates, as considered in this study) was established to be in the range of 0.35–1.0, with n = 0.7 as representative. This finding would extend the application of the Archie’s-law-based model to a wider range of materials.
For testing the existing predictive models for λ and Cv, the physically based models [i.e., Woodside and Messmer (1961) [24] and de Vries (1963) [25] for λ, and de Vries (1963) [25] for Cv] predicted the measured λ and Cv for roadbed materials fairly well, making them widely applicable models for predicting λ and Cv. However, these models required many input parameters. For a quick estimation of the Cv of roadbed materials using RCA and AAC, the linear regression described by Equation (18) can be considered. In the dry condition (e.g., air-dried), the model proposed by Johansen (1975) [29] as a function of easily measurable dry density was suggested for the estimation of λ, while the linear regression described by Equation (19) was recommended for the estimation of Cv.
The models proposed in this study are simple and applicable over a wide range of moisture contents, allowing for their incorporation into simulation programs or governing equations to model heat transport in roadbed materials under conditions ranging from prolonged dry periods (i.e., dry state in the model) to immediately after heavy rainfall (i.e., fully saturated state in the model). Information on mass transport parameters, such as gas and water transport parameters, is also necessary to comprehensively evaluate the UHI, and also enables a closer look into the pore tortuosity-connectivity of the liquid and gaseous phases of unsaturated roadbed materials. Further characteristics and the links between these mass transport parameters are suggested for future study. The applicability of the Archie’s-law-based model for predicting the mass transport parameters for roadbed materials is also a promising topic.
Author Contributions
Conceptualization, V.N.P., K.K., and T.S.; methodology, V.N.P., K.K., and T.S.; formal analysis, V.N.P. and K.K.; investigation, V.N.P., K.K., and T.S.; writing—original draft, V.N.P.; writing—review and editing, V.N.P., K.K., and T.S.; supervision, K.K.; funding acquisition, K.K. All authors have read and agreed to the published version of the manuscript.
Funding
This research was supported by the JST-JICA Science and Technology Research Partnership for Sustainable Development (SATREPS) Project (No. JPMJSA1701) and the research grant from the Research Bureau of Saitama University.
Data Availability Statement
The data presented in this study are available on request from the corresponding author. (The data are not publicly available due to project-based restrictions).
Conflicts of Interest
Author Toshihiro Sakaki was employed by the ESE Consulting LLC. The remaining authors declare that the research was conducted in the absence of any commercial or financial relationships that could be construed as a potential conflict of interest.
References
- Trihamdani, R.A.; Kubota, T.H.; Lee, S.H.; Sumida, K.; Tran, T.T.P. Impacts of land use changes on urban heat islands in Hanoi, Vietnam: Scenario analysis. Procedia Eng. 2017, 198, 525–529. [Google Scholar] [CrossRef] [Scilit]
- Nguyen, T.S.; Chen, C.F.; Chen, C.R.; Bui, X.T.; Tran, H.V. Assessment of urbanization and urban heat islands in Ho Chi Minh City, Vietnam using Landsat data. Sustain. Cities Soc. 2017, 30, 150–161. [Google Scholar] [CrossRef] [Scilit]
- Tran, T.V.; Hoang, T.L.; Le, V.T. Research on the change of urban surface temperature under impact of urbanization in Ho Chi Minh City by applying remote sensing method. Vietnam J. Earth Sci. 2011, 33, 347–359. (In Vietnamese) [Google Scholar]
- Nguyen, K.D.; Phan, K.D. Monitoring urban surface heat island in Can Tho city period 2014–2020. Can Tho Univ. J. Sci. 2022, 58, 35–44. (In Vietnamese) [Google Scholar]
- Nguyen, T.T. Landsat time-series images-based urban heat island analysis: The effects of changes in vegetation and built-up land on land surface temperature in summer in the Hanoi metropolitan area Vietnam. Environ. Nat. Resour. J. 2020, 18, 177–190. [Google Scholar] [CrossRef] [Scilit]
- Tran, H.H.N.; Kubota, A.; Trihamdani, R.A. Impact of urban heat island under the Hanoi Master Plan 2030 on Cooling Loads in Residential Buildings. Int. J. Built Environ. Sustain. 2015, 2, 48–61. [Google Scholar] [CrossRef] [Scilit]
- Nguyen, H.K.L.; Huynh, V.C. Assessing the impact of urbanization on urban climate by remote sensing perspective: A case study in Danang City Vietnam. Int. Arch. Photogramm. Remote Sens. Spat. Inf. Sci.—ISPRS Arch. 2015, XL–7/W3, 207–212. [Google Scholar]
- EPA, U.S. Environmental Protection Agency. Available online: https://www.epa.gov/heatislands/what-are-heat-islands (accessed on 26 January 2026).
- Mirzaei, M.; Verrelst, J.; Arbabi, M.; Shaklabadi, Z.; Lotfizadeh, M. Urban heat island monitoring and impacts on citizen’s general health status in Isfahan metropolis: A remote sensing and field survey approach. Remote Sens. 2020, 12, 1350. [Google Scholar] [CrossRef] [Scilit]
- Tran, N.D.; Doan, Q.V.; Kusaka, H.; Seposo, X.T.; Honda, Y. Green space and deaths attributable to the urban heat island effect in Ho Chi Minh City. Am. J. Public Health 2018, 108, S137–S143. [Google Scholar]
- Hou, H.; Su, H.; Liu, K.; Li, X.; Chen, S.; Wang, W.; Lin, J. Driving forces of UHI changes in China’s major cities from the perspective of land surface energy balance. Sci. Total Environ. 2022, 829, 154710. [Google Scholar] [CrossRef] [Scilit]
- Hertel, D.; Schlink, U. How to convert urban energy balance into contributions to urban excess temperatures. MethodsX 2019, 6, 132–142. [Google Scholar] [CrossRef] [Scilit]
- Back, Y.; Bach, P.M.; Santamouris, M.; Rauch, W.; Kleidorfer, M. Role of Surface Energy Fluxes in Urban Overheating Under Buoyancy-Driven Atmospheric Conditions. J. Geophys. Res. Atmos. 2024, 129, e2023JD039723. [Google Scholar] [CrossRef] [Scilit]
- Pham, V.N.; Kawamoto, K.; Nguyen, T.D.; Tong, T.K.; Nguyen, H.G. Review of water and heat balances and challenges to adoption of permeable pavement system in Vietnam. Int. J. GEOMATE 2023, 24, 84–95. [Google Scholar] [CrossRef] [Scilit]
- Sailor, D.J. Mitigation of urban heat islands—Recent progress and future prospects. In Paper Presented on American Meteorological Society 6th Symposium on the Urban Environment and Forum on Managing Our Physical and Natural Resources; Portland State University: Portland, OR, USA, 2006. [Google Scholar]
- Irfeey, A.M.M.; Chau, H.W.; Sumaiya, M.M.F.; Wai, C.Y.; Muttil, N.; Jamei, E. Sustainable mitigation strategies for urban heat island effects in urban areas. Sustainability 2023, 15, 10767. [Google Scholar] [CrossRef] [Scilit]
- Li, H.; Harvey, J.T.; Holland, T.J.; Kayhanian, M. The use of reflective and permeable pavements as a potential practice for heat island mitigation and stormwater management. Environ. Res. Lett. 2013, 8, 015023. [Google Scholar] [CrossRef] [Scilit]
- Cao, X.; Tang, B.; Zhu, H.; Zhang, A.; Chen, S. Cooling principle analyses and performance evaluation of heat-reflective coating for asphalt pavement. J. Mater. Civ. Eng. 2011, 23, 1067–1075. [Google Scholar] [CrossRef] [Scilit]
- Pomerantz, M.; Akbari, H.; Chang, S.C.; Kevison, R.; Pon, B. Examples of Cooler Reflective Streets for Urban Heat Islands: Cement Concrete and Chip Seals; Lawrence Berkeley National Laboratory: Berkeley, CA, USA, 2001. [Google Scholar]
- Tsirigoti, D.; Gkyrtis, K. Recycled Pavement Materials and Urban Microclimate: Albedo and Thermal Capacity Effects on Heat Island Mitigation. Solar 2026, 6, 5. [Google Scholar] [CrossRef] [Scilit]
- Qin, Y.; He, Y.; Hiller, J.E.; Mei, G. A new water-retaining paver block for reducing runoff and cooling pavement. J. Clean. Prod. 2018, 199, 948–956. [Google Scholar] [CrossRef] [Scilit]
- Yamagata, H.; Nasu, M.; Yoshizawa, M.; Miyamoto, A.; Minamiyama, M. Heat island mitigation using water retentive pavement sprinkled with reclaimed wastewater. Water Sci. Technol. 2008, 57, 763–771. [Google Scholar] [CrossRef] [Scilit]
- Shimazaki, Y.; Aoki, M.; Nitta, J.; Okajima, H.; Yoshida, A. Experimental determination of pedestrian thermal comfort on water-retaining pavement for UHI adaptation strategy. Atmosphere 2021, 12, 127. [Google Scholar] [CrossRef] [Scilit]
- Woodside, W.; Messmer, J.H. Thermal conductivity of porous media, I. Unconsolidated sands. J. Appl. Phys. 1961, 32, 688–1699. [Google Scholar] [CrossRef] [Scilit]
- de Vries, D.A. Thermal properties of soils. In Physics of the Plant Environment; van Wijk, W.R., Ed.; North-Holland Publishing Company: Amsterdam, The Netherlands, 1963; pp. 210–235. [Google Scholar]
- Farouki, O.T. The thermal properties of soils in cold regions. Cold Reg. Sci. Technol. 1981, 5, 67–75. [Google Scholar] [CrossRef] [Scilit]
- Côté, J.; Konrad, J.M.A. Generalized thermal conductivity model for soils and construction materials. Can. Geotech. J. 2005, 42, 443–458. [Google Scholar] [CrossRef] [Scilit]
- Thai, H.N.; Kawamoto, K.; Nguyen, H.G.; Sakaki, T.; Komatsu, T. Measurements and modeling of thermal conductivity of recycled aggregates from concrete, clay brick, and their mixtures with autoclaved aerated concrete grains. Sustainability 2022, 14, 2417. [Google Scholar] [CrossRef] [Scilit]
- Johansen, O. Thermal Conductivity of Soils. Ph.D. Thesis, University of Trondheim, Trondheim, Norway, 1975. [Google Scholar]
- Saito, H.; Šimůnek, J.B.; Mohanty, P. Numerical analysis of coupled water, vapor, and heat transport in the vadose zone. Vadose Zone J. 2006, 5, 784–800. [Google Scholar] [CrossRef] [Scilit]
- Moldrup, P.; Olesen, T.; Komatsu, T.; Schjønning, P.; Rolston, D.E. Tortuosity, diffusivity, and permeability in the soil liquid and gaseous phases. Soil Sci. Soc. Am. J. 2001, 65, 613–623. [Google Scholar] [CrossRef] [Scilit]
- Hamamoto, S.; Moldrup, P.; Kawamoto, K.; Komatsu, T. Excluded-volume expansion of Archie’s law for gas and solute diffusivities and electrical and thermal conductivities in variably saturated porous media. Water Resour. Res. 2010, 46, 1–14. [Google Scholar] [CrossRef] [Scilit]
- Dissanayaka, S.H.; Hamamoto, S.; Kawamoto, K.; Komatsu, T.; Moldrup, P. Thermal properties of peaty soils: Effects of liquid-phase impedance factor and shrinkage. Vadose Zone J. 2012, 11, vzj2011.0092. [Google Scholar] [CrossRef] [Scilit]
- Saito, T.; Hamamoto, S.; Mon, E.E.; Takemura, T.; Saito, H.; Komatsu, T.; Moldrup, P. Thermal properties of boring core samples from the Kanto area, Japan: Development of predictive models for thermal conductivity and diffusivity. Soils Found. 2014, 54, 116–125. [Google Scholar] [CrossRef] [Scilit]
- Abu-Hamdeh, N.H. Thermal properties of soils as affected by density and water content. Biosyst. Eng. 2003, 86, 97–102. [Google Scholar] [CrossRef] [Scilit]
- Lu, S.; Ren, T.; Gong, Y.; Horton, R. An improved model for predicting soil thermal conductivity from water content at room temperature. Soil Sci. Soc. Am. J. 2007, 71, 8–14. [Google Scholar] [CrossRef] [Scilit]
- Pham, V.N.; Nguyen, T.D.; Nguyen, H.G.; Kawamoto, K. Mechanical, hydraulic, and particle breakage properties of recycled concrete aggregates blended with autoclaved aerated concrete (AAC) grains for unbound road base and subbase materials in Vietnam. J. Mater. Cycles Waste Manag. 2024, 26, 845–859. [Google Scholar] [CrossRef] [Scilit]
- Smits, K.M.; Sakaki, T.; Limsuwat, A.; Illangasekare, T.H. Thermal conductivity of sands under varying moisture and porosity in drainage–wetting cycles. Vadose Zone J. 2010, 9, 172–180. [Google Scholar] [CrossRef] [Scilit]
- Tong, B.; Gao, Z.; Horton, R.; Li, Y.; Wang, L. An empirical model for estimating soil thermal conductivity from soil water content and porosity. J. Hydrometeorol. 2016, 17, 601–613. [Google Scholar] [CrossRef] [Scilit]

Disclaimer/Publisher’s Note: The statements, opinions and data contained in all publications are solely those of the individual author(s) and contributor(s) and not of MDPI and/or the editor(s). MDPI and/or the editor(s) disclaim responsibility for any injury to people or property resulting from any ideas, methods, instructions or products referred to in the content. |
© 2026 by the authors. Licensee MDPI, Basel, Switzerland. This article is an open access article distributed under the terms and conditions of the Creative Commons Attribution (CC BY) license.