


Abstract
Potentially toxic element (PTE) contamination of food systems has emerged as an important environmental and public health concern in many developing countries, including Uganda, owing to rapid urbanization, industrialization, mining activities, wastewater reuse, informal waste disposal, and expanding urban agriculture. This review synthesizes evidence from peer-reviewed and selected grey literature on the occurrence of cadmium (Cd), chromium (Cr), nickel (Ni), lead (Pb), and arsenic (As) in cereals, vegetables, tubers, livestock products, fish, fruits, and processed foods consumed in Uganda. A structured literature synthesis and screening-level dietary risk assessment using estimated daily intake (EDI), target hazard quotient (THQ), hazard index (HI), carcinogenic risk (CR), and total carcinogenic risk (TCR) were conducted to identify contamination hotspots, priority exposure pathways, and potential public health implications. The available evidence revealed substantial spatial variability, with contamination consistently concentrated in mining-influenced agricultural areas, wastewater-irrigated farms, municipal dumpsites, industrial corridors, and urban food markets. Vegetables, cereals, livestock products, fish, and street-vended foods exhibited the greatest contamination burdens, while Pb and Cd were the PTEs most frequently reported exceeding WHO/FAO, Codex Alimentarius, and Ugandan food safety limits. Screening-level risk estimates indicated that Pb, Cd, and Cr contributed most to cumulative dietary exposure, with children consistently exhibiting higher EDI, THQ, HI, and TCR values than adults because of greater food intake relative to body weight. Although cumulative HI and TCR values exceeded recommended screening thresholds in several hotspot regions, these estimates should be interpreted as conservative screening-level indicators derived from heterogeneous published datasets rather than nationally representative measures of dietary exposure. Overall, the evidence indicates that PTE contamination in Ugandan food systems is predominantly hotspot-driven and highlights the need for targeted surveillance, standardized monitoring and reporting, improved pollution control, and strengthened food safety management to reduce chronic dietary exposure and protect public health.
1. Introduction
Potentially toxic element (PTE) contamination of food systems has emerged as an important environmental and public health concern because these contaminants can persist in environmental media, accumulate in agricultural soils and aquatic ecosystems, and ultimately enter the human food chain through crops, livestock products, fish, and processed foods [1,2]. Unlike many organic contaminants, PTEs are non-biodegradable and may remain in soils, sediments, and water bodies for prolonged periods, allowing their continuous transfer into edible food products through plant uptake, irrigation with contaminated water, atmospheric deposition, bioaccumulation, and post-harvest contamination during food processing, transportation, storage, and marketing [1,3]. Consequently, dietary exposure has become one of the principal pathways of chronic human exposure, particularly in low- and middle-income countries where environmental monitoring and food safety enforcement remain limited.
Several PTEs have no beneficial biological function and can cause adverse health effects even at relatively low concentrations following prolonged exposure [2]. Their toxic effects accumulate over time in organs such as the kidneys, liver, and brain, and long-term dietary exposure has been associated with neurotoxicity, renal dysfunction, developmental impairment, oxidative stress, and carcinogenic outcomes [3,4,5,6]. Because exposure generally occurs through routine consumption of contaminated foods rather than acute poisoning events, even relatively low concentrations in staple foods may present significant long-term public health concerns.
In Uganda, PTE contamination of food systems has become an increasing environmental and public health concern due to expanding industrial activities, informal waste disposal, roadside cultivation, wastewater reuse, mining activities, and cultivation near polluted wetlands and drainage channels [7,8]. These activities introduce PTEs into agricultural soils, irrigation water, and aquatic ecosystems, from where they are transferred into vegetables, cereals, root crops, livestock products, fish, and other foodstuffs through plant uptake, sediment accumulation, trophic transfer, and environmental deposition. Available studies indicate that contamination is not evenly distributed across the country but is concentrated within localized environmental “hotspots”, including industrial corridors, dumpsite-adjacent farming zones, mining-influenced landscapes, wastewater-irrigated farms, and high-traffic urban markets [8,9,10]. These localized contamination patterns are especially relevant because they intersect directly with food production and distribution systems, thereby increasing the likelihood of chronic dietary exposure among surrounding populations.
Among the most frequently reported PTEs in food systems are cadmium (Cd), chromium (Cr), nickel (Ni), lead (Pb), arsenic (As), and, less frequently, mercury (Hg), all of which are recognized for their persistence, toxicological significance, and potential for bioaccumulation [11,12,13]. Lead primarily affects neurological development and cognitive function, particularly in children, while cadmium accumulates in the kidneys and has been associated with renal dysfunction and bone demineralization [14,15]. Inorganic arsenic and hexavalent chromium [Cr(VI)] are established human carcinogens, whereas chronic nickel exposure has been linked to allergic and systemic toxic effects [5,6,16]. Because these contaminants accumulate gradually through routine dietary intake rather than acute poisoning events, even relatively low concentrations in commonly consumed foods may pose significant long-term public health concerns, particularly in vulnerable populations such as children [17,18,19].
The Ugandan evidence base on foodborne PTE contamination is growing but remains fragmented. Existing studies have reported PTE concentrations in vegetables, cereals, beef, milk, fish, edible insects, rice, and street foods from different locations, including Kampala retail markets, Bushenyi open markets, Soroti beef supply chains, Mbale municipal dumpsite farming systems, Tororo/Osukuru mine-adjacent crop systems, and Lake Albert fisheries [20,21,22,23]. However, these studies differ substantially in sampling design, food categories, analytical methods, quality assurance procedures, unit reporting, and approaches to exposure assessment. Most have focused on individual food commodities or localized study areas rather than providing an integrated national perspective. Furthermore, concentrations are inconsistently reported on either a wet-weight or dry-weight basis, and most studies report total chromium concentrations without chemical speciation, even though toxicological benchmarks often depend largely on Cr(VI), introducing uncertainty into risk interpretation [24].
Although several studies have investigated PTE contamination in specific Ugandan foods or geographical locations, no previous review has comprehensively synthesized the occurrence of major PTEs across food categories while simultaneously evaluating regional contamination pathways, and screening-level human health risks using harmonized risk assessment metrics. A comprehensive synthesis is therefore needed to consolidate the available evidence, identify priority food categories and contamination hotspots, evaluate potential dietary exposure, highlight key knowledge gaps, and support evidence-based food safety management and environmental monitoring in Uganda.
Therefore, this review aims to: (i) synthesize the available evidence on the occurrence of Cd, Cr, Ni, Pb, and As in foodstuffs consumed in Uganda; (ii) evaluate screening-level dietary exposure and potential human health risks using established risk assessment metrics including estimated daily intake (EDI), target hazard quotient (THQ), hazard index (HI), carcinogenic risk (CR) and total carcinogenic risk (TCR); (iii) identify the major contamination pathways and regional hotspots contributing to food contamination; and (iv) discuss the public health implications, knowledge gaps, remediation strategies, and future priorities for food safety management, environmental monitoring, and research in Uganda.
2. Scope, Literature Sources, and Review Approach
2.1. Scope of the Review
This review synthesizes currently available evidence on PTE contamination in foodstuffs consumed in Uganda, with emphasis on dietary exposure pathways and associated public health implications. The review focuses on five major PTES, cadmium (Cd), chromium (Cr), nickel (Ni), lead (Pb), and arsenic (As), reported in major food categories including cereals, vegetables, fruits, tubers, livestock products, fish, dairy products, and processed foods. Rather than estimating population-wide exposure, this review consolidates occurrence data, identifies geographical contamination patterns, compares reported concentrations with international and national food safety standards, and evaluates potential human health implications using established dietary risk assessment metrics, including EDI, THQ, HI, and CR.
2.2. Literature Sources and Eligibility Criteria
Relevant peer-reviewed publications and selected grey literature reporting PTE contamination in foods produced or consumed in Uganda were identified through structured searches of major scientific databases, including Scopus, Web of Science, Google Scholar, and PubMed, supplemented by reference-list screening of eligible publications. Search terms combined keywords such as Uganda, potentially toxic elements, heavy metals, food contamination, cadmium, lead, chromium, nickel, arsenic, vegetables, cereals, tubers, fish, livestock products, dietary exposure, and health risk assessment.
Studies were considered eligible if they: (i) reported quantitative concentrations of at least one target PTE in edible food matrices sampled in Uganda, (ii) clearly identified the food type and sampling location/region, and (iii) presented quantitative concentration data in units that were either reported in mg/kg (wet weight or dry weight as specified) or could be interpreted as equivalent concentration units such as parts per million (ppm). Where unit bases differed, values were recorded exactly as presented, and differences in reporting basis were explicitly noted to avoid inappropriate aggregation. Selected grey literature was included where it provided relevant analytical data and sufficient methodological detail. The final evidence base comprised 115 peer-reviewed publications together with selected grey literature that met the eligibility criteria and formed the basis of the evidence synthesis and screening-level risk assessment.
2.3. Data Extraction and Harmonization
For each eligible study, information was extracted on food category and specific food item, sampling site or region, sample size, target metal(s), reported concentration statistics (mean, median, or range), analytical method, and any applicable guideline limits referenced by the authors. Because the available Ugandan studies varied substantially in reporting basis (wet versus dry weight), food matrices, analytical techniques, and geographical coverage, quantitative meta-analysis was not considered appropriate. Instead, occurrence data were synthesized descriptively, and concentrations were retained as originally reported. Where necessary, values reported in parts per million (ppm) were treated as equivalent to mg/kg for consistency.
To facilitate comparative dietary risk assessment, representative regional concentrations were derived from published concentration ranges to enable comparison among geographical regions and food categories. The extracted data were organized by food category, target PTE, and geographical region before application of a standardized harmonization approach. These resulting representative values were intended solely for comparative screening and should not be interpreted statistically as population-weighted concentrations or nationally representative estimates of dietary exposure.
2.4. Screening-Level Dietary Exposure and Human Health Risk Assessment
Where sufficient concentration data were available, screening-level dietary exposure and potential human health risks associated with PTEs were evaluated using established risk assessment metrics, including estimated daily intake (EDI), target hazard quotient (THQ), hazard index (HI), carcinogenic risk (CR), and total carcinogenic risk (TCR). The objective of this assessment was not to estimate nationwide dietary exposure or disease burden, but rather to compare the relative magnitude of reported contamination across food categories and geographical regions using harmonized assumptions [25,26]. Because the reviewed studies differed substantially in sampling design, food matrices, analytical methodologies, and reporting formats, the resulting exposure estimates should be interpreted as comparative screening-level indicators intended to identify priority contaminants, vulnerable food categories, and contamination hotspots requiring further investigation.
Representative regional concentrations used in the exposure assessment were derived from the compiled occurrence data by calculating the midpoint of each reported concentration range and subsequently averaging these midpoint values within each geographical region. This simplified harmonization approach was adopted because statistically weighted regional averages could not be calculated from the available literature owing to inconsistent sample sizes, heterogeneous study designs, and limited reporting of consumption data. Consequently, the representative concentrations should be interpreted as comparative indicators rather than true regional average concentrations or population-wide exposure estimates.
2.4.1. Estimated Daily Intake (EDI)
The estimated daily intake (EDI) was used to evaluate dietary exposure to individual PTEs on a body-weight basis following the methodology recommended by the United States Environmental Protection Agency (US EPA) [27], which has been widely applied in dietary exposure and food safety risk assessments. EDI was calculated using (Equation (1)):
where Cm is the concentration of the PTE in food (mg/kg), IR is the food ingestion rate (kg/person/day), and BW is body weight (kg).
Because nationally representative, food-specific dietary consumption data for Uganda are currently unavailable, a generalized ingestion rate adopted from published Ugandan dietary risk assessment studies was applied uniformly across all food categories to facilitate comparative assessment of heterogeneous datasets included in this review. This standardized approach enabled consistent comparison of potential dietary exposure across different food groups and geographical regions using harmonized exposure assumptions [25,26]. However, it does not account for differences in the consumption patterns of individual food categories and may therefore overestimate or underestimate exposure for specific foods. Consequently, the calculated EDI values should be interpreted as comparative screening-level estimates intended to identify relative exposure patterns rather than population-specific dietary exposure or actual dietary intake.
2.4.2. Non-Carcinogenic Risk Assessment
Potential non-carcinogenic health risks were evaluated using the target hazard quotient (THQ), which compares the estimated daily intake (EDI) of a contaminant with its corresponding oral reference dose (RfD). THQ was calculated using (Equation (2)):
where EDI is the estimated daily intake (mg/kg/day), and RfD is the oral reference dose (mg/kg/day) for the specific PTE obtained from the US EPA Integrated Risk Information System (IRIS) database [27]. A THQ value less than 1 (THQ < 1) indicates that adverse non-carcinogenic effects are unlikely, whereas THQ ≥ 1 suggests a potential health risk associated with long-term exposure.
To evaluate cumulative non-carcinogenic risk resulting from simultaneous exposure to multiple PTEs, the hazard index (HI) was calculated as the sum of individual THQ values for all PTEs considered in this study, as shown in (Equation (3)):
where THQi represents the target hazard quotient of the ith PTE. An HI value less than 1 (HI < 1) indicates no significant risk of non-carcinogenic effects, while HI ≥ 1 suggests a potential for cumulative adverse health effects due to combined exposure to multiple contaminants [27].
2.4.3. Carcinogenic Risk (CR) and Total Carcinogenic Risk (TCR)
Lifetime carcinogenic risk (CR) was estimated to evaluate the probability of an individual developing cancer following a long-term dietary exposure to carcinogenic PTEs. CR was calculated using (Equation (4)):
where EDI is the estimated daily intake (mg/kg/day), and CSF is the cancer slope factor ((mg/kg/day)−1) for the corresponding PTE. CSF values were obtained from the US EPA guidance [27].
CR = EDI × CSF
The total carcinogenic risk (TCR) was calculated as the sum of individual CR values for all carcinogenic PTEs considered in this review, as shown in (Equation (5)):
where CRi represents the carcinogenic risk associated with the ith PTE. According to US EPA guidance, TCR values between 1 × 10⁻⁶ and 1 × 10⁻⁴ are generally considered acceptable or tolerable lifetime cancer risks, whereas TCR values exceeding 1 × 10⁻⁴ indicate a potential carcinogenic risk that may require investigation or regulatory attention.
2.5. Exposure Parameters, Assumptions, and Toxicological Benchmarks
Screening-level dietary exposure calculations were performed using standardized exposure parameters for adult and child populations (Table 1). The assessment assumed that PTEs present in food were fully bioavailable and that exposure occurred exclusively through dietary ingestion. Representative regional concentrations derived from the compiled occurrence data were used consistently throughout the exposure calculations. Standardized body weight, food ingestion rate, and unit conversion parameters were applied consistently across all calculations to ensure internal consistency. Oral reference dose (RfD) and cancer slope factor (CSF) values were obtained from internationally established human health risk assessment guidelines and were used to evaluate non-carcinogenic and carcinogenic risks. Collectively, these assumptions were adopted to provide a conservative and internally standardized framework for comparing potential dietary risks across heterogeneous datasets rather than estimating actual population-wide dietary exposure.
Table 1.
Exposure parameters adopted for the screening-level dietary exposure assessment [11].
The exposure parameters and toxicological reference values summarized in Table 1 and Table 2 provide a standardized framework for comparing potential dietary risks across heterogeneous studies included in this review. Consequently, the calculated EDI, THQ, HI, CR, and TCR values should be interpreted as comparative screening-level indicators for evaluating relative differences among food categories and geographical regions rather than as precise estimates of national dietary exposure or population disease burden.
Table 2.
Toxicological reference values adopted for the screening-level dietary assessment [11,28].
2.6. Key Interpretive Limitations
The reviewed studies differed substantially in sampling strategy, sample size, food preparation, washing status, analytical methodology, detection limits, and reporting basis (wet weight versus dry weight), introducing unavoidable heterogeneity that limited direct comparison among studies and uncertainty into the compiled dataset. Reported concentrations were therefore retained as originally published, and no mathematical conversion between wet- and dry-weight values was attempted because sufficient information was generally unavailable to support reliable conversion. Similarly, representative regional concentrations were derived solely to facilitate comparative screening and should not be interpreted as statistically weighted regional averages.
An additional source of uncertainty relates to chromium speciation. Most Ugandan food studies reported total chromium concentrations, whereas toxicological benchmarks are primarily based on hexavalent chromium [Cr(VI)]. Because Cr(VI) is considerably more toxic and carcinogenic than trivalent chromium [Cr(III)], assuming that total chromium is entirely present as Cr(VI) represents a conservative screening approach that may overestimate carcinogenic risk. Furthermore, the use of generalized ingestion rates, complete oral bioavailability, and standardized exposure parameters may either overestimate or underestimate exposure for specific food categories. Consequently, the EDI, THQ, HI, CR, and TCR values presented in this review should be interpreted as screening-level indicators intended to identify priority contaminants, vulnerable food categories, and contamination hotspots rather than refined estimates of national dietary exposure or disease burden.
3. Sources, Pathways and Research Landscape of PTEs in Ugandan Food Systems
PTEs enter Ugandan food systems through multiple interconnected environmental and anthropogenic pathways, including contaminated agricultural soils, irrigation water, industrial emissions, mining activities, dumpsite cultivation, roadside deposition, food processing environments, and bioaccumulation within aquatic ecosystems [29,30,31]. Unlike many organic contaminants, PTEs are non-biodegradable and can therefore persist in soils, sediments, and water bodies, allowing their continuous transfer into crops, livestock products, fish, and ready-to-eat foods throughout the food production and distribution chain [13]. Because agricultural production, food processing, and marketing frequently occur near pollution sources in many parts of Uganda, these pathways may directly increase dietary exposure among surrounding populations. The principal contamination sources and pathways identified from the reviewed literature are summarized in (Figure 1).
Figure 1.
Sources and pathways of PTE contamination entering Ugandan food systems.
3.1. Agricultural Soil Contamination
Agricultural soils represent a primary entry point for PTEs into food systems [32]. In Uganda, cultivation frequently occurs near industrial areas, mining zones, dumpsites, drainage channels, and high-traffic corridors, where soils may accumulate PTEs through atmospheric deposition, wastewater irrigation, fertilizer application, waste disposal, and natural geological processes [19,22,32,33,34]. Once introduced into soil, PTEs may persist for extended periods and become available for plant uptake depending on factors such as soil pH, organic matter content, redox conditions, metal speciation, and crop species. Leafy vegetables may generally exhibit greater PTE accumulation than cereals and tubers because of their relatively high transpiration rates, large exposed surfaces, and greater exposure to atmospheric deposition [28]. Elevated concentrations reported in crops cultivated near mining areas and in vegetables grown around dumpsites indicate that contaminated soils constitute a major pathway contributing to dietary exposure in Uganda [21,23].
3.2. Wastewater Contamination Used for Irrigation and Food Processing
The use of contaminated surface water and wastewater for irrigation represents an important pathway for PTE transfer into food crops [35,36]. In many urban and peri-urban agricultural systems, untreated or partially treated wastewater is frequently used due to limited access to clean irrigation water and its perceived nutrient benefits [37]. Such waters may contain dissolved PTEs and contaminated suspended particulates that progressively accumulate in agricultural soils and edible plant tissues, particularly in leafy vegetables [28,31,38]. The extent of accumulation may depend on irrigation frequency, contaminant concentration, soil characteristics, crop type, and duration of wastewater use [39]. Contaminated water may also introduce PTEs post-harvest when it is used for washing, soaking, cooking, and food preparation. These practices may increase contaminant concentrations in foods that were initially less contaminated at the point of harvest. Wastewater use may therefore contribute to exposure at both agricultural production and food-processing steps.
3.3. Food Processing and Post-Harvest Contamination
PTE contamination may also be introduced during food processing, handling, storage, transportation, and vending stages [9,40]. Metal leaching from cookware made of poorly regulated alloys can occur under acidic cooking conditions or prolonged heating, increasing metal concentrations even when raw food contamination is relatively low [41]. Likewise, packaging materials, recycled storage containers, and printing inks have been identified as potential secondary sources of trace metal contamination in processed foods [42]. In Uganda, additional contamination may occur through atmospheric deposition of metal-containing dust onto foods displayed in open-air markets or sold along busy roadsides [8,17]. Improper storage, repeated handling, contact with contaminated surfaces, and the use of inadequately cleaned utensils may further contribute to post-harvest contamination. Consequently, PTE concentrations in ready-to-eat foods may reflect both contamination already present in the ingredients and additional inputs introduced during processing, transportation, storage, and vending.
3.4. Industrial Emissions and Mining Activities
Industrial emissions and mining operations represent major localized sources of PTE contamination in Uganda [43,44,45]. Atmospheric emissions, fugitive dust, and waste disposal from industrial facilities may deposit PTEs onto nearby soils, agricultural land, drainage systems, and surface waters [46,47]. These contaminants may subsequently enter food systems through crop uptake, livestock exposure, irrigation, atmospheric deposition, and contamination of aquatic environments. Similarly, mining activities generate waste rock, tailings, dust, and contaminated runoff capable of transporting PTEs into adjacent farmlands and water bodies. Studies conducted around the Tororo–Osukuru mining area have consistently reported elevated concentrations of Pb and Cd in crops cultivated near mining operations, illustrating the importance of mining-derived contamination pathways [10,33,48]. The magnitude of contamination may vary according to the mineral being extracted, waste-management practices, distance from the mining site, prevailing wind direction, drainage patterns, and soil characteristics [49].
3.5. Dumpsite Cultivation
Cultivation on or adjacent to municipal dumpsites represents another important source of PTE contamination within Ugandan food systems [50,51]. PTEs released through waste decomposition, leachate migration, surface runoff, and open accumulation accumulate within surrounding soils, where they become available for crop uptake [52,53]. Although dumpsite soils may appear fertile because of their high organic matter content, they may also contain elevated concentrations of persistent contaminants. Studies conducted around the Mbale municipal dumpsite reported elevated Cd and Pb levels in leafy vegetables and maize tissues cultivated within contaminated soils [22,23]. Crops grown in such areas may subsequently enter nearby markets without being identified as products from contaminated land. Dumpsite cultivation therefore represents an important localized pathway through which environmental contamination may be transferred into the human food chain and contribute to chronic dietary exposure.
3.6. Roadside Cultivation and Market Deposition
Roadside cultivation and open-air marketing expose food products to traffic-related emissions and resuspended dust containing PTEs [54,55]. Vehicle exhaust, brake wear, tire abrasion, and road surface deterioration generate particulate matter containing Pb, Cd, Cr, Ni, and other trace PTEs that may deposit onto crops or accumulate in nearby soils [56]. Crops grown close to heavily trafficked roads may therefore be exposed through both root uptake and foliar deposition. Similar contamination may occur after harvest when vegetables, fruits, and ready-to-eat foods are displayed or prepared in high-traffic market environments [8,17]. Limited protection from dust, repeated handling, and prolonged roadside exposure may increase surface contamination. Consequently, elevated PTE concentrations measured in market foods may reflect both environmental contamination during cultivation and secondary contamination during transport, storage, or vending [7,57].
3.7. Bioaccumulation in Aquatic Foods
Aquatic ecosystems function as important sinks for PTEs transported from industrial activities, mining operations, agricultural runoff, municipal waste, and urban wastewater [58,59,60]. Once introduced into water bodies, PTEs may remain dissolved, bind to suspended particles, or accumulate in sediments [29]. Contaminated sediments can act as long-term reservoirs from which PTEs become available for uptake by benthic organisms, aquatic plants, and fish, resulting in bioaccumulation within edible tissues [58,60,61]. Communities relying heavily on fish and other aquatic foods from contaminated water bodies may therefore experience increased dietary exposure [62,63]. The extent of accumulation may vary according to the PTE, fish species, trophic level, age, feeding behavior, habitat, and tissue type [64]. Tissue-specific accumulation may also influence exposure, depending on whether muscle or organ tissues are consumed, with some organs exhibiting higher metal concentrations than fillets [65,66]. Consequently, fish and other aquatic foods constitute an important exposure pathway in regions where contaminated freshwater resources support local fisheries.
4. Occurrence and Distribution of PTEs in Ugandan Foodstuffs
PTEs were widely detected in cereals, vegetables, tubers, fish, livestock products, and processed foods consumed in Uganda, although reported concentrations varied considerably among food categories, geographical regions, and individual studies owing to differences in environmental conditions, sampling strategies, analytical methodologies, and reporting practices. Reported concentrations were evaluated against international and national food safety standards, including the Codex Alimentarius Commission’s General Standard for Contaminants and Toxins in Food and Feed (CXS 193-1995), jointly established by the Food and Agriculture Organization (FAO) and the World Health Organization (WHO) [67,68], as well as relevant Uganda National Bureau of Standards (UNBS) and harmonized East African Standards (US EAS) [69]. These standards establish maximum permissible levels for PTEs in specific food commodities; for example, Codex sets limits of 0.30 mg/kg Pb for leafy vegetables, 0.20 mg/kg Pb for cereals, and 0.10 mg/kg Pb for meat, 0.05 mg/kg Cd in vegetables and meat, and 0.20 mg/kg inorganic As in rice, with comparable thresholds adopted in Ugandan and regional standards for similar food categories. Pb and Cd most frequently exceeded these guideline values, while Cr and Ni contributed substantially to localized contamination hotspots such as dumpsites, mining areas, and industrial corridors [8,9,23]. Overall, contamination levels were generally higher in leafy vegetables, animal-sourced foods, fish, and street-vended foods compared with cereals, tubers, and milk, suggesting contributions from both environmental uptake and post-harvest contamination pathways. Because the reviewed studies differed in sample size, analytical approach, and reporting basis (wet- or dry-weight), the occurrence data should be interpreted as a qualitative synthesis of the available evidence rather than nationally representative contamination levels. The geographical distribution of the reviewed studies and the major contamination hotspots is presented in (Figure 2), while the compiled occurrence data across Ugandan regions are summarized in (Table 3).
Figure 2.
Geographical distribution of study locations and reported PTE contamination hotspots in Uganda.
Table 3.
Reported ranges of PTE concentrations in foodstuffs consumed in Uganda.
4.1. Cereals and Grains
Cereals showed considerable variability in PTE concentrations depending on their production environment, geographical region, and processing history. Rice represents a potentially important exposure pathway due to widespread consumption and its capacity to accumulate certain PTEs, particularly As and Cd. Arsenic concentrations in commercial rice brands sold in Kampala ranged from 0.935 to 2.400 mg/kg [80], substantially exceeding the Codex recommended maximum level of 0.2 mg/kg for inorganic arsenic in polished rice. Similarly, imported rice from the Busia and Mutukula border regions also contained elevated Cd concentrations of 0.436–0.604 mg/kg and 0.431–0.609 mg/kg, respectively, while Pb levels ranged from 0.696 to 0.884 mg/kg and 0.699 to 0.901 mg/kg [40,70]. These values exceed WHO/FAO limits for Cd and Pb in rice and other cereal commodities, suggesting regular rice consumption may contribute significantly to chronic dietary exposure.
Maize generally contained lower PTE concentrations than rice; however, marked differences were observed between plant tissues and cultivation environments. In farming areas surrounding the Mbale municipal dumpsite, maize leaves contained Cd concentrations of 0.020–0.050 mg/kg, Cr concentrations of 1.100–1.900 mg/kg, Ni concentrations of 0.900–1.500 mg/kg, and Pb concentrations of 0.300–0.700 mg/kg, whereas maize grains showed lower concentrations Cd at 0.010–0.050 mg/kg and Pb at 0.040–0.060 mg/kg [23,79]. The lower concentrations in grains relative to leaves suggest limited translocation of some PTEs into the edible portions; however, Pb concentrations in maize leaves approached or exceeded the WHO vegetable limit (0.3 mg/kg), suggesting environmental deposition from contaminated soils, contaminated irrigation water, and atmospheric dust [23,84]. Although grain concentrations were comparatively lower, continued cultivation on contaminated soils may result in gradual accumulation over successive growing seasons.
4.2. Vegetables and Fruits
Vegetables exhibited the highest frequency of contamination and the greatest variability among all the food categories reviewed. Leafy vegetables were particularly susceptible to PTE accumulation because of their extensive leaf surface area, rapid growth, and direct exposure to atmospheric deposition [85]. Studies conducted in Kampala urban markets reported Pb concentrations reaching 9.50 mg/kg in leafy vegetables, greatly exceeding the WHO/FAO and UNBS maximum permissible limit of 0.30 m/kg [7,8,57]. Similar exceedances were reported for Cd, particularly in vegetables cultivated under wastewater irrigation or near heavily trafficked roads [31]. The widespread occurrence of elevated Pb and Cd concentrations indicates that urban agriculture remains an important pathway through which environmental contamination enters the human food chain. Even higher concentrations were observed in vegetables grown adjacent to municipal dumpsites and mining areas. Amaranthus cultivated around the Mbale dumpsite accumulated elevated Cd, Cr, Ni, and Pb concentrations, reflecting prolonged exposure to metal-rich leachates and contaminated soils [22,23,84]. The most severe contamination was reported in the Osukuru mining area, where pumpkin and amaranthus leaves contained exceptionally high lead concentrations reaching 50.24 mg/kg, representing one of the highest values reported among Ugandan foodstuffs. These findings demonstrate the strong influence of localized environmental conditions on food contamination and emphasize the need for targeted monitoring in identified hotspot regions [21]. Compared with fruiting vegetables such as tomatoes and cucumbers, leafy vegetables consistently accumulated greater PTE concentrations, indicating that both root uptake and atmospheric deposition contribute significantly to contamination [79]. Consequently, leafy vegetables appear to represent the highest-priority food category for routine surveillance within Uganda.
4.3. Tubers and Root Crops
Root and tuber crops generally exhibited lower PTE concentrations than leafy vegetables but remain important contributors to dietary exposure because of their widespread consumption throughout Uganda. Overall, these crops showed comparatively lower Pb concentrations than vegetables and animal-source foods, although measurable levels of Cd, Ni, and As were consistently reported across several regions. In Kasese, yams contained Cd concentrations of 0.001–0.050 mg/kg, Ni 0.200–3.300 mg/kg, Pb 0.010–0.040 mg/kg, and As 0.003–0.070 mg/kg, while cassava accumulated Ni concentrations of up to 3.700 mg/kg [33,48]. Similarly, matooke also showed detectable concentrations of Cd (0.001–0.020 mg/kg), Ni (0.100–3.200 mg/kg), and Pb (0.002–0.060 mg/kg) [33]. Sweet potatoes also exhibited elevated Ni concentrations ranging from 1.200 to 3.810 mg/kg, while Pb concentrations remained comparatively low [33]. Although most Pb concentrations were below WHO/FAO and Ugandan guideline values, the relatively elevated Ni concentrations suggest localized influences from geological conditions, mining activities, or agricultural inputs [86]. Compared with leafy vegetables, the generally lower accumulation observed in underground storage organs likely reflects physiological barriers that restrict the translocation of several PTEs from roots to edible tissues. Nevertheless, prolonged cultivation in contaminated soils may still result in chronic low-level dietary exposure, particularly because these staple foods are consumed frequently by many Ugandan households. Continued monitoring therefore remains important in regions affected by mining, wastewater irrigation, industrial activities, or other anthropogenic sources of PTE contamination.
4.4. Fish and Aquatic Foods
Fish and other aquatic foods exhibited some of the highest PTE concentrations reported in the compiled dataset, highlighting the importance of aquatic ecosystems as both contaminant sinks and dietary exposure pathways. Aquatic organisms readily accumulate PTEs from contaminated water, sediments, and suspended particulates through bioaccumulation, making them useful indicators of environmental pollution. Studies conducted in western Uganda reported exceptionally high Pb concentrations in mudfish ranging from 20.50 to 69.40 mg/kg in edible muscle and 30.30–89.60 mg/kg in gill tissues, far exceeding the WHO/FAO and Ugandan maximum permissible limit of 0.3 mg/kg [63]. Similarly, gilled lungfish collected from Lira contained Pb concentrations ranging from 1.690 to 5.120 mg/kg [71]. These extremely elevated values indicate significant contamination of aquatic systems, likely arising from sediment-associated PTEs, mining activities, industrial or municipal discharges, and catchment-derived runoff [29,58]. The consistently higher concentrations observed in gill tissues compared to muscle suggest dominant uptake through waterborne exposure and particulate ingestion pathways rather than dietary accumulation alone [62,66]. Given the importance of fish in the Ugandan diet, particularly in lakeshore communities, these findings indicate that fish consumption may represent a significant pathway of chronic dietary exposure in contaminated aquatic systems.
4.5. Livestock Products
Livestock products showed significant regional variability, reflecting differences in grazing environments, feed quality, drinking water, and surrounding environmental conditions. Beef from Soroti contained some of the highest reported concentrations among Ugandan animal-source foods, with Cd ranging from 0.110 to 0.980 mg/kg, Cr 11.60 to 32.50 mg/kg, Ni 5.970 to 26.58 mg/kg, and Pb 2.410 to 10.94 mg/kg [72]. Chicken eggs similarly contained measurable concentrations of Cd (0.03–0.250 mg/kg), Cr (1.810–11.63 mg/kg), Pb (0.010–0.040 mg/kg), and As (0.040–1.840 mg/kg) [77]. Many of these values greatly exceed the WHO/FAO and Ugandan guideline values, particularly for Pb (0.1 mg/kg) and Cd (0.05 mg/kg) in meat, suggesting contamination through grazing on polluted land, contaminated feed, drinking water, or incidental soil ingestion. These findings indicate that livestock products may constitute important dietary exposure pathways in affected regions [20,87]. In contrast, milk generally showed comparatively lower contamination levels. Raw cow milk collected from Wakiso contained Cd concentrations of 0.002–0.015 mg/kg and Pb concentrations of 0.002–0.018 mg/kg, both below WHO/FAO limits [81]. However, milk collected from Mbarara contained Pb concentrations ranging from 6.620 to 14.34 mg/kg [20], indicating possible localized contamination from feed, water, or environmental sources. This contrast indicates that localized environmental or production-related factors may exert a strong influence on contamination. This marked geographical variability highlights the importance of routine surveillance of livestock-derived foods, particularly in regions influenced by mining, industrial activities, or intensive agriculture.
4.6. Street Foods and Processed Foods
Street-vended and processed foods represent an increasingly important component of urban diets in Uganda and therefore constitute a potentially significant pathway for dietary exposure to heavy metals. Compared with fresh meat products, street-roasted meats consistently exhibited higher concentrations of Pb and Cd, suggesting that contamination may occur during cooking, handling, storage, or roadside vending in addition to primary production. Street-roasted pork contained Cd concentrations ranging from 0.011 to 0.189 mg/kg, Cr 0.540 to 2.160 mg/kg, Pb 0.880 to 3.700 mg/kg, and As 0.020 to 0.040 mg/kg. Similarly, street-roasted beef contained Cd concentrations of 0.042–0.084 mg/kg, Cr 1.230–3.470 mg/kg, Pb 1.707–2.267 mg/kg, and As 0.024–0.130 mg/kg, while street-roasted chicken contained Cd 0.131–0.251 mg/kg, Cr 1.430–2.170 mg/kg, and Pb 0.381–2.161 mg/kg [73]. These values exceed WHO/FAO and Ugandan permissible limits for meat, suggesting contamination during roasting, handling, or exposure to roadside dust [88,89]. These findings indicate that street foods may represent an important exposure pathway due to environmental deposition and cooking-related contamination. Similarly, cereal-based baby foods contained lower concentrations, including Cd at 0.002–0.016 mg/kg, Pb at 0.001–0.016 mg/kg, and As at 0.010–0.030 mg/kg [75], indicating additional exposure pathways for sensitive populations. Although these concentrations were lower than those reported in many street-vended foods, continued monitoring remains essential because infants and young children are particularly vulnerable to the adverse health effects of chronic PTE exposure.
5. Integrated Discussion: Screening-Level Risk, Regional Hotspots, Regulatory Compliance, Public Health Implications, and Management Priorities
The occurrence data and screening-level risk assessment collectively indicate that PTE contamination within Ugandan food systems is highly heterogeneous and largely hotspot-driven rather than uniformly distributed nationwide. Elevated concentrations were mainly associated with mining-influenced agricultural areas, wastewater-irrigated farms, municipal dumpsites, industrial corridors, contaminated aquatic environments, and urban food production and marketing systems. Therefore, the calculated EDI, THQ, HI, CR, and TCR values should be interpreted as comparative screening-level indicators rather than population-weighted or nationally representative dietary exposure estimates. Nevertheless, the assessment provides a useful basis for identifying priority PTEs, vulnerable population groups, high-risk food categories, and geographical areas requiring targeted monitoring and intervention.
5.1. Screening-Level Exposure and Risk Estimates by Region
Representative regional PTE concentrations were derived from the compiled occurrence dataset to facilitate comparative screening-level dietary risk assessment. For each food item within a region, the midpoint of the reported concentration range was calculated, after which the resulting midpoints were averaged by PTE within each region. The resulting concentrations are summarized in (Table 4), while corresponding estimated daily intake (EDI), total hazard quotient (THQ), and hazard index (HI) values are presented in (Table 5). Because these representative concentrations were derived from heterogeneous studies encompassing different food categories, sample sizes, analytical methods, and reporting bases, they were used to provide a harmonized basis for regional comparison rather than to estimate true regional mean concentrations. Accordingly, the calculated risk metrics should be interpreted as screening-level indicators for comparative assessment rather than precise estimates of population exposure.
Table 4.
Representative regional representative PTE concentrations used for dietary risk calculations.
Table 5.
Estimated daily intake, target hazard quotient, and hazard index for children and adults across Ugandan regions.
The calculated EDI, THQ, and HI values varied substantially among geographical regions and between age groups, reflecting differences in representative PTE concentrations and body-weight-adjusted dietary exposure (Table 5). Consistent with previous dietary exposure studies, children exhibited higher EDI and THQ values than adults due to lower body weight and greater food intake relative to body mass [90], with the highest EDI observed for Pb in Eastern Uganda (0.1692 mg/kg/day for children) and Northern Uganda (0.1050 mg/kg/day for children), and for Cr in Northern Uganda (0.0665 mg/kg/day for children). These elevated intake values translated into high THQ values, particularly for Pb, Cr, and Cd, which dominated non-carcinogenic risk across regions. Hazard index values exceeded the recommended safety threshold (HI = 1) for all regions in both children and adults, with the highest cumulative risk observed in Eastern Uganda (HI = 91.38 for children; 33.82 for adults), followed by Central Uganda (HI = 50.55 for children; 19.62 for adults) and Northern Uganda (HI = 40.51 for children; 15.72 for adults). The elevated HI values reflect the use of conservative, screening-level representative concentrations derived from reported ranges, and therefore represent worst-case exposure scenarios rather than population-weighted estimates.
These values are substantially higher than those reported in similar food-based exposure assessments from other regions, where HI values typically range between 1 and 10 for vegetables and staple foods in countries such as Ghana, Nigeria, China, and India, with children generally exhibiting higher risk than adults (e.g., HI values of 2.3–8.5 reported for vegetables in Ghana; 1.8–6.7 for Nigerian food crops; and 3.2–9.4 for cereals and vegetables in parts of China) [91,92,93,94]. The markedly higher HI values observed in the present study indicate stronger localized contamination and cumulative exposure from multiple food sources. Overall, Pb and Cr contributed most strongly to dietary exposure and non-carcinogenic risk, while consistently higher EDI, THQ, and HI values in children indicate greater vulnerability of younger populations to chronic dietary PTE exposure, consistent with findings from previous dietary risk assessments in Africa and Asia that identify children as the most sensitive population group due to higher intake per body weight and increased susceptibility to metal toxicity [95,96].
5.2. Carcinogenic Risk Assessment
Carcinogenic risk was estimated using the approach described in Section 2.4.3, and the resulting CR and TCR are presented in (Table 6). Estimated TCR values exceeded the commonly accepted lifetime risk threshold (1 × 10⁻⁴) [97] for all evaluated regions, indicating potential long-term cancer risk associated with dietary exposure. The highest TCR occurred in Eastern Uganda, reaching 0.0831 for children and 0.0322 for adults, followed by Central Uganda (0.0414 for children and 0.0161 for adults) and Northern Uganda (0.0394 for children and 0.0153 for adults). Consistent with the non-carcinogenic assessment, children exhibited higher carcinogenic risk estimates than adults because of greater dietary intake relative to body weight. Among the evaluated PTEs, Cr and Pb contributed most strongly to the calculated carcinogenic risk, while As contributed to a lesser extent depending on the food category and geographical region. The calculated CR were influenced by the representative regional concentrations, generalized dietary ingestion rates, assumed complete bioavailability, and toxicological assumptions applied in the analysis. Of particular importance is the treatment of total chromium as Cr(VI) because most Ugandan studies did not provide chromium speciation. Since Cr(VI) is substantially more carcinogenic than Cr(III) [98], this health-protective assumption may considerably overestimate chromium-related cancer risk where Cr(III) constitutes most of the measured total chromium.
Table 6.
Screening-level carcinogenic and total carcinogenic risks associated with PTEs in Ugandan foodstuffs for children and adults.
Although the calculated values are substantially higher than those reported in comparable dietary exposure assessments in other regions, where TCR values for food-based exposure typically fall within the range of 10−6 to 10−4 for vegetables and staple foods in countries such as China, India, Ghana, and Nigeria, with only localized hotspots exceeding the upper acceptable limit [99,100,101,102]. The present assessment employed representative midpoint concentrations compiled from heterogeneous datasets, generalized dietary ingestion rates, and conservative toxicological assumptions, including the treatment of total chromium as Cr(VI) for screening purposes. Collectively, these assumptions are intentionally health protective and may overestimate actual carcinogenic risk where exposure is lower or where less toxic chromium species predominate.
Nevertheless, the consistently elevated TCR values identified in hotspot regions indicate that chronic dietary exposure to multiple PTEs warrants continued attention, particularly in areas influenced by mining activities, wastewater irrigation, municipal dumpsites, and industrial emissions. Rather than representing definitive estimates of population cancer risk, the calculated CR and TCR values should be interpreted as screening-level indicators that assist in prioritizing food commodities, geographical hotspots, and contaminants for detailed exposure assessment, environmental monitoring, and regulatory intervention. Future investigations incorporating metal speciation, Uganda-specific food consumption data, probabilistic exposure modelling, and human biomonitoring would substantially improve characterization of carcinogenic risk under local exposure conditions.
5.3. Regional Hotspot Interpretation
Spatial integration of the occurrence data in (Table 3), representative regional concentrations in (Table 4), and screening-level risk estimates in (Table 5 and Table 6) identified clear geographical differences in PTE concentration across Uganda. Eastern Uganda consistently exhibited the highest cumulative non-carcinogenic (HI) and carcinogenic (TCR) risks, followed by Central, Northern, Western, and Southwestern Uganda. These regional differences reflect variations in environmental contamination sources, land-use practices, agricultural activities, and food production systems rather than uniform nationwide contamination.
Eastern Uganda emerged as the principal contamination hotspot, largely because of the combined influence of mining activities, municipal dumpsite cultivation, contaminated livestock production systems, and intensive agriculture. Beef from Soroti contained some of the highest concentrations of Cd, Cr, Ni, and Pb reported in the reviewed literature, while vegetables cultivated around the Mbale municipal dumpsite and crops grown adjacent to the Osukuru phosphate mining area exhibited substantial PTE accumulation. The convergence of these contamination sources explains the consistently higher EDI, HI, and TCR values observed for this region, highlighting Eastern Uganda as a priority area for environmental monitoring and food safety interventions.
Central Uganda also exhibited substantial cumulative screening-level risk, driven by contamination reported in urban vegetables, commercial rice, street-vended foods, tea, eggs, and selected livestock products. Kampala and its surrounding districts are affected by dense traffic, industrial activity, wastewater irrigation, open-air food marketing, and rapid urban development. These overlapping pressures may expose foods to PTEs during cultivation, transportation, processing, and vending. Northern Uganda exhibited moderate screening-level risk, driven mainly by cereals, fish, and livestock products, whereas Southwestern Uganda showed contamination largely associated with vegetables and animal-derived foods, with Cd and Pb contributing most strongly to cumulative exposure. Western Uganda presented notable localized contamination in fish and root crops, particularly in Kasese, where mining activities, contaminated sediments, and naturally mineralized geological formations may influence environmental PTE concentrations. A summary of regional hotspot foods, priority metals, and relative risk levels is presented in (Table 7). Similar spatial hotspot patterns have been reported in other regional food contamination studies, where mining zones [103], urban agriculture near dumpsites [104], and industrial corridors [105] consistently produce higher dietary exposure compared with background agricultural areas. These findings demonstrate that regional averages can conceal substantial within-region variability. A region classified as having comparatively moderate overall risk may still contain individual districts, food commodities, or production systems with severe contamination. Monitoring programs should therefore prioritize specific source–pathway–food combinations rather than relying solely on broad regional classifications.
Table 7.
Summary of screening-level exposure and risk patterns by region.
5.4. Regulatory Compliance with WHO/FAO, Codex, and Ugandan Food Safety Standards
Comparison of the reported PTE concentrations with internationally and nationally recognized food safety standards revealed frequent exceedances across several food categories, particularly for Pb and Cd (Section 4; Table 3). The most affected commodities included leafy vegetables, rice, beef, fish, and street-vended foods, whereas milk generally exhibited lower contamination except for localized hotspots. These exceedances indicate that contamination is primarily associated with specific production environments rather than representing a uniform food safety issue across Uganda.
Leafy vegetables collected from Kampala contained Pb concentrations of ~2.940–9.500 mg/kg [57], substantially exceeding the WHO/FAO and Ugandan vegetable limit of 0.30 mg/kg, while dump site-grown vegetables from Mbale contained Pb concentrations of 0.200–1.400 mg/kg [23], and mining-area vegetables from Osukuru reached 35.21–50.24 mg/kg [21], all above the same threshold. Cadmium in vegetables ranged from 0.020 to 0.100 mg/kg [7], exceeding the 0.05 mg/kg WHO/FAO and Ugandan guideline in several cases. Rice sold in Kampala contained As concentrations of 0.935–2.400 mg/kg [70], exceeding the Codex and Ugandan limit of 0.20 mg/kg in polished rice, while Cd in rice (0.431–0.609 mg/kg) exceeded the 0.40 mg/kg cereal limit and Pb (0.696–0.901 mg/kg) exceeded the 0.20 mg/kg limit. Similarly, beef from Eastern Uganda contained Cd concentrations of 0.110–0.980 mg/kg and Pb concentrations of 2.410–10.94 mg/kg [78], exceeding WHO/FAO and Ugandan meat limits of 0.05 mg/kg and 0.10 mg/kg, respectively. Fish samples contained Pb concentrations of 20.50–69.40 mg/kg [60], exceeding the 0.30 mg/kg WHO/FAO and Ugandan guideline. Street-roasted meats also exceeded limits, with Pb 0.880–3.700 mg/kg and Cd 0.042–0.251 mg/kg [73], surpassing recommended thresholds. In contrast, raw cow milk from Wakiso contained Cd 0.002–0.015 mg/kg and Pb 0.002–0.018 mg/kg [76], below the Ugandan and WHO dairy limits, although localized contamination in Mbarara showed Pb up to 14.34 mg/kg [20], exceeding the 0.02 mg/kg dairy guideline.
Although several food commodities complied with guideline values in some regions, particularly raw cow milk from Wakiso, the marked geographical variability observed across the reviewed studies demonstrates that compliance cannot be generalized nationally. Rather, food safety appears to be strongly influenced by localized environmental conditions, agricultural practices, and post-harvest handling. These findings reinforce the importance of routine surveillance targeting high-risk food commodities produced within mining areas, wastewater-irrigated farms, municipal dumpsites, industrial corridors, and urban markets.
From a regulatory perspective, the widespread exceedance of Codex, WHO/FAO, and Ugandan food safety standards highlights the need to strengthen implementation of existing environmental and food safety legislation. Improved enforcement of the National Environment Act, the National Environment (Waste Management) Regulations, relevant UNBS food standards, and associated regulations governing industrial emissions, wastewater discharge, mining activities, and agricultural production would reduce contaminant inputs into food systems before they reach consumers. Integrating environmental monitoring with routine food safety surveillance would further support early identification of contamination hotspots and facilitate evidence-based regulatory interventions.
5.5. Integrated Toxicological and Public Health Interpretation
The toxicological significance of the observed contamination patterns indicates that among the PTEs evaluated, Pb exposure poses the greatest public health concern, particularly for children consuming contaminated vegetables, beef, fish, and street foods [18]. Chronic Pb exposure has been associated with neurodevelopmental impairment, reduced cognitive performance, behavioral disorders, and cardiovascular effects [106]. Cd, detected mainly in cereals, vegetables, and livestock products, may accumulate in the kidneys and bones, leading to renal dysfunction and skeletal damage following prolonged exposure [15,107]. Elevated Cr concentrations, particularly in mining-influenced areas, also contributed substantially to the calculated carcinogenic risk; however, because most Ugandan studies reported total chromium rather than chromium speciation, the assumption that total Cr represents Cr(VI) provides a conservative, health-protective estimate that may overestimate actual risk [108]. Nickel exposure from vegetables and cereals may contribute to allergic responses and potential carcinogenic risk under chronic exposure [109]. Arsenic exposure through rice and fish further contributes to long-term cancer risk and cardiovascular effects [110]. The toxicological significance of the PTEs detected in Ugandan food systems is summarized in (Table 8). Overall, the screening-level assessment indicates that foodborne PTE exposure in Ugandan food systems is primarily driven by chronic low-dose intake rather than acute poisoning events. Children consistently exhibited higher EDI, THQ, HI, and TCR values than adults because of greater food intake relative to body weight and increased physiological susceptibility. Although the calculated risks were based on conservative screening assumptions, they identify Pb and Cd as the dominant contributors to cumulative dietary exposure and highlight hotspot regions such as Eastern Uganda and urban vegetable production systems as priorities for monitoring and intervention.
Table 8.
Toxicological implications of PTEs detected in Ugandan foodstuffs.
5.6. Remediation and Management Strategies for PTE-Contaminated Food Systems
The contamination patterns identified in this review highlight the need for integrated management strategies that reduce PTE inputs throughout the food production and distribution chain. Because contamination is concentrated within localized hotspots, mitigation efforts should prioritize mining-affected areas, wastewater-irrigated farms, municipal dumpsites, industrial corridors, and high-risk urban markets rather than broad nationwide interventions. Source control remains the most effective long-term strategy and should include strengthened regulation of industrial effluents, mining waste disposal, wastewater reuse, and municipal waste management. In contaminated agricultural areas, remediation approaches such as biochar application, lime and organic amendments, phytoremediation, and improved irrigation water management have demonstrated considerable potential to reduce PTE mobility, plant uptake, and subsequent transfer into the food chain while maintaining soil productivity [111,112,113,114].
Complementary food safety measures are equally important. Routine monitoring should prioritize high-risk commodities identified in this review, particularly leafy vegetables, cereals, livestock products, fish, and street-vended foods produced within contamination hotspots. Adoption of Good Agricultural Practices (GAPs), standardized monitoring protocols, and improved post-harvest handling should be supported through stronger coordination among environmental, agricultural, food safety, and public health institutions [26,40,115]. Future research should focus on nationally representative food consumption data, metal speciation, bioavailability, biomonitoring, and probabilistic exposure assessment to improve the accuracy of dietary risk characterization and support evidence-based food safety policies in Uganda.
6. Conclusions and Recommendations
This review synthesizes the available evidence on PTE contamination in foods consumed in Uganda and demonstrates that contamination is highly localized rather than uniformly distributed nationwide. Elevated concentrations were consistently associated with mining-influenced agricultural areas, wastewater-irrigated farms, municipal dumpsites, industrial corridors, contaminated aquatic environments, and urban food markets, with Pb and Cd emerging as the dominant contaminants across most food categories. The screening-level exposure assessment further identified children as the most vulnerable population because of higher dietary intake relative to body weight. At the same time, vegetables, cereals, livestock products, fish, and street-vended foods represented the principal dietary exposure pathways, although the dominant food–metal combinations varied geographically. Eastern Uganda showed the highest overall screening priority, followed by Central, Northern, Southwestern, and Western Uganda, with each region exhibiting distinct contamination sources and affected food commodities. However, because the risk estimates were derived from heterogeneous published datasets using harmonized and conservative assumptions, they should be interpreted as comparative screening-level indicators for identifying priority contaminants, food categories, and contamination hotspots rather than nationally representative estimates of dietary exposure. Overall, the findings highlight the need for strengthened food safety surveillance and environmental pollution control in identified hotspot regions while also exposing important knowledge gaps, including limited chromium speciation, inconsistent reporting of wet- and dry-weight concentrations, variability in analytical methodologies, and the absence of nationally representative food consumption data. Addressing these limitations will improve future exposure assessments and support more effective evidence-based food safety management in Uganda.
Recommendations and Future Research Priorities
Future research, monitoring, and policy efforts should prioritize the following actions:
- Targeted surveillance of high-risk food commodities produced within identified contamination hotspots, particularly leafy vegetables, cereals, livestock products, fish, and street-vended foods.
- Stronger control of industrial emissions, mining activities, wastewater reuse, and municipal waste disposal to reduce contaminant transfer into agricultural production systems.
- Standardization of sampling protocols, analytical methods, QA/QC procedures, wet- and dry-weight reporting, detection limits, and metal speciation to improve comparability among future studies.
- Development of Uganda-specific food consumption datasets, probabilistic dietary exposure assessments, biomonitoring studies, and geospatial mapping of contamination hotspots to strengthen future risk characterization and guide evidence-based policy.
Author Contributions
Conceptualization, G.B. (Gabson Baguma); G.B. (Gadson Bamanya) and A.G.; methodology, G.B. (Gabson Baguma) and A.G.; formal analysis, G.B. (Gabson Baguma), G.B. (Gadson Bamanya)., A.G., H.T., E.N. and B.M.; investigation, G.B. (Gabson Baguma), H.T., A.G., E.N. and B.M.; data curation, G.B. (Gabson Baguma), G.B. (Gadson Bamanya) and A.G.; writing—original draft preparation, G.B. (Gabson Baguma) and G.B. (Gadson Bamanya); writing—review and editing, all authors; visualization, G.B. (Gadson Bamanya) and A.G.; supervision, G.B. (Gabson Baguma) and H.T. All authors have read and agreed to the published version of the manuscript.
Funding
This research received no external funding.
Institutional Review Board Statement
Not applicable.
Informed Consent Statement
Not applicable.
Data Availability Statement
No new experimental data were generated in this study. All data supporting the findings are contained within the article and its cited references.
Conflicts of Interest
All authors declare that this research was conducted in the absence of any commercial or financial relationships that could be construed as a potential conflict of interest.
References
- Munir, N.; Jahangeer, M.; Bouyahya, A.; El Omari, N.; Ghchime, R.; Balahbib, A.; Aboulaghras, S.; Mahmood, Z.; Akram, M.; Ali Shah, S.M.; et al. Heavy Metal Contamination of Natural Foods Is a Serious Health Issue: A Review. Sustainability 2022, 14, 161. [Google Scholar] [CrossRef] [Scilit]
- Jaishankar, M.; Tseten, T.; Anbalagan, N.; Mathew, B.B.; Beeregowda, K.N. Toxicity, Mechanism and Health Effects of Some Heavy Metals. Interdiscip. Toxicol. 2014, 7, 60–72. [Google Scholar] [CrossRef] [Scilit] [PubMed]
- Baguma, G.; Bamanya, G.; Gonzaga, A.; Ampaire, W.; Onen, P. A Systematic Review of Contaminants of Concern in Uganda: Occurrence, Sources, Potential Risks, and Removal Strategies. Pollutants 2023, 3, 544–586. [Google Scholar] [CrossRef] [Scilit]
- Kerna, N.A.; Holets, H.M.; Ii, J.A.; Flores, J.V.; Pruitt, K.D.; McKee, D.; Carsrud, N.D.V.; Ngwu, D.C.; Nnake, I.; Chawla, S.; et al. Heavy Metals and Human Health: From Neurological Disorders to Developmental Delays. Eur. J. Ecol. Biol. Agric. 2024, 1, 152–184. [Google Scholar] [CrossRef] [Scilit] [PubMed]
- Ciobanu, C.; Slencu, B.G.; Cuciureanu, R. Estimation of Dietary Intake of Cadmium and Lead through Food Consumption. Med.-Surg. J. 2012, 116, 617–623. [Google Scholar]
- Gupta, V.K.; Singh, S.; Agrawal, A.; Siddiqi, N.J.; Sharma, B. Phytochemicals Mediated Remediation of Neurotoxicity Induced by Heavy Metals. Biochem. Res. Int. 2015, 2015, 534769. [Google Scholar] [CrossRef] [Scilit] [PubMed]
- Mbabazi, J.; Wasswa, J.; Kwetegyeka, J.; Bakyaita, G.K. Heavy Metal Contamination in Vegetables Cultivated on a Major Urban Wetland Inlet Drainage System of Lake Victoria, Uganda. Int. J. Environ. Stud. 2010, 67, 333–348. [Google Scholar] [CrossRef] [Scilit]
- Kasozi, K.I.; Otim, E.O.; Ninsiima, H.I.; Zirintunda, G.; Tamale, A.; Ekou, J.; Musoke, G.H.; Muyinda, R.; Matama, K.; Mujinya, R.; et al. An Analysis of Heavy Metals Contamination and Estimating the Daily Intakes of Vegetables from Uganda. Toxicol. Res. Appl. 2021, 5, 2397847320985255. [Google Scholar] [CrossRef] [Scilit]
- Mugume, H.K.; Byamugisha, D.; Omara, T.; Ntambi, E. Deposition, Dietary Exposure and Human Health Risks of Heavy Metals in Mechanically Milled Maize Flours in Mbarara City, Uganda. J. Xenobiotics 2023, 13, 298–311. [Google Scholar] [CrossRef] [Scilit] [PubMed]
- Etumah, S.O.; Ifie, J.E.; Odoma, S.; Babangida, A.I.; Aja, P.M. Integrated Assessment of Antioxidant Defense, Phytohormonal Responses, and Rhizomicrobial Dynamics in Maize Cultivated on Heavy Metal Impacted Mining Soils, Kilembe, Uganda. F1000Research 2025, 14, 877. [Google Scholar] [CrossRef] [Scilit]
- Baguma, G.; Bamanya, G.; Twinomuhwezi, H.; Gonzaga, A.; Omara, T.; Onen, P.; Ocakacon, S.; Angiro, C.; Waibale, W.; Ntuwa, R. Bioaccumulation and Transfer of Potentially Toxic Elements in the Yam-Soil System and Associated Health Risks in Kampala’s Luzira Industrial Area. J. Xenobiotics 2025, 15, 193. [Google Scholar] [CrossRef] [Scilit] [PubMed]
- Mititelu, M.; Neacșu, S.M.; Busnatu, Ș.S.; Scafa-Udriște, A.; Andronic, O.; Lăcraru, A.-E.; Ioniță-Mîndrican, C.-B.; Lupuliasa, D.; Negrei, C.; Olteanu, G. Assessing Heavy Metal Contamination in Food: Implications for Human Health and Environmental Safety. Toxics 2025, 13, 333. [Google Scholar] [CrossRef] [Scilit] [PubMed]
- Rai, P.K.; Lee, S.S.; Zhang, M.; Tsang, Y.F.; Kim, K.-H. Heavy Metals in Food Crops: Health Risks, Fate, Mechanisms, and Management. Environ. Int. 2019, 125, 365–385. [Google Scholar] [CrossRef] [Scilit] [PubMed]
- Sanders, T.; Liu, Y.; Buchner, V.; Tchounwou, P.B. Neurotoxic Effects and Biomarkers of Lead Exposure: A Review. Rev. Environ. Health 2009, 24, 15–46. [Google Scholar] [CrossRef] [Scilit] [PubMed]
- Satarug, S.; Garrett, S.H.; Sens, M.A.; Sens, D.A. Cadmium, Environmental Exposure, and Health Outcomes. Environ. Health Perspect. 2010, 118, 182–190. [Google Scholar] [CrossRef] [Scilit] [PubMed]
- Oudah, A.J.A.-A.; AL-Jebory, R.W.S.; Zurfi, A.H.R.A.; Jasim, H.M. Mechanisms of Heavy Metal Toxicity at the Cellular, Molecular and General Health Levels. J. Biomed. Biochem. 2025, 4, 98–123. [Google Scholar] [CrossRef] [Scilit]
- Otim, E.O.; Kasozi, K.I.; Zirintunda, G.; Matama, K.; Otim, O. Investigating Vegetable Contamination in Indigent Communities by Heavy Metals: A Case of Food Safety in Bushenyi, Uganda. Environ. Pollut. Bioavailab. 2021, 33, 292–300. [Google Scholar] [CrossRef] [Scilit]
- Kasozi, K.I.; Namazi, C.; Basemera, E.; Atuheire, C.; Odwee, A.; Majalija, S.; Kateregga, J.N. Inorganic Pollutants in Edible Grasshoppers (Ruspolia Nitidula) of Uganda and Their Major Public Health Implications. Afr. Health Sci. 2019, 19, 2679–2691. [Google Scholar] [CrossRef] [Scilit] [PubMed]
- Nabulo, G.; Young, S.D.; Black, C.R. Assessing Risk to Human Health from Tropical Leafy Vegetables Grown on Contaminated Urban Soils. Sci. Total Environ. 2010, 408, 5338–5351. [Google Scholar] [CrossRef] [Scilit] [PubMed]
- Kasozi, K.I.; Natabo, P.C.; Namubiru, S.; Tayebwa, D.S.; Tamale, A.; Bamaiyi, P.H. Food Safety Analysis of Milk and Beef in Southwestern Uganda. J. Environ. Public Health 2018, 2018, 1627180. [Google Scholar] [CrossRef] [Scilit] [PubMed]
- Tagumira, A.; Biira, S.; Amabayo, E.B. Concentrations and Human Health Risk Assessment of Selected Heavy Metals in Soils and Food Crops around Osukuru Phosphate Mine, Tororo District, Uganda. Toxicol. Rep. 2022, 9, 2042–2049. [Google Scholar] [CrossRef] [Scilit] [PubMed]
- Twinamatsiko, R.; Mbabazi, J.; Twinomuhwezi, H. Toxic Metal Levels in Food Crops Grown From Dump-Sites Around Gulu Municipality, Northern Uganda. Int. J. Soc. Sci. Technol. 2016, 1, 22–45. [Google Scholar] [CrossRef] [Scilit]
- Awino, F.B.; Maher, W.A.; Krikowa, F.; Lynch, A.J.J. Occurrence of Trace Metals in Food Crops Grown on the Mbale Dumpsite, Uganda, and Human Health Risks. Integr. Environ. Assess. Manag. 2020, 16, 362–377. [Google Scholar] [CrossRef] [Scilit] [PubMed]
- Rakhunde, R.; Deshpande, L.; Juneja, H.D. Chemical Speciation of Chromium in Water: A Review. Crit. Rev. Environ. Sci. Technol. 2012, 42, 776–810. [Google Scholar] [CrossRef] [Scilit]
- United States Environmental Protection Agency. Exposure Factors Handbook (2011 Edition). Available online: https://www.epa.gov/expobox/exposure-factors-handbook-2011-edition (accessed on 1 July 2026).
- World Health Organization; Food and Agriculture Organization of the United Nations. Food Safety Risk Analysis. A Guide for National Food Safety Authorities; Food and Agriculture Organization of the United Nations: Rome, Italy, 2006; 119p. [Google Scholar]
- US EPA. Risk Assessment Guidance for Superfund Volume I: Human Health Evaluation Manual (Part F, Supplemental Guidance for Inhalation Risk Assessment); Office Superfund Remediation and Technology Innovation Environmental Protection Agency: Washington, DC, USA, 2009; Volume I, pp. 1–68. [Google Scholar]
- Rutehenda, D.R.; Adaku, C.; Omara, T.; Angiro, C.; Ntambi, E. Enrichment, Bioaccumulation and Health Risks of Trace Metals in Soils and Leafy Vegetables Grown on the Banks of the Ugandan Lifeline River, River Rwizi. World 2024, 5, 136–154. [Google Scholar] [CrossRef] [Scilit]
- Baguma, G.; Musasizi, A.; Twinomuhwezi, H.; Gonzaga, A.; Nakiguli, C.K.; Onen, P.; Angiro, C.; Okwir, A.; Opio, B.; Otema, T.; et al. Heavy Metal Contamination of Sediments from an Exoreic African Great Lakes’ Shores (Port Bell, Lake Victoria), Uganda. Pollutants 2022, 2, 407–421. [Google Scholar] [CrossRef] [Scilit]
- Nabulo, G.; Oryem Origa, H.; Nasinyama, G.W.; Cole, D. Assessment of Zn, Cu, Pb and Ni Contamination in Wetland Soils and Plants in the Lake Victoria Basin. Int. J. Environ. Sci. Technol. 2008, 5, 65–74. [Google Scholar] [CrossRef] [Scilit]
- Nabulo, G.; Black, C.R.; Craigon, J.; Young, S.D. Does Consumption of Leafy Vegetables Grown in Peri-Urban Agriculture Pose a Risk to Human Health? Environ. Pollut. 2012, 162, 389–398. [Google Scholar] [CrossRef] [Scilit] [PubMed]
- Rashid, A.; Schutte, B.J.; Ulery, A.; Deyholos, M.K.; Sanogo, S.; Lehnhoff, E.A.; Beck, L. Heavy Metal Contamination in Agricultural Soil: Environmental Pollutants Affecting Crop Health. Agronomy 2023, 13, 1521. [Google Scholar] [CrossRef] [Scilit]
- Mwesigye, A.R.; Young, S.D.; Bailey, E.H.; Tumwebaze, S.B. Uptake of Trace Elements by Food Crops Grown within the Kilembe Copper Mine Catchment, Western Uganda. J. Geochem. Explor. 2019, 207, 106377. [Google Scholar] [CrossRef] [Scilit]
- Feng, W.; Guo, Z.; Xiao, X.; Peng, C.; Shi, L.; Ran, H.; Xu, W. A Dynamic Model to Evaluate the Critical Loads of Heavy Metals in Agricultural Soil. Ecotoxicol. Environ. Saf. 2020, 197, 110607. [Google Scholar] [CrossRef] [Scilit] [PubMed]
- Dhiman, J.; Prasher, S.O.; ElSayed, E.; Patel, R.M.; Nzediegwu, C.; Mawof, A. Heavy Metal Uptake by Wastewater Irrigated Potato Plants Grown on Contaminated Soil Treated with Hydrogel Based Amendments. Environ. Technol. Innov. 2020, 19, 100952. [Google Scholar] [CrossRef] [Scilit]
- Singh, A.; Sharma, R.K.; Agrawal, M.; Marshall, F.M. Health Risk Assessment of Heavy Metals via Dietary Intake of Foodstuffs from the Wastewater Irrigated Site of a Dry Tropical Area of India. Food Chem. Toxicol. 2010, 48, 611–619. [Google Scholar] [CrossRef] [Scilit] [PubMed]
- Kaur, N.; Singh, J.; Sharma, N.R.; Natt, S.K.; Mohan, A.; Malik, T.; Girdhar, M. Heavy Metal Contamination in Wastewater-Irrigated Vegetables: Assessing Food Safety Challenges in Developing Asian Countries. Environ. Sci. Process. Impacts 2025, 27, 1747–1767. [Google Scholar] [CrossRef] [Scilit] [PubMed]
- Singh, R.; Singh, P.K.; Madheshiya, P.; Khare, A.K.; Tiwari, S. Heavy Metal Contamination in the Wastewater Irrigated Soil and Bioaccumulation in Cultivated Vegetables: Assessment of Human Health Risk. J. Food Compos. Anal. 2024, 128, 106054. [Google Scholar] [CrossRef] [Scilit]
- Orosun, M.M.; Nwabachili, S.; Alshehri, R.F.; Omeje, M.; Alshdoukhi, I.F.; Okoro, H.K.; Ogunkunle, C.O.; Louis, H.; Abdulhamid, F.A.; Osahon, S.E.; et al. Potentially Toxic Metals in Irrigation Water, Soil, and Vegetables and Their Health Risks Using Monte Carlo Models. Sci. Rep. 2023, 13, 21220. [Google Scholar] [CrossRef] [Scilit] [PubMed]
- Namubiru, L.L.; Male, D.; Mukisa, I.M.; Byaruhanga, Y.B. Food Safety Knowledge, Attitudes and Practices of Food Handlers along the Rice Value Chain of Uganda. J. Food Ind. 2022, 6, 1. [Google Scholar] [CrossRef] [Scilit]
- Habimaana, S.; Gumisiriza, H.; Birungi, G. Trace Metal Leaching from Cookware Locally Fabricated from Scrap Metal: A Case Study of Ntungamo District, Uganda. Am. J. Anal. Chem. 2022, 13, 314–330. [Google Scholar] [CrossRef]
- Rhein, S.; Schmid, M. Consumers’ Awareness of Plastic Packaging: More than Just Environmental Concerns. Resour. Conserv. Recycl. 2020, 162, 105063. [Google Scholar] [CrossRef] [Scilit]
- Mu, T.; Cao, B.; Yang, M.; Gan, X.; Chen, L.; Wang, X.; Li, M.; Lu, Y.; Xu, J. Heavy Metals Distribution and Source Identification in Contaminated Agricultural Soils: Isotopic and Multi-Model Analysis. Agronomy 2025, 15, 812. [Google Scholar] [CrossRef] [Scilit]
- Qiu, L.-F.; Zhu, J.-X.; Pan, Y.; Dang, Y.-X.; Wu, S.-H. Distribution Characteristics, Ecological Risks, and Source Identification of Heavy Metals in Cultivated Land Under Non-grain Production. Huan Jing Ke Xue Huanjing Kexue 2023, 44, 2829–2837. [Google Scholar] [CrossRef] [Scilit] [PubMed]
- Laoye, B.; Olagbemide, P.; Ogunnusi, T.; Akpor, O. Heavy Metal Contamination: Sources, Health Impacts, and Sustainable Mitigation Strategies with Insights from Nigerian Case Studies. F1000Research 2025, 14, 134. [Google Scholar] [CrossRef] [Scilit] [PubMed]
- Namuhani, N.; Cyrus, K. Soil Contamination with Heavy Metals around Jinja Steel Rolling Mills in Jinja Municipality, Uganda. J. Health Pollut. 2015, 5, 61–67. [Google Scholar] [CrossRef] [Scilit] [PubMed]
- Mpewo, M.; Kizza-Nkambwe, S.; Kasima, J.S. Heavy Metal and Metalloid Concentrations in Agricultural Communities around Steel and Iron Industries in Uganda: Implications for Future Food Systems. Environ. Pollut. Bioavailab. 2023, 35, 2226344. [Google Scholar] [CrossRef] [Scilit]
- Masereka, J.; Byamugisha, D.; Adaku, C. Heavy Metal Accumulation in Vegetables Grown in Rock Soils of Kilembe Copper Mine, Kasese, Western Uganda. Asian J. Appl. Chem. Res. 2022, 12, 30–40. [Google Scholar] [CrossRef] [Scilit]
- Guan, Y.; Shao, C.; Ju, M. Heavy Metal Contamination Assessment and Partition for Industrial and Mining Gathering Areas. Int. J. Environ. Res. Public Health 2014, 11, 7286–7303. [Google Scholar] [CrossRef] [Scilit] [PubMed]
- Nyiramigisha, P.; Komariah; Sajidan. Harmful Impacts of Heavy Metal Contamination in the Soil and Crops Grown Around Dumpsites. Rev. Agric. Sci. 2021, 9, 271–282. [Google Scholar] [CrossRef] [Scilit] [PubMed]
- Sanga, V.F.; Pius, C.F. Heavy Metal Contamination in Soil and Food Crops and Associated Human Health Risks in the Vicinity of Iringa Municipal Dumpsite, Tanzania. Discov. Environ. 2024, 2, 104. [Google Scholar] [CrossRef] [Scilit]
- Afolabi, F.; Adeyinka, G.C.; Ajibola, O.O.; Bakare, B.F. Comparative Assessment of Heavy Metal Contamination of Abandoned and Active Dumpsite of Osun Waste Management, Ejigbo Road, Osogbo, Osun State, Nigeria. Int. J. Environ. Anal. Chem. 2023, 103, 8739–8755. [Google Scholar] [CrossRef] [Scilit]
- Njagi, J.; Akunga, D.; Njagi, M.M.; Mp, N.; Njagi, E. Heavy Metal Concentration in Vegetables Grown around Dumpsites in Nairobi City County, Kenya. World Environ. 2017, 7, 49–56. [Google Scholar]
- Atayese, M.; Eigbadon, A.; Oluwa, K.; Adesodun, J. Heavy Metal Contamination of Amaranthus Grown along Major Highways in Lagos, Nigeria. Afr. Crop Sci. J. 2010, 16, 225–235. [Google Scholar] [CrossRef] [Scilit]
- Reddy, A.R.; Madhuri, K.U.; Reddy, G.C.; Parameshwar, P. Heavy Metal Contamination in Roadside Orchards: Implications and Management Strategies: A Review. J. Sci. Res. Rep. 2025, 31, 451–460. [Google Scholar] [CrossRef] [Scilit]
- Adamiec, E.; Jarosz-Krzemińska, E.; Wieszała, R. Heavy Metals from Non-Exhaust Vehicle Emissions in Urban and Motorway Road Dusts. Environ. Monit. Assess. 2016, 188, 369. [Google Scholar] [CrossRef] [Scilit] [PubMed]
- Nabulo, G.; Oryem-Origa, H.; Diamond, M. Assessment of Lead, Cadmium, and Zinc Contamination of Roadside Soils, Surface Films, and Vegetables in Kampala City, Uganda. Environ. Res. 2006, 101, 42–52. [Google Scholar] [CrossRef] [Scilit] [PubMed]
- Jamil Emon, F.; Rohani, M.F.; Sumaiya, N.; Tuj Jannat, M.F.; Akter, Y.; Shahjahan, M.; Abdul Kari, Z.; Tahiluddin, A.B.; Goh, K.W. Bioaccumulation and Bioremediation of Heavy Metals in Fishes-A Review. Toxics 2023, 11, 510. [Google Scholar] [CrossRef] [Scilit] [PubMed]
- Omara, T. Spectroscopic Analysis of Selected Priority Trace Metals in the Extant East African Gilled Lungfish (Protopterus Amphibius) in Lira Municipal Lagoon and Its Edibility Health Risk. Sci. J. Anal. Chem. 2018, 6, 38. [Google Scholar] [CrossRef] [Scilit]
- Lwanga, M.S.; Kansiime, F.; Denny, P.; Scullion, J. Heavy Metals in Lake George, Uganda, with Relation to Metal Concentrations in Tissues of Common Fish Species. Hydrobiologia 2003, 499, 83–93. [Google Scholar] [CrossRef] [Scilit]
- Namulawa, V.T.; Mutiga, S.; Musimbi, F.; Akello, S.; Ngángá, F.; Kago, L.; Kyallo, M.; Harvey, J.; Ghimire, S. Assessment of Fungal Contamination in Fish Feed from the Lake Victoria Basin, Uganda. Toxins 2020, 12, 233. [Google Scholar] [CrossRef] [Scilit] [PubMed]
- Mwebesa, N.; Oyege, I.; Ssekimpi, D.; Ndolo, J.K.; Egor, M. Potential Health Risks from Contaminated Fish in Lake Victoria: A 25-Year Systematic Review of Pollutants and Management Challenges. Sci. Total Environ. 2025, 1005, 180861. [Google Scholar] [CrossRef] [Scilit] [PubMed]
- Mukisa, W.; Yatuha, J.; Andama, M.; Kasangaki, A. Heavy Metal Pollution in The Main Rivers Of Rwenzori Region, Kasese District South-Western Uganda. Octa J. Environ. Res. 2020, 8, 78–90. [Google Scholar]
- Ignacio, S.; Schlotthauer, J.; Sigrist, M.; Volpedo, A.V.; Thompson, G.A. Potentially Toxic Trace Elements in the Muscle of Coastal South American Fish: Implications for Human Consumption and Health Risk Assessment. Mar. Pollut. Bull. 2024, 202, 116384. [Google Scholar] [CrossRef] [Scilit] [PubMed]
- Ikwuemesi, J.C.; Egesi, C.; Irozuru, O.; Ezeamaka, S.N. Bioaccumulation of Heavy Metals in Gills and Muscles of Selected Fish Species from Owerrinta Section of Imo River. J. Aquat. Sci. 2023, 38, 49–57. [Google Scholar] [CrossRef] [Scilit]
- Afshan, S.; Ali, S.; Ameen, U.S.; Farid, M.; Bharwana, S.A.; Hannan, F.; Ahmad, R. Effect of Different Heavy Metal Pollution on Fish. Res. J. Chem. Environ. Sci. 2015, 2, 74–79. [Google Scholar]
- Food and Agriculture Organization of the United Nations (FAO); World Health Organization (WHO). Codex Alimentarius. Available online: https://www.fao.org/fao-who-codexalimentarius/en/ (accessed on 13 April 2026).
- CXS 193-1995; General Standard for Contaminants and Toxins in Food and Feed. Codex Alimentarius Commission: Rome, Italy, 2023. Available online: https://www.fao.org/fao-who-codexalimentarius/codex-texts/list-standards/en/ (accessed on 13 April 2026).
- US EAS 44:2019; Milled Maize (Corn) Products—Specification. Uganda National Bureau of Standards (UNBS): Kampala, Uganda, 2019. Available online: https://webstore.unbs.go.ug/store.php?preview=&src=3996 (accessed on 13 April 2026).
- Namubiru, L.; Male, D.; Muzira, I.M.; Byaruhanga, Y.B. Toxicological Risk Associated with Consumption of Rice Sold in Uganda. Int. J. Sci. Adv. 2021, 2, 1005–1015. [Google Scholar] [CrossRef] [Scilit]
- Makokha, A.O.; Mghweno, L.R.; Magoha, H.S.; Nakajugo, A.; Wekesa, J.M. Environmental Lead Pollution and Contamination in Food around Lake Victoria, Kisumu, Kenya. Afr. J. Environ. Sci. Technol. 2008, 2, 349–353. [Google Scholar]
- Bamuwamye, M.; Ogwok, P.; Tumuhairwe, V.; Eragu, R.; Nakisozi, H.; Ogwang, P.E. Dietary Content and Potential Health Risks of Metals in Commercial Black Tea in Kampala (Uganda). J. Food Res. 2017, 6, 1. [Google Scholar] [CrossRef] [Scilit]
- Bamuwamye, M.; Ogwok, P.; Tumuhairwe, V. Associated with Heavy Metal Exposures from Street Foods: Evaluation of Roasted Meats in an Urban Setting. J. Environ. Pollut. Hum. Health 2015, 3, 24–30. [Google Scholar] [CrossRef]
- Nnamuyomba, P.; Mbabazi, J.; Ntale, M. Trace Elements in Marketed Rastreneobola Argentea and Clarias Werneri Caught from Selected Aquatic Ecosystems in Uganda. Int. J. Curr. Trends Eng. Technol. 2015, I, 76–82. [Google Scholar]
- Nantongo, S. Non-Cancer Health Risks Associated with Pesticide Residues and Heavy Metal Exposures in Locally Manufactured Cereal-Based Baby Foods in Kampala City. Master’s Thesis, Kyambogo University, Kampala, Uganda, November 2019. [Google Scholar]
- Biryomumaisho, S.; Atukwase, A.; Manirakiza, L. Assessment of Lead and Cadmium Concentrations in Raw Cow Milk from Farms near Namanve Industrial Park in Kira Division, Wakiso District, Uganda. J. Appl. Sci. Environ. Manag. 2022, 26, 1357–1361. [Google Scholar] [CrossRef] [Scilit]
- Mugabi, S.; Angubua, S.; Tamale, A.; Nyombi, A. Human Health Risk from Dietary Exposure to Heavy Metals through Poultry Eggs: Evidence from Commercial Farms in Wakiso District, Uganda. Food Chem. Adv. 2026, 10, 101243. [Google Scholar] [CrossRef] [Scilit]
- Kasozi, K.I.; Otim, E.O.; Zirintunda, G.; Tamale, A.; Otim, O. Multivariate Analysis of Heavy Metals Content of Beef from Soroti, Uganda. Toxicol. Rep. 2023, 10, 400–408. [Google Scholar] [CrossRef] [Scilit] [PubMed]
- Awino, F.B.; Maher, W.A.; Fai, P.B.A. Do Crops Grown at Urban Dumpsites Contain Metals at Levels That Pose Unacceptable Health Risks to Consumers? Environ. Toxicol. Chem. 2024, 43, 2628–2644. [Google Scholar] [CrossRef] [Scilit] [PubMed]
- Namubiru, L.; Byenkya Byaruhanga, Y.; Male, D. Incidence of Aflatoxins, Heavy Metals and Pesticide Residues Contamination in Imported and Locally Grown White Rice in Uganda. Int. J. Sci. Res. 2021, 10, 84–91. [Google Scholar] [CrossRef] [Scilit]
- Odongo, M.; Mutagaya, S.A.; Wanasolo, W.; Oketch, D. Investigation of Levels of Some Selected Heavy Metals in Raw Bovine Milk from Oyam District, Uganda and Estimation of Potential Health Risks. Am. J. Appl. Ind. Chem. 2007, 6, 1–6. Available online: https://www.researchgate.net/publication/358226526_Investigation_of_Levels_of_Some_Selected_Heavy_Metals_in_Raw_Bovine_Milk_from_Oyam_District_Uganda_and_Estimation_of_Potential_Health_Risks (accessed on 13 April 2026). [CrossRef]
- Nambowa, B.; Aruwa, J.O.; Adepoju, A.A.; Asanga, O.P.; Sanusi, I.O. Health Risk Assessment of Exposure to Some Heavy Metals from Roasted Pork and Goat Meats Sold in Ishaka-Bushenyi Municipality, Uganda. J. Agric. Chem. Environ. 2024, 13, 325–340. [Google Scholar] [CrossRef]
- Godfrey, M.; Johnson, T.; Juliet, K. Assessment of Heavy Metal Concentrations in Mango Fruits Grown in Kasese District, Uganda. Afr. J. Environ. Sci. Technol. 2021, 15, 451–456. [Google Scholar] [CrossRef] [Scilit]
- Awino, F.B.; Maher, W.; Lynch, A.J.J.; Asanga Fai, P.B.; Otim, O. Comparison of Metal Bioaccumulation in Crop Types and Consumable Parts between Two Growth Periods. Integr. Environ. Assess. Manag. 2022, 18, 1056–1071. [Google Scholar] [CrossRef] [Scilit] [PubMed]
- Gao, J.; Zhang, D.; Proshad, R.; Uwiringiyimana, E.; Wang, Z. Assessment of the Pollution Levels of Potential Toxic Elements in Urban Vegetable Gardens in Southwest China. Sci. Rep. 2021, 11, 22824. [Google Scholar] [CrossRef] [Scilit] [PubMed]
- Mwongyera, A.; Muwanga, A.; Ntale, M. Impact of the Disused Kilembe Mine Pyrites on the Domestic Water Quality of Kasese Town, Western Uganda. Caribb. J. Sci. Technol. 2014, 2, 482–495. [Google Scholar]
- Bamuwamye, M. Health Risk Posed by Lead, Copper and Iron via Consumption of Organ Meats in Kampala City (Uganda). J. Environ. Pollut. Hum. Health 2014, 2, 69–73. Available online: https://www.researchgate.net/publication/316595552_Health_Risk_Posed_by_Lead_Copper_and_Iron_via_Consumption_of_Organ_Meats_in_Kampala_City_Uganda#fullTextFileContent (accessed on 13 April 2026). [CrossRef]
- Mukooza, E.K. Health Risk Associated with Near-Road Ambient Air Concentration of Particulate Matter in Mukono Municipal Council, Uganda. Texila Int. J. Public Health 2021, 9, 127–137. [Google Scholar] [CrossRef] [Scilit]
- Opolot, M.; Omara, T.; Adaku, C.; Ntambi, E. Pollution Status, Source Apportionment, Ecological and Human Health Risks of Potentially (Eco)Toxic Element-Laden Dusts from Urban Roads, Highways and Pedestrian Bridges in Uganda. Pollutants 2023, 3, 74–88. [Google Scholar] [CrossRef] [Scilit]
- Vernarelli, J.A.; Mitchell, D.C.; Hartman, T.J.; Rolls, B.J. Dietary Energy Density Is Associated with Body Weight Status and Vegetable Intake in U.S. Children. J. Nutr. 2011, 141, 2204–2210. [Google Scholar] [CrossRef] [Scilit] [PubMed]
- Bawa, U. Heavy Metals Concentration in Food Crops Irrigated with Pesticides and Their Associated Human Health Risks in Paki, Kaduna State, Nigeria. Cogent Food Agric. 2023, 9, 2191889. [Google Scholar] [CrossRef] [Scilit]
- Kelle, H.; Ogoko, E.; Udeozo, P.I.; Achem, D.; Otumala, J.O. Health Risk Assessment of Exposure to Heavy Metals in Rice Grown in Nigeria. Pac. J. Sci. Technol. 2021, 22, 262–270. [Google Scholar]
- Guo, G.; Zhang, D.; Wang, Y. Probabilistic Human Health Risk Assessment of Heavy Metal Intake via Vegetable Consumption around Pb/Zn Smelters in Southwest China. Int. J. Environ. Res. Public. Health 2019, 16, 3267. [Google Scholar] [CrossRef] [Scilit] [PubMed]
- Atitsogbey, P.; Kyereh, E.; Ofori, H.; Johnson, P.-N.T.; Steiner-Asiedu, M. Heavy Metal, Microbial and Pesticides Residue Contaminations Are Limiting the Potential Consumption of Green Leafy Vegetables in Ghana: An Overview. Heliyon 2023, 9, e15466. [Google Scholar] [CrossRef] [Scilit] [PubMed]
- Lin, C.-Q.; Cai, Y.-H.; Hu, G.-R.; Yu, R.-L.; Hao, C.-L.; Huang, H.-B. Bioaccessibility and Health Risks of the Heavy Metals in Soil-Rice System of Southwest Fujian Province. Huan Jing Ke Xue Huanjing Kexue 2021, 42, 359–367. [Google Scholar] [CrossRef] [PubMed]
- Mhungu, F.; Cheng, Y.; Zhou, Z.; Zhang, W.; Liu, Y. Estimation of the Cumulative Risks from Dietary Exposure to Cadmium, Arsenic, Nickel, Lead and Chromium in Guangzhou, China. Food Chem. Toxicol. Int. J. Publ. Br. Ind. Biol. Res. Assoc. 2023, 178, 113887. [Google Scholar] [CrossRef] [Scilit] [PubMed]
- Neumann, H.-G. Risk Assessment of Chemical Carcinogens and Thresholds. Crit. Rev. Toxicol. 2009, 39, 449–461. [Google Scholar] [CrossRef] [Scilit] [PubMed]
- Sawicka, E.; Jurkowska, K.; Piwowar, A. Chromium (III) and Chromium (VI) as Important Players in the Induction of Genotoxicity—Current View. Ann. Agric. Environ. Med. 2020, 28, 1–10. [Google Scholar] [CrossRef] [Scilit] [PubMed]
- Sosan, M.B.; Adeleye, A.O.; Oyekunle, J.A.O.; Udah, O.; Oloruntunbi, P.M.; Daramola, M.O.; Saka, W.T. Dietary Risk Assessment of Organochlorine Pesticide Residues in Maize-Based Complementary Breakfast Food Products in Nigeria. Heliyon 2020, 6, e05803. [Google Scholar] [CrossRef] [Scilit] [PubMed]
- Kortei, N.K.; Annan, T.; Kyei-Baffour, V.; Essuman, E.K.; Okyere, H.; Tettey, C.O. Exposure and Risk Characterizations of Ochratoxins A and Aflatoxins through Maize (Zea Mays) Consumed in Different Agro-Ecological Zones of Ghana. Sci. Rep. 2021, 11, 23339. [Google Scholar] [CrossRef] [Scilit] [PubMed]
- Rasheed, H.; Slack, R.; Kay, P.; Gong, Y.Y. Refinement of Arsenic Attributable Health Risks in Rural Pakistan Using Population Specific Dietary Intake Values. Environ. Int. 2017, 99, 331–342. [Google Scholar] [CrossRef] [Scilit] [PubMed]
- Wang, W.; Gong, Y.; Greenfield, B.K.; Nunes, L.M.; Yang, Q.; Lei, P.; Bu, W.; Wang, B.; Zhao, X.; Huang, L.; et al. Relative Contribution of Rice and Fish Consumption to Bioaccessibility-Corrected Health Risks for Urban Residents in Eastern China. Environ. Int. 2021, 155, 106682. [Google Scholar] [CrossRef] [Scilit] [PubMed]
- Al Yeamin, A.; Mia, M.Y.; Khan, S.R.; Rahman, M.S.; Senapathi, V.; Islam, A.R.M.T.; Choudhury, T.R. Innovative Strategies for Pollution Assessment in Northern Bangladesh: Mapping Pollution Areas and Tracing Metal(Loid)s Sources in Various Soil Types. PLoS ONE 2025, 20, e0311270. [Google Scholar] [CrossRef] [Scilit] [PubMed]
- Doskenova, B.; Saduova, A.; Saduov, M.; Lyssakova, T.; Avezov, M.; Makhambetov, M.; Kakabayev, A.; Pangaliyev, Y. Assessment of Environmental Pollution and Health Risks across Urban-Rural Gradients. J. Ecol. Eng. 2026, 27, 98–111. [Google Scholar] [CrossRef] [Scilit] [PubMed]
- Wang, C.; Jiang, Y.; Shao, Y.; Chen, Z.; Liang, J.; Gao, J.; Fang, F.; Guo, J. The Disparities in Health Risks of Multiple Pollutants through Soil and Dietary Exposure in a Rural-Urban Area Based on Accessibility Method. J. Environ. Manag. 2024, 371, 123194. [Google Scholar] [CrossRef] [Scilit] [PubMed]
- Järup, L. Hazards of Heavy Metal Contamination. Br. Med. Bull. 2003, 68, 167–182. [Google Scholar] [CrossRef] [Scilit] [PubMed]
- Nordberg, G.F.; Bernard, A.; Diamond, G.L.; Duffus, J.H.; Illing, P.; Nordberg, M.; Bergdahl, I.A.; Jin, T.; Skerfving, S. Risk Assessment of Effects of Cadmium on Human Health (IUPAC Technical Report). Pure Appl. Chem. 2018, 90, 755–808. [Google Scholar] [CrossRef] [Scilit]
- Kapoor, R.T.; Bani Mfarrej, M.F.; Alam, P.; Rinklebe, J.; Ahmad, P. Accumulation of Chromium in Plants and Its Repercussion in Animals and Humans. Environ. Pollut. 2022, 301, 119044. [Google Scholar] [CrossRef] [Scilit] [PubMed]
- Wang, Y.; Cao, D.; Qin, J.; Zhao, S.; Lin, J.; Zhang, X.; Wang, J.; Zhu, M. Deterministic and Probabilistic Health Risk Assessment of Toxic Metals in the Daily Diets of Residents in Industrial Regions of Northern Ningxia, China. Biol. Trace Elem. Res. 2023, 201, 4334–4348. [Google Scholar] [CrossRef] [Scilit] [PubMed]
- Tchounwou, P.B.; Patlolla, A.K.; Centeno, J.A. Carcinogenic and Systemic Health Effects Associated with Arsenic Exposure—A Critical Review. Toxicol. Pathol. 2003, 31, 575–588. [Google Scholar] [CrossRef] [Scilit] [PubMed]
- Ali, H.; Khan, E.; Sajad, M.A. Phytoremediation of Heavy Metals—Concepts and Applications. Chemosphere 2013, 91, 869–881. [Google Scholar] [CrossRef] [Scilit] [PubMed]
- Abd Elnabi, M.K.; Elkaliny, N.E.; Elyazied, M.M.; Azab, S.H.; Elkhalifa, S.A.; Elmasry, S.; Mouhamed, M.S.; Shalamesh, E.M.; Alhorieny, N.A.; Abd Elaty, A.E.; et al. Toxicity of Heavy Metals and Recent Advances in Their Removal: A Review. Toxics 2023, 11, 580. [Google Scholar] [CrossRef] [Scilit] [PubMed]
- Yu, G.; Li, P.; Wang, G.; Wang, J.; Zhang, Y.; Wang, S.; Yang, K.; Du, C.; Chen, H. A Review on the Removal of Heavy Metals and Metalloids by Constructed Wetlands: Bibliometric, Removal Pathways, and Key Factors. World J. Microbiol. Biotechnol. 2021, 37, 157. [Google Scholar] [CrossRef] [Scilit] [PubMed]
- Lumami Kapepula, V.; García Alvarez, M.; Sang Sefidi, V.; Buleng Njoyim Tamungang, E.; Ndikumana, T.; Musibono, D.D.; Van Der Bruggen, B.; Luis, P. Evaluation of Commercial Reverse Osmosis and Nanofiltration Membranes for the Removal of Heavy Metals from Surface Water in the Democratic Republic of Congo. Clean Technol. 2022, 4, 1300–1316. [Google Scholar] [CrossRef] [Scilit]
- Gautam, P.K.; Gautam, R.K.; Banerjee, S.; Chattopadhyaya, M.C.; Pandey, J.D. Heavy Metals in the Environment: Fate, Transport, Toxicity and Remediation Technologies. In Heavy Metals: Sources, Toxicity and Remediation Techniques; Nova Science Publishers, Inc.: Hauppauge, NY, USA, 2016. [Google Scholar]
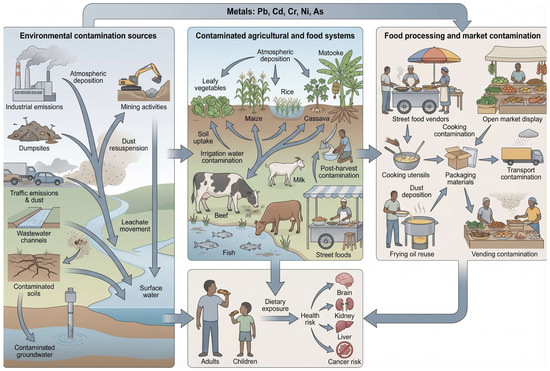
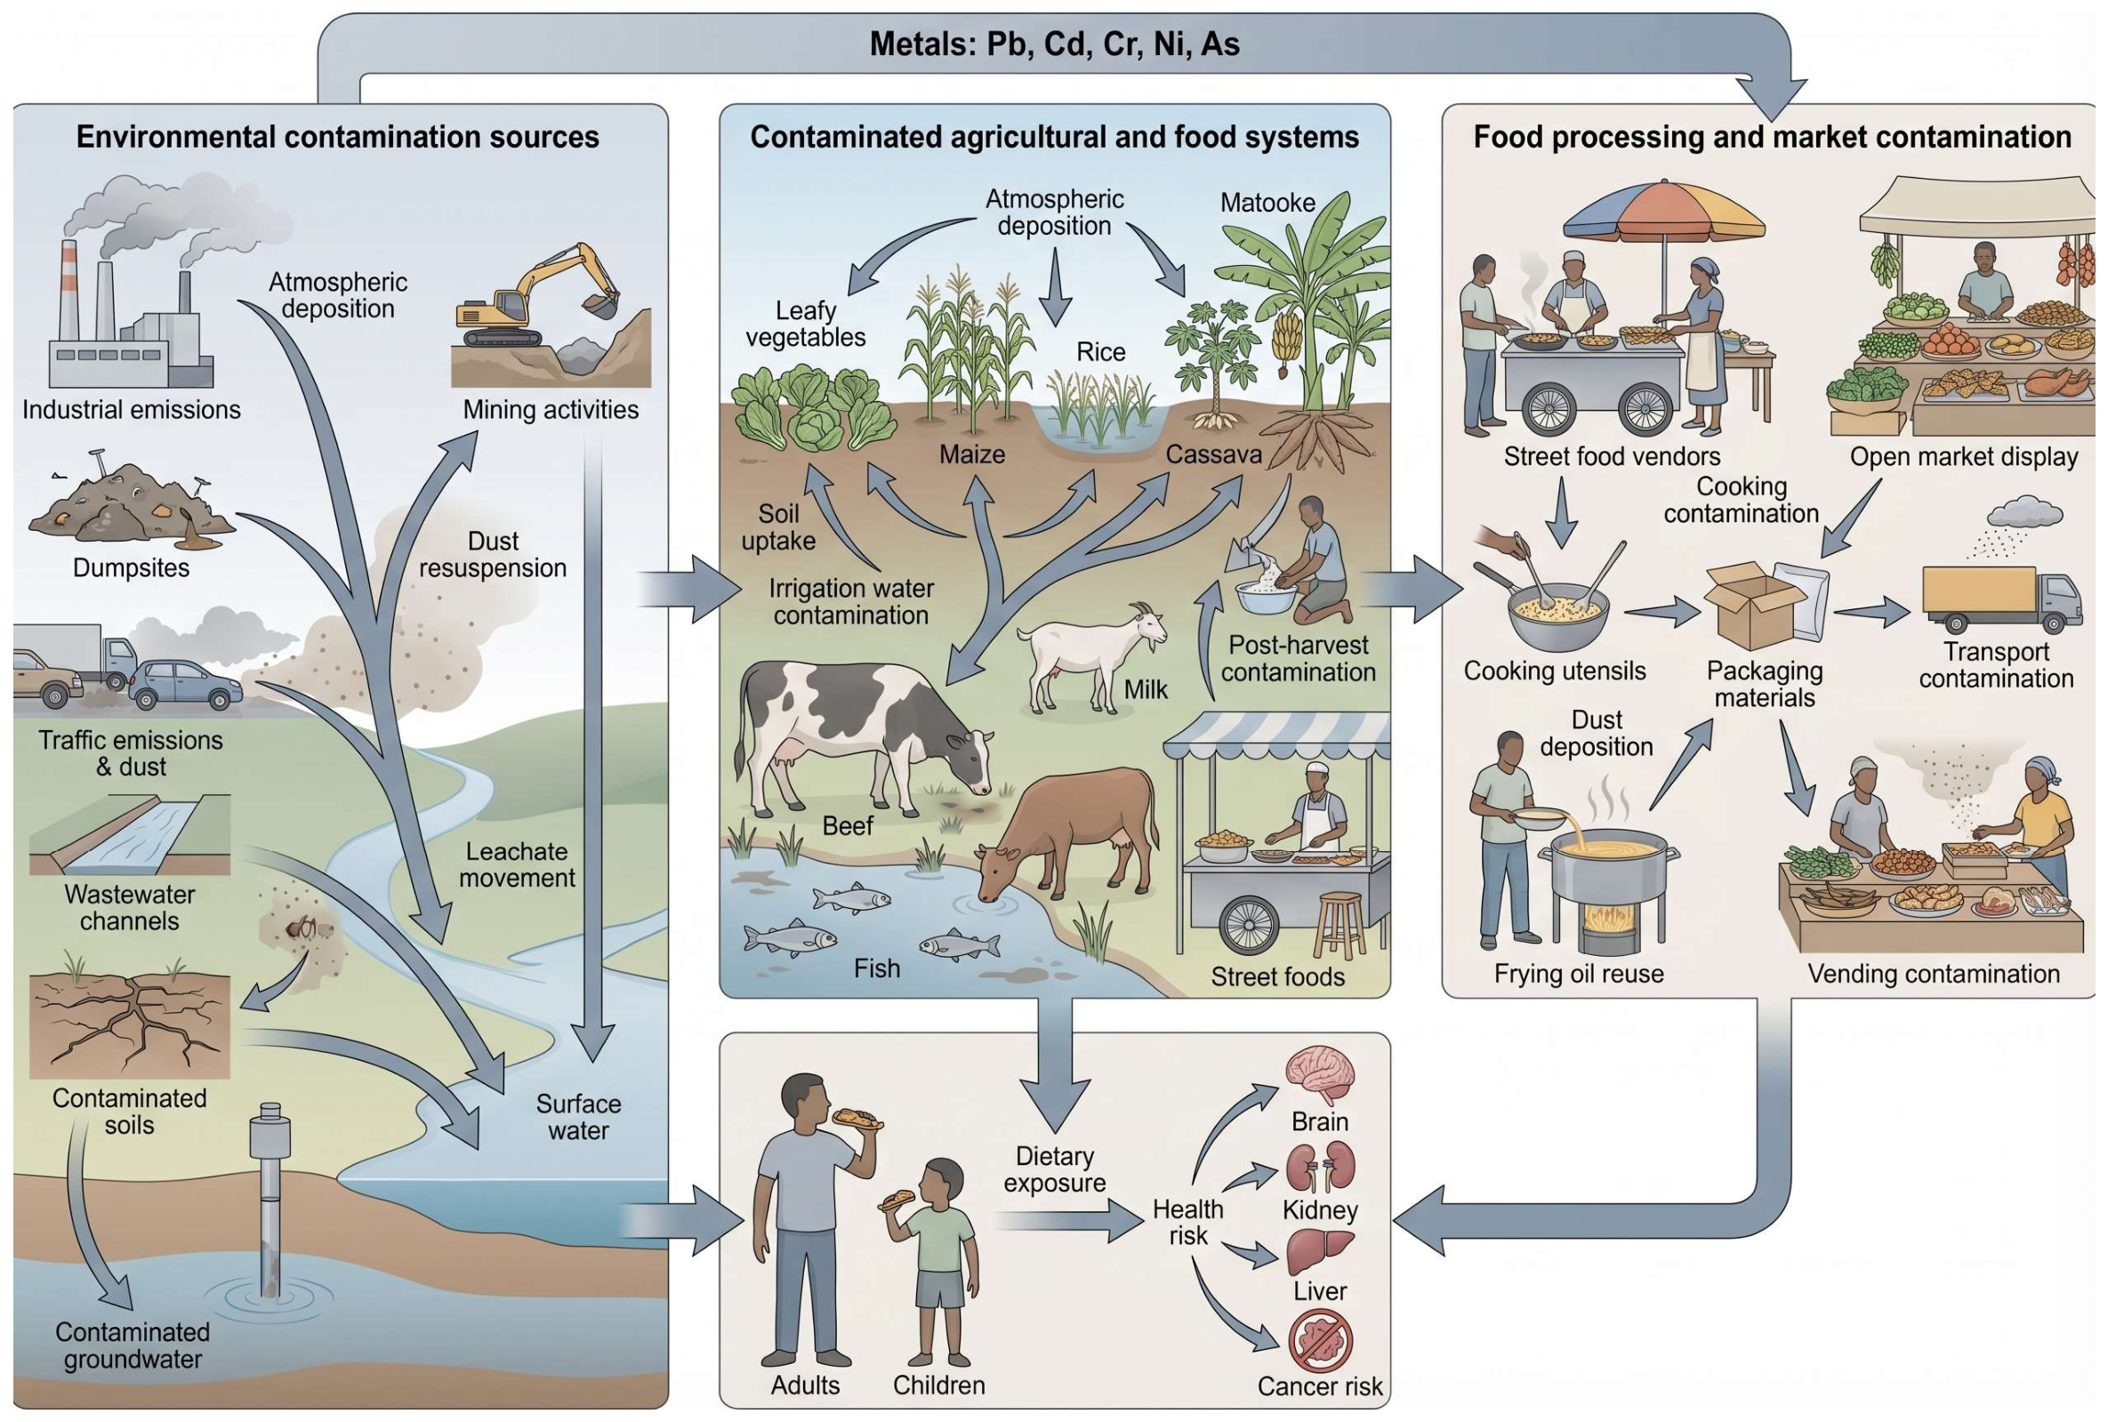
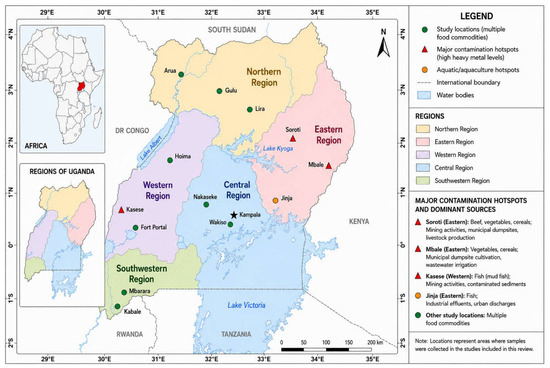
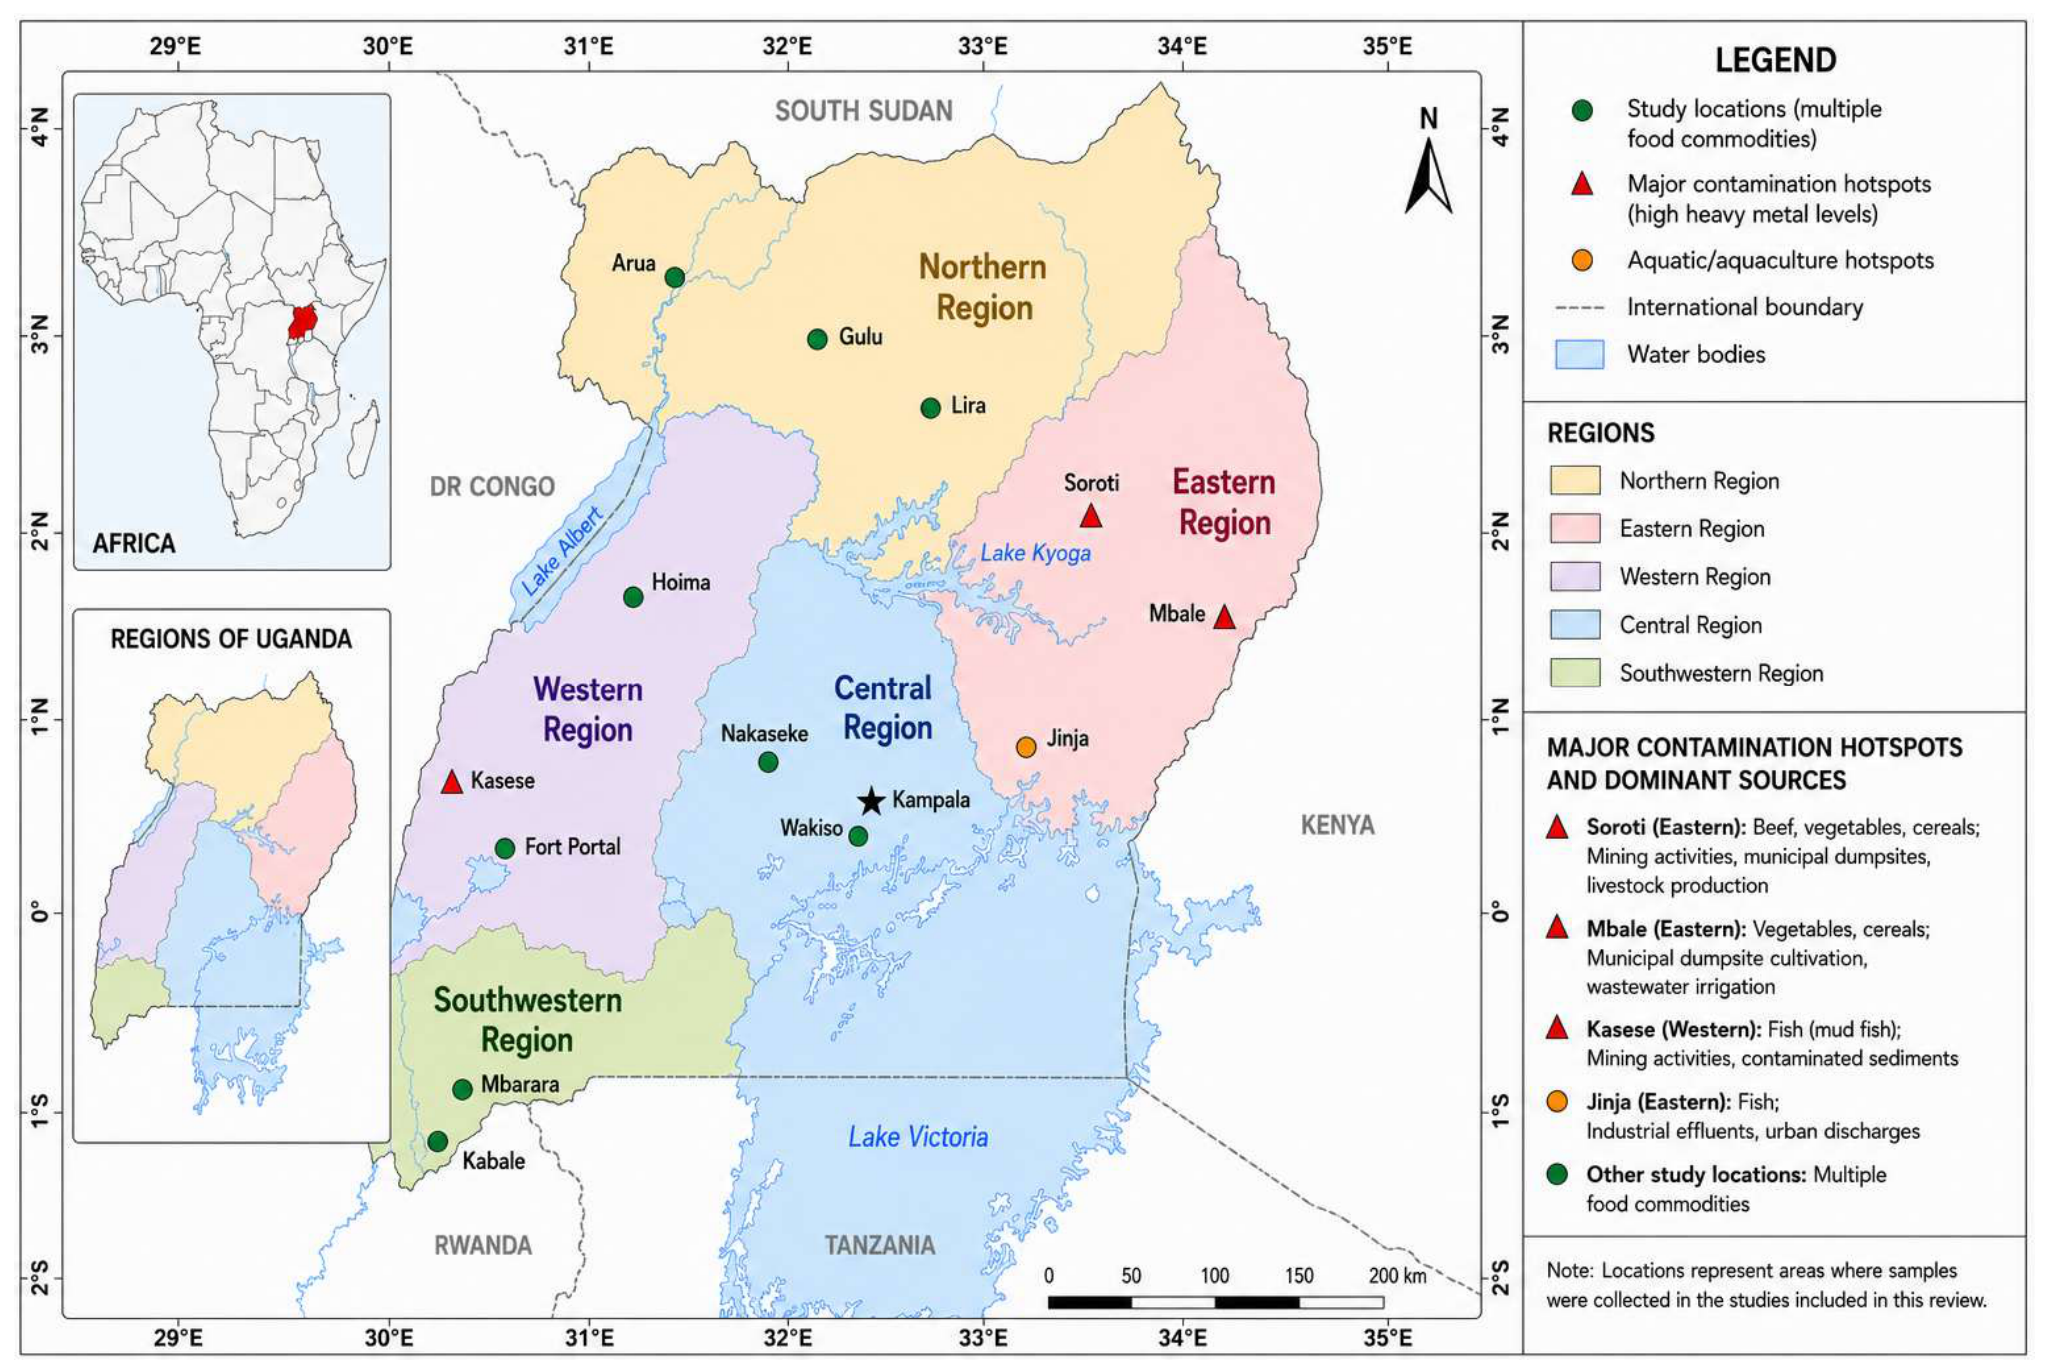

Disclaimer/Publisher’s Note: The statements, opinions and data contained in all publications are solely those of the individual author(s) and contributor(s) and not of MDPI and/or the editor(s). MDPI and/or the editor(s) disclaim responsibility for any injury to people or property resulting from any ideas, methods, instructions or products referred to in the content. |
© 2026 by the authors. Licensee MDPI, Basel, Switzerland. This article is an open access article distributed under the terms and conditions of the Creative Commons Attribution (CC BY) license.