


Abstract
Chromium contamination in aquatic systems represents a significant environmental concern due to its toxicity and complex geochemical behaviour. This study analyzes the spatial distribution of total chromium (Cr) in sediments from streams and surface waters of the Iron Quadrangle (IQ), one of the world’s most important mining provinces, with the aim of establishing regional reference values and identifying anomalous concentrations. A total of 487 samples were collected, corresponding to an average sampling density of one sample per 14.37 km2. Statistical approaches, including the Upper Inner Fence (UIF) method, were applied to distinguish background levels, elevated concentrations, and anomalies, while contamination factor and enrichment factor indices were used to assess contamination and enrichment patterns. The results indicate a wide range of Cr concentrations, with sediments reaching up to 2581 mg·kg−1 and surface waters up to 384.7 μg·L−1. Although most samples reflect natural background conditions, significant anomalies were identified, particularly in areas associated with mafic–ultramafic lithologies and mining activities. Approximately 73.3% and 42.3% of sediment samples exceeded TEL and PEL thresholds, respectively, while 35.3% of surface water samples surpassed drinking water limits. The results highlight the need for continuous environmental monitoring and reinforce the importance of integrating geochemical mapping with risk assessment approaches to better understand contamination dynamics in complex mining regions.
1. Introduction
The intensification of industrial activities, the growth of urban areas, and mining have favoured the introduction of potentially toxic elements (PTEs) into soils, sediments, and water resources, among which chromium (Cr) is particularly relevant due to its wide environmental distribution and toxicological potential [1,2]. This element occurs naturally in the Earth’s crust in average concentrations of 100 to 140 mg·kg−1, mainly associated with mafic and ultramafic rocks, as well as minerals such as chromite, pyroxenes, and amphiboles. Its dispersal in environmental compartments has been greatly enhanced by anthropogenic activities, such as mining, metallurgy, tanning industries, and various industrial processes [3,4].
From a geochemical perspective, chromium occurs primarily in the trivalent (Cr(III)) and hexavalent (Cr(VI)) oxidation states, which are commonly described in the literature as exhibiting contrasting behaviour with respect to mobility, bioavailability, and toxicity. In general, Cr(III) is associated with relatively low solubility and a tendency to form stable complexes and adsorb onto mineral surfaces and organic matter, whereas Cr(VI) is typically found as more soluble anionic species (e.g., chromate and dichromate) [5,6,7].
The distribution between these oxidation states is generally influenced by environmental factors such as pH, redox conditions (Eh), and the presence of organic matter and reactive mineral phases, which may promote oxidation–reduction processes. Under oxidizing conditions, particularly at neutral to alkaline pH, Cr(VI) is often reported as the dominant form, whereas reducing environments tend to favour the occurrence of Cr(III). These differences are commonly associated with variations in mobility, with Cr(VI) generally described as more mobile than Cr(III) [8,9,10].
The environmental and health relevance of chromium largely depends on its chemical speciation [8,9,10]. In general, Cr(VI) is regarded as the more toxic form due to its higher mobility and greater interaction with biological systems, whereas Cr(III) is typically considered less mobile and less bioavailable under most environmental conditions [10,11,12,13,14].
Despite the importance of speciation for environmental risk assessment, regional-scale studies frequently use total Cr determination as an initial approach to characterize its spatial distribution. This is because total Cr analysis allows the identification of geochemical patterns, the definition of regional reference values, and the detection of anomalies associated with natural or anthropogenic controls, especially in geochemical mapping studies [1,2,15]. However, total Cr determination does not allow direct distinction between Cr(III) and Cr(VI), which limits the direct assessment of toxicological risk and therefore requires complementary chromium speciation studies [16,17,18,19].
In this context, recent studies have emphasised the importance of understanding the geochemical distribution of Cr in complex environmental systems, highlighting the roles of lithology, redox conditions, and interactions with iron and manganese oxides in the retention and mobility of the element [9,14]. In addition, studies of sediments and surface waters demonstrate that environments with strong geological influence and mining activity present high spatial variability in Cr concentrations, reflecting both natural processes and anthropogenic contributions [10,19].
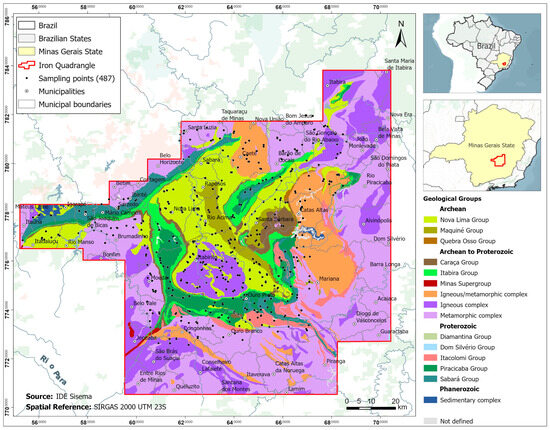
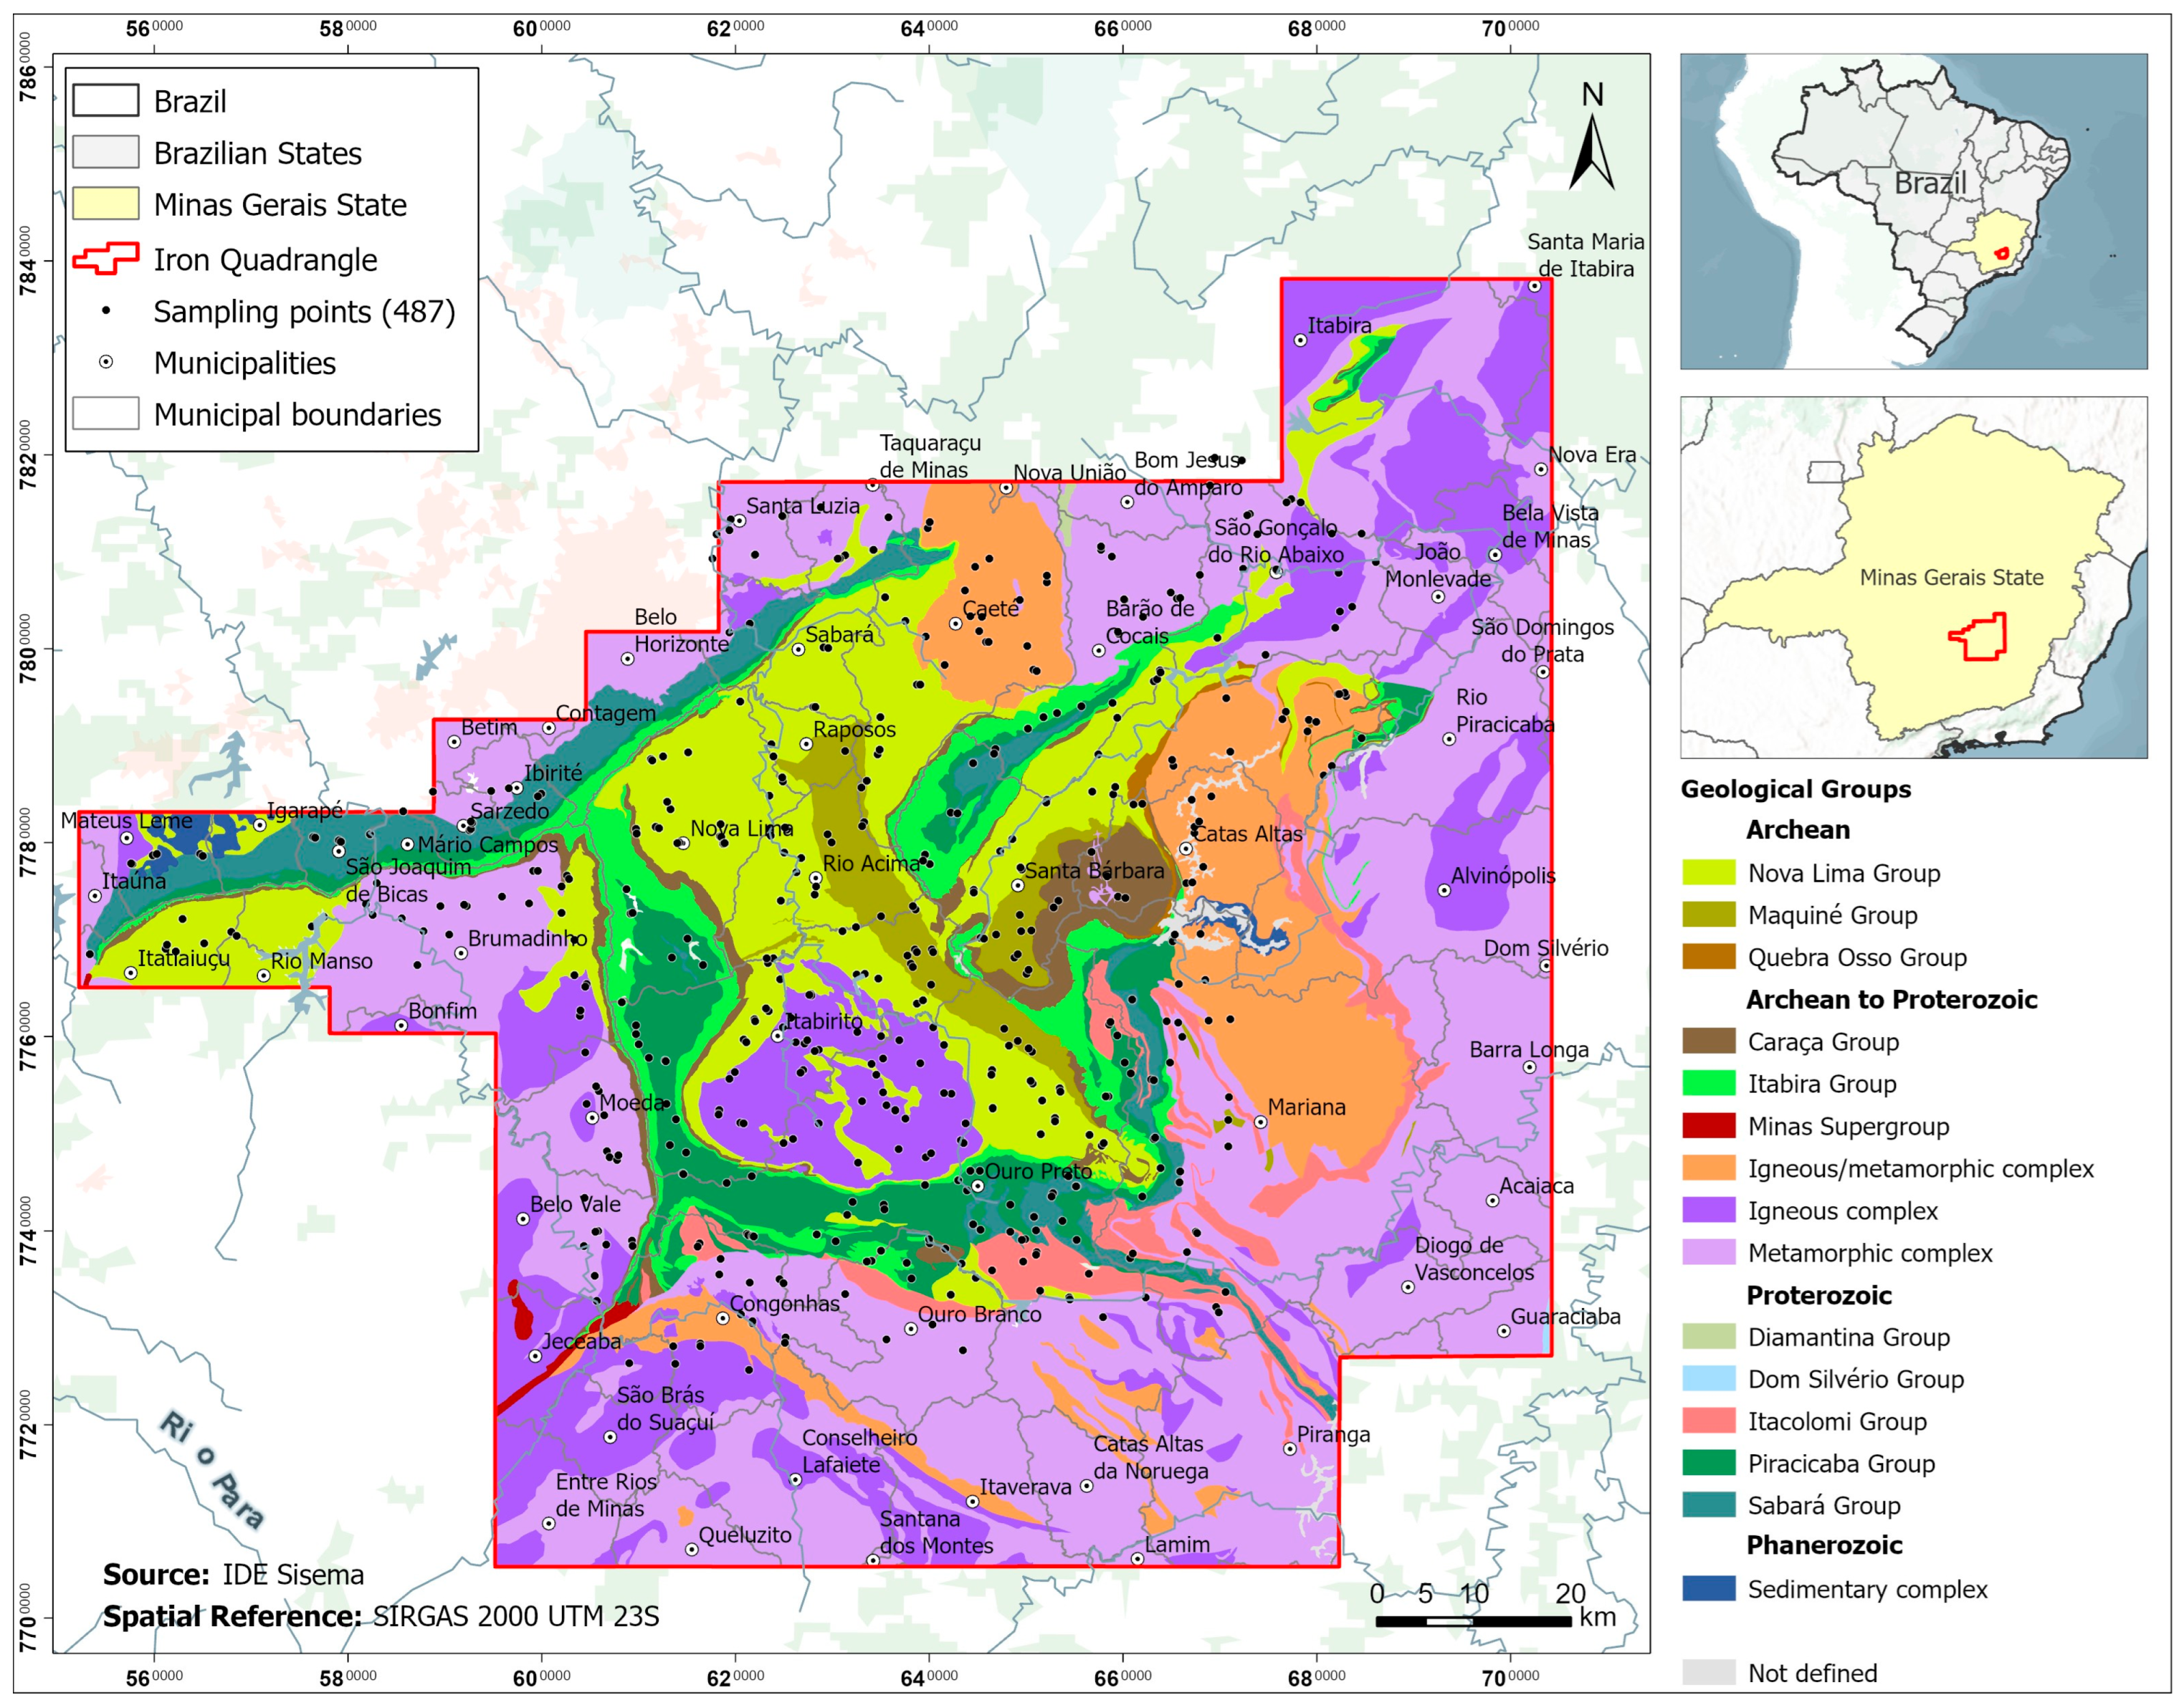
The Iron Quadrangle (IQ), located in the state of Minas Gerais, Brazil (Figure 1), is one of the world’s main mineral provinces, characterised by high lithological diversity and intense mining activity. Beyond its significant mineral resources, the IQ hosts critical water systems that supply major urban centres, including the Metropolitan Region of Belo Horizonte [20]. However, intensive mining activities, along with poorly regulated urban and industrial expansion, have resulted in significant environmental degradation, particularly through the contamination of sediments and surface waters by PTEs [21,22,23,24,25]. Furthermore, the occurrence of geological units enriched in ferromagnesian minerals, combined with historical and ongoing mining activities, increases the mobilisation, redistribution, and environmental availability of trace elements, including Cr [20,24].
Figure 1.
Simplified geological map of the Iron Quadrangle showing the sampling locations.
Despite the region’s environmental relevance, the distribution of Cr in stream sediments and surface waters remains poorly characterised across the entire IQ, particularly in studies that integrate spatial variability and controlling factors.
Given this scenario, the present study aims to assess the spatial patterns of total Cr in surface waters and associated sediments within the IQ, determine regional reference values, and identify areas with elevated or anomalous concentrations. The analysis also addresses the main factors controlling the spatial variability of the element, considering the influence of lithology and potential anthropogenic sources. This approach contributes to the interpretation of geochemical patterns and provides a basis for future studies focused on chemical speciation and environmental risk assessment.
2. Materials and Methods
2.1. Study Area
The IQ is located in the south-central portion of the state of Minas Gerais, Brazil, encompassing an area of approximately 7000 km2 between latitudes 19°45′ and 20°30′ S and longitudes 44°30′ and 43°07′ W (Figure 1) [21,23,26]. The region comprises 35 municipalities and has a population exceeding 5.5 million. It is one of the most socioeconomically significant regions in the country, accounting for nearly 24% of the population of Minas Gerais [26,27]. Its economy is strongly driven by mining activities, particularly the extraction of iron ore, gold, limestone, dolomite, bauxite, steatite, manganese, topaz, and clays, which collectively confer strategic importance to the region within Brazil’s mineral production sector [28,29]. In addition, the IQ sustains a diversified industrial base, with a strong emphasis on the steel and metallurgical industries [29].
Hydrologically, the IQ contains the headwaters of two of Brazil’s most important river basins: the São Francisco and Doce basins. These systems are fed by multiple sub-basins, including the Das Velhas and Paraopeba rivers (tributaries of the São Francisco River), as well as the Conceição, Piracicaba, Carmo, Gualaxo do Sul, and Gualaxo do Norte rivers (tributaries of the Doce River) [20,30,31]. These drainage networks have been subject to sustained anthropogenic pressures since the early stages of settlement and colonization in Minas Gerais, resulting in long-term environmental alterations [21,23,28,32,33].
From a geological perspective, the IQ is situated in the southernmost sector of the São Francisco Craton [34] and comprises a complex lithostratigraphic framework organized into four main units, arranged from base to top.
- (i)
- The crystalline basement is predominantly formed by polydeformed tonalitic gneisses, intruded by granites, granodiorites, and mafic to ultramafic bodies, which constitute the Belo Horizonte, Bonfim, Caeté, Santa Bárbara, Santa Rita, and Bação metamorphic complexes [34,35].
- (ii)
- Above this basement complex, the Rio das Velhas Supergroup consists of a sequence of metavolcanic and metasedimentary units, subdivided into the Nova Lima and Maquiné Groups. The former consists of volcano–sedimentary suites, notably carbonaceous schists, banded iron formations (BIFs), phyllites, and metacherts. Conversely, the Maquiné Group is defined by basal metaconglomerates that grade upward into extensive packages of sericitic quartzites, phyllites, and quartz schists, indicating a transition in sedimentary facies and depositional dynamics [36,37].
- (iii)
- The Minas Supergroup overlies the Rio das Velhas Supergroup unconformably and is dominated by pelitic and quartz-rich metasedimentary rocks. It is subdivided into four major stratigraphic units reflecting distinct depositional settings. The Caraça Group forms the basal unit, consisting of metaconglomerates and metarenites indicative of fluvial to shallow marine conditions. The Itabira Group overlies it and is primarily composed of chemical sediments, including itabirites, representing a major phase of iron deposition. The Piracicaba Group follows, characterised by metapelites interbedded with chemical layers. The uppermost Sabará Group consists mainly of terrigenous sediments, including conglomeratic phyllites, and is interpreted as the result of more dynamic depositional conditions associated with tectonic activity during the later stages of basin evolution [38,39].
- (iv)
- At the top of this sequence, the Itacolomi Group consists mainly of quartzites and metaconglomerates formed in fluvial–deltaic to shallow-marine depositional settings [38,39]. Also assigned to the Paleoproterozoic, this unit represents a transitional stage in the stratigraphic evolution of the region. Overlying these units, Tertiary and Quaternary deposits consist of unconsolidated sediments related to modern fluvial processes and prolonged weathering, contributing to the present-day geomorphological configuration [38,39]. Figure 1 presents a simplified geological map of the IQ, highlighting the principal lithostratigraphic units described above.
2.2. Sampling
A total of 487 surface water and stream sediment samples were collected at the outlets of basins with areas between 5 and 40 km2 [26], distributed throughout the IQ area, resulting in an estimated sampling density of approximately one sample per 14.37 km2. These sampling points were delineated using ArcGIS 10.8 by integrating 1:25,000-scale hypsometric, topographic, and hydrographic datasets obtained from the Minas Gerais State Water Management Institute (IGAM) and the Brazilian Geological Survey (CPRM).
Sediment samples were collected along stretches ranging from 300 to 500 m in length and comprised nine sub-samples representative of different fluvial depositional environments, to capture local geomorphological variability [40].
Surface water samples were filtered in the field using 0.45 μm cellulose acetate membranes (Millipore) and subsequently acidified with nitric acid to pH < 2, according to the protocol established by [41], to preserve dissolved elements.
2.3. Chemical Analyses and Quality Control
Sediment samples were dried at room temperature, homogenized, and sieved, with the fraction smaller than 0.63 mm selected for geochemical analysis in the laboratory. An aliquot of approximately 1 g was subjected to aqua regia digestion (HCl:HNO3, 1:3), a widely used procedure for the extraction of metals from environmental matrices [42,43,44]. After digestion, the resulting solutions were analyzed by inductively coupled plasma optical emission spectrometry (ICP-OES), using Spectro brand Model Ciros CCD (AMETEK, Kleve, Germany) at the Environmental Geochemistry Laboratory of the Federal University of Ouro Preto.
Analytical quality was evaluated using the certified reference material LKSD-01 (CCNRP, Ottawa, ON, Canada), which showed a recovery of 97.3%. To ensure data reliability, the quality assurance and quality control (QA/QC) procedures included the preparation of one blank sample for every ten samples analyzed, as well as duplicate analyses for 10% of the total sample set. The detection limits were 0.2 mg·kg−1 for sediment samples and 5.3 μg·L−1 for water samples.
2.4. Data Analysis
The geochemical data were subjected to exploratory analysis in Minitab 21, which also included a correlation analysis, and box plots were used to assess the data distribution. The distinction between background concentrations, high reference values, and geochemical anomalies was performed based on the Upper Inner Fence (UIF) technique [45,46], defined as in Equation (1):
where Q1 and Q3 correspond to the first and third quartiles, respectively. Values below Q3 were considered regional references, values between Q3 and UIF were classified as high reference values, and values above UIF were classified as anomalies.
UIF = Q3 + 1.5 × (Q3 − Q1),
2.5. Pollution Quantification Indices
In addition to the statistical analysis, geochemical indices were used to evaluate the degree of Cr contamination in sediments.
2.5.1. Contamination Factor Calculation (CF)
The CF was determined using the equation presented below (2) [47]:
where CPTE represents the concentration value of PTE in the sediments of the IQ, and Cbackground corresponds to the background value of Cr in IQ. The background value adopted as reference was 131.5 mg·kg−1.
This index is among the most straightforward approaches for assessing sediment contamination. It classifies contamination into four qualitative categories based on the contamination factor (CF) values: CF < 1 indicates low contamination; 1 ≤ CF < 3 corresponds to moderate contamination; 3 ≤ CF < 6 reflects considerable contamination; and CF ≥ 6 denotes very high contamination.
2.5.2. Enrichment Factor Calculation (EF)
This index evaluates the degree of enrichment of PTEs by normalising their concentrations against a reference element, thereby minimizing the influence of natural variability and lithological heterogeneity. This approach is particularly effective in regions characterised by complex geology and mature soils, where direct comparisons of elemental concentrations may be misleading [48]. Although iron (Fe) is frequently employed as a normalising element, its elevated background concentrations in the IQ, approximately 4.2 times higher than the average upper continental crust value [49,50], may result in the underestimation of enrichment factor (EF) values [51].
Aluminium (Al) was adopted as a conservative tracer in this investigation due to its minimal geochemical mobility and its prevalence as a primary structural component in the clay mineral fraction of stream sediments [51,52,53,54,55]. The enrichment factor (EF) for each element was calculated according to Equation (3).
where
- -
- Ci is the concentration value of each element in the stream sediment sample;
- -
- CAl represents the concentration of the normalising element, aluminium (Al), in the same sediment sample;
- -
- Bi is the reference geochemical background value of each element (Cr = 131.5 mg·kg−1);
- -
- BAl is the reference geochemical background value of the reference element (Al) [24].
Five qualitative classes were used to categorize enrichment levels, as described in Table 1.
Table 1.
Enrichment factor (EF) classes [52].
2.6. Geochemical Maps
The spatial representation of Cr concentrations was performed using ArcGIS software, adopting the World Geodetic System 1984 (WGS84). For the spatial interpolation of the data, the Inverse Distance Weighting (IDW) interpolation method (IDW) was applied, with a power of 2 and a neighborhood defined by the 12 nearest points [42,45]. For data interpolation, the delimitation of the IQ was adopted based on the updated proposal of the QFe2050 project [39], used as the geological reference for defining the study area.
IDW was selected because the study aimed to delineate local concentration gradients and geochemical hotspots using a relatively dense sampling network of approximately one sample per 14.37 km2. This approach is consistent with previous high-density geochemical surveys conducted in the IQ, which applied IDW to stream sediments and surface waters at comparable sampling densities [24,56,57].
Although ordinary kriging provides predictions based on an explicitly modelled spatial autocorrelation structure, its application requires the definition of a defensible variogram and assumptions of local stationarity, which may be difficult to satisfy in the presence of abrupt lithological boundaries and localised mining-related inputs [58,59,60]. Because no interpolation method is universally superior, IDW was selected based on the study objective, regional methodological precedent, and its subsequent evaluation through leave-one-out cross-validation [58,59,60].
However, unlike ordinary kriging, IDW does not explicitly model spatial autocorrelation or provide a model-based estimate of prediction uncertainty. Therefore, the interpolated surfaces were interpreted primarily as representations of regional concentration patterns and potential hotspots, rather than as precise predictions for unsampled locations [58,59,60].
3. Results
3.1. Elemental Concentrations and Comparative Data
Table 2 presents the statistical parameters for chromium concentrations in 487 stream sediments and surface water samples from the IQ, and compares these values with similar studies conducted in the region.
Table 2.
Descriptive statistics of Cr content in sediments and surface waters of the Iron Quadrangle and comparison with other studies carried out in the IQ.
Chromium exhibits a positively skewed distribution, with median values consistently lower than the mean. A mean-to-median ratio of 1.80 highlights the influence of localised enrichment processes within the dataset.
The results indicate that maximum concentrations reported in this study exceed those documented in previous investigations within the same basin, likely reflecting the higher sampling density employed. This denser sampling strategy enabled a more detailed characterisation of localised contamination hotspots.
In sediments, Cr concentrations ranged from 0.2 to 2581 mg·kg−1, with a median value of 74.3 mg·kg−1. This median is approximately 3.4 times higher than values reported for Europe, and 1.5 times higher than those observed in Australia and Portugal [61,62,63]. The mean concentration of Cr (134.4 mg·kg−1) is approximately 1.12 times higher than the average upper continental crust value [50], suggesting regional enrichment.
For surface waters, Cr concentrations ranged from 5.3 to 384.7 μg·L−1, with a median of 8.5 μg·L−1, substantially higher than the European median value (0.093 μg·L−1) [61], indicating significant enrichment in the studied hydrographic system.
Statistical analysis of sediment data shows that 75% of samples fall within a relatively low concentration range (<0.22–131.5 mg·kg−1), which can be considered representative of the regional background (Table 3).
Table 3.
Regional concentration values and classification of reference values for Cr-stream sediments and surface waters.
Elevated background values, defined between the third quartile (Q3) and the upper inner fence (UIF), range from 131.5 to 276.4 mg·kg−1 and account for approximately 15% of the study area (Table 2). These values are closely associated with the occurrence of rocks from the Nova Lima Group (Rio das Velhas Supergroup). These points, in particular, were interpreted as reflecting strong geogenic control, with a high correlation to nickel (Ni), with 70% of the points showing joint anomalies, and partially similar to cobalt, which was corroborated by the high correlation between these elements, which was 0.90 (Cr and Ni) and 0.76 (Cr and Co).
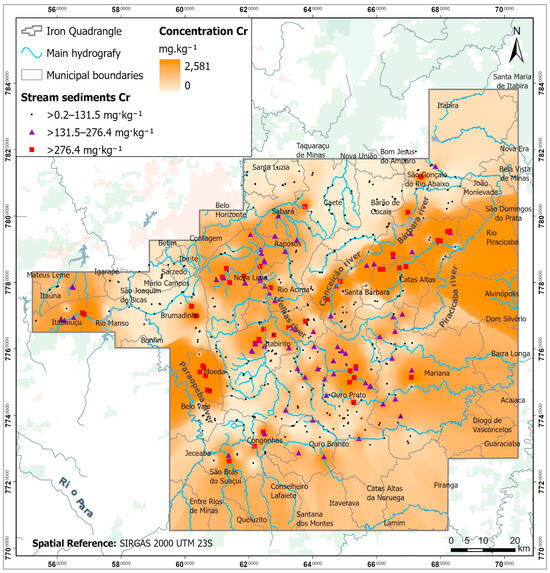
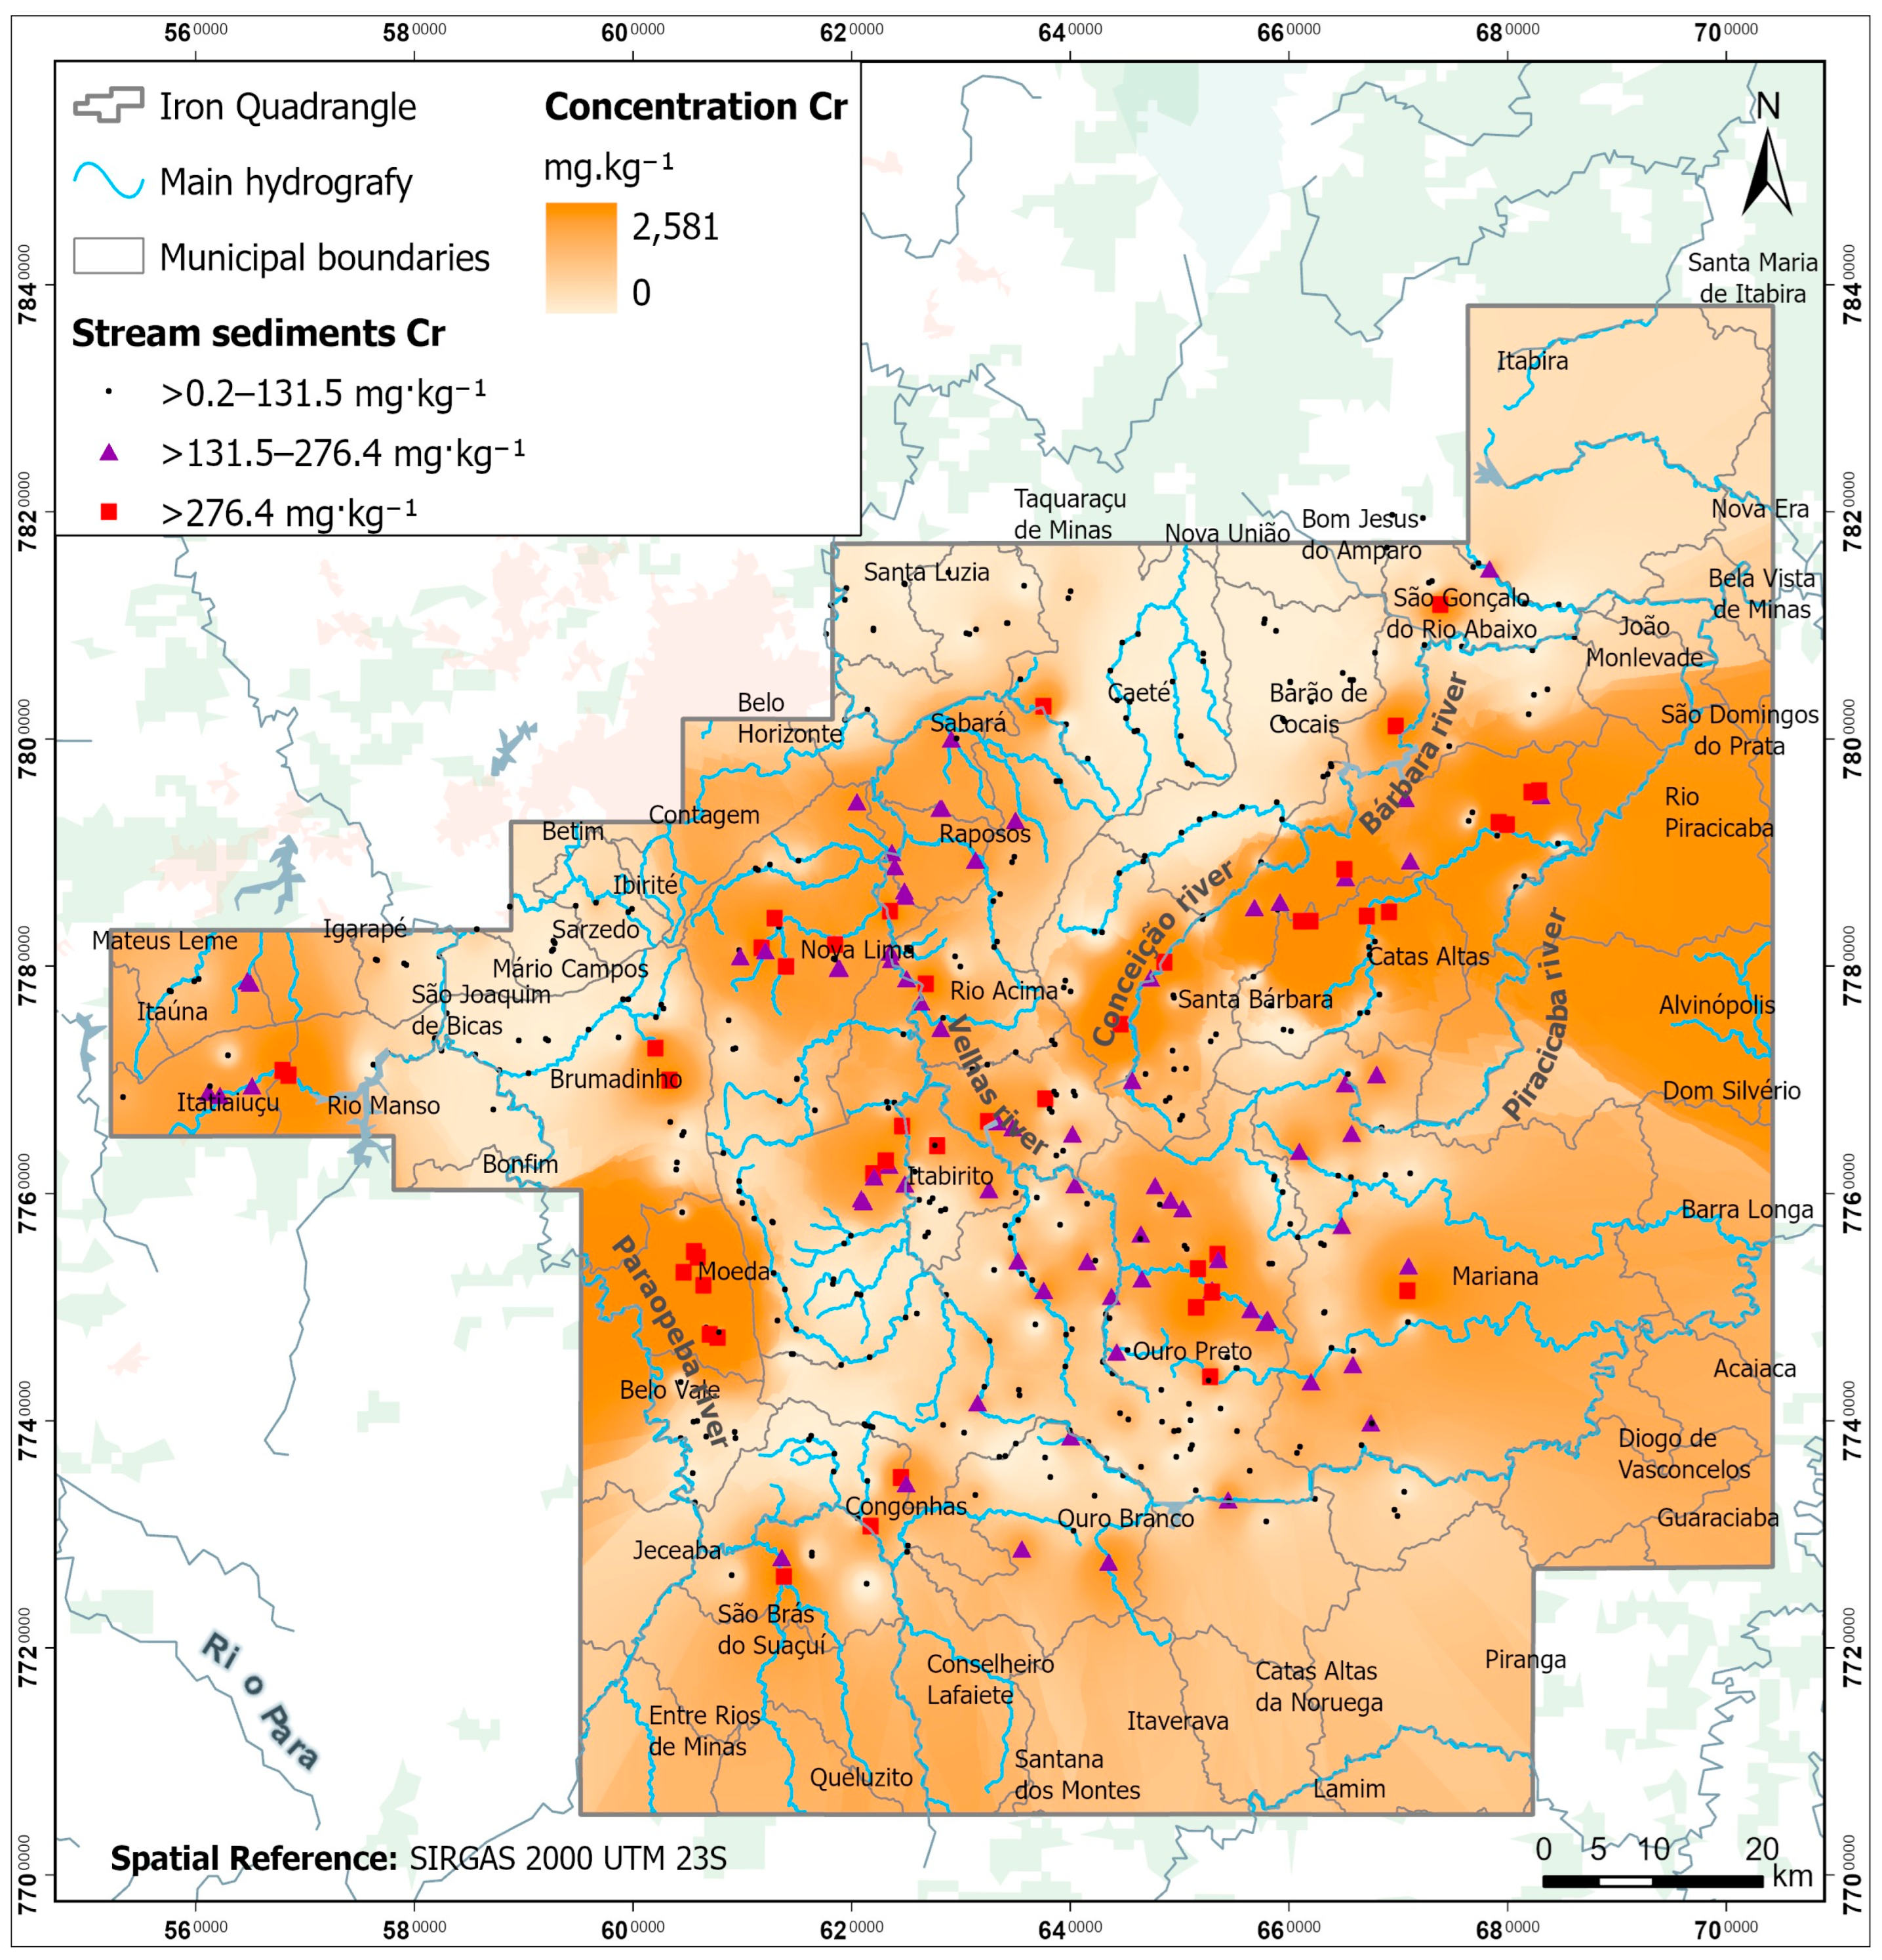
Anomalous concentrations (>276.4 mg·kg−1) are primarily concentrated in the central region, the western margin, and the northeastern portion of the IQ, particularly within the Paraopeba, Velhas, and Conceição river basins, where 46 sampling points exhibited values ranging from 287.4 to 2581 mg·kg−1 (Figure 2). Cross-validation of the IDW interpolation yielded an ME of −1.09 mg·kg−1 and an RMSE of 203.85 mg·kg−1. The low ME value indicates minimal systematic bias in the interpolated predictions, whereas the RMSE reflects the influence of localised high-concentration anomalies and the pronounced geological heterogeneity that characterizes the IQ.
Figure 2.
Cr geochemical map for IQ for stream sediments. Sampling sites were classified as reference values (>0.2–131.5 mg·kg−1), high reference values (>131.5–276.4 mg·kg−1), and anomalies (>276.4 mg·kg−1).
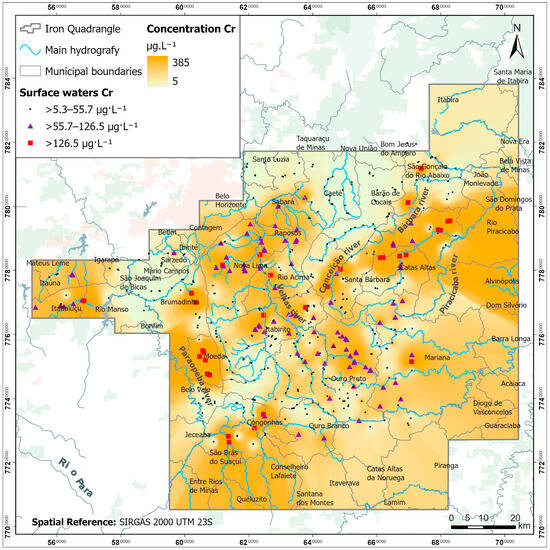
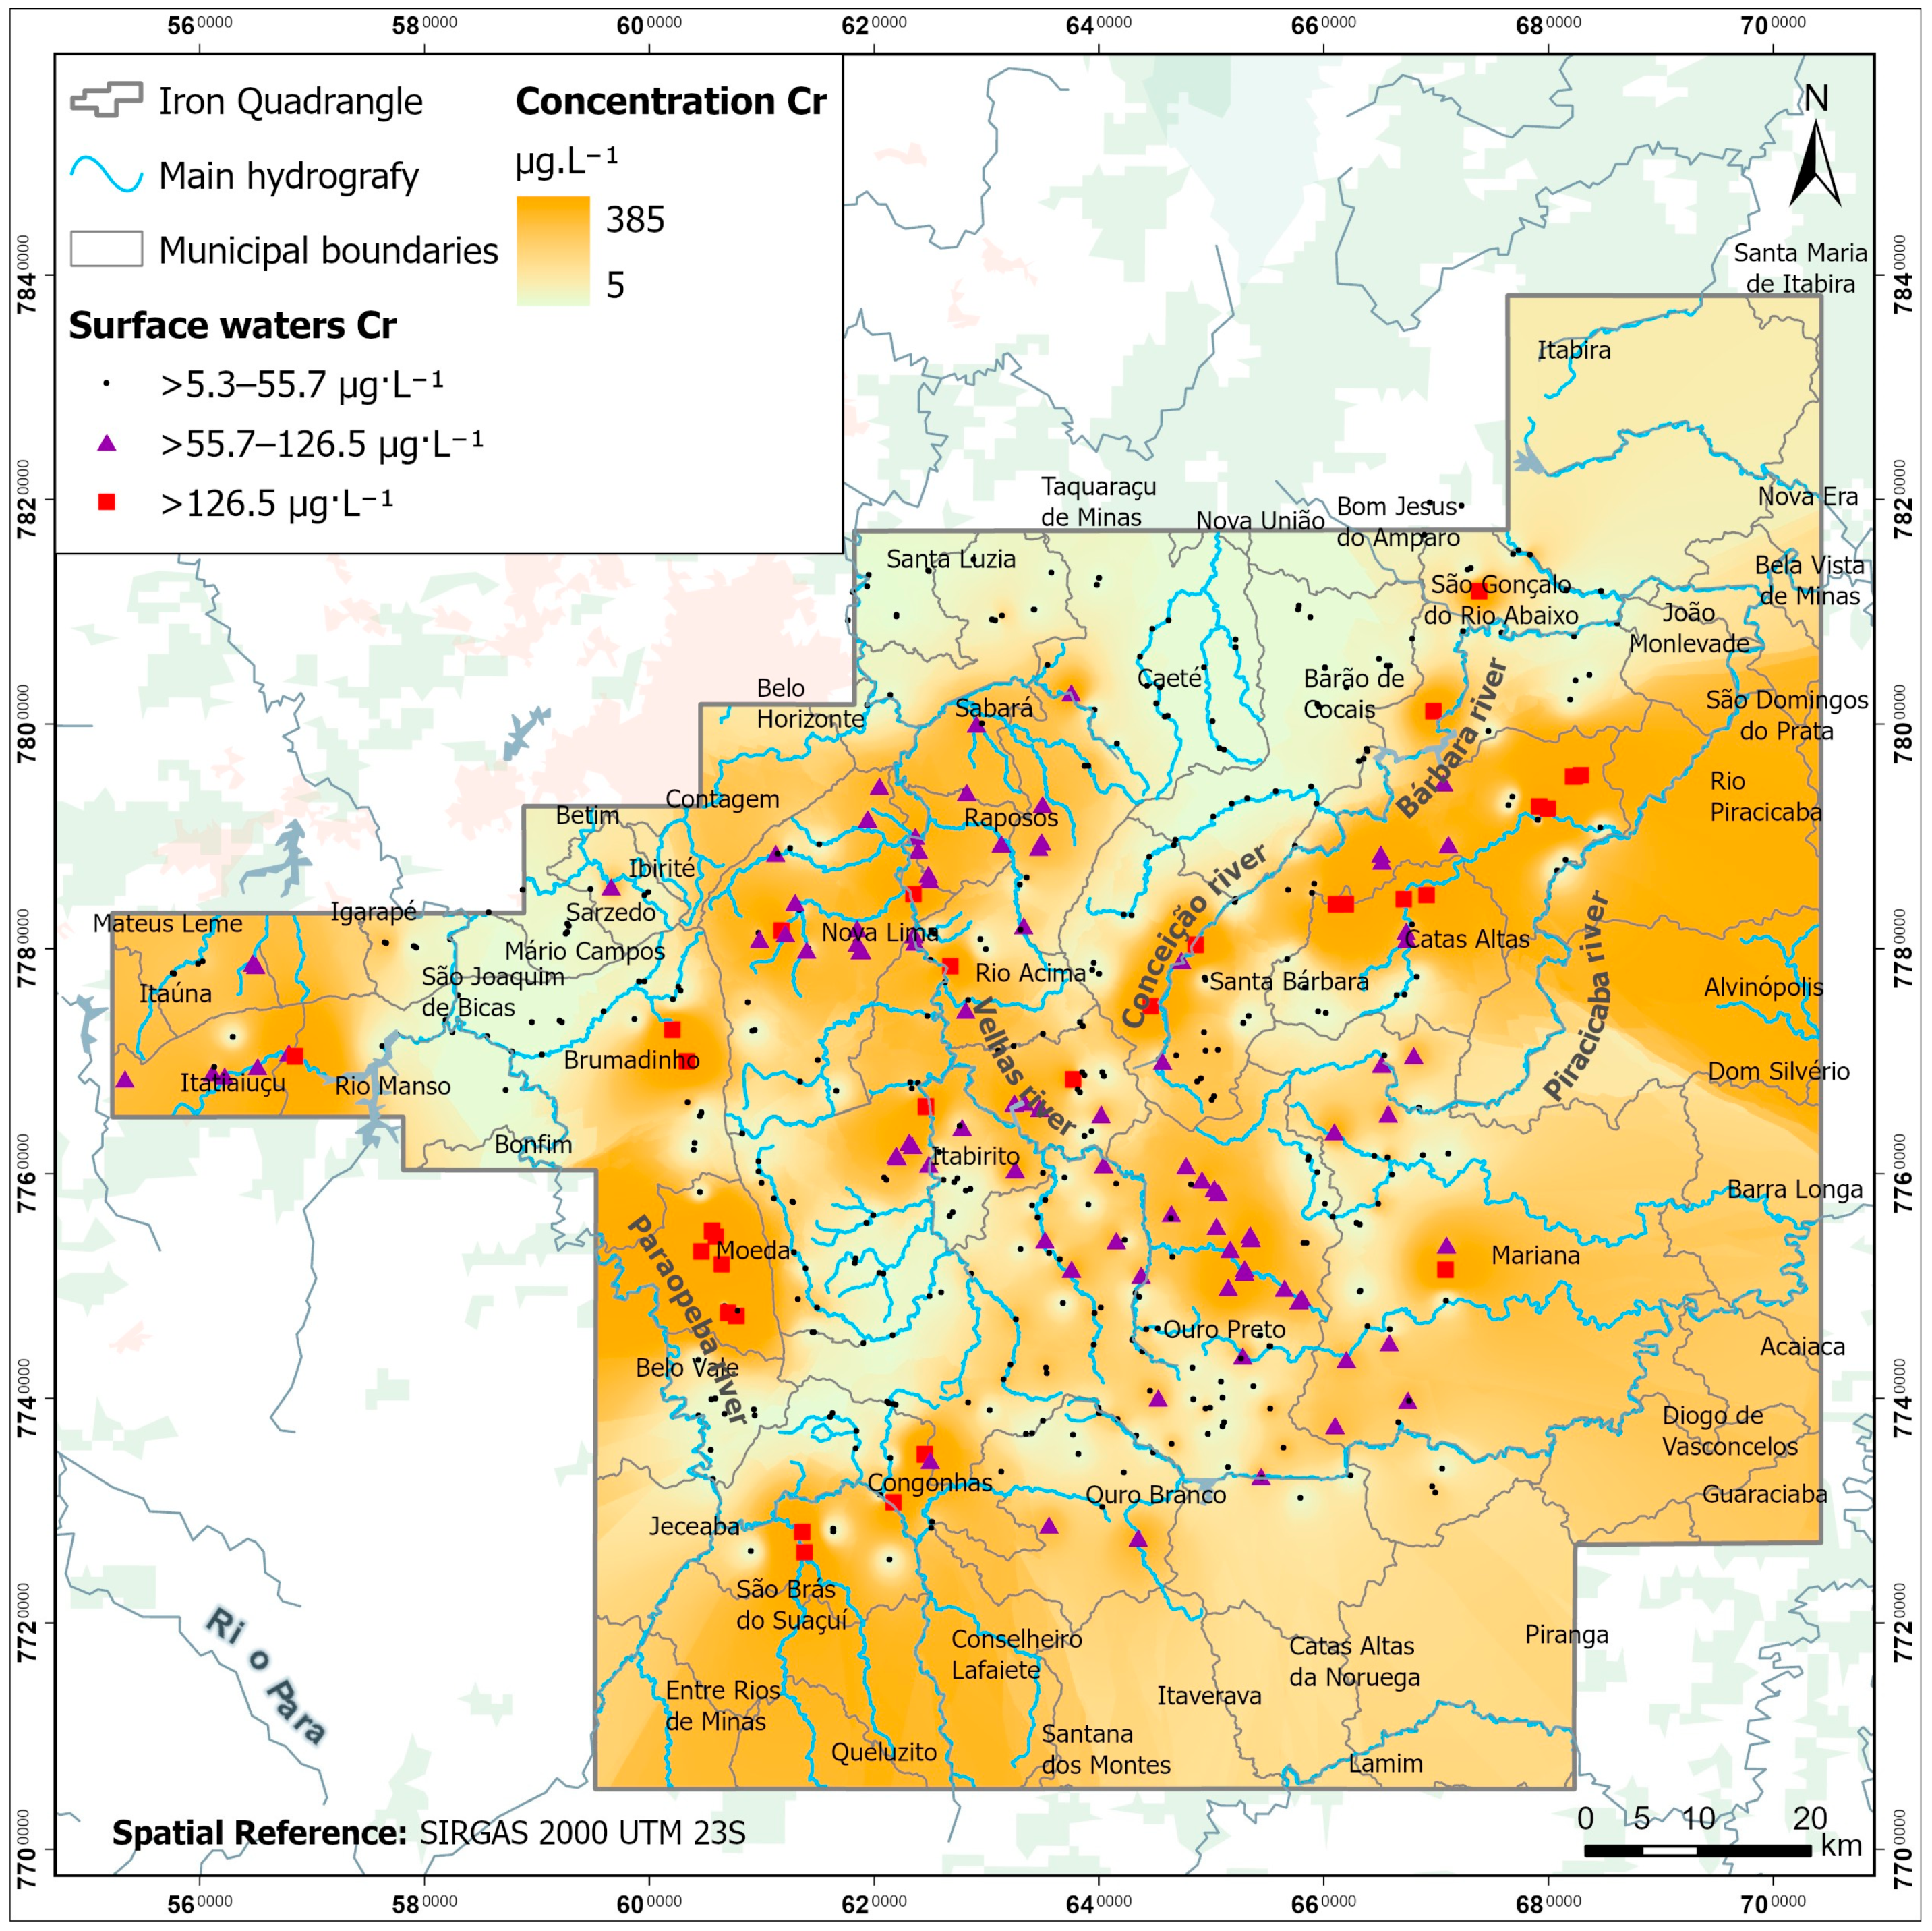
In surface waters, Cr concentrations ranged from <5.3 to 384.7 μg·L−1, with a median of 8.5 μg·L−1, substantially higher than European and global baseline values (Figure 3). Approximately 75.3% of samples exhibited concentrations up to 55.7 μg·L−1, near or slightly above regulatory limits (50 μg·L−1), while 18% fell within an intermediate range (up to 126 μg·L−1), classified as elevated background. Anomalous values (>126.5 μg·L−1) account for 6.7% of samples and are primarily associated with drainage over Nova Lima Group lithologies and mafic–ultramafic rocks of the Minas Supergroup.
Figure 3.
Cr geochemical map for IQ for surface waters. Sampling sites were classified as reference values (>5.3–55.7 µg·L−1), high reference values (>55.7–126.5 µg·L−1), and anomalies (>126.5 µg·L−1).
Cross-validation of the IDW interpolation yielded an ME of −0.78 μg·L−1 and an RMSE of 55.90 μg·L−1. The low ME suggests that interpolation errors were not systematically over- or underestimated. The observed RMSE is consistent with the marked variability of Cr concentrations among drainage systems, reflecting the influence of localised inputs and the heterogeneous geological framework that controls metal mobilisation throughout the IQ.
3.2. Sediment Quality Assessment by Pollution Indexes
3.2.1. Contamination Factor (CF)
Table 4 presents the contamination factor (CF) results for chromium, showing 2.1% of the sampling points classified as having high contamination.
Table 4.
Minimum and maximum CF values for Cr and percentage of samples in each class.
Analysis of the table indicates that the majority of samples (74.9%) fall into the “no contamination” class (CF < 1), suggesting that, in most locations, Cr concentrations are consistent with natural background levels and likely controlled by lithogenic sources.
However, a substantial proportion of samples (20.9%) are classified as moderately contaminated, and a small fraction fall into the higher contamination categories, with 2.1% classified as considerably contaminated (3 ≤ CF < 6) and 2.1% as highly contaminated (CF ≥ 6), bringing the proportion of samples with considerable to very high contamination to 4.2%. These high values are present over a limited spatial extent and indicate the presence of critical points in the western and northeastern regions of the IQ.
3.2.2. Enrichment Factor (EF)
Table 5 presents the distribution of Enrichment Factor (EF) classifications. The results indicate that the IQ is primarily marked by a natural geochemical baseline, showing limited evidence of relevant enrichment associated with anthropogenic activities.
Table 5.
Minimum and maximum EF values for Cr and percentage of samples in each class.
The enrichment factor (EF) values reveal a maximum value of 85.98, recorded in the municipality of Santa Bárbara at a point with 2128 mg·kg−1.
The majority of the sample set (68.2%) falls into the “No enrichment” category, suggesting that Cr concentrations are mainly controlled by geogenic sources. However, a considerable proportion of samples (23.4%) are classified as moderately enriched, indicating localised increases in Cr concentrations that may reflect a combination of natural variability and small anthropogenic contributions. Furthermore, 8.4% of the samples show more severe levels of enrichment, with 6.8% classified as severely enriched and another 1.4% as very severely enriched.
The high EF values partially coincided with the points showing the most extreme CF levels, although some discrepancies were observed. CF registered the highest values in samples with the highest Cr concentrations; on the other hand, the maximum EF values occurred in locations associated with the 4th, 7th, and 3rd highest concentrations of this element.
The highest concentrations were 2581, 2461, 2138, and 2128 mg·kg−1, and the points that exhibited these values showed the highest CF values (16.18 to 19.63). However, the highest EF values, ranging from 38.84 to 85.98, were obtained at points with Cr concentrations of 1691 to 2138 mg·kg−1. This difference between the indices can be attributed to the normalising effect of Al, which reduces the variability associated with natural geochemical conditions, causing points that did not necessarily have the highest concentrations to still present higher EF values.
Despite both indices being used to assess the degree of contamination, the Contamination Factor (CF) more frequently assigns the classification of “not contaminated.” This behaviour indicates that the CF may have limited sensitivity to detecting signals of anthropogenic origin in complex lithological and geochemical environments [64]. In contrast, the EF provides a more refined assessment, allowing the recognition of discrete variations in contamination even when influenced by natural geochemical conditions [52,65,66].
4. Discussion
The spatial distribution of anomalies is strongly correlated with the presence of schists, quartzites, ferruginous quartzites, and metabasalts of the Nova Lima Group, as well as quartzite-phyllitic rocks of the Caraça Group (Minas Supergroup), and granites and gneisses with mafic and ultramafic intrusions from metamorphic complexes.
In the central IQ region, where lithologies of the Nova Lima Group predominate, a high density of samples exhibiting elevated background and anomalous values was observed. These anomalies originate in the headwaters of the Velhas River, in the municipality of Ouro Preto, within areas of low anthropogenic influence (rural communities), with concentrations ranging from 279.5 to 437.6 mg·kg−1. They extend downstream to the middle basin (Rio Acima, Nova Lima, and Caeté), covering an area of approximately 135 km2 with 23 sampling points exceeding Q3 or UIF thresholds (131.2–572 mg·kg−1).
In this region, the increase in Cr levels may reflect the combined influence of geogenic and possibly anthropogenic factors, which has intensified in recent decades. Local geology contributed to the natural enrichment of this element, while activities such as mining, the presence of tailings, metallurgy, urbanization, and changes in land use may have favored its mobilization or environmental redistribution. The simultaneous occurrence of anomalies in other potentially toxic elements, such as As, Co, Cu, and Ni, reinforces the possibility of a complex geochemical context, conditioned by multiple environmental sources and processes [20,26,30,44,67,68,69].
In the upper part of the basin, in the city of Congonhas, there is also probable evidence of anthropogenic influence. At a sampling point located downstream from a steel mill that manufactures various types of steel, anomalous levels of chromium and other potentially toxic elements (PTEs) were recorded, associated with strongly alkaline pH values, with an average of 9.3.
pH and redox conditions are recognized as relevant factors in controlling chromium behavior in aquatic systems, influencing its mobility, distribution, and potential bioavailability [70,71]. In the present case, relatively alkaline conditions may favor certain partitioning processes between sediments and surface waters, although the interpretation of these mechanisms should be carried out with caution.
High chromium concentrations in sediments may suggest partial retention in this compartment, while variations observed in the aqueous phase may indicate some degree of redistribution in the system.
However, since only total chromium was determined, it is not possible to directly infer the ratio between Cr(III) and Cr(VI), forms that exhibit distinct geochemical behaviors and toxicities. Thus, the available data do not allow a conclusive assessment of the effective toxicity of chromium or its specific environmental risk under the studied conditions. Therefore, any interpretation of potential ecotoxicological effects should be considered preliminary and dependent on complementary studies, including chromium speciation, bioavailability assays, and evaluation of local geochemical conditions.
In the city of Moeda, concentrations ranged from 512 to 2138 mg·kg−1 in rural communities with low anthropogenic influence, which drained over gneisses, granites and migmatites with mafic-ultramafic intrusions (Bonfim Complex). In Brumadinho, two anomalous points were observed with contents between 312.4 and 313.1 mg·kg−1, which are associated with drainage over meta-ultramafic rocks, in areas where we have diabase dikes, which are known to contain high levels of Cr and Ni, and are probably responsible for these anomalies, confirming the correlation described for both elements [28,44,72].
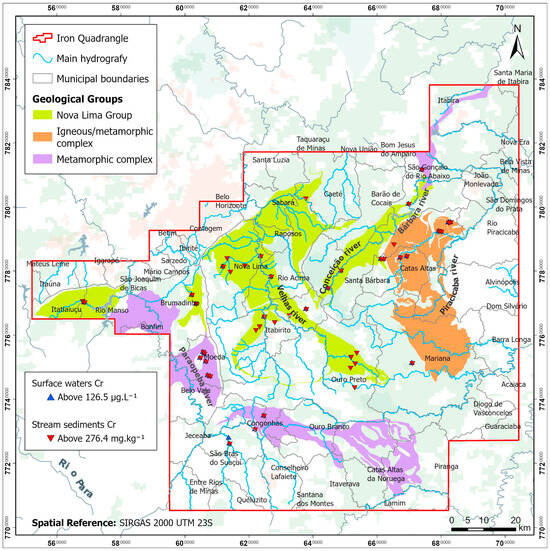
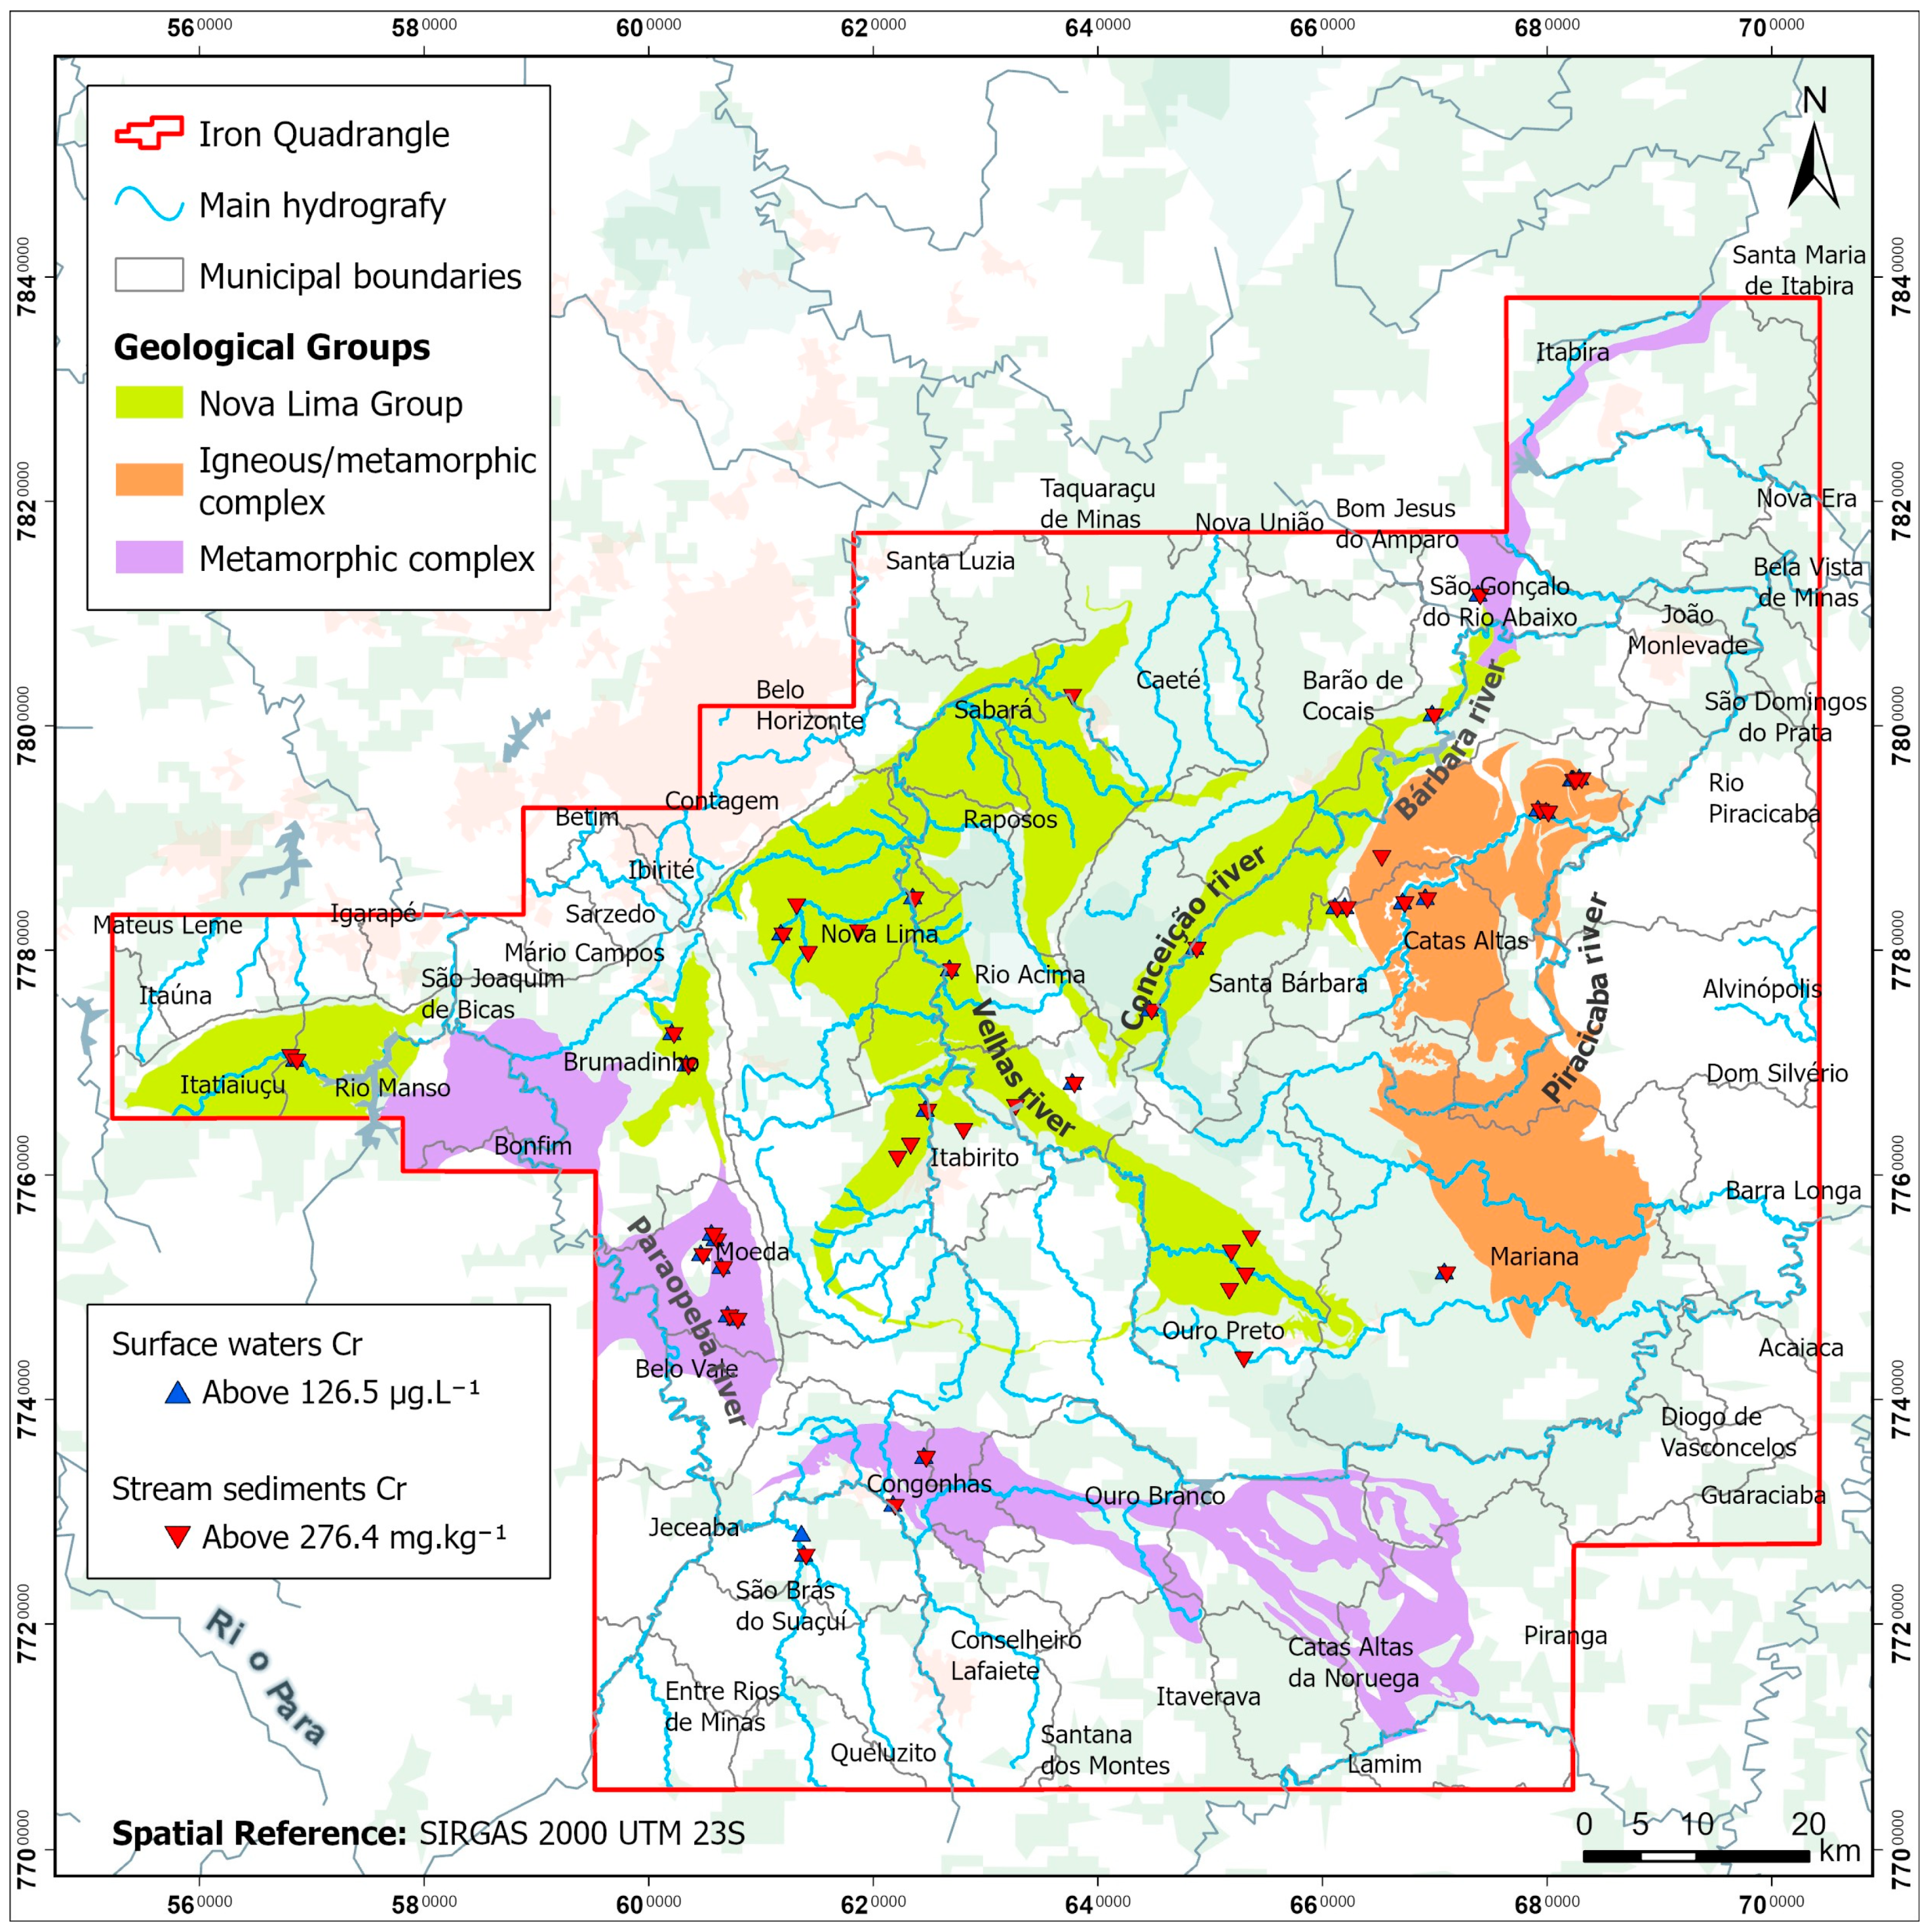
In the northeastern IQ, within the Conceição and Piracicaba River basins, a cluster of anomalous values (312.7–1332 mg·kg−1) was identified in the municipality of Santa Bárbara (Figure 4). These are associated with Dom Silvério schists, biotite–hornblende assemblages of the Mantiqueira Complex, and amphibolite intrusions. In Catas Altas, located in the upper Piracicaba basin, the highest Cr concentrations in the entire IQ were recorded (2461 and 2581 mg·kg−1), associated with quartzites, phyllites, serpentinites, talc-rich rocks, and undifferentiated mafic–ultramafic lithologies. These lithological controls extend downstream, where concentrations between 238.2 and 796 mg·kg−1 were observed in basins draining granites and gneisses of the Santa Bárbara Complex. Previous studies have consistently reported elevated Cr, Co, and Ni concentrations in ultrabasic rocks, highlighting their role as primary sources [22,26,28,44].
Figure 4.
Distribution of geological groups and the sampling points with the highest Cr concentrations in stream sediments and surface waters.
When sediment concentrations are compared with sediment quality guidelines (TEL = 37.3 mg·kg−1 and PEL = 90 mg·kg−1), a highly concerning scenario emerges, with 73.3% of samples exceeding TEL and 42.3% exceeding PEL thresholds. Notably, many of these points occur in areas of low anthropogenic influence, such as rural communities, where environmental monitoring is often limited or absent.
Regarding surface waters spatially, elevated concentrations were observed in the Paraopeba River basin, where 11 points ranged between 197.3 and 325.8 μg·L−1, some located in urbanised areas (Moeda, Jeceaba, Belo Vale), where untreated domestic effluents may contribute to Cr enrichment. Additional anomalies were identified in low-impact areas influenced by diabase intrusions, highlighting lithogenic control.
In the Velhas River basin, eight anomalous points (104.6–273.6 μg·L−1) were identified in rural communities where surface water is frequently used for direct consumption. In the northeastern IQ, particularly in Catas Altas and along the Santa Bárbara River basin, concentrations ranged from 105 to 365 μg·L−1 (Figure 4), associated with lithologies rich in trace elements. Mining activities further enhance the mobilisation and availability of Cr in these environments [20,22,24,26,28,44,69].
The comparison of surface water concentrations with drinking water standards (50 μg·L−1) indicates a critical scenario, with 35.3% of sampling points exceeding regulatory limits, representing a significant potential risk to human health.
Overall, the spatial distribution of Cr in the surface waters of the IQ appears to reflect the combined influence of lithological controls and possible anthropogenic contributions. Geogenic sources may play an important role in some areas, while human activities, including urbanization, mining, and industrial land use, may contribute to the mobilization or redistribution of Cr under specific environmental conditions [73].
5. Conclusions
This study provides a comprehensive regional-scale assessment of Cr distribution in river sediments and surface waters of the Iron Quadrangle (IQ), revealing high spatial variability, with a predominance of values consistent with regional background conditions, but with significant anomalies occurring in specific areas.
The results show that many stream sediment samples are above internationally recognised sediment quality limits (TEL and PEL), indicating the need for more detailed ecotoxicological analyses, particularly elutriation assays. This scenario is similar for surface waters, which exceeded the limits established by legislation in more than a third of samples. Although no analyses of chemical species were performed, these findings raise critical concerns regarding environmental quality and public health, particularly in rural and peri-urban areas where surface water is frequently used directly for human consumption without adequate treatment.
Based on the established reference values and the mapping carried out, it was possible to identify regions and hotspots that should be continuously monitored, since changes in pH and redox potential, possibly resulting from the discharge of sewage or effluents, can modify environmental conditions and promote the mobility and bioavailability of Cr in the aquatic system, with potential impacts throughout the food chain [71].
Another relevant finding was the occurrence of high Cr concentrations in areas of low anthropogenic influence, reinforcing the need to establish region-specific thresholds that account for high natural background concentrations. These established environmental standards, often based on generalized global limits, may not adequately represent the regional geochemical setting and may lead to incorrect classifications of contamination levels. Therefore, defining specific reference values for each region should be considered a priority for environmental regulation and land-use planning. At the same time, the increasing influence of mining activities and urban expansion on Cr mobilisation highlights the need for improved control of effluent discharge, waste management, and continuous monitoring. In this context, the combination of geochemical mapping, pollution indices (CF and EF), and spatial analysis provides a useful framework for environmental assessment and decision-making, enabling the identification of priority areas and the definition of targeted monitoring strategies.
The results also point to the need for further studies, including Cr speciation and complementary assays, as total concentrations alone do not allow a complete assessment of environmental risk. In this sense, integrated approaches that combine geochemical and spatial information will remain essential for managing mining-impacted regions such as the IQ.
Author Contributions
Conceptualization, R.V., T.V., M.G.P.L., L.P.L., R.F. and H.A.N.J.; methodology, R.V., M.G.P.L., R.F., L.P.L., D.C.d.C.e.S. and N.d.P.N.; software, D.C.d.C.e.S. and N.d.P.N.; validation, R.V., T.V., M.G.P.L., L.P.L. and R.F., writing—original draft preparation, R.V., T.V., M.G.P.L., L.P.L., R.F., D.C.d.C.e.S., N.d.P.N. and H.A.N.J. ; writing—review and editing, R.V., T.V., M.G.P.L., L.P.L., R.F., D.C.d.C.e.S., N.d.P.N. and H.A.N.J.; project administration, R.V., T.V., M.G.P.L., L.P.L., R.F. and H.A.N.J. All authors have read and agreed to the published version of the manuscript.
Funding
This research was supported by Multi-annual funding of ICT through the contract with the Foundation for Science and Technology (FCT), under project ID/04683. The authors highly appreciate the financial support of the institutions CNPq (Project PRONEX CNPQ Proc. No 476881/07-2.), FAPEMIG (Project 02529/24), FINEP (Project 1340/24) and mainly CAPES for the scholarship Proc. No. 10228/13-6.
Data Availability Statement
Data are available on request from the authors. The data are not publicly available due to the large dimensions of the database.
Conflicts of Interest
The authors declare no conflicts of interest.
References
- An, Y.; Yan, T.; Gong, Q.; Wang, X.; Huang, Y.; Zhang, B.; Yin, Z.; Zhao, X.; Liu, N. Chromium (Cr) geochemical mapping based on fixed-values’ method: Case studies in China. Appl. Geochem. 2022, 136, 105168. [Google Scholar] [CrossRef] [Scilit]
- Zhao, Y.; Kumul, C.; Wang, T.; Mosusu, N.; Yao, Z.; Zhu, Y.; Zhang, B.; Wang, X. National-Scale Geochemical Baseline and Anomalies of Chromium in Papua New Guinea. Minerals 2023, 13, 205. [Google Scholar] [CrossRef] [Scilit]
- Kabata-Pendias, A. Trace Elements in Soils and Plants, 4th ed.; CRC Press: Boca Raton, FL, USA, 2010; p. 548. [Google Scholar] [CrossRef] [Scilit]
- Prasad, S.; Yadav, K.K.; Kumar, S.; Gupta, N.; Cabral-Pinto, M.M.; Rezania, S.; Radwan, N.; Alam, J. Chromium contamination and effect on environmental health and its remediation: A sustainable approaches. J. Environ. Manag. 2021, 285, 112174. [Google Scholar] [CrossRef] [Scilit] [PubMed]
- Kotaś, J.; Stasicka, Z. Chromium occurrence in the environment and methods of its speciation. Environ. Pollut. 2000, 107, 263–283. [Google Scholar] [CrossRef] [Scilit] [PubMed]
- Shahid, M.; Dumat, C.; Khalid, S.; Schreck, E.; Xiong, T.; Niazi, N.K. Foliar heavy metal uptake, toxicity and detoxification in plants: A comparison of foliar and root metal uptake. J. Hazard. Mater. 2017, 325, 36–58. [Google Scholar] [CrossRef] [Scilit] [PubMed]
- Rai, D.; Eary, L.E.; Zachara, J.M. Environmental chemistry of chromium. Sci. Total Environ. 1989, 86, 15–23. [Google Scholar] [CrossRef] [Scilit] [PubMed]
- Richard, F.C.; Bourg, A.C. Aqueous geochemistry of chromium: A review. Water Res. 1991, 25, 807–816. [Google Scholar] [CrossRef] [Scilit]
- Rasool, A.; Pertile, E.; Brožová, K.; Halfar, J.; Čabanová, K.; Malíková, P.; Chromíková, J.; Motyka, O.; Drabinová, S.; Heviánková, S. Mechanistic insights and environmental ramifications of Cr (III) oxidation to Cr (VI) in soil and groundwater systems: Bridging geochemical mechanisms and emerging remediation strategies. Environ. Geochem. Health 2026, 48, 12. [Google Scholar] [CrossRef] [Scilit] [PubMed]
- Ao, M.; Zhou, R.; Meng, R.; Bonaventure, L.A.; Luo, B.; Qian, X.; Xu, X.; Wang, S.; Wu, P. Chromium transformations and biological impacts in aquatic systems: From sediment-water interfaces to food web complexity. Ecotoxicol. Environ. Saf. 2025, 303, 118850. [Google Scholar] [CrossRef] [Scilit] [PubMed]
- U.S. Environmental Protection Agency (USEPA). IRIS Toxicological Review of Hexavalent Chromium (Cr(VI)) (Final Report). 2024. Available online: https://iris.epa.gov/document/&deid=361833 (accessed on 7 February 2026).
- Zhitkovich, A. Chromium in drinking water: Sources, metabolism, and cancer risks. Chem. Res. Toxicol. 2011, 24, 1617–1629. [Google Scholar] [CrossRef] [Scilit] [PubMed]
- ANZECC. Australian and New Zealand Guidelines for Fresh and Marine Water Quality; Australian and New Zealand Environment and Conservation Council and Agriculture and Resource Management Council of Australia and New Zealand: Canberra, Australia, 2000; Volume 1, pp. 1–314. Available online: https://www.waterquality.gov.au/anz-guidelines/guideline-values/default/water-quality-toxicants/toxicants/chromium-2000 (accessed on 4 January 2026). [CrossRef] [Scilit]
- Wang, Z.; Feng, W.; Zhang, J.; Chang, M.; Ma, Y.; Li, H. Integrated effects of water conditions and aging on chromium speciation and availability in two paddy soils spiked with hexavalent chromium. Environ. Pollut. Bioavailab. 2024, 36, 2407382. [Google Scholar] [CrossRef] [Scilit]
- Matschullat, J.; Ottenstein, R.; Reimann, C. Geochemical background—Can we calculate it? Environ. Geol. 2000, 39, 990–1000. [Google Scholar] [CrossRef] [Scilit]
- Pettine, M.; Capri, S. Digestion treatments and risks of Cr (III)–Cr (VI) interconversions during Cr (VI) determination in soils and sediments—A review. Anal. Chim. Acta 2005, 540, 231–238. [Google Scholar] [CrossRef] [Scilit]
- Rakhunde, R.; Deshpande, L.; Juneja, H.D. Chemical speciation of chromium in water: A review. Crit. Rev. Environ. Sci. Technol. 2012, 42, 776–810. [Google Scholar] [CrossRef] [Scilit]
- Zhu, X.; Hu, B.; Jiang, Z.; Wu, Y.; Xiong, S. Speciation of chromium (III) and chromium (VI) by in situ separation and sequential determination with electrothermal vaporization inductively coupled plasma atomic emission spectrometry. Anal. Chim. Acta 2002, 471, 121–126. [Google Scholar] [CrossRef] [Scilit]
- Sricharoenvech, P.; Siebecker, M.G.; Tappero, R.; Landrot, G.; Fischel, M.H.; Sparks, D.L. Chromium speciation and mobility in contaminated coastal urban soils affected by water salinity and redox conditions. J. Hazard. Mater. 2024, 462, 132661. [Google Scholar] [CrossRef] [Scilit] [PubMed]
- Vicq, R.; Leite, M.G.; Leão, L.P.; Nallini Júnior, H.A.; Gomes, P.; Fonseca, R.; Valente, T. Advancing the understanding of sediment contamination dynamics in the Iron Quadrangle (Brazil): A comparative analysis of pollution indices for PTE assessment. Minerals 2025, 15, 199. [Google Scholar] [CrossRef] [Scilit]
- Matschullat, J.; Borba, R.P.; Deschamps, E.; Figueiredo, B.F.; Gabrio, T.; Schwenk, M. Human and environmental contamination in the Iron Quadrangle, Brazil. Appl. Geochem. 2000, 15, 181–190. [Google Scholar] [CrossRef] [Scilit]
- Costa, A.T.; Nalini, H.A., Jr.; Castro, P.D.T.A.; Tatumi, S.H. Análise estratigráfica e distribuição do arsênio em depósitos sedimentares quaternários da porção sudeste do Quadrilátero Ferrífero, bacia do Ribeirão do Carmo, MG. REM Rev. Esc. Minas 2010, 63, 703–714. [Google Scholar] [CrossRef] [Scilit]
- Deschamps, E.; Matschullat, J. Arsenic: Natural and anthropogenic. In Arsenic in the Environment; CRC Press: Boca Raton, FL, USA, 2011; Volume 4, 209p, ISBN 978-0-203-09322-1. [Google Scholar]
- Vicq, R.; Matschullat, J.; Leite, M.G.P.; Nalini Junior, H.A.; Mendonça, F.P.C. Iron Quadrangle stream sediments, Brazil: Geochemical maps and reference values. Environ. Earth Sci. 2015, 74, 4407–4417. [Google Scholar] [CrossRef] [Scilit]
- Costa, R.V.F.; Valente, T.; Leão, L.; Leite, M.; Nalini, H., Jr. O chumbo na Província Mineira do Quadrilátero Ferrífero, Brasil: Mapeamento geoquímico e valores de referência. Comun. Geológicas 2025, 112, 323–327. [Google Scholar] [CrossRef]
- Larizzatti, J.H.; Marques, E.D.; Silveira, F.V. Geochemical Mapping of the Quadrilátero Ferrífero, Brazil and Surroundings; CPRM, 2014; p. 208. ISBN 978-85-7499-153-5. Available online: https://www.researchgate.net/publication/304580521_MAPEAMENTO_GEOQUIMICO_DO_QUADRILATERO_FERRIFERO_E_SEU_ENTORNO_Geochemical_Mapping_of_Iron_Quadrangle_and_Surroundings (accessed on 16 January 2026).
- Instituto Brasileiro de Geografia e Estatística (IBGE). Censo Demográfico do Brasil. 2021. Available online: https://www.ibge.gov.br/cidades-e-estados/mg./ (accessed on 12 January 2026).
- Marques, E.D.; Castro, C.C.; de Assis Barros, R.; Lombello, J.C.; de Souza Marinho, M.; Araújo, J.C.S.; Santos, E.A. Geochemical mapping by stream sediments of the North West portion of Quadrilátero Ferrífero, Brazil: Application of the exploratory data analysis (EDA) and a proposal for generation of new gold targets in Pitangui gold district. J. Geochem. Explor. 2023, 250, 107232. [Google Scholar] [CrossRef] [Scilit]
- Leão, L.P.; Vicq, R.; Nalini, H.A., Jr.; Leite, M.G.P. Mapeamento Geoquímico do Manganês e Avaliação da Qualidade de Sedimentos Fluviais e Águas Superficiais do Quadrilátero Ferrífero, Brasil. In Anuário do Instituto de Geociências; Universidade Federal do Rio de Janeiro: Rio de Janeiro, Brazil, 2019; Volume 42, pp. 444–455. [Google Scholar] [CrossRef] [Scilit]
- Pereira, J.C.; Guimarães-Silva, A.K.; Nalini, H.A., Jr.; Pacheco-Silva, E.; De Lena, J.C. Distribuição, fracionamento e mobilidade de elementos traço em sedimentos superficiais. Quim. Nova 2007, 30, 1249–1255. [Google Scholar] [CrossRef] [Scilit]
- Mendonça, F.P.C. Influência da Mineração na Geoquímica das Águas Superficiais e nos Sedimentos no Alto Curso da Bacia do Ribeirão Mata Porcos, Quadrilátero Ferrífero, Minas Gerais. Master’s Thesis, Federal University of Ouro Preto, Ouro Preto, Brazil, 2012. Available online: https://www.repositorio.ufop.br/items/e50f6cb9-78c9-4ee9-bf9f-4d84b4878e41 (accessed on 18 January 2026).
- Varejão, E.V.; Bellato, C.R.; Fontes, M.P.F.; Mello, J.W.V. Arsenic and trace metals in river water and sediments from southeast portion of Quadrilátero Ferrífero, Brazil. Environ. Monit. Assess. 2010, 172, 631–642. [Google Scholar] [CrossRef] [Scilit] [PubMed]
- Parra, R.R.; Roeser, H.M.P.; Leite, M.G.P.; Nalini, H.A., Jr.; Guimarães, A.T.A.; Pereira, J.C.; Friese, K. Influência antrópica na geoquímica de água e sedimentos do Rio Conceição, Quadrilátero Ferrífero, Minas Gerais—Brasil. Geochim. Bras. 2007, 21, 36–49. [Google Scholar]
- Alkmim, F.F.; Teixeira, W. The Paleoproterozoic Mineiro Belt and the Quadrilátero Ferrífero. In São Francisco Craton, Eastern Brazil. Regional Geology Reviews; Heilbron, M., Cordani, U., Alkmim, F., Eds.; Springer: Cham, Switzerland, 2017. [Google Scholar] [CrossRef] [Scilit]
- Teixeira, W.; Sabate, P.; Barbosa, J.; Noce, C.M.; Carneiro, M.A. Archean and paleoproterozoic tectonic evolution of the São Francisco craton, Brazil. In Tectonic Evolution of South America; Instituto de Geociências, Universidade de São Paulo: Rio de Janeiro, Brazil, 2000; Available online: https://www.researchgate.net/publication/236348451_Archean_and_Paleoproterozoic_tectonic_evolution_of_the_Sao_Francisco_Craton_Brazil (accessed on 15 January 2026).
- Baltazar, O.F.; Zucchetti, M. Lithofacies associations and structural evolution of the Archean Rio das Velhas greenstone belt, Quadrilátero Ferrífero, Brazil: A review of the setting of gold deposits. Ore Geol. Rev. 2007, 32, 471–499. [Google Scholar] [CrossRef] [Scilit]
- Lobato, L.M.; Ribeiro-Rodrigues, L.C.; Zucchetti, M.; Noce, C.M.; Baltazar, O.F.; da Silva, L.C.; Pinto, C.P. Brazil’s premier gold province. Part I: The tectonic, magmatic, and structural setting of the Archean Rio das Velhas greenstone belt, Quadrilátero Ferrífero. Miner. Depos. 2001, 36, 228–248. [Google Scholar] [CrossRef] [Scilit]
- Alkmim, F.F.; Marshak, S. Transamazonian orogeny in the southern São Francisco craton region, Minas Gerais, Brazil: Evidence for Paleoproterozoic collision and collapse in the Quadrilátero Ferrífero. Precambrian Res. 1998, 90, 29–58. [Google Scholar] [CrossRef] [Scilit]
- Endo, I.; Galbiatti, H.F.; Delgado, C.E.R.; Oliveira, M.M.F.; Zapparoli, A.C.; Moura, L.G.B.; Peres, G.G.; Oliveira, A.H.; Zavaglia, G.; Danderfer Filho, A.; et al. Mapa Geológico do Quadrilátero Ferrífero, Minas Gerais, Brasil. Escala 1:150.000: Uma Celebração do Cinquentenário da Obra de Dorr (1969); Departamento de Geologia da Escola de Minas/UFOP—Centro de Estudos Avançados do Quadrilátero Ferrífero: Ouro Preto, Brazil, 2020; Available online: https://qfe2050.ufop.br/sites/default/files/qfe2050/files/quadrilatero_ferrifero_web_5.pdf?m=1724969074 (accessed on 2 February 2026).
- Salminen, R.; Tarvainen, T.; Demetriades, A.; Duris, M.; Fordyce, F.M.; Gregorauskiene, V.; Kahelin, H.; Kivisilla, J.; Klaver, G.; Klein, H.; et al. FOREGS Geochemical Mapping Field Manual; Guide 47; Geological Survey of Finland: Espoo, Finland, 2005; 36p, Available online: https://nora.nerc.ac.uk/id/eprint/19017/1/FOREGSmanual.pdf (accessed on 7 February 2026).
- OHIO Environmental Protection Agency. Sediment Sampling Guide and Methodologies; Ohio—EPA Division of Surface Water: Columbus, OH, USA, 2001; Volume 2, pp. 1–35. Available online: https://clu-in.org/download/contaminantfocus/sediments/sampling-guide-ohio-sedman2001.pdf (accessed on 10 January 2026).
- Albanese, S.; Vivo, B.; Lima, A.; Cicchella, D. Geochemical background and baseline values of toxic elements in stream sediments of Campania region (Italy). J. Geochem. Explor. 2006, 93, 21–34. [Google Scholar] [CrossRef] [Scilit]
- Reimann, C.; de Caritat, P.; GEMAS Project Team; NGSA Project Team. New soil composition data for Europe and Australia: Demonstrating comparability, identifying continental-scale processes and learning lessons for global geochemical mapping. Sci. Total Environ. 2012, 416, 239–252. [Google Scholar] [CrossRef] [Scilit] [PubMed]
- Larizzatti, J.H.; Duarte Marques, E.; Valdir Silveira, F. Geochemical Mapping of Iron Quadrangle region by active stream sediments, State of Minas Gerais, Brazil. Geochim. Bras. 2018, 32, 268–292. [Google Scholar] [CrossRef] [Scilit]
- Carranza, E.J.M. Geochemical anomaly and mineral prospectivity mapping in GIS. In Handbook of Exploration and Environmental Geochemistry; Elsevier: Enschede, The Netherlands, 2009; pp. 3–351. Available online: https://researchonline.jcu.edu.au/40323/ (accessed on 15 January 2026).
- Caritat, P.; Cooper, M. National Geochemical Survey of Australia: The Geochemical Atlas of Australia; Geoscience Australia Record; 2011; Volume 2, 557p, Available online: https://www.researchgate.net/deref/http%3A%2F%2Fdx.doi.org%2F10.11636%2FRecord.2011.020?_tp=eyJjb250ZXh0Ijp7ImZpcnN0UGFnZSI6InB1YmxpY2F0aW9uIiwicGFnZSI6InB1YmxpY2F0aW9uIiwicG9zaXRpb24iOiJwYWdlQ29udGVudCJ9fQ (accessed on 18 January 2026).
- Hakanson, L. An ecological risk index for aquatic pollution control. A sedimentological approach. Water Res. 1980, 14, 975–1001. [Google Scholar] [CrossRef] [Scilit]
- Reimann, C.; de Caritat, P. Distinguishing between natural and anthropogenic sources for elements in the environment: Regional geochemical surveys versus enrichment factors. Sci. Total Environ. 2005, 337, 91–107. [Google Scholar] [CrossRef] [Scilit] [PubMed]
- Wedepohl, K.H. The composition of the continental crust. Geochim. Cosmochim. Acta 1995, 59, 1217–1232. [Google Scholar] [CrossRef] [Scilit]
- Reimann, C.; de Caritat, P. Chemical elements in the environment. In Factsheets for the Geochemist and Environmental Scientist; Springer: Berlin/Heidelberg, Germany, 1998; 398p. [Google Scholar] [CrossRef] [Scilit]
- Birch, G. An assessment of aluminum and iron in normalisation and enrichment procedures for environmental assessment of marine sediment. Sci. Total Environ. 2020, 727, 138123. [Google Scholar] [CrossRef] [Scilit] [PubMed]
- Birch, G. A review and critical assessment of sedimentary metal indices used in determining the magnitude of anthropogenic change in coastal environments. Sci. Total Environ. 2023, 854, 158129. [Google Scholar] [CrossRef] [Scilit] [PubMed]
- Balls, P.; Hull, S.; Miller, B.; Pirie, J.; Proctor, W. Trace metal in Scottish estuarine and coastal sediments. Mar. Pollut. Bull. 1997, 34, 42–50. [Google Scholar] [CrossRef] [Scilit]
- Munoz-Barbosa, A.; Huerta-Diaz, M.A. Trace metal enrichments in nearshore sediments and accumulation in mussels (Modiolus capax) along the eastern coast of Baja California, Mexico: Environmental status in 1995. Mar. Pollut. Bull. 2013, 77, 71–81. [Google Scholar] [CrossRef] [Scilit] [PubMed]
- Rubio, B.; Nombella, M.A.; Vilas, F. Geochemistry of major and trace elements in sediments of the Ria de Vigo (NW Spain): An assessment of metal pollution. Mar. Pollut. Bull. 2000, 40, 968–980. [Google Scholar] [CrossRef] [Scilit]
- Liao, Y.; Li, D.; Zhang, N. Comparison of interpolation models for estimating heavy metals in soils under various spatial characteristics and sampling methods. Trans. GIS 2018, 22, 409–434. [Google Scholar] [CrossRef] [Scilit]
- Ersoy, A. Critical review of the environmental investigation on soil heavy metal contamination. Appl. Ecol. Environ. Res. 2021, 19, 3853–3878. [Google Scholar] [CrossRef] [Scilit]
- Ouabo, R.E.; Sangodoyin, A.Y.; Ogundiran, M.B. Assessment of ordinary Kriging and inverse distance weighting methods for modeling chromium and cadmium soil pollution in E-waste sites in Douala, Cameroon. J. Health Pollut. 2020, 10, 200605. [Google Scholar] [CrossRef] [Scilit] [PubMed]
- Zhang, Y.; Zhang, L.; Lei, Z.; Xiao, F.; Zhou, Y.; Zhao, J.; Qian, X. Analysis of spatial structure and singularity of microbial biogeochemical anomalies in the Taiwan Strait Basin. Front. Mar. Sci. 2024, 11, 1450243. [Google Scholar] [CrossRef] [Scilit]
- Gonçalves, G.H.T. Avaliação Geoambiental de Bacias Contíguas Situadas na Área de Proteção Ambiental Cachoeira das Andorinhas e Floresta Estadual do Uaimii, Ouro Preto-Minas Gerais: Diagnóstico e Percepção Ambiental. Master’s Thesis, Federal University of Ouro Preto, Ouro Preto, Brazil, 2010. Available online: https://www.repositorio.ufop.br/items/219547c6-060e-4a18-9081-009a3f48a4e6 (accessed on 12 December 2025).
- FOREGS. EuroGeoSurveys: Geochemical Baseline Database, Geochemical Atlas of Europe. 2005. Available online: http://weppi.gtk.fi/publ/foregsatlas/ (accessed on 3 March 2026).
- Caritat, P.D. The national geochemical survey of Australia: Review and impact. Geochem. Explor. Environ. Anal. 2022, 22, geochem2022-032. Available online: https://www.lyellcollection.org/doi/full/10.1144/geochem2022-032 (accessed on 27 December 2025). [CrossRef] [Scilit]
- Ferreira, A.; Inácio, M.; Morgado, P.; Batista, M.; Ferreira, L.; Pereira, V.; Pinto, M. Low-density geochemical mapping in Portugal. Appl. Geochem. 2001, 16, 1323–1331. [Google Scholar] [CrossRef] [Scilit]
- Cevik, F.; Goksu, M.Z.L.; Derici, O.B.; Fındık, O. An assessment of metal pollution in surface sediments of Seyhan dam by using enrichment factor, geoaccumulation index and statistical analyses. Environ. Monit. Assess. 2009, 152, 309–317. [Google Scholar] [PubMed]
- Duodu, G.O.; Goonetilleke, A.; Ayoko, G.A. Comparison of pollution indices for the assessment of heavy metal in Brisbane River sediment. Environ. Pollut. 2016, 219, 1077–1091. [Google Scholar] [CrossRef] [Scilit] [PubMed]
- Brady, J.P.; Ayoko, G.A.; Martens, W.N.; Goonetilleke, A. Development of a hybrid pollution index for heavy metals in marine and estuarine sediments. Environ. Monit. Assess. 2015, 187, 306. [Google Scholar] [CrossRef] [Scilit] [PubMed]
- APA Sul RMBH. Projeto Apa Sul RMBH: Estudos do meio físico: Mapas Geoquímicos escala 1:225.000. Belo Horizonte: 2005. Fernanda G. da Cunha, Gilberto J. Machado—Belo Horizonte: SEMAD/CPRM, 2005. 80p, v.7:17 Mapas (Série Programa Informações Básicas Para a Gestão Territorial—GATE). 2005. Available online: https://rigeo.sgb.gov.br/items/6a3d5208-c6c5-4084-8f99-e63cb67451d6/full (accessed on 2 December 2025).
- Silva, D.D.C.; Bellato, C.R.; Marques, J.D.O.; Fontes, M.P. Arsenic and trace metals in water and sediment of the Velhas river, Southeastern Iron Quadrangle region, Minas Gerais, Brazil. Quím. Nova 2018, 41, 1011–1018. [Google Scholar] [CrossRef] [Scilit]
- Paraguassú, L.; Leite, M.G.; Moreira, F.W.; Mendonça, F.P.; Eskinazi-Sant’Anna, E.M. Impacts of mining in artificial lake of Iron Quadrangle-MG: Past marks and changes of the present. Environ. Earth Sci. 2019, 78, 167. [Google Scholar] [CrossRef] [Scilit]
- Gorny, J.; Billon, G.; Noiriel, C.; Dumoulin, D.; Lesven, L.; Madé, B. Chromium behavior in aquatic environments: A review. Environ. Rev. 2016, 24, 503–516. [Google Scholar] [CrossRef] [Scilit]
- Li, Z.; Li, X.; Wang, S.; Che, F.; Zhang, Y.; Yang, P.; Zhang, J.; Liu, Y.; Guo, H.; Fu, Z. Adsorption and desorption of heavy metals at water sediment interface based on bayesian model. J. Environ. Manag. 2023, 329, 117035. [Google Scholar] [CrossRef] [Scilit]
- Carneiro, M.A.; Carvalho Júnior, I.M.; Teixeira, W. Petrologia, geoquímica e geocronologia dos diques máficos do complexo metamórfico Bonfim Setentrional (Quadrilátero Ferrífero) e suas implicações na evolução crustaL do Cráton do São Francisco Meridional. Rev. Bras. Geociências 1998, 28, 29–44. [Google Scholar] [CrossRef] [Scilit]
- Georgaki, M.N.; Charalambous, M.; Kazakis, N.; Talias, M.A.; Georgakis, C.; Papamitsou, T.; Mytiglaki, C. Chromium in water and carcinogenic human health risk. Environments 2023, 10, 33. [Google Scholar] [CrossRef] [Scilit]

Disclaimer/Publisher’s Note: The statements, opinions and data contained in all publications are solely those of the individual author(s) and contributor(s) and not of MDPI and/or the editor(s). MDPI and/or the editor(s) disclaim responsibility for any injury to people or property resulting from any ideas, methods, instructions or products referred to in the content. |
© 2026 by the authors. Licensee MDPI, Basel, Switzerland. This article is an open access article distributed under the terms and conditions of the Creative Commons Attribution (CC BY) license.