


Abstract
Rheumatoid arthritis (RA) management via conventional monotherapy is often limited by poor transdermal flux and suboptimal articular accumulation. This study seeks to bridge a critical gap in monotherapy by engineering chitosan-coated nanobilosomal gel co-encapsulated with thymol and silibinin (CH-TH+SB-BG) in a 3:1 stoichiometric ratio. Compared with monotherapeutics, the CH-TH+SB-BG showed the highest drug content and a sustained drug release profile, accompanied by higher skin permeation and deposition, indicating the fluidizing effect of thymol and the dermal reservoir of silibinin. Interestingly, CH-TH+SB-BG was cytocompatible, owing to its higher IC50 than that of the pure drugs. A marked reduction in the paw volume and arthritic score and significant normalization of hematological, biochemical, and inflammatory biomarkers, compared with the monotherapeutics, indicate the synergistic anti-inflammatory potential of the developed gel. Furthermore, the dual loading effectively reduced oxidative stress, confirmed by a significant decrease in malondialdehyde level along with the restoration of glutathione and superoxide dismutase levels. The Bliss independence model mathematically validated pharmacological synergy. Radiographic and histopathological analysis confirmed the near-complete articular restoration and marked reduction in pannus formation. In conclusion, the developed transdermal gel can be a more effective and safer alternative to long-term oral administration, opening the way for novel topical management of RA.
1. Introduction
Rheumatoid arthritis (RA) is a chronic, systemic autoimmune and inflammatory disease with a global prevalence of 0.5–1%, especially in Western countries. It is characterized by pain, joint swelling, and bone or cartilage destruction, which significantly affect patients’ mobility and quality of life. Beyond the complex pathogenesis, it is believed that RA involves undesirable immune responses (such as protein modifications, gene expression, and environmental factors), collectively producing RA autoantibodies and activating T and B lymphocytes, synoviocytes, neutrophils, and macrophages. Further, the activated cells cause joint inflammation and eventually transform into pannus (tumor-like tissue). Additionally, activated synovial inflammation stimulates vascular endothelial growth factor (VEGF) production, promoting angiogenesis and facilitating the dispersion of inflammatory cells into joints. These inflammatory cells release various pro-inflammatory cytokines (interleukin-6 (IL-6), interleukin-17 (IL-17), interleukin-1β (IL-1β), and tumor necrosis factor-α (TNF-α)), chemokines, and matrix metalloproteinases (MMPs), which contribute to bone and cartilage destruction [1]. Despite the use of various medications (e.g., non-steroidal anti-inflammatory drugs, biological agents, disease-modifying antirheumatic drugs, and glucocorticoids) to manage RA, a complete cure remains elusive. Moreover, controlling its progression and preventing joint and cartilage damage are currently not feasible. Additionally, long-term use of conventional pharmacotherapy to achieve clinical remission is limited due to adverse effects and dose-dependent toxicities [2,3,4]. They are usually administered orally, parenterally, or via intra-articular routes and have certain limitations [1,5,6,7]. Therefore, alternative and supportive treatments, particularly phytomedicine, should be considered for managing RA.
Phytochemicals have been extensively used for the treatment of RA using different nanoformulations, but face limitations as monotherapy owing to their poor aqueous solubility and low bioavailability [8,9,10]. To overcome the monotherapy limitations, the co-delivery approach is a potential alternative to manage RA by simultaneously targeting multiple inflammatory pathways. Various co-delivery-based nanoformulations, such as acelofenac and methotrexate nanoparticles [11], transdermal patches [12], photothermal microneedles of loxoprofen and tofacitinib [13], nanocomposite hydrogel of methotrexate and natural isothiocyanates [14], and an ethosomal gel of cyclosporine and curcumin [15], have been reported for treating RA. Further, the synergistic anti-inflammatory activity of teriflunomide with multiple phytochemicals [16] and nicotine and thymol (TH) [17] has been investigated. Furthermore, various bilosomal gels comprising natural drugs (berberine [18]) and synthetic drugs (flurbiprofen [19], diclofenac [20], fluticasone propionate [21]) have been reported for RA. Nanobilosomal gel is a promising frontier for site-specific drug delivery and relies on the integration of drug-loaded bilosomes (BLs) into a gel matrix [7]. The gel provides a protective microenvironment with preserved molecular integrity, ensuring localized drug action, sustained and controlled drug delivery, minimal adverse effects, biocompatibility, superb physical properties, augmented permeability, and bioavailability with proper lubrication and pain relief [22]. Chitosan (CH) coating of BLs increases their therapeutic efficacy owing to its distinct properties, especially biocompatibility, biodegradability, and the chondro-protective effect [18]. Moreover, CH-modification maintains the integrity of drugs by protecting them from the harsh physiological environment, along with magnified adhesiveness, leading to deep skin penetration [23].
TH is a small phenolic monoterpene with high permeability and low solubility [7]. The anti-inflammatory potential is mediated via the transcriptional attenuation of key pro-inflammatory regulators and modulation of multiple intracellular signaling cascades (Signal Transducer and Activator of Transcription 3 (STAT-3), mitogen-activated protein kinases (MAPK), and nuclear factor-κB (NF-κB)) [24,25], thereby reducing the IL-6 and TNF-α levels. Moreover, it targets cyclooxygenase-2 (COX-2) enzyme and prevents joint destruction by reducing MMP-1 levels and scavenging reactive oxygen species (ROS) [24,26]. Despite its effective pharmacological potential, the clinical application of TH is impeded by a suboptimal biopharmaceutical profile. Specifically, its inherent aqueous solubility and pronounced volatility lead to poor bioavailability. Additionally, significant chemical instability in the gastrointestinal milieu necessitates high-dose regimens, causing dose-dependent toxicities [27,28]. Silibinin (SB), a rigid flavonolignan (BCS class II drug), is extracted from the seeds of Silybum marianum. It is mainly known for its hepatoprotective effect against various chemotherapeutics and toxins owing to its antioxidant and anti-inflammatory activities [29,30,31,32]. The anti-inflammatory activity of SB is attributed to the inhibition of NF-κB pathways, modulation of estrogen receptor β (ER-β), and downregulation of inflammatory microRNA (miR-155), resulting in a reduction in TNF-α and IL-6 levels [33,34,35,36]. The clinical application of SB is severely constrained by its suboptimal biopharmaceutical profile, specifically its hydrophobicity and first-pass metabolism, leading to poor bioavailability [37]. To overcome the aforementioned pharmacokinetic constraints, it is necessary to explore an alternative delivery strategy capable of delivering these phytochemicals safely and conveniently with improved bioavailability.
This study builds upon our prospective parallel study on nanobilosomal gels for the transdermal delivery of TH [7], which exhibited a significant reduction in synovial inflammation but remained insufficient in addressing the concomitant oxidative stress and complete restoration of the ankle joints. To address these multifaceted clinical requirements, the current study transitions from monotherapy to a rationally designed co-delivery system and demonstrates a bimodal therapeutic axis: the TH-mediated suppression of pro-inflammatory biomarkers and SB-induced restoration of the endogenous antioxidant defense system. This study seeks to bridge a critical gap in monotherapy by engineering chitosan-coated BLs co-encapsulated with TH and SB (CH-TH+SB-BLs) at a literature-validated 3:1 stoichiometric ratio. Rather than re-screening known pharmacological ratios, the present study focuses purely on engineering a novel nanobilosomal gel platform to co-deliver this specific therapeutic payload across the stratum corneum. By incorporating these co-loaded BLs into carbopol 940 gel base (1% w/w), the resulting nanobilosomal gel (CH-TH+SB-BG) is designed to overcome the intrinsic biopharmaceutical limitations of the individual phytochemicals. Further, the anti-inflammatory and antioxidant potential of the developed gel was systematically evaluated in the Freund’s Complete Adjuvant (FCA)-induced arthritic model using Wistar rats. This integrated approach aims to minimize systemic toxicities while simultaneously facilitating magnified transdermal flux and sustained therapeutic efficacy at the target site.
2. Materials and Methods
2.1. Materials
TH, SB, cholesterol, soya lecithin (SL), carbopol 940, sodium deoxycholate (SDC), methanol, chloroform, CH (MW: 150,000), FCA, Span 60, and Tween 80 were procured from Sigma-Aldrich, Bangalore, India. RAW 264.7 cell lines were purchased from the National Centre for Cell Science, Pune, Maharashtra, India. Enzyme-linked immunoassay (ELISA) kits for IL-6 and TNF-α were purchased from Ray Biotech Labs, Norcross, GA, USA. GraphPad Prism software, version 8.0.1 (GraphPad Software, San Diego, CA, USA).
2.2. Development of Monotherapeutic and Synergistic Bilosomes
The monotherapeutic and synergistic BLs were developed by using an optimized thin film hydration method, utilizing the identical parallel processing parameters established for CH-TH-BLs with 100 mg of TH, as reported in our parallel baseline study [7]. To ensure a robust comparative analysis, new monotherapy CH-SB-BLs were also prepared using 100 mg of SB. The synergistic CH-TH+SB-BLs were prepared with a slight modification in the drug stoichiometric ratio. Briefly, weighed quantities of drugs (a total of 100 mg of TH and SB in a 3:1 stoichiometric ratio), cholesterol (20 mg), SL (3% w/v), and Span 60: Tween 80 (1:1) were dissolved in 40 mL of binary solvent (chloroform: methanol (2:1)) to ensure homogeneity. Under reduced pressure and controlled temperature conditions (50 ± 5 °C), the organic phase was placed into a round-bottom flask (RBF) and subjected to rotary evaporation (30 min @ 90 rpm) utilizing a rotary evaporator (Physilab rotary vacuum film evaporator, Ambala, India), yielding a lipid film on the RBF periphery. This lipidic architecture was subjected to vacuum desiccation for 24 h to evaporate residual organic solvents, followed by rehydration with 10 mL of phosphate buffer saline (PBS, pH 7.4) containing 20.84 mg of SDC for 1 h. The resulting multilamellar vesicles were further refined through a probe sonicator for 4 min at 30% amplitude (Sartorius, Labsonic@ P, Singapore) in an ice bath to achieve small unilamellar vesicles. The final CH coating was achieved by the dropwise addition of 2 mL of CH solution (0.265% w/v CH in glacial acetic acid) to the dispersion under constant magnetic stirring at room temperature [18,38]. The developed formulation was further lyophilized and subsequently maintained at 4 °C for further analysis [39,40].
2.3. Physicochemical and Structural Characterization
A comparative study was performed to assess the impact of single therapeutic loading and dual therapeutic loading on the BL architecture. Data are expressed as the mean value ± SEM, derived from three independent experimental runs.
2.3.1. Vesicular Size, Zeta Potential, and Polydispersity Index
The vesicular size, zeta potential, and polydispersity index (PDI) were analyzed by differential light scattering using Malvern Nano-ZetaSizer (Malvern Instrument Ltd., Malvern, UK) at 25 °C [7].
2.3.2. Entrapment Efficiency
The entrapment efficiency (EE) was evaluated by measuring the free drug concentration in the BL dispersion using Equation (1) and compared with the monotherapeutic control. Briefly, 1 mL of the synergistic BLs was centrifuged at 4 °C for 2 h at 10,000 rpm using a cooling centrifuge (Sartorius-SIGMA 3–18 K, Osterode am Harz, Germany); the supernatant was separated, diluted with 30% v/v ethanolic PBS (pH 7.4) and analyzed spectrophotometrically using a UV-Visible spectrophotometer (Shimadzu 2202, Kyoto, Japan) at wavelengths of 274 nm [41] and 288 nm [42] for TH and SB, respectively. For the simultaneous quantification of TH and SB in the synergistic formulation, the Vierordt method was validated according to the ICH Q2 (R1) guideline (Supplementary Method). Equations (2) and (3) were used for the simultaneous estimation of TH and SB concentrations due to the overlapping absorption spectra of both drugs [43,44].
T: total amount of drug added in the formulation.
F: free drug concentration in the supernatant after centrifugation.
where A1 and A2: absorbances of the mixture at λ1 and λ2, ax1 and ax2: absorptivities of TH at λ1 and λ2, ay1 and ay2: absorptivities of SB at λ1 and λ2, and CTH and CSB: concentration of TH and SB, respectively.
2.3.3. Surface Morphology
The morphological integrity of CH-TH+SB-BLs and CH-SB-BLs was examined using a transmission electron microscope (TEM, Thermo Scientific Talos L120C G2 (S), Thermo Fisher Scientific, Waltham, MA, USA). The operating parameters were maintained consistent with the concurrent experimental protocol [7].
2.3.4. Solid-State Characterization
Solid-state characterization using FTIR spectroscopy (Bruker, alpha-II, Ettlingen, Germany) between 400 and 4000 cm−1 and differential scanning calorimetry (Shimadzu, DSC-60 Plus, Kyoto, Japan) was performed to evaluate the molecular interaction between the drug and BL excipients [7].
2.4. Preparation of Monotherapeutic and Synergistic Nanobilosomal Gel
The new monotherapeutic (CH-SB-BG) and synergistic nanobilosomal gel (CH-TH+SB-BG) were prepared concurrently under the identical parallel manufacturing protocol utilized for CH-TH-BG [7], with minor modifications. Briefly, 1% w/w carbopol was hydrated for 24 h, then continuously stirred for 3–4 h, after which 0.10% methylparaben and 5% w/w propylene glycol were added. Further, 147 mg of CH-TH+SB-BLs were reconstituted in a small amount of PBS (pH 7.4) to prevent lump formation and gradually dispersed into the 853 mg of gel base under magnetic stirring (@800 rpm to prepare the nanobilosomal gel containing an equivalent 1% w/w of TH and SB in a 3:1 ratio. The resultant gel was neutralized by dropwise addition of tri-ethanolamine to adjust the pH (5.6 ± 0.2) [41]. For comparative analysis, a conventional TH+SBgel and a non-coated nanobilosomal gel (TH+SB-BG) were also prepared using the same drug concentration and the same procedure. The prepared gels were maintained at 4 °C for further analysis.
2.5. Physicochemical Characterization of Nanobilosomal Gel
The physicochemical attributes of the synergistic nanobilosomal gel were characterized in direct comparison with the monotherapies (CH-TH-BG and CH-SB-BG) to recognize the effect of co-loaded BLs on the gel matrix. The developed gel was characterized for viscosity, pH, and spreadability using a Brookfield viscometer, a pH meter, and the parallel plate method, respectively [7]. The drug content was assessed by dissolving the gel (1 g) in ethanol (20 mL) using a magnetic stirrer @1000 rpm for 30 min. The resulting mixture was subjected to a probe sonicator in an ice bath for 4 min at 60% amplitude to break the BLs following centrifugation (6000 rpm) for 20 min. The supernatant was further spectrophotometrically analyzed using a UV-Visible spectrophotometer at 274 nm and 288 nm to determine the TH and SB concentration, respectively [41]. Data are expressed as the mean value ± SEM, derived from three independent experimental runs.
2.6. In Vitro Drug Release Study
The in vitro release of the drug from all the formulations was determined using a Franz diffusion cell equipped with a pre-treated dialysis membrane (MWCO: 12,000–14,000 Da, surface area: 3.14 cm2). The developed gel (equivalent to 1% w/w of the total drug) was placed in the donor compartment, and 35 mL of 30% v/v ethanolic PBS (pH 7.4) was placed in the receptor compartment to maintain sink conditions. The samples were kept at 32 ± 0.5 °C at 50 rpm using a shaking water bath, and aliquots (1 mL) were withdrawn at various intervals (0.5, 1, 2, 4, 8, 12, and 24 h) and replenished with fresh ethanolic PBS to maintain sink conditions [38]. The simultaneous concentration of TH and SB was determined by validated Vierordt’s method using a UV-Visible spectrometer with a detection wavelength of 274 nm [41] and 288 nm [42], respectively. Data are expressed as the mean value ± SEM, derived from three independent experimental runs. Further, the in vitro release data were mathematically fitted to various release kinetics models, and the best fit model was selected by the highest regression coefficient (R2).
2.7. Ex Vivo Permeation and Skin Retention Studies
Ex vivo studies were conducted using a standardized vertical diffusion model to assess the comparative skin permeation and skin retention of synergistic nanobilosomal gels against conventional TH+SB-gel, TH+SB-BG, and monotherapies, executed concurrently within the same synchronized experimental timeline reported for CH-TH-BG [7].
2.7.1. Preparation of the Integumentary Membrane
The dorsal skin of Wistar rats (200–250 g) was harvested following Institutional Animal Ethical Committee (IAEC) approval (BBDNIIT/IAEC/Aug/2025/06), after which hair was removed. Further, the subcutaneous fat and tissues were scraped, cut into circular pieces, cleaned with normal saline, and air-dried [7].
2.7.2. Vertical Diffusion Assembly, Sampling, and Analytical Benchmarking
The rat skin was placed in a Franz diffusion cell with an effective diffusion area of 3.14 cm2, with the epidermis facing the donor and the dermis facing the receptor compartment. The receptor compartment was charged with 35 mL of 30% v/v ethanolic PBS (pH 7.4) to facilitate sink conditions. The assembly was maintained at 32 ± 0.5 °C and 100 rpm using a shaking water bath to prevent the formation of a stagnant diffusion layer at the membrane-receptor interface. Further, the donor compartment was loaded with 1 g of each gel (equivalent to 1% w/w of the drug), and aliquots (1 mL) were withdrawn at various intervals (0, 1, 2, 3, 4, 6, 8, and 12 h) and replenished with fresh ethanolic PBS. The samples were filtered through a membrane filter (0.25 µm), and the simultaneous concentration of TH and SB was estimated by Vierordt’s method using a UV-Visible spectrometer [7,41,43].
2.7.3. Skin Retention Study
Upon completion of the 12 h permeation study, the exposed rat skin was removed from the assembly, and the skin sample (~100 mg) was thoroughly washed with PBS (pH 7.4) to remove any surface-adherent formulation and gently patted dry. The skin tissue was minced into small pieces, followed by homogenization (@10,000 rpm, 5 min) in 1 mL cold PBS (pH 7.4) while maintaining temperature (using an ice bath) to prevent thermal degradation. For protein denaturation, methanol was added, followed by vortexing of the skin tissue homogenate. The resulting mixture was centrifuged at 11.180× g for 15 min at 4 °C, and the uppermost clear aqueous-methanol layer was collected and filtered through a membrane filter (0.25 µm). The filtrate was subsequently further UV analyzed using validated Vierordt’s method at the respective wavelengths of drugs using a blank (matrix-matched blank prepared by an untreated, drug-free skin homogenate [41,43].
2.7.4. Data Analysis and Calculations
The data were analyzed and processed using Equations (4)–(6) to quantify the permeation flux (Jss), enhancement ratio (ER), and skin retention ratio (SRR) provided by the co-loading approach relative to the conventional TH+SB gel as a control [7].
2.8. Cell Viability Assay
The cytotoxicity of all the nanobilosomal gels was assessed using the methyl thiazolyl tetrazolium (MTT) assay with RAW 264.7 cells [25]. Briefly, the cell lines were cultured in 96-well plates for 24 h in Dulbecco’s Modified Eagle Medium (DMEM-AT149-1L-HIMEDIA) and supplemented with 10% Fetal Bovine Serum (FBS-HIMEDIA-RM 10432) and 1% solution of penicillin/streptomycin (Sigma-Aldrich P0781) at 37 °C with 5% CO2. Subsequently, the cell lines were incubated with the test samples in DMEM at varying concentrations (0–1000 µg/mL) for 24 h, then incubated with MTT solution (5 mg/mL) for 2 h. Further, the culture supernatant was removed, and the formed formazan crystals were dissolved in 100 µL of dimethyl sulfoxide. The absorbance of the resulting solution was measured at 540 nm using an ELISA microplate reader (iMark, Bio-Rad, Hercules, CA, USA), and % cell viability and IC50 were determined using Equation (7) and GraphPad Prism (version 8.0.1), respectively. Data are expressed as the mean value ± SEM, derived from three independent experimental runs.
2.9. In Vivo Studies
The experimental design was duly approved by IAEC (approval no. BBDNIIT/IAEC/Aug/2025/06). Healthy Wistar rats (200–250 g) were housed and acclimatized in a controlled environment (25 ± 2 °C/55 ± 5% RH) with a 12-h light/dark cycle and provided ad libitum access to a standardized diet and water. In compliance with the ARRIVE Essential 10 criteria, the individual animal was designated as the discrete experimental unit for all treatment allocations, monitoring, and statistical analyses (n = 5 rats/group). All experimental procedures were executed concurrently for all testing groups within the same synchronized project timeline [7]. Inclusion and exclusion criteria for all experimental units were defined a priori. Rats were included based on uniform weight (200–250 g) and successful FCA-induced paw inflammation. Pre-established exclusion benchmarks were set for animal health degradation or structural collection errors. No animals or data points were excluded from any cohort during the experiments or final statistical modeling; the full allocation of n = 5 per group was completely analyzed across all parallel test arms.
2.9.1. Skin Irritation Study
The biocompatibility and dermal safety of the developed gels were evaluated by a skin irritation study using Wistar rats. Approximately 24 h before the initiation of the study, the dorsal area of rats (6 cm2) was shaved, and rats were randomly allocated into 4 groups (n = 5). Group 1 was treated with 1% w/w carbopol gel (vehicle control), group 2 with CH-TH-BG, group 3 with CH-SB-BG, and group 4 with CH-TH+SB-BG. A standardized dose of 500 mg of the respective nanobilosomal gels was topically applied to the shaved area. Following a continuous 24 h exposure window, the treated animals were visually examined for signs of erythema and edema at specific post intervals of 4, 24, 48, and 72 h. The dermal alterations were quantified by a single investigator using the standardized Draize scoring criteria presented in Supplementary Table S1, and the cumulative scores were subsequently used to calculate the Primary Dermal Irritation Index (PDII) to establish the safety threshold. Further, photographs of treated dorsal sites were captured at 4 h and 72 h post-application [45].
2.9.2. Establishment of the FCA-Induced Rat Arthritic Model
The antiarthritic potential of synergistic nanobilosomal gel was assessed in the FCA-induced Rat arthritic model against the monotherapies and the marketed Voltaren emulgel (1% w/w diclofenac). On Day 0, arthritis was induced via the injection of FCA (0.1 mL) into the subplantar tissue of the right hind paw, except for the vehicle control group. The animals were monitored throughout a 27-day study period for primary and systemic inflammation.
2.9.3. Experimental Design and Therapeutic Regimen
An a priori sample size calculation was performed based on effect sizes extracted from our synchronized benchmark study [7]. Except for group 1 (n = 5), the remaining 25 animals were randomly allocated to the arthritic control and treatment groups (n = 5) following confirmation of arthritis induction on Day 8. Group 1 was treated with 1% w/w carbopol gel (vehicle control), group 2 did not receive any treatment (arthritic control), group 3 was treated with the marketed formulation (standard control), group 4 with the synchronized parallel benchmark monotherapy (CH-TH-BG) reported in Ref. [7], group 5 with the new monotherapy (CH-SB-BG), and group 6 with the synergistic formulation (CH-TH+SB-BG). The animal dosing protocol was executed in strict alignment with the peer-reviewed parameters established in our previous work, operating within a synchronized experimental timeline to ensure direct comparability across all parallel treatment arms. A standardized dose of 500 mg of the respective nanobilosomal gels (equivalent to 1% w/w drug) was topically applied to the inflamed paw (application surface area: 2 cm2) once daily and gently massaged to facilitate penetration [7]. Given the current 3:1 ratio of TH and SB, this fixed dose delivered a weight-normalized applied target of 20 mg/kg (15 mg/kg TH and 5 mg/kg SB) based on a 250 g average body weight of the experimental animals.
2.9.4. Assessment of Arthritic Score and Paw Volume
The severity of RA was assessed by calculating the arthritic score in FCA-induced animals. The right hind paws of all animals were visually examined for arthritic signs, including redness, swelling, and erythema, every 7th day between Days 0 and 28. Grade 0 was adopted for a normal paw; grades 1, 2, and 3 were adopted for mild, moderate, and severe swelling and erythema, respectively. Grade 4 was adopted for gross deformity and inability to use the limb [46]. Paw volume of each group was measured every 7th day using a mercury-based plethysmometer [7].
2.9.5. Hematological and Biochemical Parameters Assessment
Upon completion of the study (i.e., on the 28th day), the rats were anesthetized, and blood samples were collected via cardiac puncture into two separate tubes: EDTA-containing tubes for hematological profiling and non-heparinized tubes for serum separation [47]. Serum was separated by centrifugation (3000 rpm/10 min) of blood samples at 4 °C, and supernatant was collected and stored at −20 °C [7]. Hematological parameters, including erythrocyte sedimentation rate (ESR) and platelet counts, were quantified using a Westergren tube (300 mm long, 2.5 mm internal diameter; AQRA, Maharashtra, India) and Rohem Silverline Neubauer Counting Chamber, respectively. Biochemical markers, including C-reactive protein (CRP) and rheumatoid factor (RF), were quantified by commercially available diagnostic kits [47].
2.9.6. Oxidative Stress and Serum Inflammatory Biomarkers Assessment
Oxidative stress was assessed by lipid peroxidation assay by determining malondialdehyde (MDA) levels using the Thiobarbituric Acid (TBA) test [48]. Furthermore, the restoration of the endogenous antioxidant defense system was confirmed by quantifying glutathione (GSH) and superoxide dismutase (SOD) levels following established GSH assay and SOD assay, respectively [47]. The oxidative marker levels were quantified using Sigma-Aldrich (India) assay kits, strictly adhering to the prescribed instructions. Similarly, serum levels of IL-6 and TNF-α were determined via Raybiotech (USA) ELISA kits following the manufacturer’s specifications [7].
2.9.7. Synergistic Effect Analysis
The synergistic effect of CH-TH+SB-BG was analyzed by calculating the co-delivery index (CDI) based on an effect-based approach using the Bliss independence model [49,50]. The Bliss independence model is widely used to determine the interaction between two drugs (A and B), assuming that there is no interaction between TH and SB in a co-loaded formulation. The calculation of the expected therapeutic combined effect (Expected ECH-TH+SB-BG) is based on the individual observed effect of CH-TH-BG (ECH-TH-BG) and CH-SB-BG (ECH-SB-BG) and expressed in % inhibition. The expected combined effect is calculated by Expected ECH-TH+SB-BG = ECH-TH-BG+ECH-SB-BG (1-ECH-TH-BG). In this study, the CDIBliss was calculated (Equation (8)) based on reductions in the levels of ESR, platelets, CRP, RF, MDA, TNF-α, and IL-6. CDIBliss values less than 1, equal to 1, and greater than 1 indicate synergistic, additive, and antagonistic effects, respectively [49,50].
2.9.8. Radiological and Histopathological Analysis
Upon completion of the study (i.e., on the 28th day), the rats were anesthetized, and radiographic screening was performed using an X-ray machine (RMS MDS 300) to evaluate joint architectural integrity [46]. For histopathological analysis, the animals were sacrificed, and the excised joints of the ankle were fixed in 10% formalin solution to be further embedded in paraffin blocks. 5 µm tissue sections were stained with hematoxylin and eosin and examined under an optical microscope at 100× [7].
2.10. Stability Studies
The storage stability of monotherapies and synergistic nanobilosomal gel was evaluated for long-term accelerated stability studies as per International Conference on Harmonization (ICH) guidelines. Briefly, 10 g of each nanobilosomal gel was sealed in a glass container and placed in a stability chamber (Newtronics Limited, New Delhi, India) at 25 ± 2 °C/60 ± 5% RH for 6 months. The gel samples were stored for 6 months and assessed for physical appearance, viscosity, pH, and drug content. All the measurements were performed in triplicate [7].
2.11. Statistical Analysis
Statistical evaluations were conducted using GraphPad Prism (v8.0.1), applying one-way ANOVA for cytotoxicity and two-way ANOVA for in vivo studies, followed by Tukey’s post hoc test (p < 0.05). Data are expressed as the mean value ± SEM, derived from three independent experimental runs.
3. Results and Discussion
3.1. Physicochemical Characterization of Monotherapeutic and Synergistic Bilosomes
Monotherapeutic CH-SB-BLs and synergistic CH-TH+SB-BLs were prepared by using our established protocol for CH-TH-BLs [7]. For CH-TH+SB-BLs, the drug concentration ratio of TH and SB (3:1) was selected based on the published literature [25] without independent formulation level optimization. To preserve uniform thermodynamic properties and matrix integrity across all the formulations, the total drug payload was fixed at 100 mg. Consequently, while the monotherapeutics contained 100 mg of an individual drug, the synergistic formulation comprised 75 mg of TH and 25 mg of SB. The concentration of TH and SB was estimated by a validated UV spectrophotometric method using Vierordt’s simultaneous equations as per ICH Q2 (R1) guidelines to ensure its suitability for the quality control of TH and SB within a synergistic CH-TH+SB-BG (Supplementary Results).
The physicochemical attributes of synergistic CH-TH+SB-BLs were analyzed against monotherapies (Table 1, Supplementary Figure S1). The synergistic CH-TH+SB-BLs exhibited a larger vesicle size (166.8 ± 1.6 nm), lower zeta potential (32.3 ± 1.09 mV), and higher EE (91 ± 1.87%) than the previously reported CH-TH-BLs [7] and CH-SB-BLs. The relatively larger vesicle size may be due to the different molecular weights of TH (150.22 g/mol) and SB (482.44 g/mol), enabling molecular interaction. TH is a relatively small and highly lipophilic molecule and can easily interact with the SL bilayer [51], leading to fluidization of the phospholipid bilayer, resulting in expansion of the bilayer and a larger surface area of the co-loaded formulation [52]. The reduced zeta potential may be due to the hydrogen bonding between the drugs’ hydroxyl groups and the CH amine group, masking the surface charge [53]. Higher encapsulation efficiency of CH-TH+SB-BLs was correlated with the larger vesicle size, cosolvent, and fluidizing effect of TH. Due to the fluidization effect, TH increases the lipophilicity of the lipid core, facilitating deep incorporation of SB [51]. This space-filling mechanism decreased the displacement of drugs and stabilized the formulation, resulting in a high drug payload. The lower EE and higher zeta potential than the previously reported CH-TH-BLs and synergistic CH-TH+SB-BLs may be due to the relatively large molecular size and rigid polyphenolic core of SB, which induces deeper incorporation into the lipid core compared to the smaller and more mobile TH molecule and less interference with the CH layer [37]. The PDI of CH-TH-BLs and CH-TH+SB-BLs was <0.3, while CH-SB-BLs exhibited slightly higher PDI (0.360 ± 0.024) above the threshold typical for intravenous administration (<0.3); this remains completely acceptable within the acceptable threshold for skin delivery (0.5) [54].
Table 1.
Comparative physicochemical characterization of synergistic bilosomes against monotherapies.
Comparative TEM imaging was used to confirm that dual loading of TH and SB preserved the surface morphology established in our previous study (CH-TH-BLs) [7], ensuring the carrier’s ability to traverse skin without any structural deformation. TEM images confirmed that the BLs maintained a uniform surface devoid of aggregation, necessary for transdermal delivery (Figure 1). The CH-TH-BLs exhibited a standard layer of CH coating, whereas the CH-TH+SB-BLs displayed a distinct layer of CH coating with a dark core, confirming that the 3:1 stoichiometric ratio of drug maintains the surface morphology of the synergistic formulation.
Figure 1.
Comparative TEM images of nanobilosomes: (a) Parallel benchmark CH-TH-BLs, synthesized concurrently and previously reported in Ref. [7], MDPI (2026); (b) Newly developed monotherapy CH-SB-BLs; (c) Synergistic CH-TH+SB-BLs.
3.2. Solid-State Characterization
FTIR and DSC confirm that the drug was successfully incorporated into the formulation and not physically mixed. In our previous study, FTIR spectra (Supplementary Figure S2) and DSC thermogram (Supplementary Figure S3) were obtained for TH, all BL excipients, physical mixture, and lyophilized CH-TH-BLs, and the results confirmed the successful entrapment of the drug within the formulation [7]. Therefore, in this study, only drugs (TH and SB), CH, the physical mixture of drugs with the excipients, and newly developed formulations (CH-SB-BLs and CH-TH+SB-BLs) have been characterized for FTIR and DSC. For CH-SB-BLs, the FTIR spectra revealed that there was no chemical interaction between the drug and excipients (Supplementary Figure S4), and SB was uniformly dispersed in the BL matrix, indicated by the complete disappearance of its endothermic peak in the DSC thermogram (Supplementary Figure S5).
Figure 2 displays the FTIR spectra of TH, SB, physical mixture, CH, and CH-TH+SB-BLs. The vibrational characteristics of TH included a phenolic-OH stretch appearing as a wide absorption band at 3239 cm−1. The aliphatic region was presented by a C-H stretch (2958 cm−1) and a bending (1422 cm−1), while benzene skeletal vibrations were identified at 1621 cm−1 [7]. FTIR spectra of SB exhibited a characteristic peak at 3455 cm−1 corresponding to phenolic O-H stretching, sharp peaks at 1637 cm−1 corresponding to C=O stretching, and 1510 cm−1 and 1468 cm−1 corresponding to C-C bond vibration of the aromatic ring [55]. CH exhibited a broad peak at 3356 cm−1 for OH stretching, a sharp peak at 2863 cm−1 for NH stretching, a small sharp peak at 1583 cm−1 for C-H stretching, and a long sharp peak at 1025 cm−1 for C-O-C stretching [7]. The physical mixture spectra displayed a wide peak at 3350 cm−1, and multiple distinct peaks at 2924 cm−1, 1617 cm−1, 1454 cm−1, 1290 cm−1, 1087 cm−1, 805 cm−1, confirming no chemical interaction between the drugs and excipients [41]. The synergistic CH-TH+SB-BLs spectra provided critical insights into the intermolecular interactions between the BL matrix and drugs. The characteristic alkyl C-H stretching of TH (2923 cm−1) and the C=O stretching of SB (1646 cm−1) were retained in the developed CH-TH+SB-BLs, confirming that both the drugs were chemically intact. However, a broad peak at 3372 cm−1 was observed, suggesting intermolecular hydrogen bonding established between drug molecule and the BL matrix. This interaction can stabilize the drugs within the BL matrix and prevent premature leakage, in line with the high EE of the developed formulation.
Figure 2.
FTIR spectra of drugs, excipients, and synergistic bilosomes: (a) thymol; (b) silibinin; (c) chitosan; (d) physical mixture; and (e) CH-TH+SB-BLs. Spectra a and c represent parallel benchmark parameters from the synchronized experimental timeline, previously reported in Ref. [7], MDPI (2026), for comparative analysis.
DSC assesses the thermal behavior of the drug and its physical state within the carrier. A sharp peak presents purity, a shifted or broad peak presents chemical interaction or impurity, new peak formation signifies a new eutectic substance formation, and peak disappearance indicates transformation from a crystalline to an amorphous state [7]. Figure 3 displays the thermogram of both drugs, physical mixture, CH, and synergistic CH-TH+SB-BLs. SB and TH showed a sharp endothermic peak at 170.26 °C (ΔH: −117.60 J/g) [56] and 53.81 °C (ΔH: −174.70 J/g) [41], respectively, presenting their melting point and confirming their purity. CH exhibited similar peaks to those established in our previous study (CH-TH-BLs) [7]. The structural integrity and chemical compatibility of the components were confirmed by the persistence of the original endothermic peaks for both drugs (169.16 °C and 54.48 °C) within the physical mixture. The synergistic CH-TH+SB-BLs thermogram showed the disappearance of the drugs’ characteristic peaks, suggesting transformation of their crystalline to amorphous state, confirming successful entrapment of the drugs into the formulation. This amorphous state is favorable for enhanced drug dissolution and skin permeation [39].
Figure 3.
DSC thermogram of drugs, excipients, and developed bilosomes. The thermograms of TH and CH represent parallel benchmark parameters from the synchronized experimental timeline, previously reported in Ref. [7] (MDPI, 2026), for direct comparative analysis.
3.3. Preparation and Physicochemical Characterization of Nanobilosomal Gel
The monotherapeutic and synergistic nanobilosomal gels were prepared by incorporating the slurry of reconstituted lyophilized BLs in PBS (pH 7.4) to avoid lump formation. In this study, lyophilized BLs were incorporated instead of dispersion due to their increased stability and uniform dispersion. The developed nanobilosomal gels exhibited a smooth and glossy appearance, matching the previously reported CH-TH-BG [7]. Table 2 presents the characterization parameters of the nanobilosomal gels.
Table 2.
Comparative analysis of different characterization parameters of the nanobilosomal gels.
The rheological results revealed that the synergistic nanobilosomal gels exhibited pseudoplastic behavior (Supplementary Figure S6), matching the parallel benchmark parameters of the monotherapy groups evaluated concurrently within the synchronized study timeline [7]. The viscosity of CH-TH+SB-BG was higher (63,200 ± 1017 cps) than the monotherapies (CH-SB-BG: 61,500 ± 1000 cps; CH-TH-BG: 60,000 ± 1020 cps). The higher viscosity of the synergistic nanobilosomal gel may be due to the high drug content and rigid nature of SB. Rigid particles cannot deform to slide past one another during flow, hence exhibit higher viscosity than flexible formulations [37]. Both CH-SB-BG and CH-TH+SB-BG exhibited nearly identical pH values, aligning closely with the human skin (4.5–6.5) [7]. Spreadability is an important parameter for the successful application of a topical formulation. A too-thick gel can not be easily spread, but a gel with optimal viscosity can be easily spread using finger pressure while staying in place afterwards [40]. The results revealed that the spreadability of all the formulations was in the optimum range (5–7 cm), ensuring their localization at the inflammation site for a prolonged time, facilitating deeper skin penetration [41]. The drug content of CH-TH+SB-BG and CH-SB-BG was almost the same, but CH-TH-BG showed a slightly lower drug content, which may be due to the volatile nature of TH [37,57].
3.4. In Vitro Drug Release
The cumulative drug concentrations of TH and SB were measured by the validated Vierordt’s method using a UV-Visible spectrometer at their respective wavelengths. To explain the role of the BL structure, CH coating on the drug release profile, and the effect of drug co-loading, the synergistic nanobilosomal gels were evaluated against conventional TH+SB-gel, TH+SB-BG, and monotherapies (Figure 4). Figure 4a,b presents the cumulative release of individual TH and SB from all the formulations up to 24 h. The conventional TH+SB-gel exhibited a rapid burst-release profile, with approximately 94.20 ± 1.8% TH and 90.75 ± 1.6% of SB diffusing into the receptor medium within 8 h. This rapid release was due to the direct diffusion of drug molecules through the porous carbopol 940 polymeric network without any resistance. In contrast, TH+SB-BG exhibited a slower release than conventional TH+SB-gel but faster release than CH-TH+SB-BG. This intermediate release profile confirmed that the BL lipidic bilayers act as a physical barrier, modulating the drug diffusion from the BL core.
Figure 4.
Comparative in vitro drug release profile of TH and SB from different formulations: (a) cumulative release of TH from all the formulations, and (b) cumulative release of SB from all the formulations. Data for CH-TH-BG represent parallel benchmark parameters from the synchronized experimental timeline, previously reported in Ref. [7], for direct comparison with the newly developed monotherapy (CH-SB-BG) and synergistic formulation (CH-TH+SB-BG).
The surface coating of CH further regulated the drug release profile of CH-coated nanobilosomal gels. Therefore, the synergistic CH-TH+SB-BG and monotherapies demonstrated a characteristic biphasic release profile, beginning with a rapid burst during the first 8 h and transitioning to sustained release over 24. The initial burst-release effect is attributed to the presence of surfactants and SDC, which decrease interfacial tension and increase BL fluidity, resulting in enhanced drug dissolution. The sustained-release profile was due to diffusion of the drug from the CH-carbopol complex [7]. The slowest release was observed in the synergistic CH-TH+SB-BG, which achieved faster release of TH (40.69 ± 1.3%) and slower and sustained release of SB (28.43 ± 1.1%) up to 24. The faster release of TH was due to its smaller size and fluidizing effect [51], and the slower release of SB may be due to its larger size and higher affinity for the lipid core of BLs [37]. The slowest release of CH-TH+SB-BG was due to magnified hydrophobic packing density within the BL bilayers and intermolecular hydrogen bonding established between the drug molecule and BL matrix, as evidenced by FTIR. This controlled release is advantageous for managing RA, as it maintains a steady state drug concentration at the target site with minimal toxicity. Interestingly, CH-SB-BG exhibited slower drug release (55.21 ± 1.78%) than the previously reported CH-TH-BG (74.89 ± 1.60%) [7]. The slower release of CH-SB-BG was attributed to its large size and higher affinity for the lipid core, in contrast to the smaller and more mobile TH molecule [37]. Further, the release data were mathematically evaluated by different kinetic models, and the model was selected based on the highest R2 values (Supplementary Table S2). The results revealed that the conventional TH+SB-gel followed a first-order model, indicating concentration gradient diffusion, whereas TH+SB-BG followed the Higuchi model, confirming diffusion-controlled release of drug. All CH-coated nanobilosomal gels followed the Korsemeyer–Peppas model with a non-Fickian release exponent. In conclusion, the CH-TH+SB-BG will be beneficial for managing RA through the initial controlled release of TH, providing relief from pain and oxidative stress and fluidizing the skin’s lipid membrane, which facilitates the sustained release of SB through the skin barrier, ensuring its magnified anti-inflammatory effect.
3.5. Ex Vivo Studies
Ex vivo studies are the most critical parameter for an antiarthritic gel because they measure the actual drug concentration that crosses the stratum corneum and reaches the underlying inflamed tissues. To evaluate the transdermal transport mechanism and tissue localization, ex vivo skin permeation and retention data for the synergistic nanobilosomal gel were compared with conventional TH+SB-gel, TH+SB-BG, and monotherapies (Table 3). The conventional TH+SB-gel exhibited restricted transdermal parameters characterized by the lowest skin permeation (21.23 ± 0.19% (TH) and 8.48 ± 0.14% (SB)) and skin retention (17.45 ± 1.89% (TH) and 9.82 ± 0.78 (SB)). The poor transdermal parameters confirm that uncapsulated drugs cannot effectively cross the stratum corneum when confined within a hydrophilic polymer matrix. Conversely, the TH+SB-BG exhibited enhanced transdermal permeation with the highest ER of 9.12 and 5.32 for TH and SB, respectively. This significant increase confirms that bile salts can ameliorate the flexibility of the stratum corneum via the fluidization of skin lipids, leading to enhanced permeation [7]. However, TH+SB-BG achieved a relatively low SRR for TH (1.74) and SB (1.98), confirming that the flexible formulation traverses rapidly through the dermis and reaches the systemic drainage directly rather than skin localization.
Table 3.
Comparative evaluation of skin permeation and skin retention parameters of synergistic nanobilosomal gel against conventional TH+SB-gel, TH+SB-BG, and monotherapies.
The CH surface coating resolved this transdermal imbalance due to the electrostatic bioadhesion between the cationic CH and anionic skin lipids [58]. For the monotherapies (CH-TH-BG and CH-SB-BG) and synergistic CH-TH+SB-BG, transdermal permeation parameters were moderated to steady and controlled rates with maximum skin retention. The skin retention of TH and SB from the CH-TH+SB-BG reached a remarkable 52.54 ± 1.22% and 41.78 ± 1.56%, respectively, with enhanced SRR of 3.01 and 4.25 for TH and SB, respectively, over the conventional TH+SB-gel baseline. Moreover, the CH-TH+SB-BG exhibited ~1.72-fold (TH) and 2.14-fold (SB) higher SRR compared to the TH+SB-BG. This tissue localization highlights the structural role of the CH coating, which decreases immediate systemic drainage, enabling an intradermal drug depot [59]. Notably, the individual SRR of TH and SB within the CH-TH+SB-BG was not significantly different from their respective monotherapies, suggesting that the co-loading of TH and SB in a ratio of 3:1 does not compromise the tissue-retention behavior of either phytochemical without any competitive transport inhibition between them. Consequently, the synergistic CH-TH+SB-BG is therapeutically superior to monotherapies due to the fluidity–rigidity balance of the synergistic formulation. Briefly, TH fluidizes the BL lipid bilayer, enabling a reduction in interfacial tension and increasing the BL membrane deformability, allowing them to cross the stratum corneum [51]. Conversely, SB is a rigid molecule and forms stiffer and more stable vesicles, preventing premature drug leakage and carrying the formulation deeper into the dermal layer [37]. However, the stiffer vesicle alone can not easily adapt its shape to cross the skin barrier, evidenced by a relatively lower ER (3.22) of CH-SB-BG. Therefore, the synergistic convergence of fluidizer (TH) and stabilizer (SB) optimizes the formulation for better permeability and dermal depot effect than the monotherapy. The synergistic nanobiolosomal gel can easily permeate the upper epidermis but remain within the dermal matrix, and localize the therapeutic effect at the inflamed synovial tissues for a prolonged duration with minimal systemic exposure [59].
3.6. Cytotoxicity Studies
The MTT assay is a commonly used colorimetric method to assess the metabolic activity of living cells. Regarding this, the cytotoxic effect of the developed nanobilosomal gels was investigated using the RAW 264.7 7 macrophages cell line at varying concentrations of 0–1000 µg/mL. RAW 264.7 was selected due to its pathological relevance to joint inflammation. These secrete pro-inflammatory cytokines and ROS, leading to tissue damage; therefore, evaluating the viability of these cells upon exposure to nanobilosomal gels is essential to confirm cytocompatibility without triggering any secondary cytotoxicity in target immune cells. The cytotoxicity results revealed a significant shift (p < 0.05) in IC50 values, where CH-TH-BG and CH-SB-BG exhibited 30.08- and 9.88-fold higher than their respective pure drug counterparts. Moreover, CH-TH+SB-BG is also cytocompatible and exhibited a 35.30-fold higher (p < 0.05) IC50 value than the combination of SB and TH (1:3) (Figure 5). The CH-BG exhibited excellent cytocompatibility, confirming that the carrier matrix was safe. These results indicate that CH-TH+SB-BG was safe, non-irritant, and cytocompatible and can be used for synergistic transdermal delivery of TH and SB. This higher cytocompatibility is directly correlated with the sustained drug release profile, preventing the toxic surge of the drugs. The correlation between sustained release, augmented skin permeation and deposition, and superior cytocompatibility validates that the nanobilosomal gel is an excellent carrier for the synergistic delivery of TH and SB without any toxicity [41].
Figure 5.
IC50 values of pure TH, SB, and nanobilosomal gel loaded with TH/SB, co-loaded with TH and SB in a 3:1 ratio, and blank nanobilosomal gel (CH-BG). Data are expressed as the mean value ± SEM, and statistical evaluations are conducted using GraphPad Prism (v8.0.1), applying one-way ANOVA followed by Tukey’s post hoc test (p < 0.05). Means are statistically different when compared with pure TH and SB and a combination of SB and TH (1:3), considering p < 0.05 as statistically significant. a p < 0.0001, b p > 0.05, # p < 0.0001, $ p < 0.0001.
3.7. In Vivo Skin Irritation Test and Antiarthritic Efficacy
The developed nanobilosomal gels were non-irritant and safe for topical application, evidenced by no signs of erythema or edema during the study (Supplementary Figure S7 and Supplementary Table S3). A multiparametric approach was used to assess the antiarthritic potential of the synergistic formulation against monotherapies. Clinical recovery was evaluated by assessment of arthritic score and paw volume (Figure 6), whereas systemic improvement was analyzed by hematological and biochemical parameters (Figure 7) and oxidative and serum inflammatory biomarkers (Figure 8). Further, the synergistic potential was mathematically validated by the CDI Bliss (Table 4). Additionally, recovery of joint damage was assessed by radiographic and histopathological studies (Figure 9).
Figure 6.
Comparative antiarthritic effect of CH-TH+SB-BG against the FCA-induced Rat model: (a) arthritic scoring, and (b) paw volume. Data are expressed as the mean value ± SEM, and statistical evaluations are conducted using GraphPad Prism (v8.0.1), applying two-way ANOVA followed by Tukey’s post hoc test (p < 0.05). Significant variations compared to the vehicle group are denoted by a, b, c, d, and ns (p < 0.0001, p < 0.001, p < 0.01, p < 0.05, and p > 0.05, respectively). Superior therapeutic significance compared to the arthritic group is indicated by #, @, and $ (p < 0.0001, p < 0.001, and p < 0.01, respectively). Paw volume data for parallel control and CH-TH-BG represent parallel benchmark parameters from the synchronized experimental timeline, previously reported in Ref. [7], for direct comparative analysis with the newly developed monotherapy (CH-SB-BG) and synergistic formulation (CH-TH+SB-BG).
Figure 7.
Systemic impact of inflammation and the antiarthritic synergistic potential of CH-TH+SB-BG on hematological and biochemical parameters in FCA-induced arthritic model: (a) ESR; (b) platelets; (c) CRP; and (d) RF. Data are expressed as the mean value ± SEM, and statistical evaluations are conducted using GraphPad Prism (v8.0.1), applying two-way ANOVA followed by Tukey’s post hoc test (p < 0.05). Significant variations compared to the vehicle group are denoted by a, b, d, and ns (p < 0.0001, p < 0.001, p < 0.05, and p > 0.05, respectively). Superior therapeutic efficacy compared to the arthritic group is indicated by # at p < 0.0001.
Figure 8.
Effect of CH-TH+SB-BG on oxidative stress and inflammatory biomarkers in FCA-induced arthritic model: (a) MDA; (b) GSH; (c) SOD; (d) TNF-α; and (e) IL-6. Data are expressed as the mean value ± SEM, and statistical evaluations are conducted using GraphPad Prism (v8.0.1), applying two-way ANOVA followed by Tukey’s post hoc test (p < 0.05). Significant variations compared to the vehicle control group are denoted by a, b, and ns (p < 0.0001, p < 0.001, and p > 0.05, respectively). Superior therapeutic efficacy compared to the arthritic control group is indicated by # at p < 0.0001. The TNF-α and IL-6 datasets for parallel control groups and CH-TH-BG represent parallel benchmark parameters from the synchronized experimental timeline, previously reported in Ref. [7], for direct comparison with the newly developed monotherapy (CH-SB-BG) and synergistic formulation (CH-TH+SB-BG).
Table 4.
CDI Bliss calculation using the Bliss independent model based on the effect-based approach.
Figure 9.
Effect of CH-TH+SB-BG on radiological and histopathological analysis (×100) of the ankle joint in FCA-induced arthritic model. The histopathology images of vehicle control, arthritic control, standard control, and CH-TH-BG represent parallel benchmark parameters from the synchronized experimental timeline, previously reported in Ref. [7], for direct comparison with the newly developed monotherapy (CH-SB-BG) and synergistic formulation (CH-TH+SB-BG).
3.7.1. Arthritic Score and Paw Volume
The clinical efficacy of the developed nanobilosomal gels was assessed using the arthritic score and paw volume (Figure 6). On Day 7 after FCA induction, all groups exhibited a significantly higher (p < 0.0001) arthritic score (Figure 6a) and paw volume (Figure 6b) than the vehicle control group, indicating full development of RA. At Day 28, the monotherapies and marketed formulation exhibited a significant reduction (p < 0.0001) in arthritic score and paw volume compared with the arthritic control group, but CH-TH+SB-BG showed a greater reduction than the monotherapies and the marketed formulation. The marked reduction in the arthritic score and paw volume in CH-TH+SB-BG surpassed the individual effect of the monotherapies, highlighting the pharmacodynamic synergy of TH and SB in a 3:1 ratio. This synergy is attributed to the synchronized delivery of the dual drugs via the BLs, ensuring simultaneous availability of TH and SB at the synovial interface. TH rapidly reduces edema owing to its anti-inflammatory effect and higher permeability [60], SB provides a prolonged anti-inflammatory effect due to its sustained-release action and higher skin deposition [34], supporting the ex vivo findings.
3.7.2. Hematological and Biochemical Parameters
In rats, FCA induction causes a significant variation in different hematological and biochemical parameters. In this study, ESR, platelets, CRP, and RF were measured due to their reliability to quantify the systemic impact of inflammation and the antiarthritic synergistic potential of TH and SB (Figure 7). The results revealed that the arthritic control group exhibited ~4.7-fold, ~2-fold, ~ 3.35-fold, and ~46.10-fold increase in ESR (Figure 7a), platelet count (Figure 7b), CRP (Figure 7c), and RF level (Figure 7d), respectively, compared to the vehicle control group. The significant increment in all parameters of the arthritic control group may be due to the modulation of the NF-κB-mediated inflammatory pathway and oxidative stress pathway caused by FCA induction. Elevated ESR levels are associated with increased fibrinogen and other protein concentrations stimulated by TNF- α and IL-6, causing red blood cells (RBC) to stick together. IL-6 stimulates the overproduction of platelets and CRP, whereas TNF-α activates B cells and T cells, producing RF [47]. Notably, all the nanobilosomal gels significantly reduced (p < 0.0001) the hematological and biochemical parameters, compared to the arthritic control group, but a marked reduction was observed with CH-TH+SB-BG application than that of monotherapies. The synergistic CH-TH+SB-BG exhibited ~1.35, ~2.25, and ~1.50-fold reduction in ESR level, ~1.14, ~1.40, and ~1.21-fold in platelets count, ~1.70, ~2, and ~1.8-fold in CRP level, and ~2.47, ~3.38, and ~2.8-fold in RF level against the CH-TH-BG, CH-SB-BG, and marketed formulation, respectively (Figure 7). The restoration of all values is ascribed to the synergistic anti-inflammatory and antioxidant activity of the TH and SB [25]. Further, SB stabilizes erythrocyte membrane, providing RBC protection via a significant reduction in the MDA level [29].
3.7.3. Oxidative Stress and Inflammatory Biomarkers
Oxidative stress and cytokine inflammatory biomarkers are very important parameters in RA, because cytokines are primarily responsible for immune attack, whereas oxidative stress biomarkers are responsible for joint destruction. FCA induction significantly (p < 0.0001) increased MDA level, indicating lipid peroxidation (Figure 8a), whereas it significantly (p < 0.0001) depleted the level of endogenous antioxidant enzymes, including GSH (Figure 8b) and SOD (Figure 8c), compared to that of the vehicle control group. These oxidative variations are positively correlated with the activation of different inflammatory pathways and stimulate joint and cartilage destruction. The monotherapeutic gels significantly suppressed (p < 0.0001) the MDA level, compared to the arthritic control, but the synergistic gel application resulted in a ~2, ~1.46-, ~1.3-, and -1.6-fold decrease in MDA level compared to arthritic control, CH-TH-BG, CH-SB-BG, and marketed formulation, respectively. This marked reduction in the MDA level is attributed to the superior antioxidant effect of SB, confirmed by the higher reduction in MDA level through CH-SB-BG than CH-TH-BG, compared to the arthritic control (Figure 8a). Despite the slower release of SB, it exhibited sustained release and higher skin deposition, enabling a prolonged antioxidant effect [29]. Further, CH-TH+SB-BG significantly (p < 0.0001) restored the GSH (Figure 8b) and SOD levels (Figure 8c) compared to the arthritic control group, suggesting the synergistic antioxidant potential of TH and SB. Simultaneous delivery of TH and SB possesses enhanced antioxidant activity through their structural support, i.e., the hydroxyl group of TH directly neutralizes the free radicals and restores the endogenous antioxidants [61], whereas SB stabilizes the cell membrane against oxidative damage [29].
A significant increase (p < 0.0001) in the level of TNF-α (~3.6-fold) and IL-6 (~3.9-fold) was observed in the arthritic control group, compared to the vehicle control group. This increased level was responsible for alterations in hematological and biochemical parameters, causing tissue damage and joint swelling. Notably, the animals treated with nanobilosomal gels significantly reduced (p < 0.0001) the serum level of TNF-α (Figure 8d) and IL-6 (Figure 8e), but CH-TH+SB-BG showed a higher reduction than the monotherapies and marketed formulation, confirming the synergistic anti-inflammatory potential of TH and SB through suppression of the production of TNF-α and IL-6 [25]. The superior attenuation of pro-inflammatory cytokines by the synergistic formulation is the direct result of the convergence of TH and SB in the same cargo. Despite sharing the common anti-inflammatory mechanism by TH and SB, both drugs reduce the production of TNF-α and IL-6 through their unique molecular mechanism [24,25,35]. Briefly, TH’s contribution relies on its small structure and lipophilicity, which allow it to permeate the lipid membrane and act as an antioxidant modulator, and being a rigid and large molecule, SB acts as a dermal reservoir.
3.7.4. Assessment of Synergistic Effect
The effect-based approach was used to assess the synergistic antiarthritic effect of CH-TH+SB-BG using the Bliss independence model. The effect-based approach relies on the comparison of the therapeutic inhibitory effect of the synergistic formulation to the monotherapies (Table 4). The synergistic CH-TH+SB-BG demonstrated a CDI Bliss value of less than 1, confirming the synergistic interaction between TH and SB when co-delivered through bilosomal gel. This synergy is mainly attributed to the fluidizing property of TH, which facilitates SB permeation, ensuring the synergistic anti-inflammatory and antioxidant properties of both drugs [7,37].
3.7.5. Radiological and Histopathological Analysis
The recovery of joint and bone damage was assessed by radiological and histopathological analysis (Figure 9). X-ray images of the vehicle control group revealed normal joint structure (i) and soft tissues (ii) (Figure 9a), which correlates with dense articular surface (iii) and thinner synovial membrane (iv) (Figure 9b), indicating a non-inflamed ankle joint. The radiographs of the arthritic control group exhibited narrowing of the joint space characterized by a thinner space (v) and swelling of soft tissue characterized by increased and opaque shadow around the bones (vi) (Figure 9c). Histopathologically, joint space narrowing and soft tissue swelling were correlated with subchondral bone erosion (vii) and joint space filled with pannus formation (viii), and irregular and thin articular surface, respectively (ix), confirming arthritis induction (Figure 9d). The radiograph (Figure 9e) and micrograph (Figure 9f) of the standard group showed a slight reduction in joint space narrowing (x) and a decrease in soft tissue swelling (xi), correlated with a slight recovery in cartilage erosion (xii) and thinning (xiii), indicating partial recovery of joints and bone damage. The radiograph of monotherapies exhibited a significant reduction in joint space narrowing (xiv) without any soft tissue swelling (Figure 9g,i), and histopathologically correlated with partial degeneration of the articular surface with some pits (xv and xvi), compared to the arthritic control group (Figure 9h,j), indicating moderate restoration of the articular joint. Notably, the radiograph and microphotograph of CH-TH+SB-BG exhibited near-normal joints without any soft tissue swelling (Figure 9k) and a smooth synovial membrane (xvii) with minimal infiltration of inflammatory cells (Figure 9l), indicating articular preservation. These results confirmed the synergistic protection provided by CH-TH+SB-BG through nearly articular restoration, whereas the monotherapies only moderately recover the joints. Moreover, these results are also correlated with the CDI Bliss (<1) calculated from the various biomarkers. The superior protection is attributed to the simultaneous delivery of TH and SB, which may reduce acute cell recruitment and inhibit MMP/chondrocyte apoptosis, respectively, resulting in a chondro-protective effect in contrast to monotherapies. Moreover, SB may interact with ER-β and downregulate miR-155 and may increase osteoprotegerin level that stops Receptor Activator of Nuclear Factor kappa-B Ligand, preventing bone dissolution [33,34,35,36]. Additionally, the dermal depot generated by the synergistic gel imparted a sustained release of drugs enough to reach the synovial interface, halting disease progression.
3.8. Stability Studies
The developed nanobilosomal gels were assessed for 6-month storage stability studies as per ICH guidelines. After 6 months, the gels were homogeneous, with minor variation in viscosity, drug content, and pH (Supplementary Table S4).
4. Conclusions
This study explored the antiarthritic potential of a synergistic nanobilosomal gel co-loaded with TH and SB (CH-TH+SB-BG) for the topical management of RA using the FCA-induced Rat arthritic model. The CH-TH+SB-BG overcomes the limitations of transdermal delivery and monotherapies using the unique properties of BLs, CH, and carbopol 940. The CH-TH+SB-BG exhibited faster drug release than CH-SB-BG but slower than previously reported CH-TH-BG, which served as the parallel benchmark from our synchronized study timeline. This distinct release profile was due to increased hydrophobic packing density of both drugs within the BL bilayers and intermolecular hydrogen bonding established between the drugs and the BL matrix. Moreover, TH exhibited higher release, whereas SB exhibited slower, sustained release from CH-TH+SB-BG, making the gel beneficial for managing RA. Initial release of TH provides relief from pain and oxidative stress and fluidizes the skin’s lipid membrane, which facilitates the sustained release of SB through the skin barrier, ensuring its magnified anti-inflammatory effect. Further, ex vivo results confirmed the fluidizing effect of TH and the dermal depot of SB, evidenced by higher permeability flux and increased skin deposition of synergistic CH-TH+SB-BG compared to the parallel benchmark monotherapy (CH-TH-BG) evaluated during our synchronized experimental timeline. Interestingly, cytotoxicity and skin irritation results indicated that the CH-TH+SB-BG was safe, cytocompatible, and non-irritant, and can be used for synergistic transdermal delivery of TH and SB.
A multiparametric approach was used to evaluate the antiarthritic efficacy of synergistic nanobilosomal gel in the FCA-induced Rat model. A Significant reduction in arthritic score and paw volume and normalization of hematological (ESR and platelet) and biochemical parameters (CRP and RF) suggested clinical recovery and protective effect of the synergistic nanobilosomal gel, respectively. Finally, restoration of the level of oxidative stress biomarkers (MDA, GSH, and SOD), inflammatory biomarkers (TNF-α and IL-6), and ankle joints confirmed the synergistic antioxidant, anti-inflammatory, antiarthritic potential, and chondro-protective effect of CH-TH+SB-BG, in contrast to monotherapies, also validated by CDIBliss (<1). The superior therapeutic efficacy of CH-TH+SB-BG is ascribed to the simultaneous delivery of TH and SB, their structural support, unique molecular mechanism, and dermal depot generated by nanobilosomal gel, resulting in reduced levels of pro-inflammatory cytokines. In conclusion, the developed synergistic nanobilosomal gel represents a potential carrier for the effective co-delivery of TH and SB, with superior therapeutic efficacy for managing RA. This approach can be a more effective and safer alternative to long-term oral administration of corticosteroids and NSAIDS, opening the way for the effective management of RA.
Supplementary Materials
The following supporting information can be downloaded at: https://www.mdpi.com/article/10.3390/polysaccharides7030078/s1. Figure S1: Particle size and zeta potential of developed bilosomes: Particle size (a) and zeta potential (b) of CH-TH-BLs; particle size (c) and zeta potential (d) of CH-SB-BLs; particle size (e) and zeta potential (f) of CH-TH+SB-BLs. Data for CH-TH-BLs represent parallel benchmark parameters from the synchronized experimental timeline, previously reported in Ref [7] for direct comparative analysis; Figure S2: FTIR spectra of drug, excipients, physical mixture, and developed bilosomes. (a) thymol; (b) chitosan; (c) soyalecithin; (d) cholesterol; (e) sodium deoxycholate; (f) physical mixture; (g) CH-TH-BLs. represent parallel benchmark parameters from the synchronized experimental timeline, previously reported in Ref [7] for direct comparative analysis; Figure S3: DSC thermogram of thymol and different excipients used in CH-TH-BLs. These thermograms represent parallel benchmark parameters from the synchronized experimental timeline, previously reported in Ref [7] for direct comparative analysis; Figure S4: FTIR spectra of drug, physical mixture, and developed bilosomes. (a) silibinin; (b) chitosan; (c) physical mixture; (d) CH-SB-BLs; Figure S5: DSC thermogram of silibinin and different excipients used in CH-SB-BLs; Figure S6: Effect of shearing speed on the viscosity of bilosomal gels. Rheological data for CH-TH-BG represent parallel benchmark parameters from the synchronized experimental timeline, previously reported in Ref [7] for direct comparative analysis; Figure S7: Skin appearance of Wistar rats at 4 h and 72 h after the topical application of nanobilosomal gels. (a) Vehicle control group; (b) CH-TH-BG; (c) CH-SB-BG; (d) CH-TH+SB-BG; Table S1: Dermal reaction scoring matrix and irritation classification index; Table S2: Mathematical model to determine the release kinetics of the nanobilosomal gels; Table S3: Skin irritation responses observed at various time intervals; Table S4: Long-term stability study of all the nanobilosomal gels for 6 months as per ICH guidelines.
Author Contributions
D.T.: Conceptualization, data curation, writing—original draft. B.C.: Conceptualization, data curation, writing—original draft. R.S.: Supervision, validation, writing—review and editing. G.N.F.: Conceptualization, visualization, data curation, writing—original draft, writing—review and editing. P.K. (Parveen Kumar): Supervision, validation, writing—review and editing. P.K. (Preeti Kush): Conceptualization, visualization, data curation, writing—original draft, writing—review and editing. All authors have read and agreed to the published version of the manuscript.
Funding
This research received no external funding.
Institutional Review Board Statement
The animal study was duly approved by the IAEC with approval no. BBDNIIT/IAEC/Aug/2025/06.
Data Availability Statement
The original contributions presented in this study are included in the article. Further inquiries can be directed to the corresponding authors.
Acknowledgments
Preeti Kush and Ranjit Singh acknowledge Shobhit University, Gangoh, Saharanpur, Uttar Pradesh 247341, Saharanpur, U.P., and Deepti Tripathi acknowledges Babu Banarasi Das Northern India Institute of Technology, Lucknow, U.P., for providing the necessary facilities.
Conflicts of Interest
Parveen Kumar was employed by Anant Material Pvt Ltd. The remaining authors declare that the research was conducted in the absence of any commercial or financial relationships that could be construed as potential conflicts of interest.
References
- Shen, Q.; Du, Y. A comprehensive review of advanced drug delivery systems for the treatment of rheumatoid arthritis. Int. J. Pharm. 2023, 635, 122698. [Google Scholar] [CrossRef] [Scilit]
- Li, Y.; Duan, Q.; Huang, J.; Zhao, P.; Cai, K. Advances in injectable drug delivery systems for the treatment of rheumatoid arthritis. Biomater. Transl. 2025, 6, 40–54. [Google Scholar] [CrossRef] [Scilit] [PubMed]
- Xu, Y.; Zhao, M.; Cao, J.; Fang, T.; Zhang, J.; Zhen, Y.; Wu, F.; Yu, X.; Liu, Y.; Li, J.; et al. Applications and recent advances in transdermal drug delivery systems for the treatment of rheumatoid arthritis. Acta Pharm. Sin. B 2023, 13, 4417–4441. [Google Scholar] [CrossRef] [Scilit] [PubMed]
- Deshmukh, R. Rheumatoid arthritis: Pathophysiology, current therapeutic strategies and recent advances in targeted drug delivery system. Mater. Today Commun. 2023, 35, 105877. [Google Scholar] [CrossRef] [Scilit]
- Sriram, A.; Ithape, H.; Singh, P.K. Deep-insights: Nanoengineered gel-based localized drug delivery for arthritis management. Asian J. Pharm. Sci. 2025, 20, 101012. [Google Scholar] [CrossRef] [Scilit] [PubMed]
- Zhang, Y.; Gao, Z.; Chao, S.; Lu, W.; Zhang, P. Transdermal delivery of inflammatory factors regulated drugs for rheumatoid arthritis. Drug Deliv. 2022, 29, 1934–1950. [Google Scholar] [CrossRef] [Scilit] [PubMed]
- Tripathi, D.; Singh, R.; Kumar, P.; Kush, P.; Fatima, G.N. Exploring the Potential of Transdermal Nanobilosomal Gel for Magnified Anti-Inflammatory Efficacy of Thymol for Managing Rheumatoid Arthritis. Gels 2026, 12, 156. [Google Scholar] [CrossRef] [Scilit] [PubMed]
- Rahmanian, M.; Khosropanah, S.; Moghaddam, S.H.; Vatankhah, A.; Haghbin, A.; Oroojalian, F.; Abass, K.S.; Kesharwani, P.; Sahebkar, A. Phytochemicals and nanoformulation strategies for rheumatoid arthritis: Mechanistic insights, therapeutic advances, and translational challenges. Inflammopharmacology 2026, 34, 91–123. [Google Scholar] [CrossRef] [Scilit] [PubMed]
- Pimple, P.; Shah, J.; Singh, P. Emerging Phytochemical Formulations for Management of Rheumatoid Arthritis: A Review. Curr. Drug Deliv. 2025, 22, 15–40. [Google Scholar] [CrossRef] [Scilit] [PubMed]
- Piekarz, J.; Picheta, N.; Pobideł, J.; Daniłowska, K.; Gil-Kulik, P. Phytotherapy as an adjunct to the treatment of rheumatoid arthritis—A systematic review of clinical trials. Phytomed. Int. J. Phytother. Phytopharm. 2025, 148, 157285. [Google Scholar] [CrossRef] [Scilit] [PubMed]
- Negi, S.; Tandel, N.; Garg, N.K.; Sharma, P.; Kumar, R.; Sharma, P.; Kumar, R.; Saini, S.; Sharma, A.; Tyagi, R.K. Co-Delivery of Aceclofenac and Methotrexate Nanoparticles Presents an Effective Treatment for Rheumatoid Arthritis. Int. J. Nanomed. 2024, 19, 2149–2177. [Google Scholar] [CrossRef] [Scilit] [PubMed]
- Zheng, L.; Chen, Y.; Gu, X.; Li, Y.; Zhao, H.; Shao, W.; Ma, T.; Wu, C.; Wang, Q. Co-delivery of drugs by adhesive transdermal patches equipped with dissolving microneedles for the treatment of rheumatoid arthritis. J. Control. Release Off. J. Control. Release Soc. 2024, 365, 274–285. [Google Scholar] [CrossRef] [Scilit] [PubMed]
- Lu, Y.; Xiao, T.; Lai, R.; Liu, Z.; Luo, W.; Wang, Y.; Fu, S.; Chai, G.; Jia, J.; Xu, Y. Co-Delivery of Loxoprofen and Tofacitinib by Photothermal Microneedles for Rheumatoid Arthritis Treatment. Pharmaceutics 2023, 15, 1500. [Google Scholar] [CrossRef] [Scilit] [PubMed]
- Haloi, P.; Lokesh, B.S.; Chawla, S.; Konkimalla, V.B. Formulation of a dual drug-loaded nanoparticulate co-delivery hydrogel system and its validation in rheumatoid arthritis animal model. Drug Deliv. 2023, 30, 2184307. [Google Scholar] [CrossRef] [Scilit] [PubMed]
- Gharat, S.; Momin, M.; Panchal, U.; Omri, A. Novel ethosomal gel formulation for enhanced transdermal delivery of curcumin and cyclosporine: A preclinical approach to rheumatoid arthritis management. Drug Deliv. 2025, 32, 2512620. [Google Scholar] [CrossRef] [Scilit] [PubMed]
- Karnam, S.; Jagtap, U.; Jindal, A.B.; Paul, A.T. Evaluation of synergistic anti-inflammatory activity of selected natural products in combination with teriflunomide in LPS stimulated RAW 264.7 cells for rheumatoid arthritis treatment. S. Afr. J. Bot. 2025, 184, 217–228. [Google Scholar] [CrossRef] [Scilit]
- Golbahari, S.; Abtahi Froushani, S.M. Synergistic benefits of Nicotine and Thymol in alleviating experimental rheumatoid arthritis. Life Sci. 2019, 239, 117037. [Google Scholar] [CrossRef] [Scilit] [PubMed]
- Elkomy, M.H.; Alruwaili, N.K.; Elmowafy, M.; Shalaby, K.; Zafar, A.; Ahmad, N.; Alsalahat, I.; Ghoneim, M.M.; Eissa, E.M.; Eid, H.M. Surface-Modified Bilosomes Nanogel Bearing a Natural Plant Alkaloid for Safe Management of Rheumatoid Arthritis Inflammation. Pharmaceutics 2022, 14, 563. [Google Scholar] [CrossRef] [Scilit] [PubMed]
- Mushtaq, R.Y.; Naveen, N.R.; Rolla, K.J.; Al Shmrany, H.; Alshehri, S.; Salawi, A.; Kurakula, M.; Alghamdi, M.A.; Rizg, W.Y.; Bakhaidar, R.B.; et al. Design and evaluation of magnetic-targeted bilosomal gel for rheumatoid arthritis: Flurbiprofen delivery using superparamagnetic iron oxide nanoparticles. Front. Pharmacol. 2024, 15, 1433734. [Google Scholar] [CrossRef] [Scilit] [PubMed]
- Mahmoud, T.M.; Nafady, M.M.; Farouk, H.O.; Mahmoud, D.M.; Ahmed, Y.M.; Zaki, R.M.; Hamad, D.S. Novel Bile Salt Stabilized Vesicles-Mediated Effective Topical Delivery of Diclofenac Sodium: A New Therapeutic Approach for Pain and Inflammation. Pharmaceuticals 2022, 15, 1106. [Google Scholar] [CrossRef] [Scilit] [PubMed]
- AbuBakr, A.H.; Hassan, H.; Abdalla, A.; Khowessah, O.M.; Abdelbary, G.A. Therapeutic potential of cationic bilosomes in the treatment of carrageenan-induced rat arthritis via fluticasone propionate gel. Int. J. Pharm. 2023, 635, 122776. [Google Scholar] [CrossRef] [Scilit] [PubMed]
- Yi, J.; Liu, Y.; Xie, H.; An, H.; Li, C.; Wang, X.; Chai, W. Hydrogels for the treatment of rheumatoid arthritis. Front. Bioeng. Biotechnol. 2022, 10, 1014543. [Google Scholar] [CrossRef] [Scilit] [PubMed]
- Jacob, S.; Kather, F.S.; Boddu, S.H.S.; Rao, R.; Nair, A.B. Vesicular Carriers for Phytochemical Delivery: A Comprehensive Review of Techniques and Applications. Pharmaceutics 2025, 17, 464. [Google Scholar] [CrossRef] [Scilit] [PubMed]
- Nagoor Meeran, M.F.; Javed, H.; Al Taee, H.; Azimullah, S.; Ojha, S.K. Pharmacological Properties and Molecular Mechanisms of Thymol: Prospects for Its Therapeutic Potential and Pharmaceutical Development. Front. Pharmacol. 2017, 8, 380. [Google Scholar] [CrossRef] [Scilit] [PubMed]
- Chen, J.; Li, D.L.; Xie, L.N.; Ma, Y.R.; Wu, P.P.; Li, C.; Liu, W.F.; Zhang, K.; Zhou, R.P.; Xu, X.T.; et al. Synergistic anti-inflammatory effects of silibinin and thymol combination on LPS-induced RAW264.7 cells by inhibition of NF-κB and MAPK activation. Phytomed. Int. J. Phytother. Phytopharm. 2020, 78, 153309. [Google Scholar] [CrossRef] [Scilit] [PubMed]
- Gago, C.; Serralheiro, A.; Miguel, M.D.G. Anti-Inflammatory Activity of Thymol and Thymol-Rich Essential Oils: Mechanisms, Applications, and Recent Findings. Molecules 2025, 30, 2450. [Google Scholar] [CrossRef] [Scilit] [PubMed]
- Keser, S.; Rukavina, Z.; Jozić, M.; Pavlović-Mitrović, L.; Vodolšak, M.; Kranjčec, K.; Stupin Polančec, D.; Maravić-Vlahoviček, G.; Lovrić, J.; Šegvić Klarić, M.; et al. Potentials and Challenges in Development of Vesicular Phospholipid Gel as a Novel Dermal Vehicle for Thymol. Pharmaceutics 2025, 17, 854. [Google Scholar] [CrossRef] [Scilit] [PubMed]
- Sheorain, J.; Mehra, M.; Thakur, R.; Grewal, S.; Kumari, S. In vitro anti-inflammatory and antioxidant potential of thymol loaded bipolymeric (tragacanth gum/chitosan) nanocarrier. Int. J. Biol. Macromol. 2019, 125, 1069–1074. [Google Scholar] [CrossRef] [Scilit] [PubMed]
- Khawaja, G.; El-Orfali, Y. Silibinin’s Effects against Methotrexate-Induced Hepatotoxicity in Adjuvant-Induced Arthritis Rat Model. Pharmaceuticals 2024, 17, 431. [Google Scholar] [CrossRef] [Scilit] [PubMed]
- Hussain, S.A.; Mortada, A.H.; Jasim, N.A.; Gorial, F.I. Silibinin Improves the Effects of Methotrexate in Patients with Active Rheumatoid Arthritis: Pilot Clinical Study. Oman Med. J. 2016, 31, 263–269. [Google Scholar] [CrossRef] [Scilit] [PubMed]
- Zugravu, G.S.; Pintilescu, C.; Cumpat, C.M.; Miron, S.D.; Miron, A. Silymarin Supplementation in Active Rheumatoid Arthritis: Outcomes of a Pilot Randomized Controlled Clinical Study. Medicina 2024, 60, 999. [Google Scholar] [CrossRef] [Scilit] [PubMed]
- Dupuis, M.L.; Conti, F.; Maselli, A.; Pagano, M.T.; Ruggieri, A.; Anticoli, S.; Fragale, A.; Gabriele, L.; Gagliardi, M.C.; Sanchez, M.; et al. The Natural Agonist of Estrogen Receptor β Silibinin Plays an Immunosuppressive Role Representing a Potential Therapeutic Tool in Rheumatoid Arthritis. Front. Immunol. 2018, 9, 1903. [Google Scholar] [CrossRef] [Scilit] [PubMed]
- Rigon, C.; Marchiori, M.C.L.; da Silva Jardim, F.; Pegoraro, N.S.; Chaves, P.D.S.; Velho, M.C.; Beck, R.C.R.; Ourique, A.F.; Sari, M.H.M.; Oliveira, S.M.; et al. Hydrogel containing silibinin nanocapsules presents effective anti-inflammatory action in a model of irritant contact dermatitis in mice. Eur. J. Pharm. Sci. Off. J. Eur. Fed. Pharm. Sci. 2019, 137, 104969. [Google Scholar] [CrossRef] [Scilit] [PubMed]
- Zheng, W.; Feng, Z.; Lou, Y.; Chen, C.; Zhang, C.; Tao, Z.; Li, H.; Cheng, L.; Ying, X. Silibinin protects against osteoarthritis through inhibiting the inflammatory response and cartilage matrix degradation in vitro and in vivo. Oncotarget 2017, 8, 99649–99665. [Google Scholar] [CrossRef] [Scilit] [PubMed]
- Tong, W.W.; Zhang, C.; Hong, T.; Liu, D.H.; Wang, C.; Li, J.; He, X.K.; Xu, W.D. Silibinin alleviates inflammation and induces apoptosis in human rheumatoid arthritis fibroblast-like synoviocytes and has a therapeutic effect on arthritis in rats. Sci. Rep. 2018, 8, 3241. [Google Scholar] [CrossRef] [Scilit] [PubMed]
- Lim, J.O.; Shin, N.R.; Seo, Y.S.; Nam, H.H.; Ko, J.W.; Jung, T.Y.; Lee, S.J.; Kim, H.J.; Cho, Y.K.; Kim, J.C.; et al. Silibinin Attenuates Silica Dioxide Nanoparticles-Induced Inflammation by Suppressing TXNIP/MAPKs/AP-1 Signaling. Cells 2020, 9, 678. [Google Scholar] [CrossRef] [Scilit] [PubMed]
- Bijak, M. Silybin, a Major Bioactive Component of Milk Thistle (Silybum marianum L. Gaernt.)-Chemistry, Bioavailability, and Metabolism. Molecules 2017, 22, 1942. [Google Scholar] [CrossRef] [Scilit] [PubMed]
- El Menshawe, S.F.; Aboud, H.M.; Elkomy, M.H.; Kharshoum, R.M.; Abdeltwab, A.M. A novel nanogel loaded with chitosan decorated bilosomes for transdermal delivery of terbutaline sulfate: Artificial neural network optimization, in vitro characterization and in vivo evaluation. Drug Deliv. Transl. Res. 2020, 10, 471–485. [Google Scholar] [CrossRef] [Scilit] [PubMed]
- Salama, A.; El-Hashemy, H.A.; Darwish, A.B. Formulation and optimization of lornoxicam-loaded bilosomes using 23 full factorial design for the management of osteoarthritis in rats: Modulation of MAPK/Erk1 signaling pathway. J. Drug Deliv. Sci. Technol. 2022, 69, 103175. [Google Scholar] [CrossRef] [Scilit]
- Peddapalli, H.; Radha, G.V.; Chinnaiyan, S.K. Formulation optimization and PK/PD evaluation of novel valsartan bilosomes enhancing transdermal drug delivery. J. Drug Deliv. Sci. Technol. 2024, 92, 105400. [Google Scholar] [CrossRef] [Scilit]
- Zohdy, M.H.; El-Kamel, A.H.; Alseqely, M.; Bakr, B.A.; Heikal, L.A. Bilosomal delivery of thymol-glycyrrhetinic acid: A multifaceted strategy to combat multidrug-resistant wound infections. J. Pharm. Investig. 2025, 56, 367–391. [Google Scholar] [CrossRef] [Scilit]
- Amirsaadat, S.; Pilehvar-Soltanahmadi, Y.; Zarghami, F.; Alipour, S.; Ebrahimnezhad, Z.; Zarghami, N. Silibinin-loaded magnetic nanoparticles inhibit hTERT gene expression and proliferation of lung cancer cells. Artif. Cells Nanomed. Biotechnol. 2017, 45, 1649–1656. [Google Scholar] [CrossRef] [Scilit] [PubMed]
- El-Leithy, E.S.; Abdel-Rashid, R.S. Validation and application of Vierordt’s spectrophotometric method for simultaneous estimation of tamoxifen/coenzyme Q10 in their binary mixture and pharmaceutical dosage forms. Asian J. Pharm. Sci. 2016, 11, 318–325. [Google Scholar] [CrossRef] [Scilit]
- Akabari, A.H.; Solanki, D.K.; Patel, S.K.; Desai, P.; Jainisha, G.; Patel, B.; Shah, B.N.; Shah, K.V. Development and validation of a novel simultaneous equation and Q-absorbance ratio method for the quantitative estimation of atenolol and hydrochlorothiazide in combined tablet dosage forms: A green analytical chemistry approach. Green Anal. Chem. 2025, 12, 100224. [Google Scholar] [CrossRef] [Scilit]
- Maurya, A.; Singh, C.; Saraf, S.K.; Mishra, V.; Tripathi, D. Exploring the Potential of Topical Praziquantel-loaded Ethosomal Gel for the Management of Psoriasis: In vitro and In vivo Assessment. J. Pharm. Innov. 2026, 21, 499. [Google Scholar] [CrossRef] [Scilit]
- Pal, R.R.; Rajpal, V.; Singh, N.; Singh, S.; Mishra, N.; Singh, P.; Maurya, P.; Alka; Saraf, S.A. Downregulation of pro-inflammatory markers IL-6 and TNF-α in rheumatoid arthritis using nano-lipidic carriers of a quinone-based phenolic: An in vitro and in vivo study. Drug Deliv. Transl. Res. 2023, 13, 627–641. [Google Scholar] [CrossRef] [Scilit] [PubMed]
- Manan, M.; Saleem, U.; Akash, M.S.H.; Qasim, M.; Hayat, M.; Raza, Z.; Ahmad, B. Antiarthritic Potential of Comprehensively Standardized Extract of Alternanthera bettzickiana: In Vitro and In Vivo Studies. ACS Omega 2020, 5, 19478–19496. [Google Scholar] [CrossRef] [Scilit] [PubMed]
- Abdel Jaleel, G.A.; Azab, S.S.; El-Bakly, W.M.; Hassan, A. ‘Methyl palmitate attenuates adjuvant induced arthritis in rats by decrease of CD68 synovial macrophages. Biomed. Pharmacother. 2021, 137, 111347. [Google Scholar] [CrossRef] [Scilit] [PubMed]
- Duarte, D.; Vale, N. Evaluation of synergism in drug combinations and reference models for future orientations in oncology. Curr. Res. Pharmacol. Drug Discov. 2022, 3, 100110. [Google Scholar] [CrossRef] [Scilit] [PubMed]
- Wang, Z.; Sun, J.; Jia, L.; Sheng, R. Glycopolymer nanomicelles: pH-responsive drug delivery, endocytosis pathway, autophagy behavior, and the effect of autophagy inhibitors. J. Mater. Sci. Mater. Med. 2025, 36, 47. [Google Scholar] [CrossRef] [Scilit] [PubMed]
- Hajibonabi, A.; Yekani, M.; Sharifi, S.; Nahad, J.S.; Dizaj, S.M.; Memar, M.Y. Antimicrobial activity of nanoformulations of carvacrol and thymol: New trend and applications. OpenNano 2023, 13, 100170. [Google Scholar] [CrossRef] [Scilit]
- Zhou, D.; Li, M.; Li, Q.; Geng, F.; Li, S.; Wu, D. Enhancement of liposomal properties of thyme essential oil using lysozyme modification: Physicochemical, storage, and antibacterial properties. Food Chem. X 2023, 20, 101057. [Google Scholar] [CrossRef] [Scilit] [PubMed]
- Lin, L.; Zhu, Y.; Thangaraj, B.; Abdel-Samie, M.A.S.; Cui, H. Improving the stability of thyme essential oil solid liposome by using β-cyclodextrin as a cryoprotectant. Carbohydr. Polym. 2018, 188, 243–251. [Google Scholar] [CrossRef] [Scilit] [PubMed]
- Guillot, A.J.; Martínez-Navarrete, M.; Garrigues, T.M.; Melero, A. Skin drug delivery using lipid vesicles: A starting guideline for their development. J. Control. Release Off. J. Control. Release Soc. 2023, 355, 624–654. [Google Scholar] [CrossRef] [Scilit] [PubMed]
- Solís-Gómez, A.; Sato-Berrú, R.Y.; Mata-Zamora, M.E.; Saniger, J.M.; Guirado-López, R.A. Characterizing the properties of anticancer silibinin and silybin B complexes with UV–Vis, FT-IR, and Raman spectroscopies: A combined experimental and theoretical study. J. Mol. Struct. 2019, 1182, 109–118. [Google Scholar] [CrossRef] [Scilit]
- Villapiano, F.; Piccioni, M.; D’Aria, F.; Crispi, S.; Rassu, G.; Giunchedi, P.; Gavini, E.; Giancola, C.; Serri, C.; Biondi, M.; et al. Silibinin-Loaded Amphiphilic PLGA-Poloxamer Nanoparticles: Physicochemical Characterization, Release Kinetics, and Bioactivity Evaluation in Lung Cancer Cells. Materials 2024, 17, 5480. [Google Scholar] [CrossRef] [Scilit] [PubMed]
- Islam, M.T.; Bappi, M.H.; Bhuia, M.S.; Ansari, S.A.; Ansari, I.A.; Shill, M.C.; Albayouk, T.; Saleh, N.; El-Shazly, M.; El-Nashar, H.A.S. Anti-inflammatory effects of thymol: An emphasis on the molecular interactions through in vivo approach and molecular dynamic simulations. Front. Chem. 2024, 12, 1376783. [Google Scholar] [CrossRef] [Scilit] [PubMed]
- Imam, S.S.; Alshehri, S.; Altamimi, M.A.; Almalki, R.K.H.; Hussain, A.; Bukhari, S.I.; Mahdi, W.A.; Qamar, W. Formulation of Chitosan-Coated Apigenin Bilosomes: In Vitro Characterization, Antimicrobial and Cytotoxicity Assessment. Polymers 2022, 14, 921. [Google Scholar] [CrossRef] [Scilit] [PubMed]
- Zhang, Z.; Wang, G.; Zhang, Z.; Liang, X.; Wang, G.; Xu, M.; Yang, X.; Zhong, X.; Li, C.; Zhou, M. Locally administered liposomal drug depot enhances rheumatoid arthritis treatment by inhibiting inflammation and promoting cartilage repair. J. Nanobiotechnol. 2025, 23, 69. [Google Scholar] [CrossRef] [Scilit] [PubMed]
- Stephanie, T.A.; David, O.O.; Farombi, E.O. Thymol Reduces Hepatorenal Oxidative Stress, Inflammation and Caspase-3#xd; Activation in Rats Exposed to Indomethacin. Egypt. J. Basic Appl. Sci. 2022, 9, 136–150. [Google Scholar] [CrossRef] [Scilit]
- Javed, H.; Azimullah, S.; Meeran, M.F.N.; Ansari, S.A.; Ojha, S. Neuroprotective Effects of Thymol, a Dietary Monoterpene Against Dopaminergic Neurodegeneration in Rotenone-Induced Rat Model of Parkinson’s Disease. Int. J. Mol. Sci. 2019, 20, 1538. [Google Scholar] [CrossRef] [Scilit] [PubMed]
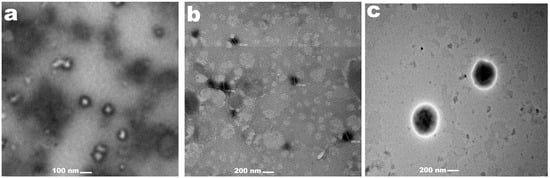
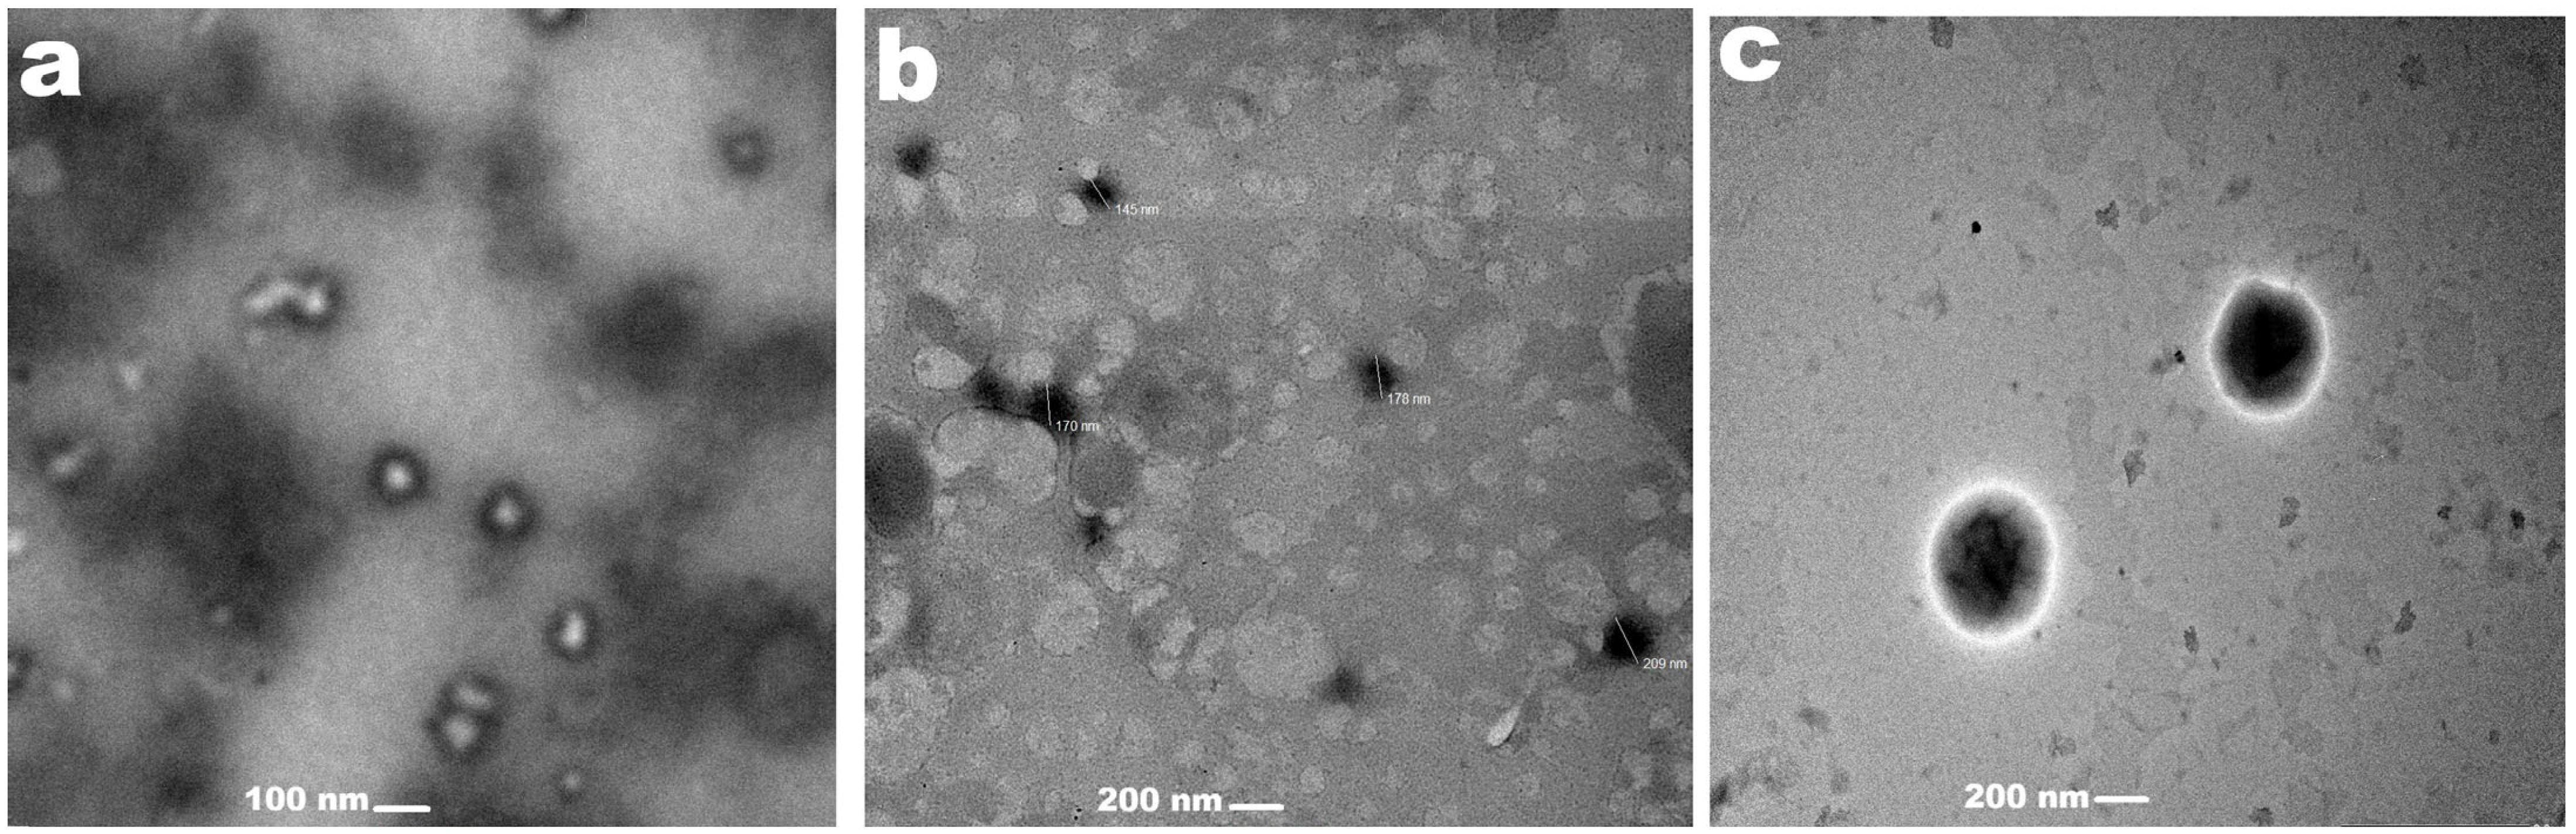
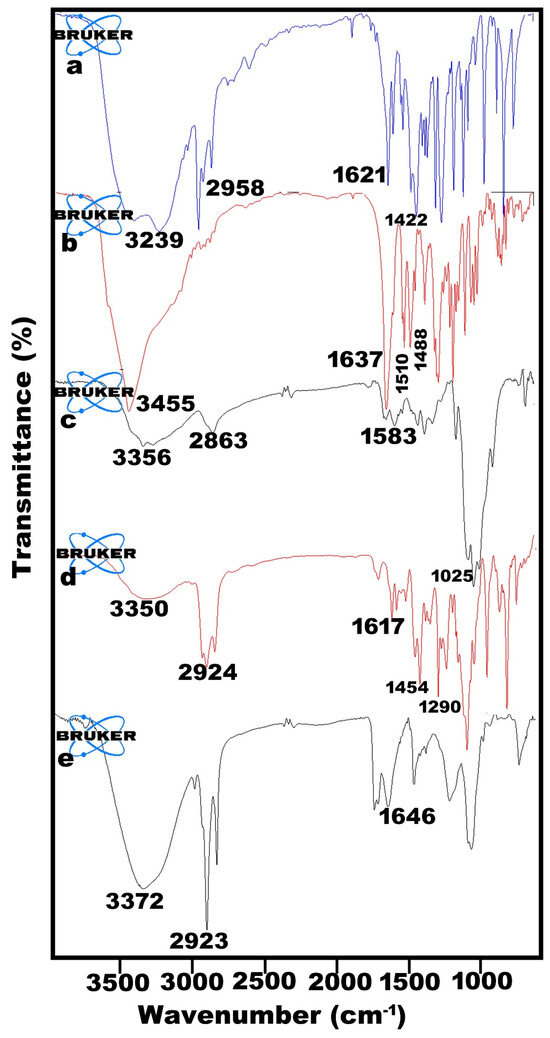
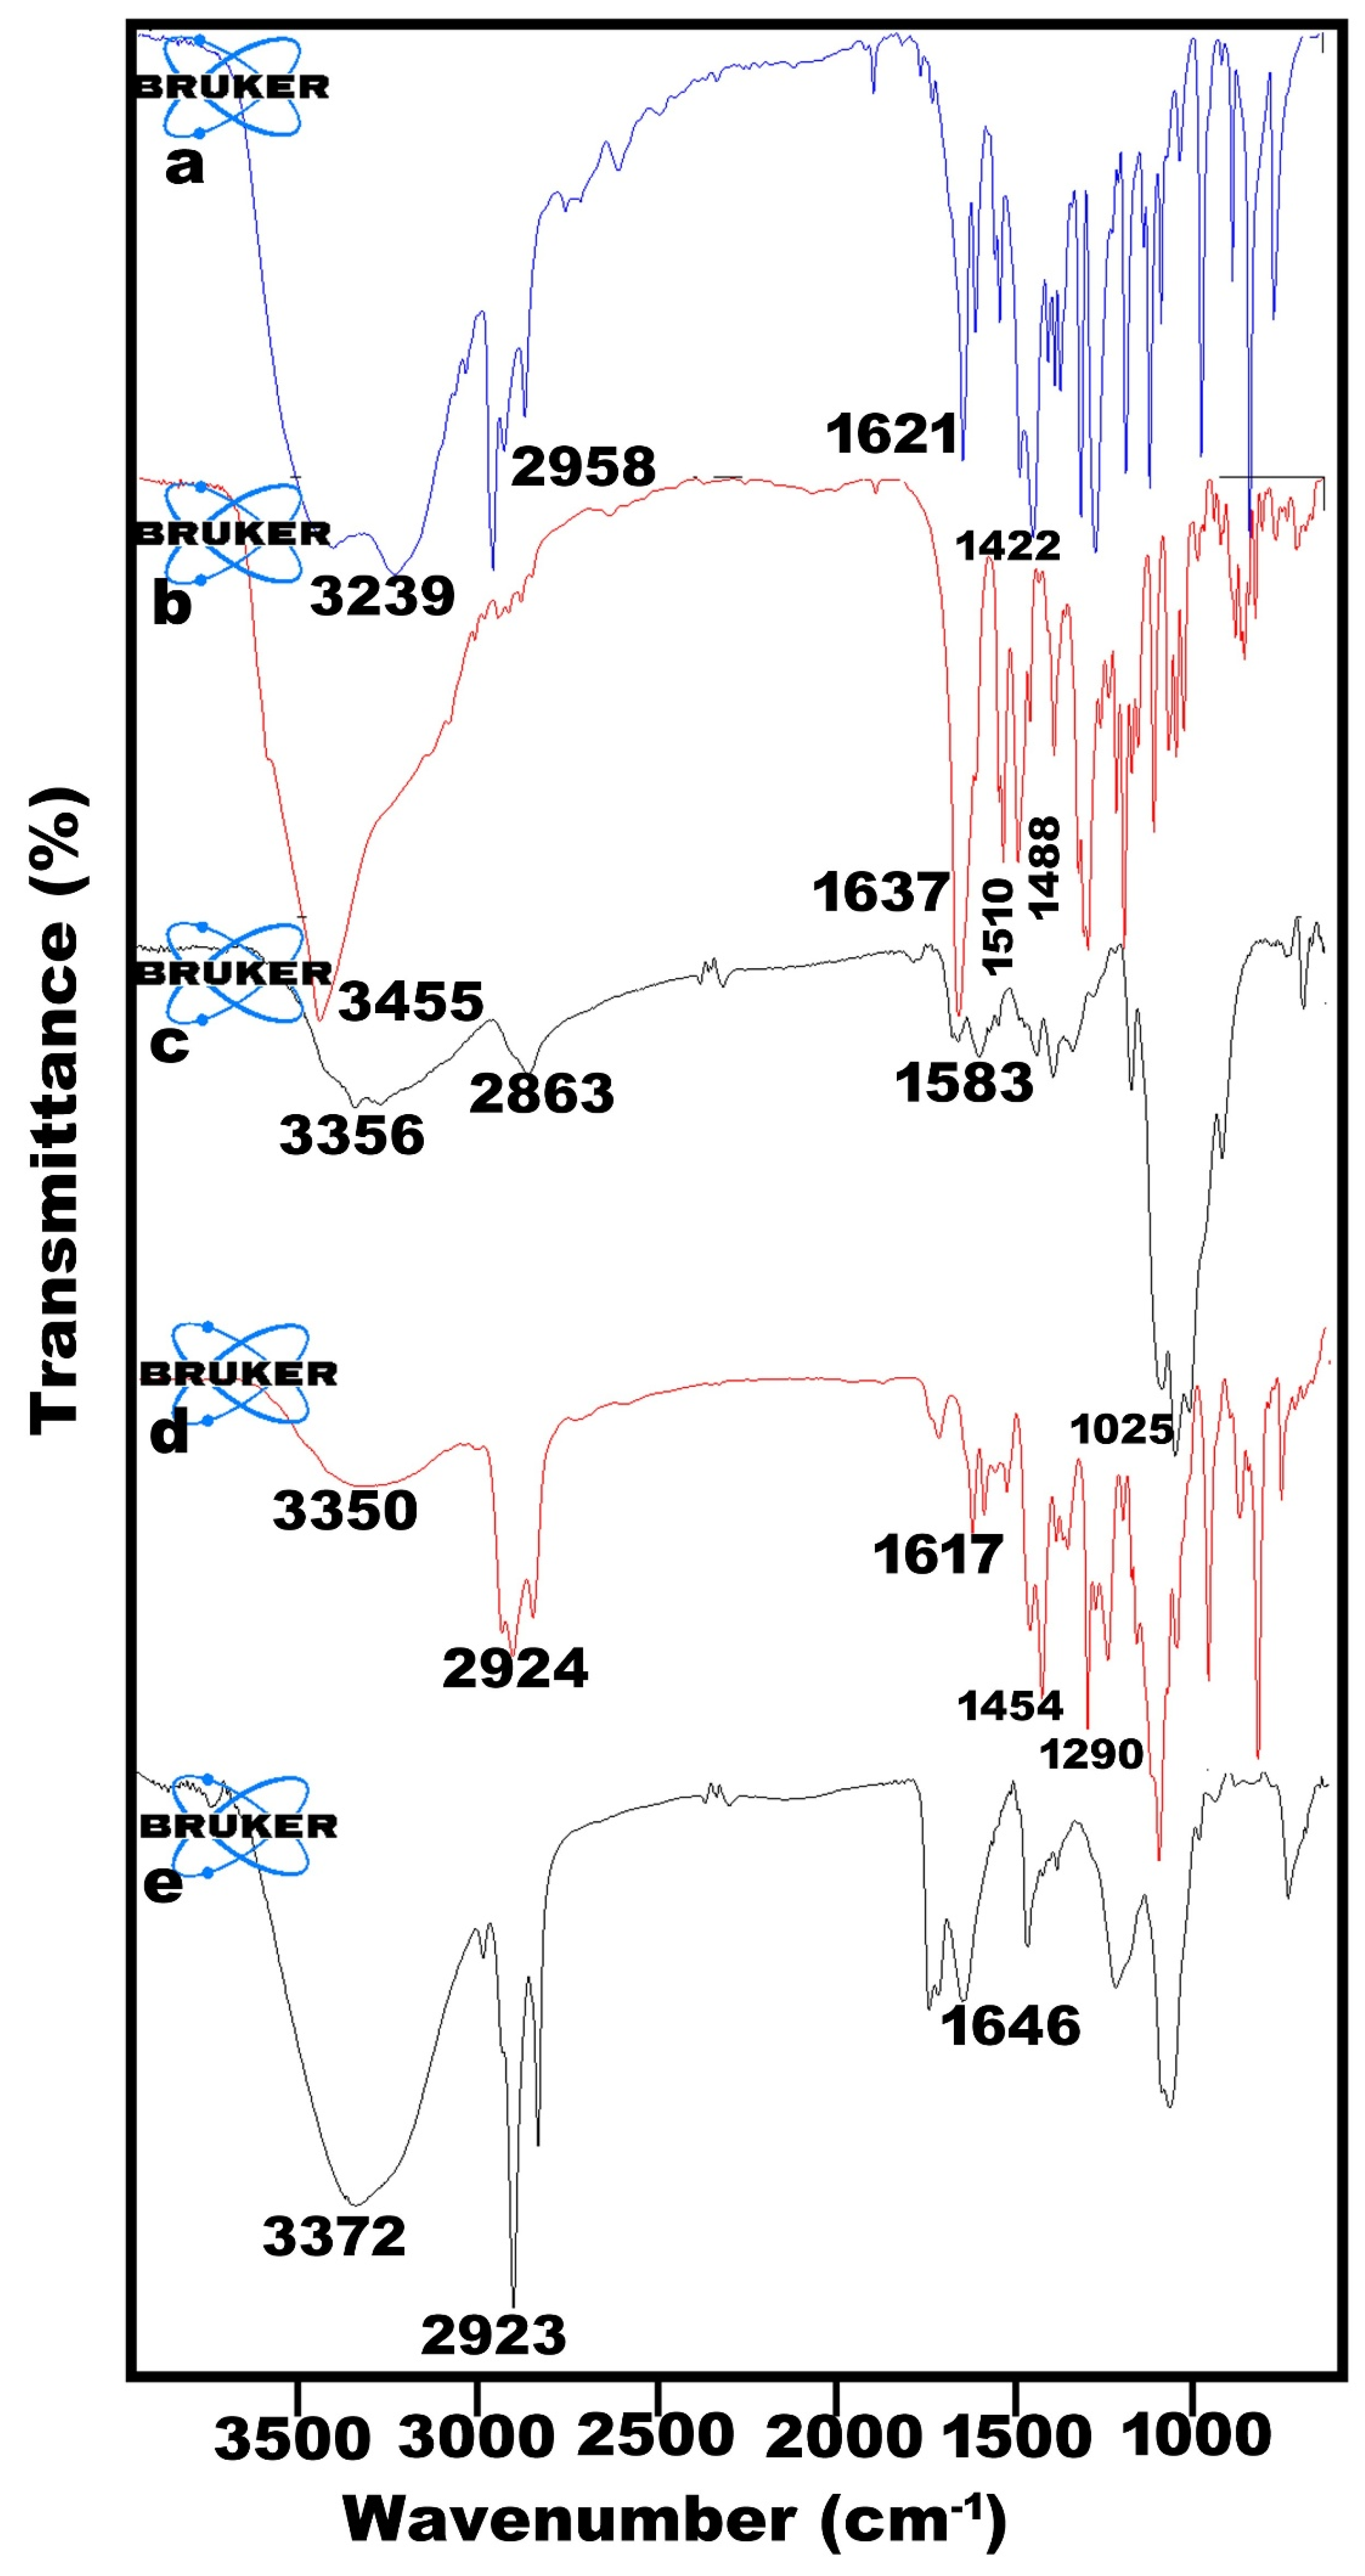
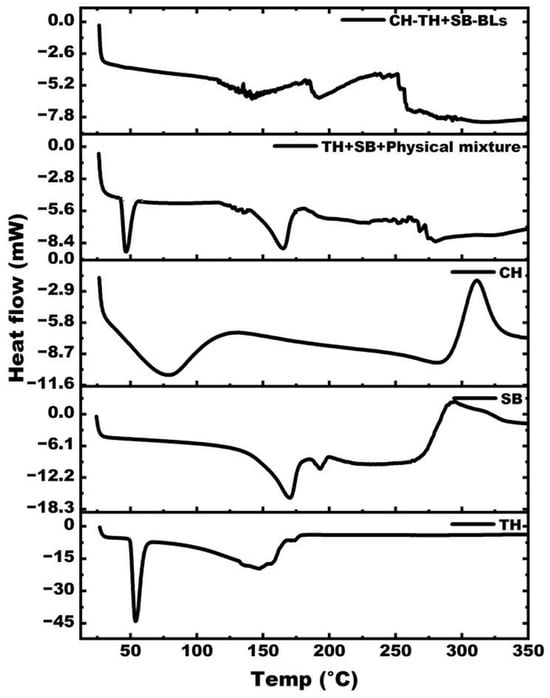
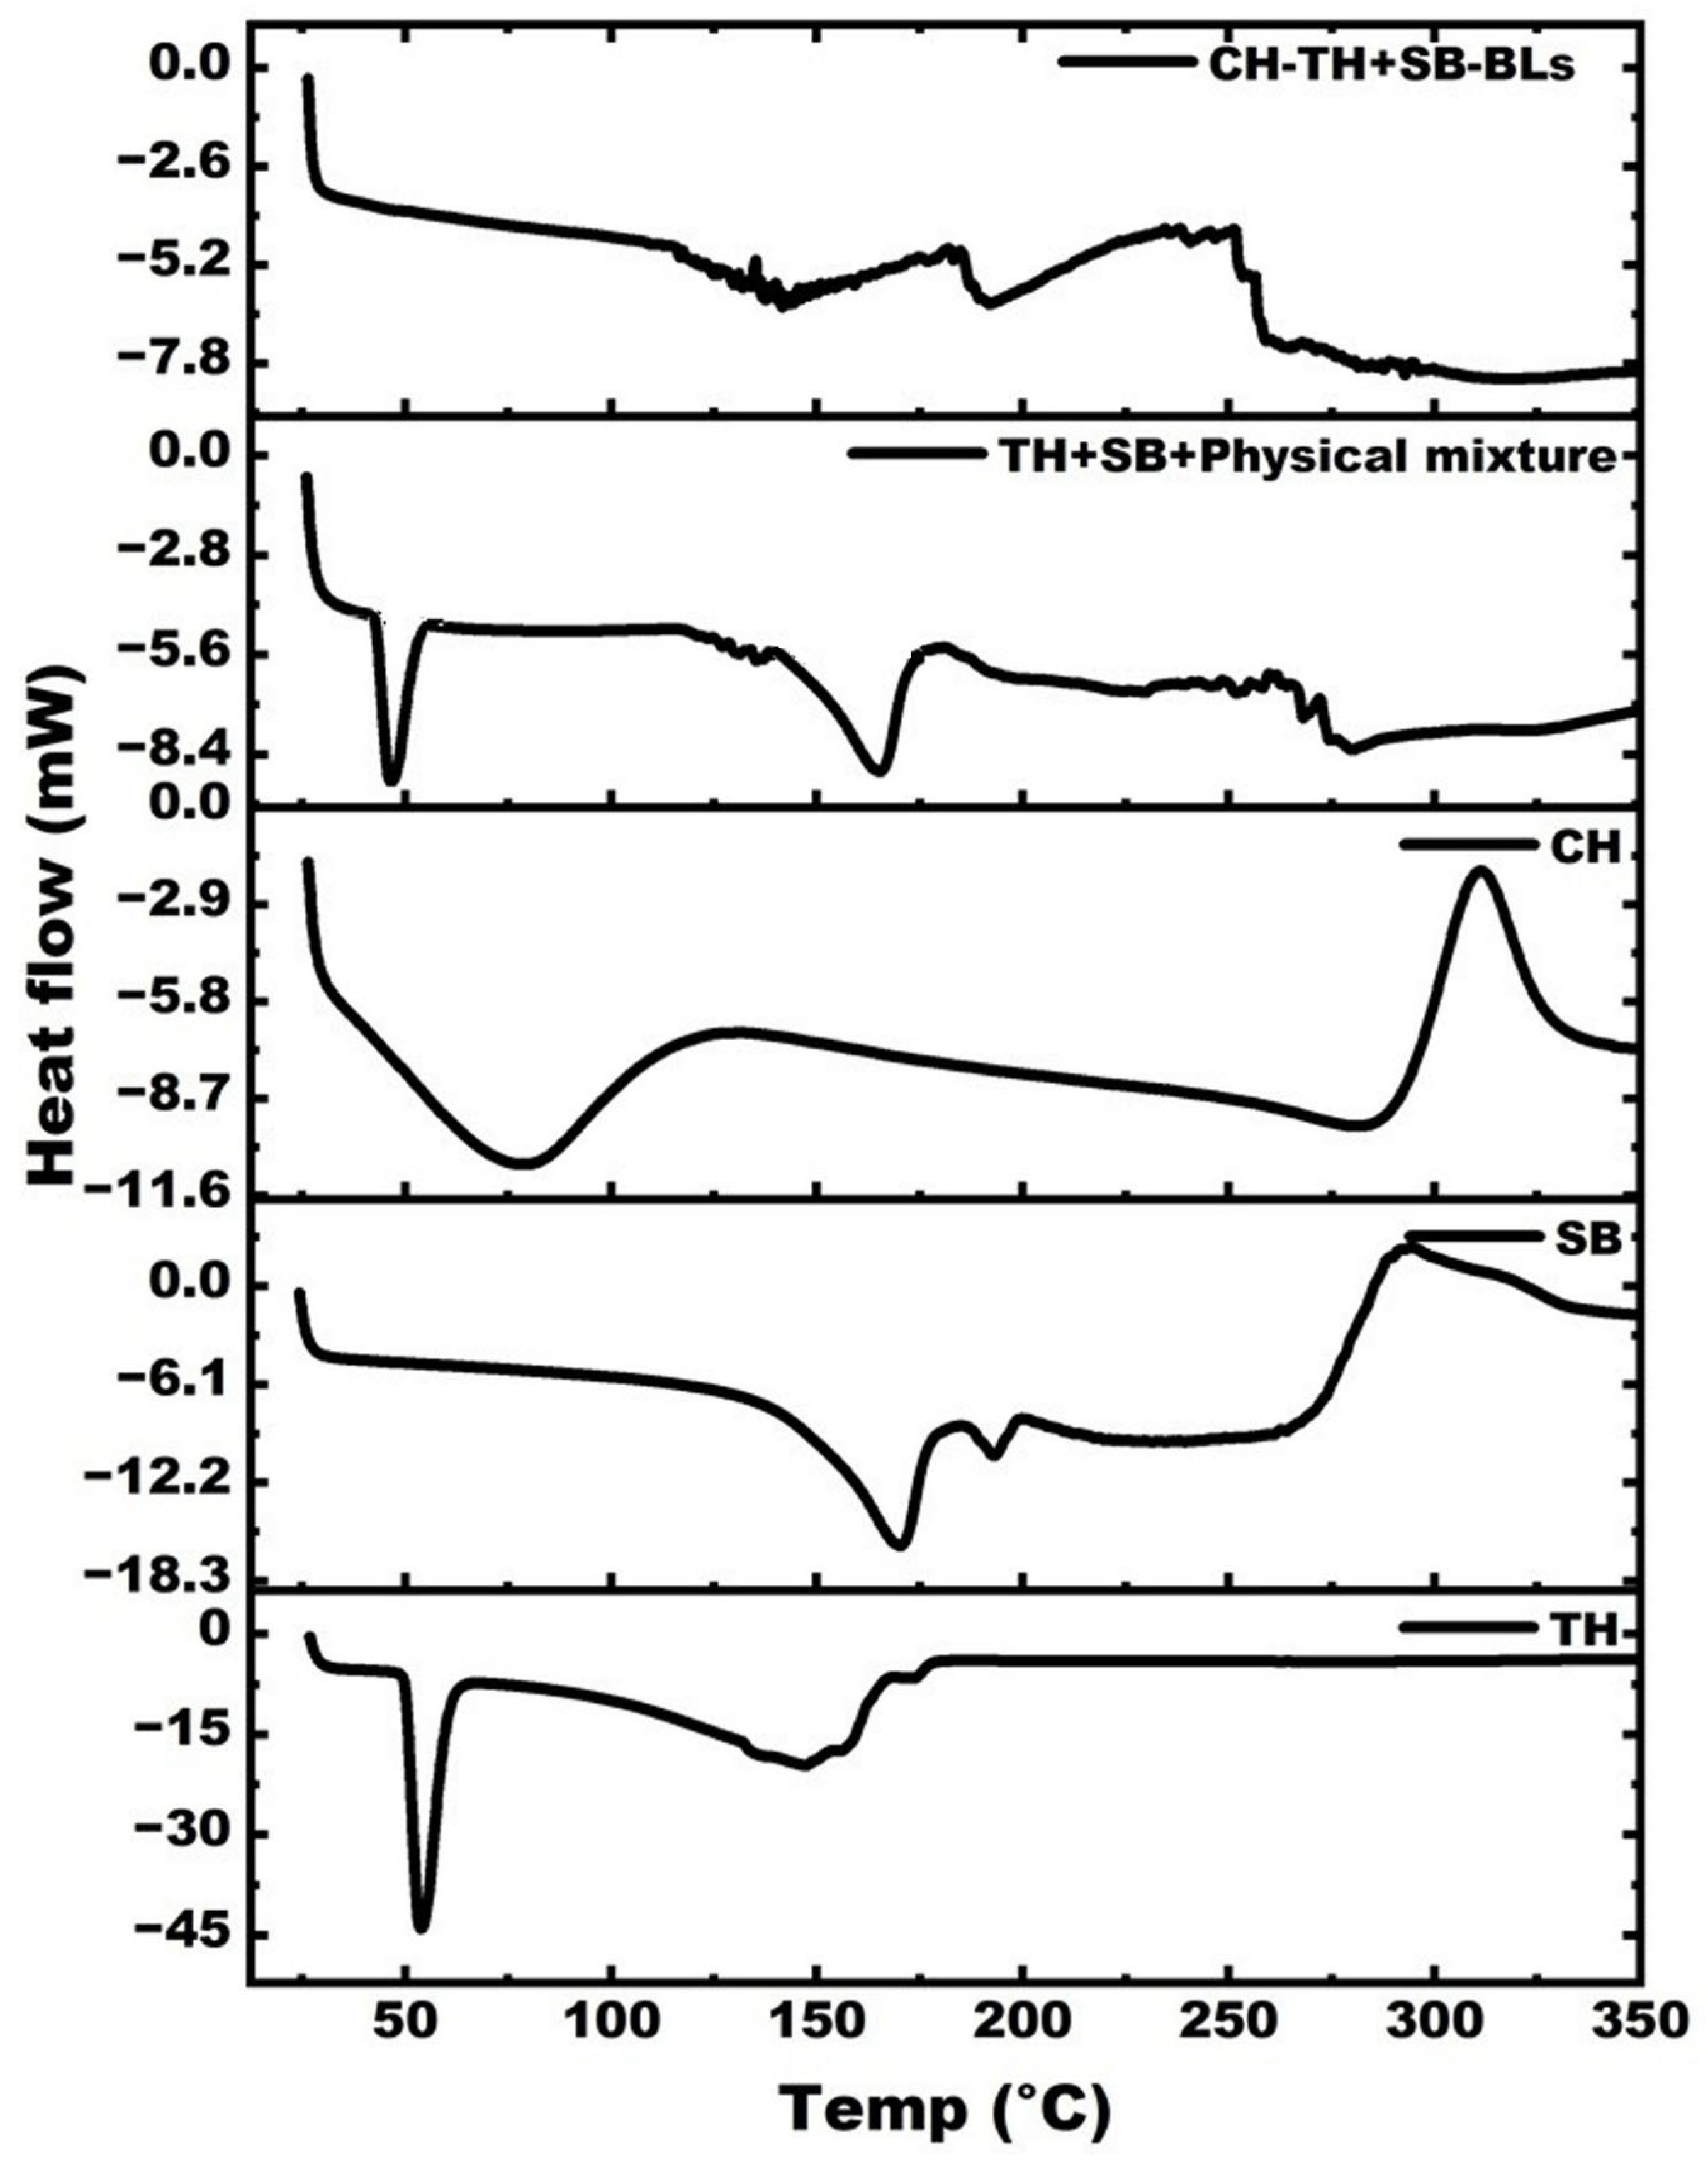
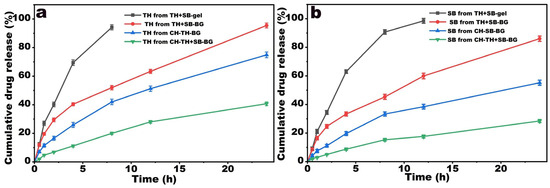
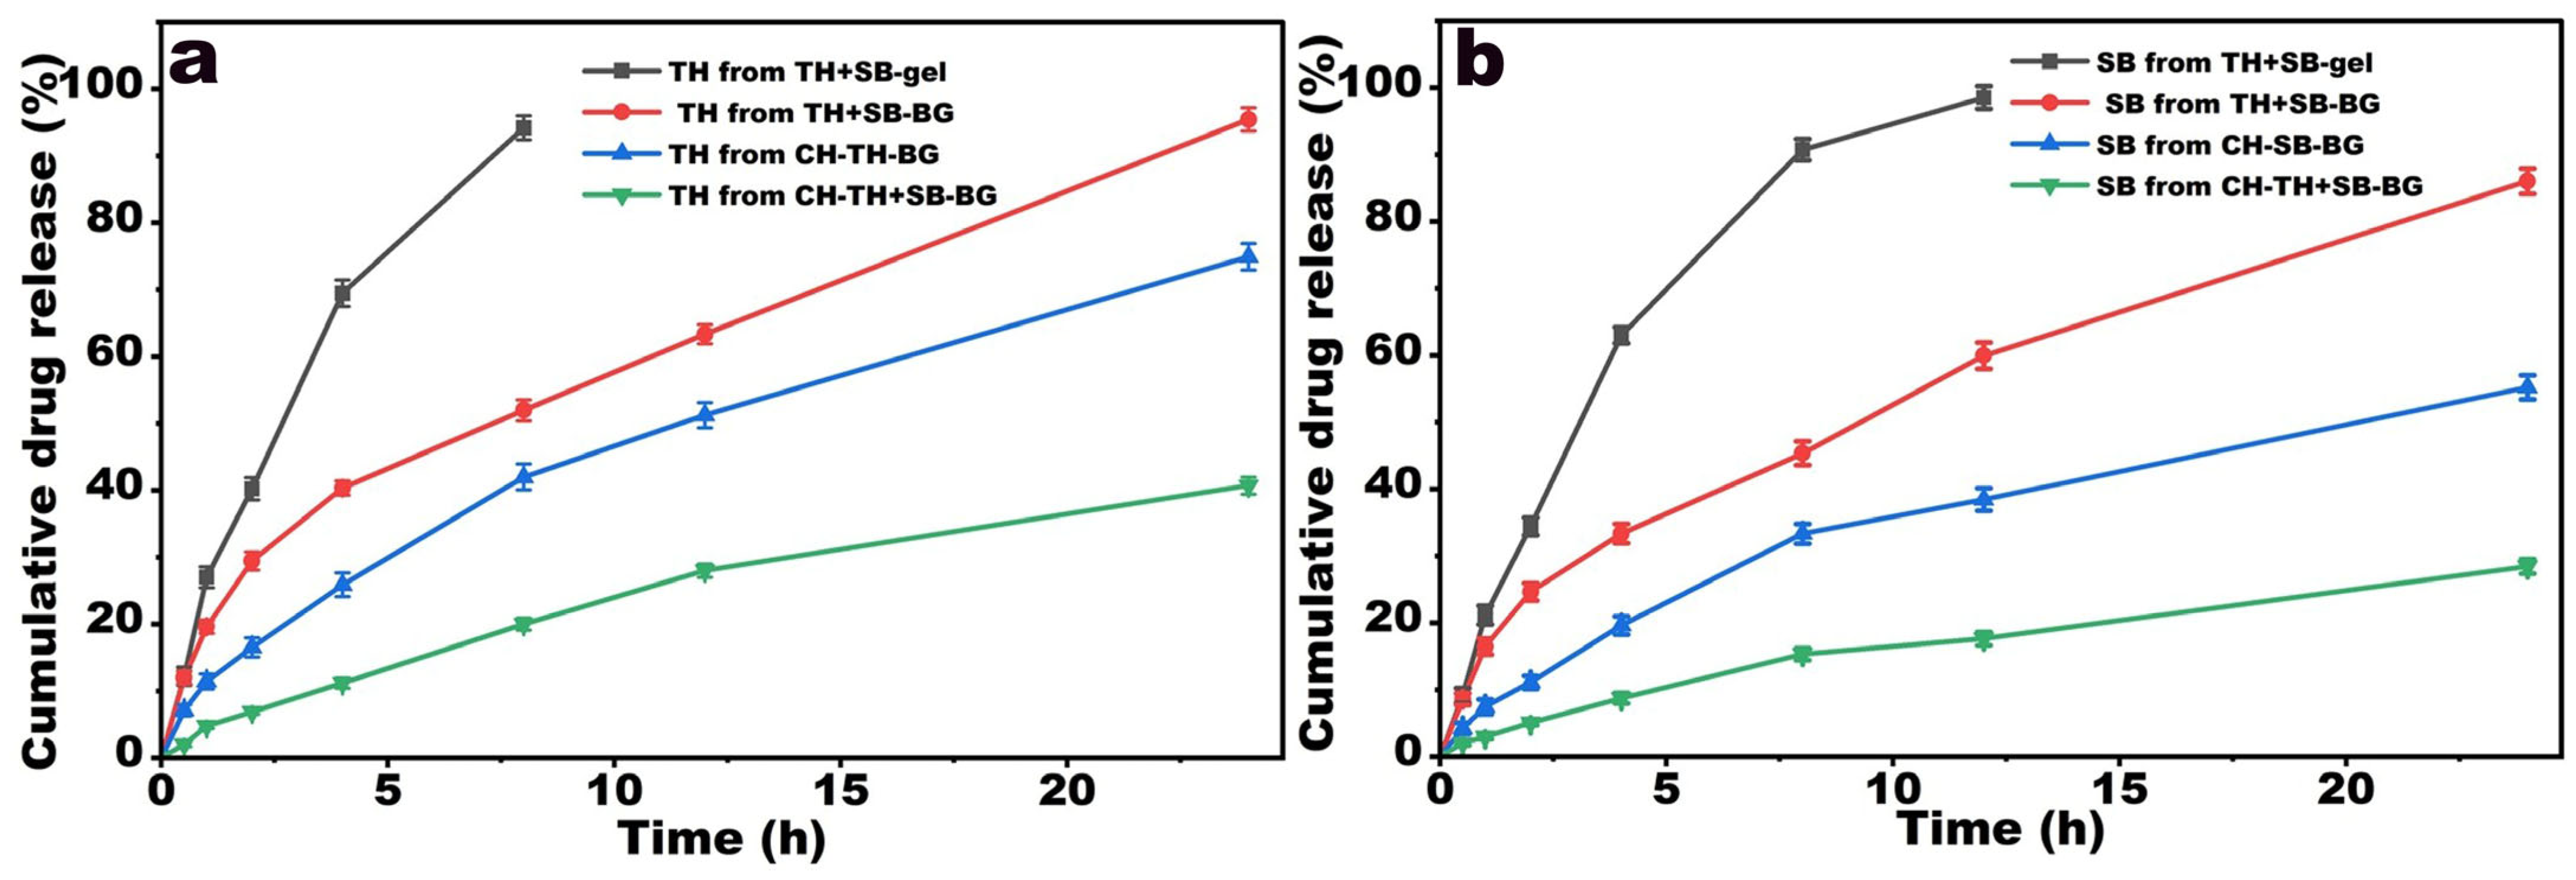
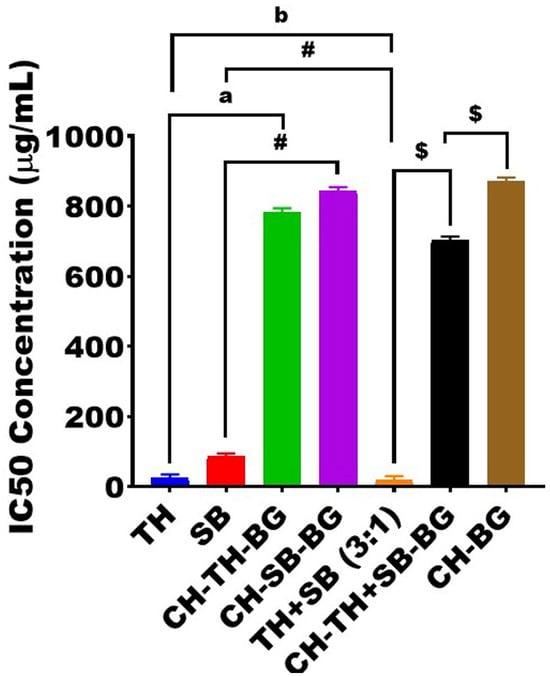
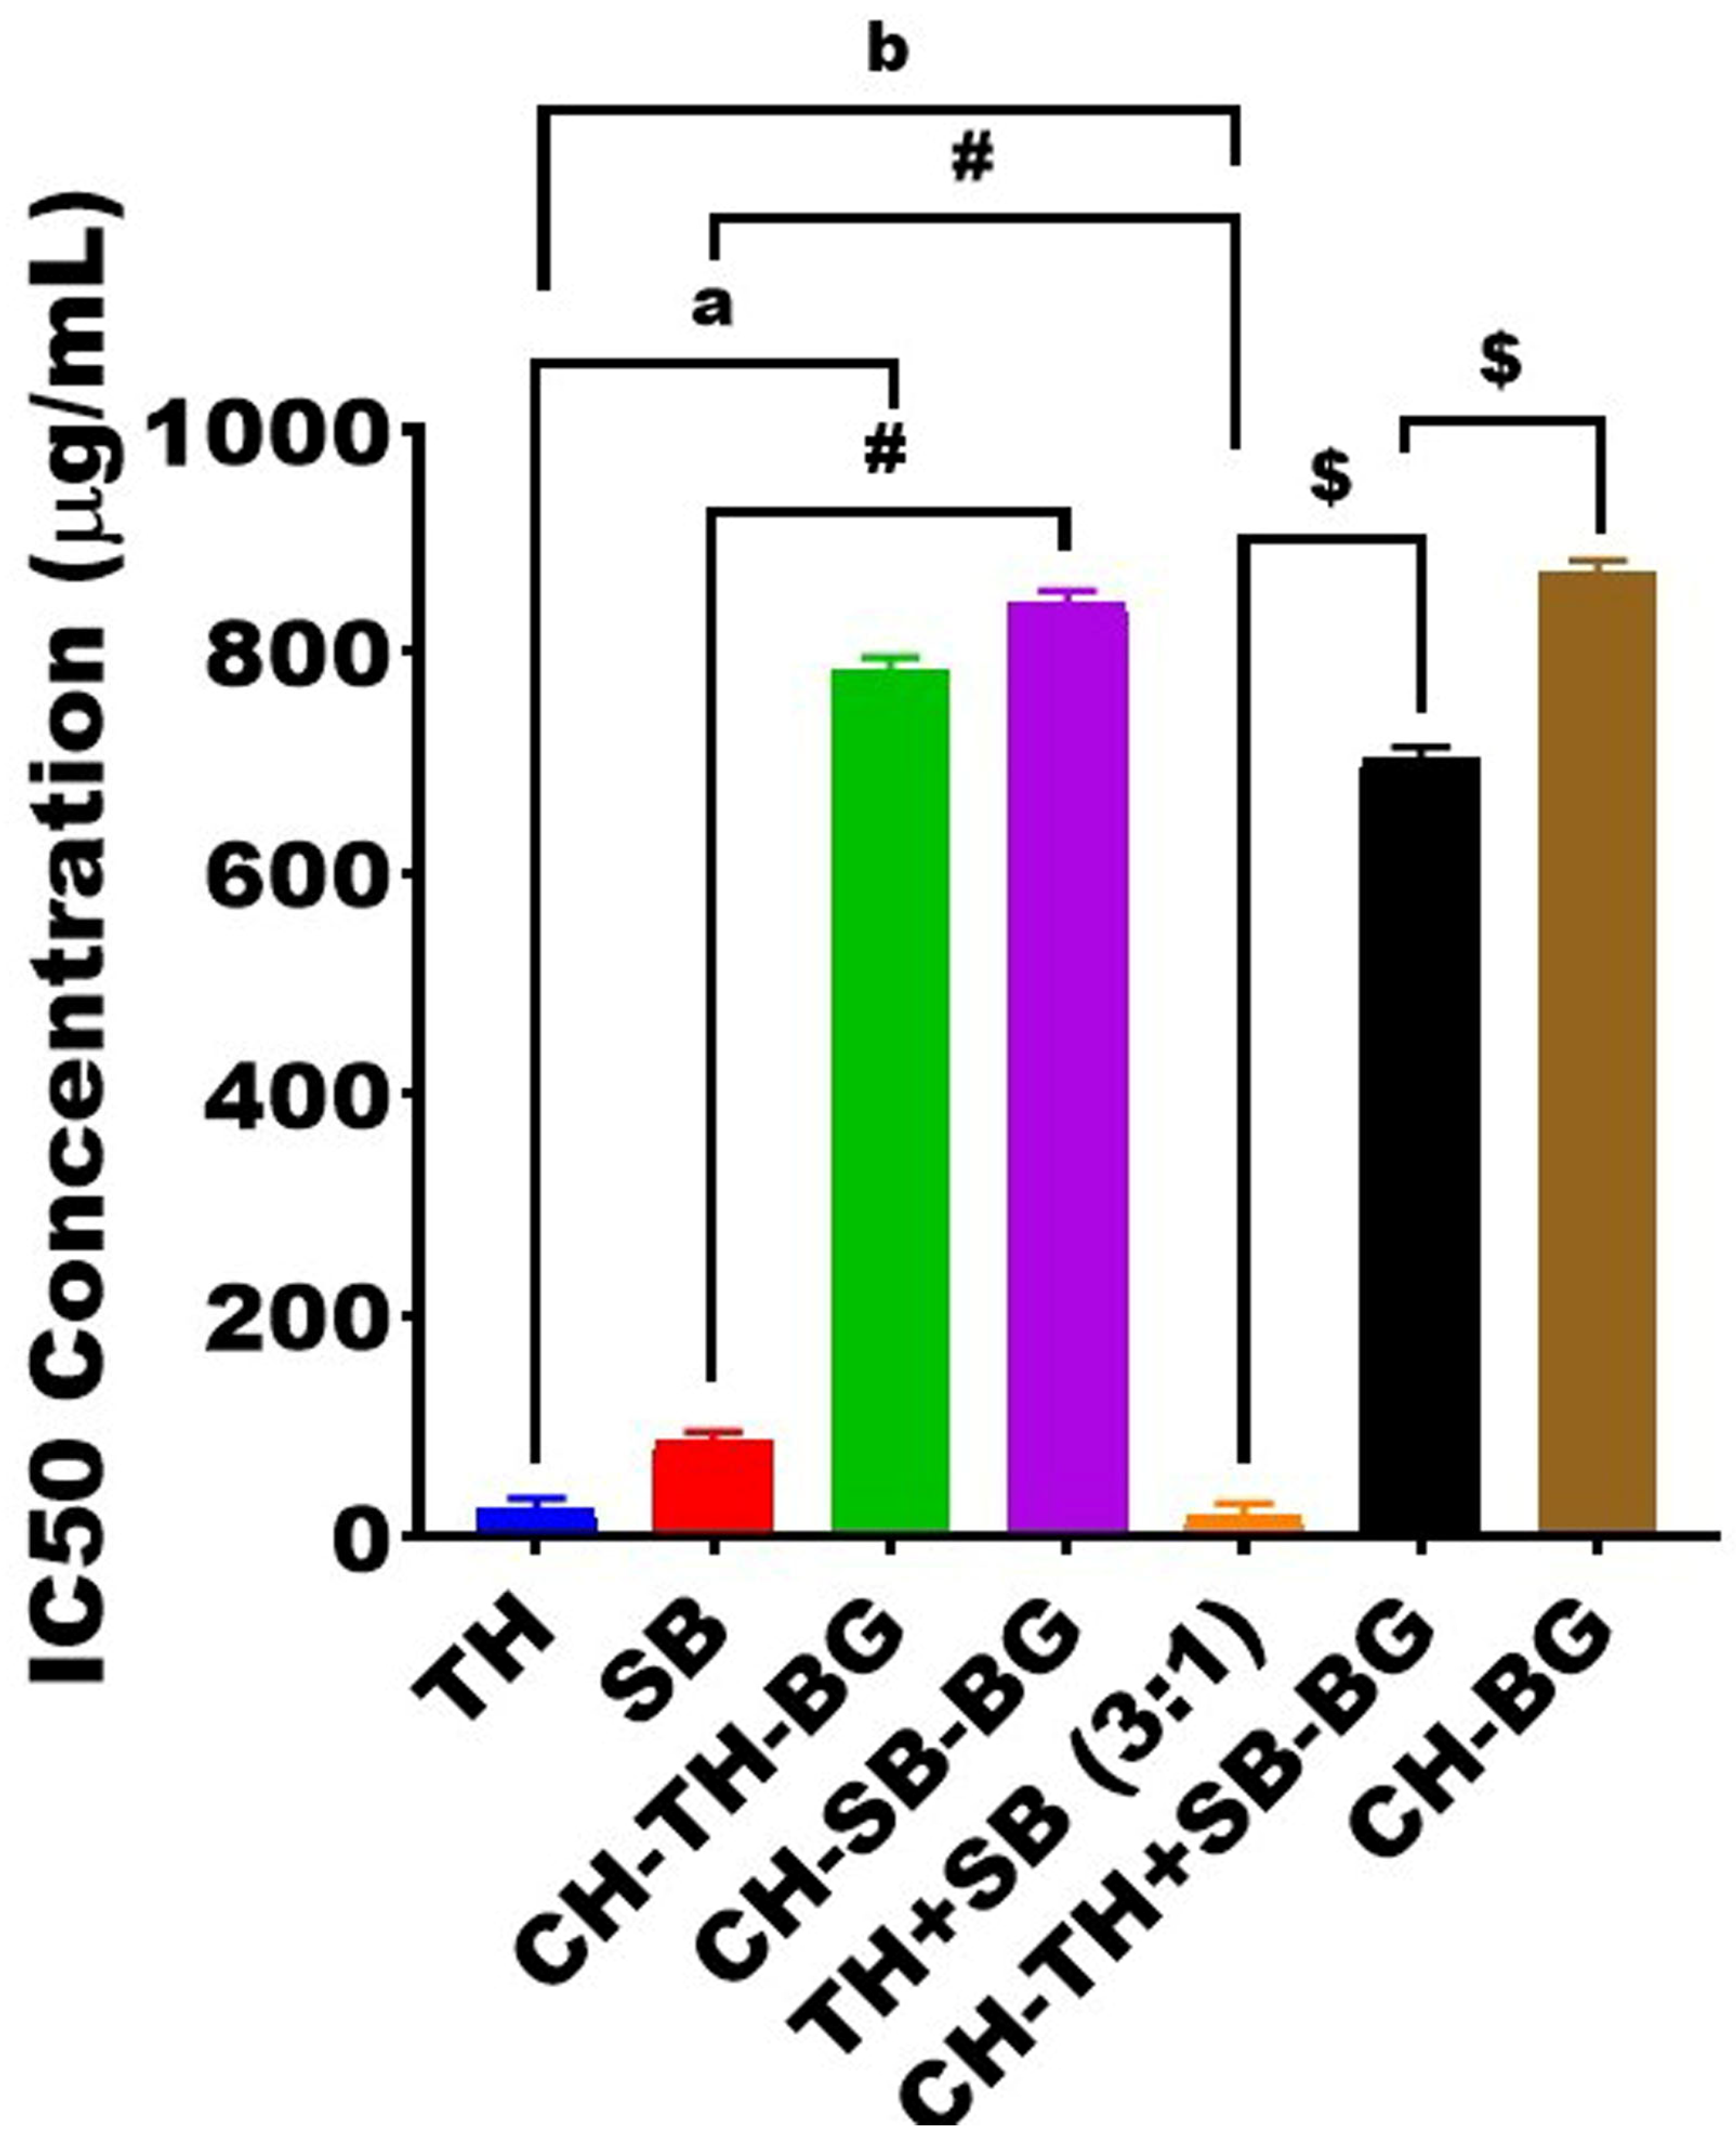
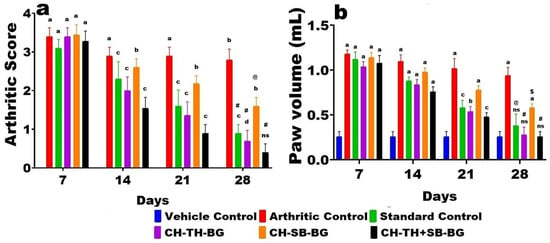
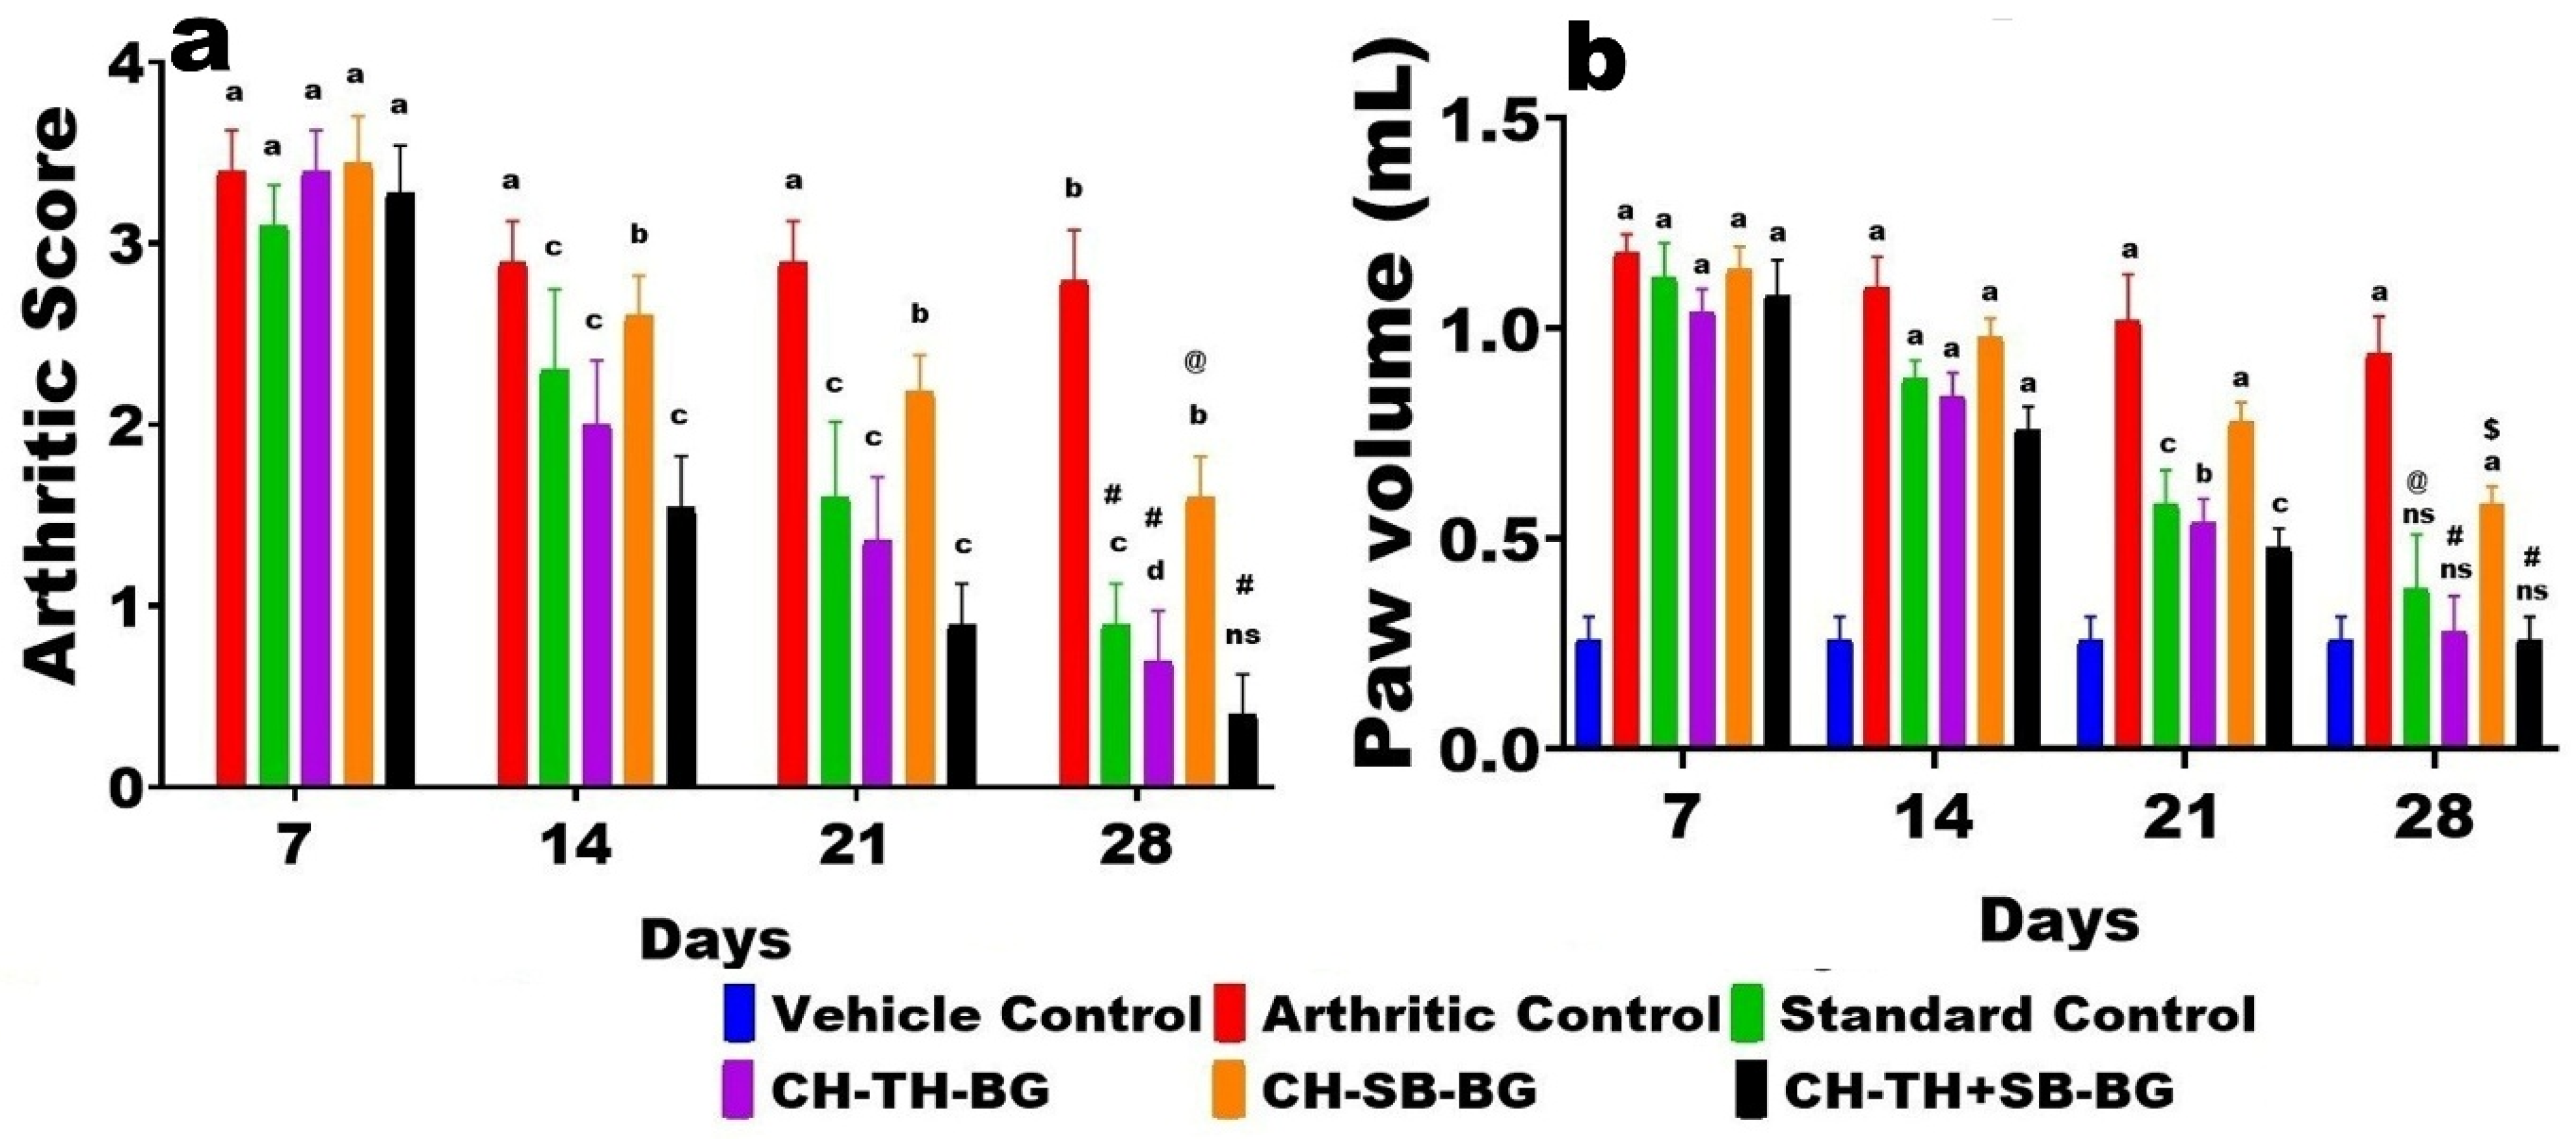
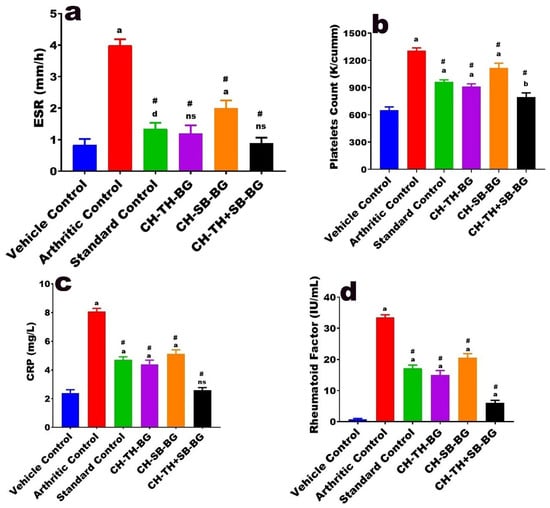
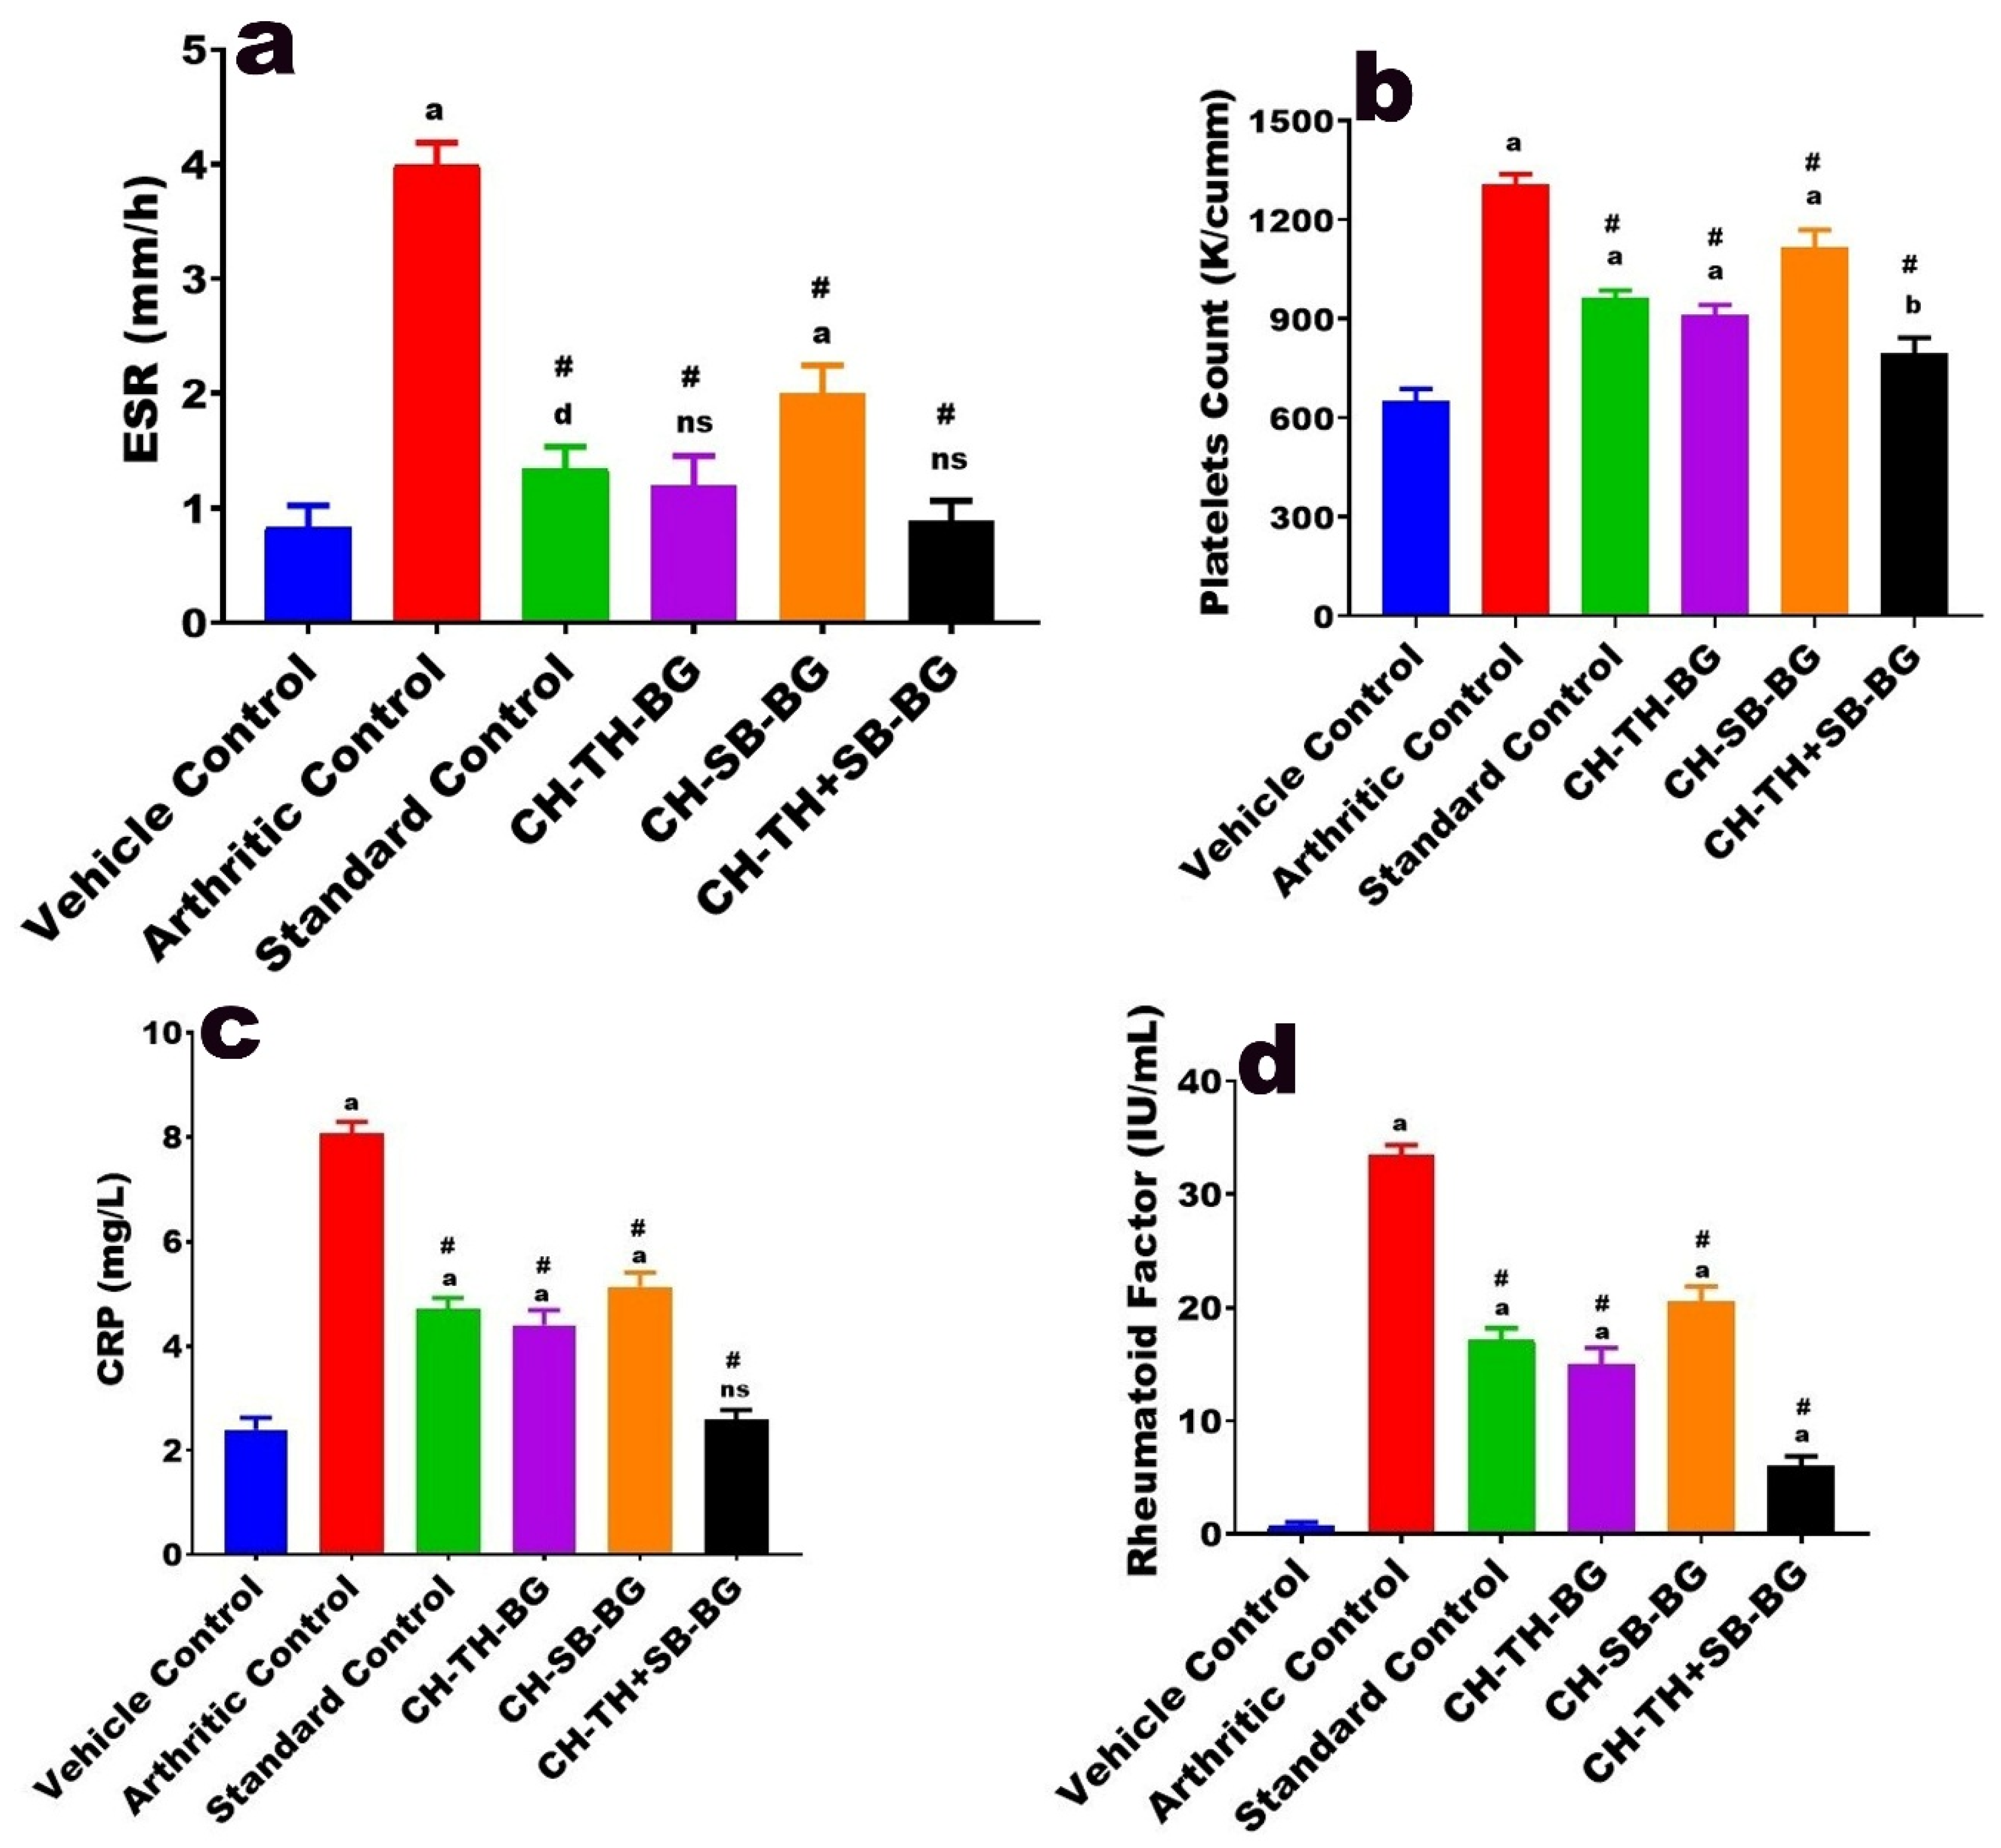
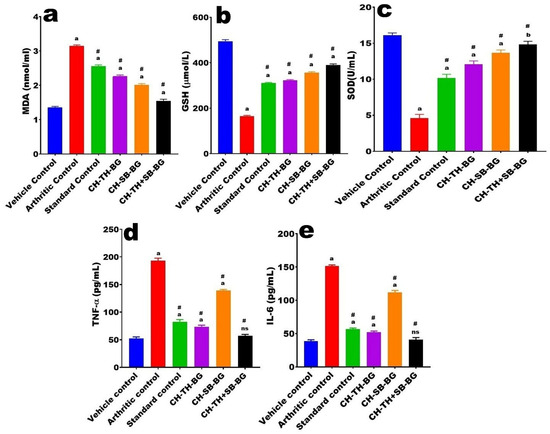
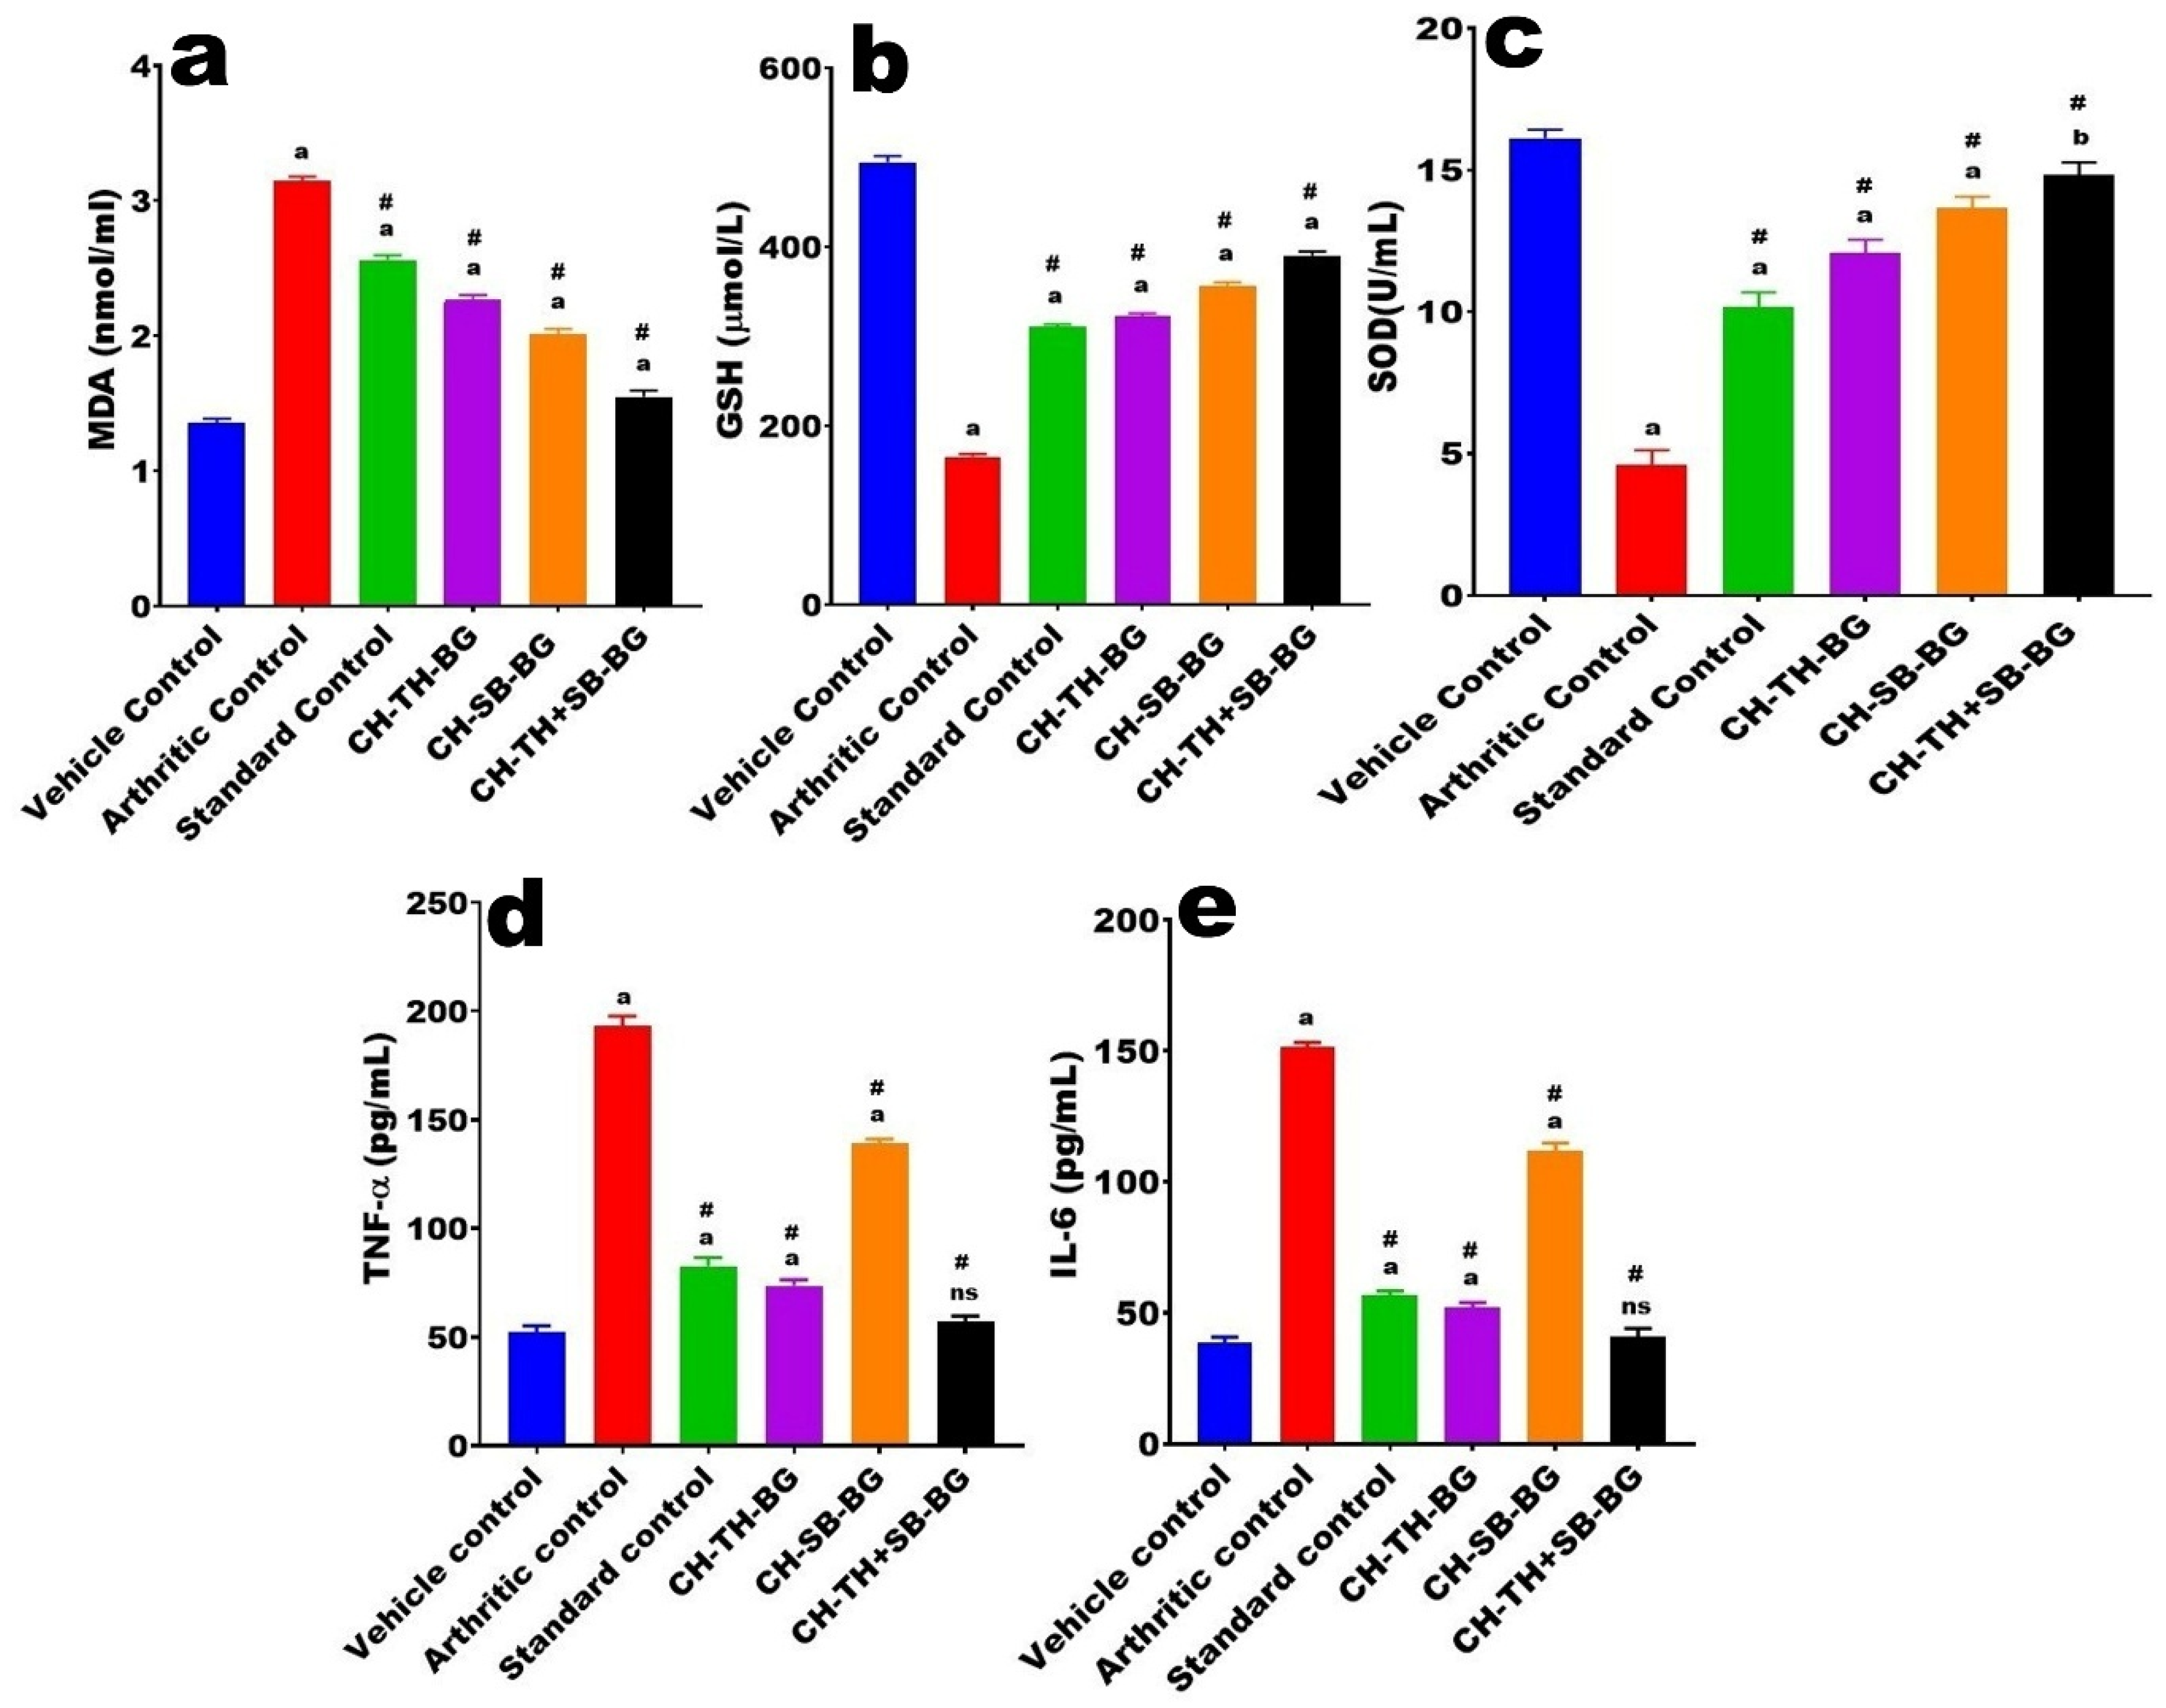
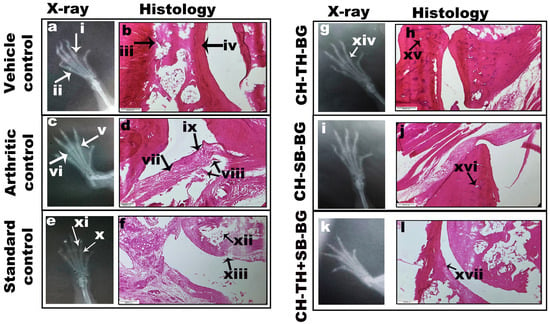
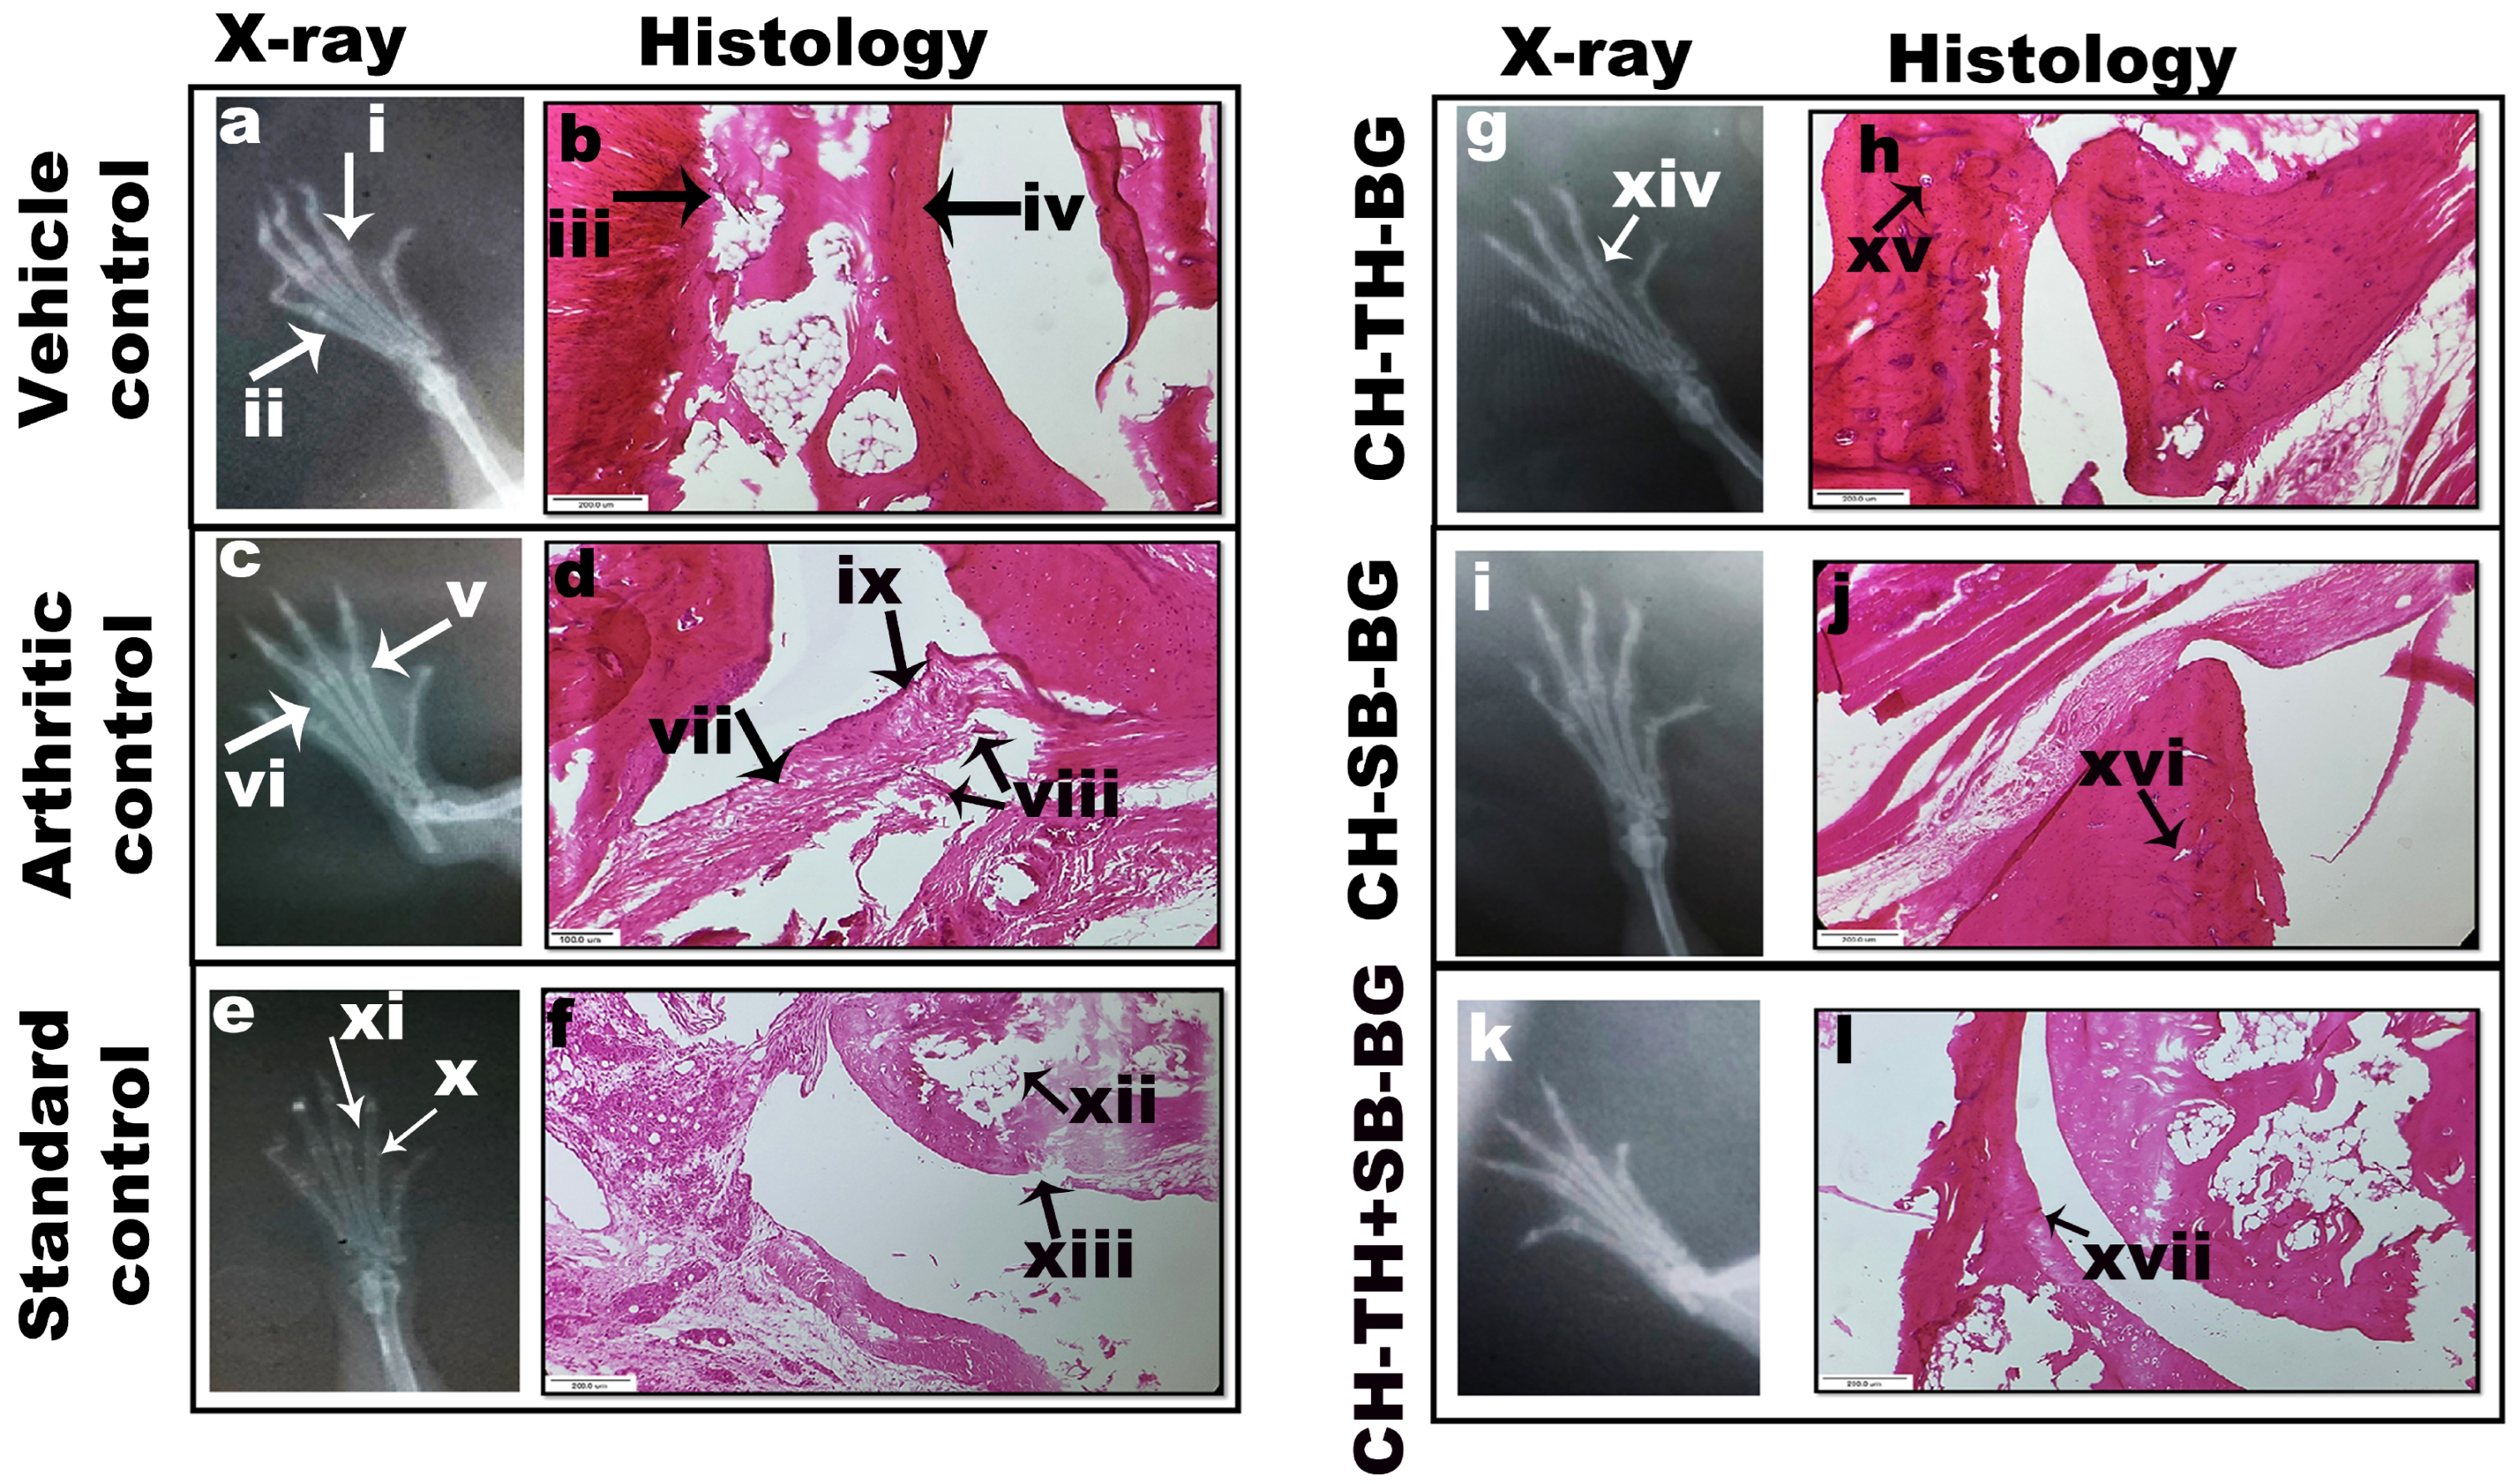

Disclaimer/Publisher’s Note: The statements, opinions and data contained in all publications are solely those of the individual author(s) and contributor(s) and not of MDPI and/or the editor(s). MDPI and/or the editor(s) disclaim responsibility for any injury to people or property resulting from any ideas, methods, instructions or products referred to in the content. |
© 2026 by the authors. Licensee MDPI, Basel, Switzerland. This article is an open access article distributed under the terms and conditions of the Creative Commons Attribution (CC BY) license.