


Abstract
Emotion recognition (ER) in human–computer interaction (HCI) holds immense potential for real-world applications, but traditional approaches based on electroencephalography (EEG) face challenges due to the complexity and impracticality of collecting and analyzing EEG data in ambulatory settings. This study explores electrodermal activity (EDA), a simpler measure of the sympathetic nervous system response that can be collected at multiple peripheral body sites, as a potential alternative for ER. We investigated the variable frequency complex demodulation (VFCDM) technique to analyze EDA and EEG signals and used deep learning models (ResNet50 and MobileNetV2) to classify arousal states (high arousal, HA vs. low arousal, LA). Our results show that EDA signals analyzed by VFCDM and classified by MobileNetV2 achieve promising performance, with an accuracy of 91.45%, comparable to the best EEG-based model (91.98%), in arousal classification. This suggests that EDA offers a viable and more practically accessible approach to ER in HCI compared to traditional EEG-based methods. Future work should explore larger and more diverse datasets, incorporate valence classification through multimodal fusion, and investigate the neural mechanisms underlying EDA-EEG interactions during emotional processing to further advance robust ER for HCI applications.
1. Introduction
Emotion is conceptualized as a complex multidimensional mental experience characterized by four primary dimensions: qualitative, hedonic, intensity, and temporal [1]. Emotions play a crucial role in influencing human behavior and action [2]. Emotion recognition (ER) holds significant promise within the domain of human–computer interaction (HCI) [3,4]. ER has traditionally relied on methods like electroencephalography (EEG) to capture central nervous system (CNS) responses [5]. However, the inherent complexity of EEG data analysis necessitates the exploration of alternative modalities [6]. Electrodermal activity (EDA), a measure of the sympathetic nervous system (SNS) response, offers a simpler and potentially more robust approach to ER [7]. ER can be easily collected from multiple peripheral body sites [8], making it practical for multiple applications. This work investigates the feasibility of leveraging EDA for emotion recognition in HCI applications.
The emotions are conceptualized through various frameworks, including discrete, dimensional, appraisal, and dynamic models [9,10]. Among these, the circumplex model proposed by Russell [11] has been widely preferred due to its continuous and comprehensive representation of emotional states. This model utilizes a two-dimensional space defined by arousal and valence. Arousal signifies the level of activation (low-calm or high-excited), or intensity associated with an emotional state. Conversely, valence reflects the hedonic dimension of emotion, encompassing both positive (pleasant) and negative (unpleasant) experiences [9]. In this work, we adopt Russell’s circumplex model to classify emotions based on their arousal (high vs. low) dimension.
Emotions can be recognized using physiological and non-physiological measures. Physiological signals, such as heart rate, EDA, and EEG, offer direct insights into the body’s responses to emotional stimuli [12]. These signals are popular in emotion recognition due to their high sensitivity to emotional arousal and relatively non-invasive nature [13]. Moreover, these signals are not easily controllable, making them more reliable representations of emotional states [14]. Among physiological signals, EEG and EDA are widely used for ER [15], each with distinct practical characteristics. EEG signal acquisition involves complex instrumentation and requires a brain source-localized electrode system for optimal signal acquisition. In contrast, EDA signals are reliable, low-cost, and non-intrusive [16], and as an index of SNS activity, are highly reliable for capturing the arousal dimension of emotion, reflecting sympathetic activation with sensitivity comparable to EEG for this specific dimension [8]. The pathway from brain to sweat gland stimulation is detailed in [17]. However, unlike EEG, which can capture both arousal and valence through markers such as frontal alpha asymmetry [18,19], EDA has recognized limitations in distinguishing valence [7]. This modality-specific strength of EDA in arousal detection directly motivates our focus on the arousal dimension in this study. The advantages and limitations of each modality are briefly described in Table 1.
Table 1.
Advantages and Limitations of EEG and EDA Modalities for Emotion Recognition.
Understanding the intricate relationship between EDA and EEG signals in emotion recognition has been a subject of intense research. Several brain regions are implicated in the generation of these signals, including the amygdala, ventromedial prefrontal cortex (vmPFC), and anterior cingulate cortex (ACC). Previous work identified a network of brain regions involved in regulating sympathetic arousal, which subsequently influences peripheral EDA [20]. The amygdala is activated by emotional stimuli and influences ANS responses such as skin conductance [21]. The vmPFC is associated with emotion regulation and reward processing, while the ACC is involved in emotional salience and attention [20,22]. Moreover, Critchley et al. (2002) and Nagai et al. (2004) highlighted the co-variation between EEG signals and EDA, implicating regions such as the hypothalamus, amygdala, prefrontal cortex, and brain stem in emotional and cognitive processes [20,22]. EEG studies utilizing statistical methods have revealed patterns associated with emotional stimuli, suggesting a link between EEG activity and ANS responses [23].
EEG asymmetries, particularly in the frontal lobes, have been associated with approach and withdrawal emotional processes [18,19], suggesting a role in emotion regulation [24]. The amygdala’s involvement in emotional processing extends to its influence on visceral responses, including EDA, respiration, and hormonal responses [18,21]. Additionally, Davidson et al. (2000) emphasized the role of the prefrontal cortex in emotional processes and its connectivity with the amygdala, underscoring the interplay between cortical and subcortical regions in emotion regulation [18]. Recently, Banik et al. (2024) highlighted the interaction of the central-peripheral nervous system during emotion [25]. These findings highlight the complex interplay between brain regions in generating physiological responses used for emotion recognition [25]. Both EDA and EEG offer valuable insights into emotional states, with EDA reflecting autonomic nervous system activity and EEG capturing cortical activity [26,27].
However, both EEG and EDA signals exhibit non-stationary and non-linear characteristics. Traditional time and frequency domain analysis methods may struggle to capture the intricate dynamics of these signals effectively [28]. Time-frequency (TF) analysis offers a promising approach to overcome these limitations by providing insights into the frequency components of signals over time. Previous studies have utilized various TF methods for emotion recognition in both EEG and EDA signals, including Short-time Fourier transform [29,30], Choi–Williams distribution [30,31], Wavelet Transforms [32], Hilbert–Huang Transform [33], and Empirical mode decomposition [34]. While these methods have provided valuable insights, there is a recognized need for more precise and high-resolution TF techniques to accurately capture the complex dynamics of emotional states. Wang et al. [35] have extensively discussed the limitations of certain existing time-frequency analysis methods, highlighting the necessity for advancements in this domain. To address these challenges, in this study, we propose the variable frequency complex demodulation (VFCDM) approach. This novel technique aims to offer enhanced precision and resolution in analyzing EEG and EDA signals, thereby enabling more accurate characterization of emotional states. This approach is extensively documented in prior literature [35,36] and validated with various physiological signals, including blood pressure [35], heart rate variability [37], and electrodermal activity [38,39].
Furthermore, a comprehensive evaluation of the suitability of the TF spectrum of EDA and EEG signals is crucial for effective ER. The performance of an ER system depends on the accurate representation of the underlying physiological processes. Hence, the selection and extraction of dominant, critical, and most relevant features is necessary for better ER [40]. Deep learning techniques have emerged as powerful tools for extracting useful information from TF spectrograms. Previous researchers have employed various convolutional neural networks (CNNs) to analyze the TF representations of physiological signals comprehensively [40,41]. In this study, we focus on exploring the effectiveness of ResNet50 and MobileNetV2 architectures for ER tasks due to their well-documented advantages in handling complex data structures, efficient parameter utilization, and robustness to variations in input data characteristics [42].
- Novelty:
In this study, we introduce the VFCDM approach, a novel technique for analyzing EDA and EEG signals in emotion recognition. VFCDM offers enhanced precision and resolution in capturing the complex dynamics of emotional states by providing a more accurate representation of the TF spectrum.
- Significant Contributions:
- Investigation of EDA as a simpler and potentially more practical alternative to EEG for ER in HCI applications.
- Proposal of the VFCDM technique for enhanced precision and resolution in analyzing EEG and EDA signals.
- Evaluation of the effectiveness of ResNet and MobileNet architectures for ER tasks using VFCDM TF spectrograms.
- Comprehensive analysis of VFCDM-derived TF representations of EDA and EEG signals for characterization of physiological dynamics associated with emotional arousal.
This paper is organized as follows. Section 2 describes the materials and methods, including the DEAP database used for signal acquisition, the VFCDM algorithm employed for time-frequency spectrum generation, and the deep learning architectures (ResNet50 and MobileNetV2) used for arousal classification. Section 3 presents the results, including representative time-frequency spectrograms of EEG and EDA signals and the classification performance of all models across both modalities. Section 4 provides a detailed discussion of the findings, their implications for HCI-based emotion recognition, and the limitations of the current study. Finally, Section 5 presents the conclusions and directions for future research.
2. Materials and Methods
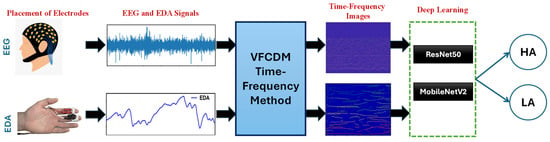
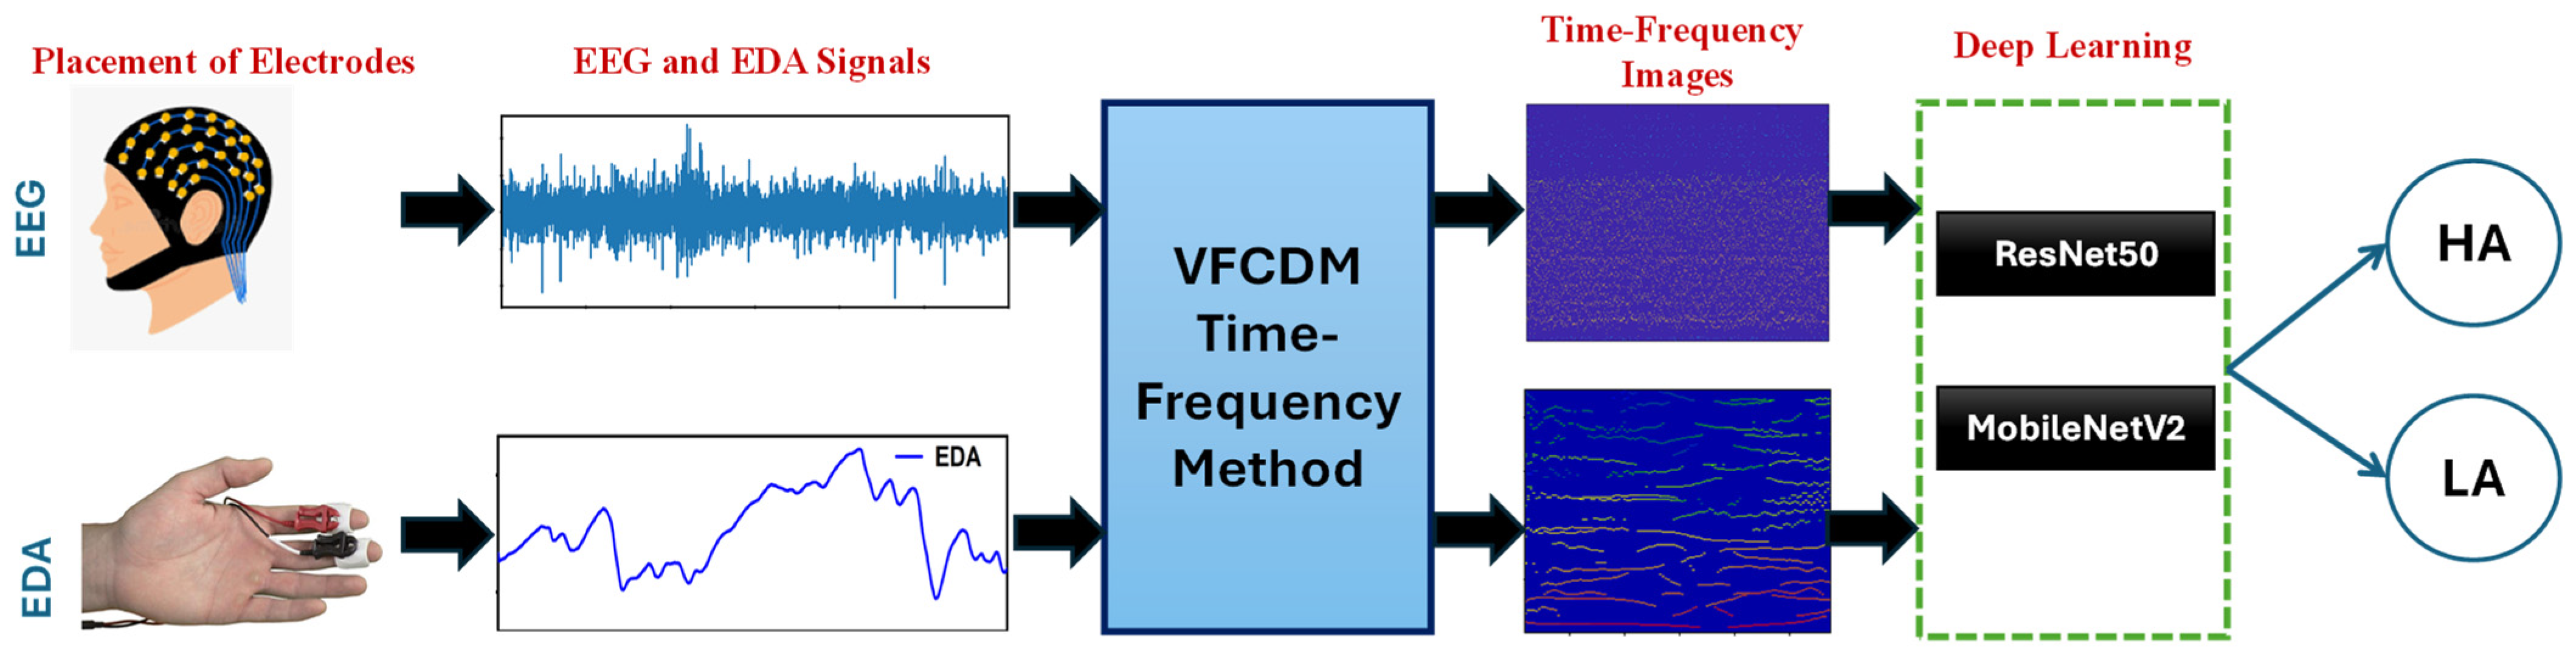
The methodology employed in this study is described in a step-by-step manner in this section and graphically represented in Figure 1. Initially, we obtain the EEG and EDA signals from the DEAP database [43]. Subsequently, we generate the TF spectrum of these signals using the VFCDM algorithm. The resulting TF images are then utilized as inputs to DL networks, specifically ResNet50 and MobileNetV2, for the classification of HA and LA dimensions of emotional states.
Figure 1.
Block diagram of the proposed methodology.
2.1. Database Used for Collecting EEG and EDA Signals
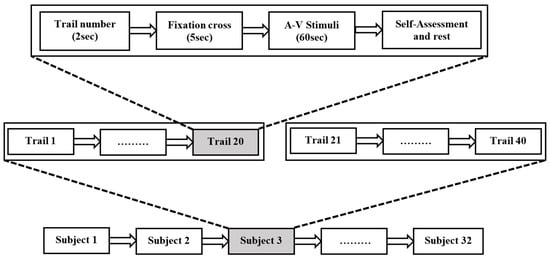
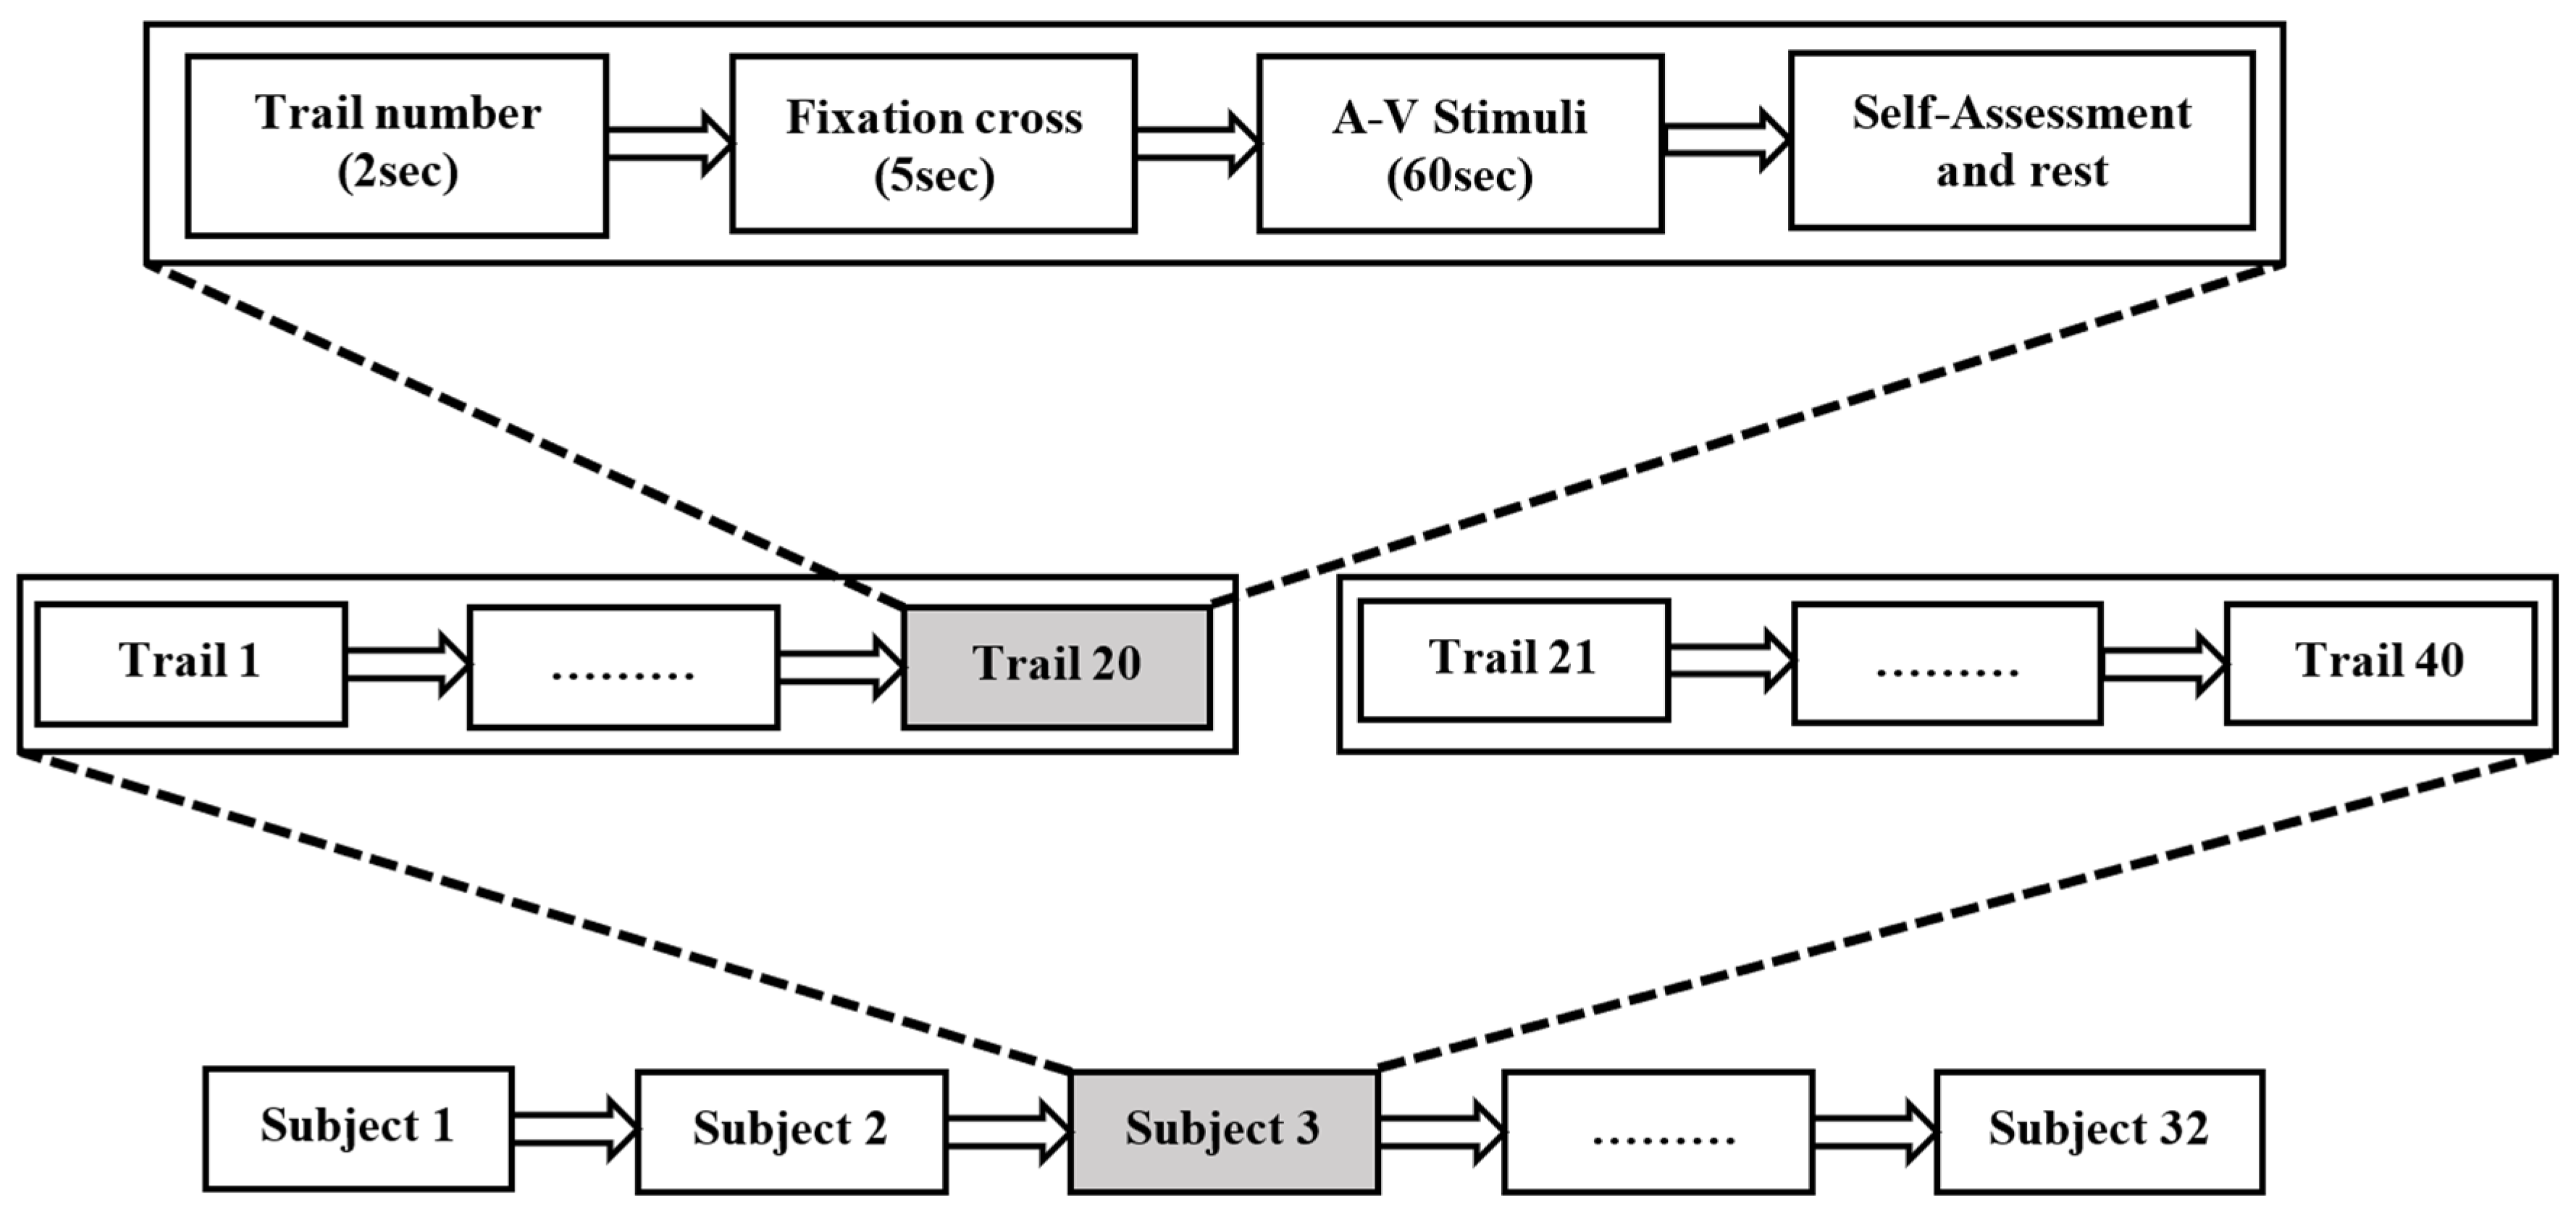
The DEAP database comprises physiological signals from 32 healthy volunteers, each subjected to 40 distinct 60 s-long audio-visual stimuli. The EDA and EEG signals were recorded using a Biosemi ActiveTwo system at a sampling rate of 512 Hz and subsequently downsampled to 128 Hz per channel. EEG signals were recorded using the international 10–20 system with 32 channels, all of which were included in the analysis, while EDA was recorded using a single peripheral channel. Additionally, participants’ self-assessment of their emotional states was collected using a SAM (Self-Assessment Manikin) scale ranging from 1 to 9. The emotional state was defined as high if the Arousal/Valence score was greater than 4.5 and low if the score was less than 4.5. The dataset contains a total of 1280 trials (32 subjects × 40 trials), with 815 trials categorized under the High Arousal (HA) group and 465 trials under the Low Arousal (LA) group. Each trial was treated as one classification instance for both EEG and EDA analyses [28]. Table 2 provides a comprehensive overview of the demographic characteristics of the study participants, while Figure 2 visually represents the experimental protocol described in [43].
Table 2.
Subject Demographic Characteristics.
Figure 2.
Description of the experimental protocol employed as per Koelstra et al., 2012 [43].
The study utilized the preprocessed version of the DEAP dataset. In this dataset, EEG signals were band-pass filtered between 4 and 45 Hz, re-referenced to a common average reference, and corrected for EOG-related artifacts. Both EEG and EDA signals were downsampled to 128 Hz and segmented into 63 s trials consisting of a 3 s baseline followed by a 60 s stimulus period. Baseline correction was applied as part of the DEAP preprocessing pipeline, wherein the mean value of the 3 s baseline period was subtracted from the corresponding 60 s stimulus segment for each trial and each channel. This correction accounts for inter-subject variability and signal drift inherent to EDA measurements [43]. Consequently, all VFCDM analysis and deep learning classification in this study were performed on baseline-corrected signals. The EEG signals in the DEAP dataset are represented in microvolts (µV) and EDA signals in microsiemens (µS). No additional amplitude-threshold rejection, noisy-trial exclusion, z-score normalization, or channel-quality assessment procedures were applied beyond the standard DEAP preprocessing pipeline. Additional modality-specific downsampling was applied only to EDA signals before VFCDM processing, while EEG signals retained their sampling rate.
2.2. VFCDM Algorithm for Generating TF Spectrum
Our analysis employs the TF Spectrum obtained from EEG and EDA signals to capture the changing dynamics within the central nervous system and peripheral sympathetic response during Arousal. The core of our analysis centers on the VFCDM technique.
VFCDM was selected because it provides adaptive frequency tracking and improved amplitude preservation compared to fixed-resolution TF techniques. The steps involved in the VFCDM algorithm to estimate the TF spectrum of EEG and EDA signals are:
2.2.1. Complex Demodulation with Fixed Center Frequencies
- a)
- Fixed Center Frequency Selection: A set of normalized center frequencies are chosen, typically ranging from low to high values.
- b)
- Complex Demodulation: The signal is multiplied by the complex exponential term , at each center frequency. This essentially shifts the frequency components of the signal around the chosen center frequency.
- c)
- Low-Pass Filtering: A low-pass filter (LPF) eliminates unwanted low-frequency components from the complex-demodulated signal.
- d)
- Instantaneous Amplitude and Phase Extraction: The Hilbert transform is applied to the filtered signal to extract the instantaneous amplitude and phase at each time point.
- e)
- Signal Reconstruction and TFR Estimation: The instantaneous amplitude and phase information are used to reconstruct the signal for each center frequency using the formula provided in Equation (1). This initial reconstruction provides a coarse estimate of the TFS.
2.2.2. Refinement with Dynamic Center Frequencies
This step refines the time-frequency resolution by extracting the dominant modes of interest.
- a)
- Dynamic Center Frequency Selection: Based on the dominant spectral components identified in the initial TF spectrum estimate, time-varying center frequencies are determined.
- b)
- Variable Frequency Demodulation: Similar to step 1b, the signal is multiplied by the complex exponential term at each time-varying center frequency.
- c)
- Amplitude and Phase Extraction: The filtered signals obtained after step 2b undergo the same process as step 1c to extract instantaneous amplitude and phase at each time point.
- d)
- Signal Reconstruction: The instantaneous amplitude and phase information are used to reconstruct the signal for each time-varying center frequency using the formula provided in Equation (2).
- e)
- Refined TFR Estimation: The Hilbert transform is applied to the reconstructed signals from step 2d to extract the final, refined instantaneous amplitudes and frequencies. These are then combined to create a more accurate TFS representation.
In this study, VFCDM analysis was implemented using specific parameter settings to ensure reproducibility.
For EDA signals, VFCDM analysis was performed on the preprocessed signals at 128 Hz sampling rate. A high-pass filter with a cutoff frequency of 0.01 Hz was applied, and VFCDM reconstruction was restricted to the 0.045–0.25 Hz band. This frequency range corresponds to the sympathetic nervous system activity band of EDA, which has been established in prior literature as the most informative spectral region for capturing autonomic arousal responses [44]. The analysis band is well within the Nyquist limit of 64 Hz at 128 Hz sampling rate, precluding any aliasing concerns.
For EEG signals, VFCDM analysis was performed using the preprocessed EEG signals at 128 Hz sampling rate. The analysis focused on oscillatory activity within the 4–45 Hz band. Time-frequency representations were computed separately for each channel and later combined to generate a unified TF representation per trial.
The instantaneous amplitude obtained from the analytic signal was used to construct the TF spectrum. Instantaneous frequency at each time point was derived from the time derivative of the unwrapped instantaneous phase of the reconstructed analytic signal. These instantaneous frequency estimates were used only for descriptive characterization of representative VFCDM-generated TF spectra and were not used as quantitative features or direct inputs to the deep learning classification pipeline. The resulting TF matrices were normalized using min–max normalization and resized to match the input dimensions required by the deep learning networks. No additional window-based segmentation or smoothing was applied, and each trial was represented by a single TF image. For EEG analysis, TF representations from all 32 channels were combined to form a unified TF image per trial, whereas for EDA, the single-channel TF representation was directly used for classification. TF representations were first computed individually for each EEG channel. The channel-wise TF matrices were then averaged across channels to generate a single TF representation per trial. This spatial averaging strategy was adopted to reduce dimensional complexity, suppress channel-specific noise, and enable a direct modality-level comparison between multi-channel EEG and single-channel EDA representations within a unified deep learning framework. Although this approach may reduce spatial specificity associated with regional neural dynamics such as frontal asymmetry, it provides a compact global representation of cortical activity suitable for the present comparative analysis. Future work will investigate channel-preserving tensor representations and region-of-interest (ROI)-based analysis to better exploit spatial information relevant to emotion processing.
For EEG analysis, time–frequency representations were generated by integrating information from all 32 channels to obtain a single representation per trial. Similarly, EDA signals were transformed into time–frequency representations using the VFCDM approach. Therefore, classification was performed at the trial level for both modalities, resulting in 1280 samples. After obtaining the TF spectra from EEG and EDA signals, these images are fed into ResNet50 and MobileNetV2 DL networks for arousal classification.
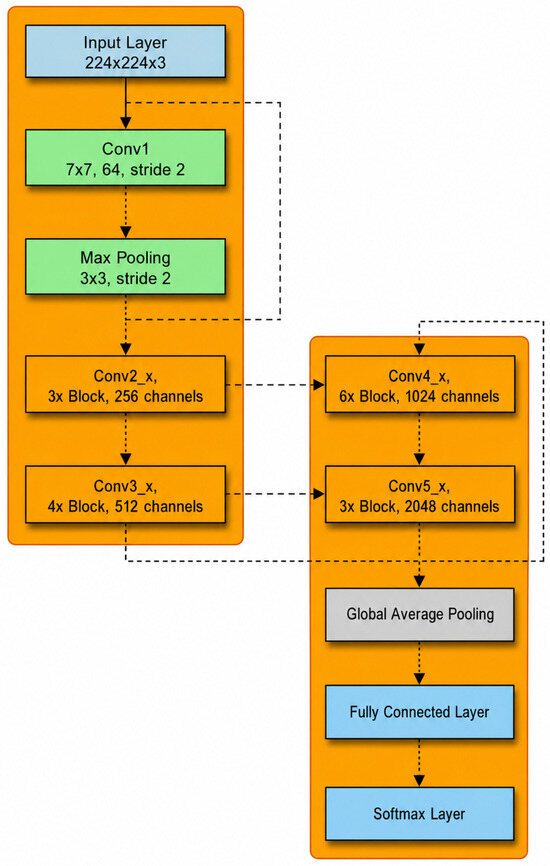
2.2.3. 50-Layer Residual Nets (ResNet50)
It is a deep CNN architecture introduced by Microsoft Research. The block diagram shown in Figure 3 depicts the structure of the ResNet50 architecture. The network comprises 50 layers, including convolutional layers, batch normalization, activation layers, and fully connected layers. The key feature of ResNet50 is the presence of residual blocks, which include skip connections that allow the gradient to flow directly through the network, mitigating the vanishing gradient problem. When used for arousal classification based on TF spectra, ResNet50 leverages its deep architecture to capture intricate patterns and features present in the TF images, facilitating accurate arousal classification [45].
Figure 3.
ResNet50 Architecture.
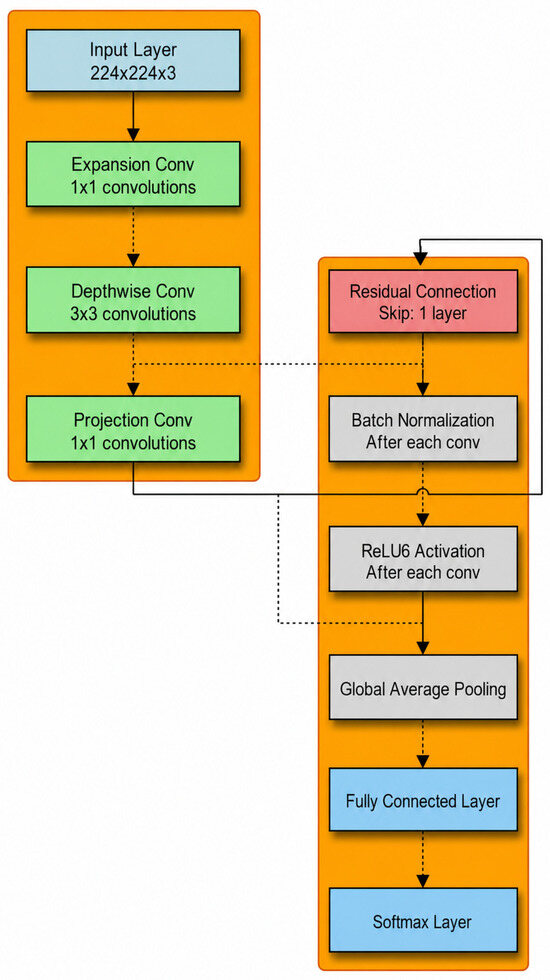
2.2.4. Mobile Architecture (MobileNetV2)
It is a lightweight deep neural network architecture developed by Google. It is specifically designed for mobile and embedded vision applications. The block diagram (Figure 4) illustrates the architecture of the MobileNetV2 model, which is optimized for mobile and edge devices. The network incorporates inverted residual blocks and linear bottlenecks to manage model size and computational efficiency. MobileNetV2 utilizes depth-wise separable convolutions, which split the convolution operation into depth-wise and pointwise convolutions, significantly reducing the computational cost and model size [46].
Figure 4.
MobileNetV2 Architecture.
We utilized the Adam optimizer with a fixed learning rate of 0.001—maintained constant throughout training without any scheduling or decay strategy—and a batch size of 32 for training the deep learning networks. The Adam optimizer’s internal adaptive moment estimation was considered sufficient to ensure stable convergence in conjunction with the early stopping criterion applied [47,48]. Training was performed for up to 20 epochs, with early stopping based on validation loss to prevent overfitting. If validation performance did not improve for five consecutive epochs, training was terminated. These parameters were selected to balance computational efficiency and model performance while ensuring stable and reliable training. The performance of the deep learning networks was evaluated using accuracy (Acc), F1-score (F1), sensitivity (Sen), and area under the receiver operating characteristic curve (AUC), consistent with evaluation frameworks adopted in recent physiological signal classification studies [49,50]. The F1-score was considered particularly important as it provides balanced performance evaluation in the presence of class imbalance between high-arousal and low-arousal trials.
To ensure unbiased model evaluation and prevent data leakage, a Leave-One-Subject-Out Cross-Validation (LOSO-CV) strategy was employed for dataset splitting. In this approach, data from one subject were used exclusively as the test set, while data from the remaining subjects were used for model training. A validation subset was extracted from the training subjects, used exclusively for hyperparameter tuning and model selection, and not used during final performance evaluation. Dataset splitting was performed strictly at the subject level, ensuring that all trials and windowed segments for a given subject remained within the same fold. This strategy prevents overlap of samples originating from the same recording across training, validation, and testing sets. The LOSO-CV process was repeated for all subjects, and final performance metrics were obtained by averaging results across all folds. This subject-independent evaluation framework inherently accounts for inter-subject variability and provides a robust estimate of model generalization performance.
3. Results
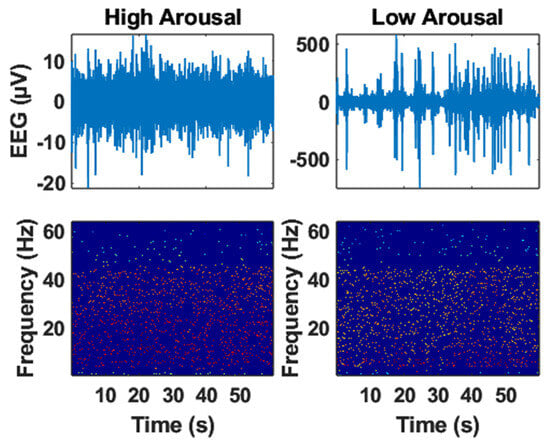
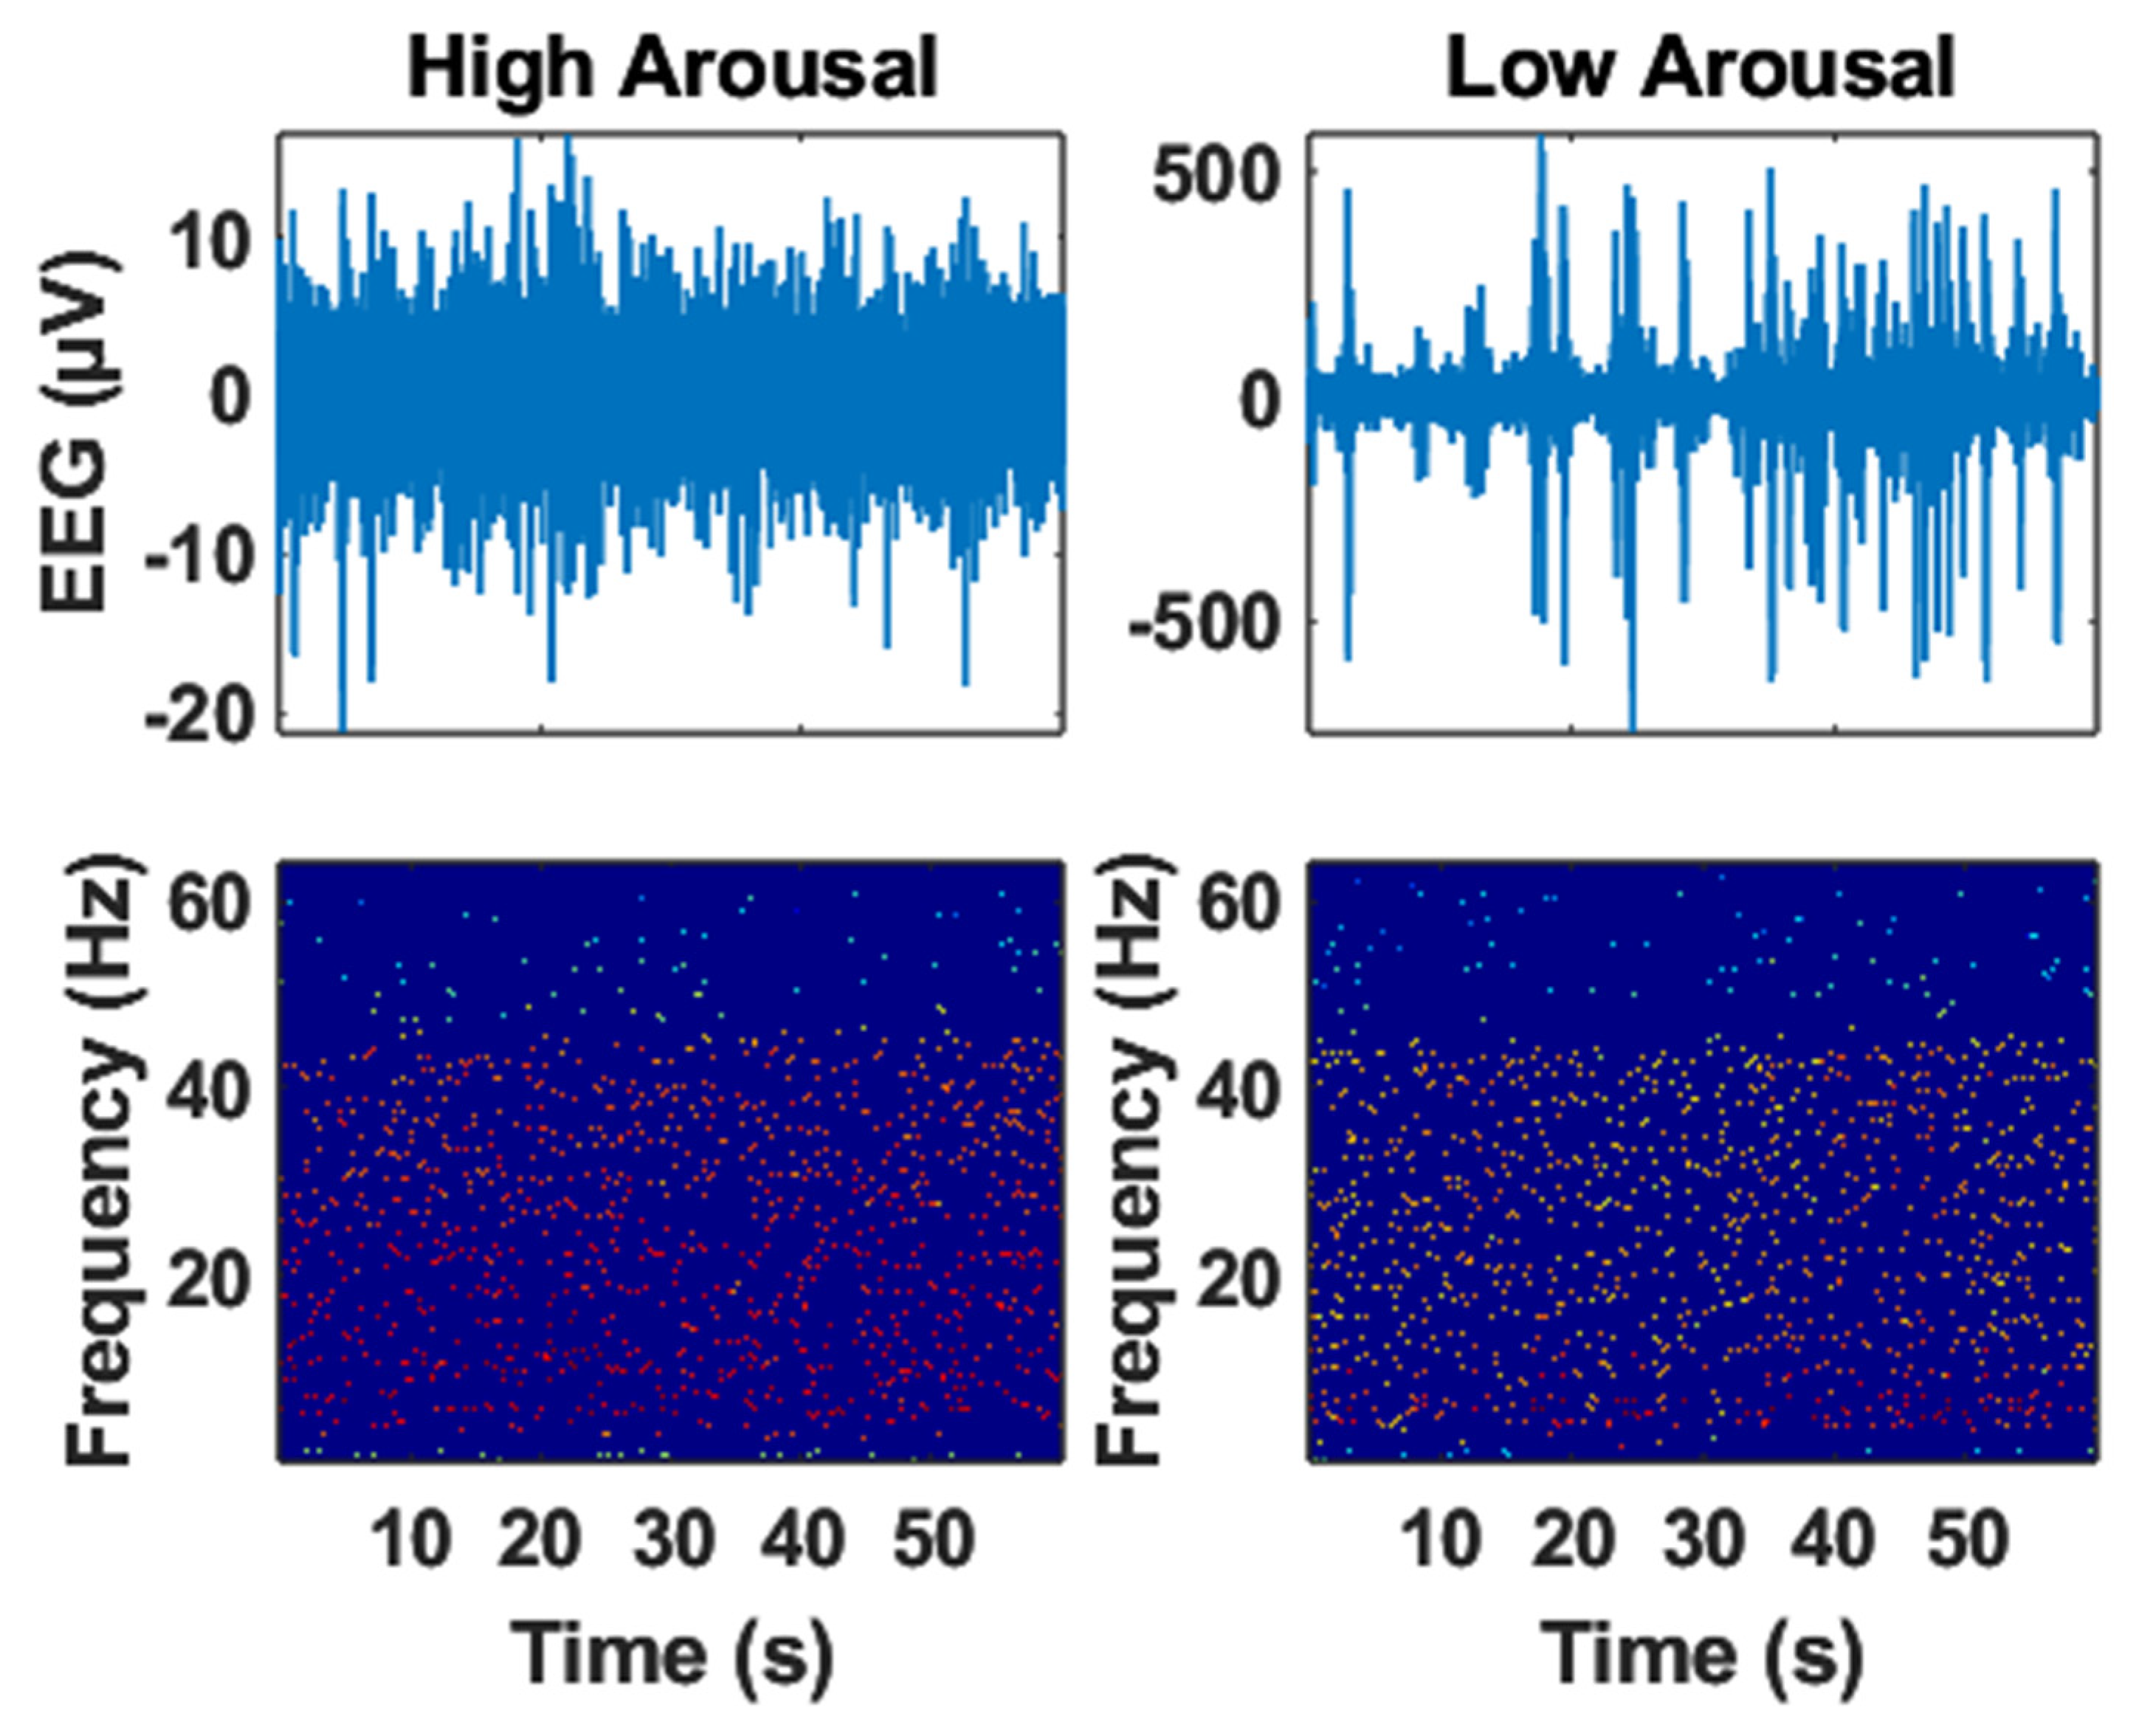
The EEG signals shown in Figure 5 exhibit observable differences between HA and LA states in terms of amplitude dynamics and spectral distribution. Variations in signal fluctuation patterns and energy characteristics suggest distinct cortical activity associated with different arousal conditions.
Figure 5.
The representative EEG and its Time-frequency spectrum in High and Low Arousal.
The EEG time–frequency spectrums shown in Figure 5 exhibit observable differences between HA and LA states in terms of spectral distribution, temporal fluctuation patterns, and energy concentration. Variations in the TF representations suggest distinct cortical dynamics associated with different arousal conditions. Differences were also observed in spectral energy distribution and signal variability between HA and LA states, indicating changes in EEG activity patterns across arousal conditions. Since formal statistical hypothesis testing was not performed for these spectral descriptors, these observations should be interpreted descriptively rather than inferentially.
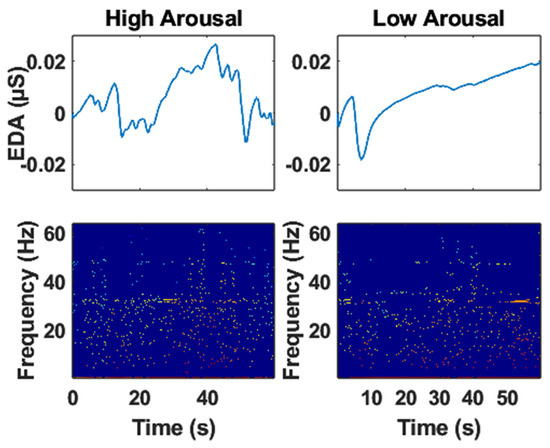
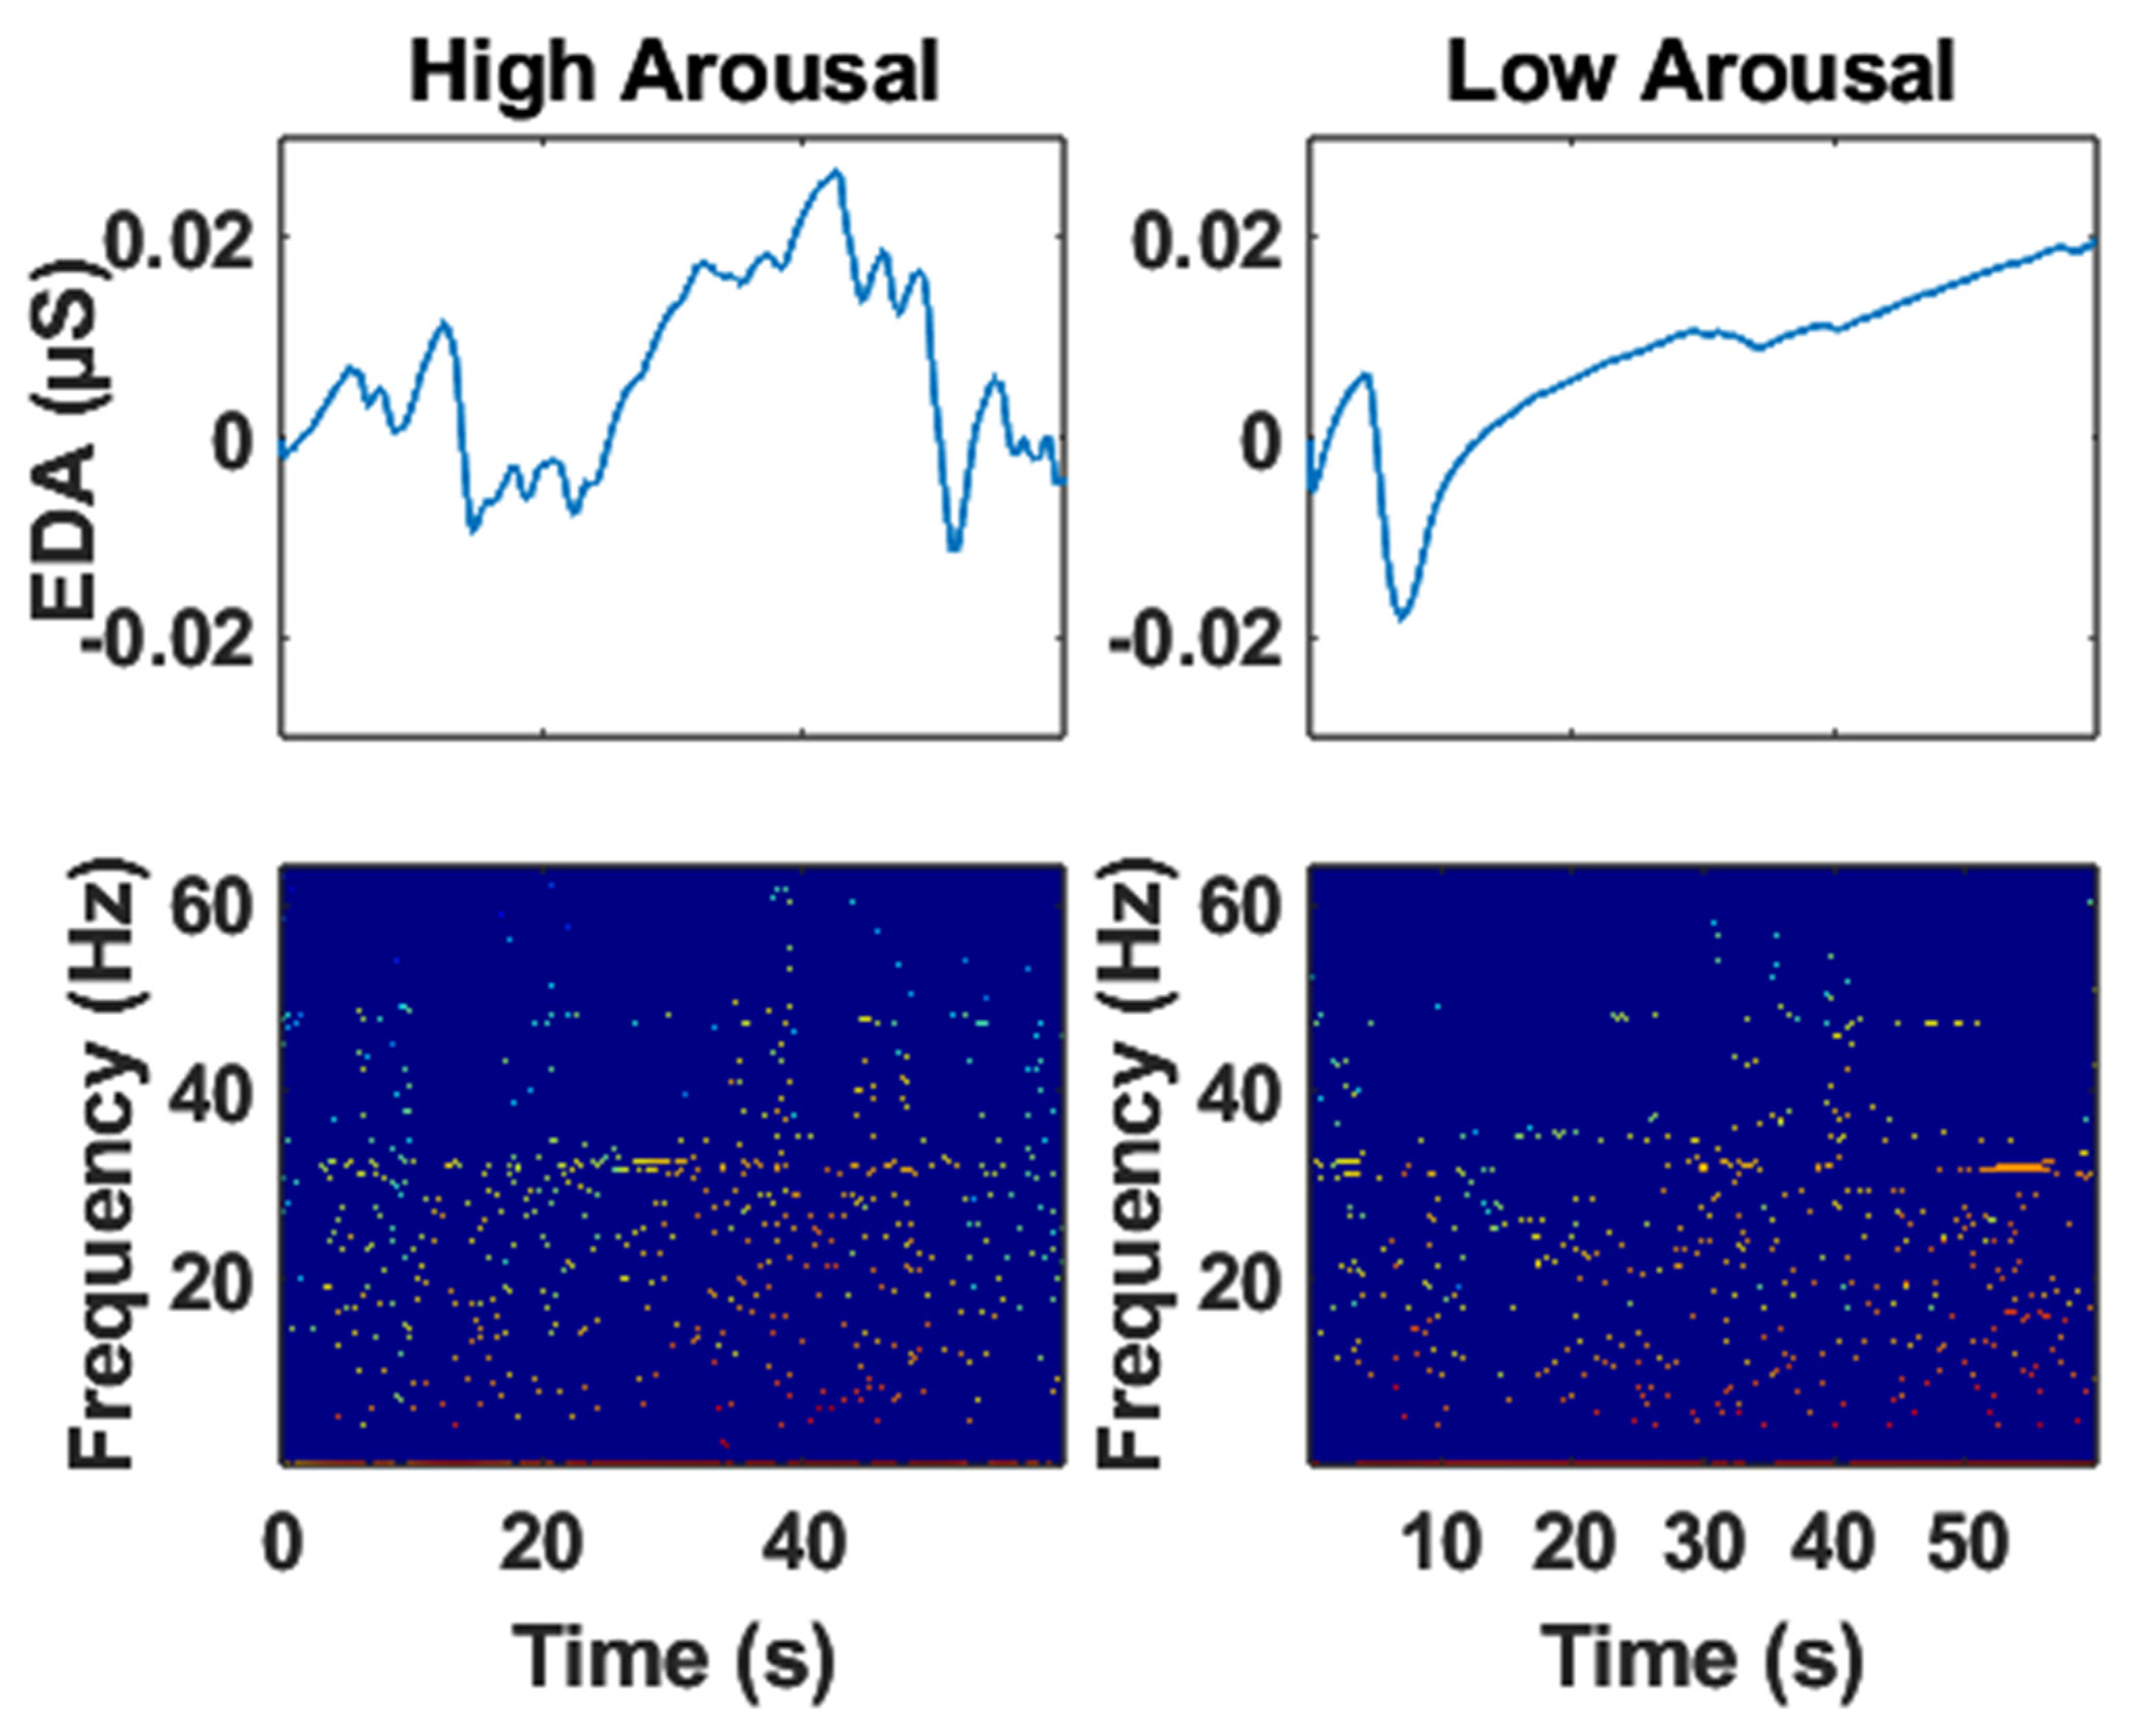
The EDA signal and its TF spectrum obtained using the VFCDM algorithm in HA and LA are shown in Figure 6. EDA signals exhibit observable differences between HA and LA states. In HA, skin conductance shows a wider dynamic range and a notably higher number of fluctuations compared to LA, suggesting a more dynamic and responsive sympathetic nervous system under high arousal.
Figure 6.
The representative EDA and its Time-frequency spectrum in High and Low Arousal.
Examining the EDA TF spectra shown in Figure 6 for HA and LA states reveals observable spectral differences. The mean frequency shows a modest shift towards higher values in HA, while total signal energy and energy variance differ between the two arousal conditions. These findings suggest that the EDA signal exhibits distinct spectral characteristics in HA and LA, potentially useful for differentiating between these states.
The mean frequency shows a modest shift between HA and LA states, although its physiological significance requires further investigation. Differences in total spectral energy and signal energy variance suggest distinct autonomic dynamics between arousal conditions. However, interpreting these spectral characteristics without detailed analysis of the underlying frequency distribution remains challenging. Further statistical comparisons and broader spectral investigations may provide deeper insights into the relationship between EDA frequency dynamics and emotional arousal.
Table 3 presents the classification performance of various DL architectures (MobileNetV2, ResNet50) for differentiating HA and LA states using EEG and EDA signals. The results reveal promising performance for MobileNetV2 across both modalities. For EDA signals, the MobileNetV2 model without pre-training achieves the highest Acc at 91.45%, with an F1 of 0.92, Sen of 0.94, and an AUC of 0.90. The pre-trained version of MobileNetV2 also performs well, achieving an Acc of 90.31%, an F1 of 0.92, Sen of 0.93, and an AUC of 0.90. Conversely, ResNet50 without pre-training yields an Acc of 59.38%, an F1 of 0.74. Pre-training ResNet50 slightly improves these metrics, yielding an Acc of 61.72%, and an F1 of 0.76.
Table 3.
Performance Evaluation of Deep Learning Models for Arousal Classification.
For EEG signals, the pre-trained ResNet50 model achieved the best performance with an accuracy of 91.98%, F1-score of 0.93, sensitivity of 0.94, and AUC of 0.91. The MobileNetV2 model without pre-training also demonstrated competitive performance with an accuracy of 91.56%. Similarly, for EDA signals, MobileNetV2 without pre-training achieved the best classification performance with an accuracy of 91.45%, highlighting its effectiveness in extracting discriminative features from EDA-based time–frequency representations. These results demonstrate that model architecture and pre-training strategies significantly influence arousal classification performance across physiological modalities.
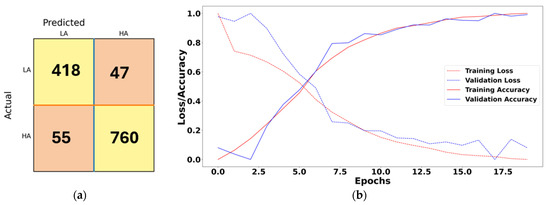
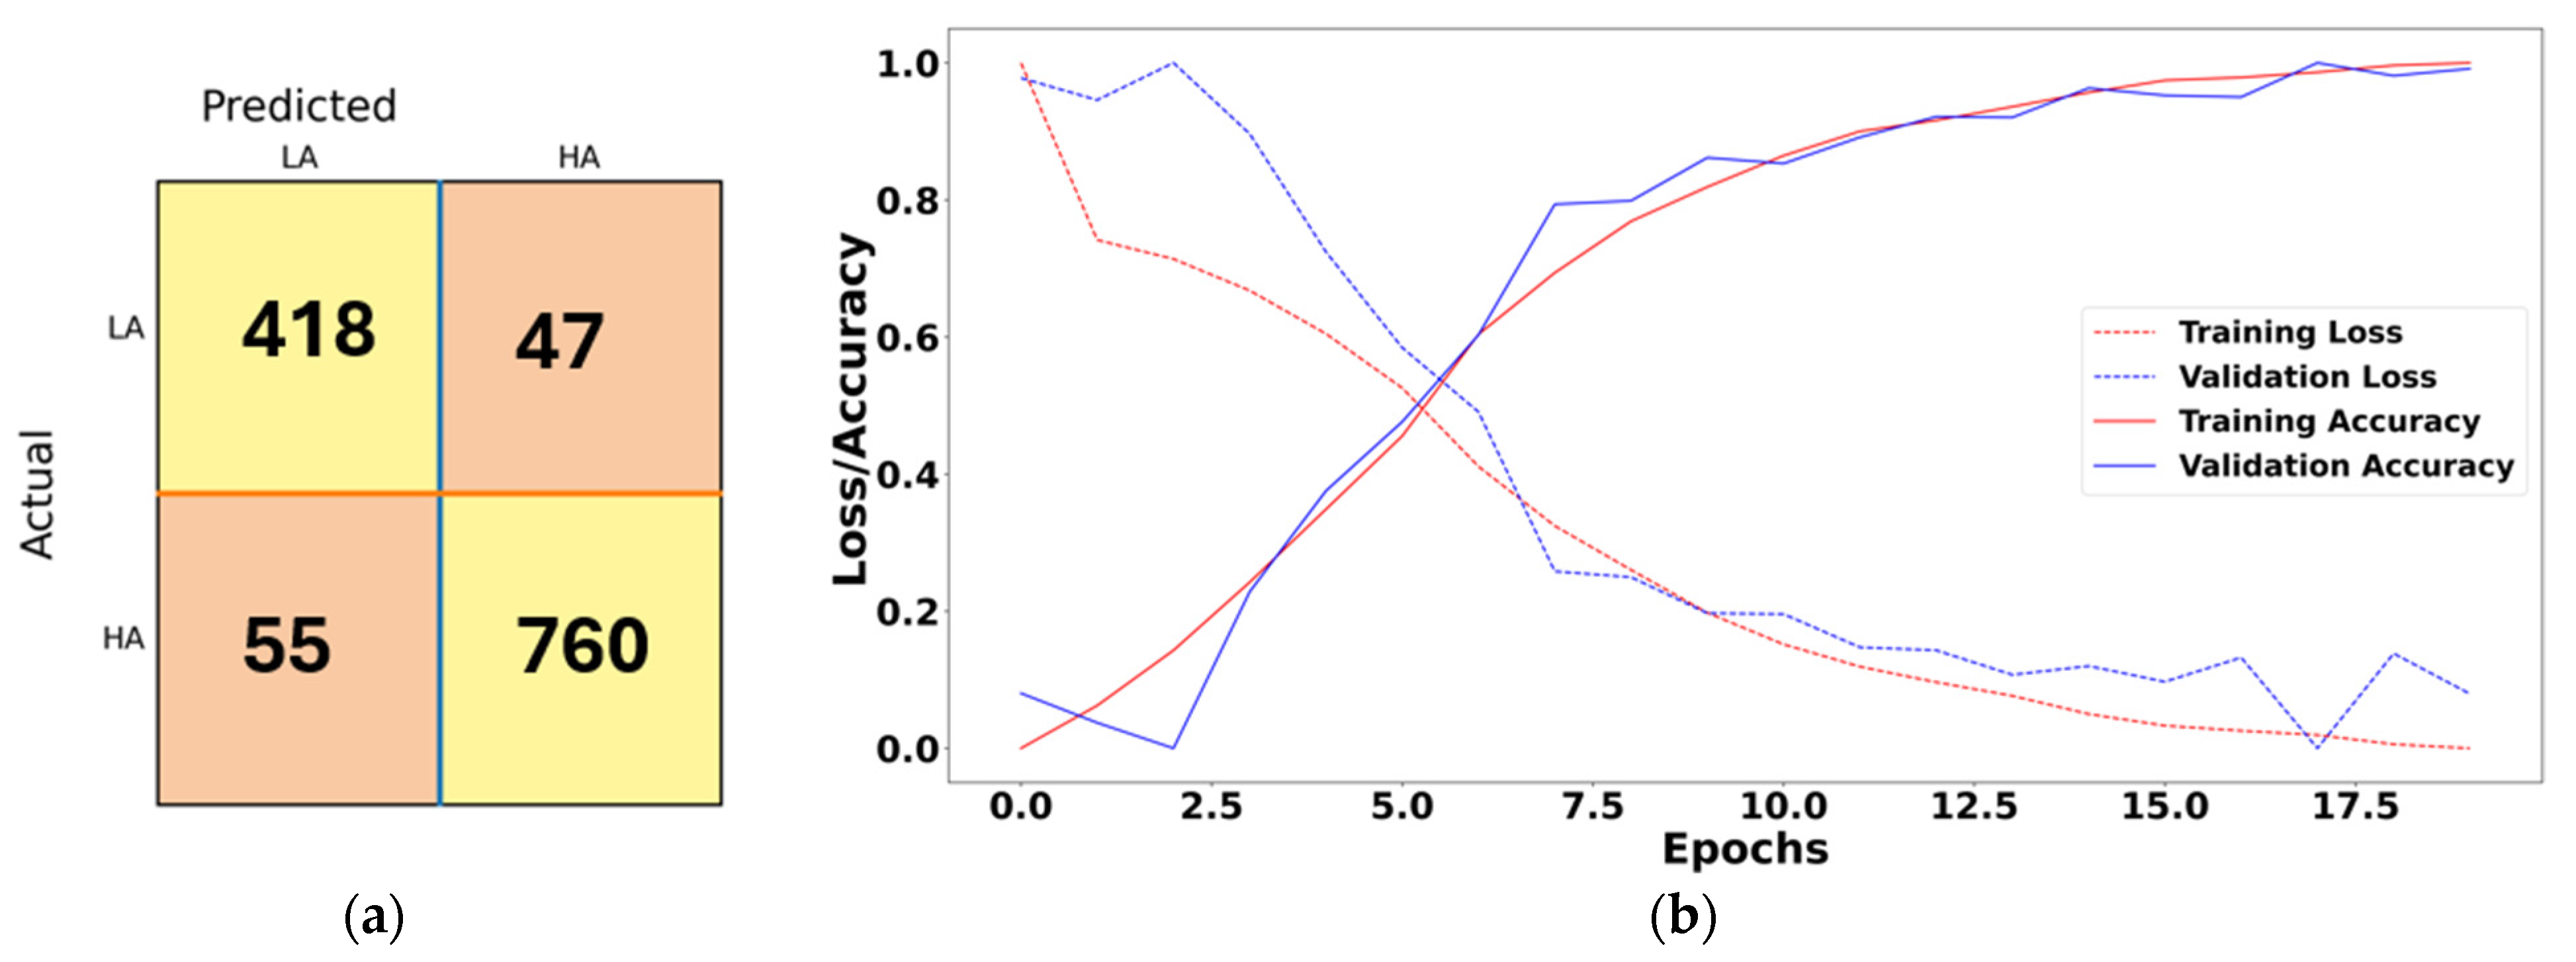
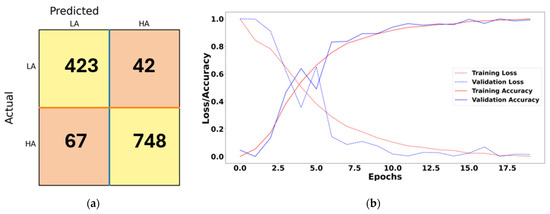
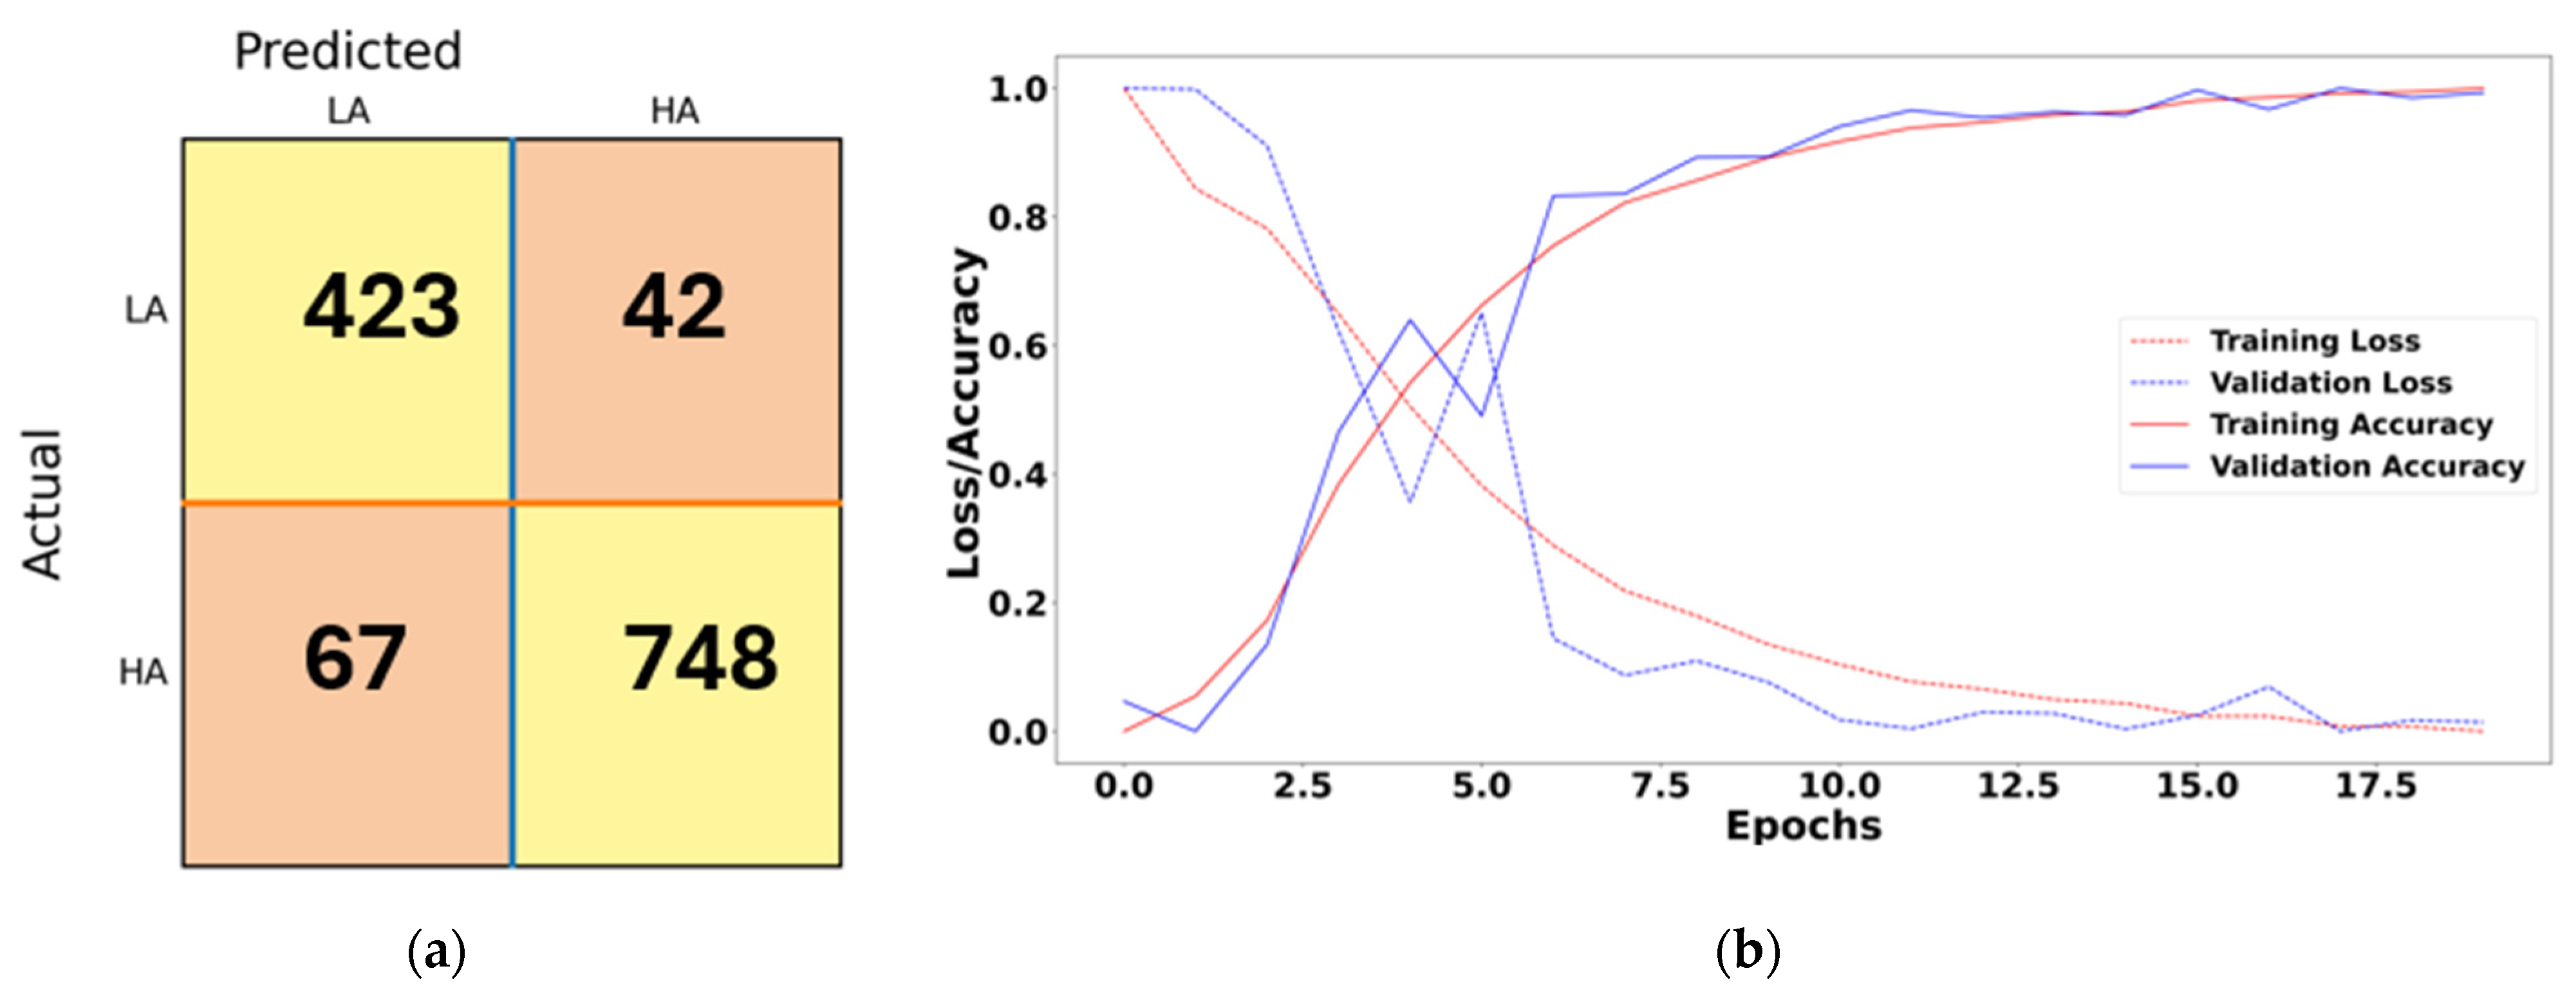
The confusion matrices presented in Figure 7 and Figure 8 represent trial-level classification performance. The total number of samples in each confusion matrix equals 1280, consistent with the number of trials in the DEAP dataset.
Figure 7.
Performance of pre-trained ResNet50 on EEG signals showing (a) confusion matrix and (b) training/validation loss and accuracy curves.
Figure 8.
Performance of MobileNetV2 without pre-training on EDA signals showing (a) confusion matrix and (b) training/validation loss and accuracy curves.
The confusion matrix obtained using the best-performing EEG model, the pre-trained ResNet50 network, is shown in Figure 7a. Among the total 815 high-arousal (HA) trials, the model correctly classified 760 trials while misclassifying 55 trials as low arousal (LA). Similarly, out of 465 LA trials, 418 were correctly classified and 47 were misclassified as HA. Overall, the model demonstrates strong discrimination capability between HA and LA classes, achieving an overall classification accuracy of 91.98%.
The training and validation performance shown in Figure 7b indicates that the model achieved stable convergence during training. The loss values for both training and validation datasets decreased steadily across epochs, while classification accuracy consistently improved. These trends confirm the model’s capability to generalize effectively to unseen EEG data.
The confusion matrix obtained using the best-performing EDA model, MobileNetV2 without pre-training, is shown in Figure 8a. Out of 815 HA trials, the model correctly classified 748 and misclassified 67 as LA. Similarly, among 465 LA trials, 423 were correctly identified, while 42 were misclassified as HA. The results indicate that the model effectively distinguishes between HA and LA classes, achieving an overall accuracy of 91.45%.
The training and validation curves in Figure 8b show that the model gradually reduced training loss and improved classification accuracy over 20 epochs. Although the validation loss fluctuated slightly, the overall trend indicates consistent learning behavior and reliable classification performance for EDA signals.
4. Discussion
VFCDM was selected in this study due to its ability to provide adaptive time–frequency resolution and stable amplitude estimation for non-stationary physiological signals. Previous studies [35] have demonstrated that VFCDM can achieve higher time–frequency resolution compared with conventional approaches such as Short-Time Fourier Transform, wavelet transform, Wigner–Ville distribution, and Hilbert–Huang transform. In particular, VFCDM avoids cross-term interference and provides improved tracking of oscillatory components by employing adaptive center frequency estimation. The advantages of VFCDM compared to other TF methods are summarized in Table 4.
Table 4.
VFCDM advantages compared to the existing TF methods.
These properties make VFCDM particularly suitable for analyzing EEG and EDA signals, which exhibit dynamic spectral variations associated with autonomic nervous system activity. However, direct benchmarking of VFCDM against alternative time–frequency techniques under identical evaluation protocols was not performed in this study. Future research will focus on systematic comparison and ablation analysis to further quantify the relative advantages of VFCDM-based representations. Modality-specific VFCDM parameter settings were employed to reflect the different spectral characteristics of EDA and EEG signals. Furthermore, independent validation of the VFCDM-derived TF representations against established EEG spectral estimation approaches, such as STFT-, wavelet-, or Welch PSD-based analysis, was not performed in the current study and remains an important direction for future methodological validation.
The results presented in this study provide useful insights into the feasibility of leveraging EDA as a simpler and more practical physiological modality for arousal recognition in HCI applications. Our findings suggest that EDA signals exhibit distinct spectral characteristics in HA and LA states, indicating their potential utility in differentiating between these states.
Our study demonstrates that EDA signals can effectively differentiate between HA and LA states. The wider range of activity observed in HA, characterized by higher minimum and maximum amplitudes and increased fluctuations in skin conductance, suggests a more dynamic and responsive nervous system under high arousal. These findings align with previous research highlighting the sensitivity of EDA signals to emotional arousal.
While both EDA and EEG signals offer valuable insights into emotional states, our results suggest that EDA signals may offer practical advantages in certain HCI scenarios, particularly in terms of simplicity, cost-effectiveness, and non-invasiveness. EEG signals, although widely used for ER, require complex instrumentation and brain source localization for optimal signal acquisition. In contrast, EDA signals can be acquired using low-cost and non-intrusive sensors, making them attractive for practical and wearable HCI applications.
Despite these promising results, an important physiological limitation of EDA must be acknowledged in the context of real-world HCI deployment. Emotion mapping in affective computing frameworks—including Russell’s circumplex model adopted in this study—requires characterization along both the arousal and valence dimensions to fully specify an emotional state. While EDA is a highly sensitive and reliable biomarker for sympathetic arousal, it is inherently limited in its ability to distinguish valence, i.e., whether an arousal response stems from a positive stimulus (e.g., joy, excitement) or a negative one (e.g., fear, anger). This is because both positive and negative high-arousal states elicit comparable sympathetic nervous system activation, making EDA responses largely valence-ambiguous [7]. Consequently, a HCI system relying solely on EDA would be capable of detecting that a user is highly activated, but unable to determine whether that activation reflects engagement or distress—a critical distinction for adaptive and emotionally intelligent systems. To address this limitation, future work should explore multimodal fusion approaches that combine EDA-based arousal detection with valence-sensitive modalities such as EEG frontal alpha asymmetry [22,23], facial action coding, or speech prosody analysis. Such hybrid systems could leverage the practical advantages of EDA—low cost, non-intrusiveness, and ease of collection—while compensating for its valence insensitivity through complementary signal modalities. The present study therefore positions EDA as a viable and efficient component within a broader multimodal affective computing framework, rather than a complete standalone replacement for EEG.
Our study underscores the importance of TF analysis in effectively capturing the dynamic nature of physiological signals like EDA and EEG. Traditional analysis methods may struggle to capture the intricate dynamics of these signals, necessitating the development of advanced TF techniques such as the VFCDM approach proposed in this study. VFCDM provides adaptive TF representations suitable for analyzing the dynamic spectral behavior of EDA and EEG signals, facilitating detailed characterization of emotional-state-related physiological dynamics.
Our results highlight the effectiveness of deep learning techniques, particularly CNNs such as ResNet50 and MobileNetV2, in classifying arousal states based on TF spectrograms derived from EDA and EEG signals. These models demonstrate promising performance metrics, with MobileNetV2 showing particularly strong performance across both modalities. Pre-training of models, particularly for ResNet50 in EEG signal analysis, improved classification performance, underscoring the importance of model selection and optimization in ER tasks.
The findings of this study have significant implications for HCI research and application development. By leveraging simpler and more accessible physiological signals like EDA, HCI systems may support the development of more practical and wearable affect-aware interfaces. This can enhance user experience, facilitate more natural human–computer interaction, and enable the development of emotionally intelligent systems capable of adapting to users’ affective states in real time.
While this study provides valuable insights into the feasibility of using EDA for ER in HCI applications, several paths for future research exist. Further investigation is warranted to explore the efficacy of combining EDA with other physiological signals to enhance ER accuracy. Additionally, longitudinal studies involving larger and more diverse participant populations can help validate the generalizability of our findings across different demographics and cultural contexts. Moreover, the development of novel TF analysis techniques and deep learning architectures tailored specifically for ER tasks holds promise for advancing the state-of-the-art in affective computing. A key methodological limitation concerns the absence of additional artifact rejection beyond the standard DEAP preprocessing pipeline. No amplitude-based thresholds, independent trial quality assessment, or evaluation of differential artifact contamination across HA and LA conditions were performed. While the DEAP preprocessing includes EOG correction via ICA, band-pass filtering (4–45 Hz), and common average re-referencing, residual non-ocular artifacts may still remain in some trials. Consequently, the potential influence of residual non-neural artifacts on the learned representations cannot be entirely excluded. Future work will incorporate additional artifact rejection and quantitative trial quality assessment to further strengthen the physiological interpretability of the classification results.
To further evaluate the influence of residual artifacts on classification performance, an additional control experiment was conducted using the best-performing EEG configuration after applying stricter preprocessing involving amplitude-based artifact rejection and noisy-trial exclusion prior to VFCDM analysis. The resulting classification performance remained highly consistent with the originally reported results, exhibiting only marginal numerical variation. This observation suggests that the learned representations were unlikely to be primarily driven by residual non-neural artifacts.
Although the proposed framework demonstrated strong classification performance for both EEG and EDA signals, formal statistical hypothesis testing was not performed to evaluate the significance of performance differences between modalities and network architectures. Future work will incorporate repeated experimental trials, cross-validation-based statistical analysis, and significance testing to provide a more rigorous assessment of model robustness and comparative reliability. Additionally, averaging channel-wise EEG TF representations into a unified representation may reduce region-specific spatial information associated with affective processing. Future work will investigate spatially informed EEG representations and region-of-interest-based analysis.
In addition to the above, we also aim to identify the brain regions associated with emotions and examine the correlation between these regions and EDA components. Specifically, investigating the relationship between EEG channels corresponding to these brain regions and EDA will be crucial. Furthermore, exploring the interaction between various EEG frequency bands and EDA can provide deeper insights into the neural underpinnings of emotional responses. These efforts can significantly contribute to a more comprehensive understanding of affective computing and enhance the accuracy of ER systems.
To contextualize the performance of the proposed approach, Table 5 presents a structured comparison with existing EEG-based and EDA-based studies on arousal/emotion classification on the DEAP dataset, highlighting differences in modality, feature extraction, classifier, and reported performance.
Table 5.
Comparison with Representative EEG- and EDA-Based Arousal Classification Studies on the DEAP Dataset.
5. Conclusions
This study demonstrates that EDA-derived time–frequency representations can support effective arousal classification performance under the proposed VFCDM-based deep learning framework on the DEAP dataset. A key finding is that a non-pretrained MobileNetV2 model applied to EDA signals achieved 91.45% accuracy—without the instrumentation overhead of 32-channel EEG systems (pretrained ResNet50, 91.98%)—while requiring substantially lower acquisition complexity compared with multi-channel EEG systems. This result has direct implications for real-world HCI deployment: reliable arousal detection can be achieved with low-cost, wearable EDA sensors, without the instrumentation overhead of 32-channel EEG systems.
However, the scope of this conclusion is deliberately bounded to the arousal dimension. EDA’s well-recognized inability to reliably capture emotional valence means that it cannot independently provide comprehensive multidimensional affect characterization comparable to EEG-based approaches. Rather, these findings position EDA as a highly practical and efficient modality for arousal-focused HCI applications—such as cognitive load monitoring, stress detection, and attention-aware interfaces—where sympathetic activation is the primary signal of interest.
Near-term implementation of EDA-based arousal detection in HCI systems appears feasible, particularly with lightweight architectures such as MobileNetV2 that are optimized for edge deployment. Future work should focus on: (i) validating this approach on larger and more demographically diverse datasets; (ii) incorporating valence-sensitive modalities through multimodal fusion to enable full two-dimensional emotion mapping; and (iii) applying systematic EEG artifact rejection and spatially informed channel selection strategies to further improve EEG-based baselines for fair cross-modal comparison.
Author Contributions
Y.R.V. and L.R.M.-D.: Conceptualization, Methodology, Software, Validation, Investigation, Writing—original draft, Writing—review and editing, Visualization. H.F.P.-Q.: Conceptualization, Methodology, Investigation, Supervision, Writing—review and editing. All authors have read and agreed to the published version of the manuscript.
Funding
This work did not receive any grant from funding agencies in the public, commercial, or not-for-profit sectors.
Institutional Review Board Statement
Not applicable for this study as it involves secondary analysis of a publicly available, de-identified dataset. This study involves secondary analysis of the publicly available DEAP dataset containing physiological recordings from human participants. The dataset is anonymized and publicly accessible. Ethical approval and informed consent were obtained in the original DEAP study. No new data collection involving human participants was performed in this study.
Informed Consent Statement
Informed consent was obtained from participants in the original DEAP study. No additional participant recruitment was performed in this work.
Data Availability Statement
The data presented in this study are available in the DEAP: Database for Emotion Analysis using Physiological Signals repository at https://www.eecs.qmul.ac.uk/mmv/datasets/deap/download.html, reference number [43] (accessed on 20 June 2019). These data were derived from the following resources available in the public domain: DEAP dataset—EEG and peripheral physiological signals from 32 participants watching 40 one-minute music video clips, along with facial video recordings of 22 participants, collected for emotion classification research (https://www.eecs.qmul.ac.uk/mmv/datasets/deap/) (accessed on 1 January 2020).
Conflicts of Interest
The authors declare no conflicts of interest.
References
- Cabanac, M. What Is Emotion? Behav. Process. 2002, 60, 69–83. [Google Scholar] [CrossRef] [Scilit]
- Picard, R.W. Toward Machines with Emotional Intelligence; Oxford University Press: Oxford, UK, 2008. [Google Scholar]
- Antle, A.N.; Chesick, L.; Mclaren, E.-S. Opening up the Design Space of Neurofeedback Brain--Computer Interfaces for Children. ACM Trans. Comput.-Hum. Interact. 2018, 24, 1–33. [Google Scholar] [CrossRef] [Scilit]
- Hassib, M.; Pfeiffer, M.; Schneegass, S.; Rohs, M.; Alt, F. Emotion Actuator: Embodied Emotional Feedback through Electroencephalography and Electrical Muscle Stimulation. In Proceedings of the 2017 CHI Conference on Human Factors in Computing Systems; Association for Computing Machinery: New York, NY, USA, 2017; pp. 6133–6146. [Google Scholar]
- Al-Nafjan, A.; Hosny, M.; Al-Ohali, Y.; Al-Wabil, A. Review and Classification of Emotion Recognition Based on EEG Brain-Computer Interface System Research: A Systematic Review. Appl. Sci. 2017, 7, 1239. [Google Scholar] [CrossRef] [Scilit]
- Veeranki, Y.R.; Kumar, H.; Ganapathy, N.; Natarajan, B.; Swaminathan, R. A Systematic Review of Sensing and Differentiating Dichotomous Emotional States Using Audio-Visual Stimuli. IEEE Access 2021, 9, 124434–124451. [Google Scholar] [CrossRef] [Scilit]
- Posada-Quintero, H.F.; Chon, K.H. Innovations in Electrodermal Activity Data Collection and Signal Processing: A Systematic Review. Sensors 2020, 20, 479. [Google Scholar] [CrossRef] [Scilit]
- Veeranki, Y.R.; Rao, N.K.; Posada-Quintero, H.F.; Swaminathan, R. Recent Trends in Electrodermal Activity Signal Processing and Deep Learning Methods for Emotion Recognition. Neuroscience 2026, 602, 12–30. [Google Scholar] [CrossRef] [Scilit] [PubMed]
- Harmon-Jones, E.; Harmon-Jones, C.; Summerell, E. On the Importance of Both Dimensional and Discrete Models of Emotion. Behav. Sci. 2017, 7, 66. [Google Scholar] [CrossRef] [Scilit]
- Bakker, I.; van der Voordt, T.; Vink, P.; de Boon, J. Pleasure, Arousal, Dominance: Mehrabian and Russell Revisited. Curr. Psychol. 2014, 33, 405–421. [Google Scholar] [CrossRef] [Scilit]
- Russell, J.A. A Circumplex Model of Affect. J. Personal. Soc. Psychol. 1980, 39, 1161–1178. [Google Scholar] [CrossRef] [Scilit]
- Alexandros, L.; Michalis, X. The Physiological Measurements as a Critical Indicator in Users’ Experience Evaluation. In Proceedings of the 17th Panhellenic Conference on Informatics; Association for Computing Machinery: New York, NY, USA, 2013; pp. 258–263. [Google Scholar]
- Egger, M.; Ley, M.; Hanke, S. Emotion Recognition from Physiological Signal Analysis: A Review. Electron. Notes Theor. Comput. Sci. 2019, 343, 35–55. [Google Scholar] [CrossRef] [Scilit]
- Bota, P.; Zhang, T.; El Ali, A.; Fred, A.; Da Silva, H.P.; Cesar, P. Group Synchrony for Emotion Recognition Using Physiological Signals. IEEE Trans. Affect. Comput. 2023, 14, 2614–2625. [Google Scholar] [CrossRef] [Scilit]
- Yasemin, M.; Sarıkaya, M.A.; Ince, G. Emotional State Estimation Using Sensor Fusion of EEG and EDA. In Proceedings of the 2019 41st Annual International Conference of the IEEE Engineering in Medicine and Biology Society (EMBC), Berlin, Germany, 23–27 July 2019; pp. 5609–5612. [Google Scholar]
- Boucsein, W. Electrodermal Activity; Springer: Boston, MA, USA, 2012. [Google Scholar]
- Hu, Y.; Converse, C.; Lyons, M.C.; Hsu, W.H. Neural Control of Sweat Secretion: A Review. Br. J. Dermatol. 2018, 178, 1246–1256. [Google Scholar] [CrossRef] [Scilit]
- Davidson, R.J.; Jackson, D.C.; Kalin, N.H. Emotion, Plasticity, Context, and Regulation: Perspectives from Affective Neuroscience. Psychol. Bull. 2000, 126, 890–909. [Google Scholar] [CrossRef]
- Davidson, R.J.; Irwin, W. The Functional Neuroanatomy of Emotion and Affective Style. Trends Cogn. Sci. 1999, 3, 11–21. [Google Scholar] [CrossRef] [Scilit]
- Critchley, H.D. Review: Electrodermal Responses: What Happens in the Brain. Neuroscientist 2002, 8, 132–142. [Google Scholar] [CrossRef] [Scilit] [PubMed]
- LeDoux, J.E. The Emotional Brain: The Mysterious Underpinnings of Emotional Life; Simon and Schuster: New York, NY, USA, 1998. [Google Scholar]
- Nagai, Y.; Critchley, H.D.; Featherstone, E.; Trimble, M.R.; Dolan, R.J. Activity in Ventromedial Prefrontal Cortex Covaries with Sympathetic Skin Conductance Level: A Physiological Account of a “Default Mode” of Brain Function. NeuroImage 2004, 22, 243–251. [Google Scholar] [CrossRef] [Scilit]
- Coan, J.A.; Allen, J.J.B. Frontal EEG Asymmetry as a Moderator and Mediator of Emotion. Biol. Psychol. 2004, 67, 7–50. [Google Scholar] [CrossRef] [Scilit]
- Lee, H.; Heller, A.S.; van Reekum, C.M.; Nelson, B.; Davidson, R.J. Amygdala-Prefrontal Coupling Underlies Individual Differences in Emotion Regulation. Neuroimage 2012, 62, 1575–1581. [Google Scholar] [CrossRef] [Scilit]
- Banik, S.; Kumar, H.; Ganapathy, N.; Swaminathan, R. Exploring Central-Peripheral Nervous System Interaction Through Multimodal Biosignals: A Systematic Review. IEEE Access 2024, 12, 60347–60368. [Google Scholar] [CrossRef] [Scilit]
- Bush, G.; Luu, P.; Posner, M.I. Cognitive and Emotional Influences in Anterior Cingulate Cortex. Trends Cogn. Sci. 2000, 4, 215–222. [Google Scholar] [CrossRef] [Scilit]
- Lang, P.J. The Emotion Probe: Studies of Motivation and Attention. Am. Psychol. 1995, 50, 372–385. [Google Scholar] [CrossRef]
- Veeranki, Y.R.; Ganapathy, N.; Swaminathan, R. Analysis of Fluctuation Patterns in Emotional States Using Electrodermal Activity Signals and Improved Symbolic Aggregate Approximation. Fluct. Noise Lett. 2021, 21, 2250013. [Google Scholar] [CrossRef] [Scilit]
- Zheng, W.-L.; Zhu, J.-Y.; Lu, B.-L. Identifying Stable Patterns over Time for Emotion Recognition from EEG. IEEE Trans. Affect. Comput. 2019, 10, 417–429. [Google Scholar] [CrossRef] [Scilit]
- Veeranki, Y.R.; Ganapathy, N.; Swaminathan, R. Electrodermal Activity Based Emotion Recognition Using Time-Frequency Methods and Machine Learning Algorithms. Curr. Dir. Biomed. Eng. 2021, 7, 863–866. [Google Scholar] [CrossRef] [Scilit]
- Alazrai, R.; Homoud, R.; Alwanni, H.; Daoud, M.I. EEG-Based Emotion Recognition Using Quadratic Time-Frequency Distribution. Sensors 2018, 18, 2739. [Google Scholar] [CrossRef] [Scilit]
- Garg, D.; Verma, G.K. Emotion Recognition in Valence-Arousal Space from Multi-Channel EEG Data and Wavelet Based Deep Learning Framework. Procedia Comput. Sci. 2020, 171, 857–867. [Google Scholar] [CrossRef] [Scilit]
- Vanitha, V.; Krishnan, P. Time-Frequency Analysis of EEG for Improved Classification of Emotion. Int. J. Biomed. Eng. Technol. 2017, 23, 191. [Google Scholar] [CrossRef] [Scilit]
- Zhuang, N.; Zeng, Y.; Tong, L.; Zhang, C.; Zhang, H.; Yan, B. Emotion Recognition from EEG Signals Using Multidimensional Information in EMD Domain. BioMed Res. Int. 2017, 2017, e8317357. [Google Scholar] [CrossRef] [Scilit]
- Wang, H.; Siu, K.; Ju, K.; Chon, K.H. A High Resolution Approach to Estimating Time-Frequency Spectra and Their Amplitudes. Ann. Biomed. Eng. 2006, 34, 326–338. [Google Scholar] [CrossRef] [Scilit] [PubMed]
- Chon, K.H.; Dash, S.; Ju, K. Estimation of Respiratory Rate from Photoplethysmogram Data Using Time–Frequency Spectral Estimation. IEEE Trans. Biomed. Eng. 2009, 56, 2054–2063. [Google Scholar] [CrossRef] [Scilit] [PubMed]
- Zhong, Y.; Jan, K.-M.; Chon, K.H. Frequency Modulation between Low- and High-Frequency Components of the Heart Rate Variability Spectrum May Indicate Sympathetic-Parasympathetic Nonlinear Interactions. In Proceedings of the 2006 International Conference of the IEEE Engineering in Medicine and Biology Society, New York, NY, USA, 31 August–3 September 2006; pp. 6438–6441. [Google Scholar]
- Posada-Quintero, H.F.; Florian, J.P.; Orjuela-Cañón, Á.D.; Chon, K.H. Highly Sensitive Index of Sympathetic Activity Based on Time-Frequency Spectral Analysis of Electrodermal Activity. Am. J. Physiol.-Regul. Integr. Comp. Physiol. 2016, 311, R582–R591. [Google Scholar] [CrossRef] [Scilit]
- Veeranki, Y.R.; Ganapathy, N.; Swaminathan, R. Classification of Dichotomous Emotional States Using Electrodermal Activity Signals and Multispectral Analysis. In Challenges of Trustable AI and Added-Value on Health; IOS Press: Amsterdam, The Netherlands, 2022; pp. 941–942. [Google Scholar]
- Liu, Z.; Xie, Q.; Wu, M.; Cao, W.; Li, D.; Li, S. Electroencephalogram Emotion Recognition Based on Empirical Mode Decomposition and Optimal Feature Selection. IEEE Trans. Cogn. Dev. Syst. 2019, 11, 517–526. [Google Scholar] [CrossRef] [Scilit]
- Ganapathy, N.; Veeranki, Y.R.; Swaminathan, R. Convolutional Neural Network Based Emotion Classification Using Electrodermal Activity Signals and Time-Frequency Features. Expert Syst. Appl. 2020, 159, 113571. [Google Scholar] [CrossRef] [Scilit]
- Jiang, X.; Hu, Z.; Wang, S.; Zhang, Y. Deep Learning for Medical Image-Based Cancer Diagnosis. Cancers 2023, 15, 3608. [Google Scholar] [CrossRef] [Scilit]
- Koelstra, S.; Muhl, C.; Soleymani, M.; Lee, J.; Yazdani, A.; Ebrahimi, T.; Pun, T.; Nijholt, A.; Patras, I. DEAP: A Database for Emotion Analysis Using Physiological Signals. IEEE Trans. Affect. Comput. 2012, 3, 18–31. [Google Scholar] [CrossRef] [Scilit]
- Kong, Y.; Posada-Quintero, H.F.; Chon, K.H. Sensitive Physiological Indices of Pain Based on Differential Characteristics of Electrodermal Activity. IEEE Trans. Biomed. Eng. 2021, 68, 3122–3130. [Google Scholar] [CrossRef] [Scilit] [PubMed]
- He, K.; Zhang, X.; Ren, S.; Sun, J. Deep Residual Learning for Image Recognition. In Proceedings of the 2016 IEEE Conference on Computer Vision and Pattern Recognition (CVPR), Las Vegas, NV, USA, 27–30 June 2016; pp. 770–778. [Google Scholar]
- Sandler, M.; Howard, A.; Zhu, M.; Zhmoginov, A.; Chen, L.-C. MobileNetV2: Inverted Residuals and Linear Bottlenecks. In Proceedings of the 2018 IEEE/CVF Conference on Computer Vision and Pattern Recognition, Salt Lake City, UT, USA, 19–21 June 2018; pp. 4510–4520. [Google Scholar]
- Chen, J.; Fan, F.; Wei, C.; Polat, K.; Alenezi, F. Decoding Driving States Based on Normalized Mutual Information Features and Hyperparameter Self-Optimized Gaussian Kernel-Based Radial Basis Function Extreme Learning Machine. Chaos Solitons Fractals 2025, 199, 116751. [Google Scholar] [CrossRef] [Scilit]
- Chen, J.; Cui, Y.; Wei, C.; Polat, K.; Alenezi, F. Driver Fatigue Detection Using EEG-Based Graph Attention Convolutional Neural Networks: An End-to-End Learning Approach with Mutual Information-Driven Connectivity. Appl. Soft Comput. 2026, 186, 114097. [Google Scholar] [CrossRef] [Scilit]
- Chen, J.; Zhao, W.; Cui, Y.; Wei, C.; Polat, K.; Alenezi, F. A Review of EEG-Based Driver Fatigue Detection: Nonlinear Dynamics, Brain Networks, and Deep Learning Advances. WIREs Data Min. Knowl. Discov. 2026, 16, e70099. [Google Scholar] [CrossRef] [Scilit]
- Wei, C.; Alenezi, F.; Chen, J.; Wang, H.; Polat, K. Nonlinear Feature Decomposition and Deep Temporal–Spatial Learning for Single-Channel sEMG-Based Lower Limb Motion Recognition. IEEE Sens. J. 2026, 26, 4120–4126. [Google Scholar] [CrossRef] [Scilit]

Disclaimer/Publisher’s Note: The statements, opinions and data contained in all publications are solely those of the individual author(s) and contributor(s) and not of MDPI and/or the editor(s). MDPI and/or the editor(s) disclaim responsibility for any injury to people or property resulting from any ideas, methods, instructions or products referred to in the content. |
© 2026 by the authors. Licensee MDPI, Basel, Switzerland. This article is an open access article distributed under the terms and conditions of the Creative Commons Attribution (CC BY) license.