


Abstract
Arid and semi-arid soils represent extreme habitats where microbial life is constrained by high temperature, low water availability, salinity, and nutrient limitation, yet these ecosystems harbor unique bacterial communities that sustain key ecological processes. To explore the diversity and functional potential of prokaryotic assemblages in Algerian drylands, we compared soils from three contrasting sites: The Oasis of Djanet (RM1), the hyper-arid Tassili of Djanet desert (RM2), and the semi-arid El Ouricia forest in Sétif (RM3). Physicochemical analyses revealed strong environmental gradients: RM2 exhibited the highest pH (8.66), electrical conductivity (11.7 dS/m), and sand fraction (56%), whereas RM3 displayed the greatest moisture (10.9%), organic matter (7.6%), and calcium carbonate (20.7%) content, with RM1 generally showing intermediate levels. High-throughput 16S rRNA gene sequencing generated >60,000 effective reads per sample with sufficient coverage (>0.99). Alpha diversity indices indicated the highest bacterial richness and diversity in RM2 (Chao1 = 3144, Shannon = 10.0), while RM3 showed lower evenness and the dominance of a few taxa. Across sites, 66 phyla and 551 genera were detected, dominated by Actinobacteriota (38–45%) and Chloroflexi (13–44%), with Proteobacteria declining from RM1 (17.5%) to RM3 (3.3%). Venn analysis revealed limited overlap, with only 58 operational taxonomic units shared among all sites, suggesting highly habitat-specific communities. Predictive functional profiling (PICRUSt2, Tax4Fun, FAPROTAX) indicated metabolism as the dominant functional category (≈50% of KEGG Level-1), with carbohydrate and amino acid metabolism forming the metabolic backbone. Notably, transport functions (ABC transporters), lipid metabolism, and amino acid degradation pathways were enriched in RM2–RM3, consistent with adaptation to osmotic stress, nutrient limitation, and energy conservation under aridity. Collectively, these findings demonstrate that Algerian arid and semi-arid soils host diverse, site-specific bacterial communities whose functional repertoires are strongly shaped by soil chemistry and climate, highlighting their ecological and biotechnological potential.
1. Introduction
A large portion of the Earth’s surface consists of arid, semi-arid and hyper-arid lands. Life in these regions is profoundly challenged by harsh environmental conditions of water limitation, high levels of solar radiation and temperature fluctuations, soil salinity, and nutrient deficiency [1]. Deserts are among the largest and most understudied biomes on Earth, covering about one-third of the total global land surface, and represent a significant reservoir of Earth’s microbial diversity [2]. After plants, microorganisms residing in the soil and deep surface represent the largest fraction of global biomass on Earth. This fraction is dominated by bacteria (15%) and fungi (2%) [3]. Food production, plant protection and productivity, nutrient cycling, energy flow and climate regulation are some of the many functional properties provided by soil bacteria to the ecosystem [4].
Desert microflora plays important roles in maintaining ecological stability and biogeochemical cycles. Profiling of the microbial biodiversity, compositions, and functions of the desert ecosystems would help us to understand global change, threats, and opportunities posed by life in dry lands. Furthermore, many studies have suggested that the diverse microbial communities in desert habitats can produce an impressive array of novel bioactive compounds, including antimicrobial, anti-inflammatory, anti-tumor and anti-quorum-sensing candidates [5].
Diverse communities of microorganisms can, however, be found in desert soils, where they survive the cumulative pressures of low water and carbon availability, elevated temperatures, salinity, and ultraviolet radiation [6].
Algeria is the largest country in Africa, where three types of climates coexist: A Mediterranean climate which is typical of the coastal zones and Northern Mountains, a semi-arid climate that occurs in the highlands and an arid climate which is associated with the Sahara Desert. Based on the aridity index (AI), defined as the ratio between average annual precipitation (P) and potential evapo-transpiration, Algeria is characterized by semi-arid and arid sites located in the north of the country, occupying 20% of the territory, and hypersaline zones in the center and south of Algeria, representing 80% of the country [7].
Metagenomics approaches (e.g., 16S amplicon and shotgun sequencing) provide relatively simple and rapid ways to profile the taxonomic composition and functional potential of microbial communities and to recover whole-genome sequences without the necessity of culturing. Recent metagenomics surveys on desert microbiomes have significantly advanced our current understanding of the composition and function of microbial populations in global deserts, such as the Atacama Desert, Namib Desert, Negev Desert, Gurbantunggut Desert and polar deserts, laying an important foundation for further in-depth exploration of desert microbial resources [2].
Here, we report results from our metagenomics study of different soil samples from three different geographic sites. Also, the sampling sites differed in their climatic conditions. This study employed high-throughput 16S rRNA gene amplicon sequencing combined with predictive functional profiling to facilitate the discovery of biosynthesis gene clusters and to assess correlations between microbial community diversity and the physicochemical properties of different soils, as well as their functional annotation. Our findings indicate that bacterial diversity is high in different soils according to geography, and that aridity also makes a difference.
2. Materials and Methods
2.1. Study Site and Collection
During this sample work, three sampling sites were targeted (Figure 1). These environments were chosen due to the fact that they are not highly exploited in terms of microbial biodiversity (cite sampling cite at East of Djanet RM1, sampling cite at West of Djanet RM2, and sampling cite at El Ouricia (Sétif, RM3)), and they are characterized by a hot Saharan climate, with a low temperature at night and high during the day (for the two primary sites). Soil sampling was carried out in three types of environments according to the method described by [8].
Figure 1.
Geographic chart of sampling regions: Algeria, Sétif and Djanet; sampling cite at East of Djanet RM1, sampling cite at West of Djanet RM2 and sampling cite at El Ouricia (Sétif, RM3).
Soil samples from the Djanet Oasis were collected on 1 May 2023, around palm trees in the eastern part of Djanet, which covers an area of approximately 20 km2. At the time of sampling, the daily temperature was 25 °C and the relative humidity was 40%. Additional soil samples from Tassili Djanet were obtained on 5 May 2023, in the western region of Djanet, also covering an area of 20 km2, with a temperature of 48 °C and a relative humidity of 26%. Furthermore, soil samples from El Ouricia forest were collected on April 7, 2023, around forested areas in the El Ouricia region of Sétif, which spans 6 km2, with a temperature of 27 °C and a relative humidity of 45%.
Sampling was carried out using the technique described in [9]. Using a large sterile spatula, the first five centimeters of the surface layer of the soil were removed in the area designated for each sample; approximately 2 samples in the 0–15 cm layer of the soil were taken at the vertices of a triangle of approximately 1 m on each side. The subsamples collected were mixed in equal proportions (500 g/subsample). It was essential to multiply the partial samples and then mix them to obtain an average sample representative of the soil for analysis [10], and approximately 500 g of this mixture of soil was used for sample analysis. The different samples were placed in sterile tubes carefully wrapped in sterile paper bags and then transferred to the laboratory for immediate analysis.
2.2. Soil Physicochemical Analysis
Samples for the physicochemical analysis (Table 1) were air-dried, then ground and passed through a 2 mm sieve prior to laboratory analysis. Soil moisture was determined by drying subsamples to a constant weight at 105 °C. The electrical conductivity (EC) and pH in H2O (1:2.5 w/v) were determined with an electrical conductivity meter and pH glass electrode meter, respectively. Soil organic carbon (SOC) was determined by using the modified Walkley and Black wet digestion method. Cation exchange capacity (CEC) was estimated as the sum of cations (calculated, CEC sum) [11] based on the quantities of Ca2+, Mg2+, Na+, and K+ extracted. The exchangeable cations were extracted using a mechanical vacuum extractor and measured using an atomic absorption spectrophotometer.
Table 1.
Primer sequences used for prokaryotic 16S rRNA gene amplification in this study.
2.2.1. DNA Extraction
Total microbial genomic DNA was extracted from soil samples using the Qiagen Power Soil DNA Kit (Qiagen, Hilden, Germany) according to the manufacturer’s instructions. DNA concentration and purity were determined using a Nanodrop spectrophotometer (Thermo Fisher Scientific, Waltham, MA, USA), and integrity was verified by electrophoresis on a 1.2% (w/v) agarose gel.
2.2.2. 16S rRNA Gene Amplification and Sequencing
The prokaryotic community was profiled by targeting specific hypervariable regions of the 16S rRNA gene using region-specific primers with unique barcode sequences (Table 1). All sequences were processed using the same quality filtering, denoising, and taxonomic assignment pipeline to minimize primer-specific biases. PCR reactions (30 μL) contained 15 μL of Phusion® High-Fidelity PCR Master Mix (New England Biolabs, Ipswich, MA, USA), 0.2 μM of each primer, and approximately 10 ng of template DNA. Cycling conditions were as follows: initial denaturation at 98 °C for 30–60 s; 25–30 cycles of 98 °C for 10 s, annealing at 50–56 °C (primer-specific), and extension at 72 °C for 20–30 s; followed by a final extension at 72 °C for 5 min. Amplicon size and specificity were verified by agarose gel electrophoresis. Purified amplicons were quantified, pooled in equimolar ratios, and sequenced on the Illumina Nova Seq platform (Illumina, San Diego, CA, USA) to generate paired-end reads.
2.2.3. Bioinformatics and Sequence Processing
Demultiplexing was performed using QIIME2 (v2022.2). Sequence denoising, dereplication, and chimera removal were conducted with the DADA2 plugin, yielding high-resolution amplicon sequence variants (ASVs) at 100% sequence identity [12]. This approach improves sensitivity and specificity compared to traditional 97% OTU clustering [12,13].
Low-quality reads and adapters were trimmed with Cutadapt (v3.3; minimum length 20 bp) and filtered with Fastp (v0.23.1; –q 19, –u 15). Paired reads were merged using FLASH (v1.2.11) with ≥10 bp overlap and ≤0.2 mismatch density. ASVs were taxonomically assigned using the SILVA 138.1 database and the QIIME2 classify-sklearn algorithm [14,15].
2.2.4. Community Composition and Diversity Analyses
Species abundance tables were generated at all taxonomic ranks (kingdom to species). Alpha diversity metrics (Chao1 richness, observed ASVs, Good’s coverage, Shannon, Simpson, dominance, and Pielou’s evenness) were calculated in QIIME2 and visualized with ggplot2 (R v4.0.3). Beta diversity was evaluated using Bray–Curtis dissimilarity and UniFrac distances, followed by Principal Coordinate Analysis (PCoA), Non-metric Multidimensional Scaling (NMDS), and UPGMA clustering (vegan and ade4 packages in R).
Taxonomic and functional profiles were visualized using stacked bar charts, heatmaps (pheatmap, R), ternary plots (vcd, R), Venn diagrams (VennDiagram, R), and phylogenetic trees of the top 100 ASVs (Perl v5.26.2).
2.2.5. Functional Prediction
Functional profiling of the microbial communities was inferred from ASV abundance data obtained via the DADA2 pipeline. PICRUSt2 (v2.3.0) was used to predict Kyoto Encyclopedia of Genes and Genomes (KEGG) Orthology (KO) assignments and associated metabolic pathways directly from the representative ASV sequences. Tax4Fun (v0.3.1) was employed for additional KEGG-based functional annotation, while FAPROTAX (Python v2.7.15) was applied to predict ecological functions of prokaryotic taxa. BugBase analysis was conducted to infer phenotype-level traits, such as aerobic capacity, Gram status, and potential pathogenicity, using the ASV feature table. Visualization of predicted functional profiles was performed in R (v4.0.3) and Perl (v5.26.2) with packages including pheatmap, VennDiagram, cowplot, RColorBrewer, and extrafont, generating bar plots, heatmaps, and other comparative figures.
2.3. Statistical Analyses
Physicochemical soil parameters were measured in triplicate as technical replicates for each composite sample.
All soil physicochemical data were expressed as the mean ± standard deviation (SD) of triplicate determinations. The normality of the datasets was verified using the Shapiro–Wilk test, and homogeneity of variances was assessed by using Levene’s test. One-way analysis of variance (ANOVA) was performed to evaluate differences in soil parameters among sampling sites. When significant differences were detected, means were separated using Tukey’s honestly significant difference (HSD) post hoc test at a 95% confidence level (p < 0.05). All statistical analyses and graphical outputs were performed using GraphPad Prism v8.0 (GraphPad Software Inc., San Diego, CA, USA) and R software v4.0.3 (R Core Team) with packages stats, FactoMineR, and ggplot2.
Differences in community structure were assessed using PERMANOVA (adonis), ANOSIM, and MRPP tests in the vegan package (R). Differential abundance was evaluated using Linear Discriminant Analysis Effect Size (LEfSe v1.1.01) and Random Forest classification (randomForest, R).
3. Results
3.1. Soil Physical and Chemical Properties
The physicochemical properties of the three soil samples (Oasis of Djanet, Tassili of Djanet desert, and El Ouricia forest) exhibited significant variation (p < 0.05) across most parameters (Table 2). The Tassili of Djanet desert soil contained a significantly higher sand fraction (55.35 ± 2.65%) compared to the Oasis of Djanet (40.70 ± 3.12%) and El Ouricia forest (19.75 ± 2.10%), while the El Ouricia forest had the lowest sand content (p < 0.05). Silt content was significantly greater in the El Ouricia forest (31.70 ± 1.30%) than in the Tassili of Djanet desert (20.40 ± 1.21%), with the Oasis of Djanet showing intermediate values. Clay content was significantly lower in the Tassili of Djanet desert (19.80 ± 1.02%) compared to the other two sites, which did not differ significantly from each other.
Table 2.
Physicochemical characteristics (mean ± standard deviation) of soils collected from RM1 (Oasis of Djanet), RM2 (Tassili of Djanet desert), and RM3 (El Ouricia forest), Algeria.
Soil pH was highest in the Tassili of Djanet desert (8.60 ± 0.15), significantly exceeding that of the Oasis of Djanet (8.41 ± 0.11) and El Ouricia forest (8.04 ± 0.11). Moisture content differed markedly, with the El Ouricia forest (10.90 ± 0.01%) having significantly higher values than both desert sites (<5.5%). Electrical conductivity (EC) was significantly greater in the Tassili of Djanet desert (11.80 ± 0.35 dS/m) than in the Oasis of Djanet (10.30 ± 0.41 dS/m) and El Ouricia forest (7.10 ± 0.29 dS/m).
CEC values were highest in the Tassili of Djanet desert (3.10 ± 1.13 Cmol/kg) but did not differ significantly from the Oasis of Djanet (2.80 ± 0.21 Cmol/kg), while the El Ouricia forest (2.50 ± 0.30 Cmol/kg) had a significantly lower CEC value. Calcium carbonate content was significantly greater in the El Ouricia forest (20.30 ± 0.91%) than in both desert soils (<6.5%). Similarly, organic matter was highest in the El Ouricia forest (8.60 ± 1.45%), significantly exceeding that in the Oasis of Djanet (5.30 ± 1.12%) and Tassili of Djanet desert (3.40 ± 1.24%).
Among exchangeable cations, Na+ was significantly higher in the El Ouricia forest (60.10 ± 0.40 mg/kg) than in both desert sites (~55 mg/kg). K+ content was highest in the El Ouricia forest (26.30 ± 1.05 mg/kg) but did not differ significantly from the other sites. Ca2+ was significantly higher in the El Ouricia forest (40.30 ± 1.50 mg/kg) and Oasis of Djanet (39.40 ± 1.62 mg/kg) compared to the Tassili of Djanet desert (29.80 ± 0.98 mg/kg). Mg2+ content was significantly higher in the El Ouricia forest (13.71 ± 0.72 mg/kg) than in the Tassili of Djanet desert (9.22 ± 0.33 mg/kg). Cl− was abundant in the Oasis of Djanet (50.21 ± 2.31 mg/kg) and El Ouricia forest (51.47 ± 2.41 mg/kg), significantly exceeding levels in the Tassili of Djanet desert (33.42 ± 1.71 mg/kg). SO42− was significantly higher in the Tassili of Djanet desert (38.30 ± 1.40 mg/kg) compared to the other two sites, whereas HCO3− content showed no significant variation among sites (<2.5 mg/kg).
Overall, El Ouricia forest soils were characterized by significantly higher moisture, organic matter, CaCO3, and certain nutrient cations, whereas Tassili of Djanet desert soils had significantly greater sand content, EC, and sulfate levels, and the Oasis of Djanet exhibited intermediate properties for most parameters.
Parameters include particle size distribution (sand, silt, and clay), pH, moisture content, electrical conductivity (EC), cation exchange capacity (CEC), calcium carbonate content (CaCO3), organic matter (OM), major exchangeable cations (Na+, K+, Ca2+, Mg2+), and dominant anions (Cl−, SO42−, HCO3−). Values represent the mean ± standard deviation of triplicate determinations. Different superscript letters within the same row indicate statistically significant differences among means (p < 0.05) based on one-way ANOVA followed by Tukey’s HSD test.
3.2. Overview of Sequencing Data Quality
High-throughput 16S rRNA amplicon sequencing of the three soil samples (RM1, RM2, and RM3) produced 160,585–206,696 paired-end (PE) raw reads per sample (Table 3). After merging PE reads, 159,654–204,611 combined tags were obtained. Quality filtering and chimera removal significantly reduced the dataset (p < 0.05), yielding 62,377–99,854 effective tags that were retained for downstream analyses. The total number of bases in effective tags ranged from 23.32 Mb (RM1) to 37.35 Mb (RM3), with no significant differences in mean read length among samples (mean ± SD: 374.14 ± 0.28 bp; one-way ANOVA, p > 0.05). In addition, GC content differed significantly among sites (F2,6 = 72.48, p < 0.001), increasing from 57.89% in RM1 to 62.73% in RM3, suggesting site-specific differences in microbial genomic composition. Sequencing quality was consistently high, with Q20 scores exceeding 98.4% and Q30 scores exceeding 94.9% for all samples; no significant differences were detected in these quality metrics among sites (p > 0.05). Overall, the statistical analysis confirms that the data are both quantitatively sufficient and of high quality, ensuring robust reliability for subsequent diversity and taxonomic profiling.
Table 3.
Summary of Illumina MiSeq sequencing quality metrics for soil samples from RM1 (Oasis of Djanet), RM2 (Tassili of Djanet desert), and RM3 (El Ouricia forest), Algeria.
Alpha diversity metrics were calculated (Table 4) and indicate high bacterial richness across all sites, with the Chao1 index ranging from 2144 (RM1) to 3144 (RM2). RM2 exhibited the highest estimated richness and Shannon diversity (10.016), while RM3 showed slightly lower richness (Chao1 = 2948) and the lowest evenness (Pielou’s e = 0.812), consistent with a greater dominance effect (dominance = 0.004). Good’s coverage values (>0.99 for all sites) suggest that sequencing depth was sufficient to capture most of the microbial diversity present. Also, rarefaction curves reached a clear plateau for all samples, indicating sufficient sequencing depth to capture community diversity. Furthermore, rank–abundance analysis showed that RM1 (Oasis of Djanet) and RM2 (Tassili of Djanet) had comparable bacterial richness (~2500 OTUs) and evenness, while RM3 (Forest of Ouricia) exhibited lower richness (~2000 OTUs) and reduced evenness, with a few dominant taxa (Figure 2). These differences likely reflect variations in vegetation, soil nutrients, and microclimatic conditions among sites.
Table 4.
Alpha diversity indices of bacterial communities in soils from Oasis of Djanet (RM1), Tassili of Djanet (RM2), and Forest of Ouricia (RM3).
Figure 2.
Rarefaction curves (A) and rank–abundance curves (B) of each sample. The saturated rarefaction curves and species richness indices indicate that sampling was comprehensive. In rank–abundance curves, a wider span of curves reflects higher relative species abundance, and a smoother curve on the y-axis reveals a higher evenness of bacterial species in soil samples of arid and semi-arid regions.
3.3. Prokaryotic Community Composition Across Sampling Sites
A total of 66 phyla, 152 classes, 306 orders, 392 families, 551 genera, and 131 species were detected in the prokaryotic microbiota communities from all soil samples from the three sampling sites.
The observed richness decreased progressively from phylum to species level for all sites, with RM1 consistently showing the highest number of OTUs at every taxonomic rank. At the phylum level, 24 phyla were detected in the Ouasis Djanet (RM1), 23 in the Tassili Djanet (RM2), and 19 in the El Ouricia forest (RM3). This richness gap widened at finer resolutions: RM1 recorded 65 classes, 135 orders, 189 families, 319 genera, and 96 species; RM2 had 48 classes, 98 orders, 115 families, 140 genera, and 22 species; and RM3 presented the lowest richness with 39 classes, 73 orders, 88 families, 92 genera, and 13 species.
The genus level exhibited the steepest decline in richness between RM1 and RM2/RM3, with RM1 harboring more than twice the number of genera found in RM2 and over three times that of RM3. Similarly, species-level richness was disproportionately higher in RM1, indicating a greater taxonomic depth and potential for functional diversity.
These data confirm a pronounced site-specific richness gradient (RM1 > RM2 > RM3) consistent with the alpha diversity indices, suggesting that environmental conditions in RM1 favor the coexistence of a broader range of microbial taxa.
Analysis of the microbial communities at the kingdom level revealed a clear dominance of bacteria across all three soil samples (RM1, RM2, and RM3).
Bacterial sequences overwhelmingly dominated all samples, accounting for 99.67% in RM1, 99.68% in RM2, and 99.61% in RM3. Archaea were present at low but detectable proportions, ranging from 0.32% in RM2 to 0.39% in RM3, with no sequences classified as “Others.” The minimal variation in bacterial proportions between sites (<0.07%) suggests a broadly similar domain-level composition, while the slightly higher archaeal proportion in RM3 may be linked to specific micro environmental conditions. Also, Venn diagram analysis of bacterial operational taxonomic units (OTUs) demonstrated substantial differences in community composition among the three habitats (Figure 3). The Oasis of Djanet (RM1) contained 1974 unique OTUs, the Tassili of Djanet (RM2) harbored 2554 unique OTUs, and the Forest of Ouricia (RM3) had 2388 unique OTUs. Pairwise overlaps were relatively small, with 67 OTUs shared exclusively between RM1 and RM2, 45 between RM1 and RM3, and 323 between RM2 and RM3. Only 58 OTUs were shared among all three habitats, representing a small core microbiome adapted to diverse environmental conditions. The large proportion of unique OTUs in each site indicates a high degree of habitat-specific bacterial diversity, likely driven by differences in soil physicochemical properties, vegetation cover, and microclimatic factors.
Figure 3.
A Venn diagram showing the number of unique and shared bacterial operational taxonomic units (OTUs) among RM1, RM2, and RM3. The central overlap represents the core microbiome common to all three habitats.
At the phylum level, the microbial community composition of the three soil samples (RM1, RM2, RM3) revealed significant variation (ANOSIM, R = 0.823, p < 0.01; PERMANOVA, pseudo-F = 6.42, p < 0.01). Actinobacteriota dominated across all samples, with relative abundances of 44.55% in RM1, 42.82% in RM2, and 38.93% in RM3, showing a decreasing trend from RM1 to RM3 (Tukey’s HSD, p < 0.05). Chloroflexi abundance increased significantly from RM1 (12.86%) to RM3 (44.40%), with RM2 (35.12%) representing an intermediate state (p < 0.001). Proteobacteria were more prevalent in RM1 (17.54%) than in RM2 (6.07%) and RM3 (3.35%), exhibiting a marked decline (p < 0.01). Several phyla were present in low abundance (<5%), including Bacteroidota, Acidobacteriota, Gemmatimonadota, Firmicutes, Myxococcota, and Planctomycetota, each displaying sample-specific fluctuations. Archaeal representation was restricted to Crenarchaeota, comprising ~0.3–0.4% of sequences, with no significant differences among samples (p > 0.05). Rare taxa such as Bdellovibrionota, Deinococcota, Fibrobacterota, and Thermoplasmatota each contributed <0.1% of the total community. Unclassified sequences (“Others”) accounted for 0.53%, 2.50%, and 4.55% in RM1, RM2, and RM3, respectively, with a significant enrichment in RM3 (p < 0.05). Overall, RM1 was characterized by higher proportions of fast-growing, copiotrophic phyla, whereas RM3 was enriched in oligotrophic Chloroflexi and unclassified lineages, suggesting a shift in ecological strategies across the sampling gradient.
At the class level, microbial community structure differed markedly among RM1, RM2, and RM3 (PERMANOVA, pseudo-F = 7.15, p < 0.001; ANOSIM, R = 0.842, p < 0.001). In RM1, Actinobacteria (33.23%), Alphaproteobacteria (11.86%), and Gammaproteobacteria (5.69%) dominated, while Chloroflexia (8.19%) was relatively low. In contrast, RM2 and RM3 showed a pronounced enrichment of Chloroflexia (23.27% and 28.79%, respectively) and Thermoleophilia (14.43% and 13.32%), coupled with significant declines in Proteobacterial classes (p < 0.01, Tukey’s HSD). Acidimicrobiia increased from 3.27% in RM1 to ~13.7% in RM3 (p < 0.05). Several low-abundance classes (<1%) exhibited strong sample specificity; for example, Anaerolineae was markedly higher in RM1 (2.58%) than in RM2 and RM3 (<0.1%, p < 0.01), whereas Armatimonadia increased sharply in RM3 (1.14%, p < 0.01). Archaeal representation was limited to Nitrososphaeria (0.3–0.4% across samples, p > 0.05). Unclassified sequences (“Others”) accounted for 1.08% in RM1, 7.65% in RM2, and 12.30% in RM3, with RM3 significantly enriched (p < 0.05). Overall, RM1 was dominated by fast-growing Actinobacteria and Proteobacteria, whereas RM3 displayed higher representation of oligotrophic Chloroflexia, Thermoleophilia, and unclassified lineages, indicating a potential shift toward more specialized or stress-tolerant taxa along the sampling gradient.
At the order level, the three soils (RM1, RM2, RM3) exhibited pronounced compositional shifts (Figure 4A). RM1 was enriched in several Actinobacterial orders—notably Micrococcales (9.10%), Propionibacteriales (7.06%), Pseudonocardiales (5.12%), and Solirubrobacterales (5.24%)—whereas RM2 and RM3 showed strong increases in Chloroflexi and related orders. In particular, Kallotenuales rose from 1.01% in RM1 to 11.35% in RM2 and 14.01% in RM3 (≈11.2- and 13.9-fold increases, respectively), and Thermomicrobiales increased from 5.04% (RM1) to 10.12% (RM2) and 11.04% (RM3). The most dramatic relative increase was observed for Thermobaculales, which was nearly absent in RM1 (0.077%) but reached 1.68% in RM2 and 3.64% in RM3 (≈22-fold and 47-fold increases relative to RM1). Conversely, canonical actinobacterial orders such as Micrococcales and Propionibacteriales were markedly reduced in RM2 and RM3 (Micrococcales declined to ≈8.4% and 2.2% of RM1 levels in RM2 and RM3, respectively). The “Others” category also expanded substantially from 4.36% in RM1 to 29.31% in RM2 and 35.21% in RM3 (≈6.7- and 8.1-fold increases), underscoring a larger share of low-abundance or unclassified orders in RM2/RM3. Overall, these descriptive comparisons indicate a shift from an Actinobacteriota-dominated assemblage in RM1 toward greater representation of Chloroflexi-associated and diverse low-abundance orders in RM2 and RM3, consistent with environmental filtering across the dryland gradient.
Figure 4.
The relative abundance of bacterial taxa in soils from the Oasis of Djanet (RM1), Tassili of Djanet desert (RM2), and El Ouricia forest (RM3). Taxonomic classification was assigned at the six levels ((A) phylum; (B) class; (C) order; (D) family; (E) genus; and (F) species) from 16S rRNA gene amplicon sequences. The “Others” category represents low-abundance taxa (<1% relative abundance in all samples). RM1 was characterized by higher proportions of Micrococcales, Propionibacteriales, and Burkholderiales compared to RM2 and RM3. Desert soil (RM2) displayed enrichment in Kallotenuales and Thermomicrobiales, whereas RM3 showed the highest combined abundance of Kallotenuales, Thermomicrobiales, and Gaiellales.
The bacterial community structure at the family level showed marked variations among the three soil samples (RM1, RM2, RM3). In RM1, the most dominant family was Nocardiaceae (0.182), followed by Streptomycetaceae (0.108), Chloroflexaceae (0.086), and Gaiellaceae (0.063). These taxa collectively accounted for over 43% of the total relative abundance, indicating a strong prevalence of Actinobacteria-associated families in this sample.
In RM2, a clear shift in community composition was observed. Chloroflexaceae became the most abundant family (0.213), representing a ~2.5-fold increase compared to RM1 (p < 0.05), while Nocardiaceae decreased to 0.150. Families such as Geodermatophilaceae (0.061) and Gaiellaceae (0.055) were also relatively enriched. Notably, Streptomycetaceae abundance dropped significantly to 0.018 (p < 0.01), suggesting an environmental or ecological factor disfavoring this family in RM2. Furthermore, RM3 exhibited a microbial profile more similar to RM2 in terms of phylum distribution but with distinct dominant families. Chloroflexaceae remained highly abundant (0.260; +22% compared to RM2), whereas Nocardiaceae decreased sharply to 0.102 (p < 0.05). A substantial enrichment of Thermomicrobiaceae (0.070) and Rubrobacteraceae (0.058) was observed in RM3, while Streptomycetaceae was nearly absent (0.001).
The bacterial community composition at the genus level varied significantly among the three soil samples (Figure 4B). In RM1, the most abundant genera were Nocardioides (5.38%), Pseudonocardia (3.41%), and Skermanella (3.04%), whereas RM2 was dominated by Rubrobacter (2.74%), Thermobaculum (1.68%), and Conexibacter (0.64%), and RM3 by Rubrobacter (3.96%), Thermobaculum (3.64%), and Nocardioides (0.08%). Comparative analysis of genus-level relative abundances revealed that several taxa were significantly enriched in specific soils (p < 0.05, Kruskal–Wallis test), including Nocardioides and Skermanella in RM1, Conexibacter and Bacillus in RM2, and Rubrobacter and Thermobaculum in RM3. Heatmap clustering supported these distinctions, showing clear separation of the three samples based on dominant genera. These results indicate that bacterial community structure is strongly shaped by local environmental conditions, with distinct genera preferentially associated with each soil type.
Metagenomic analysis at the species level revealed distinct bacterial communities in the three soil samples (Figure 5). RM1 was characterized by higher relative abundances of Skermanella aerolata (1.03%), Vaucheria litorea (0.67%), and Blastococcus aggregatus (0.26%), whereas RM2 was enriched in Parviterribacter kavangonensis (0.49%), Sporosarcina sp. AB 64 (0.39%), and Arenimicrobium luteum (0.19%). RM3 was dominated by Parviterribacter kavangonensis (0.80%) and low-abundance species such as Salinarimonas sp. GCR3139 (0.012%). Most species were present at very low relative abundances (<0.2%), representing a long tail of rare taxa. Statistical comparisons using the Kruskal–Wallis test confirmed that the relative abundances of several species, including Skermanella aerolata, Vaucheria litorea, and Sporosarcina sp., differed significantly among the three soils (p < 0.05). Hierarchical clustering of the heatmap further showed that RM1 formed a separate cluster from RM2 and RM3, reflecting distinct species assemblages. Collectively, these results indicate that each soil harbors a unique species-level bacterial composition, likely influenced by localized environmental factors.
Figure 5.
(Left) a heatmap of species abundance clustering. The heatmap shows the hierarchical clustering of samples based on the relative abundance of the top ranked 35 genera soil samples in arid (RM, Ouasis Djanet) and semi-arid regions (RM2, Tassili Djanet; and RM3, El Ouricia forest). The relative values in the heatmap (after normalization), depicted by colors, indicate the aggregation degree or content of bacterial species among samples at the genus level. (Right) cluster analysis with the Unifrac distance matrix based on the weighted Unifrac distance.
3.4. Analysis of Discrepancies Between Groups
Metagenomic analysis at the phylum level revealed that the microbial communities of the three samples were dominated by members of the phyla Actinobacteriota and Proteobacteria, which together accounted for more than 80% of the relative abundance across all samples (Figure 5). Actinobacteriota represented the most abundant group in RM1, while Proteobacteria proportions were comparatively lower. In contrast, RM2 and RM3 exhibited a more balanced distribution between Actinobacteriota and Proteobacteria, along with slightly higher contributions from minor phyla such as Chloroflexi, Bacteroidota, and Acidobacteriota. Consistent with these taxonomic profiles, hierarchical clustering based on the weighted UniFrac distance showed that RM2 and RM3 were more closely related to each other than to RM1, indicating greater similarity in community composition between these two samples. The higher relative abundance of Actinobacteriota in RM1 suggests a more specialized microbial community, whereas RM2 and RM3 appeared to harbor more phylogenetically diverse communities due to the increased representation of less abundant phyla.
At the genus/species level, the microbial community composition revealed marked variation among the three samples (Figure 5). The heatmap shows clear clustering, with RM2 and RM3 grouping closely together and displaying similar taxonomic profiles, whereas RM1 forms a distinct cluster, consistent with phylum-level patterns.
RM1 was enriched with members of Actinobacteriota (e.g., Blastococcus aggregatus, Skermanella aerolata, Nocardiodes sp. MSL 21) and Acidobacteriota (Acidobacteria bacterium SCN_69-37, Acidobacteria bacterium WX72), suggesting a strong dominance of Actinobacterial and acidobacterial taxa in this sample. In contrast, RM2 and RM3 were characterized by a higher relative abundance of Proteobacteria, including taxa such as Sphingomonas flava, Methylobacterium organophilum, and Parvibacter kavangonensis. Additionally, minor phyla such as Planctomycetota (Planctomycote WY108), Nitrospirota (Nitrospira sp.) and Chloroflexi (Chloroflexi bacterium JEA33) were detected in lower proportions, contributing to the overall microbial diversity of RM2 and RM3.
Overall, these results indicate that RM1 harbored a more specialized community dominated by Actinobacteriota and Acidobacteriota, while RM2 and RM3 supported more phylogenetically diverse assemblages with greater representation of Proteobacteria and other minor phyla. The clustering analysis further confirmed that RM2 and RM3 shared highly similar microbial profiles, whereas RM1 was taxonomically distinct.
3.5. Alpha and Beta Diversity
Alpha diversity metrics revealed comparable microbial diversity across the three soils, but with distinct patterns of variability (Figure 6, Left). The Shannon diversity index showed similar median values for RM1, RM2, and RM3 (3.3–3.4), indicating broadly consistent community evenness and richness across sites. However, diversity dispersion differed: RM1 displayed a narrower interquartile range, reflecting a relatively stable assemblage, whereas RM2 and RM3 exhibited broader distributions, with RM2 reaching the highest maximum (~4.45) and RM3 spanning the widest overall range (3.0–4.4). These patterns suggest that RM2 and RM3 harbor more heterogeneous communities compared to the relatively uniform structure of RM1.
Figure 6.
Comparisons of alpha diversity (Shannon and observed species index) and beta diversity (with weighted and unweighted Unifrac distance matrix) of soil bacteria between arid and semi-arid regions.
In parallel, analysis of observed features, representing microbial richness, further supported these trends (Figure 6, right). RM1 was characterized by relatively constrained richness values (~2000–21,000), while RM2 and RM3 showed considerably wider distributions, with richness extending up to ~30,000 features. The particularly broad spread observed in RM3 indicates the coexistence of both low- and high-richness states, consistent with the variability detected in Shannon diversity. Collectively, these results demonstrate that while baseline diversity levels are comparable across the three soils, RM2 and RM3 exhibit greater heterogeneity in both richness and evenness, likely reflecting localized environmental gradients or niche specialization within these habitats.
Beta diversity patterns, assessed by NMDS ordination, further supported these observations (Figure 6). Distinct clustering of RM1, RM2, and RM3 indicates that the three soils hosted taxonomically differentiated microbial communities, with minimal overlap among sites. The clear spatial separation in NMDS space highlights the role of local environmental conditions and selective pressures in shaping community composition. Together, these findings demonstrate that while baseline alpha diversity levels are broadly consistent across soils, RM2 and RM3 harbor more heterogeneous communities, and all three soils maintain distinct community structures at the compositional level.
Beta diversity analysis supported the taxonomic patterns observed at both phylum and genus/species resolution (Figure 7). Pairwise dissimilarity indices indicated that RM2 and RM3 were the most compositionally similar (dissimilarity = 0.149), whereas RM1 was more distinct from RM2 (dissimilarity = 0.396) and from RM3 (dissimilarity = 0.466). Hierarchical clustering based on weighted UniFrac distances grouped RM2 and RM3 together and separated RM1, corroborating the beta diversity results. Collectively, multilevel analyses indicated that RM1 harbored a more specialized community dominated by Actinobacteriota and Acidobacteriota, while RM2 and RM3 supported a more balanced assemblage with greater representation of Proteobacteria and increased contributions from several low-abundance phyla.
Figure 7.
Pairwise community dissimilarity among RM1, RM2, and RM3 estimated using weighted UniFrac. The color scale indicates dissimilarity (0 = identical, 1 = maximally different). Numeric values in each upper-triangle cell are the pairwise weighted UniFrac dissimilarities. Values shown in parentheses are the corresponding ANOSIM R statistic (permutation test) for the same pairwise comparison—a measure of separation where values closer to 1 indicate stronger between-group differentiation.
The circular cladogram derived from LEfSe analysis (Figure 8) reveals a diverse and structured bacterial community across the three soil samples (RM1, RM2, and RM3), with significant lineage-specific enrichments distinguishing each site. At the phylum level, Actinobacteriota was the most dominant group, accounting for approximately 35–40% of the total sequences, followed by Proteobacteria (25–30%), Bacteroidota (10–15%), and Cyanobacteria (8–12%). Minor yet consistent contributions were observed from Firmicutes (3–5%), Chloroflexi (2–4%), Planctomycetota (2–3%), and Verrucomicrobiota (<2%).
Figure 8.
A circular cladogram of bacterial taxa significantly enriched across soil samples RM1, RM2, and RM3 as determined by LEfSe analysis. The tree displays the phylogenetic relationships of taxa from the phylum to the genus level, with branch colors corresponding to distinct phyla. The outer rings represent relative abundances in each soil sample (red = RM1, yellow = RM2, green = RM3), with bar length proportional to taxon abundance. The red dashed circles highlight lineages identified as statistically significant biomarkers in at least one soil type (LDA score > 2.0, p < 0.05). Dominant phyla include Actinobacteriota, Proteobacteria, Bacteroidota, and Cyanobacteria, with RM1 enriched in actinobacterial lineages (e.g., Streptomycetaceae, Micromonosporaceae), RM3 characterized by proteobacterial taxa (Rhizobiales, Burkholderiales), and RM2 showing distinct enrichment of Bacteroidota and Planctomycetota. The cladogram highlights the taxonomic divergence and site-specific microbial signatures shaped by the environmental conditions of each soil.
Comparative analysis of the outer abundance profiles revealed pronounced differences between the samples. RM1 was particularly enriched in actinobacterial lineages, including members of the families Streptomycetaceae and Micromonosporaceae, which collectively represented nearly 40% of the bacterial community in this soil. In contrast, RM3 exhibited higher proportions of Proteobacteria, notably taxa affiliated with Rhizobiales and Burkholderiales, which together contributed over 30% of its microbial community. RM2 displayed a distinct profile characterized by the predominance of Bacteroidota and Planctomycetota taxa, together accounting for nearly 20% of the relative abundance, suggesting niche-specific adaptations in this habitat.
The LEfSe analysis, indicated by the red dashed branches, identified multiple biomarker lineages that discriminated between soils. Several actinobacterial taxa, including Streptomyces spp., were significantly associated with RM1, consistent with its higher microbial diversity and putative capacity for secondary metabolite production. RM3 was characterized by proteobacterial biomarkers such as Rhizobium and Pseudomonas, taxa frequently linked to plant growth promotion and nutrient cycling. Conversely, RM2 was marked by enrichment of Bacteroidota and Chloroflexi lineages, taxa often involved in polysaccharide degradation and soil organic matter turnover.
Together, these results demonstrate that although the three soils shared a core microbial composition, their communities diverged markedly in lineage-specific abundances and biomarker taxa. Such patterns highlight the influence of local environmental pressures on microbial community assembly and suggest distinct ecological roles for Actinobacterial, proteobacterial, and bacteroidotal lineages across the sampled habitats.
3.6. Functional Profiles of Bacterial Community
The functional profiling of microbial communities based on KEGG orthologous groups revealed clear differences in predicted metabolic capabilities among RM1, RM2, and RM3 (Figure 9). Functional profiling of the soil bacterial communities revealed a conserved metabolic core alongside site-specific functional specializations aligned with local edaphic gradients. At the broadest level, metabolism dominated predicted functions (RM1 48.4%, RM2 50.4%, RM3 51.6%), followed by genetic information processing (≈22–23%), environmental information processing (≈11–12%), and cellular processes (≈6–7%); KEGG categories labeled as “Human diseases” and “Organismal systems” remained minor (~2–2.5%) and likely reflect homologous stress- and signaling-related genes rather than pathogenicity. At the pathway level, carbohydrate (≈10.9–11.2%) and amino acid metabolism (≈10.2–10.8%) formed the metabolic backbone, translation functions declined slightly from RM1 (10.4%) to RM3 (9.7%), while lipid metabolism increased from 4.2% to 5.7%, consistent with membrane- and storage-related stress adaptations; xenobiotics biodegradation and secondary metabolite pathways were also enriched in RM3. Level 3 modules highlighted a progressive enrichment of transporter functions (ABC transporters: RM1 12.7%, RM2 13.4%, RM3 14.1%), with glycolysis/gluconeogenesis (≈3.6–3.8%) and the TCA cycle (≈2.7–2.9%) remaining stable, and amino acid-centric pathways (e.g., cysteine/methionine ~2.1–2.3%; arginine/proline ~1.8–2.0%) elevated in RM2–RM3. KO-level analysis pinpointed drivers of these patterns: transport-related KOs (ABC family members including K02031–K02035 and K02067) and carbohydrate-degrading enzymes (e.g., K00666) increased toward RM2–RM3, while DNA maintenance and oxidoreductase KOs (e.g., K06994, K00257) were also relatively enriched in RM2–RM3; the most abundant single KO was K08300 (ribosomal protein S12 methylthiotransferase). Functionally, RM1 exhibited a sensor/dispersal-oriented signature (higher transporters and motility-related KOs), whereas RM2 and RM3 emphasized enhanced substrate acquisition, amino acid catabolism and lipid remodeling—patterns that map onto measured soil conditions (RM2: surface temperature ≈48 °C, moisture ≈4.8%, EC ≈11.7 dS·m−1; RM3: moisture ≈10.9%, organic matter ≈7.6%). These results indicate that while dryland microbiomes retain core carbon and energy pathways, communities in more extreme or moisture-limited sites shift toward increased uptake and targeted internal metabolism to maintain carbon turnover and resilience; note that these inferences are based on gene presence/potential rather than direct measures of activity.
Figure 9.
A heatmap of the predicted functional profiles of microbial communities from soil samples RM1, RM2, and RM3 based on KEGG orthologous groups. (Right) KEGG Level 3 module abundances (%) for selected modules. The heatmap includes key modules discussed in the text (e.g., ABC transporters, glycolysis/gluconeogenesis, TCA cycle, cysteine/methionine metabolism, arginine/proline metabolism, two-component systems, motility/signal transduction) with exact values for RM1–RM3. (Left) KO-level abundances (%) for selected KOs driving functional differences among soils. The table lists KOs (ID and name, e.g., K08300, K06994, K00257, K02031–K02035, K02067, K00666, K02014) with their relative abundances in RM1–RM3. Color intensity indicates relative abundance, ranging from high (red) to low (blue).
4. Discussion
4.1. Soil Properties
Soil texture, salinity, and organic matter differed consistently among sites and match expectations for forest–oasis–desert gradients. The high sand fraction and low clay in the Tassili of Djanet explain its low water-holding capacity and reduced nutrient retention relative to El Ouricia forest soils, which contain more silt/clay and greater moisture and organic matter. Texture-driven differences in hydraulic and retention properties commonly underlie such edaphic contrasts in arid–semi-arid systems [16,17]. In addition, the higher soil pH recorded in the Tassili desert (and the generally alkaline range across sites) likely reflects carbonate accumulation and the low organic acid inputs typical of sparse vegetation and high evaporation regimes. In contrast, El Ouricia’s relatively lower pH and higher organic matter content indicate greater biological input and leaching effects under forest vegetation—processes that commonly moderate alkalinity and increase H+ activity in more vegetated systems. Soil pH also modulates the expression of CEC and the speciation of several nutrient cations, making pH an important control on nutrient availability across the gradient [18]. Furthermore, elevated electrical conductivity (EC) and sulfate concentrations at Tassili are indicative of salinization processes driven by strong evaporative demand and salt accumulation in hyper-arid environments; EC is a robust proxy for soluble salt burden and osmotic stress on biota. In contrast, the lower EC and higher organic matter content at El Ouricia favor greater nutrient availability and biological activity [19,20].
The measured distribution of exchangeable cations (higher Ca2+ and Mg2+ in El Ouricia forest; moderate Na+ and Cl− in Oasist; dominant SO42− in Tassili Djanet) is consistent with differing dominant processes: biological cycling and weathering in the forest and evapoconcentration and sulfate mineral precipitation in the desert. These ionic differences will influence plant nutrition, microbial community composition, and enzymatic activity: for example, high salinity (EC and specific ions) can reduce microbial biomass and select for halotolerant taxa, while higher OM content and CEC favor more diverse and metabolically active communities [21,22]. Also, higher organic matter content in El Ouricia likely contributes to its greater cation exchange capacity (CEC) and retention of Ca2+, Mg2+ and K+, whereas the oasis shows intermediate conditions reflecting local water inputs and vegetation. In the same line, sulfate dominance in Tassili is consistent with atmospheric deposition and evaporative crystallization processes observed in other hyper-arid soils. These physicochemical gradients are expected to strongly filter microbial community composition and functional potential across the three sites [23,24].
Overall, the stark edaphic gradient documented across the El Ouricia forest, Oasis of Djanet, and Tassili of Djanet (increasing moisture and organic matter versus increasing sand content, electrical conductivity, and sulfate) creates a strong environmental filter that should be readily recoverable in metagenomic analysis. In saline, alkaline, sand-dominated soils such as Tassili, salinity and pH are expected to be the dominant deterministic drivers reducing overall microbial α diversity and selecting for osmotolerant, spore-forming, and stress-adapted lineages (e.g., halotolerant Proteobacteria, certain Actinobacteria and Firmicutes, and where salinity is extreme, archaeal taxa) [25,26]. Conversely, the higher organic matter and moisture levels in El Ouricia should favor nutrient-acquisitive, polymer-degrading taxa and a richer fungal component, producing a metagenomic signature characterized by expanded repertoires of carbohydrate-active enzymes (CAZymes) and genes associated with heterotrophic nutrient cycling [27,28]. Furthermore, soil samples were collected at a single time point, and therefore, seasonal variations in temperature and moisture were not captured. It is well known that temporal dynamics can influence microbial community composition in drylands. Consequently, our results represent a snapshot of microbial communities under the sampled conditions and should be interpreted accordingly.
4.2. Quality of Metagenomic Reads
In this study, primer-dependent amplification bias cannot be completely excluded and represents a known limitation of Denoising amplicon-based approaches. Overall, the sequencing depth and per-base quality were excellent: each sample yielded >160,000 paired-end reads, high merged-tag counts and strong Q20/Q30 rates, and 62,000–100,000 effective tags after filtering, providing sufficient power for robust α- and β diversity analyses and detection of low-abundance taxa [29,30]. The pronounced reduction in read number after quality and chimera filtering is expected and—given the high Q scores—indicates successful removal of artifacts that would otherwise inflate diversity estimates [31]. From another point of view, the significant increase in GC content from RM1 to RM3 is likely biologically meaningful (community composition shifts) but may also reflect GC bias during PCR/sequencing; therefore, one should interpret GC-related patterns cautiously and, where relevant, validate key taxa/abundance changes with independent checks or report GC diagnostic plots [32].
As recommended by [12,33], the use of ASV-based denoising (e.g., DADA2/QIIME 2), reporting all pipeline parameters and coverage diagnostics (rare faction/Good’s coverage), and applying compositional-aware statistics (DESeq2/ANCOM or similar) rather than simple rarefaction for differential analyses resulted in high reproducibility and accurate inference. Although methodological factors such as sequencing depth and ASV filtering thresholds may contribute to reduced overlap, the pronounced site-specificity observed here is consistent with strong environmental filtering across contrasting aridity gradients.
Additionally, a limitation of this study is the use of composite soil samples, which may obscure fine-scale spatial heterogeneity within each site. While this approach is commonly used in large-scale ecological surveys to capture dominant community patterns, it does not allow for an assessment of microhabitat-level variability. Therefore, our conclusions primarily reflect ecosystem-level differences rather than within-site spatial structure.
4.3. Metagenomic Analysis
The integrative analysis of soil microbial communities across RM1 (oasis), RM2 (transition), and RM3 (forest) demonstrates clear differences in community richness, diversity, and composition, reflecting distinct ecological filters and habitat-specific microbial adaptation.
- (a)
- Diversity patterns
Alpha diversity indices consistently highlighted RM1 as the most taxonomically rich and diverse habitat. Chao1 values confirmed higher species richness in RM1, while Shannon and Simpson indices demonstrated more balanced communities with fewer dominant taxa compared to RM2 and RM3. Pielou’s evenness further supported this trend, suggesting that oasis soils harbor both abundant and rare taxa in a relatively equitable distribution. In contrast, RM2 and especially RM3 showed reduced richness and lower evenness, indicative of communities dominated by a few specialized groups. Rarefaction curves plateaued for all samples, supported by Good’s coverage estimates exceeding 0.99, confirming sufficient sequencing depth to capture the majority of microbial diversity. Rank–abundance distributions further emphasized the broader species spread in RM1 and the steep dominance of few taxa in RM3.
Our results clearly show an elevated microbial richness and evenness in RM1 (Oasis of Djanet), as evidenced by higher Chao1 and Shannon indices coupled with more uniform rank–abundance distributions, aligning closely with findings from irrigated desert soils in Northwest China. There, oasis-like zones support significantly higher α diversity compared to adjacent desert soils, illustrating how vegetation and water availability bolster microbial richness [34]. This also mirrors studies from Qatar’s arid soils, where alpha diversity (OTU richness, Shannon, Faith’s PD) correlates positively with coarser texture (sand/clay ratios), with more diverse communities in less saline and more nutrient-rich microhabitats [35]. In contrast, the reduced richness and evenness observed in RM3, along with its pronounced taxonomic dominance, resemble patterns reported in degraded semi-arid pastures in China, where a limited number of resilient taxa prevail under nutrient-poor and moisture-constrained conditions [36]. Furthermore, the high Good’s coverage (>0.99) and the asymptotic rarefaction curves parallel best practices in microbiome studies, and were also reported in microbial surveys of the Atacama Desert, where comprehensive sampling was critical to capture rare taxa across hyper-arid landscapes [37].
Our beta diversity analyses revealed significant structuring of microbial communities across the three soil habitats, with both weighted and unweighted UniFrac metrics showing strong segregation. This indicates that not only dominant taxa but also low-abundance members contribute to the observed differentiation. The clustering of RM2 and RM3 in the weighted UniFrac space suggests a shared pool of abundant microbial taxa, while the stronger separation of RM1 in unweighted analyses highlights the distinctiveness of rare microbial lineages in that habitat. Similar patterns have been reported in soil microbiome studies, where abundant taxa tend to respond to broad edaphic factors such as pH and organic matter, whereas rare taxa are more sensitive to microhabitat variation and resource heterogeneity [38,39].
The robustness of these findings was further confirmed by PERMANOVA and ANOSIM, both of which excluded stochastic variation as the main driver of the observed patterns. This aligns with evidence that deterministic processes such as soil chemistry, vegetation cover, and microclimate exert stronger selective pressures than neutral processes in shaping bacterial assemblages [40,41]. In particular, the differentiation of RM1 suggests that this environment harbors a distinct ecological niche that selects for unique microbial guilds, consistent with studies showing that site-specific conditions such as water availability or mineral content can lead to habitat-exclusive taxa [42].
The contrasting insights obtained from weighted versus unweighted UniFrac highlight the importance of integrating abundance-based and presence/absence-based metrics. Weighted UniFrac captures the ecological dominance of abundant lineages, which are critical for key soil functions such as nutrient cycling and organic matter turnover [43]. Conversely, unweighted UniFrac provides sensitivity to rare taxa, which, despite their low abundance, can act as reservoirs of functional redundancy and adaptive potential under environmental stress [44]. The combined use of these approaches thus provides a more holistic view of community structure and its ecological implications.
Our findings resonate with broader biogeographic patterns in microbial ecology, where community similarity often decreases with increasing spatial and environmental distance [45]. The closer similarity between RM2 and RM3 may therefore reflect overlapping environmental conditions, while the distinctiveness of RM1 could indicate a more divergent edaphic profile. These results support the concept that soil microbial beta diversity is strongly tied to environmental gradients and land use patterns [46].
- (b)
- Core and unique microbiome
The Venn diagram analysis demonstrated that only 58 OTUs were shared across all sites, representing a small but ecologically important core microbiome. Such a conserved microbial backbone is consistent with findings from agricultural and natural soils, where a limited set of ubiquitous taxa contribute disproportionately to essential ecosystem processes, including organic matter decomposition, nitrogen mineralization, and phosphorus turnover [47,48]. The predominance of unique OTUs at each site underscores the strong environmental filtering acting on these habitats, driving niche specialization and limiting functional redundancy [49,50]. RM1 harbored the highest number of exclusive taxa, suggesting that it may function as a microbial reservoir enriched with copiotrophic lineages adapted to resource-rich conditions, a pattern also reported in fertile agricultural soils [51]. In contrast, RM3 contained the fewest shared taxa and was dominated by stress-tolerant specialists, in line with studies showing that arid and nutrient-limited soils select for oligotrophic and extremotolerant microorganisms with restricted functional versatility [52,53]. These site-specific assemblages highlight the balance between a minimal universal core sustaining fundamental soil processes and a highly variable satellite microbiome that underpins local adaptation to environmental constraints.
- (c)
- Taxonomic composition
At the phylum level, the enrichment of Actinobacteriota and Proteobacteria in RM1 highlights the role of oasis soils as hotspots of copiotrophic microbial activity. Both phyla are well documented for their ability to exploit carbon-rich substrates, produce hydrolytic enzymes, synthesize antibiotics, and promote plant growth [54,55]. Similar patterns have been observed in fertile agricultural soils, where these taxa dominate due to their rapid growth strategies and competitive advantage under resource-rich conditions [56,57,58]. In contrast, the dominance of Chloroflexi and Thermoleophilia in RM2 and RM3 reflects adaptation to oligotrophic, nutrient-poor, and saline habitats. These groups are recognized as metabolically versatile, stress-tolerant lineages capable of enduring desiccation and osmotic fluctuations, traits often reported in arid and semi-arid soils [6,59].
At the order level, the prevalence of Micromonosporales and Pseudonocardiales in RM1 underscores their ecological role as efficient decomposers and antibiotic producers in organic matter-rich environments [60,61]. Conversely, the enrichment of Kallotenuales and Thermomicrobiales in RM2 and RM3 supports evidence from desert soil metagenomes showing that Chloroflexi-affiliated lineages are dominant under nutrient limitation and high salinity, where slow growth and resource efficiency confer adaptive advantages [59,62]. Collectively, these findings demonstrate that soil microbial assemblages are shaped by contrasting life-history strategies: RM1 fosters nutrient-responsive decomposers that enhance organic matter turnover, whereas RM2 and RM3 select for oligotrophic specialists that maintain ecosystem function under resource scarcity.
At the species level, the three habitats exhibited clear compositional divergence, reflecting distinct ecological filters. RM1 was dominated by Skermanella aerolata and phototrophic eukaryote Vaucheria litorea, suggesting that oasis soils provide favorable conditions for aerobic heterotrophs and phototrophic lineages. S. aerolata, a member of Alphaproteobacteria, has previously been isolated from air and soil environments, where it plays a role in nitrogen cycling and organic matter [1,63]. The co-occurrence of V. litorea is consistent with earlier studies showing that phototrophic microalgae can thrive in moist microhabitats of fertile soils, contributing to soil stabilization and primary productivity [64]. In contrast, RM2 was enriched in Parviterribacter kavangonensis and Sporosarcina sp., taxa typically associated with oligotrophic and stressed soils. P. kavangonensis, a member of the family Parviterribacteraceae, has been reported in arid and nutrient-poor environments, where its metabolic versatility supports persistence under low-resource conditions [33]. Similarly, spore-forming Sporosarcina species are adapted to survive cycles of desiccation and nutrient limitation, consistent with their dominance in semi-arid soils [2].
RM3 shared the enrichment of P. kavangonensis but also harbored Thermobaculum-related taxa such as Craurococcus–Caldovatus, lineages well known for their thermophilic adaptations and tolerance to harsh edaphic changes [65,66]. The occurrence of Blastococcus aggregatus and Gemmatimonadetes bacterium LP81 as site-specific taxa in RM1 further highlights the role of oasis soils as reservoirs for desiccation-resistant and photoheterotrophic species, traits frequently reported among Actinobacteria and Gemmatimonadetes [67,68]. In contrast, the detection of Quadrisphaera granulorum and Solirubrobacterales-affiliated bacteria in RM2 and RM3 is consistent with previous studies demonstrating the prevalence of slow-growing, oligotrophic Actinobacteria in nutrient-poor soils [69].
The high proportion of unclassified or low-abundance species (“Others”) across all samples underscores the vast unexplored diversity within arid and semi-arid soils. Similar findings from desert microbiome surveys have emphasized that rare biosphere members, despite low relative abundance, may serve as critical reservoirs of functional traits that enable microbial communities to withstand environmental fluctuations [70,71]. Taken together, these results highlight a spectrum of life-history strategies: RM1 favors aerobic and phototrophic taxa adapted to organic matter-rich conditions, RM2 selects for spore-forming and oligotrophic specialists, and RM3 supports thermophilic and stress-tolerant Actinobacteria. This niche partitioning suggests that soil microbial assemblages are shaped by the interplay between resource availability, thermal regime, and desiccation stress.
The integration of taxonomic, functional, and environmental analyses revealed that soil bacterial communities in the three contrasting Algerian sites (RM1, RM2, and RM3) were strongly structured by edaphic and climatic constraints. At the taxonomic level, RM1 (oasis soil) was enriched in Actinobacteria and Firmicutes, groups typically associated with organic matter turnover and drought resistance, while RM2 (Tassili desert) harbored stress-adapted Proteobacteria and Chloroflexi, reflecting selective pressure under extreme temperature (48 °C), high sand content, and low moisture. In contrast, RM3 (forest soil) supported a more balanced assemblage dominated by Proteobacteria, Acidobacteria, and Cyanobacteria, consistent with its higher organic matter content (7.58%) and moisture (10.89%), which favor copiotrophic and photosynthetic lineages. Similar biogeographical patterns have been reported in arid and semi-arid soils worldwide, where Actinobacteria dominate under nutrient limitation and thermal stress, whereas Acidobacteria and Cyanobacteria increase under more mesic conditions [72,73]. In fact, Proteobacteria relative abundance was positively correlated with soil moisture (p < 0.05) and organic matter, and negatively correlated with salinity.
- (d)
- Functional profiling
The functional KEGG predictions, when examined in light of the measured edaphic parameters, provide strong evidence that local soil conditions are key determinants of microbial metabolic potential. Despite the conservation of core functions such as ribosome biogenesis, oxidative phosphorylation, and aminoacyl-tRNA biosynthesis across all soils, marked divergences were observed that can be directly linked to differences in temperature, moisture, salinity, and nutrient availability. However, regardless of the methodological differences among PICRUSt2, Tax4Fun, and FAPROTAX, all approaches consistently indicated enrichment of stress-related metabolic pathways, supporting the robustness of the inferred functional trends.
The desert soil RM2, characterized by extremely high surface temperature (48 °C), low humidity (26%), minimal moisture (4.81%), and elevated electrical conductivity (11.67 dS m−1), displayed a functional profile dominated by DNA repair, replication and recombination proteins, and carbohydrate metabolism pathways. These functions are hallmarks of stress adaptation, enabling microorganisms to cope with oxidative stress, desiccation, and high osmotic pressure [74,75]. The enrichment of glyoxylate/dicarboxylate metabolism and amino sugar pathways further suggests a reliance on stress-resilient carbon assimilation routes. These findings are consistent with reports from hyper-arid soils where limited water availability selects for taxa investing in genomic stability and carbohydrate salvage pathways rather than energy-expensive biosynthetic functions [76].
In contrast, the forest soil RM3 was comparatively cooler (27 °C), with higher humidity (45%), greater moisture (10.89%), and enriched organic matter (7.58%). These conditions supported a broader functional repertoire, particularly amino acid metabolism (tryptophan, valine, leucine, and isoleucine degradation), lipid biosynthesis, and two-component signaling systems. Such enrichment reflects a more versatile and interactive microbial community, adapted to fluctuating nutrient inputs and plant-associated signals typical of forested environments [47,77]. The elevated Ca2+ (41.53 mEq/L−1) and Mg2+ (13.73 mEq/L−1) concentrations may further promote microbial activity and enzymatic cofactor availability, facilitating enhanced metabolic exchange.
The oasis soil RM1 occupied an intermediate niche, with moderate temperature (25 °C), intermediate salinity (EC = 10.28 dS m−1), and relatively high organic matter (4.89%). Its functional signature was dominated by glycolysis, pyruvate metabolism, fatty acid degradation, and secondary metabolite biosynthesis pathways, including butanoate metabolism and quorum sensing. These functions suggest a community optimized for the catabolism of diverse carbon inputs and microbial cross-talk, consistent with the high representation of actinobacterial lineages known for producing bioactive compounds in semi-arid oases [26,78]. The observed balance of carbon degradation and signaling pathways may represent an adaptive strategy to exploit transient nutrient pulses while maintaining competitive fitness. Furthermore, similar enrichment of transporters and lipid metabolism pathways has been reported in transcriptomic and proteomic analyses of desert soils, where these functions are associated with osmotic stress tolerance and membrane stabilization.
Together, these results highlight that temperature, soil moisture, salinity, and organic matter are the principal drivers shaping the functional specialization of soil microbiomes. RM2 microbes emphasize stress tolerance and genome maintenance, RM1 communities exploit carbon-rich niches via energetic and signaling pathways, and RM3 harbors a metabolically versatile assemblage linked to nutrient turnover and ecological interactions. These findings reinforce the concept that functional redundancy in soils coexists with environment-driven functional divergence, whereby conserved basal processes are supplemented by niche-specific metabolic strategies [79,80].
Taken together, these findings demonstrate that temperature and soil properties act synergistically to shape the taxonomic composition and functional specialization of soil bacterial communities in Algerian arid and semi-arid ecosystems. The observed coupling between environment, taxonomy, and function highlights the ecological resilience of microbial assemblages and their capacity to maintain essential processes under extreme conditions. This ecological plasticity may be crucial for predicting microbial contributions to nutrient cycling, carbon storage, and ecosystem stability under ongoing desertification and climate change scenarios in North Africa.
5. Conclusions
This study provides an integrated overview of the bacterial community composition, functional potential, and environmental drivers shaping soils across contrasting Algerian arid and semi-arid ecosystems. Taxonomic profiling revealed that Actinobacteria, Proteobacteria, and Cyanobacteria dominated these soils, with site-specific differences reflecting adaptation to local temperature, pH, moisture, and salinity regimes. Functional prediction based on KEGG pathways highlighted clear metabolic specialization: desert soils were enriched in genes associated with stress tolerance and energy conservation, whereas oasis and forest soils displayed higher capacities for organic matter degradation, nutrient cycling, and photosynthesis. These findings underscore that temperature and soil properties act as principal drivers of both taxonomic assembly and functional specialization, ultimately determining microbial contributions to ecosystem functioning under extreme environments.
Furthermore, Actinobacteriota, particularly members affiliated with Streptomyces and Nocardiopsis, are known producers of secondary metabolites such as antibiotics, pigments, anti-inflammatory compounds and stress-resistant enzymes, highlighting the biotechnological potential of Algerian dryland soils.
Beyond advancing our understanding of microbial ecology in North African drylands, this work highlights the adaptive capacity and ecological resilience of bacterial communities in sustaining critical biogeochemical processes under aridity. Such insights are highly relevant in the context of global climate change and desertification, where microbial functions may protects ecosystems against environmental stress.
Future studies should move beyond predictive inferences and employ shotgun metagenomics, metatranscriptomics, and metabolomics to validate functional potential and identify active pathways under fluctuating stress conditions. Longitudinal monitoring across seasons will also be essential to capture microbial dynamics in response to moisture pulses and temperature extremes. Finally, translating these insights into applied strategies—such as harnessing stress-resilient microbes for biofertilizers, soil restoration, and sustainable agriculture in arid regions—offers a promising avenue for both ecosystem management and biotechnological innovation.
Author Contributions
M.G., A.J. and H.B.: conceived and designed the study and experiments; M.G. and A.G.: sample collection; M.G.: performed the experiments; M.G., Z.G. and H.B.: analyzed the data; M.G., H.B., Z.G., A.G., A.G.B. and A.J.: contributed reagents, materials, and analysis tools; H.B.: wrote the paper; A.J.; A.G.B., H.B. and Z.G.: revised the manuscript. All authors have read and agreed to the published version of the manuscript.
Funding
This research received no external funding.
Institutional Review Board Statement
Not applicable.
Informed Consent Statement
Not applicable.
Data Availability Statement
All of the data in the article are available from the corresponding author upon reasonable request.
Conflicts of Interest
The authors declare that they have no known competing financial interests or personal relationships that could have appeared to influence the work reported in this paper.
References
- Alsharif, W.; Saad, M.M.; Hirt, H. Desert Microbes for Boosting Sustainable Agriculture in Extreme Environments. Front. Microbiol. 2020, 11, 1666. [Google Scholar] [CrossRef] [Scilit]
- Li, S.; Lian, W.-H.; Han, J.-R.; Ali, M.; Lin, Z.-L.; Liu, Y.-H.; Li, L.; Zhang, D.-Y.; Jiang, X.-Z.; Li, W.-J.; et al. Capturing the microbial dark matter in desert soils using culturomics-based metagenomics and high-resolution analysis. npj Biofilms Microbiomes 2023, 9, 67. [Google Scholar] [CrossRef] [Scilit]
- Banerjee, S.; van der Heijden, M.G.A. Soil Microbiomes and One Health. Nat. Rev. Microbiol. 2022, 21, 6–20. [Google Scholar] [CrossRef] [Scilit] [PubMed]
- Wardle, D.A. In Biological Diversity and Function in Soils; Bardgett, R., Usher, M., Hopkins, D., Eds.; How plant communities influence decomposer communities. Cambridge University Press: Cambridge, UK, 2005; pp. 119–138. [Google Scholar] [CrossRef] [Scilit]
- Leung, P.M.; Bay, S.K.; Meier, D.V.; Chiri, E.; Cowan, D.A.; Gillor, O.; Woebken, D.; Greening, C. Energetic basis of microbial growth and persistence in desert ecosystems. mSystems 2020, 5, e00495-19. [Google Scholar] [CrossRef] [Scilit] [PubMed]
- Dong, L.; Li, M.-X.; Li, S.; Yue, L.-X.; Ali, M.; Han, J.-R.; Lian, W.-H.; Hu, C.-J.; Lin, Z.-L.; Shi, G.-Y.; et al. Aridity drives the variability of desert soil microbiomes across north-western China. Sci. Total Environ. 2024, 907, 168048. [Google Scholar] [CrossRef] [Scilit]
- Bona, E.; Massa, N.; Toumatia, O.; Novello, G.; Cesaro, P.; Todeschini, V.; Boatti, L.; Mignone, F.; Titouah, H.; Zitouni, A.; et al. Climatic Zone and Soil Properties Determine the Biodiversity of the Soil Bacterial Communities Associated to Native Plants from Desert Areas of North-Central Algeria. Microorganisms 2021, 9, 1359. [Google Scholar] [CrossRef] [Scilit] [PubMed]
- Pochon, J. Techniques D’Analyse en Microbiologie du Sol; Editions de la Tourelle: Paris, France, 1965. [Google Scholar]
- Hansen, F.A.; James, D.; Anderson, J.; Meredith, C.; Dominguez, A.J.; Pombubpa, N.; Stajich, J.E.; Romero-Olivares, A.L.; Salley, S.W.; Pietrasiak, N. Landscape characteristics shape surface soil microbiomes in the Chihuahuan Desert. Front. Microbiol. 2023, 14, 1135800. [Google Scholar] [CrossRef] [Scilit]
- Hadaro, M.; Ayele, T.; Datt Sharma, P.; Teshome, R. Soil properties as affected by soil conservation practices and soil depths in Uwite Watershed, Hadero Tunto District, Southern Ethiopia. Appl. Environ. Soil Sci. 2021, 2021, 5542326. [Google Scholar] [CrossRef] [Scilit]
- Bahadori, M.; Tofighi, H. A Modified Walkley-Black Method Based on Spectrophotometric Procedure. Commun. Soil Sci. Plant Anal. 2015, 47, 213–220. [Google Scholar] [CrossRef] [Scilit]
- Callahan, B.J.; McMurdie, P.J.; Rosen, M.J.; Han, A.W.; Johnson, A.J.A.; Holmes, S.P. DADA2: High-resolution sample inference from Illumina amplicon data. Nat. Methods 2016, 13, 581–583. [Google Scholar] [CrossRef] [Scilit]
- Poulsen, C.S.; Kaas, R.S.; Aarestrup, F.M.; Pamp, S.J. Standard Sample Storage Conditions Have an Impact on Inferred Microbiome Composition and Antimicrobial Resistance Patterns. Microbiol. Spectr. 2021, 9, e0138721. [Google Scholar] [CrossRef] [Scilit]
- Bokulich, N.A.; Kaehler, B.D.; Rideout, J.R.; Dillon, M.; Bolyen, E.; Knight, R.; Huttley, G.A.; Gregory Caporaso, J. Optimizing taxonomic classification of marker-gene amplicon sequences with QIIME 2’s q2-feature-classifier plugin. Microbiome 2018, 6, 90. [Google Scholar] [CrossRef] [Scilit] [PubMed]
- Bolyen, E.; Rideout, J.R.; Dillon, M.R.; Bokulich, N.A.; Abnet, C.C.; Al-Ghalith, G.A.; Alexander, H.; Alm, E.J.; Arumugam, M.; Asnicar, F.; et al. Reproducible, interactive, scalable and extensible microbiome data science using QIIME 2. Nat. Biotechnol. 2019, 37, 852–857. [Google Scholar] [CrossRef] [Scilit]
- Huang, J.; Hartemink, A.E. Soil and environmental issues in sandy soils. Earth-Sci. Rev. 2020, 208, 103295. [Google Scholar] [CrossRef] [Scilit]
- Wang, G.; Gou, Q.; Hao, Y.; Zhao, H.; Zhang, X. Dynamics of Soil Water Content Across Different Landscapes in a Typical Desert-Oasis Ecotone. Front. Environ. Sci. 2020, 8, 577406. [Google Scholar] [CrossRef] [Scilit]
- Neilson, J.W.; Califf, K.; Cardona, C.; Copeland, A.; Van Treuren, W.; Josephson, K.L.; Knight, R.; Gilbert, J.A.; Quade, J.; Caporaso, J.G.; et al. Significant impacts of increasing aridity on the arid soil microbiome. mSystems 2017, 2, e00195-16. [Google Scholar] [CrossRef] [Scilit]
- Corwin, D.L.; Yemoto, K. Salinity: Electrical Conductivity and Total Dissolved Solids. Methods Soil Anal. 2017, 2, 1442–1461. [Google Scholar] [CrossRef]
- Rhoades, J.D.; Chanduvi, F.; Lesch, S.M. Soil Salinity Assessment: Methods and Interpretation of Electrical Conductivity Measurements; FAO: Rome, Italy, 2002. [Google Scholar]
- Shokri, N.; Hassani, A.; Sahimi, M. Multi-Scale Soil Salinization Dynamics from Global to Pore Scale: A Review. Rev. Geophys. 2024, 62, e2023RG000804. [Google Scholar] [CrossRef] [Scilit]
- Jehlička, J.; Oren, A.; Vítek, P.; Wierzchos, J. Microbial colonization of gypsum: From the fossil record to the present day. Front. Microbiol. 2024, 15, 1397437. [Google Scholar] [CrossRef] [Scilit]
- Ramos, F.T.; Dores, E.F.d.C.; Weber, O.L.d.S.; Beber, D.C.; Campelo, J.H.; Maia, J.C.d.S. Soil organic matter doubles the cation exchange capacity of tropical soil under no-till farming in Brazil. J. Sci. Food Agric. 2018, 98, 3595–3602. [Google Scholar] [CrossRef] [Scilit]
- Gázquez, F.; Voigt, C.; Claire, M.W.; Rull, F.; Medina, J.; Hodell, D.A. Revealing the mechanisms of soil gypsum formation in the Atacama Desert through triple oxygen and hydrogen isotopes of gypsum hydration water. CATENA 2024, 243, 108171. [Google Scholar] [CrossRef] [Scilit]
- Rath, K.M.; Fierer, N.; Murphy, D.V.; Rousk, J. Linking bacterial community composition to soil salinity along environmental gradients. ISME J. 2019, 13, 836–846. [Google Scholar] [CrossRef] [Scilit] [PubMed]
- Mohammadipanah, F.; Wink, J. Actinobacteria from Arid and Desert Habitats: Diversity and Biological Activity. Front. Microbiol. 2016, 6, 1541. [Google Scholar] [CrossRef] [Scilit]
- Rawls, W.J.; Pachepsky, Y.A.; Ritchie, J.C.; Sobecki, T.M.; Bloodworth, H. Effect of soil organic carbon on soil water retention. Geoderma 2003, 116, 61–76. [Google Scholar] [CrossRef] [Scilit]
- Hu, M.; Zhou, S.; Xiong, X.; Wang, X.; Sun, Y.; Meng, Z.; Hui, D.; Li, J.; Zhang, D.; Deng, Q. Dynamics of soil microbial communities involved in carbon cycling along three successional forests in southern China. Front. Microbiol. 2024, 14, 1326057. [Google Scholar] [CrossRef] [Scilit] [PubMed]
- Bokulich, N.A.; Subramanian, S.; Faith, J.J.; Gevers, D.; Gordon, J.I.; Knight, R.; Mills, D.A.; Caporaso, J.G. Quality-filtering vastly improves diversity estimates from Illumina amplicon sequencing. Nat. Methods 2012, 10, 57–59. [Google Scholar] [CrossRef] [Scilit]
- Kozich, J.J.; Westcott, S.L.; Baxter, N.T.; Highlander, S.K.; Schloss, P.D. Development of a Dual-Index Sequencing Strategy and Curation Pipeline for Analyzing Amplicon Sequence Data on the MiSeq Illumina Sequencing Platform. Appl. Environ. Microbiol. 2013, 79, 5112–5120. [Google Scholar] [CrossRef] [Scilit]
- Edgar, R.C.; Haas, B.J.; Clemente, J.C.; Quince, C.; Knight, R. UCHIME improves sensitivity and speed of chimera detection. Bioinformatics 2011, 27, 2194–2200. [Google Scholar] [CrossRef] [Scilit]
- Aird, D.; Ross, M.G.; Chen, W.-S.; Danielsson, M.; Fennell, T.; Russ, C.; Jaffe, D.B.; Nusbaum, C.; Gnirke, A. Analyzing and minimizing PCR amplification bias in Illumina sequencing libraries. Genome Biol. 2011, 12, R18. [Google Scholar] [CrossRef] [Scilit] [PubMed]
- Puente-Sánchez, F.; Pascual-García, A.; Bastolla, U.; Pedrós-Alió, C.; Tamames, J. Cross-biome microbial networks reveal functional redundancy and suggest genome reduction through functional complementarity. Commun. Biol. 2024, 7, 1046. [Google Scholar] [CrossRef] [Scilit]
- Zhang, Z.; Lu, Y.; Li, L.; Zeng, F.; Li, X.; Li, L.; Yue, J. Elevational patterns in the diversity and composition of soil archaeal and bacterial communities depend on climate, vegetation, and soil properties in an arid mountain ecosystem. CATENA 2025, 249, 108679. [Google Scholar] [CrossRef] [Scilit]
- Skariah, S.; Abdul-Majid, S.; Hay, A.G.; Acharya, A.; Kano, N.; Al-Ishaq, R.K.; de Figueiredo, P.; Han, A.; Guzman, A.; Dargham, S.R.; et al. Soil Properties Correlate with Microbial Community Structure in Qatari Arid Soils. Microbiol. Spectr. 2023, 11, e0346222. [Google Scholar] [CrossRef] [Scilit]
- Guo, Y.; Hou, L.; Zhang, Z.; Zhang, J.; Cheng, J.; Wei, G.; Lin, Y. Soil microbial diversity during 30 years of grassland restoration on the Loess Plateau, China: Tight linkages with plant diversity. Land Degrad. Dev. 2019, 30, 1172–1182. [Google Scholar] [CrossRef] [Scilit]
- Bartholomäus, A.; Genderjahn, S.; Mangelsdorf, K.; Schneider, B.; Zamorano, P.; Kounaves, S.P.; Schulze-Makuch, D.; Wagner, D. Inside the Atacama Desert: Uncovering the living microbiome of an extreme environment. Appl. Environ. Microbiol. 2024, 90, e0144324. [Google Scholar] [CrossRef] [Scilit]
- Jiao, S.; Lu, Y. Soil pH and temperature regulate assembly processes of abundant and rare bacterial communities in agricultural ecosystems. Environ. Microbiol. 2020, 22, 1052–1065. [Google Scholar] [CrossRef] [Scilit]
- Kurm, V.; Geisen, S.; Gera Hol, W.H. A low proportion of rare bacterial taxa responds to abiotic changes compared with dominant taxa. Environ. Microbiol. 2018, 21, 750–758. [Google Scholar] [CrossRef] [Scilit]
- Tripathi, B.M.; Stegen, J.C.; Kim, M.; Dong, K.; Adams, J.M.; Lee, Y.K. Soil pH mediates the balance between stochastic and deterministic assembly of bacteria. ISME J. 2018, 12, 1072–1083. [Google Scholar] [CrossRef] [Scilit]
- Delgado-Baquerizo, M.; Oliverio, A.M.; Brewer, T.E.; Benavent-González, A.; Eldridge, D.J.; Bardgett, R.D.; Maestre, F.T.; Singh, B.K.; Fierer, N. A global atlas of the dominant bacteria found in soil. Science 2018, 359, 320–325. [Google Scholar] [CrossRef] [Scilit]
- Bahram, M.; Hildebrand, F.; Forslund, S.K.; Anderson, J.L.; Soudzilovskaia, N.A.; Bodegom, P.M.; Bengtsson-Palme, J.; Anslan, S.; Coelho, L.P.; Harend, H.; et al. Structure and function of the global topsoil microbiome. Nature 2018, 560, 233–237. [Google Scholar] [CrossRef] [Scilit]
- Fierer, N. Embracing the unknown: Disentangling the complexities of the soil microbiome. Nat. Rev. Microbiol. 2017, 15, 579–590. [Google Scholar] [CrossRef] [Scilit]
- Wong, R.G.; Wu, J.R.; Gloor, G.B. Expanding the UniFrac Toolbox. PLoS ONE 2016, 11, e0161196. [Google Scholar] [CrossRef] [Scilit] [PubMed]
- Lozupone, C.A.; Knight, R. Global patterns in bacterial diversity. Proc. Natl. Acad. Sci. USA 2007, 104, 11436–11440. [Google Scholar] [CrossRef] [Scilit]
- Thompson, L.R.; Sanders, J.G.; McDonald, D.; Amir, A.; Ladau, J.; Locey, K.J.; Prill, R.J.; Tripathi, A.; Gibbons, S.M.; Ackermann, G.; et al. A communal catalogue reveals Earth’s multiscale microbial diversity. Nature 2017, 551, 457–463. [Google Scholar] [CrossRef] [Scilit] [PubMed]
- Delgado-Baquerizo, M.; Trivedi, P.; Trivedi, C.; Eldridge, D.J.; Reich, P.B.; Jeffries, T.C.; Singh, B.K. Microbial richness and composition independently drive soil multifunctionality. Funct. Ecol. 2016, 31, 2330–2343. [Google Scholar] [CrossRef] [Scilit]
- Khan, M.T.; Supronienė, S.; Žvirdauskienė, R.; Aleinikovienė, J. Climate, Soil, and Microbes: Interactions Shaping Organic Matter Decomposition in Croplands. Agronomy 2025, 15, 1928. [Google Scholar] [CrossRef] [Scilit]
- Nemergut, D.R.; Schmidt, S.K.; Fukami, T.; O’Neill, S.P.; Bilinski, T.M.; Stanish, L.F.; Knelman, J.E.; Darcy, J.L.; Lynch, R.C.; Wickey, P.; et al. Patterns and Processes of Microbial Community Assembly. Microbiol. Mol. Biol. Rev. 2013, 77, 342–356. [Google Scholar] [CrossRef] [Scilit]
- Ridel, A.; Neupert, M.; Cadro, A.; Pedraza, J.; Aubert, M.; Langlois, E.; Pétillon, J. Effects of environmental filtering on taxonomic and functional diversity patterns: When spiders and plants provide complementary information to water level management in the Seine estuary. Ecol. Indic. 2024, 169, 112957. [Google Scholar] [CrossRef] [Scilit]
- Jiao, S.; Xu, Y.-Q.; Zhang, J.; Hao, X.; Lu, Y. Core Microbiota in Agricultural Soils and Their Potential Associations with Nutrient Cycling. mSystems 2019, 4, e00313-18. [Google Scholar] [CrossRef] [Scilit]
- Maestre, F.T.; Delgado-Baquerizo, M.; Jeffries, T.C.; Eldridge, D.J.; Ochoa, V.; Gozalo, B.; Quero, J.L.; García-Gómez, M.; Gallardo, A.; Ulrich, W.; et al. Increasing aridity reduces soil microbial diversity and abundance in global drylands. Proc. Natl. Acad. Sci. USA 2015, 112, 15684–15689. [Google Scholar] [CrossRef] [Scilit] [PubMed]
- Bastida, F.; Eldridge, D.J.; García, C.; Kenny Png, G.; Bardgett, R.D.; Delgado-Baquerizo, M. Soil microbial diversity–biomass relationships are driven by soil carbon content across global biomes. ISME J. 2021, 15, 2081–2091. [Google Scholar] [CrossRef] [Scilit] [PubMed]
- Ventura, M.; Canchaya, C.; Tauch, A.; Chandra, G.; Fitzgerald, G.F.; Chater, K.F.; van Sinderen, D. Genomics of Actinobacteria: Tracing the Evolutionary History of an Ancient Phylum. Microbiol. Mol. Biol. Rev. 2007, 71, 495–548. [Google Scholar] [CrossRef] [Scilit]
- Delgado-Baquerizo, M.; Maestre, F.T.; Reich, P.B.; Jeffries, T.C.; Gaitan, J.J.; Encinar, D.; Berdugo, M.; Campbell, C.D.; Singh, B.K. Microbial diversity drives multifunctionality in terrestrial ecosystems. Nat. Commun. 2017, 7, 10541. [Google Scholar] [CrossRef] [Scilit]
- Fierer, N.; Bradford, M.A.; Jackson, R.B. Toward an Ecological Classification of Soil Bacteria. Ecology 2007, 88, 1354–1364. [Google Scholar] [CrossRef] [Scilit]
- Fierer, N.; Jackson, R.B. The diversity and biogeography of soil bacterial communities. Proc. Natl. Acad. Sci. USA 2006, 103, 626–631. [Google Scholar] [CrossRef] [Scilit] [PubMed]
- Janssen, P.H. Identifying the Dominant Soil Bacterial Taxa in Libraries of 16S rRNA and 16S rRNA Genes. Appl. Environ. Microbiol. 2006, 72, 1719–1728. [Google Scholar] [CrossRef] [Scilit]
- Chanal, A.; Chapon, V.; Benzerara, K.; Barakat, M.; Christen, R.; Achouak, W.; Barras, F.; Heulin, T. The desert of Tataouine: An extreme environment that hosts a wide diversity of microorganisms and radiotolerant bacteria. Environ. Microbiol. 2006, 8, 514–525. [Google Scholar] [CrossRef] [Scilit]
- Franco, C.M.M.; Labeda, D.P. The Order Pseudonocardiales. In The Prokaryotes; Springer: Berlin/Heidelberg, Germany, 2014; pp. 743–860. [Google Scholar] [CrossRef] [Scilit]
- Addesso, R.; Gonzalez-Pimentel, J.L.; D’Angeli, I.M.; De Waele, J.; Saiz-Jimenez, C.; Jurado, V.; Miller, A.Z.; Cubero, B.; Vigliotta, G.; Baldantoni, D. Microbial Community Characterizing Vermiculations from Karst Caves and Its Role in Their Formation. Microb. Ecol. 2020, 81, 884–896. [Google Scholar] [CrossRef] [Scilit]
- Schulze-Makuch, D.; Lipus, D.; Arens, F.L.; Baqué, M.; Bornemann, T.L.V.; de Vera, J.-P.; Flury, M.; Frösler, J.; Heinz, J.; Hwang, Y.; et al. Microbial Hotspots in Lithic Microhabitats Inferred from DNA Fractionation and Metagenomics in the Atacama Desert. Microorganisms 2021, 9, 1038. [Google Scholar] [CrossRef] [Scilit]
- Ramond, J.-B.; Jordaan, K.; Díez, B.; Heinzelmann, S.M.; Cowan, D.A. Microbial Biogeochemical Cycling of Nitrogen in Arid Ecosystems. Microbiol. Mol. Biol. Rev. 2022, 86, e0010921. [Google Scholar] [CrossRef] [Scilit]
- Ramakrishnan, B.; Raju Maddela, N.; Venkateswarlu, K.; Megharaj, M. Potential of microalgae and cyanobacteria to improve soil health and agricultural productivity: A critical view. Environ. Sci. Adv. 2023, 2, 586–611. [Google Scholar] [CrossRef] [Scilit]
- Roesch, L.F.W.; Fulthorpe, R.R.; Riva, A.; Casella, G.; Hadwin, A.K.M.; Kent, A.D.; Daroub, S.H.; Camargo, F.A.O.; Farmerie, W.G.; Triplett, E.W. Pyrosequencing enumerates and contrasts soil microbial diversity. ISME J. 2007, 1, 283–290. [Google Scholar] [CrossRef] [Scilit]
- Rekadwad, B.N.; Li, W.-J.; Gonzalez, J.M.; Rekha, P.D.; Bhagwath, A.A.; Urana, R.; Parwez, K. Extremophiles: The species that evolve and survive under hostile conditions. 3 Biotech 2023, 13, 316. [Google Scholar] [CrossRef] [Scilit] [PubMed]
- Hurtado-Bautista, E.; Pérez Sánchez, L.F.; Islas-Robles, A.; Santoyo, G.; Olmedo-Alvarez, G. Phenotypic plasticity and evolution of thermal tolerance in bacteria from temperate and hot spring environments. PeerJ 2021, 9, e11734. [Google Scholar] [CrossRef] [Scilit]
- Gallo, G.; Aulitto, M. Advances in Extremophile Research: Biotechnological Applications through Isolation and Identification Techniques. Life 2024, 14, 1205. [Google Scholar] [CrossRef] [Scilit]
- Zhang, Q.; Lu, X.; Chen, G.; Luo, N.; Sun, J.; Li, X.; Ngozi, E.A. The priming effect patterns linked to the dominant bacterial keystone taxa during different straw tissues incorporation into Mollisols in Northeast China. Appl. Soil Ecol. 2024, 197, 105330. [Google Scholar] [CrossRef] [Scilit]
- Lynch, M.D.J.; Neufeld, J.D. Ecology and exploration of the rare biosphere. Nat. Rev. Microbiol. 2015, 13, 217–229. [Google Scholar] [CrossRef] [Scilit]
- Shi, Y.; Delgado-Baquerizo, M.; Li, Y.; Yang, Y.; Zhu, Y.; Peñuelas, J.; Chu, H. Abundance of kinless hubs within soil microbial networks are associated with high functional potential in agricultural ecosystems. Environ. Int. 2020, 142, 105869. [Google Scholar] [CrossRef] [Scilit]
- Kerfahi, D.; Guo, Y.; Dong, K.; Wang, Q.; Adams, J.M. pH is the major predictor of soil microbial network complexity in Chinese forests along a latitudinal gradient. CATENA 2023, 234, 107595. [Google Scholar] [CrossRef] [Scilit]
- Wen, Y.; Zhang, G.; Zhang, W.; Liu, G. Distribution patterns and functional characteristics of soil bacterial communities in desert ecosystems of northern China. Sci. Total. Environ. 2023, 905, 167081. [Google Scholar] [CrossRef] [Scilit] [PubMed]
- Barnard, R.L.; Osborne, C.A.; Firestone, M.K. Responses of soil bacterial and fungal communities to extreme desiccation and rewetting. ISME J. 2013, 7, 2229–2241. [Google Scholar] [CrossRef] [Scilit]
- Fierer, N.; Leff, J.W.; Adams, B.J.; Nielsen, U.N.; Bates, S.T.; Lauber, C.L.; Owens, S.; Gilbert, J.A.; Wall, D.H.; Caporaso, J.G. Cross-biome metagenomic analyses of soil microbial communities and their functional attributes. Proc. Natl. Acad. Sci. USA 2012, 109, 21390–21395. [Google Scholar] [CrossRef] [Scilit] [PubMed]
- Neilson, J.W.; Quade, J.; Ortiz, M.; Nelson, W.M.; Legatzki, A.; Tian, F.; LaComb, M.; Betancourt, J.L.; Wing, R.A.; Soderlund, C.A.; et al. Life at the hyperarid margin: Novel bacterial diversity in arid soils of the Atacama Desert, Chile. Extremophiles 2012, 16, 553–566. [Google Scholar] [CrossRef] [Scilit]
- Trivedi, P.; Leach, J.E.; Tringe, S.G.; Sa, T.; Singh, B.K. Author Correction: Plant–microbiome interactions: From community assembly to plant health. Nat. Rev. Microbiol. 2020, 19, 72. [Google Scholar] [CrossRef] [Scilit]
- Barka, E.A.; Vatsa, P.; Sanchez, L.; Gaveau-Vaillant, N.; Jacquard, C.; Klenk, H.-P.; Clément, C.; Ouhdouch, Y.; van Wezel, G.P. Taxonomy, Physiology, and Natural Products of Actinobacteria. Microbiol. Mol. Biol. Rev. 2015, 80, 1–43. [Google Scholar] [CrossRef] [Scilit] [PubMed]
- Allison, S.D.; Martiny, J.B.H. Resistance, resilience, and redundancy in microbial communities. Proc. Natl. Acad. Sci. USA 2008, 105, 11512–11519. [Google Scholar] [CrossRef] [Scilit] [PubMed]
- Louca, S.; Polz, M.F.; Mazel, F.; Albright, M.B.N.; Huber, J.A.; O’Connor, M.I.; Ackermann, M.; Hahn, A.S.; Srivastava, D.S.; Crowe, S.A.; et al. Function and functional redundancy in microbial systems. Nat. Ecol. Evol. 2018, 2, 936–943. [Google Scholar] [CrossRef] [Scilit]
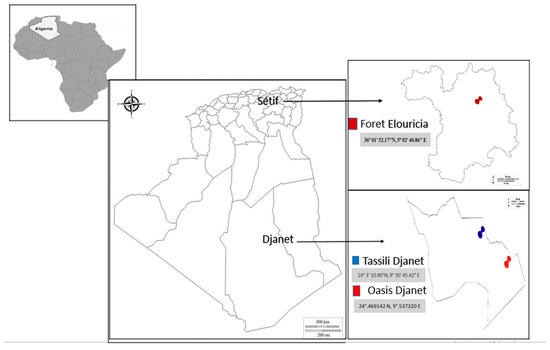
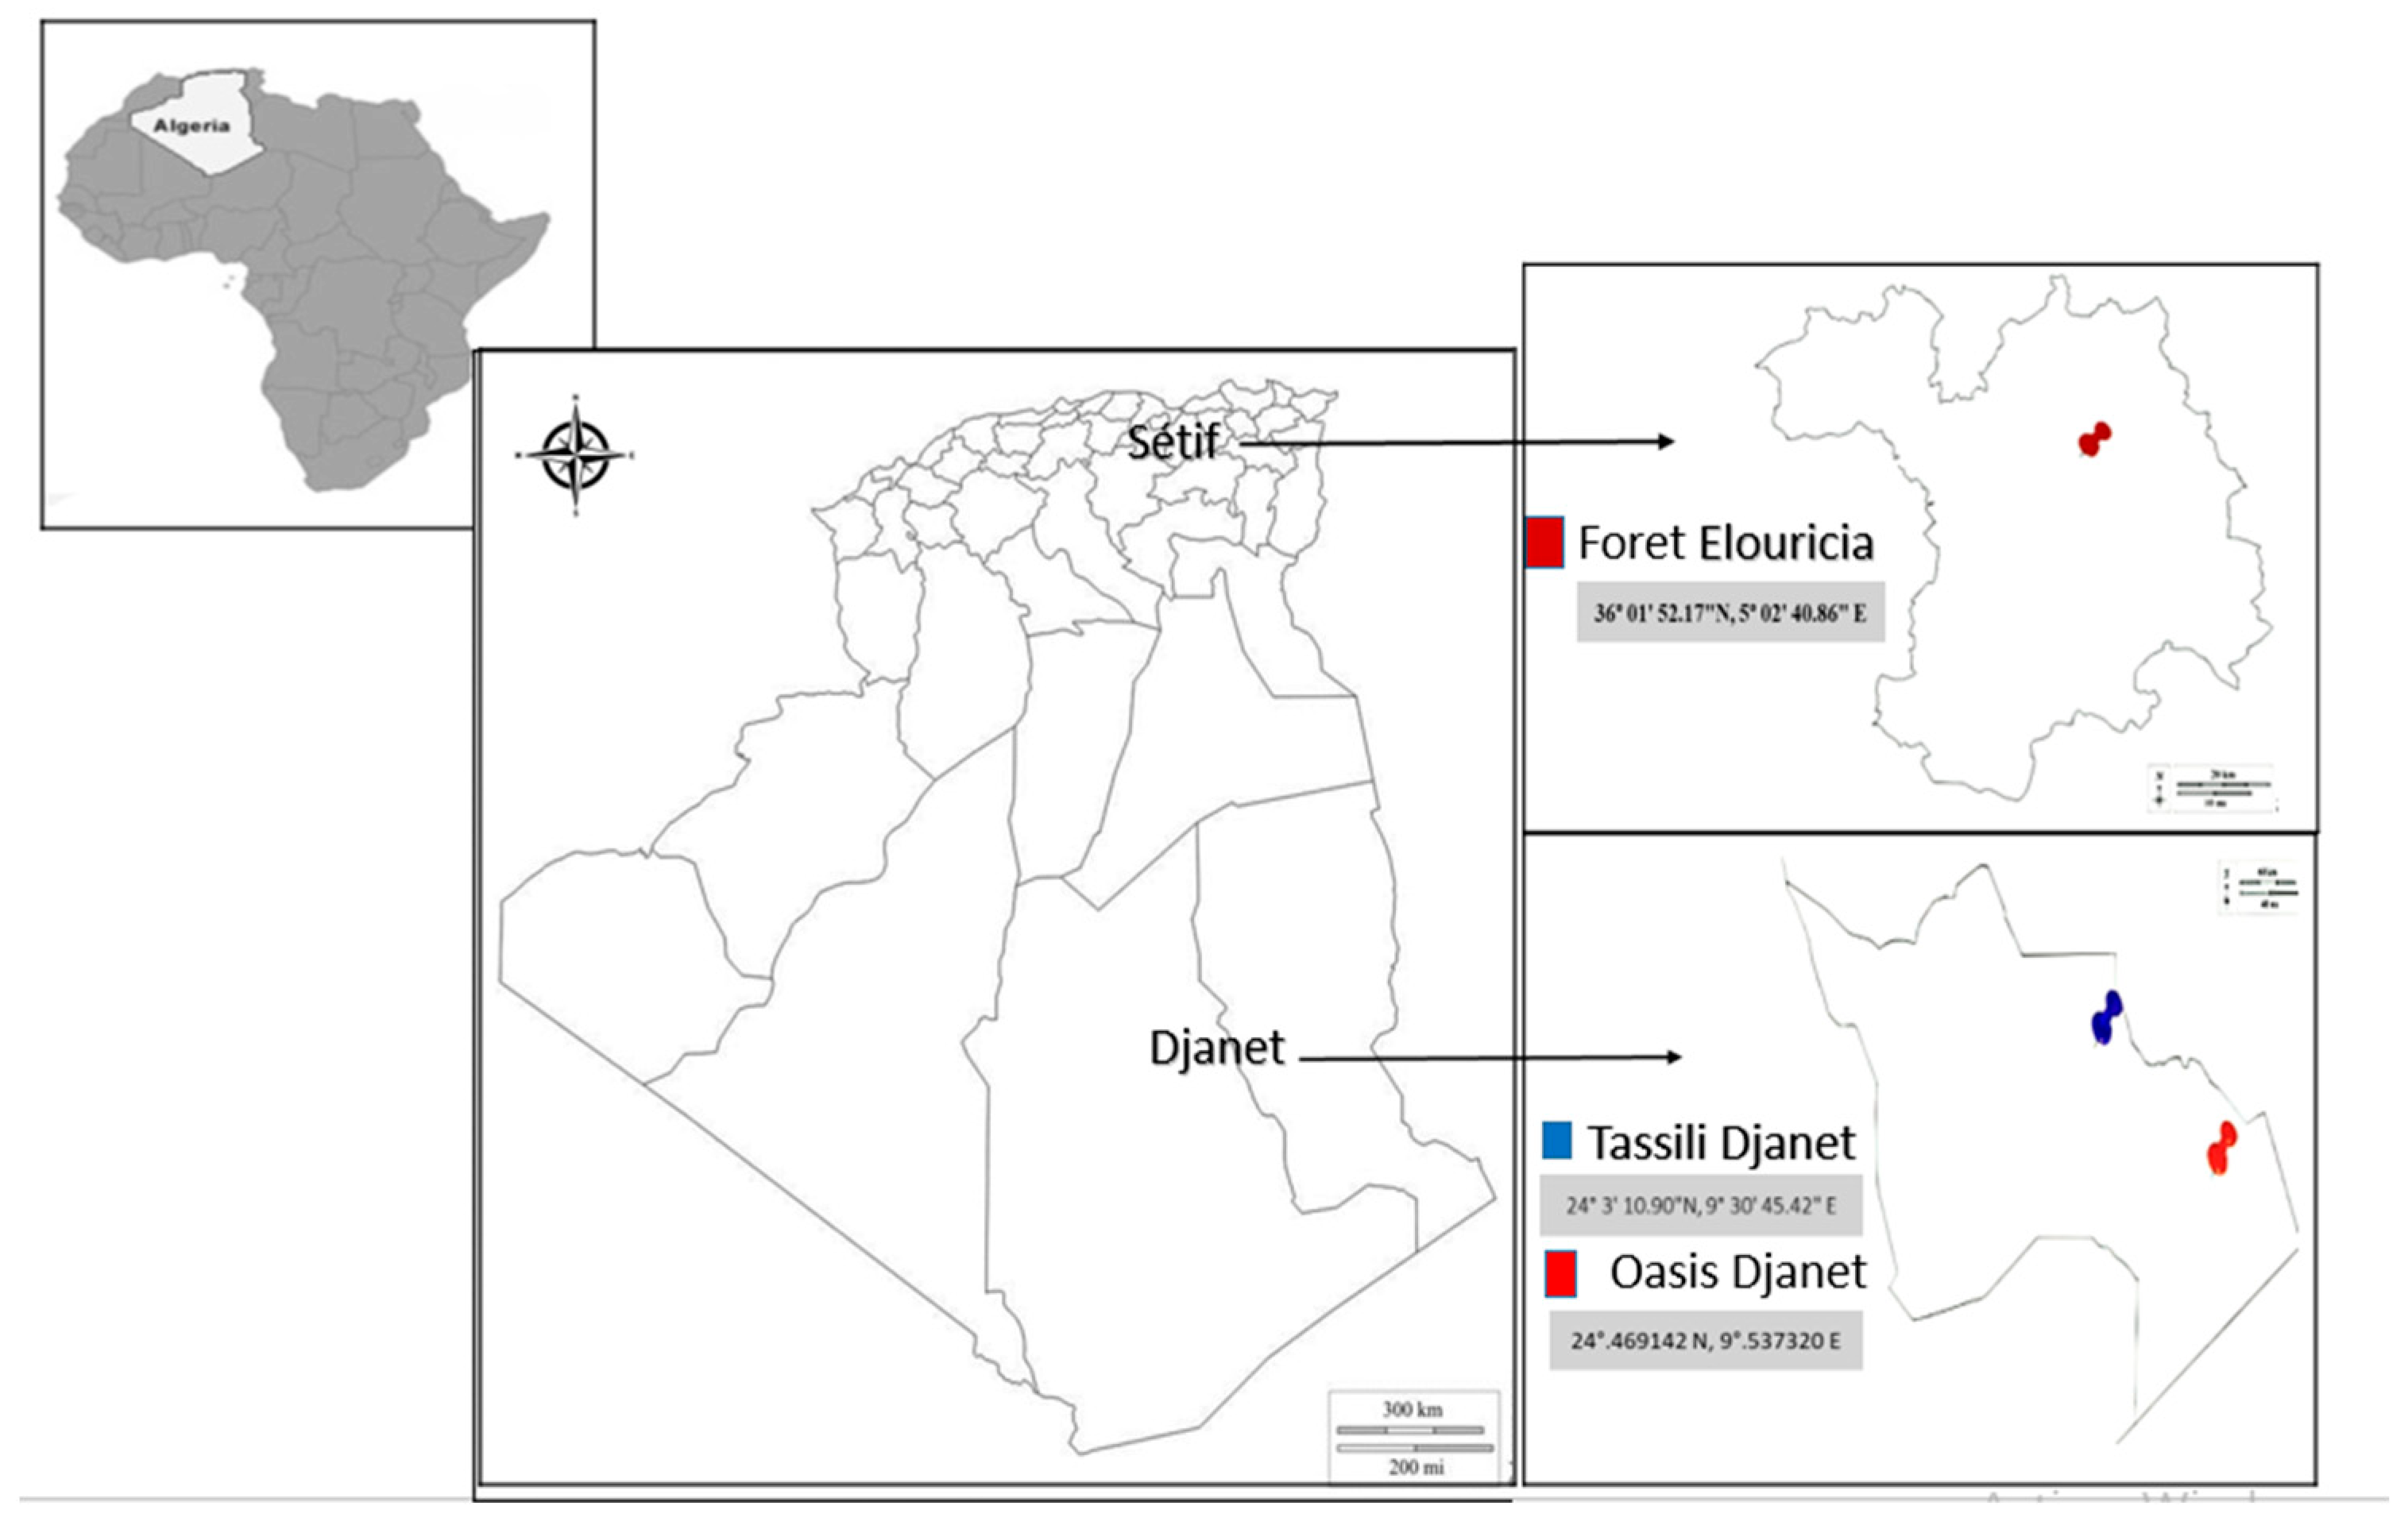
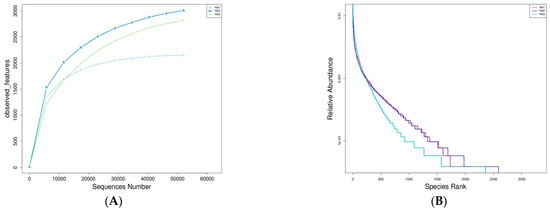
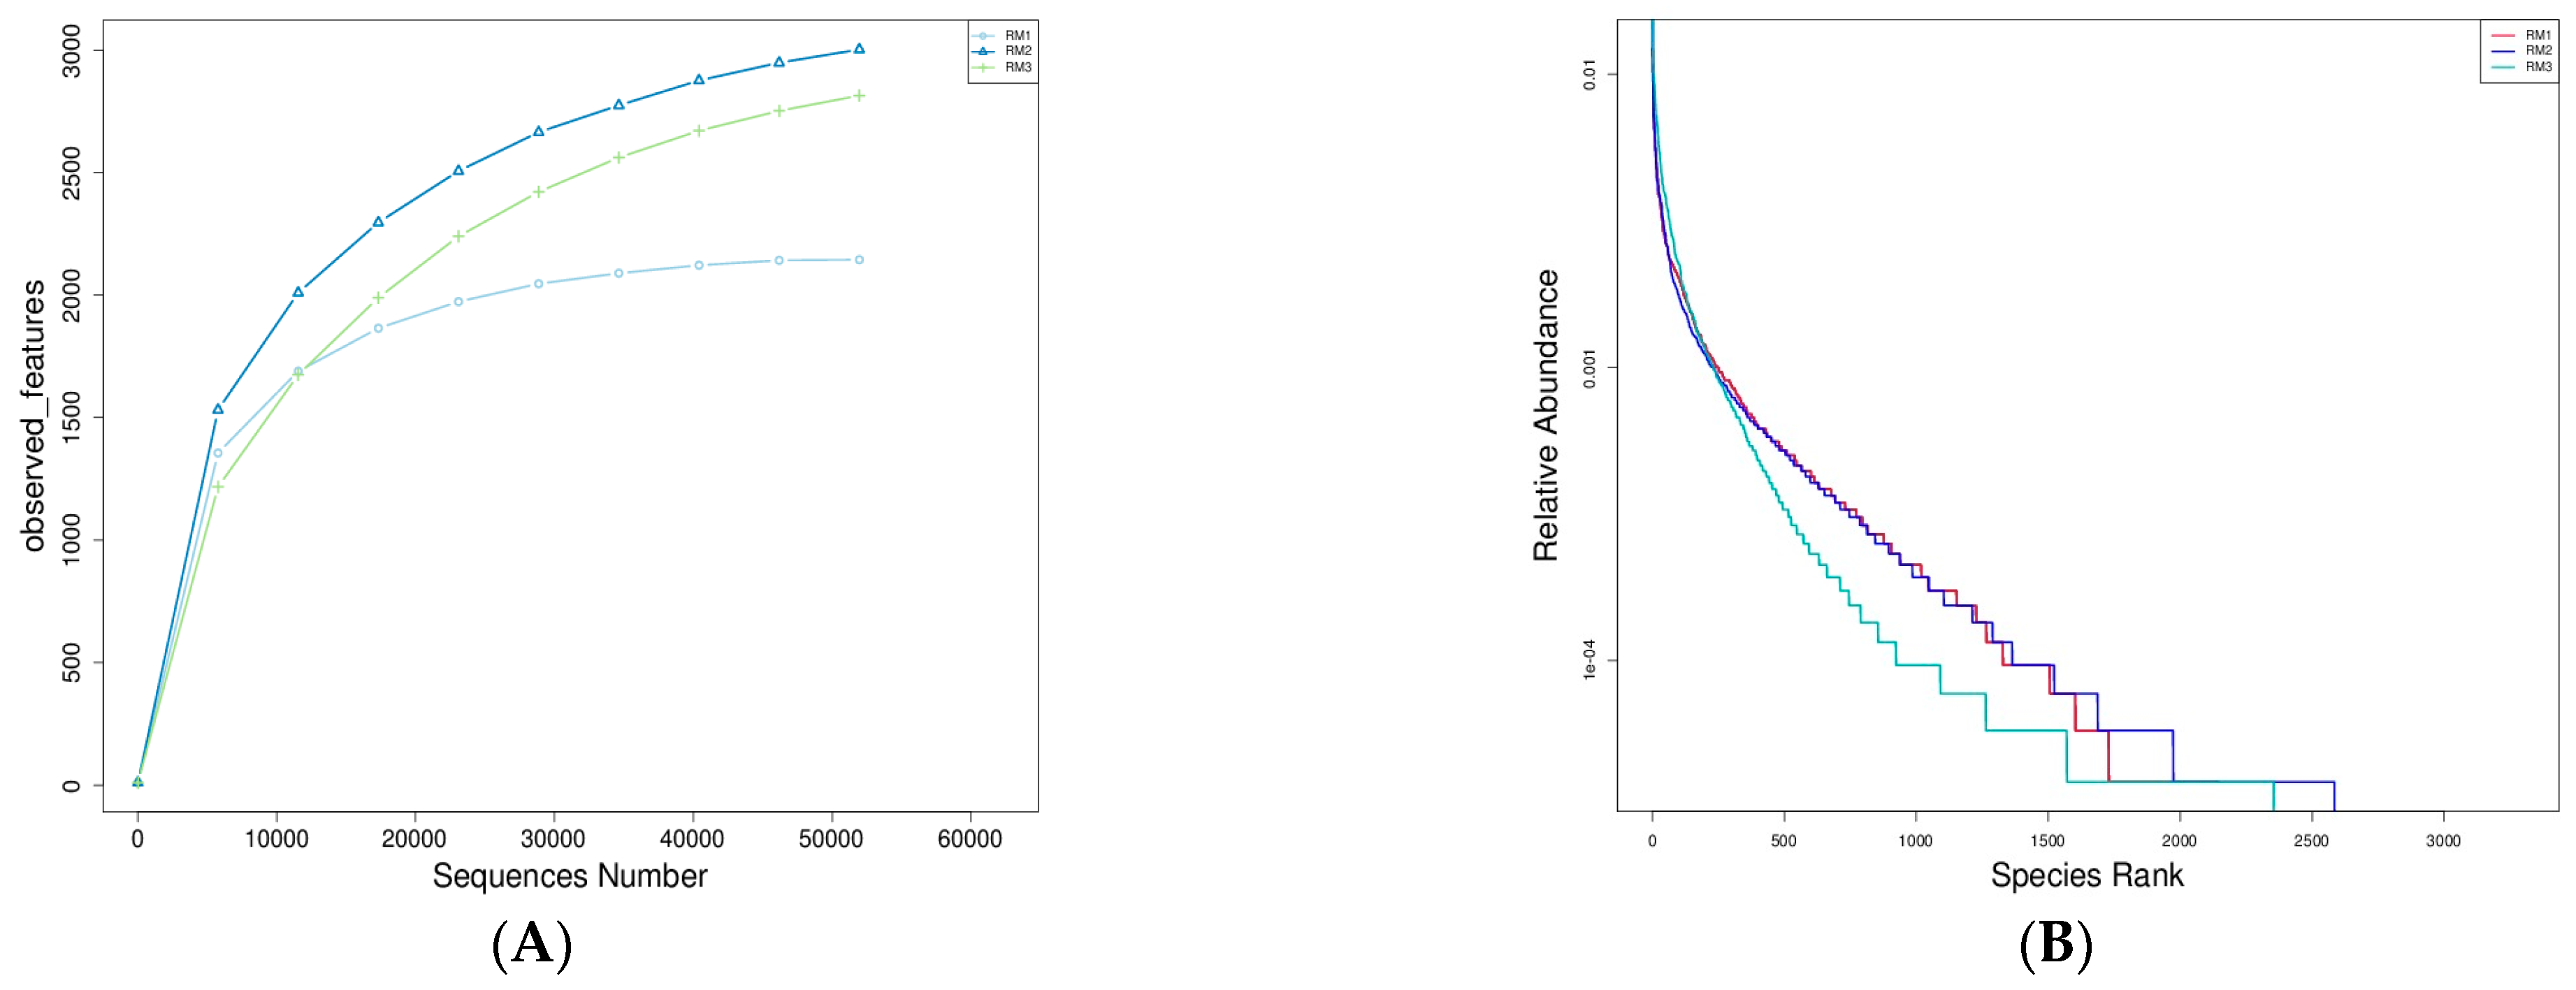
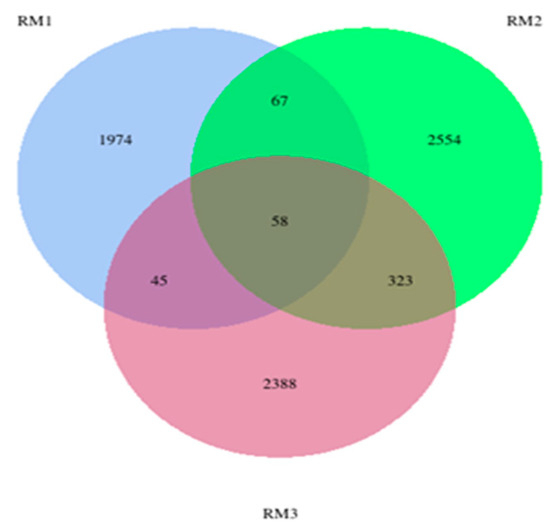
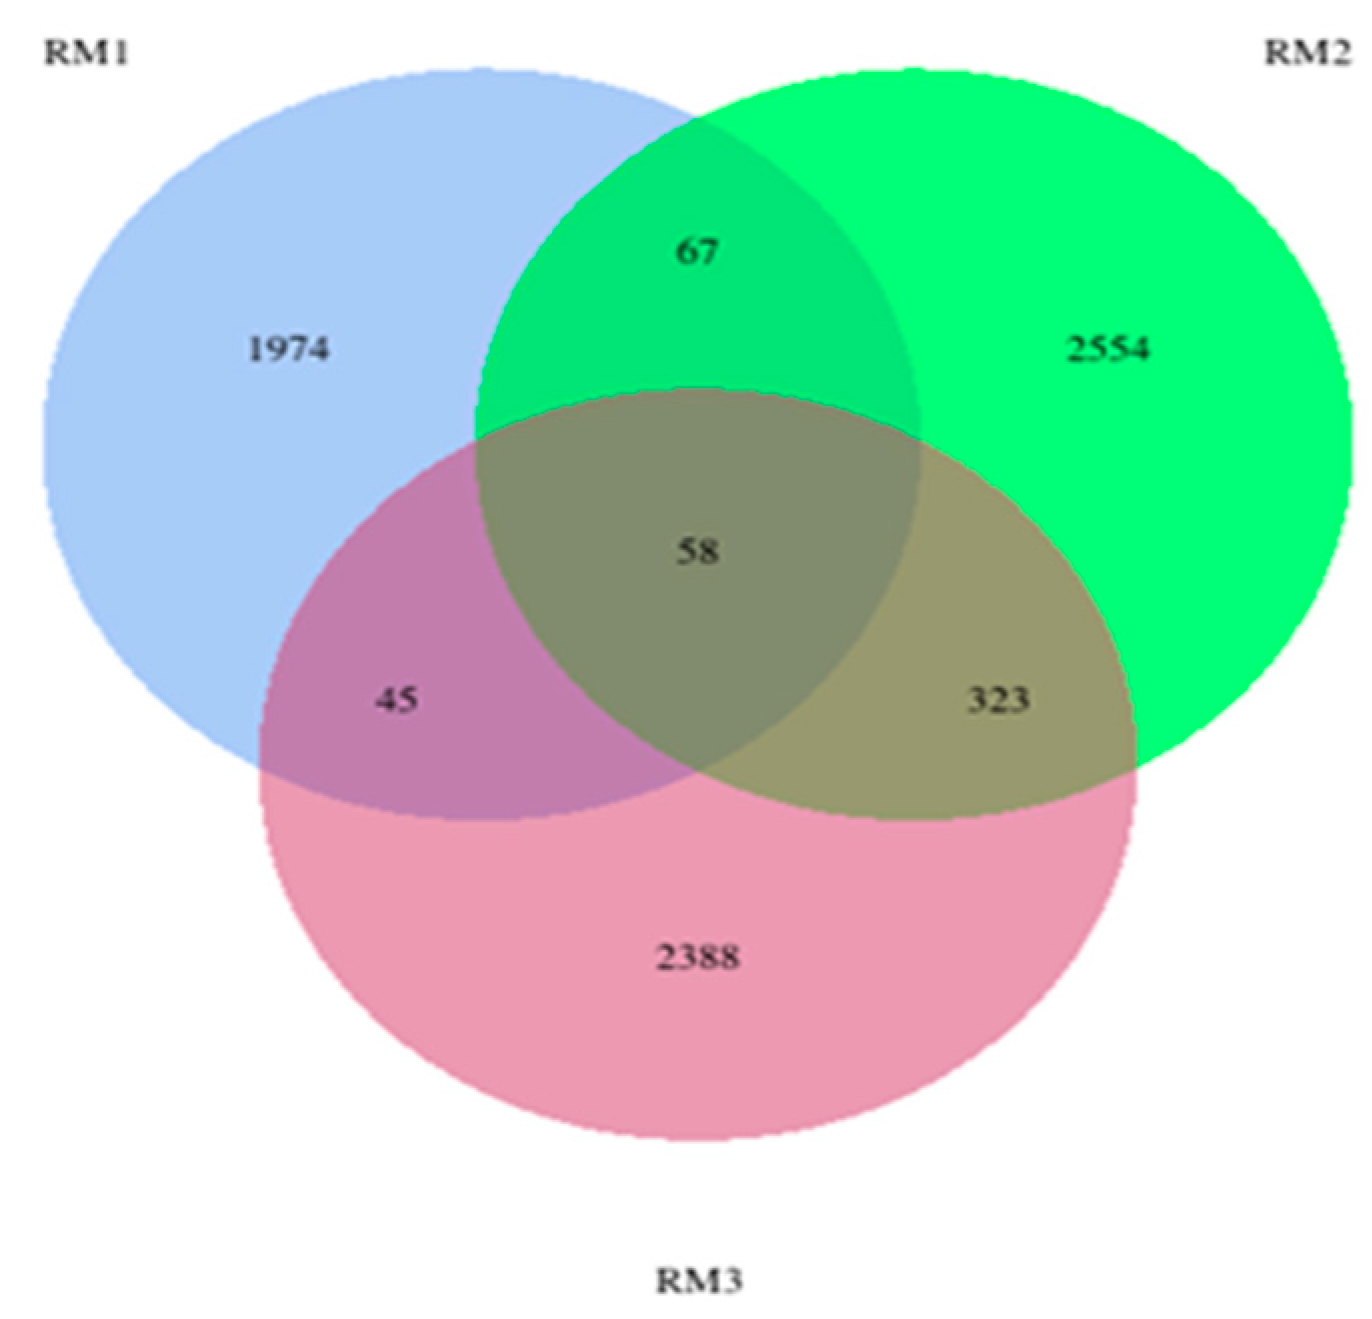
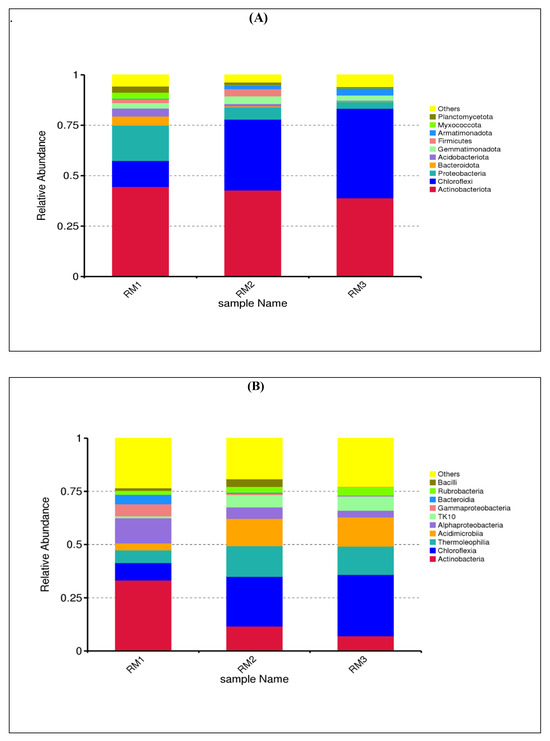
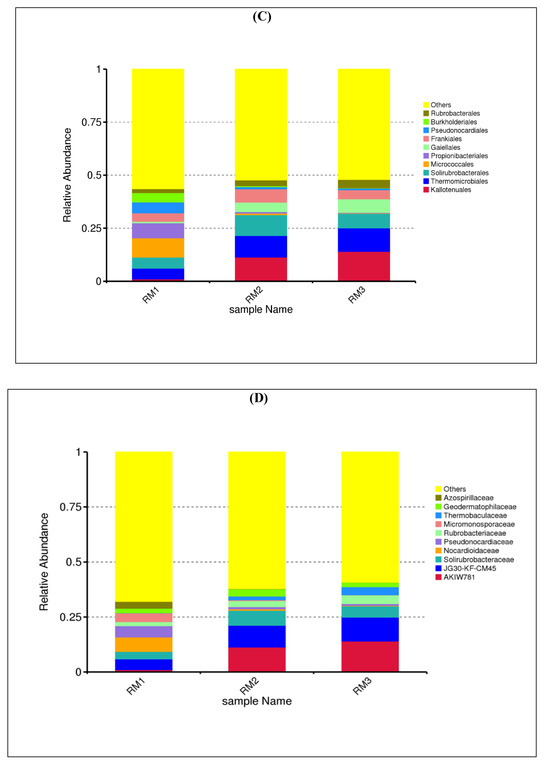
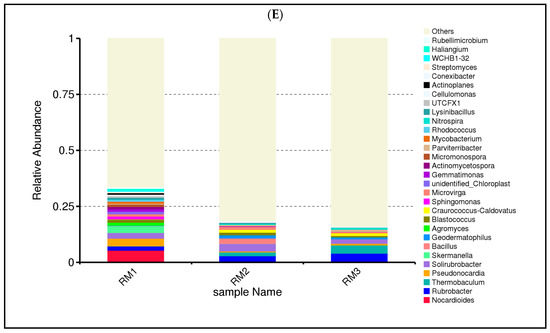
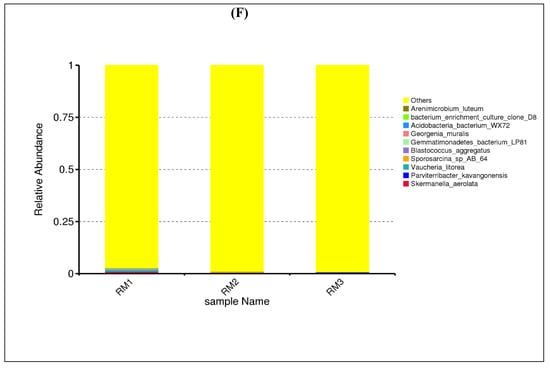
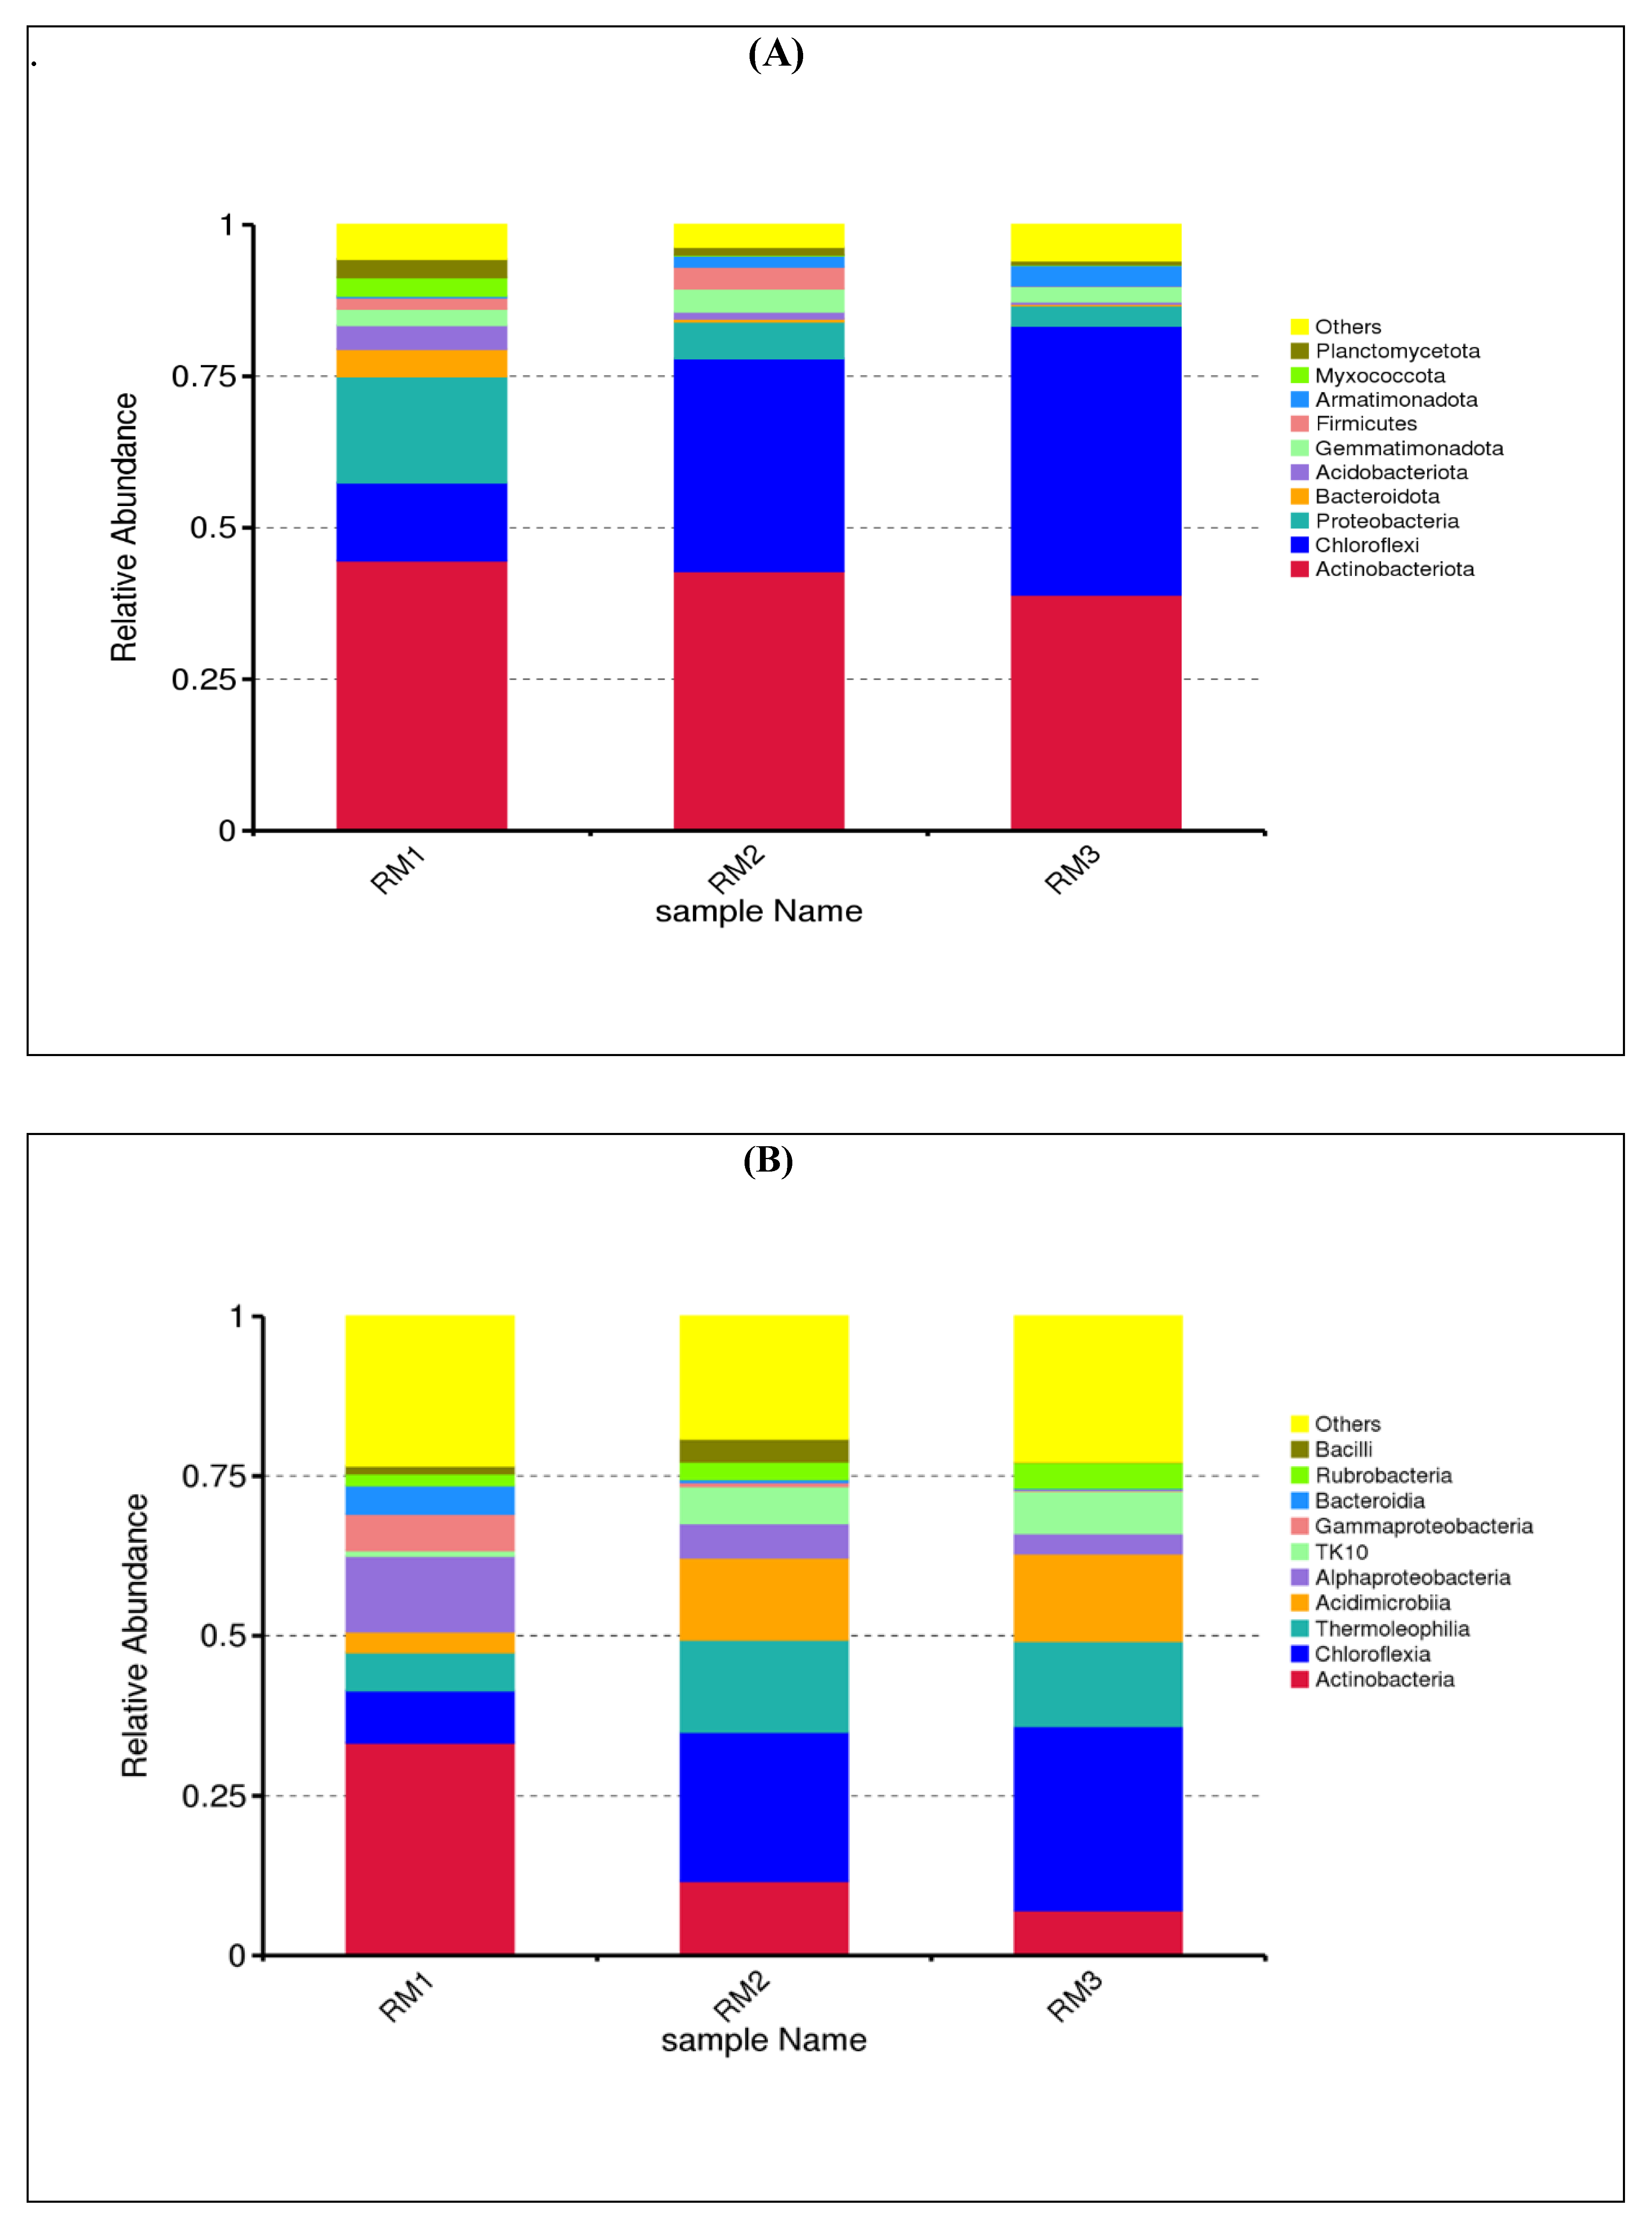
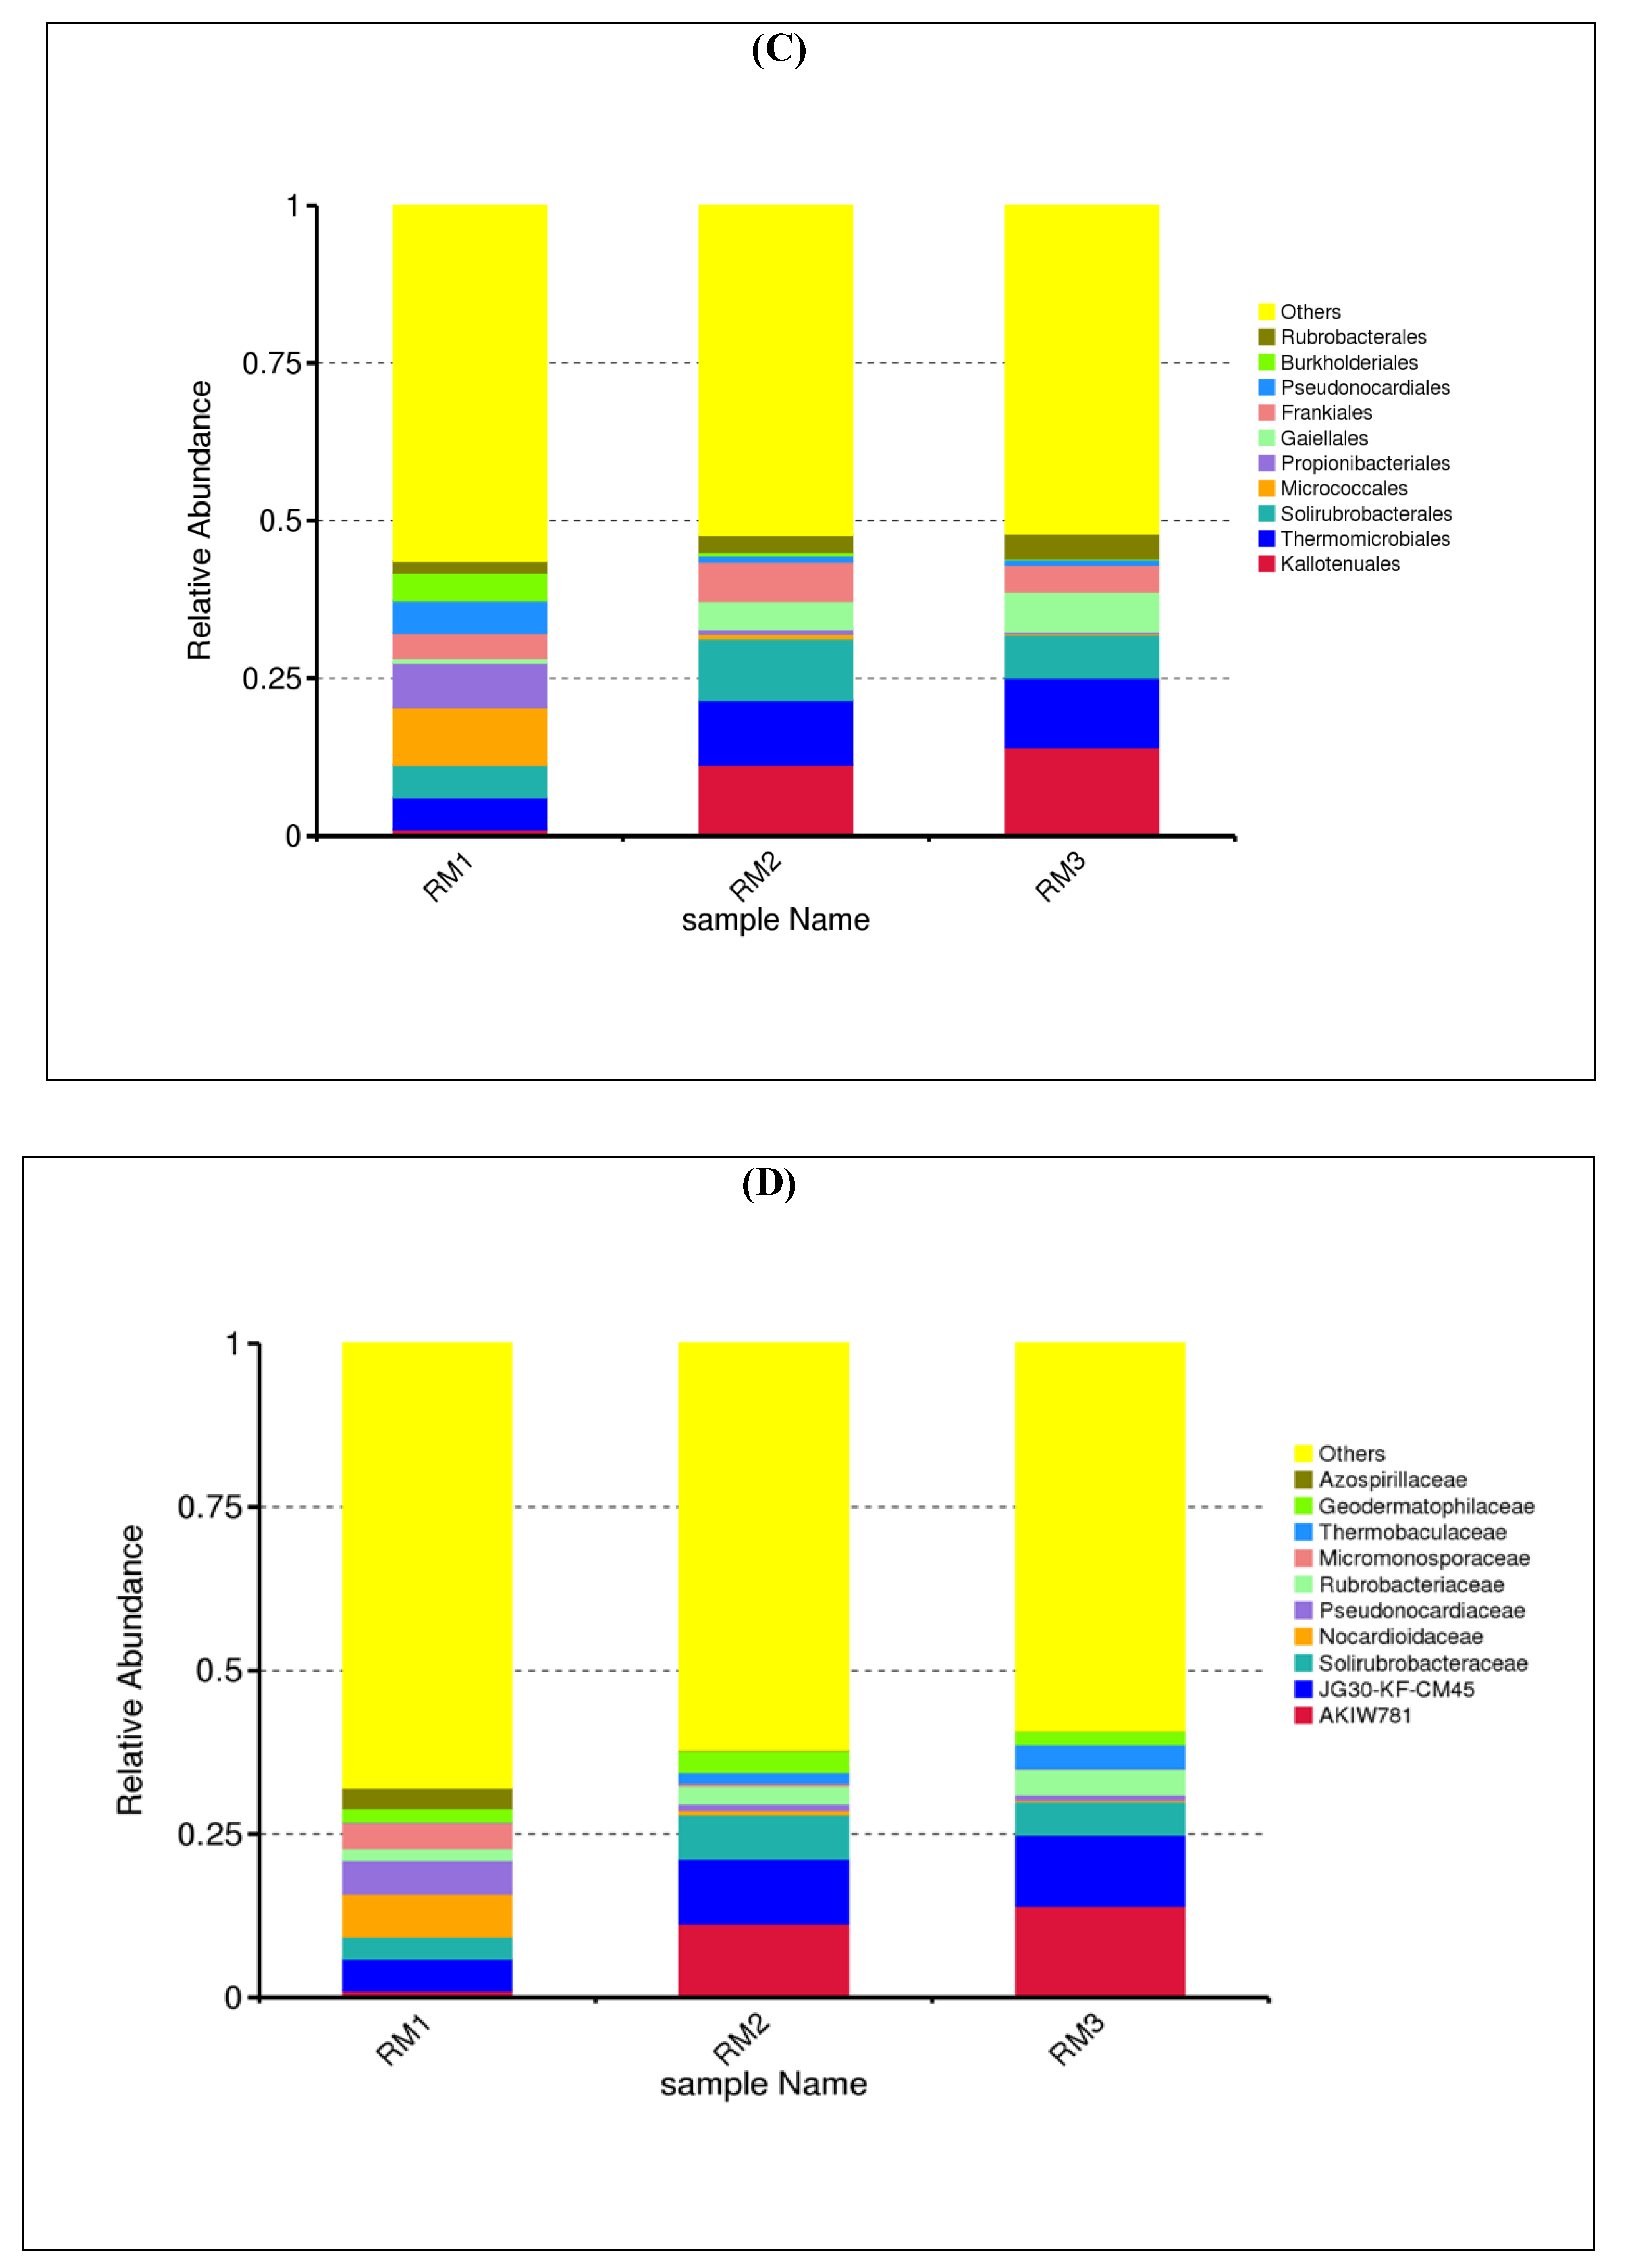
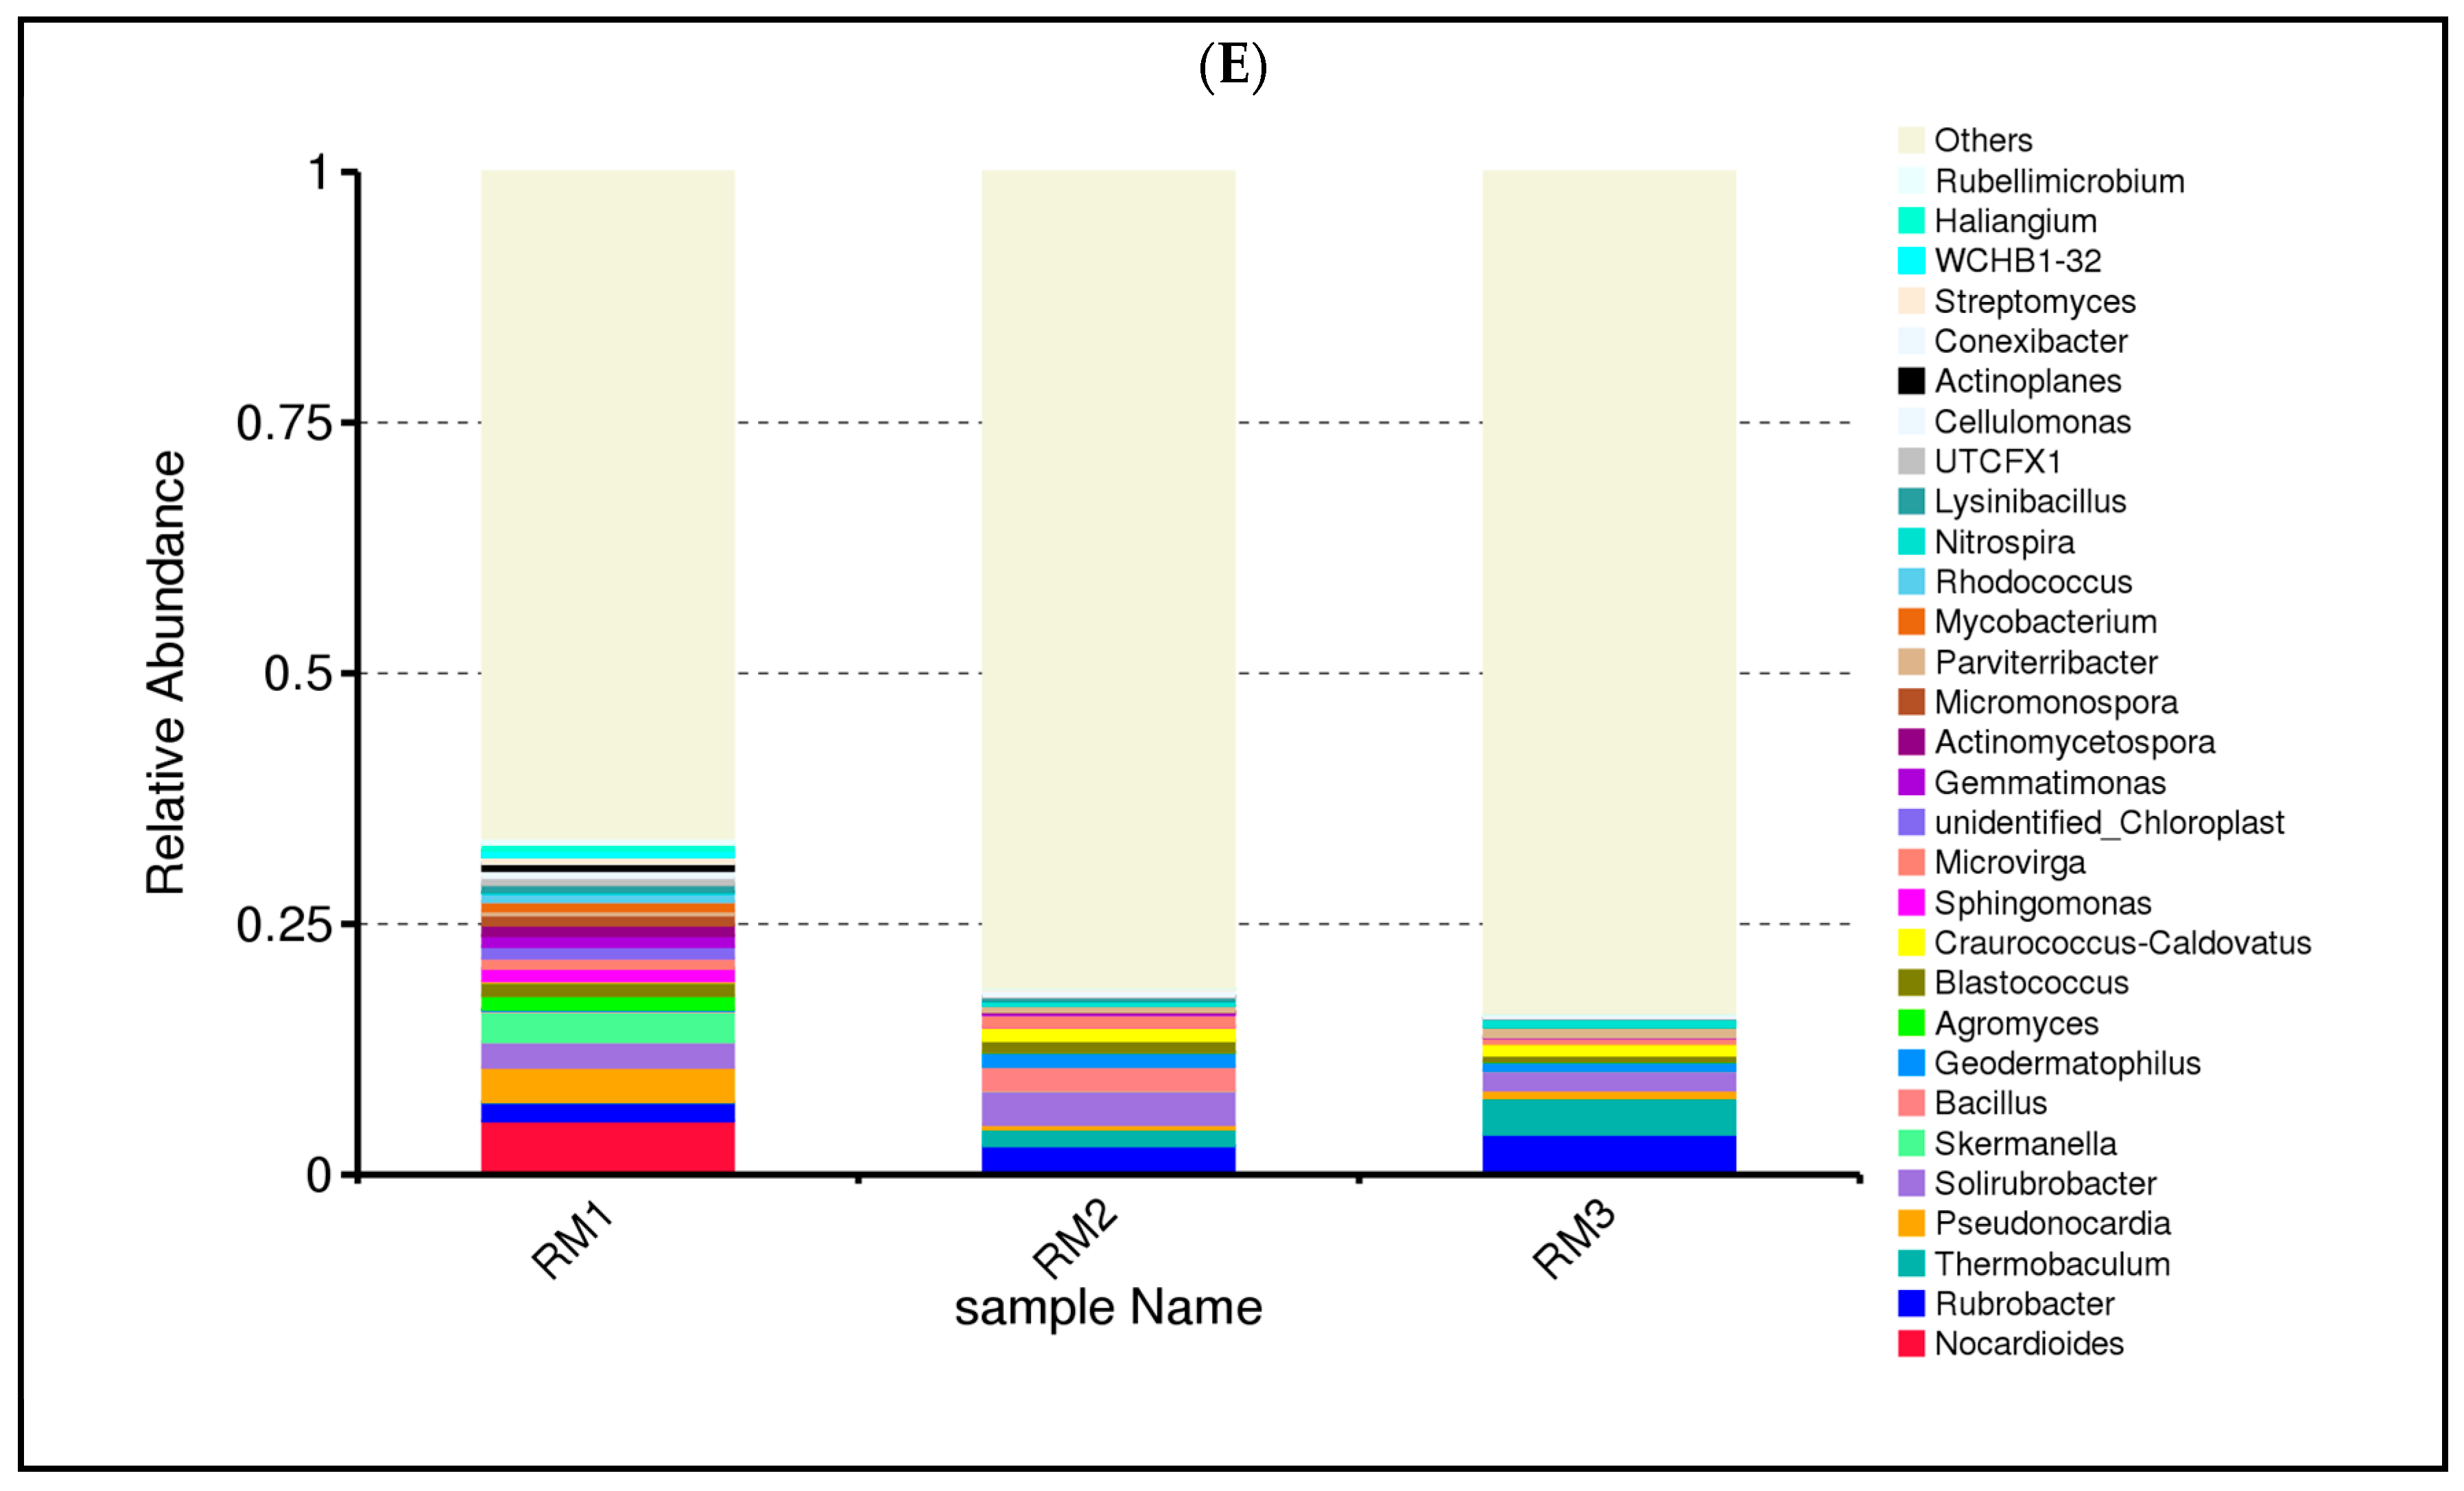
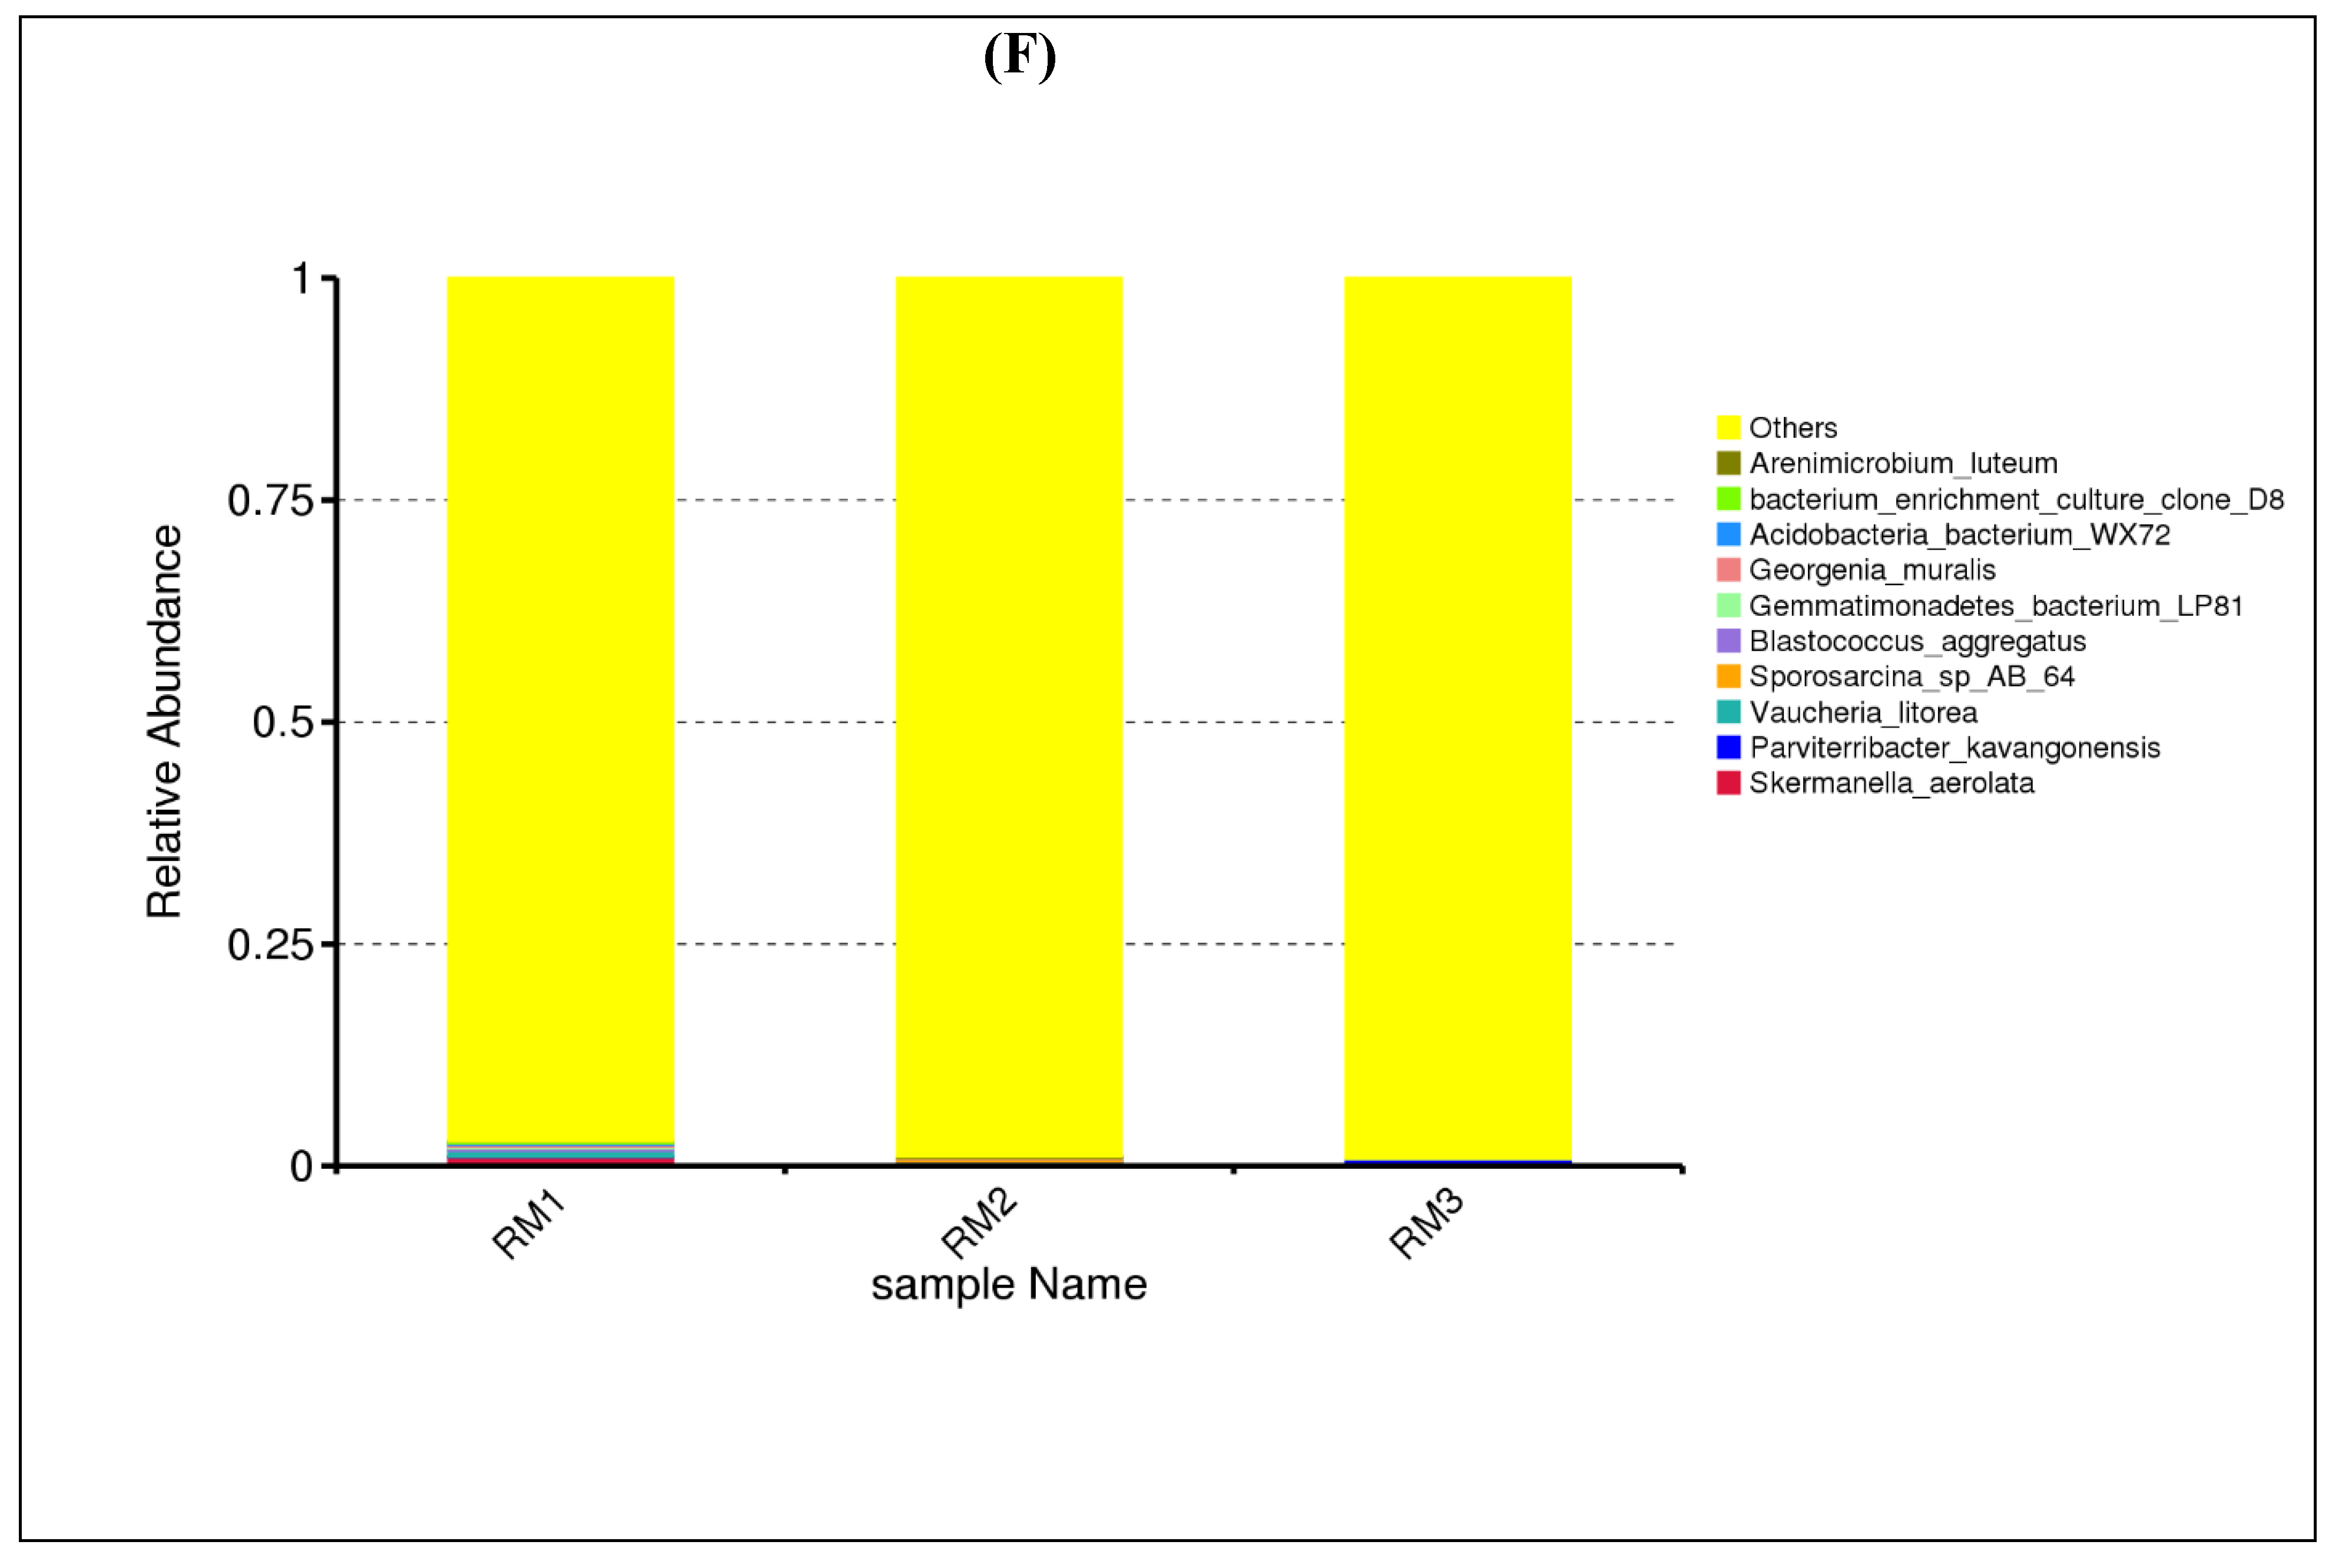
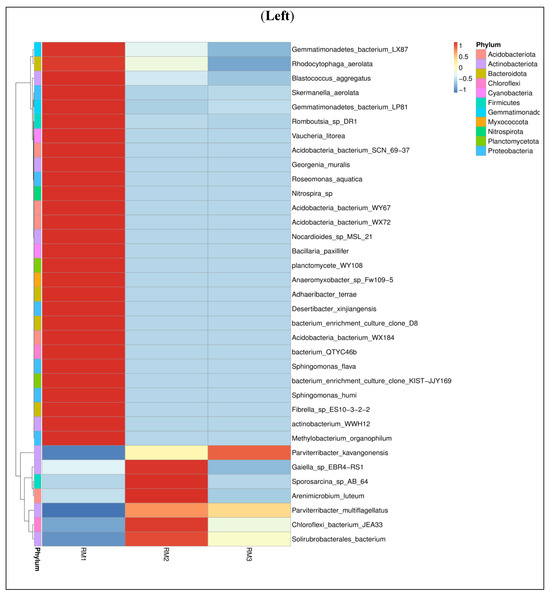
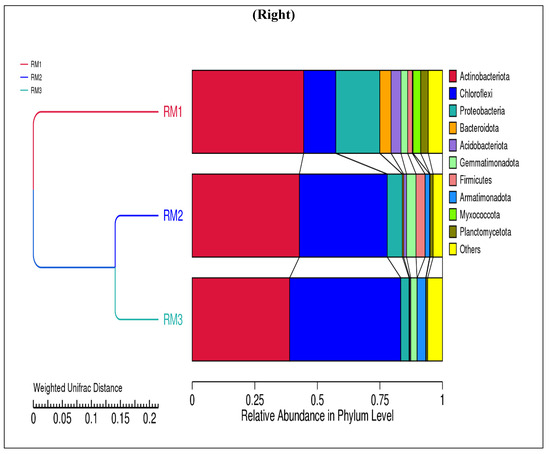
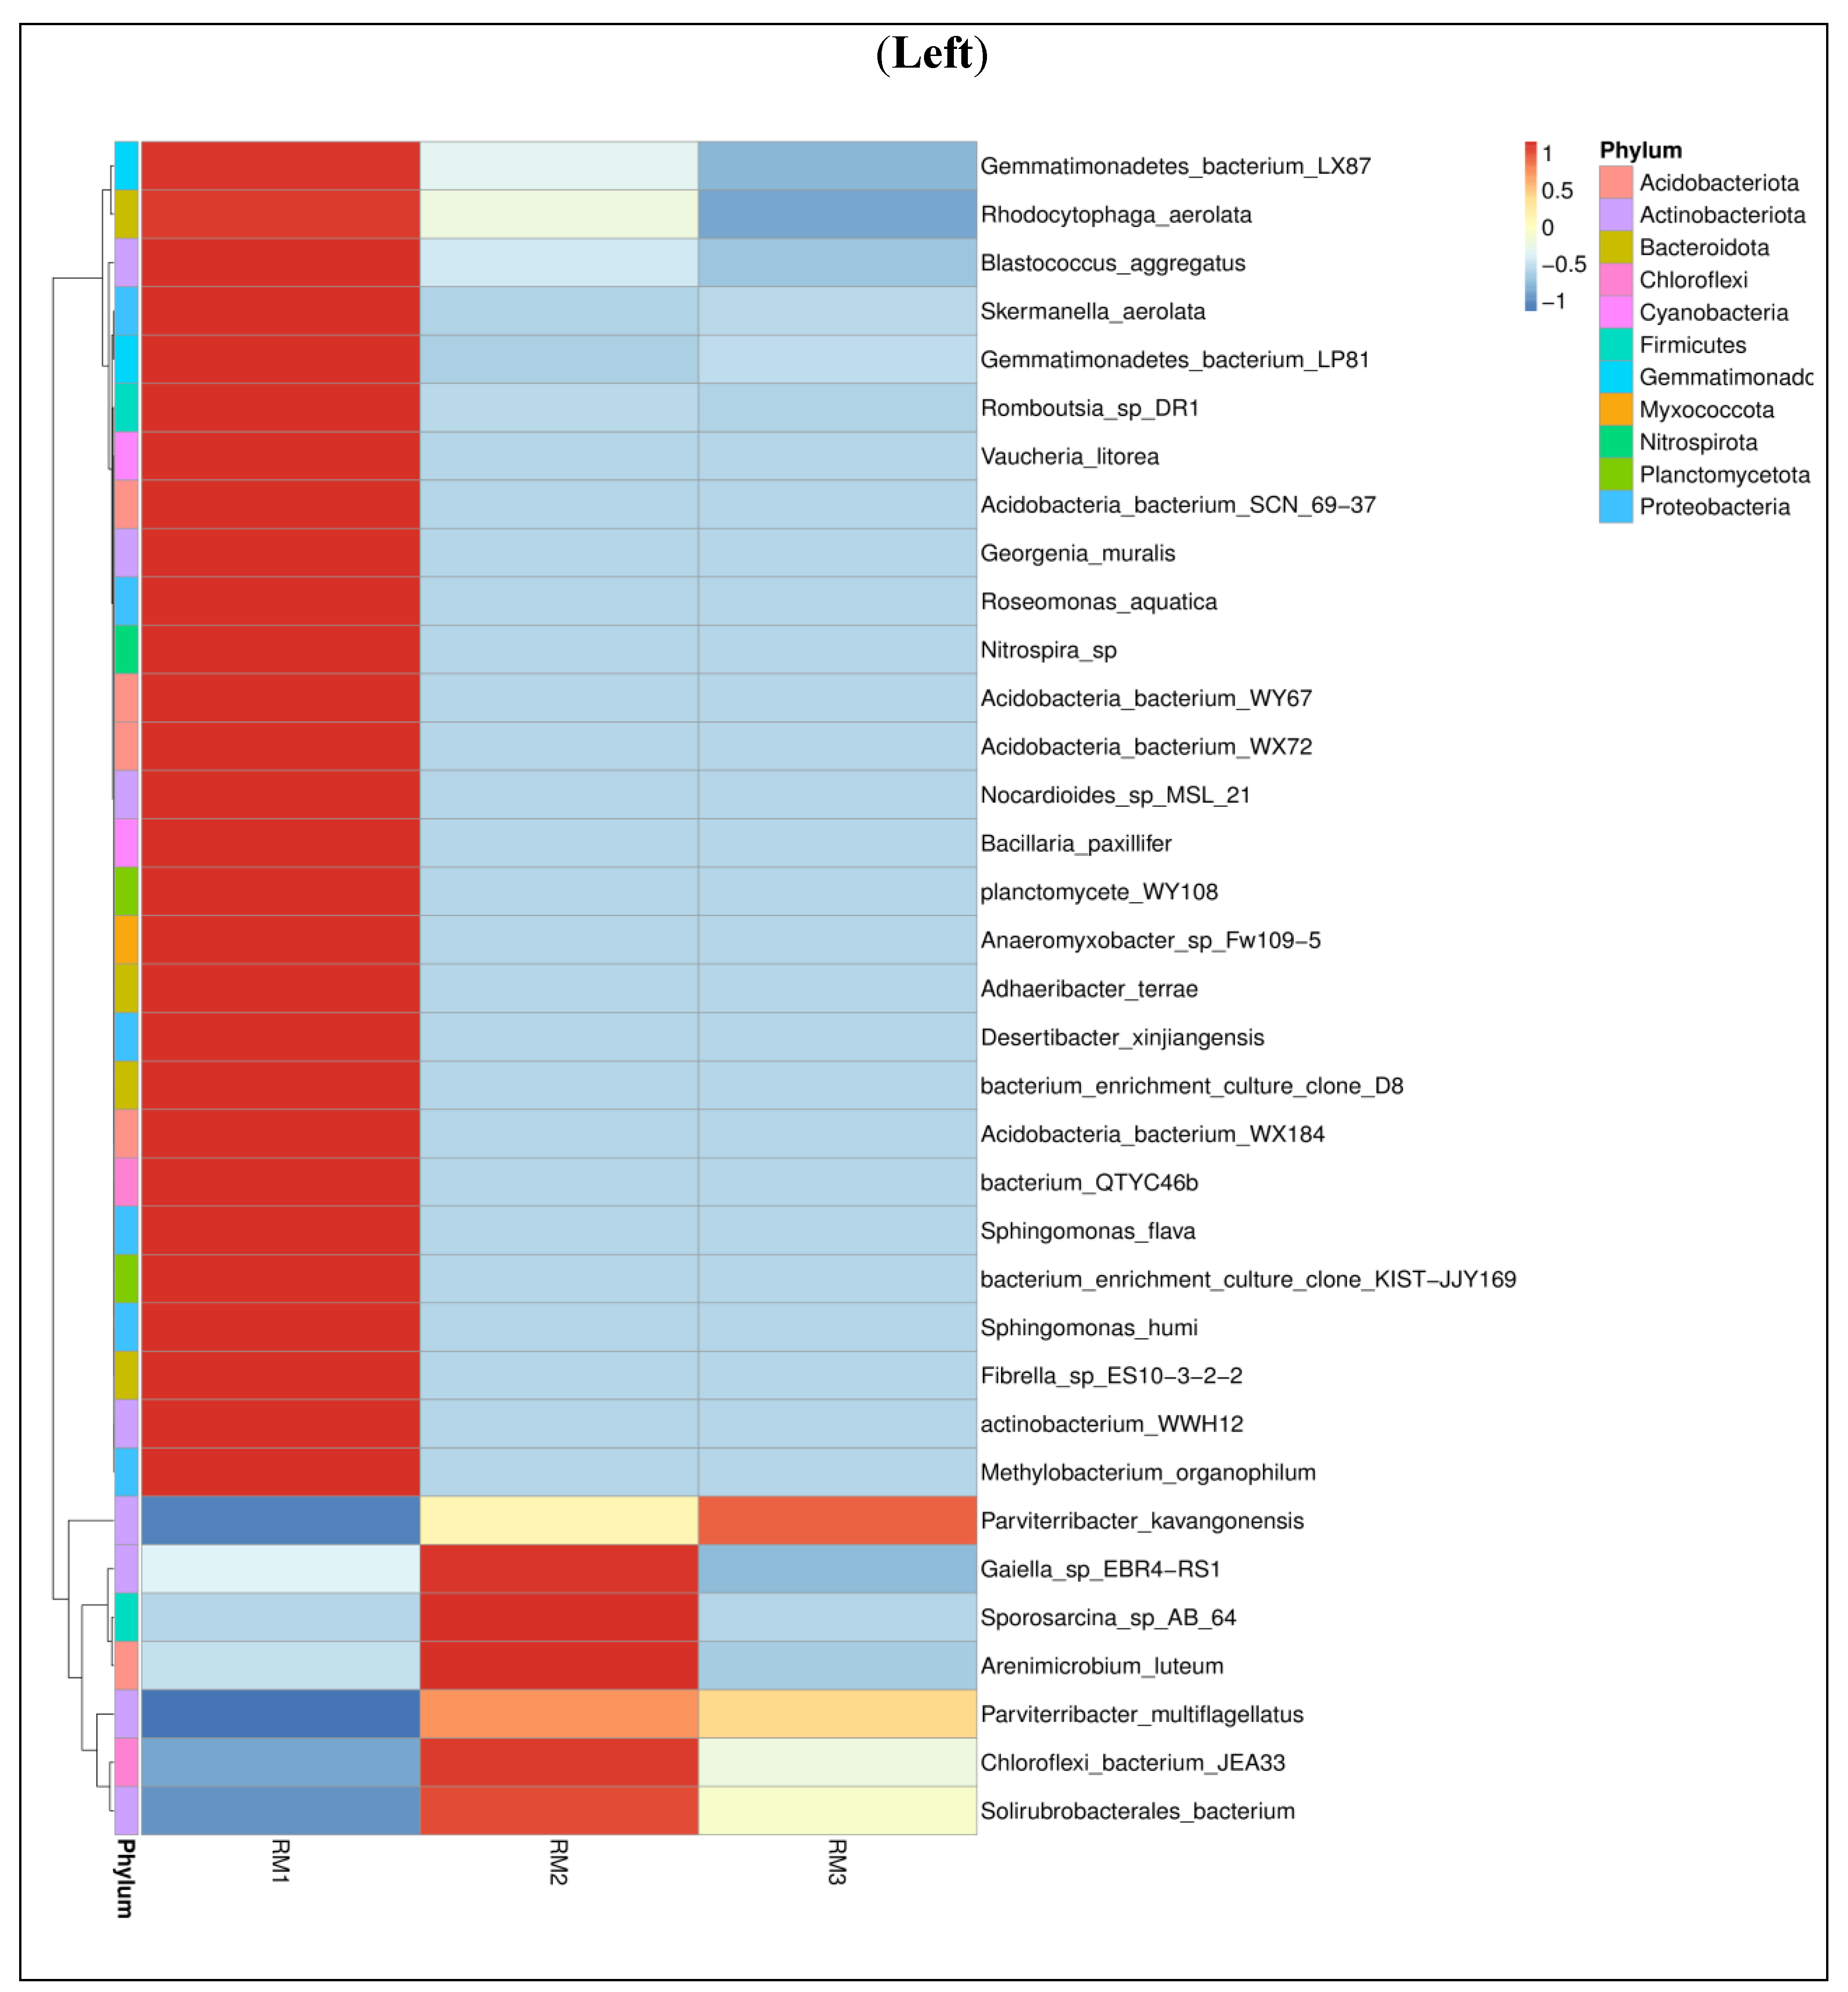
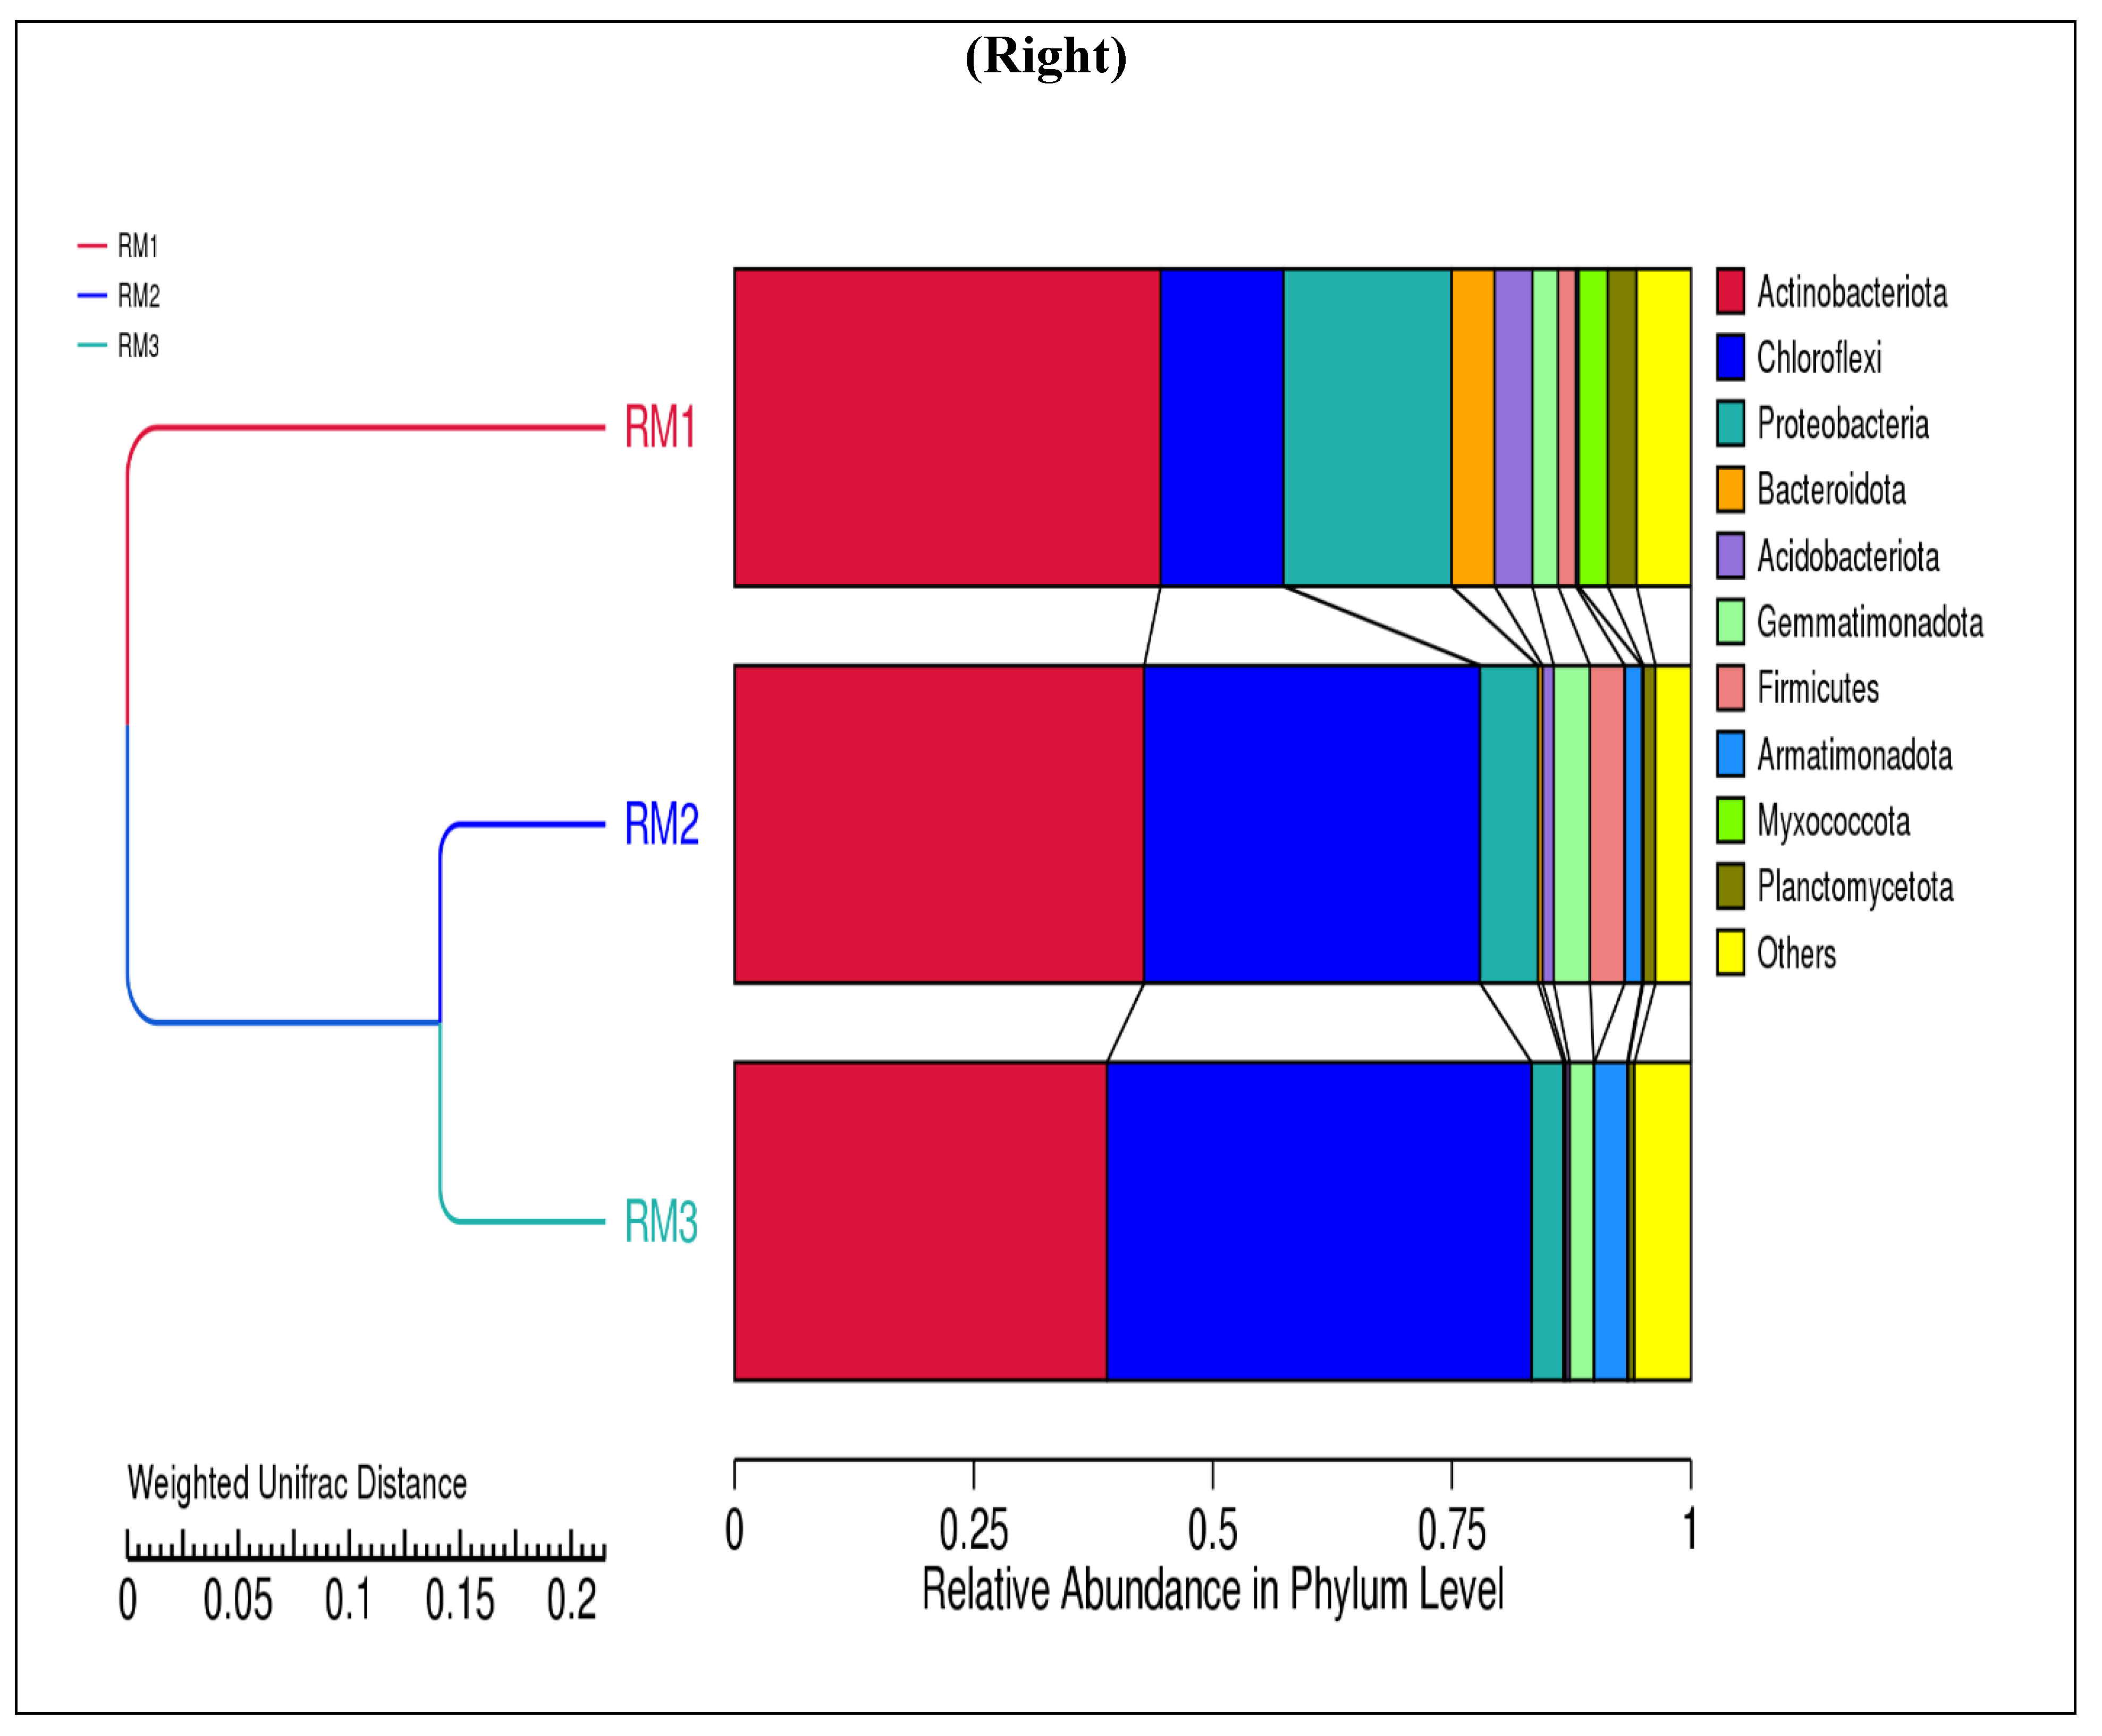
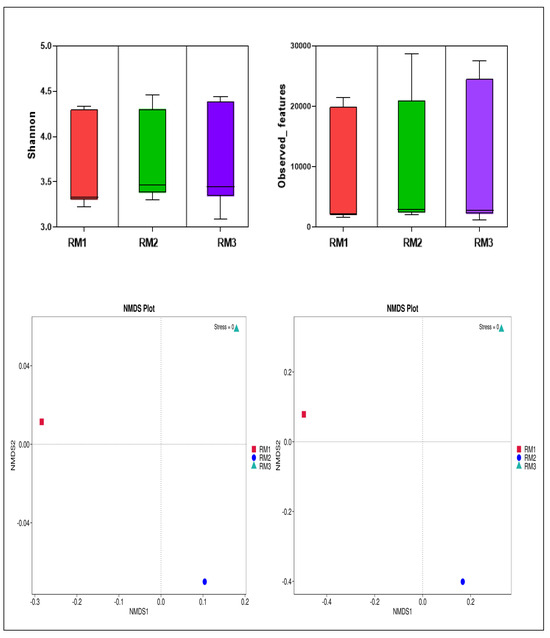
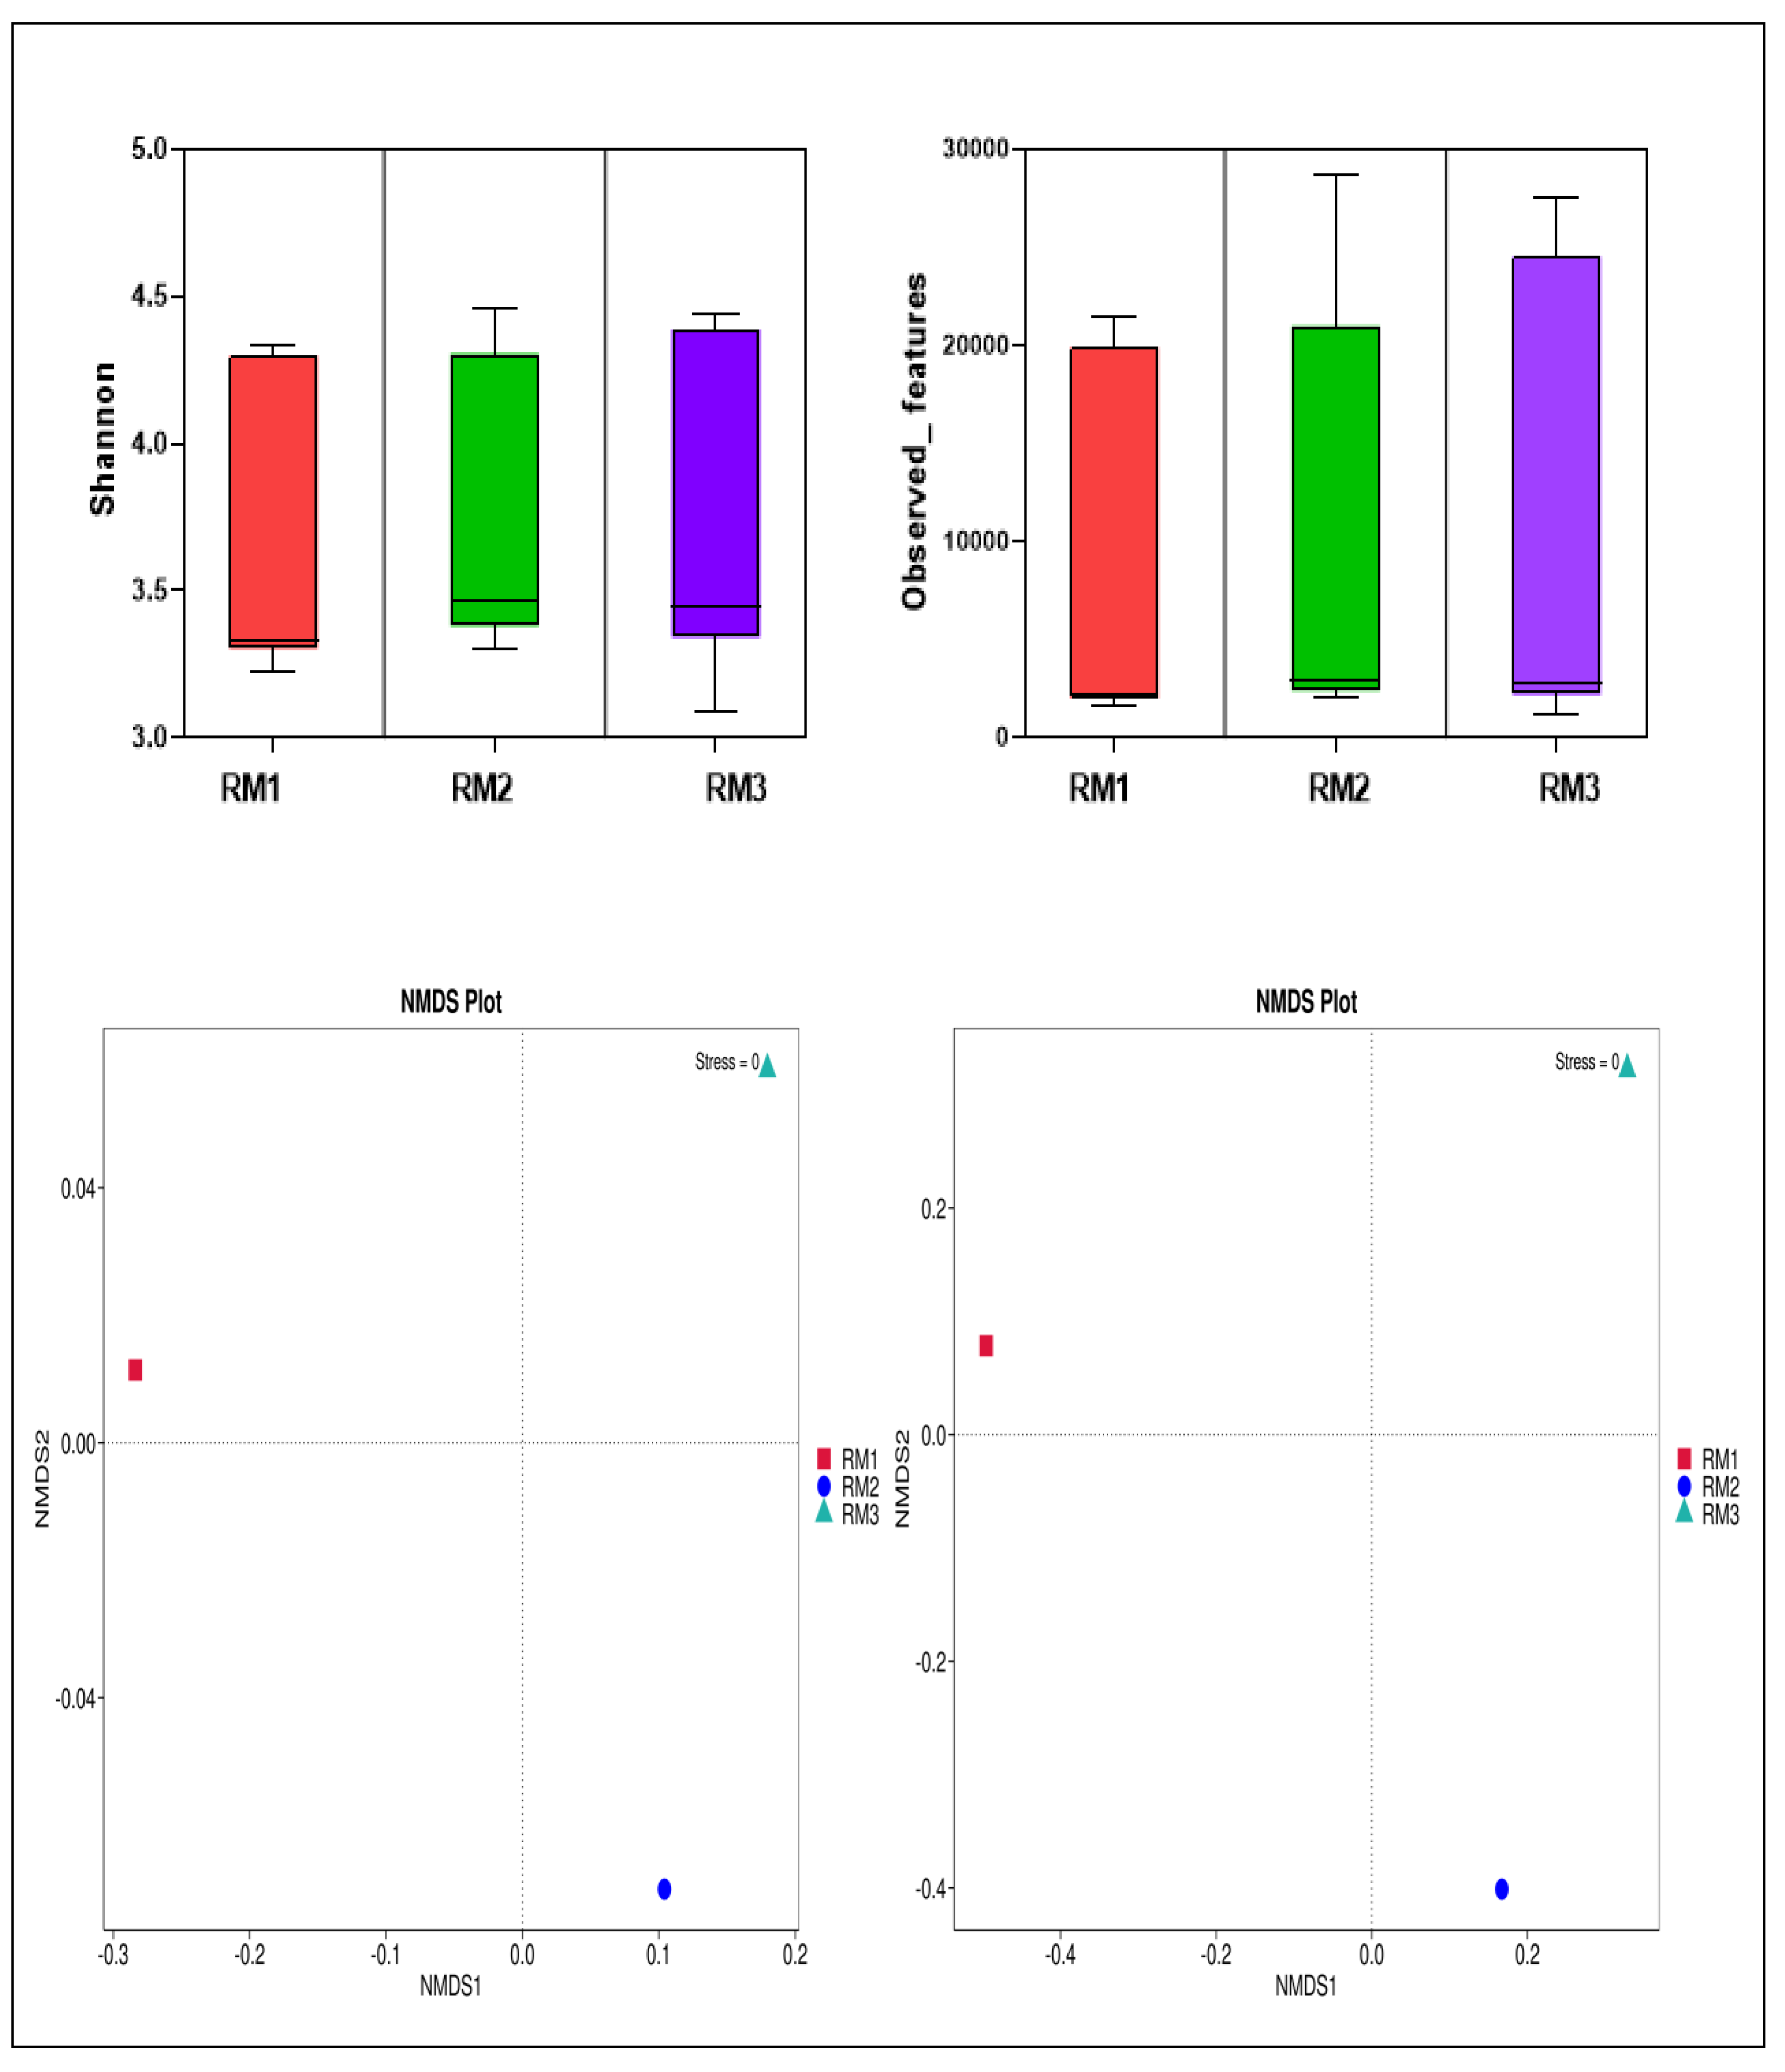
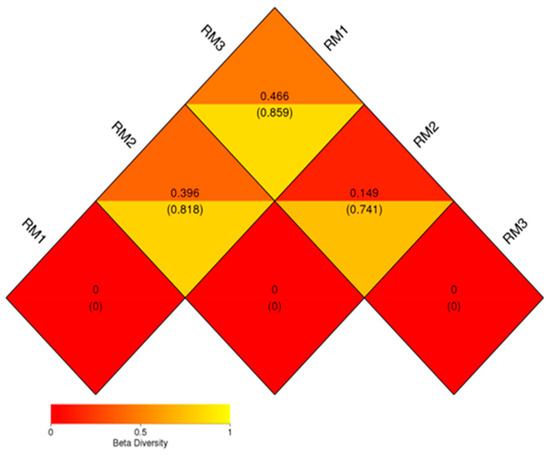
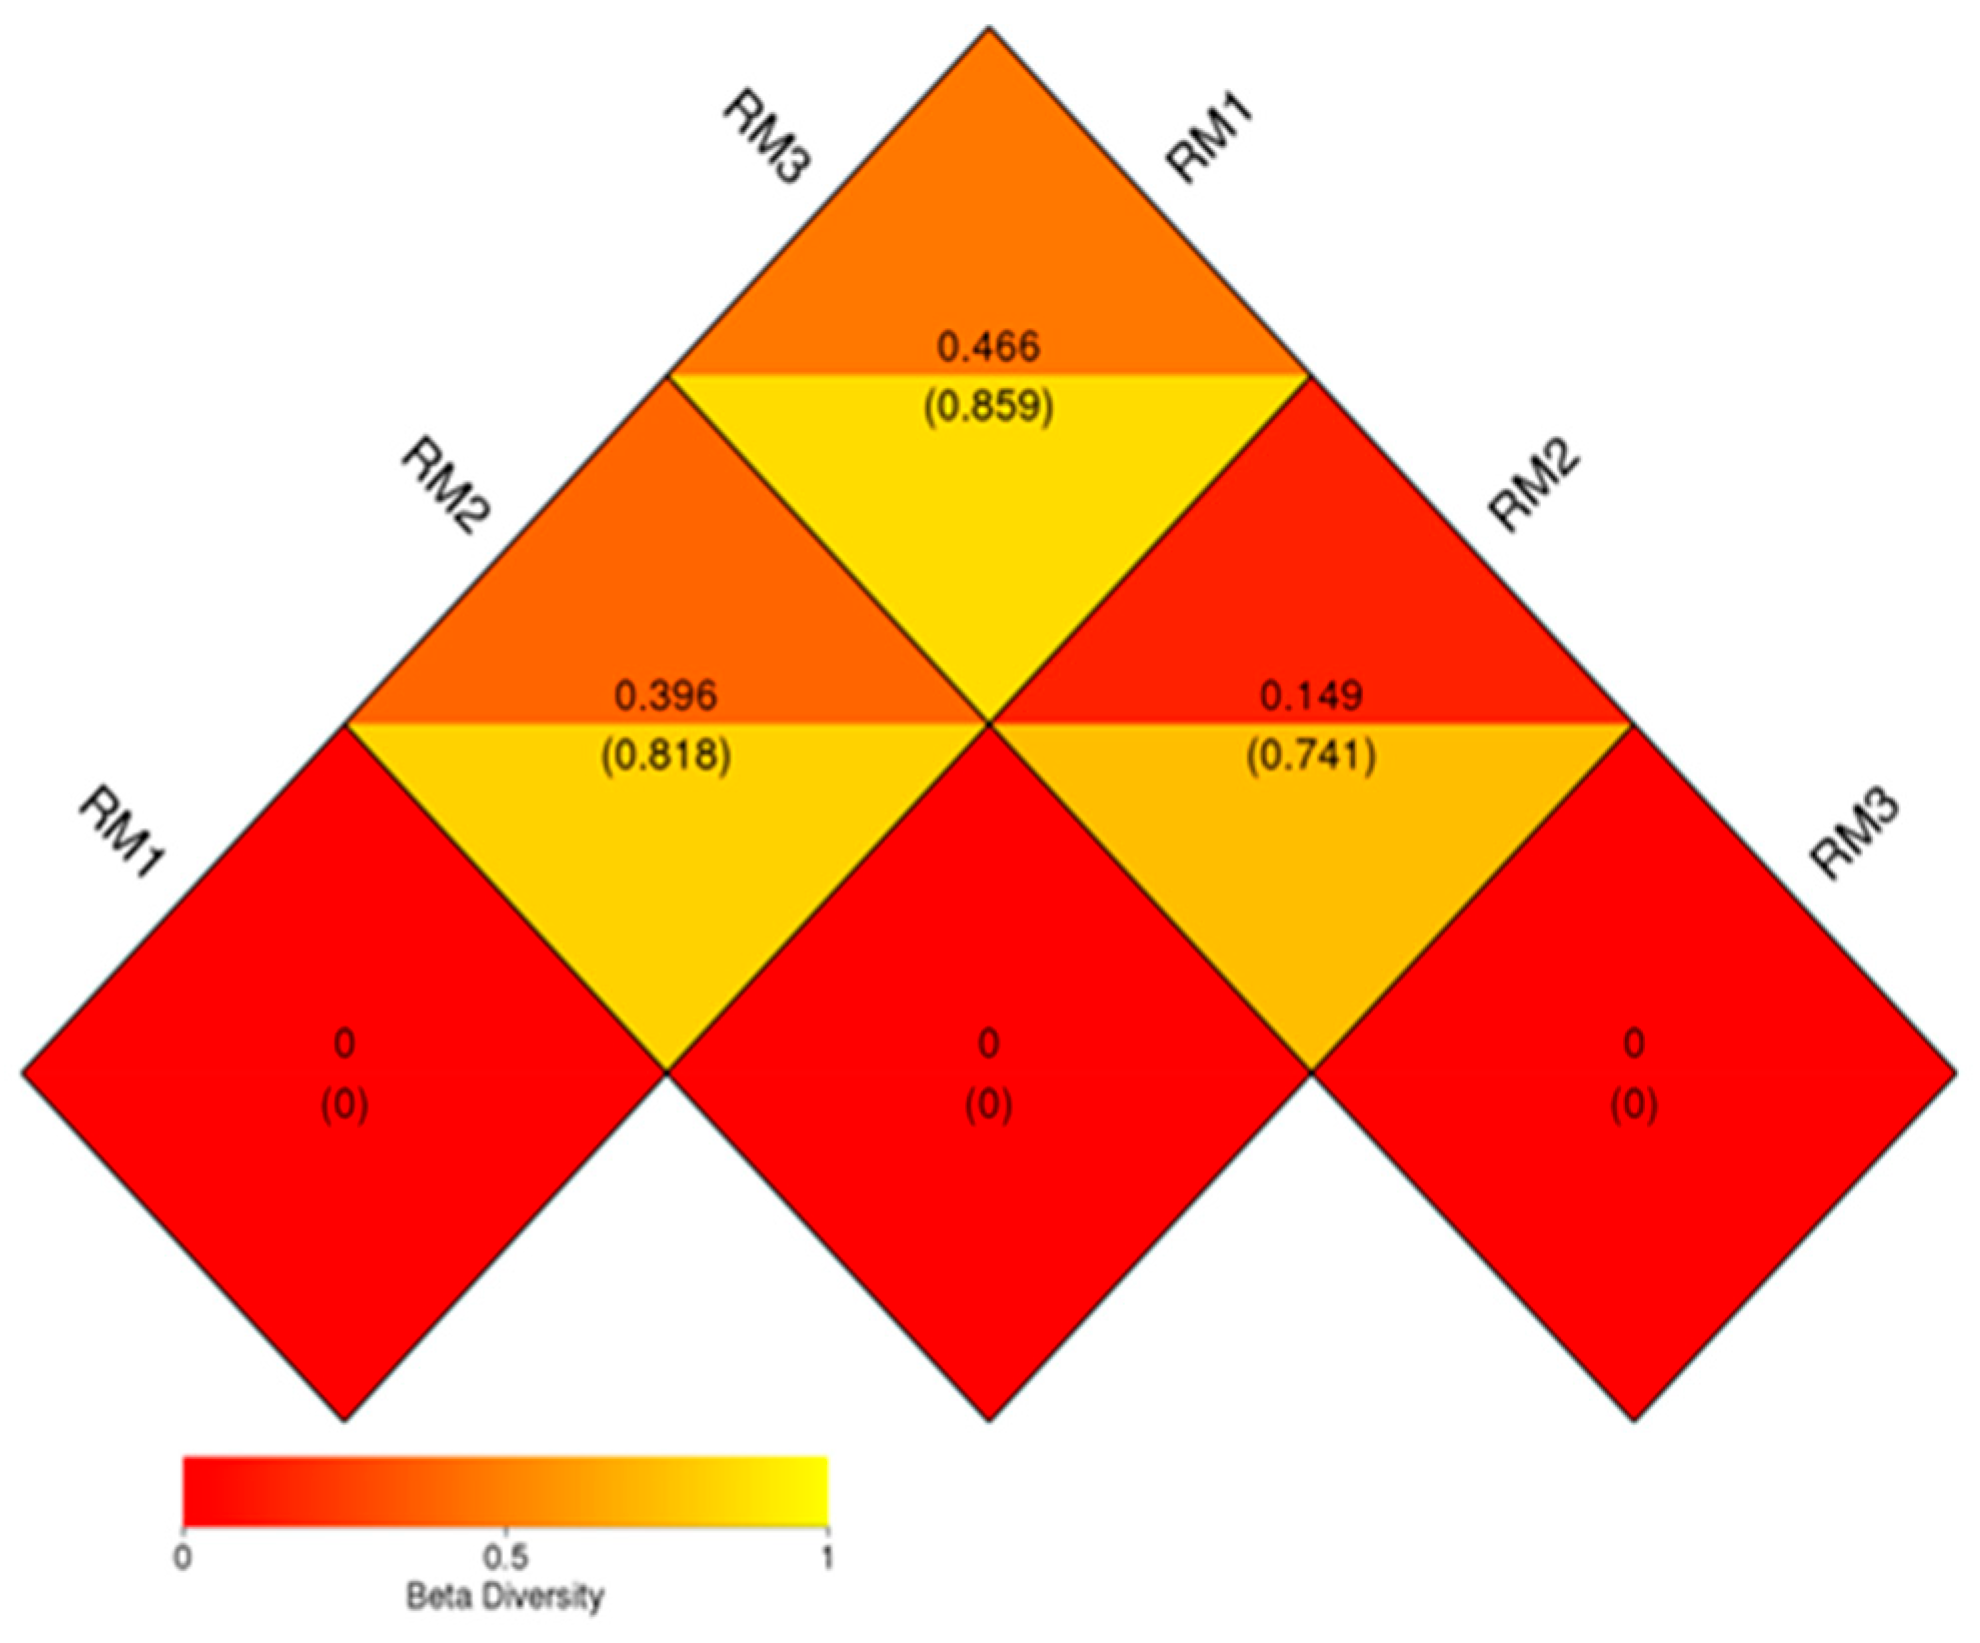
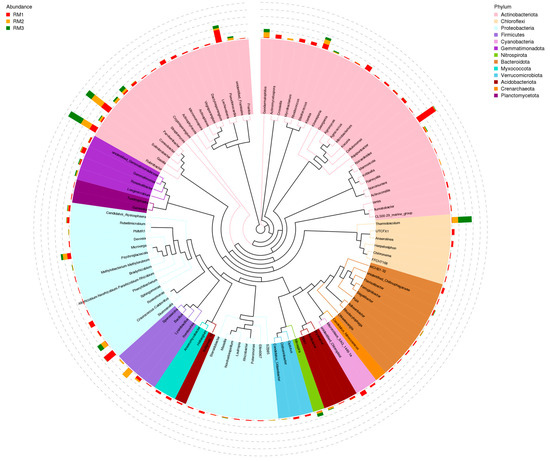
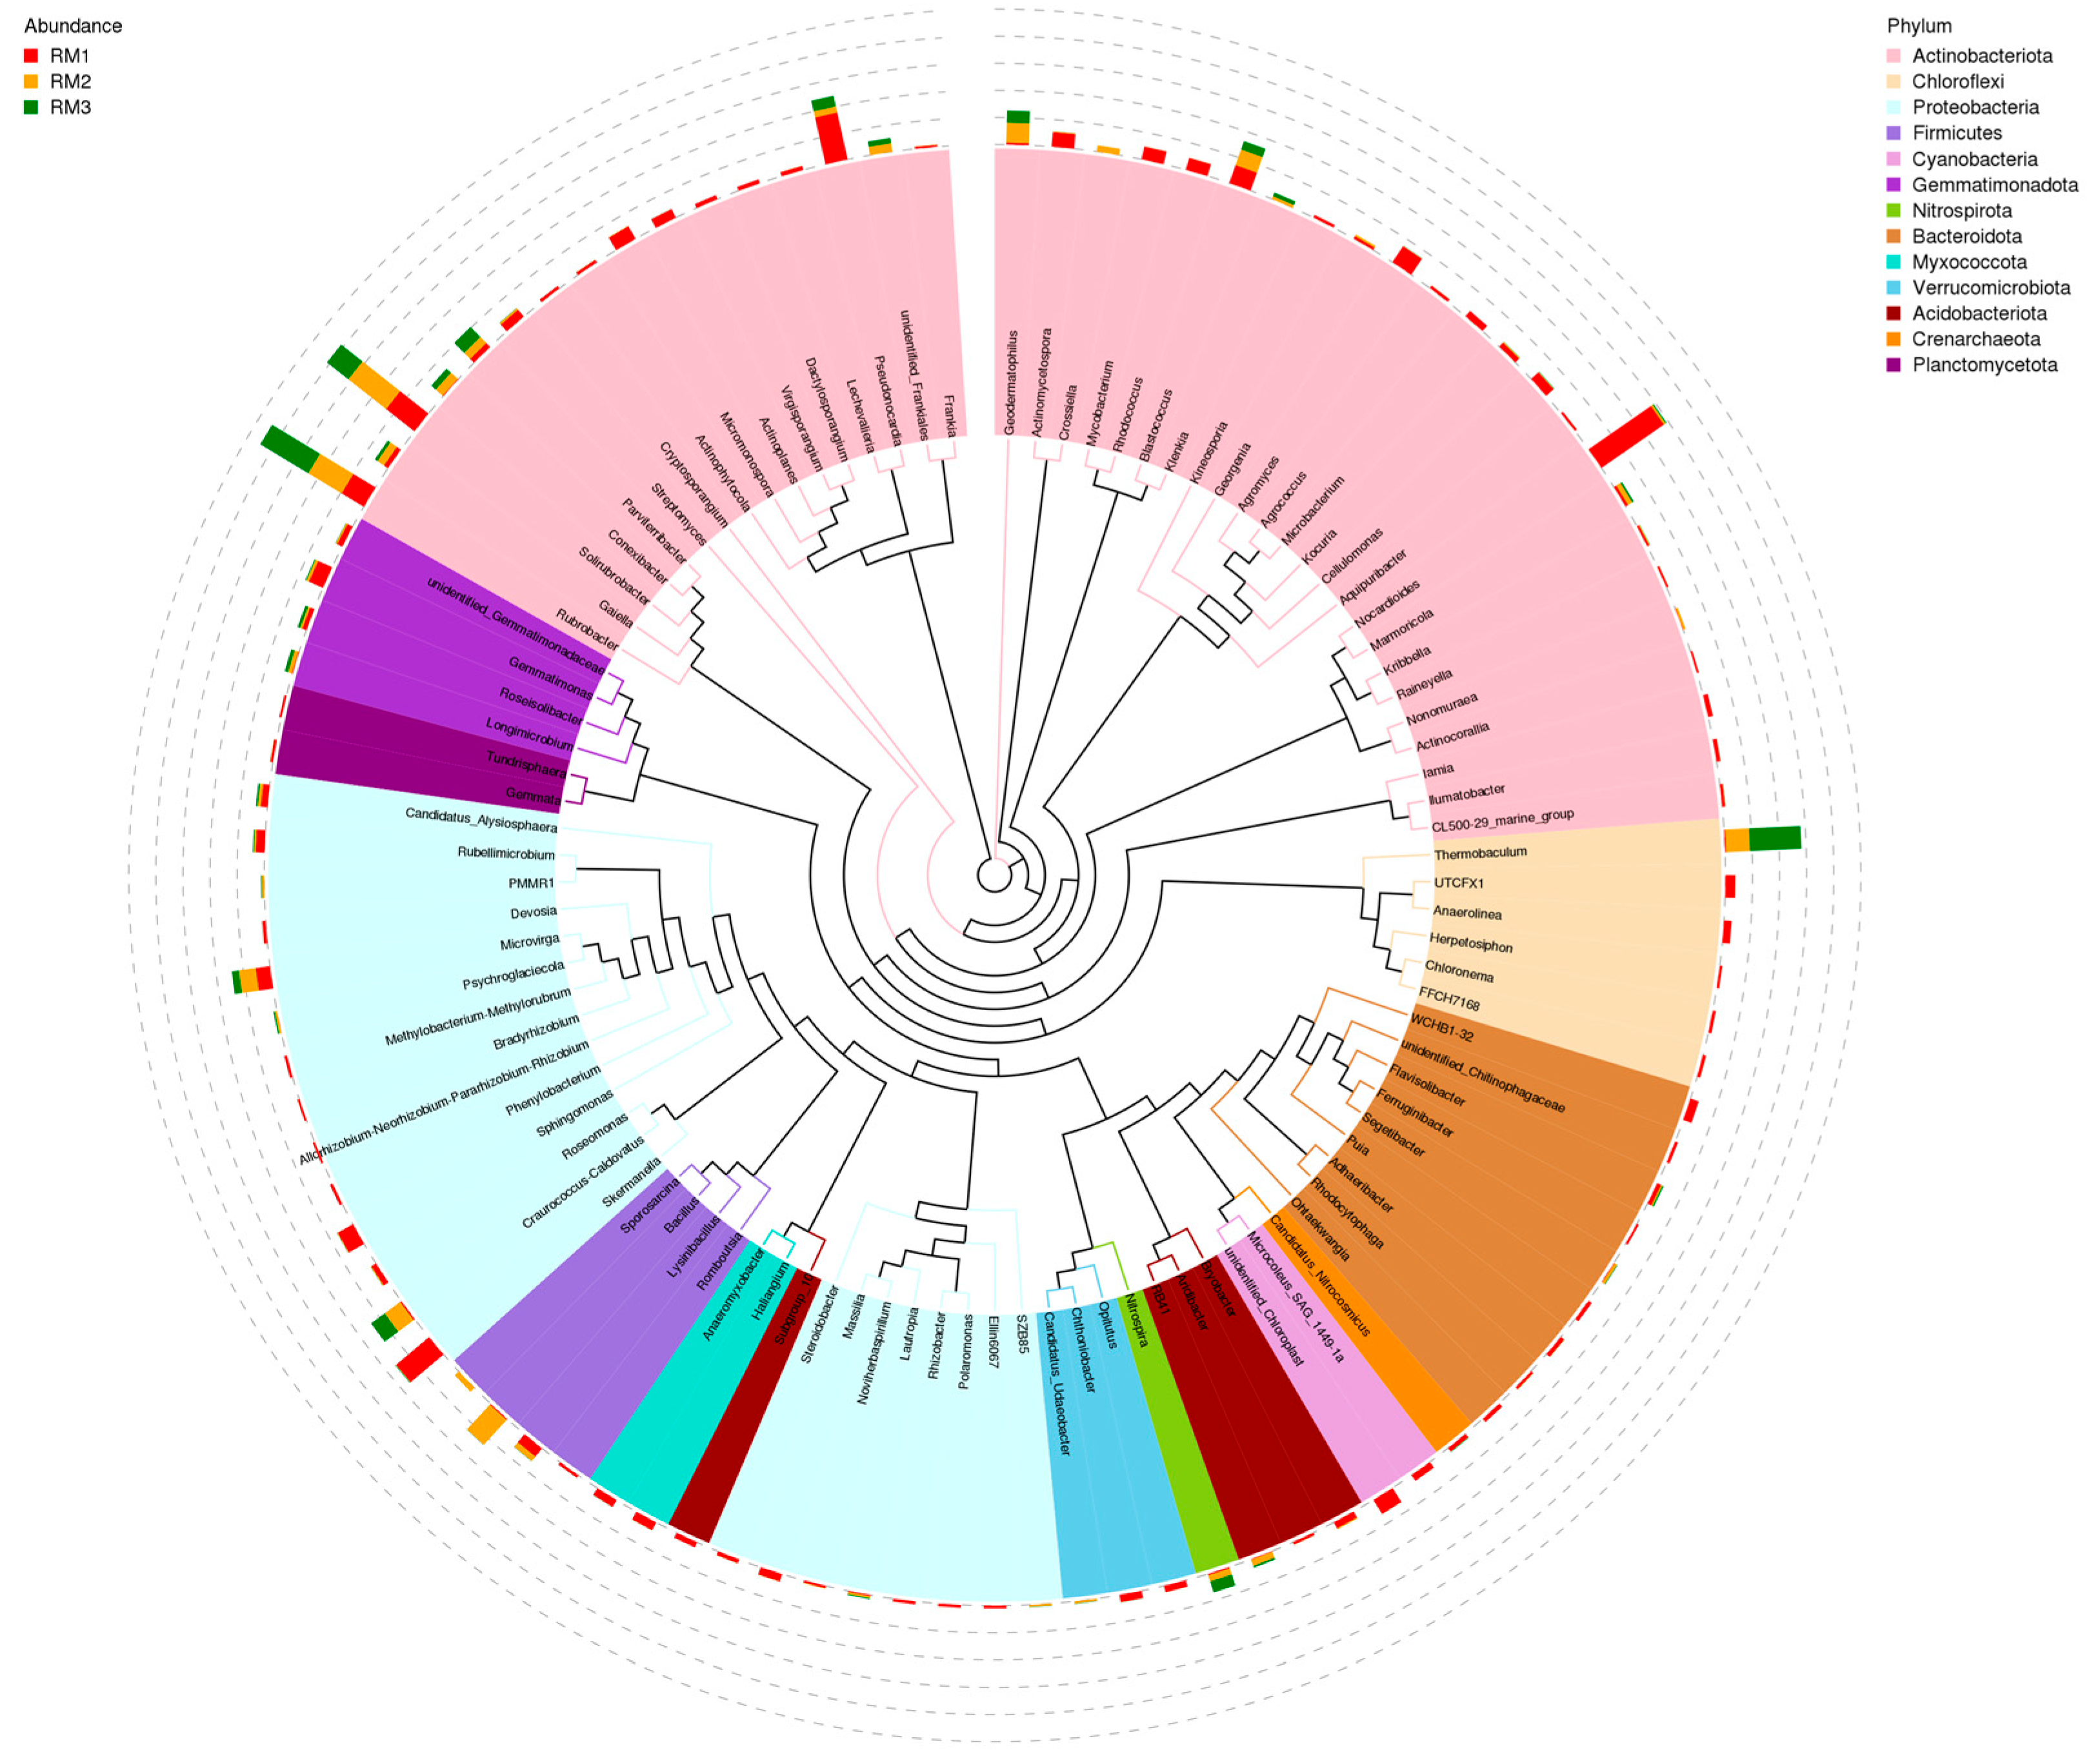
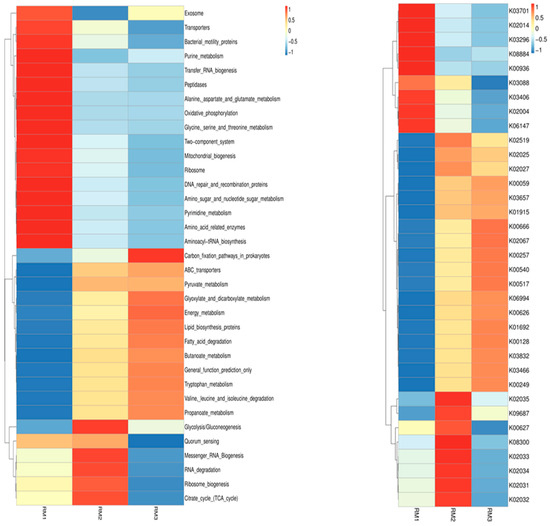
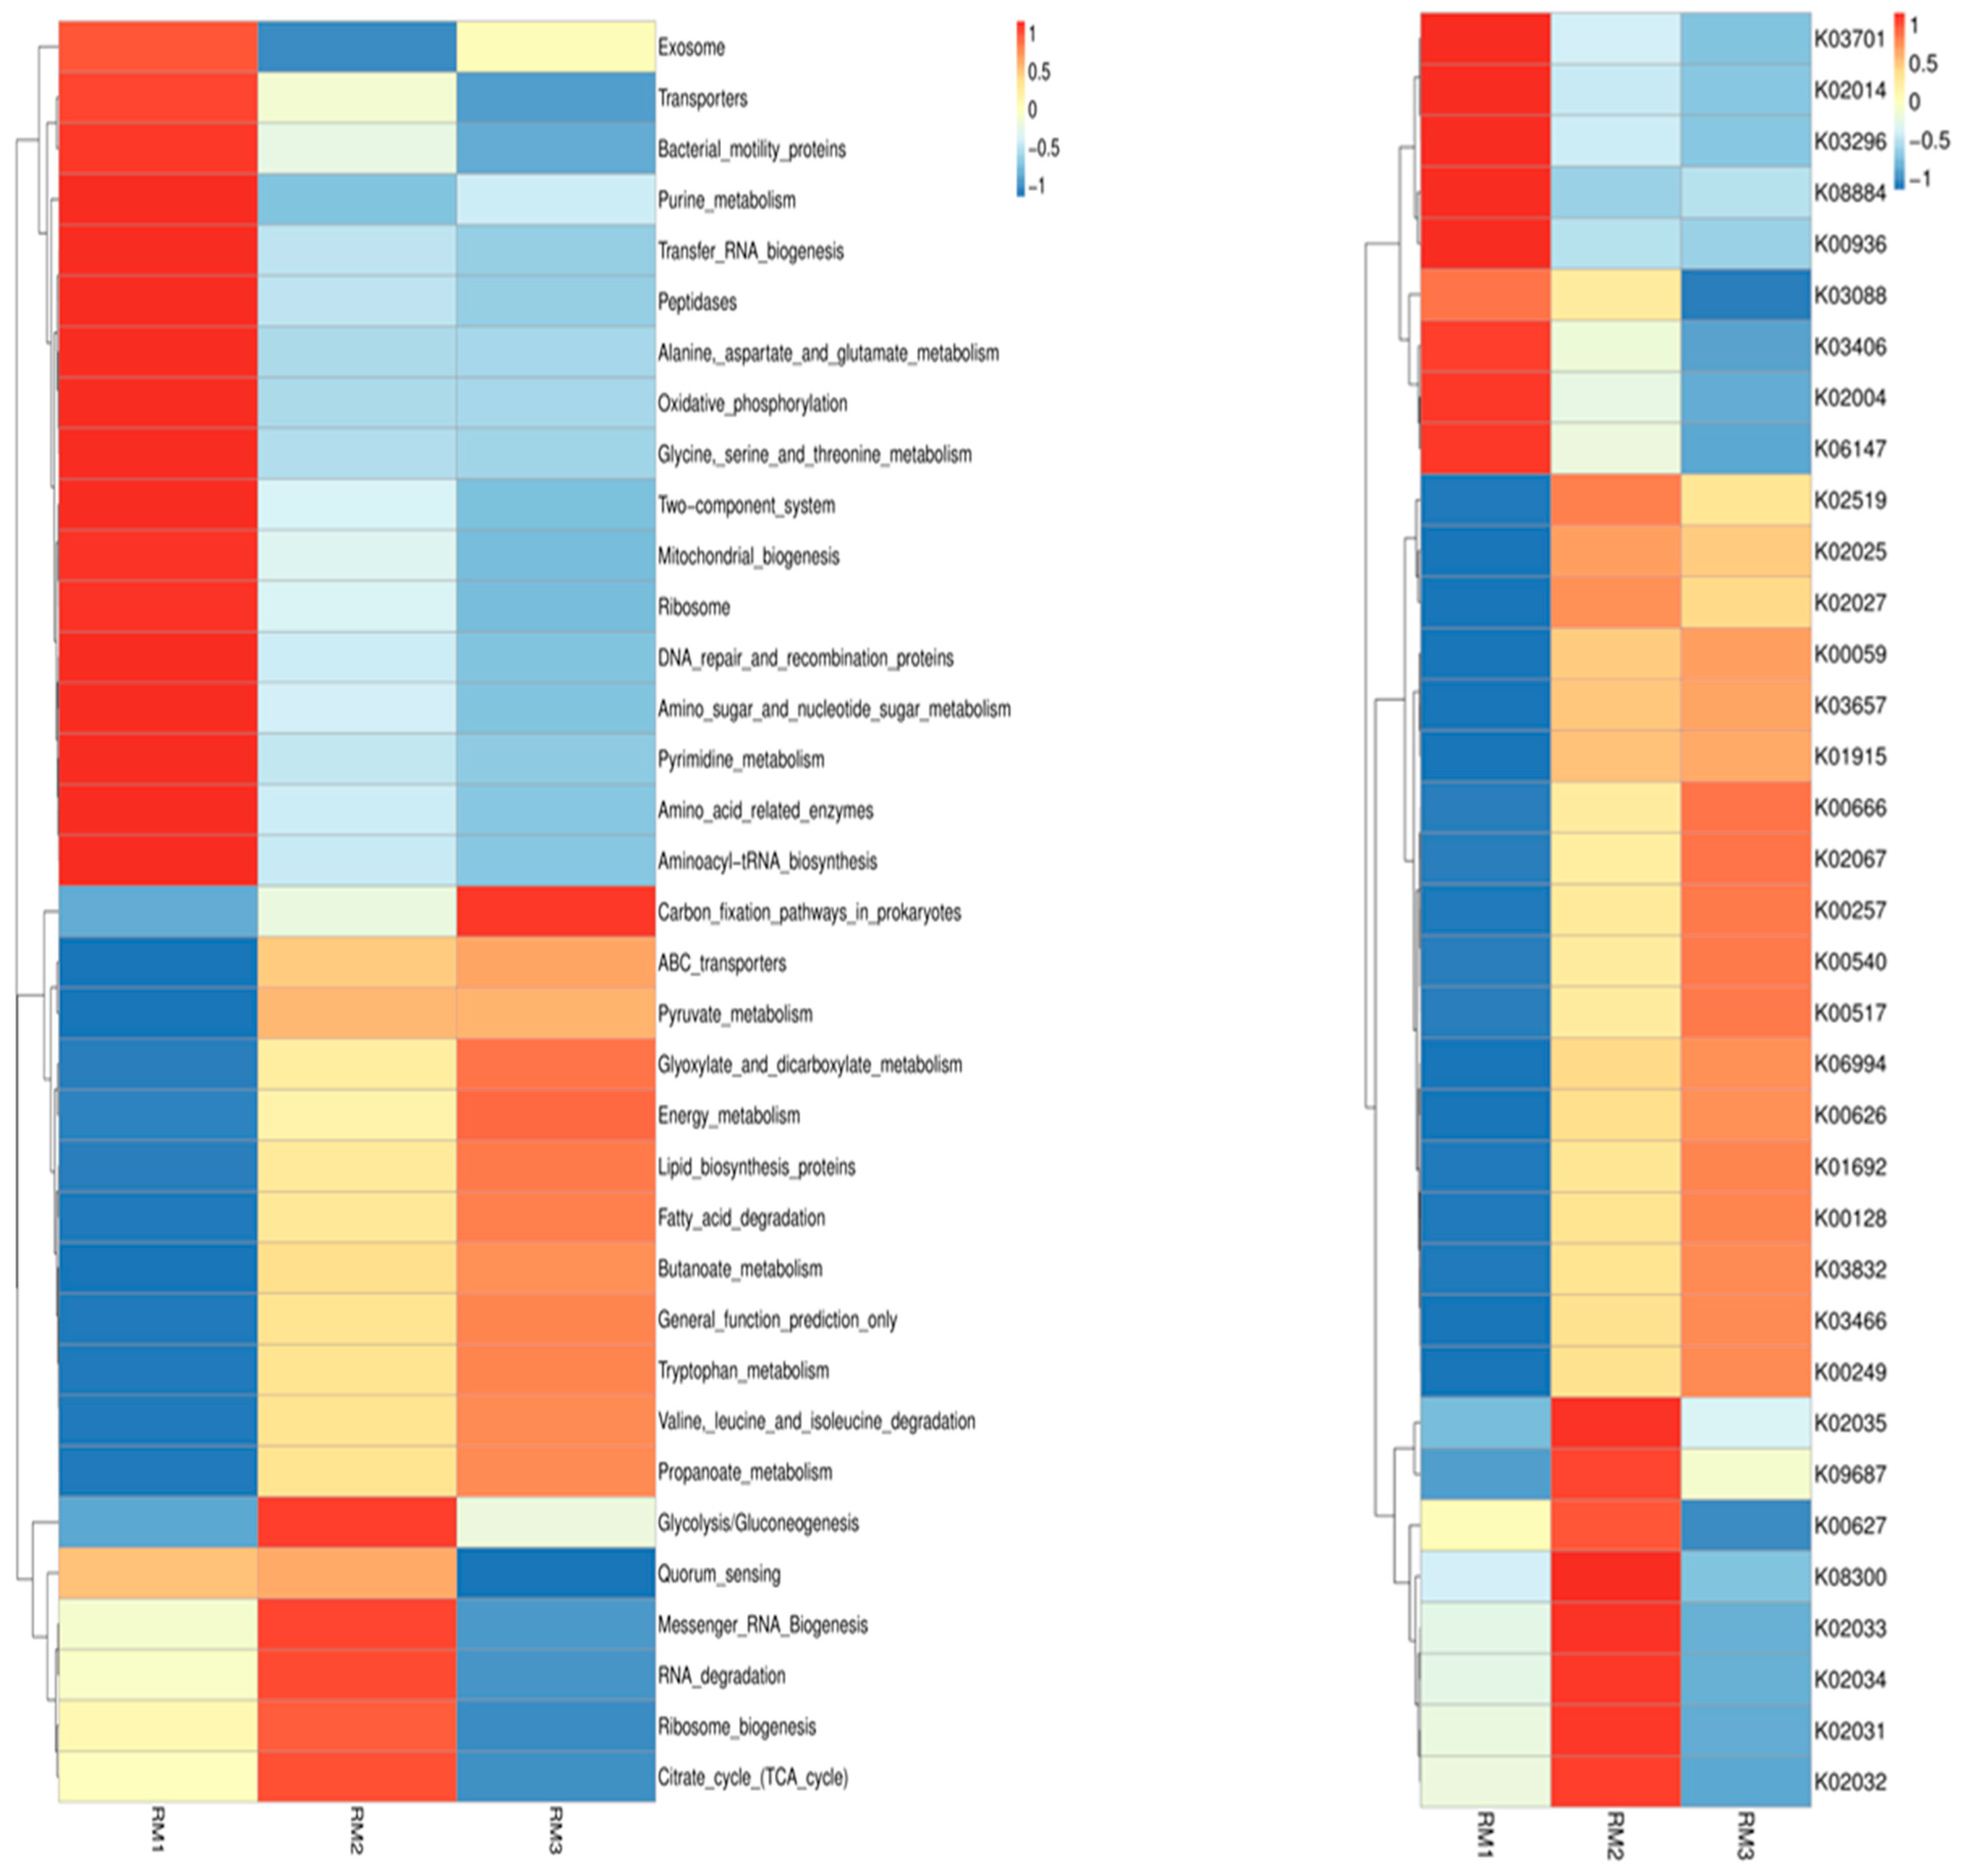

Disclaimer/Publisher’s Note: The statements, opinions and data contained in all publications are solely those of the individual author(s) and contributor(s) and not of MDPI and/or the editor(s). MDPI and/or the editor(s) disclaim responsibility for any injury to people or property resulting from any ideas, methods, instructions or products referred to in the content. |
© 2026 by the authors. Licensee MDPI, Basel, Switzerland. This article is an open access article distributed under the terms and conditions of the Creative Commons Attribution (CC BY) license.