


Abstract
Ground subsidence in mined-out areas has irreversible impacts on residents’ lives and infrastructure, making its monitoring and prediction crucial for ensuring safety, protecting the ecological environment, and promoting sustainable development. This study employed the Small Baseline Subset Interferometric Synthetic Aperture Radar (SBAS-InSAR) technique to process Sentinel-1A satellite images of Liaoyuan’s Northern New District from August 2022 to March 2025, deriving ground deformation data. The SBAS-InSAR results were validated using unmanned aerial vehicle (UAV) measurements. Monitoring revealed deformation rates ranging from −26.80 mm/year (subsidence) to 13.12 mm/year (uplift) in the area, with a maximum cumulative subsidence of 59.59 mm observed near the Xi’an Sixth District. Based on spatiotemporal patterns, most mining-induced subsidence in the study area is in its late stage, primarily caused by progressive compaction of fractured rock masses and voids within the collapse and fracture zones. Using subsidence data from August 2022 to March 2024, three prediction models—LSTM, GRU, and TCN-GRU—were trained and subsequently applied to forecast subsidence from March 2024 to August 2025. Comparisons between the predictions and SBAS-InSAR measurements showed that all models achieved high accuracy. Among them, the TCN-GRU model yielded predictions closest to the actual values, with a correlation coefficient exceeding 0.95, validating its potential for application in time-series settlement monitoring.
1. Introduction
Coal resources play a vital role in advancing the sustainable development of human society and hold an indispensable position in the global energy structure. In China, coal mining has significantly contributed to national economic growth. However, it also introduces serious adverse effects, including environmental pollution and the triggering of geological hazards. Among these, geological disasters represent a key factor contributing to ecological fragility in mining regions [1]. Specifically, surface subsidence induced by mining operations may damage infrastructure and residential buildings within affected areas. Furthermore, such subsidence can degrade farmland quality and even threaten local ecosystems, making it one of the most widespread geological hazards in mining areas worldwide [2].
For monitoring and analyzing ground deformation in mining areas, conventional techniques include leveling [3], Global Navigation Satellite Systems (GNSS) such as GPS and GLONASS, total station surveying, and 3D laser scanning [4]. In recent years, ground surface settlement monitoring techniques have been demonstrated to be reliable, achieving accuracies from centimeters down to millimeters. Leveling, as a classical geodetic approach, has been widely used in surface deformation studies. Although highly accurate, these methods are often costly, labor-intensive, and spatially limited [5]. Thus, effectively capturing deformation characteristics across entire mining areas remains a significant practical and technical challenge.
In recent decades, interferometric synthetic aperture radar (InSAR) has garnered increasing attention as an emerging space-based Earth observation technology. It offers several advantages, including comprehensive coverage, high accuracy, all-weather capability, and excellent spatial resolution, and has become a primary technique for Earth observation. Building upon InSAR, differential interferometric synthetic aperture radar (D-InSAR) [6] enables high-precision deformation monitoring. As a subsequent development in Earth observation, D-InSAR is widely employed for monitoring large spatial areas [7]. To address the limitations of D-InSAR, such as susceptibility to atmospheric effects and decorrelation, researchers have developed time-series InSAR (TS-InSAR) processing techniques, including the permanent scatterer (PS-InSAR) and small baseline subset (SBAS-InSAR) methods [8,9]. TS-InSAR offers the unique advantage of deriving time-series surface deformation [10]. For instance, Wang et al. [11] employed a robust deformation estimation technique integrating PS and distributed scatterer (DS) points to achieve early identification of large-area, high-density ground settlement in a mining area. They obtained settlement data using SBAS-InSAR and validated the results against GNSS measurements, demonstrating the high accuracy of SBAS-InSAR for long-term ground subsidence monitoring. Regarding ground control point (GCP) selection, Wang and Feng [12] proposed deriving ground control information from PS-InSAR processing for integration into SBAS-InSAR processing. Their results confirmed the reliability and accuracy of this combined (PS-SBAS-InSAR) approach. Furthermore, methods to mitigate anomalous errors during the SBAS-InSAR time-series update process have also been investigated. In summary, the SBAS-InSAR method provides critical support for monitoring ground settlement in mining areas [13], which is of great significance for the stability of buildings and personal safety [14].
Alongside advances in subsidence monitoring technology, the prediction of ground subsidence has also gained significant attention [15]. The most commonly employed prediction methods can be categorized into three groups: physical models [16], mathematical-statistical models [17], and artificial intelligence (AI) models [18].
Among these, physical models predict subsidence by simulating the evolution of underlying physical mechanisms [19]. However, ground subsidence is a complex phenomenon influenced by numerous factors. This complexity makes it challenging to select appropriate calculation parameters, a difficulty that is compounded when attempting to account for the time-dependent nature of subsidence. Consequently, physical models face inherent limitations in this context. Mathematical-statistical models typically involve simpler parameter definitions. Although they can establish relationships from large datasets to accommodate settlement changes, they often lack a solid geological foundation. This makes it challenging for them to generate reliable predictions in areas exhibiting complex or highly variable settlement patterns.
Artificial intelligence (AI) models analyze monitoring data through training and regression prediction [20]. In contrast to traditional physical models, AI models can learn complex, nonlinear settlement-time response mechanisms directly from long-term monitoring data. While traditional physical models often simplify temporal effects using empirical formulas, AI models excel at capturing dynamic and non-stationary time-dependent relationships—a capability generally absent in conventional statistical models. Furthermore, the adaptable framework of AI models facilitates rapid updates as new data becomes available, helping to reduce uncertainties in long-term projections. Consequently, AI-based approaches can provide more precise and efficient long-term subsidence forecasts for specific locations compared to traditional methods. Commonly used AI techniques include backpropagation (BP) neural networks [21], random forests [22], Recurrent Neural Networks (RNN) [23], Long Short-Term Memory networks (LSTM) [24], and Convolutional Neural Networks (CNN) [25]. Given that ground settlement is a long-term process influenced by complex, multifactorial relationships, individual algorithms often struggle to effectively reduce data noise for robust predictive analysis. To overcome the limitations of single-algorithm approaches, integrated or hybrid algorithms have been developed. For example, Liu and Zhang [26] obtained ground settlement data via SBAS-InSAR and analyzed it using a Long Short-Term Memory (LSTM) neural network enhanced with an attention mechanism to better integrate temporal dependencies. Similarly, Zhu and Qin [27] proposed a novel noise reduction approach that applies Complete Ensemble Empirical Mode Decomposition with Adaptive Noise (CEEMDAN) and Independent Component Analysis (ICA) to preprocess the raw input data.
Cai et al. [28] investigated subsidence monitoring in mining areas via an integrated, intelligent system. By incorporating reinforced mechanical mechanisms into their forecasting model, they achieved both prediction and control of residual subsidence. Lian et al. [29] proposed a time-series model for predicting residual subsidence in mountainous underground mining areas, utilizing GNSS online monitoring data. Their model integrates the probability integral method with a Kelvin rock mechanics model and incorporates a collapse-compaction coefficient to account for the behavior of fragmented rock. The GNSS data are processed using median averaging and Kalman filters. The model parameters are then inverted via a particle swarm optimization algorithm, enabling high-precision prediction of residual subsidence at arbitrary ground points. Guo et al. [30] developed a Surface Residual Settlement Prediction Model (SRSPM). Based on the probability integral method, the SRSPM comprehensively accounts for the three-dimensional distribution characteristics of various void types within the goaf—including fractured rock voids, boundary voids, and stratum separation voids—thereby enabling more accurate residual settlement prediction. Modeste et al. [31] combined leveling measurements with InSAR data to establish a dual-exponential model. Their analysis revealed that the settlement is governed by two distinct mechanisms: the response of the overlying strata and the compaction process within the goaf. This work confirms the applicability of InSAR technology for long-term monitoring and risk assessment of residual-phase, micro-scale settlement. Although current subsidence prediction techniques have matured considerably, significant potential for further development and exploration remains [32].
This study focuses on an abandoned mining area in northern Liaoyuan City, Jilin Province, employing a multi-source data integration approach. First, SBAS-InSAR technology is employed to monitor large-scale surface subsidence over time. Subsequently, high-precision unmanned aerial vehicle (UAV) data are introduced to locally validate and calibrate the InSAR-derived results. For subsidence prediction, this study proposes a hybrid deep learning model that couples a Temporal Convolutional Network (TCN) with a Gated Recurrent Unit (GRU) network. This architecture is designed to leverage the powerful local feature extraction capability of the TCN and the strength of the GRU in modeling long-term temporal dependencies, thereby aiming to more accurately characterize the spatiotemporal evolution patterns of mining-induced subsidence. To validate the model’s effectiveness, SBAS-InSAR monitoring data were used as input, and the performance of the proposed TCN-GRU model was compared against classical models, including Long Short-Term Memory (LSTM) and standalone GRU networks. The results demonstrate that the TCN-GRU model exhibits significant advantages in prediction accuracy, offering a novel and high-performance solution for the intelligent and high-precision prediction of mining subsidence.
2. Study Area and Data Sources
2.1. Study Area
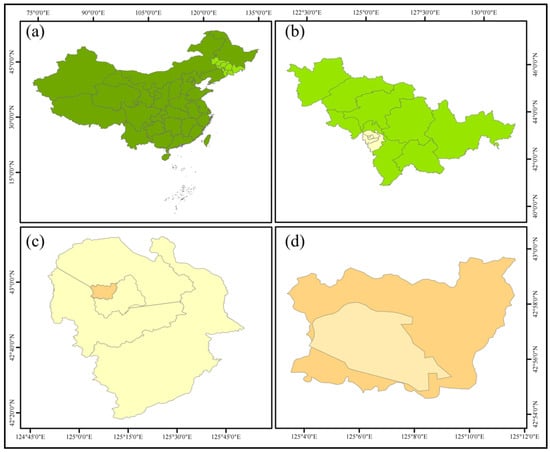
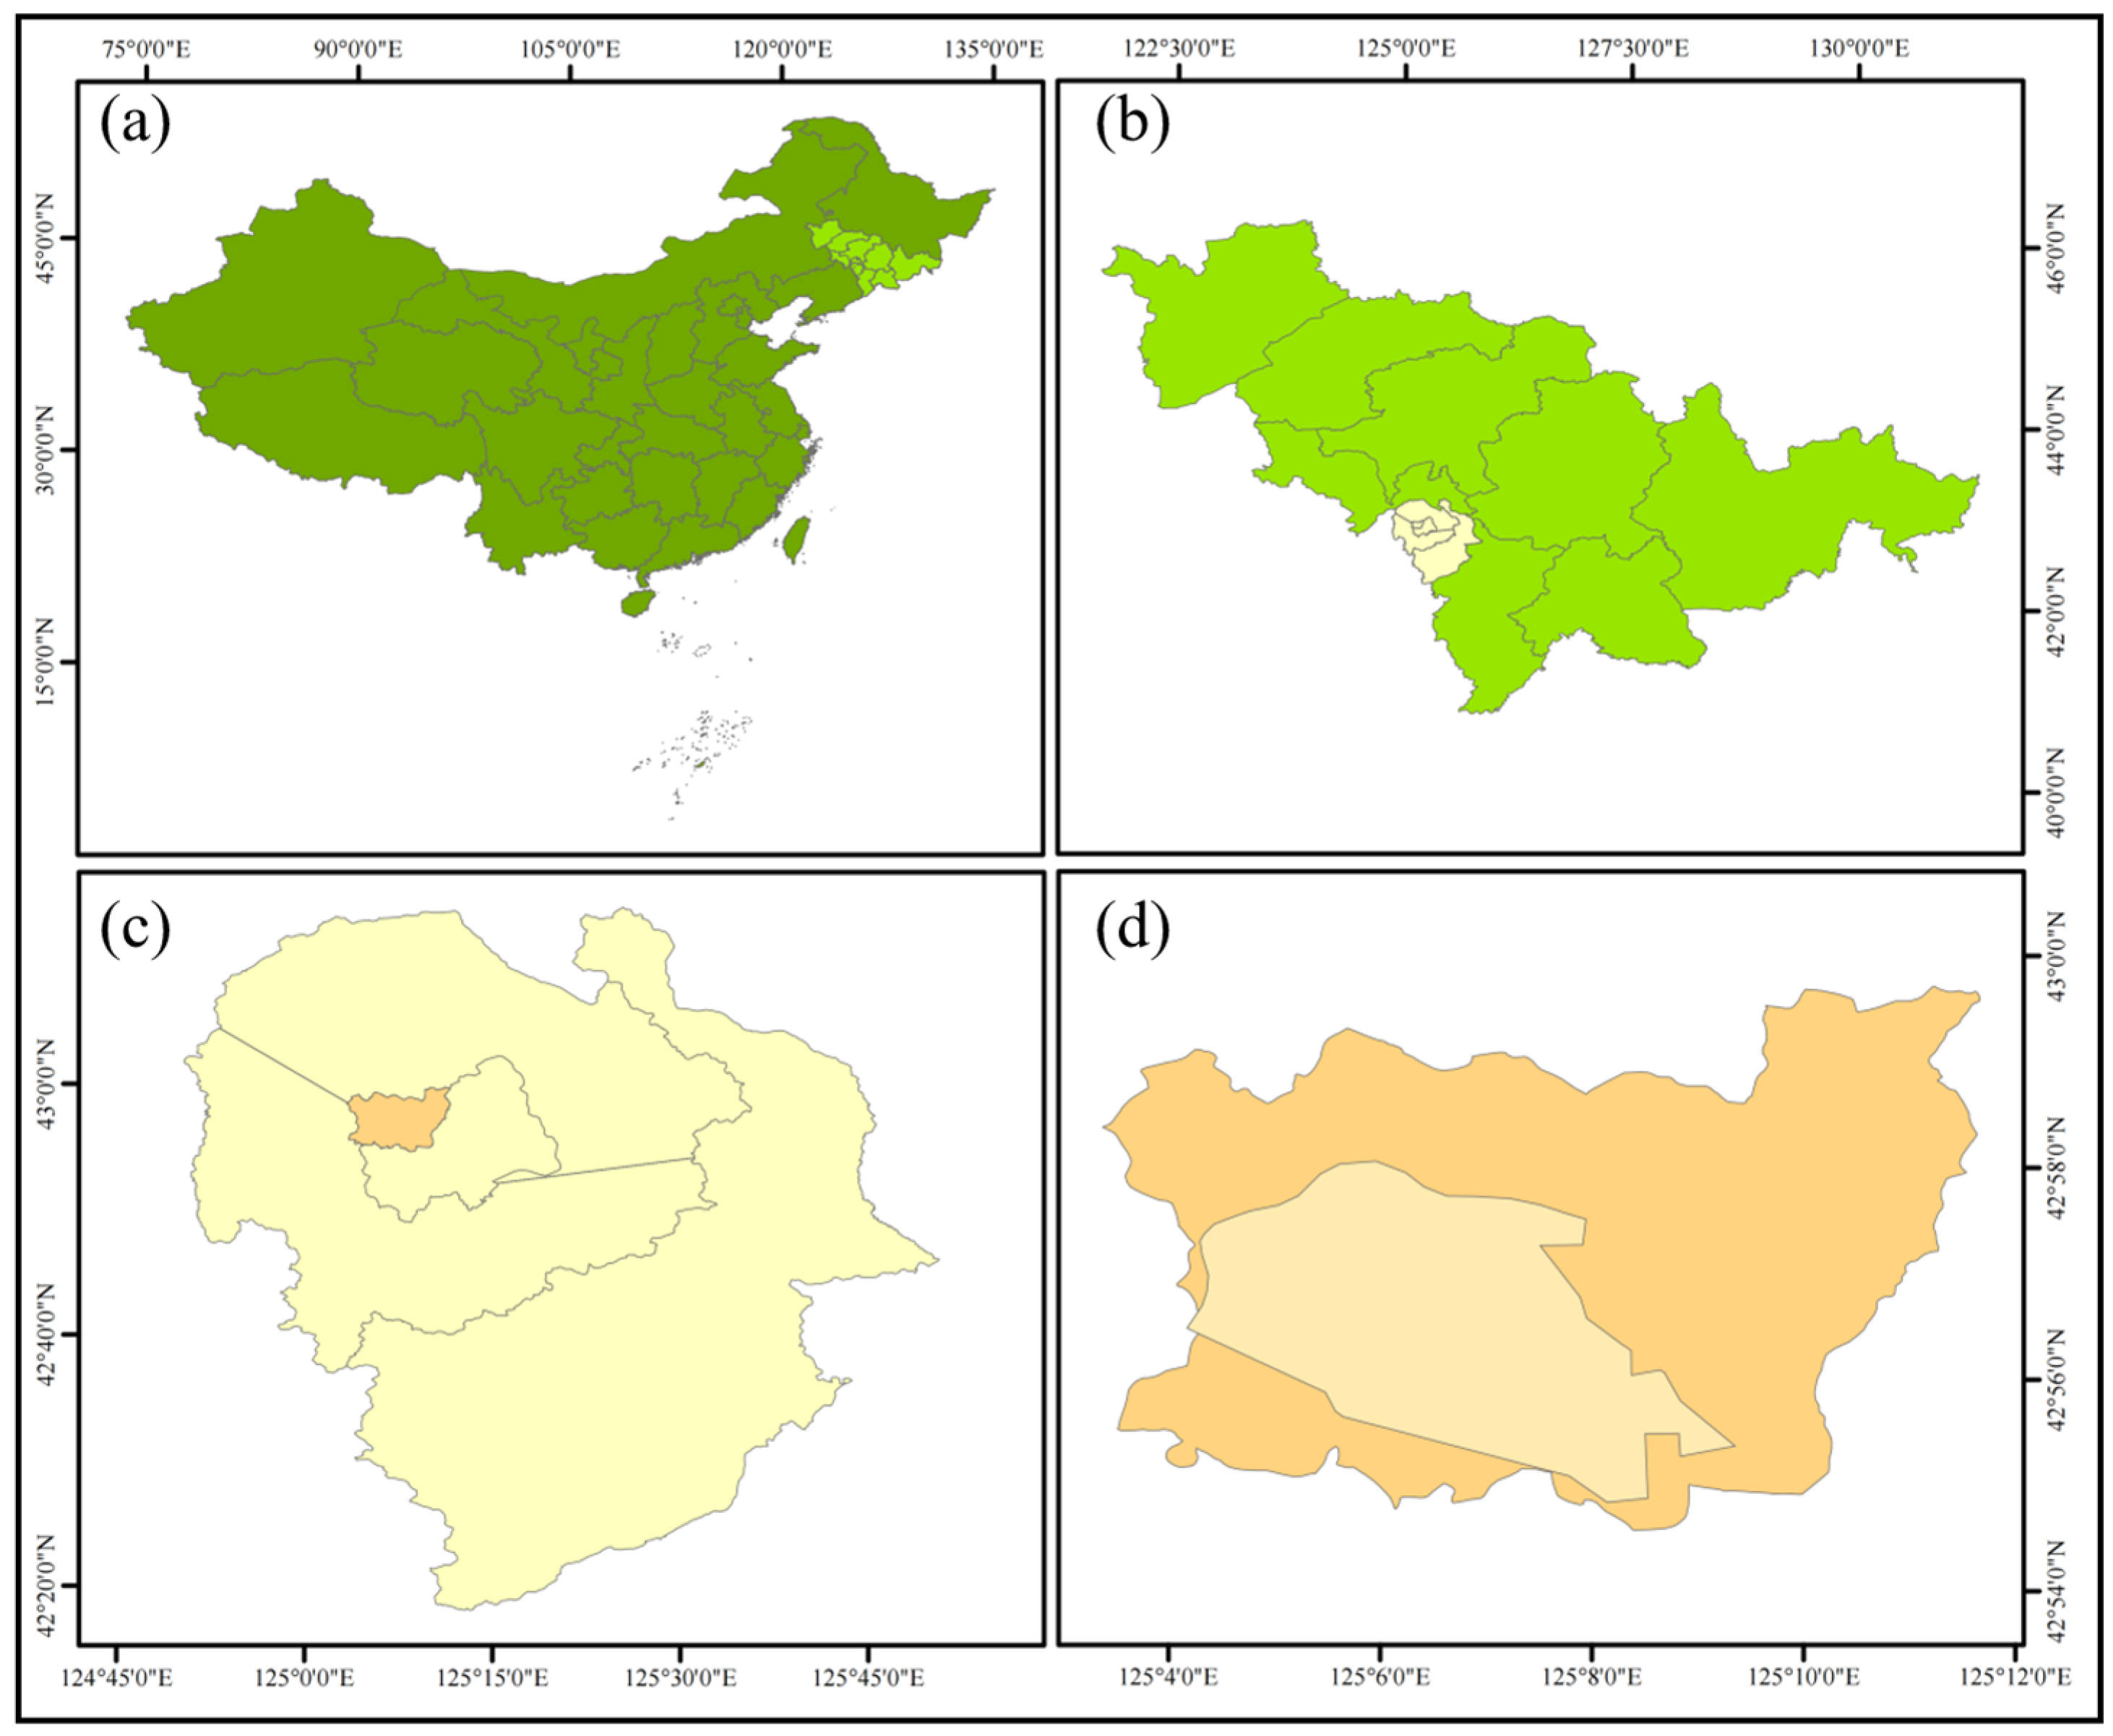
The study area is located in Xi’an District, northwest of Liaoyuan City, Jilin Province, China, as shown in Figure 1. The study area has a continental semi-humid monsoon climate, with temperatures ranging from −41.1 °C to 36 °C. The annual average temperature is 5.2 °C. The annual average precipitation is 662.2 mm, with most of the precipitation concentrated in the summer. Summer rainfall accounts for 80% of the annual rainfall. The freezing period lasts from November to March each year, with a maximum annual frost depth of 1.6 m. After soil thawing in spring, soil moisture content increases, porosity expands, and bearing capacity decreases. Repeated freeze–thaw cycles cause rock and soil layers to become loosely structured, reducing shear strength and increasing the likelihood of collapse under mining disturbances.
Figure 1.
Location map of the study area: (a) administrative map of China; (b) administrative map of Jilin Province; (c) administrative map of Liaoyuan City; (d) administrative map of Xi’an District.
The overall topography of the study area exhibits a north-high, south-low distribution, with the highest elevation in the north reaching 430.33 m. The southern region has a maximum elevation of 316.3 m, while the central area has a minimum elevation of 261.2 m, with a maximum relative elevation difference of 169.13 m, resulting in distinct topographic variations. The area can be divided into three geomorphological units: tectonic erosion low mountain region, erosion–weathering hilly region, and erosion–deposition intermontane valley region.
- Structural erosion low mountain area: Located in the northern part of the study area. Elevation ranges from 420 m to 300 m, with a relative elevation difference of approximately 120 m. Prominent peaks include Laodao Mountain and Ximangling Mountain. The area is primarily composed of basalt and gneiss, with steep surface slopes generally ranging from 15° to 30°. The soil cover is thin, with extensive bedrock exposure.
- Erosion and weathering hilly area: Distributed on both sides of the study area. Primarily composed of sandstone, shale, and granite, with an elevation ranging from 356 m to 264 m, a relative elevation difference of approximately 92 m, and a ground slope of 7° to 15°. The hilly terrain has undulating surfaces, with rounded hilltops and broad, flat valleys between the hills.
- Intermontane valley erosion and deposition zone: This zone is distributed in a belt-like pattern along the river valley, with an elevation ranging from 264 m to 252 m and a relative elevation difference of approximately 12 m. It is primarily composed of alluvial deposits, consisting of terraces and floodplains. The floodplains are composed of gravel and slope toward the riverbed, with a ground slope of 1° to 2°.
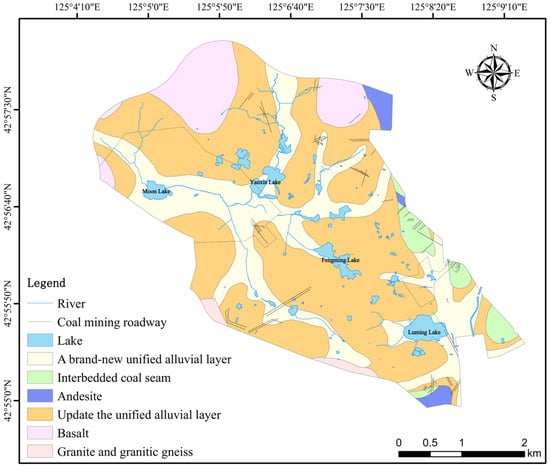
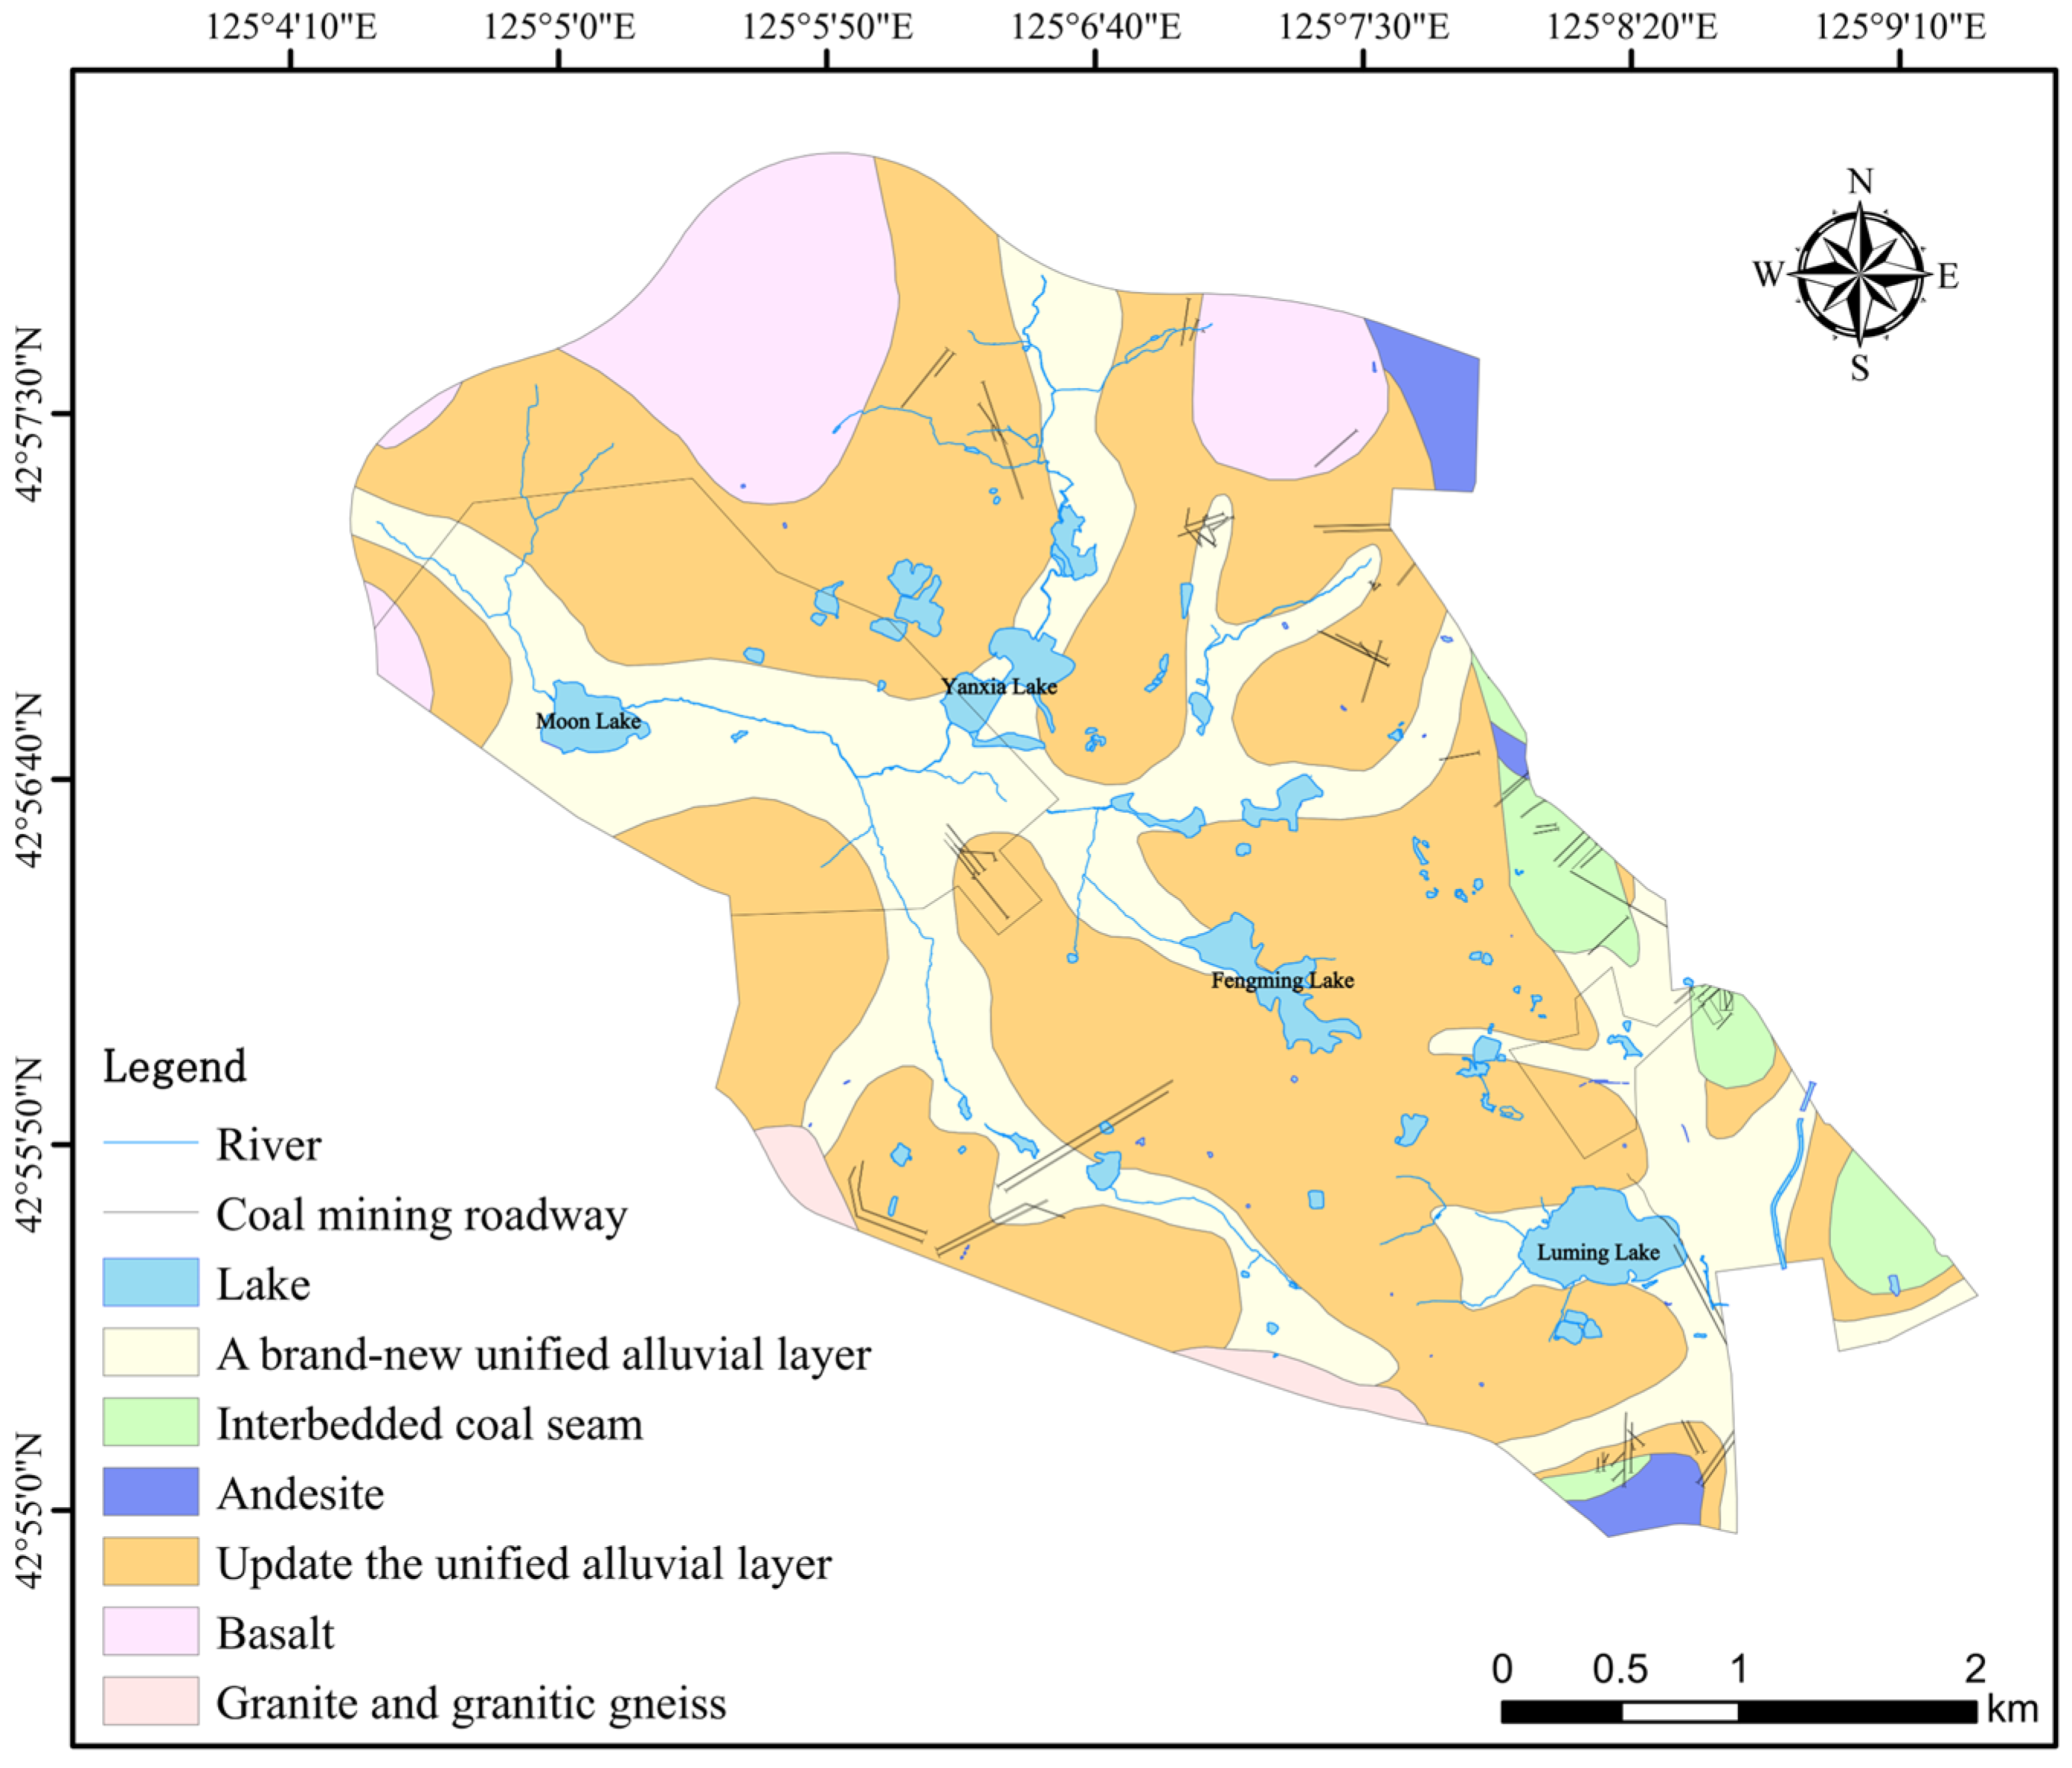
The surface of the Northern New District of Liaoyuan is primarily covered by Holocene and Pleistocene alluvial deposits. The Pleistocene alluvial layer consists of river-sedimentary deposits formed during the early Quaternary period. Due to its older age, it has undergone longer geological processes, resulting in higher density, better consolidation, and relatively stable engineering properties. The Holocene alluvial deposits represent the most recent strata formed by river sedimentation over the past 10,000 years (or even in modern times). Typically located at or near the surface, they exhibit loose structure, high porosity, potentially high water content, poor consolidation, low mechanical strength, and high compressibility. The Pleistocene alluvial deposits are relatively dense, with deformation rates and total deformation significantly lower than those of the Holocene deposits. Due to their loose nature and high compressibility, Quaternary alluvial deposits can experience significant and rapid uniform or differential settlement. The loose, unconsolidated characteristics of these sediments make the area prone to surface deformation. Beneath them lie coal-bearing strata, constituting the primary mining targets. Beneath these formations lie older bedrock structures. The bedrock consists of volcanic layers (including andesite and basalt) and deeper granitic and granitic gneiss formations. Together, these rock layers form the stable geological framework of the area. Specific geological structures are illustrated in Figure 2. The data were sourced from the Liaoyuan Municipal Natural Resources Bureau.
Figure 2.
Geological map of the Northern New District, Liaoyuan.
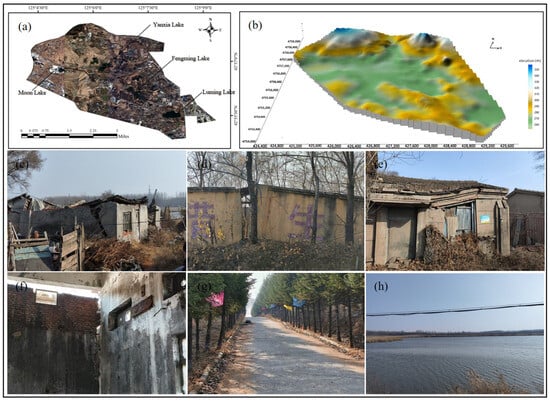
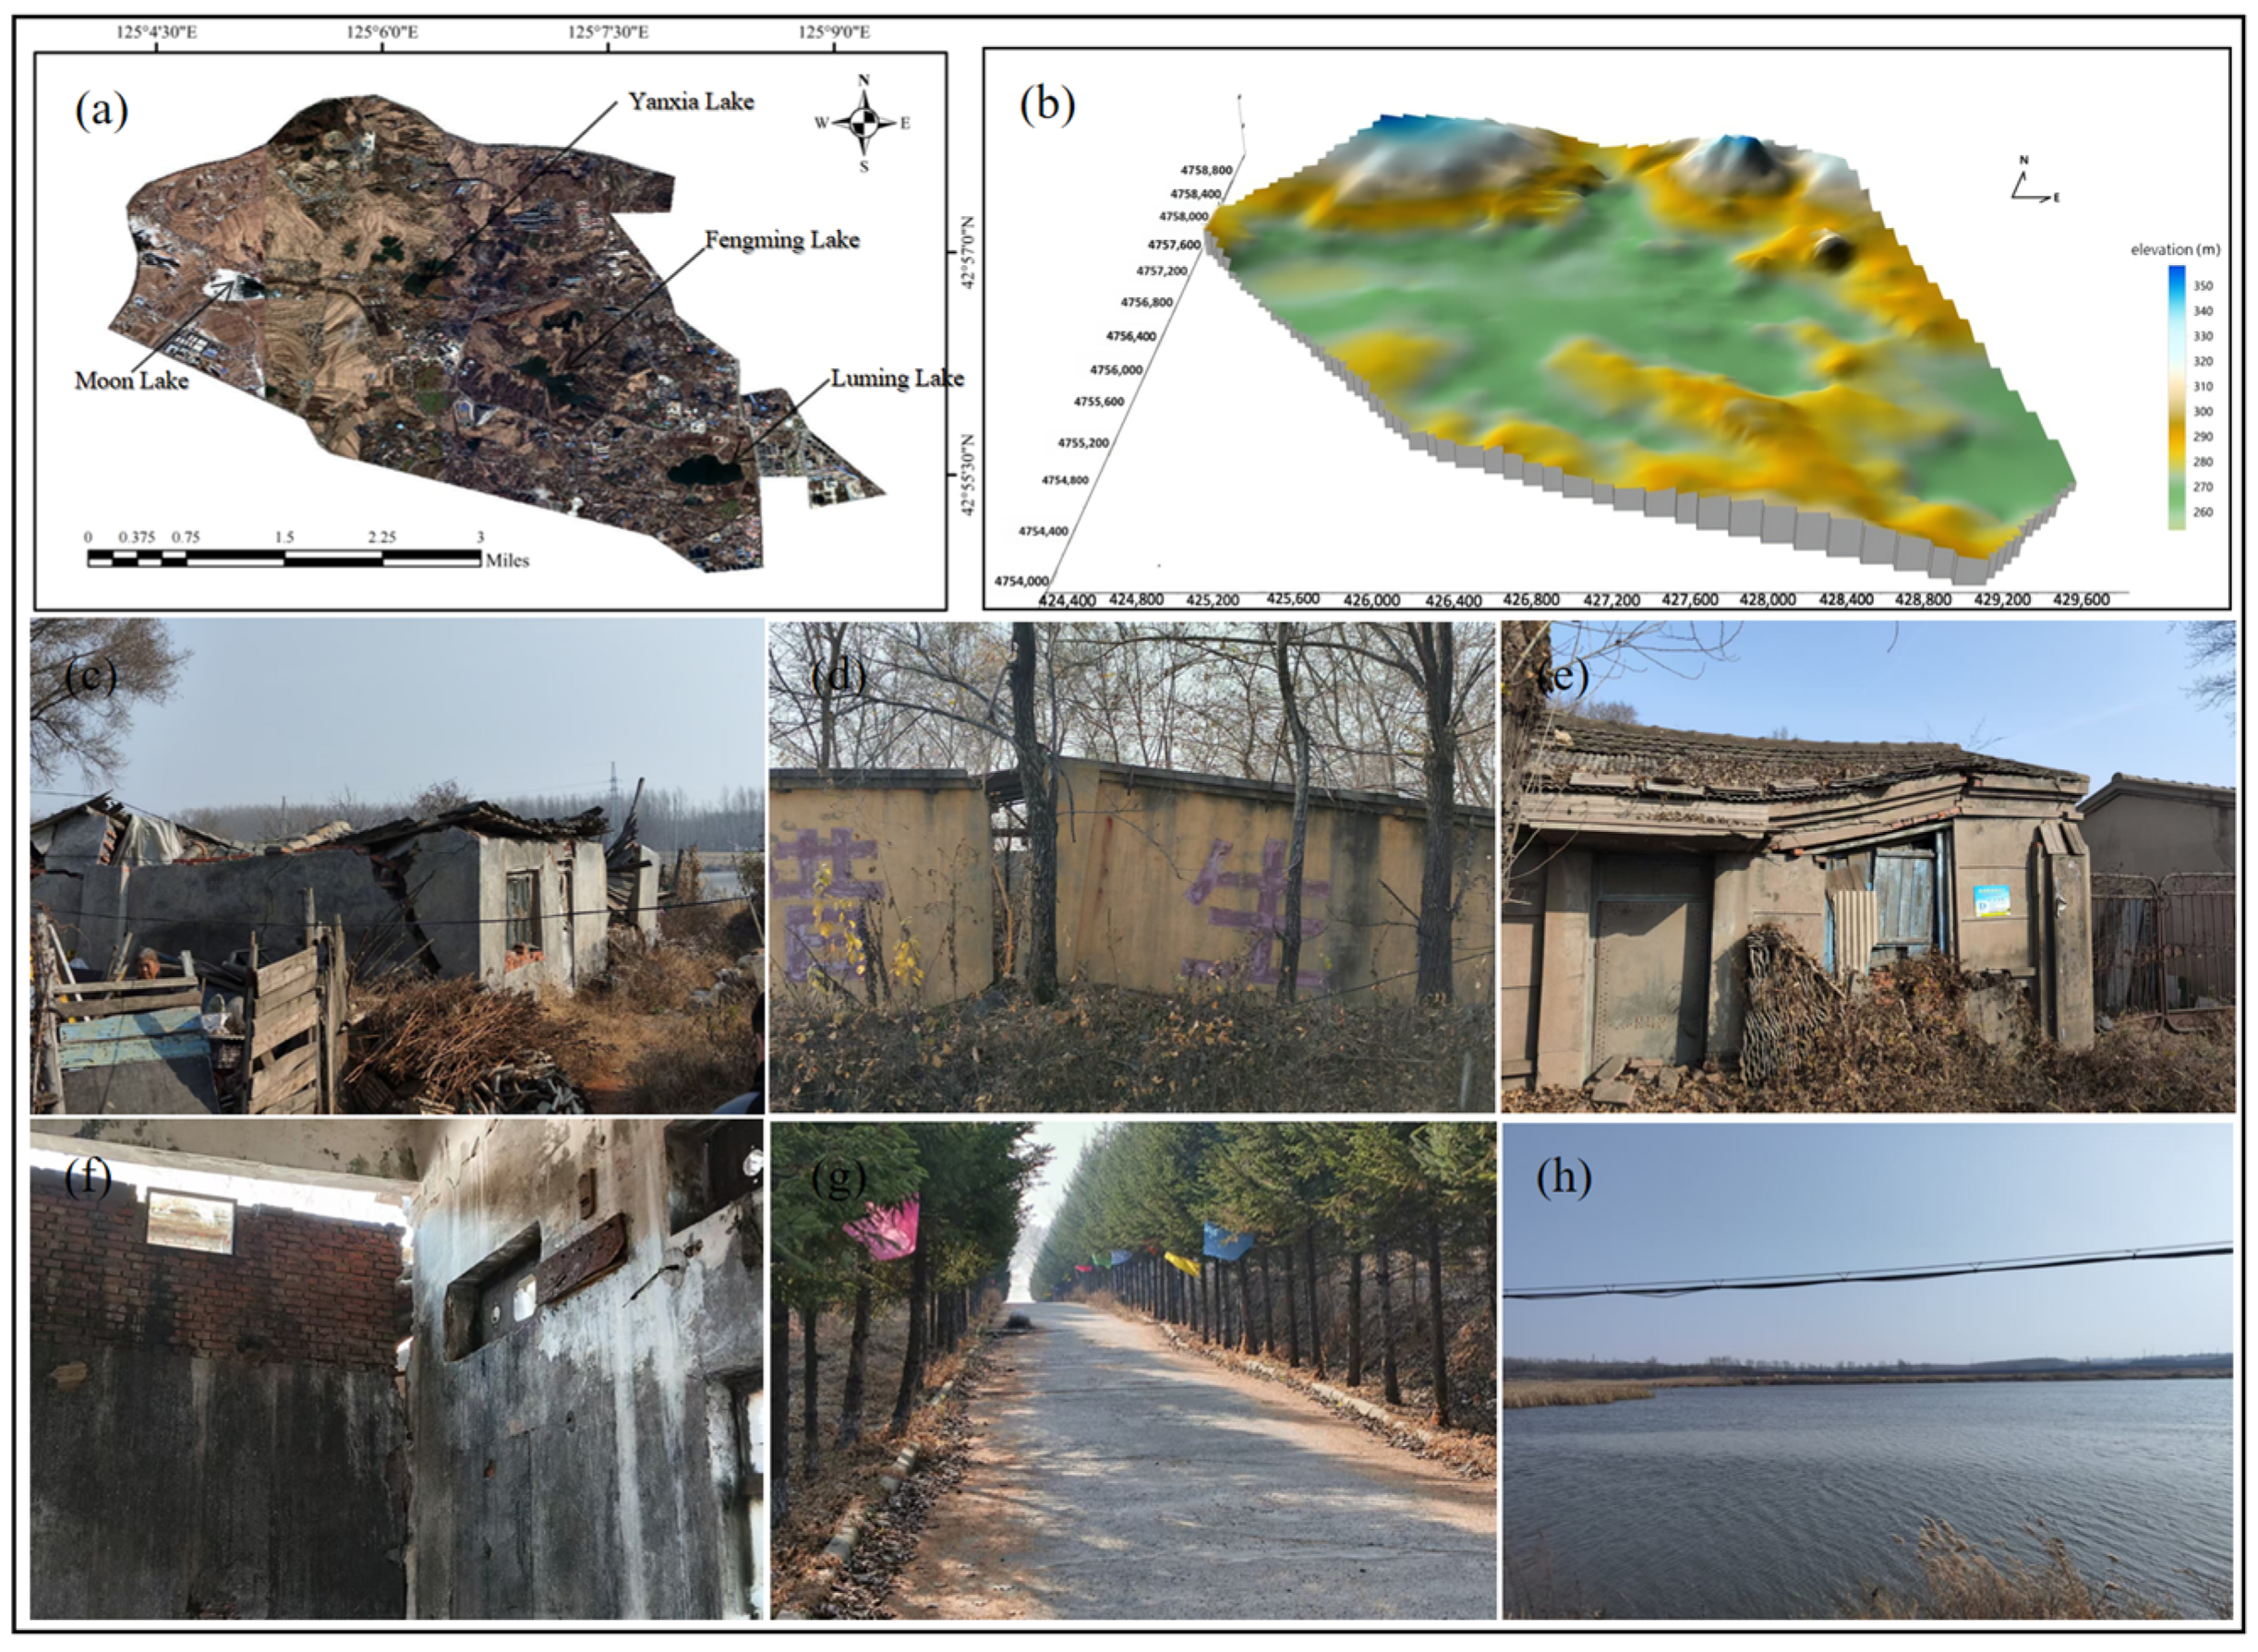
The mining area in the Northern New District of Liaoyuan City has a history of over a century of mining. Coal extraction has left a large number of complex historical issues. Coal mining has caused severe ground subsidence, with most of the ground showing overall sinking. The hazards caused by ground subsidence primarily manifest as noticeable cracks in buildings, which can lead to building tilting, deformation, water accumulation, and collapse in severe cases. Farmland has developed cracks of varying degrees, forming localized subsidence depressions, and roads have developed cracks. These issues pose a serious threat to the safety of local residents. Additionally, over seventy water bodies have formed due to subsidence in the region. Field investigations revealed that there are as many as 73 subsidence pits caused by coal mining, with total subsidence exceeding 10 m in some areas. Fengming Lake and Longming Lake are particularly prominent, causing severe economic losses to the local area. Currently, the Northern New District of Liaoyuan City still experiences varying degrees of surface deformation, posing a serious threat to the lives and property of local residents, as shown in Figure 3. The terrain data in Figure 3b are derived from the SRTM Digital Elevation Model (DEM) with a resolution of 30 m and were plotted using Surfer 18 software. Therefore, through timely monitoring and prediction, the impact of deformation can be effectively assessed and appropriate measures taken to ensure the safety of residents.
Figure 3.
(a) Northern New District of Liaoyuan City; (b) Schematic map of topography and landforms; (c–f) Collapsed buildings and cracks caused by ground subsidence; (g) Road cracks resulting from differential settlement; (h) Lake formed by water accumulation in a sinkhole.
2.2. Data
This study selected 79 Sentinel-1A satellite remote sensing image datasets from 19 August 2022 to 12 March 2025. Sentinel-1A uses C-band synthetic aperture radar (SAR) data, with a satellite overpass cycle of 12 days per pass. The data type is SLC, the flight direction is a descending orbit, the beam mode is IW, and the polarization mode is VV. The C-band image data from Sentinel-1A are freely available from the USGS, offering excellent penetration capability and stability. Additionally, SAR data feature high spatiotemporal resolution, enabling the capture of subtle deformation information on the ground surface, thereby meeting the continuous monitoring requirements for slow subsidence in this study. Furthermore, the image data processing tools and algorithms are well-established, making it an ideal choice for SBAS-InSAR subsidence monitoring.
Elevation data use SRTM 1, high-resolution digital elevation model data jointly measured by the National Aeronautics and Space Administration (NASA) and the National Imagery and Mapping Agency (NIMA) of the Department of Defense. It is primarily applied in the terrain phase removal and geocoding stages of SBAS-InSAR. In water bodies and snow-covered areas, SRTM data often exhibit smoothing effects due to interpolation. High-error regions can be corrected by using the accompanying SRTM mask data to mark the interpolated areas.
3. Mine Subsidence Monitoring Based on SBAS-InSAR Technology
3.1. SBAS-InSAR
The SBAS-InSAR method was selected for mine subsidence monitoring in this study owing to its considerable advantages, including high spatial and temporal resolution, multi-temporal monitoring capability, large spatial coverage, adaptability, and cost-effectiveness. This technique employs baseline and coherence thresholds to exclude low-quality interferometric pairs, thereby ensuring the effective utilization of the remaining pairs for analysis. Furthermore, it incorporates local adaptive alignment to mitigate registration errors, and systematic phase errors are ultimately eliminated through residual correction following phase unwrapping.
The SBAS-InSAR technique is a time-series analysis method first proposed by Berardino et al. in 2002 [9]. It operates by pairing all acquired SAR images according to specific spatial and temporal baseline thresholds, forming multiple small-baseline subsets. For each subset, the least squares method is applied to compute a time series of surface deformation. Subsequently, the mean deformation rate and cumulative displacement for each time period are jointly resolved using the singular value decomposition (SVD) method [33].
Assuming that N + 1 SAR images from the same orbit are acquired over the study area between times t0 and tn, following the principles of interferogram generation, multiple interferometric pairs are formed by co-registering all auxiliary images to a common master image. Differential interferometry is then performed on each pair, generating M differential interferograms. It is critical to note that these M interferograms must satisfy the following conditions:
For SAR images acquired at moments tm and tn (tm > tn), differential interferometry is performed to generate the sth (s = 1, 2, …, M) differential interferograms at any particular point in the image, whose interferometric phase can be expressed as:
where λ represents the wavelength of the relevant band, and φm and φn denote the accumulated deformation in the line-of-sight (LOS) direction at moments tm and tn, respectively. ∆ denotes the phase error due to atmospheric delay, ∆ denotes the phase error due to topography, and ∆ denotes the phase error due to noise.
3.2. Surface Subsidence Monitoring in Mining Areas with SBAS-InSAR Technology
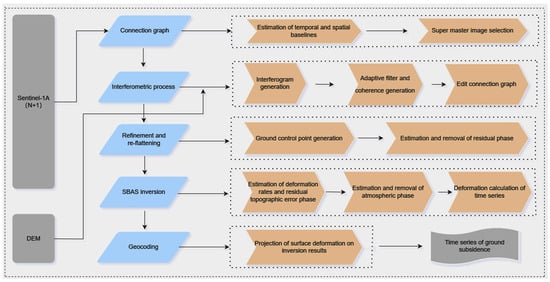
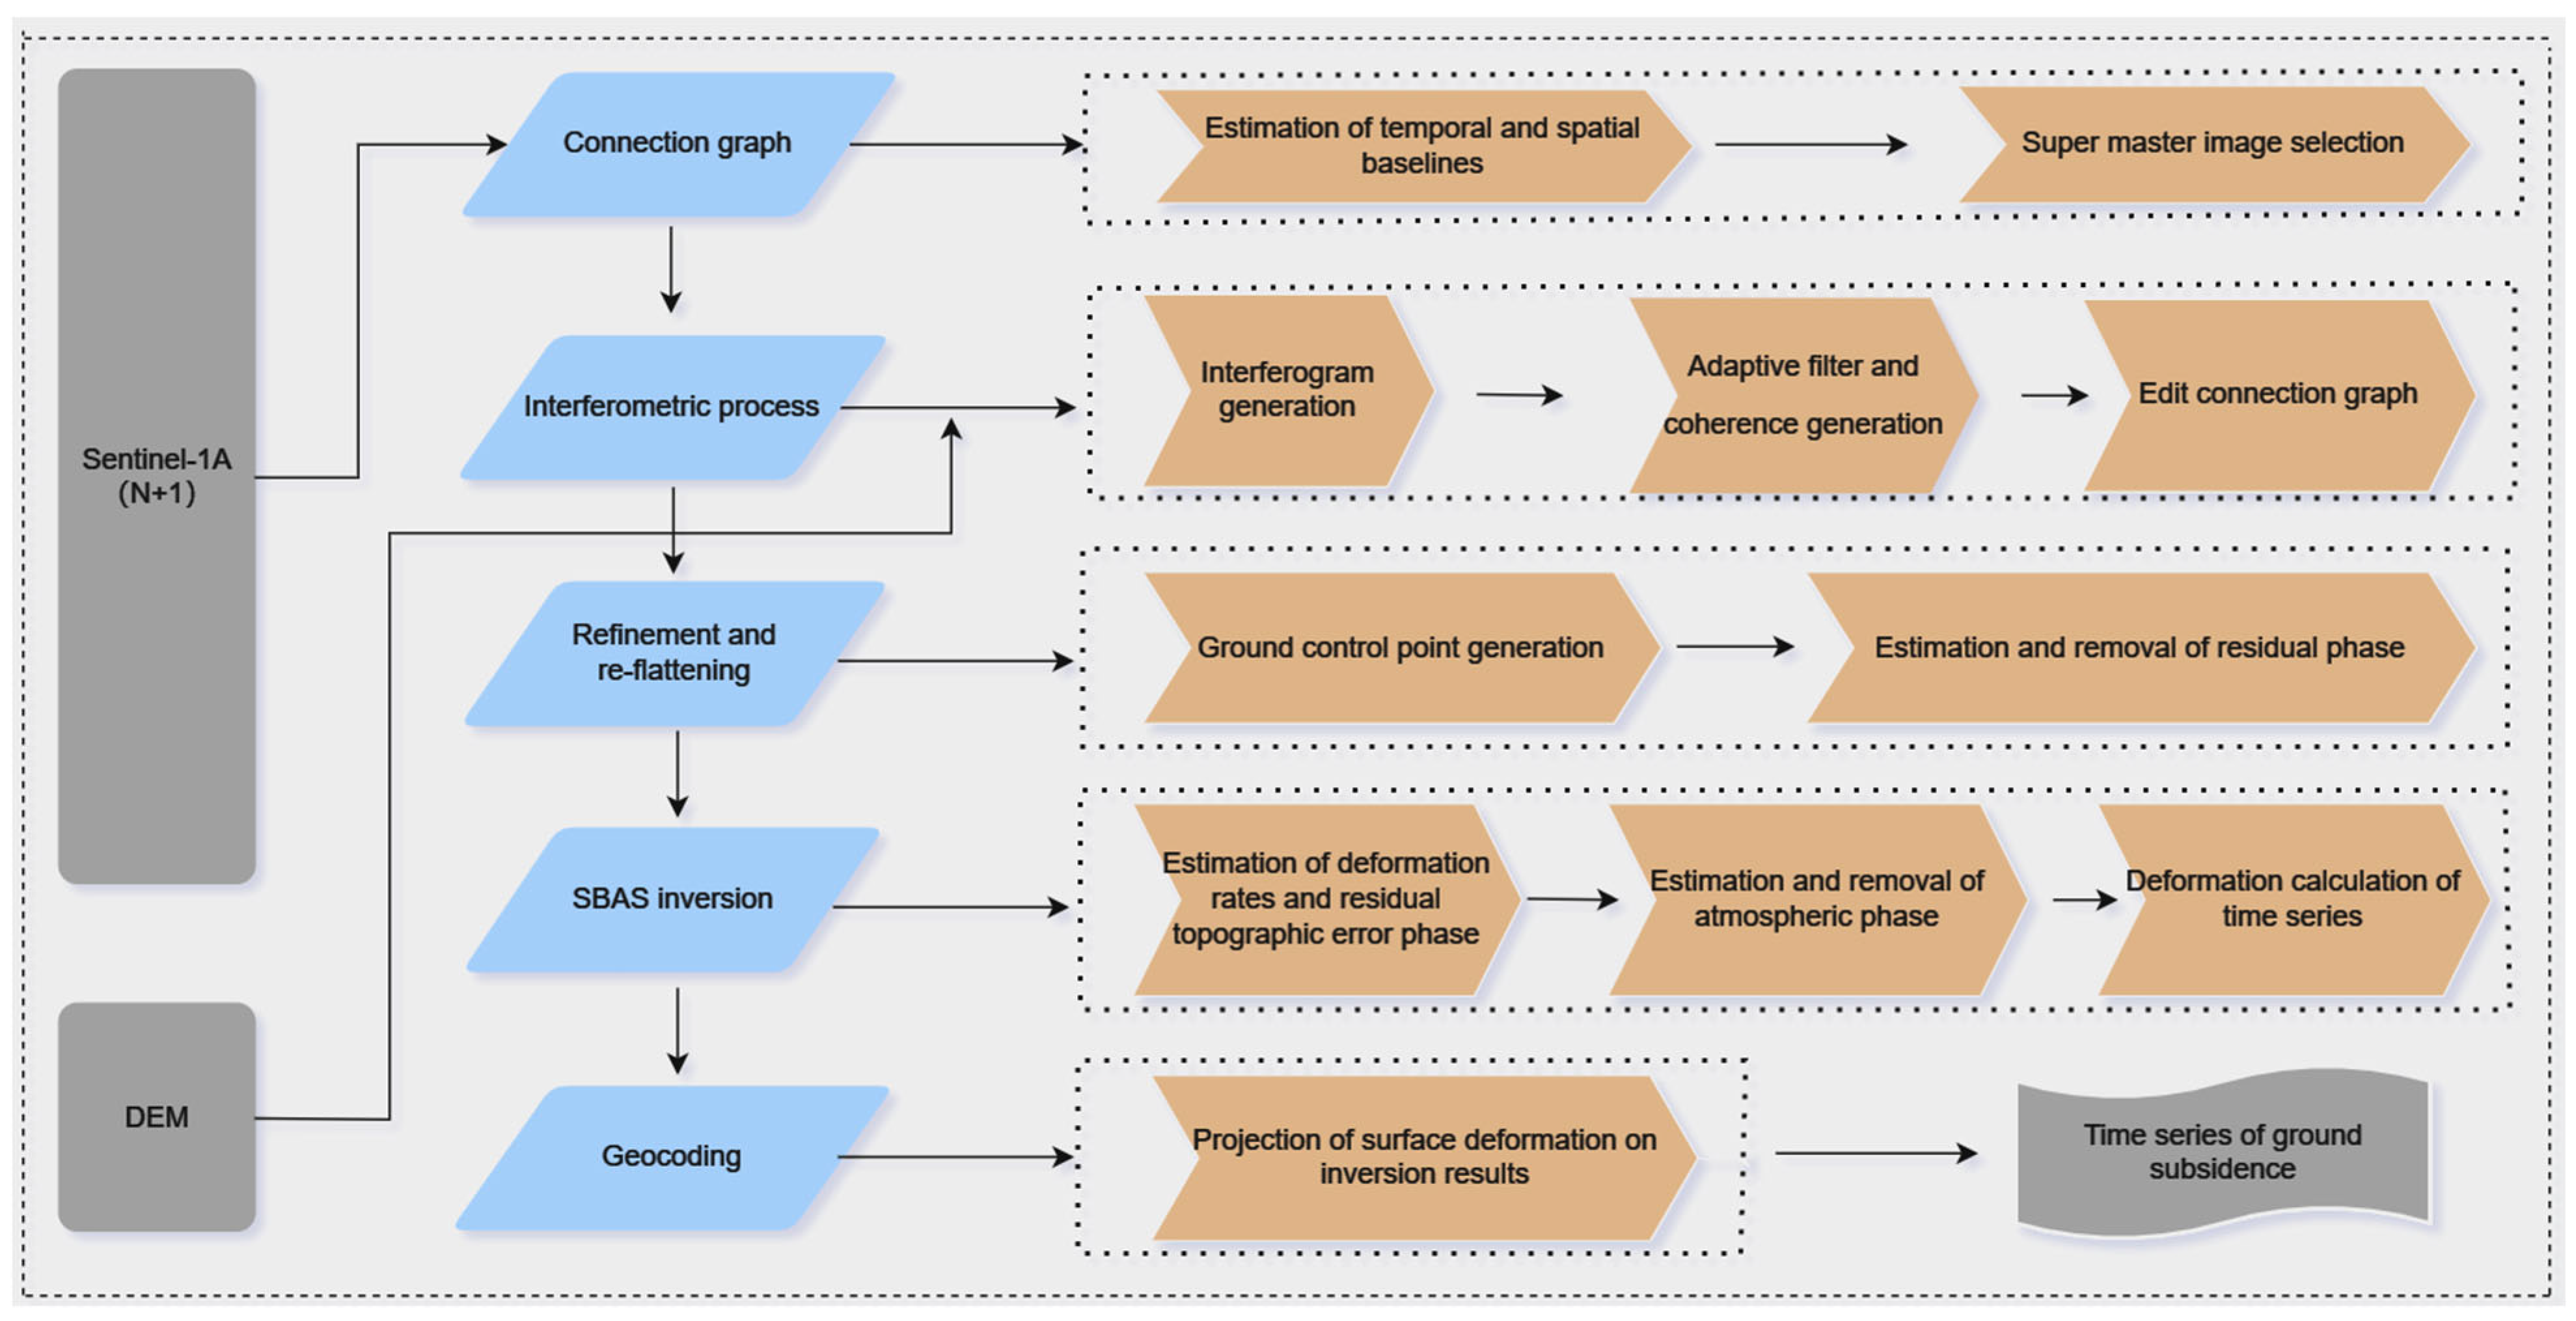
In this article, the data were processed by SBAS-InSAR using SARscape under ENVI 5.4 software, and the cumulative settlement results were analyzed using ArcGIS 10.8. Figure 4 shows the processing of the SBAS-InSAR technique in the ENVI 5.3 software. The software parameter settings are shown in Table 1 below.
Figure 4.
Flowchart of SBAS-InSAR technology.
Table 1.
SBAS-InSAR processing parameters.
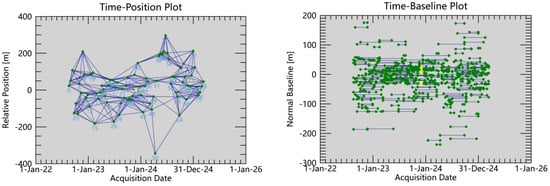
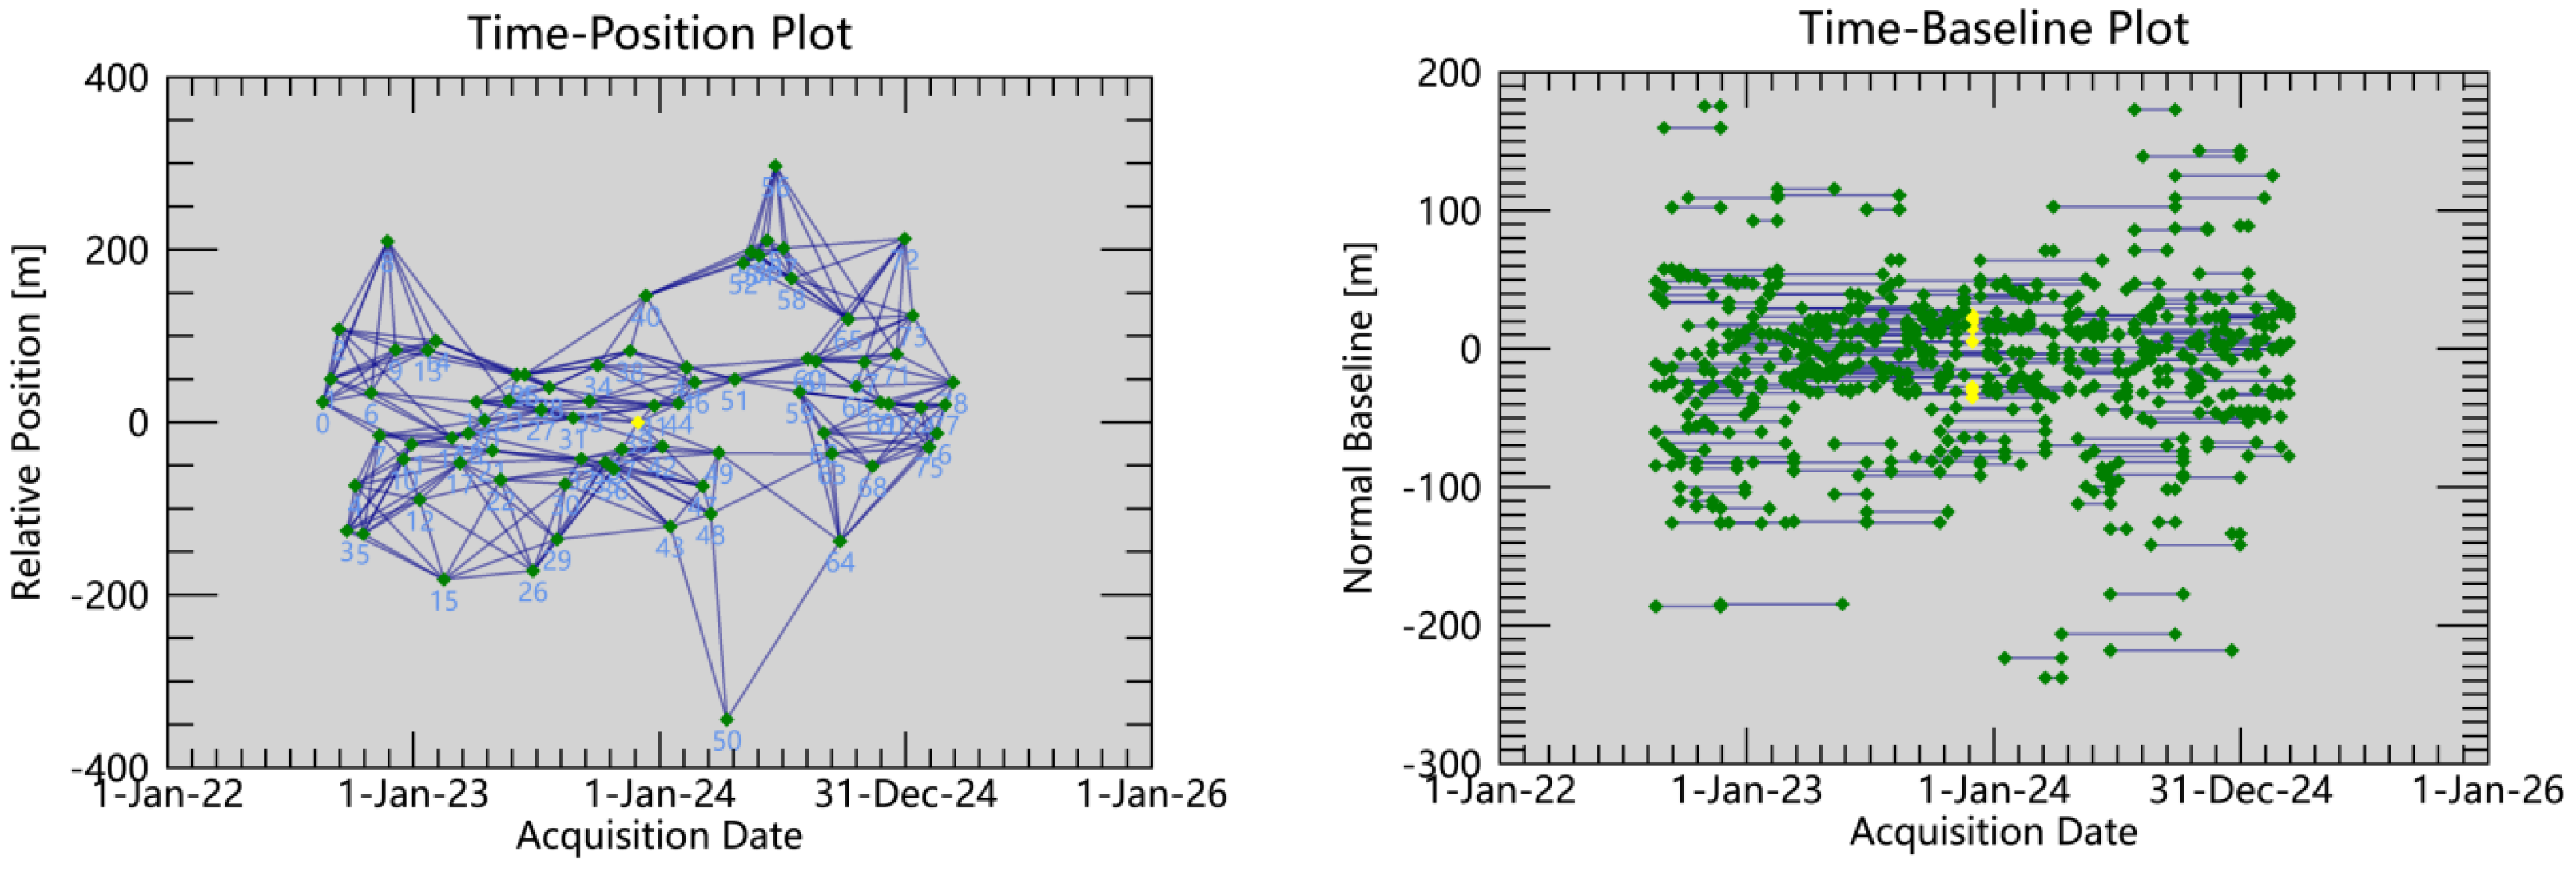
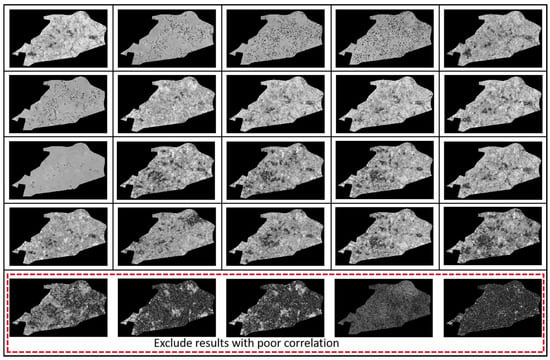
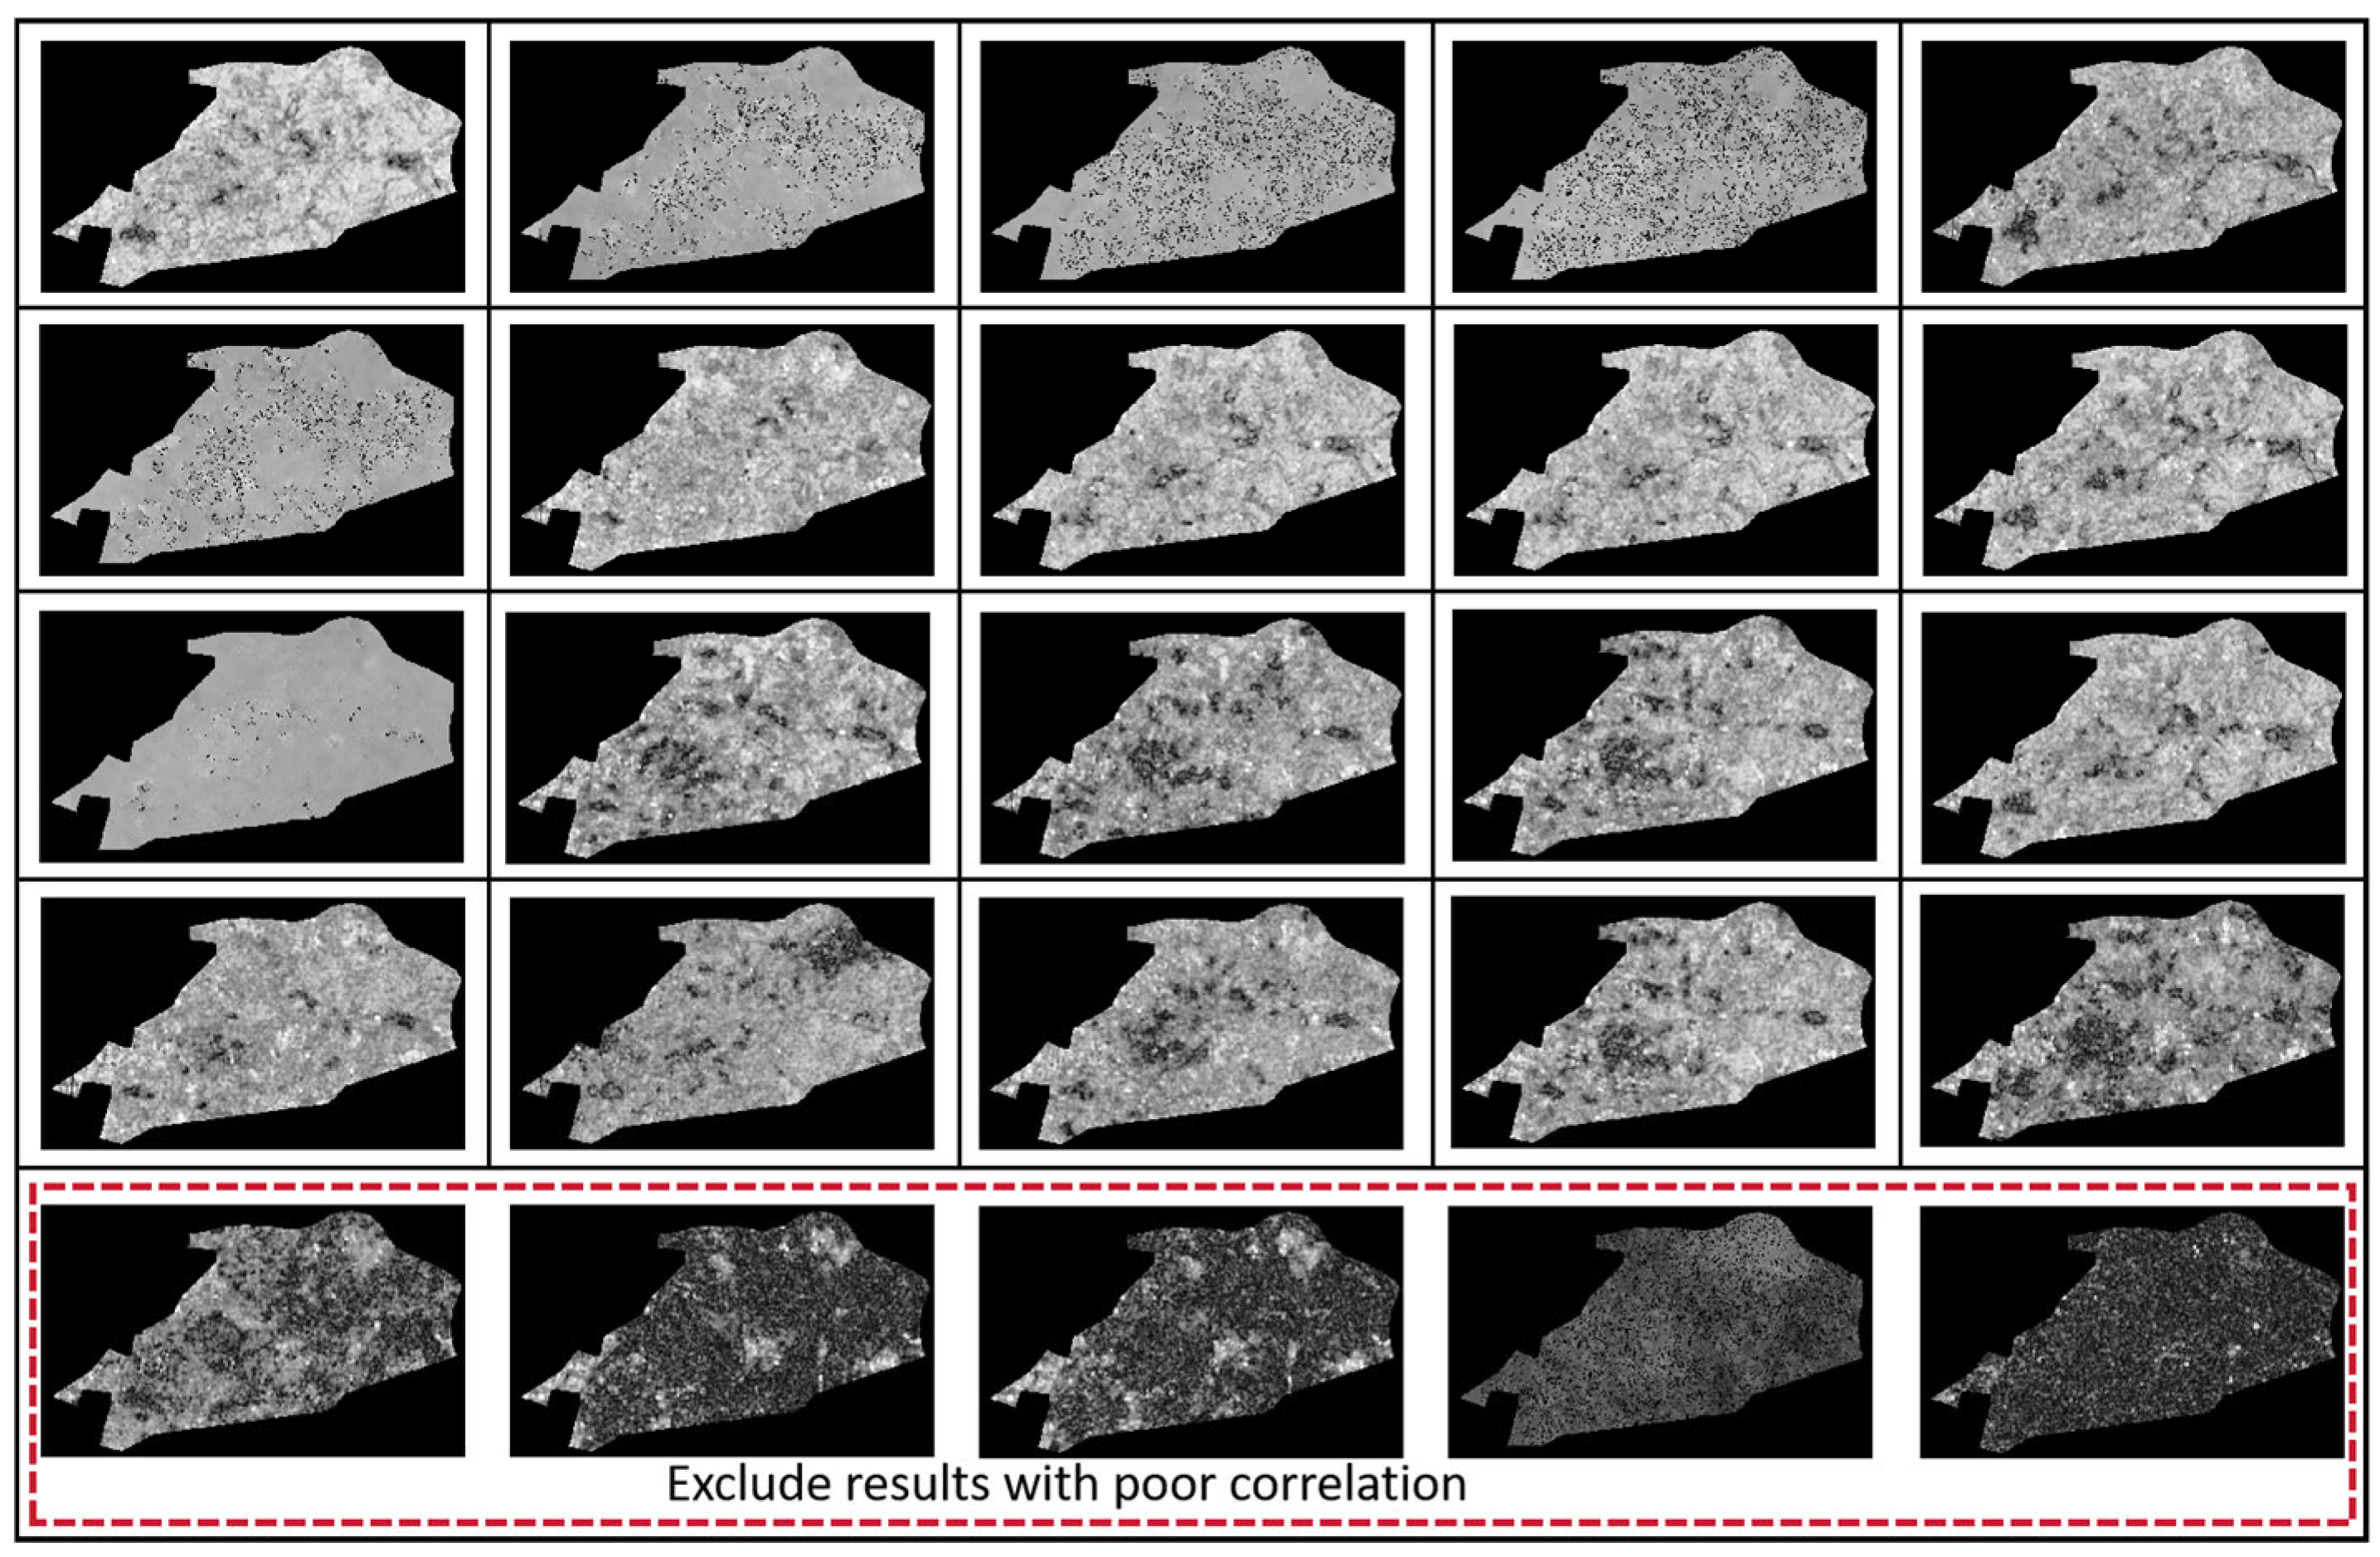
First, an interferometric network (connection map) was generated, and the spatial and temporal baseline thresholds were defined in accordance with the small baseline principle (Figure 5). A master image (acquired on 30 November 2023) was selected from the SAR dataset, and all other (slave) images were co-registered to it. Subsequently, the topographic phase component was removed using external SRTM digital elevation model (DEM) data. Next, Goldstein filtering was applied to reduce phase noise, and coherence maps were generated for each interferometric pair. Phase unwrapping was then performed using the Minimum Cost Flow (MCF) method. Subsequent inversion set the coherence threshold to 0.3. After filtering out low-coherence interferograms based on this threshold, poor-quality coherence maps were manually selected through SBAS processing connection graph editing. The connection graphs generated by these two images were removed, and coherence maps with phase islands and numerous holes were recommended for deletion (Figure 6). Ultimately, 245 high-quality datasets were retained for temporal analysis. Ground control points (GCPs) were selected to estimate and remove phase contributions from orbital inaccuracies and residual topographic effects. The time-series phase data were then processed using singular value decomposition (SVD) to separate the primary deformation signal from noise, estimate the linear deformation rate and elevation errors, and mitigate atmospheric phase delays through filtering. Finally, to derive the vertical surface deformation, the inverted deformation results were geographically projected and geocoded, as formulated in Equation (3).
where dv is the vertical deformation result, dLOS is the deformation result in the line-of-sight direction, and θ is the radar incidence angle.
Figure 5.
Spatial and temporal baseline distribution.
Figure 6.
Partial correlation results plot.
In the study area, a post-mining subsidence stabilization zone, surface settlement is characterized by slow and uniform vertical movement. Consequently, the horizontal displacement component is negligible compared to the dominant vertical subsidence. Topographic phase errors were further mitigated using a 30 m resolution SRTM digital elevation model (DEM). The SBAS-InSAR methodology inherently aids in separating time-random atmospheric signals from time-persistent deformation signals through the temporal analysis of a large stack of interferograms. Additionally, specific filtering techniques were applied to reduce residual atmospheric noise. Despite the application of SBAS temporal processing and the aforementioned filters, residual atmospheric delays and topography-related phase errors may persist. This represents a common limitation in achieving millimeter-level accuracy in deformation monitoring.
The application of the small baseline principle enhances interferogram quality by constraining temporal and spatial baselines, which reduces spatial and temporal decorrelation. Goldstein filtering effectively suppresses phase noise, thereby improving the signal-to-noise ratio in the interferograms. The minimum cost flow (MCF) phase unwrapping method is robust in handling complex phase fields, minimizing phase jumps and unwrapping errors, which directly contributes to higher monitoring accuracy. Singular value decomposition (SVD) facilitates the separation of dominant deformation signals from noise, enabling the accurate estimation of deformation rates and elevation errors, thereby refining the time-series analysis. Temporal and spatial filtering methods are employed to mitigate atmospheric phase delays. The synergistic application of these methods significantly enhances the overall accuracy and reliability of ground deformation monitoring results.
3.3. Analysis of Monitoring Results
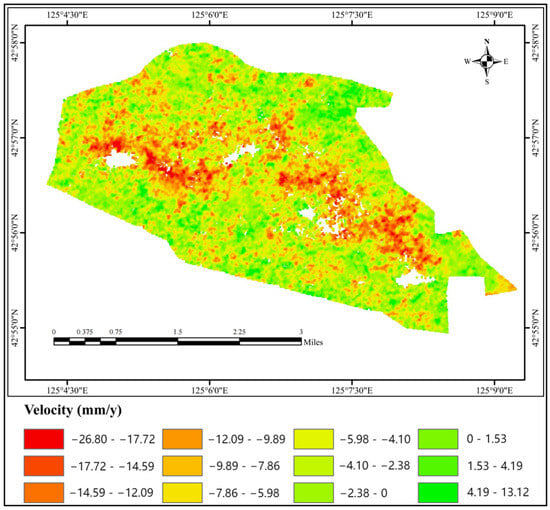
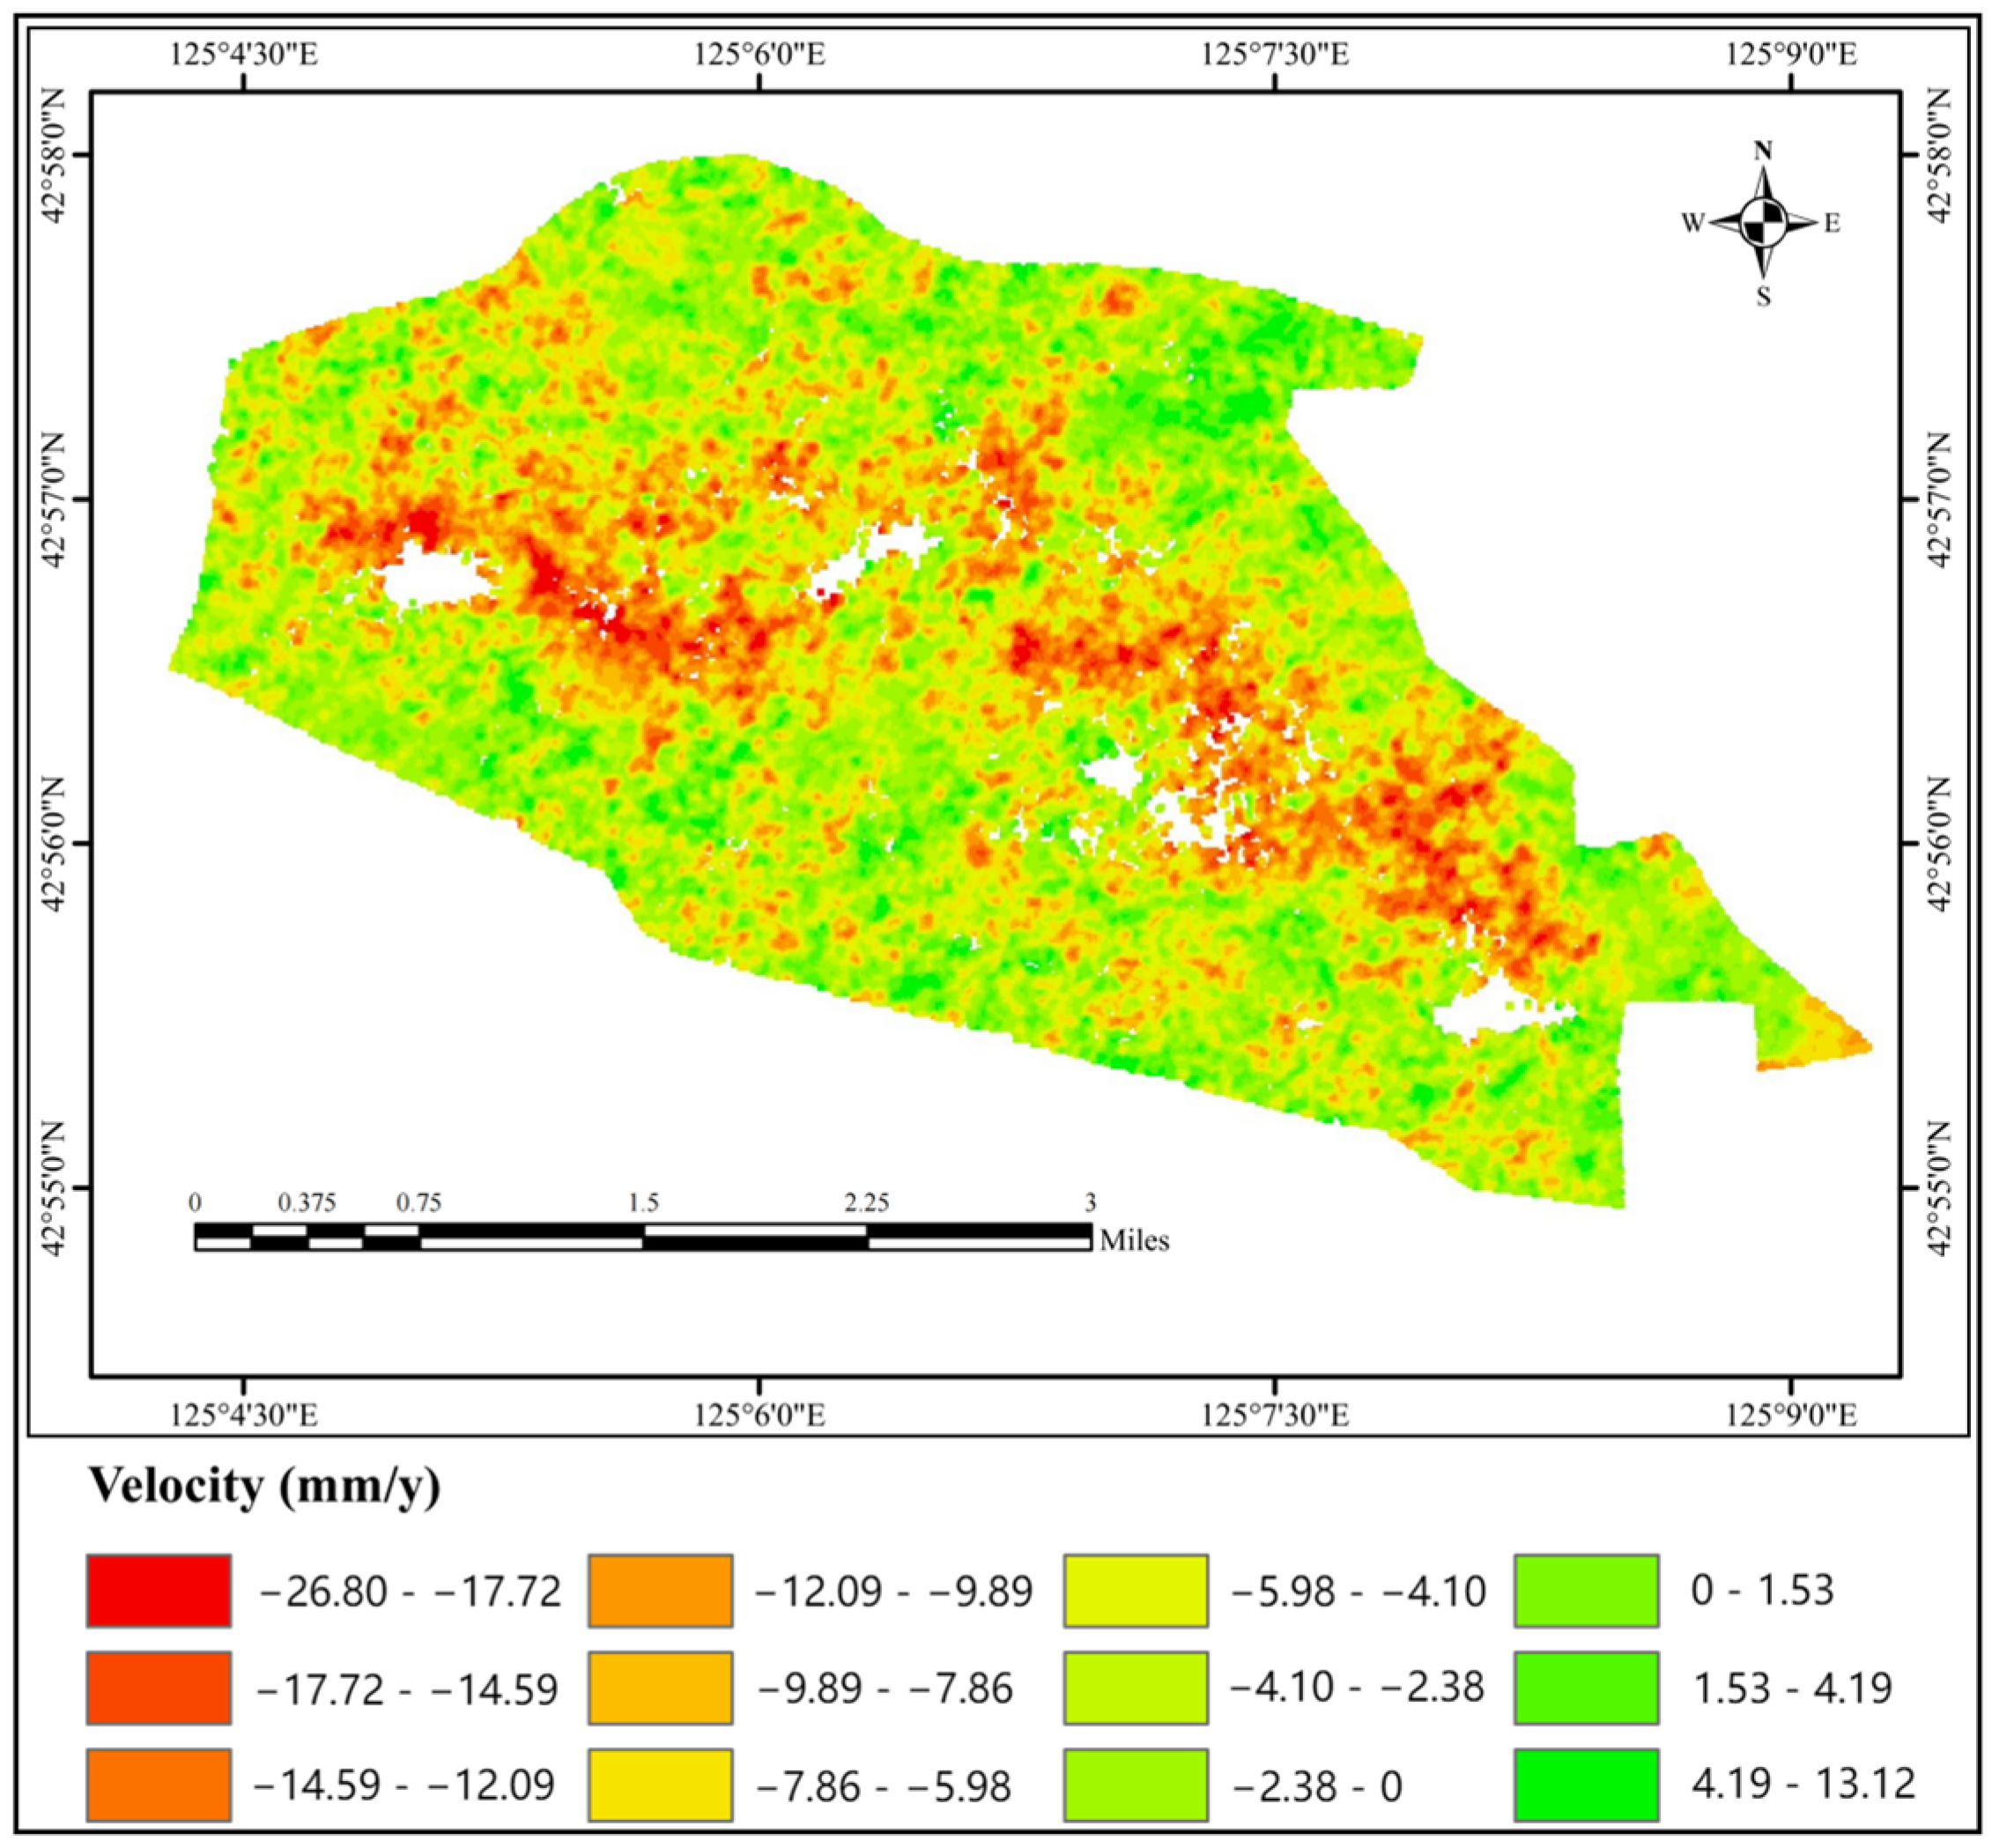
By applying SBAS-InSAR processing technology to Sentinel-1A data, we obtained the average deformation velocity map of the Northern New District of Liaoyuan from 19 August 2022 to 12 March 2025, as shown in Figure 7.
Figure 7.
Ground deformation rate map of the Northern New District of Liaoyuan.
The ground deformation rate map shows that the maximum subsidence rate in the Northern New District of Liaoyuan City is 26.80 mm/y, while the maximum ground uplift rate is 13.12 mm/y. The highest subsidence rate was observed in the six districts of Xi’an (Region A), with a maximum subsidence rate of 25.56 mm/y over the two-and-a-half-year monitoring period. The maximum subsidence rates in Xi’an District 1 (Region B) and Delong Coal Mine (Region C) were also relatively high at 24.39 mm/y and 23.15 mm/y, respectively.
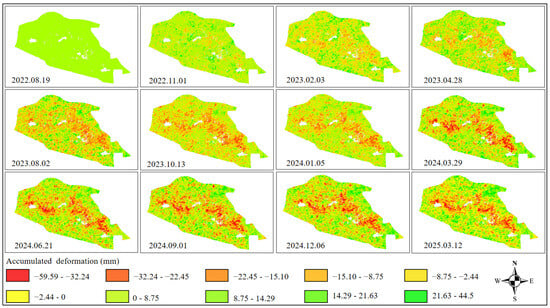
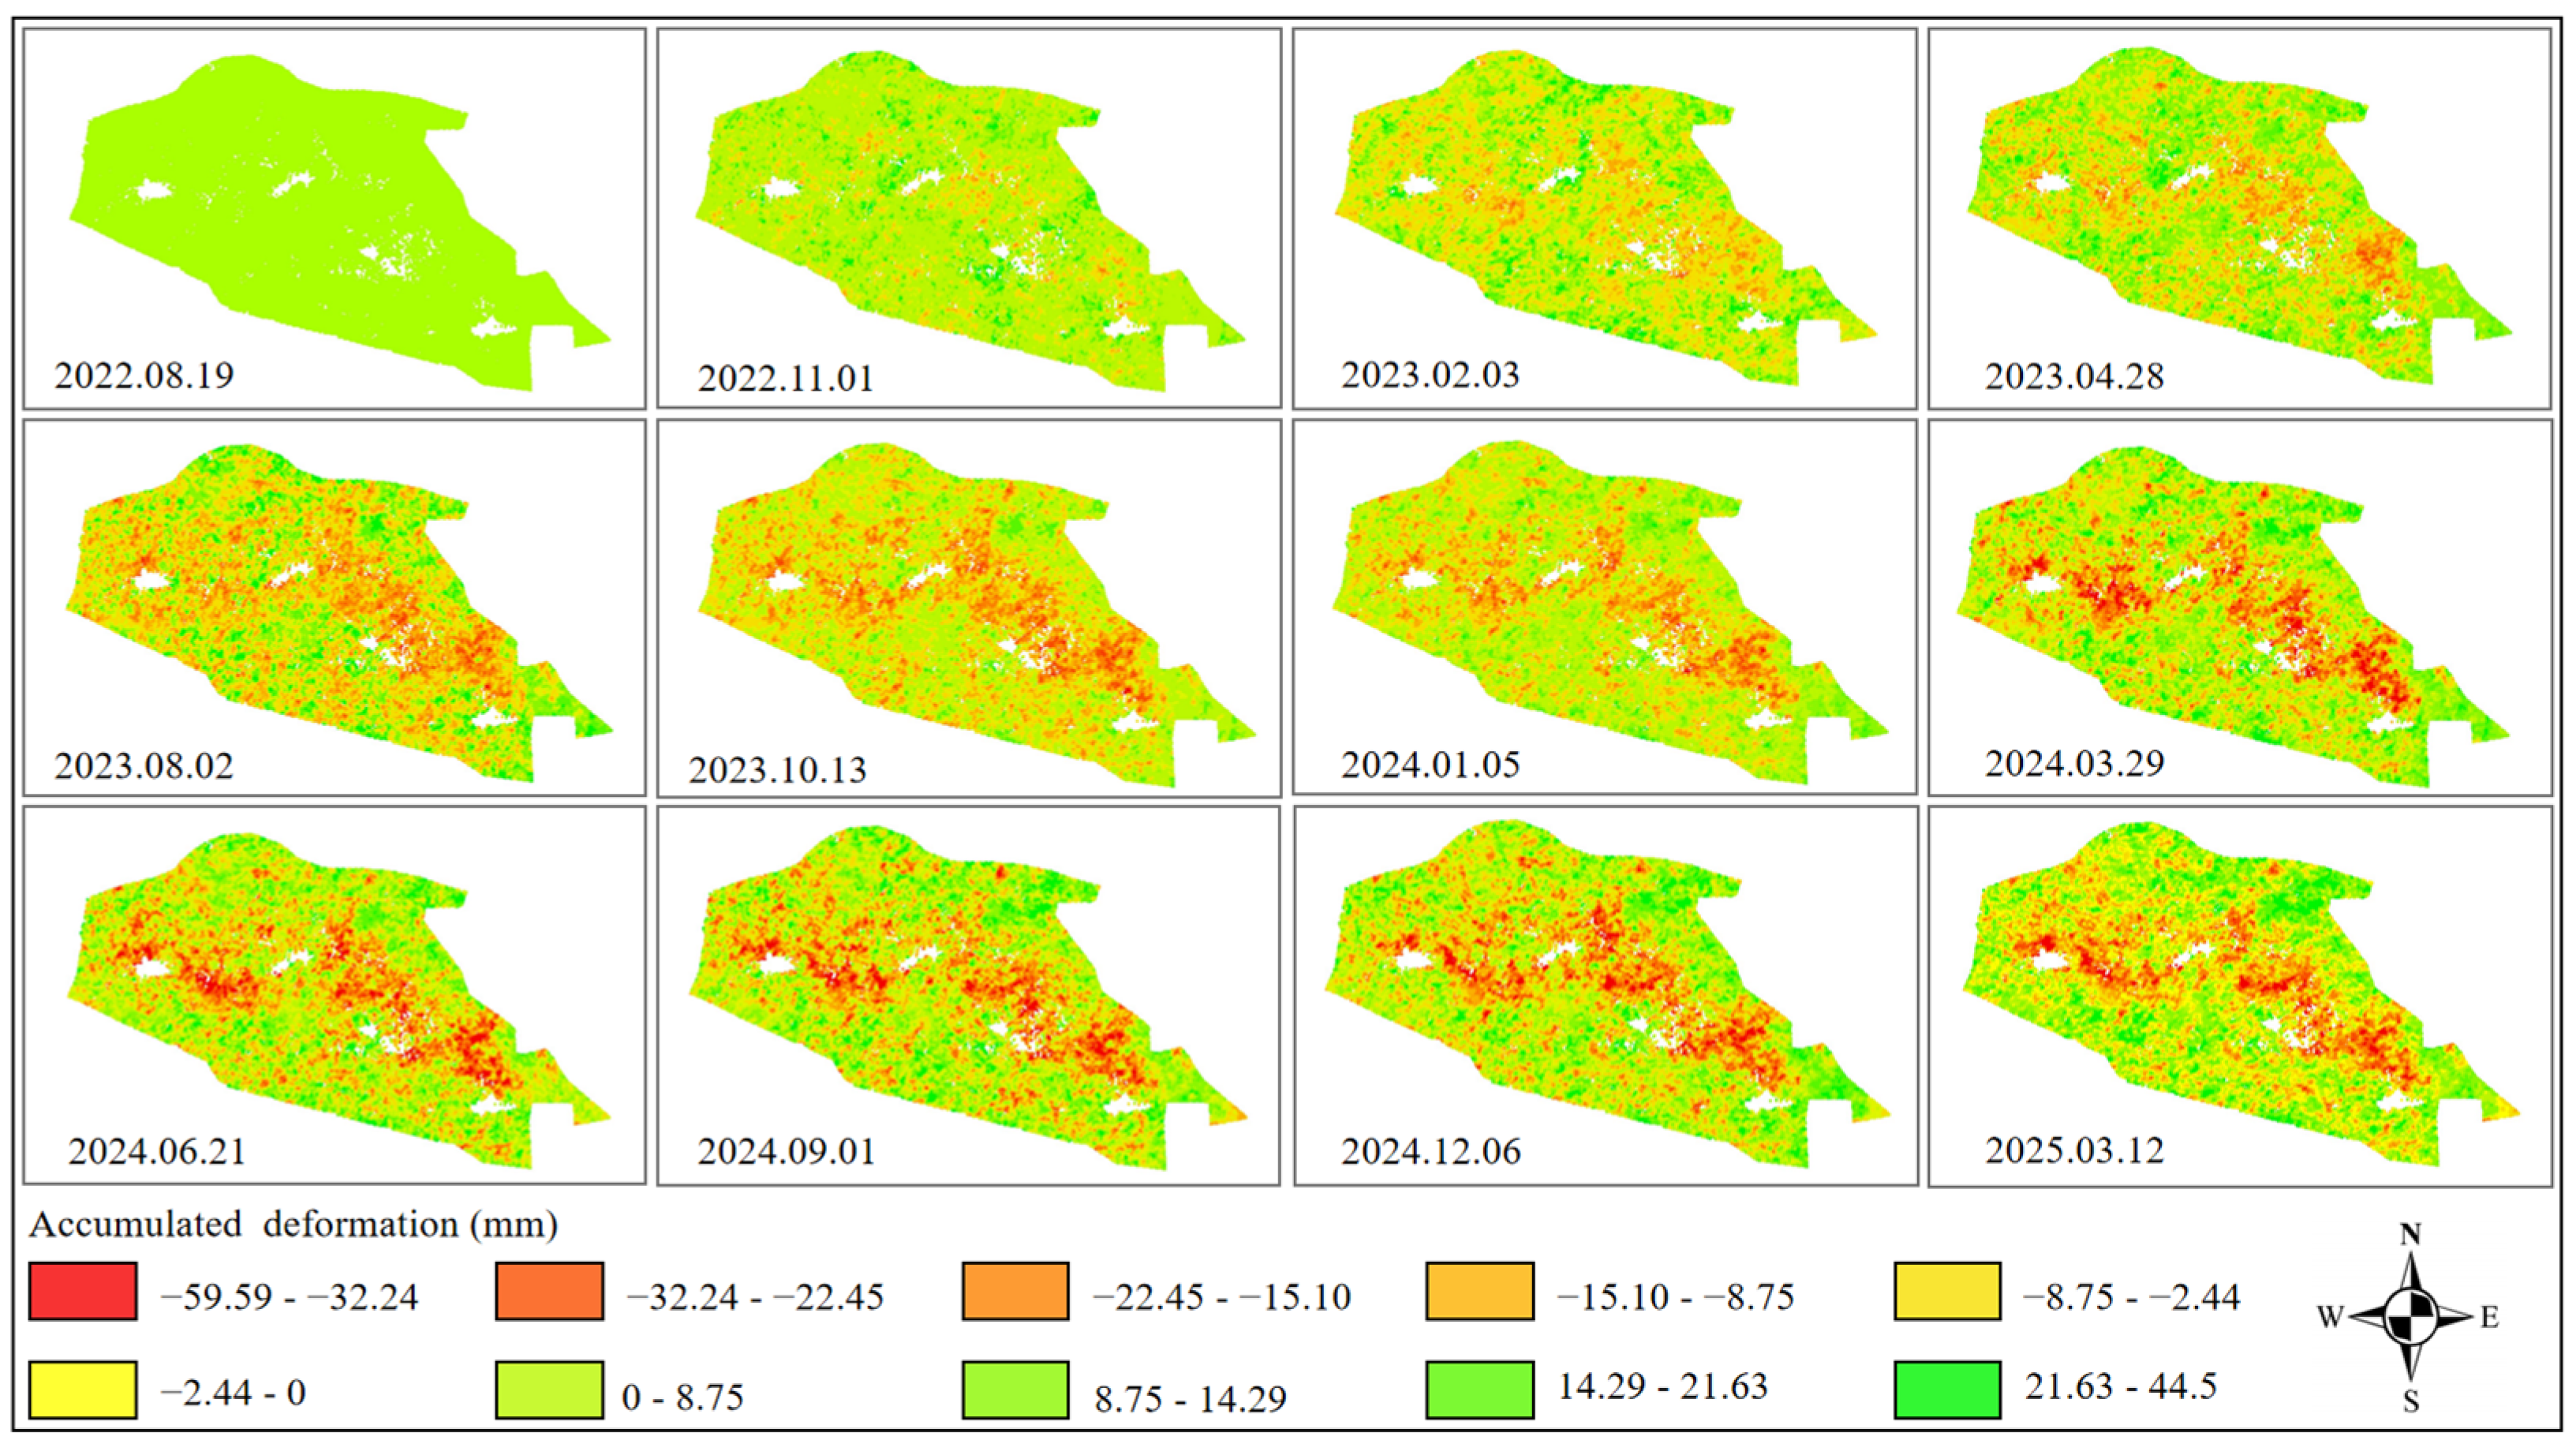
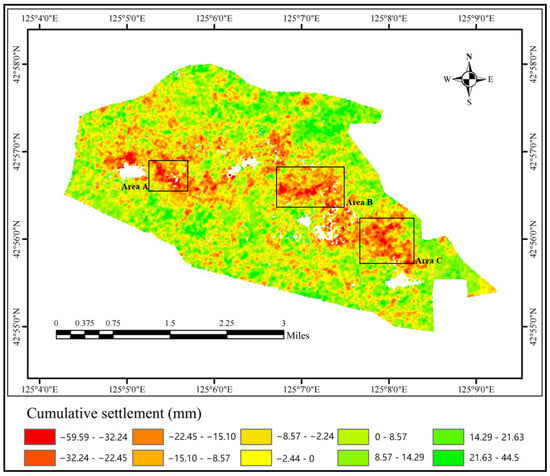
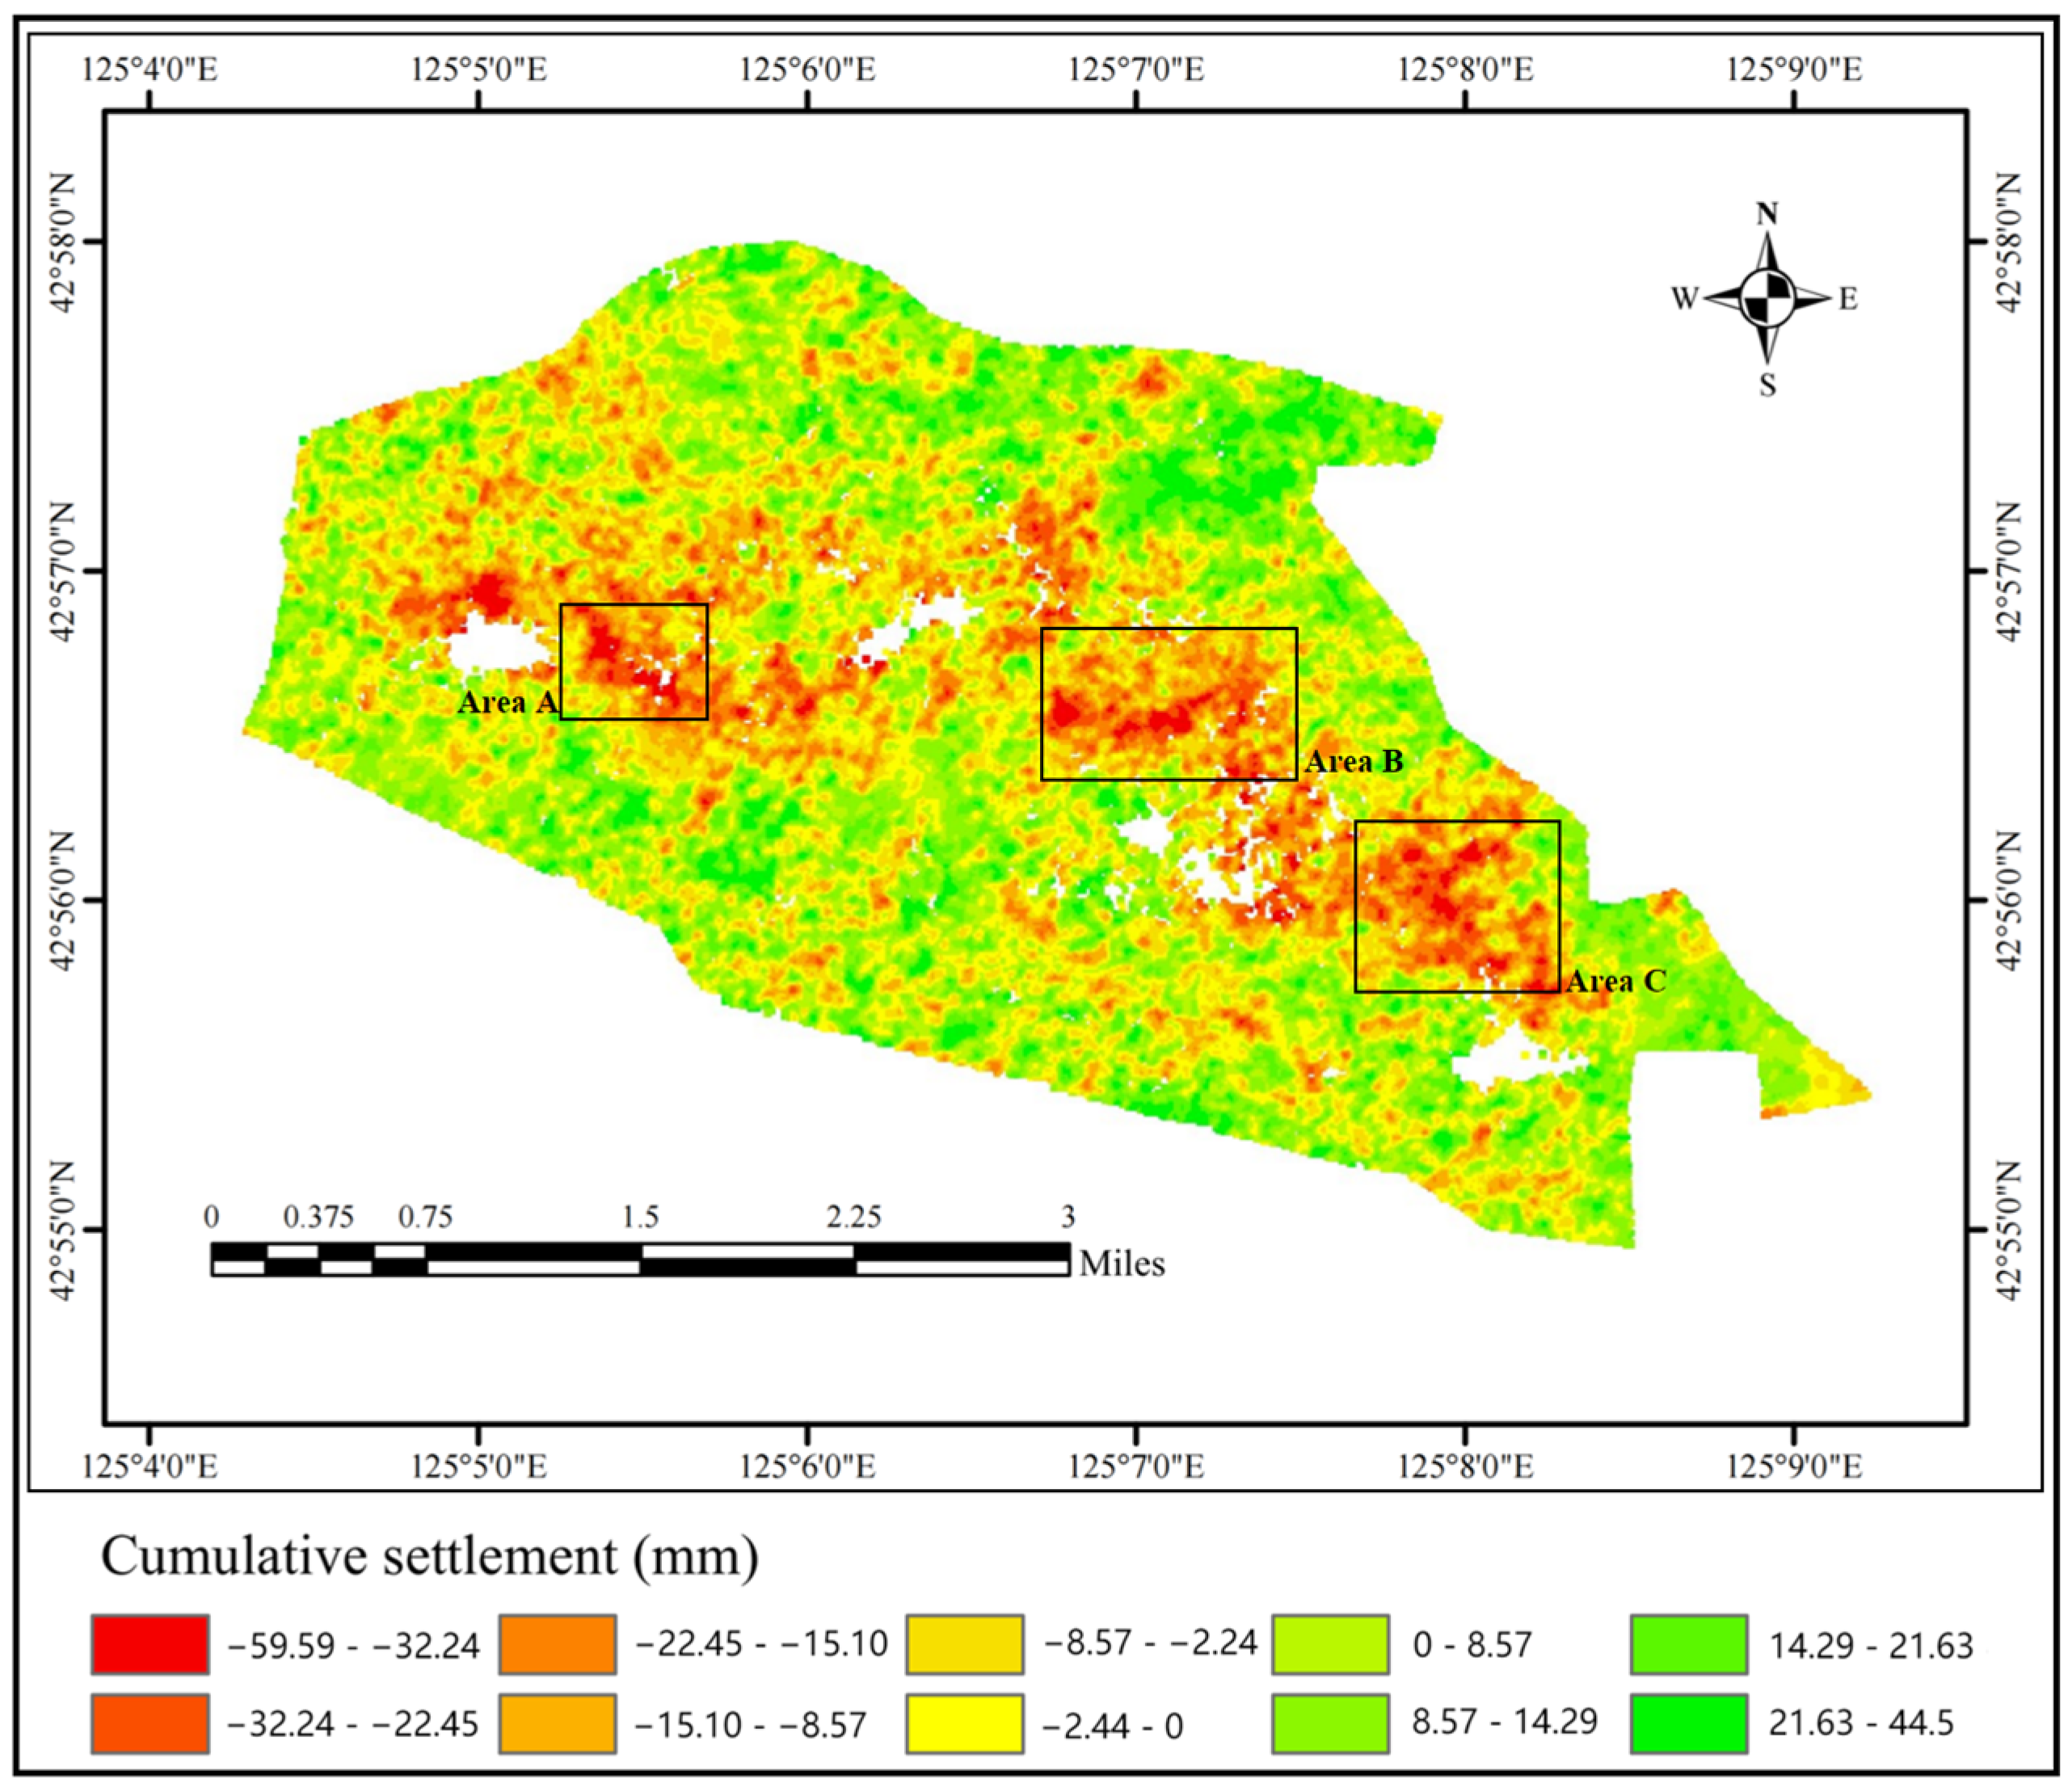
Following the SBAS-InSAR processing, ground deformation results were obtained for 79 distinct time epochs. From these, 12 representative epochs were selected for detailed time-series deformation analysis, as illustrated in Figure 8. The analysis reveals that significant subsidence within the Northern New District of Liaoyuan is concentrated in three primary areas: Xi’an Sixth District (Region A), Xi’an First District (Region B), and the Delong Coal Mine (Region C). The cumulative settlement results at the end of the monitoring period (Figure 9) provide detailed metrics for each area. In Region A (Xi’an Sixth District), the maximum cumulative settlement reached 59.59 mm, with an average of 17.94 mm over the monitoring period, indicating the most pronounced subsidence. Region B (Xi’an First District) showed a maximum of 52.71 mm and an average of 16.08 mm. Region C (Delong Coal Mine) experienced a maximum cumulative settlement of 44.91 mm and an average of 17.13 mm.
Figure 8.
Accumulated deformation results.
Figure 9.
Cumulative settlement results at the end of the monitoring period in the Northern New District of Liaoyuan.
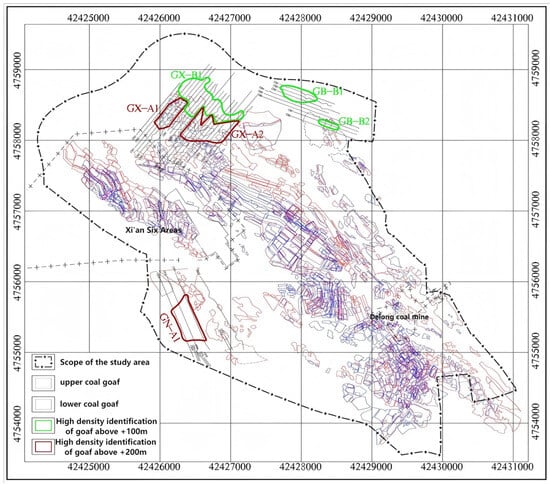
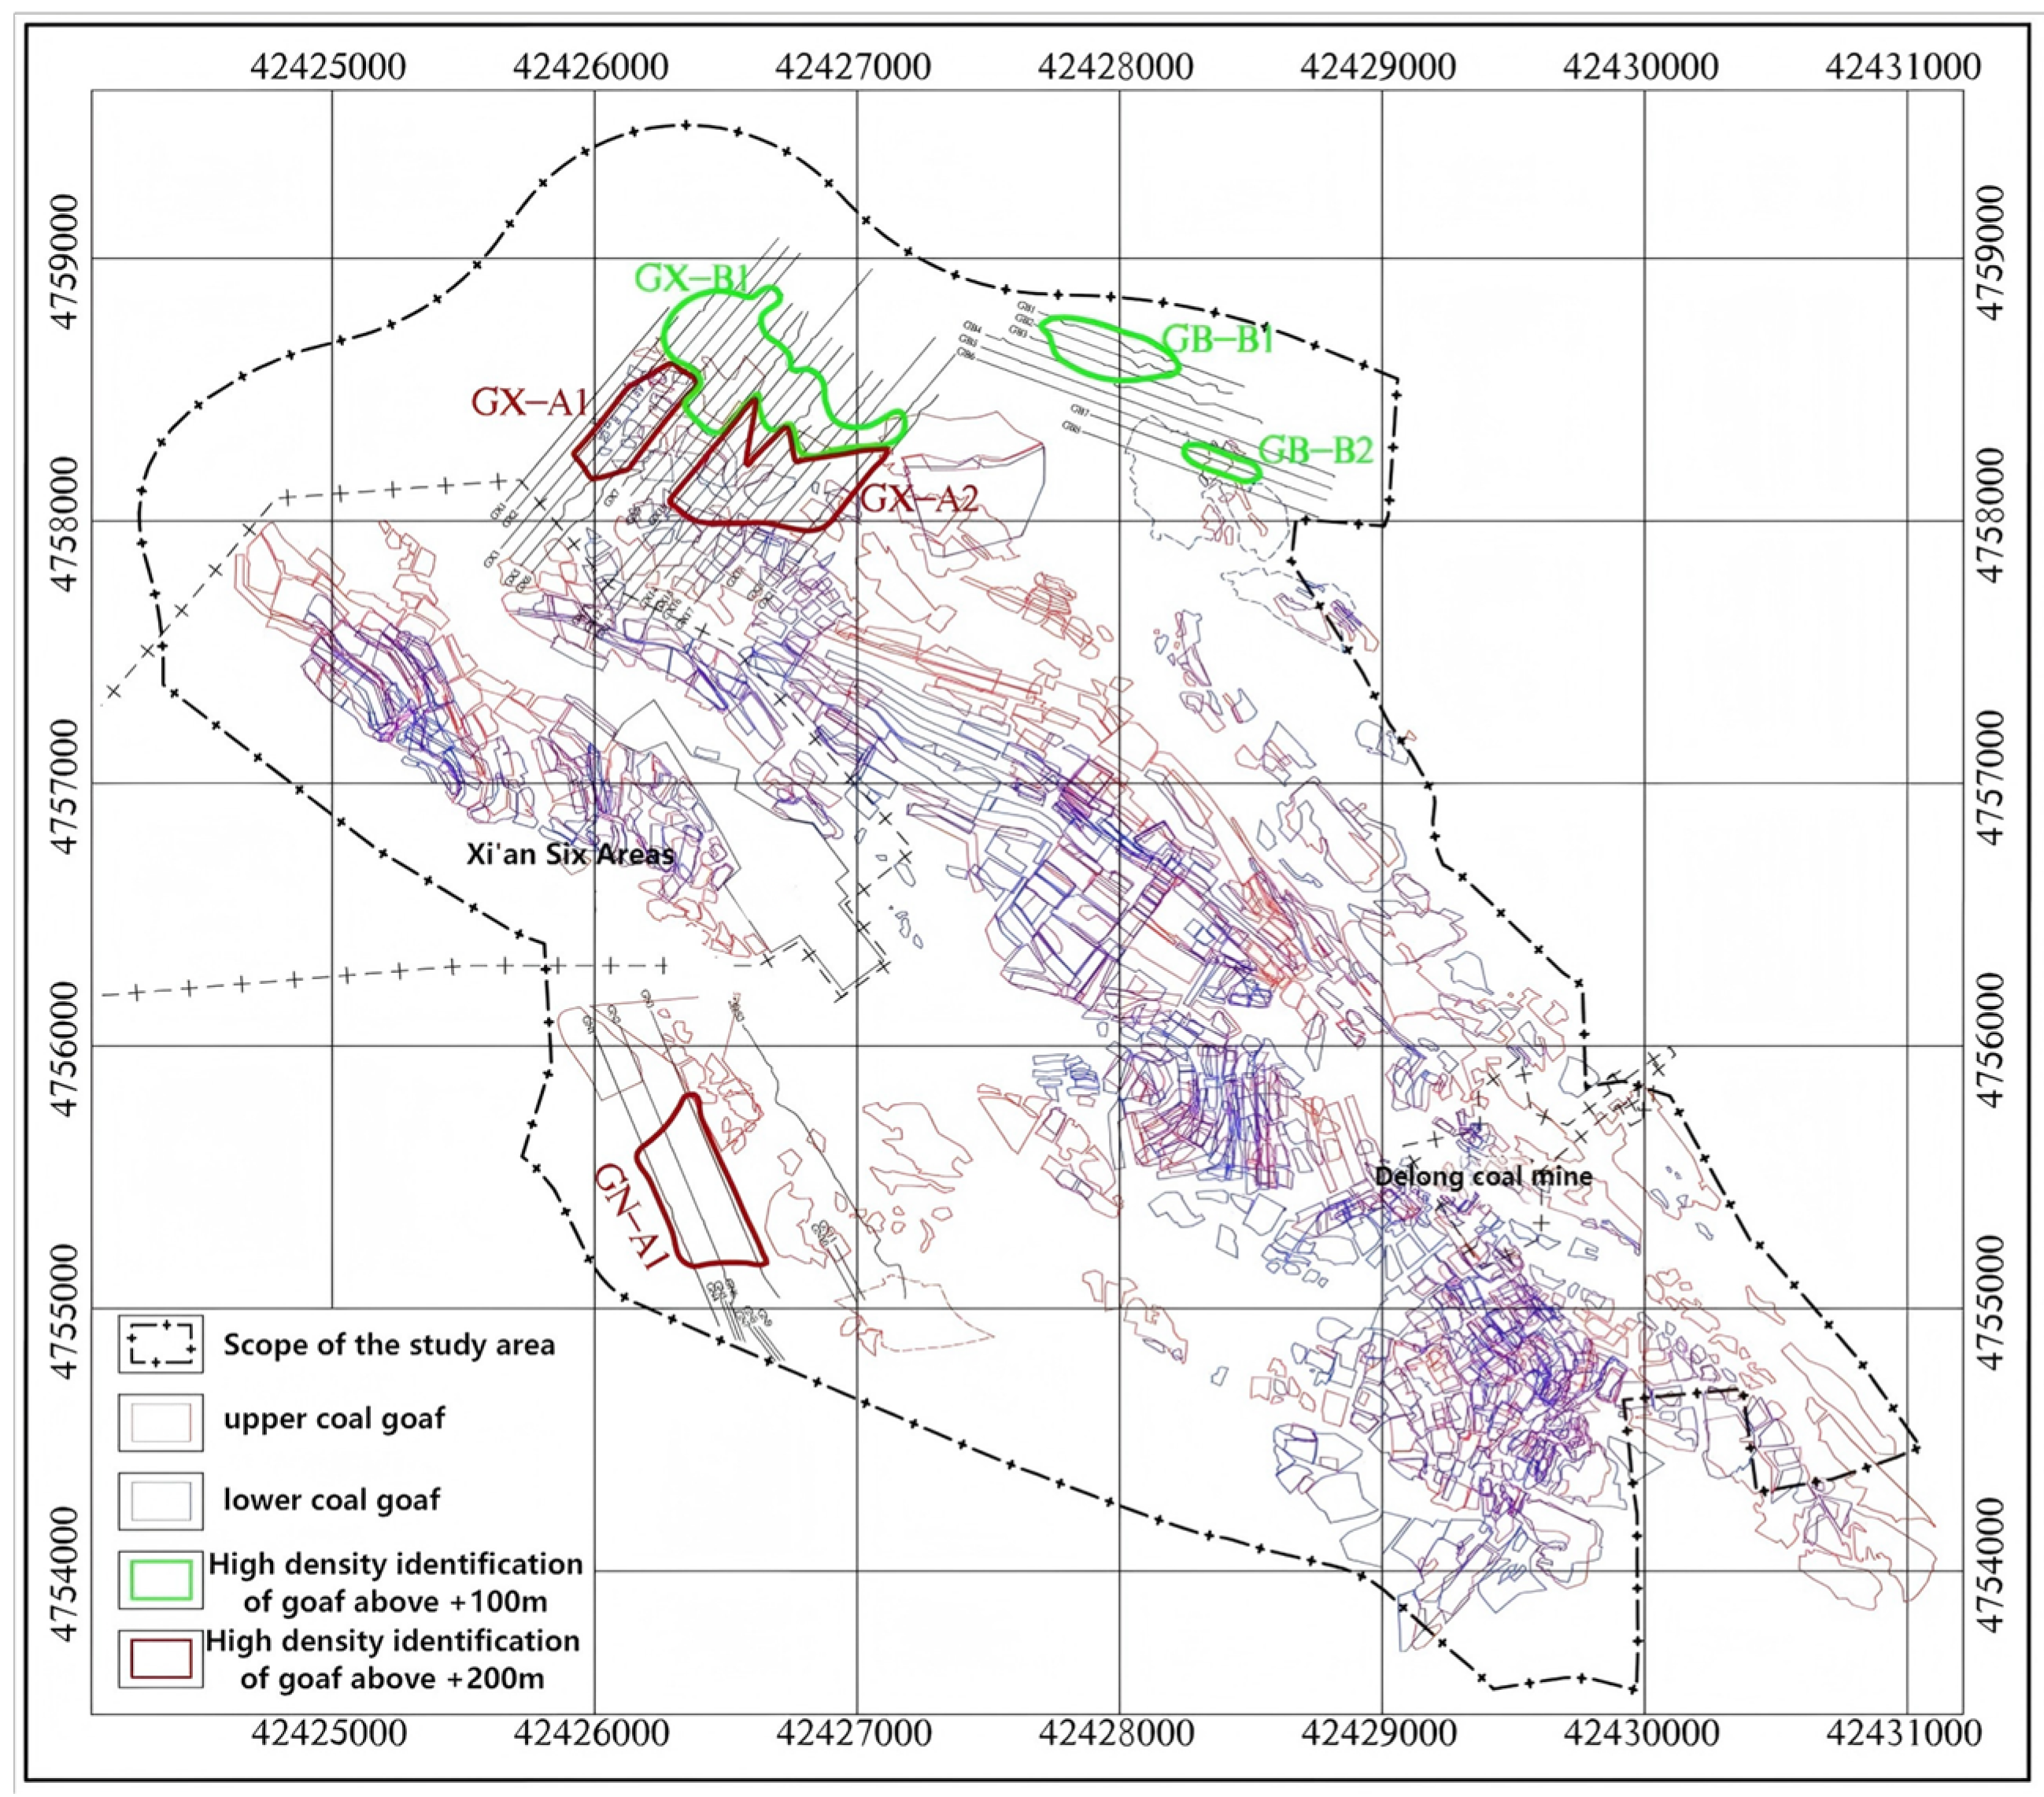
A comparison with the distribution of mined-out areas (Figure 10) indicates that recent subsidence in the Northern New District of Liaoyuan is primarily concentrated in three zones: Xi’an District No. 6 (Zone A), Xi’an District No. 1 (Zone B), and Delong Coal Mine (Zone C). In Zone A (Xi’an District No. 6), mining activities target both upper and lower coal seams. Mining depths range from 330 to 810 m, with coal seam thicknesses of approximately 10 m. Over the past 10–20 years, the primary subsidence mechanism has been the collapse and deformation of overlying strata following coal extraction. Following the removal of temporary support from the goaf, the rock mass gradually collapses, fractures, and bends under the combined effects of gravity and in situ stress, ultimately forming subsidence basins. Field surveys reveal numerous subsidence basins in the area, many of which have evolved into lakes due to year-round water accumulation, with Yuehu Lake being a typical example. Following a period of mining suspension and adjustment, the primary mining method in the six districts of Xi’an over the past two decades has been the longwall mining method with backfilling, stabilizing the subsidence process.
Figure 10.
Distribution map of goafs in the Northern New District of Liaoyuan.
In Area B (Xi’an District 1), both upper and lower coal seams were mined concurrently at depths ranging from 190 to 640 m, with individual seam thicknesses varying between 10 and 20 m. The primary mining methods employed were room-and-pillar mining, longwall mining, and longwall mining with backfilling. Mining operations in this area were conducted from 1989 to 2001. This period involved 27 mining cycles characterized by repeated, high-intensity extraction. Consequently, goaf areas were frequently subjected to new mining disturbances before previously mined-out zones could be adequately consolidated or backfilled. This sequence of operations has led to extensive regional subsidence over the past decade. The most visible manifestation of this subsidence is Fengming Lake, a water body formed by the accumulation of water in a subsidence basin. The primary cause of uneven subsidence in this area lies in insufficient compaction. As mining progresses, the overlying rock strata’s flexural zone and the ground surface will also shift and sink.
The mining cycle for Delong Coal Mine (Zone C) spans from 2014 to 2019. During the initial phase of mining, the underground rock remained in a relatively static state, maintaining internal stress equilibrium. However, mining activities such as shaft sinking, tunnel excavation, and working face development will disrupt the original stress state of the rock. Settlement primarily occurs beneath the coal mining working face. During the mid-mining phase, as the working face retreats, stress release occurs over a broader area, exacerbating subsidence. By the late mining phase, settlement reaches its peak, and the stress state of the underground rock gradually stabilizes. Nevertheless, mining-induced subsidence continues to impact surrounding areas. In other mining areas of the Northern New District of Liaoyuan, mining activities have ceased for over 20 years, resulting in minimal subsidence, which has now largely stabilized.
3.4. Analysis of Settlement Causes
The study area encompasses the Xi’an Mining District, located in the eastern sector of the Liaoyuan Mining Area within the broader Liaoyuan Coalfield. This district is characterized by complex geological structures and has a prolonged history of coal extraction. Presently, a significant portion of the district comprises historical subsidence basins formed by past mining activities. The majority of the major subsidence processes have concluded, and the current ground movement is primarily characterized by residual settlement. The historical mining conditions of the study area are summarized in Table 2.
Table 2.
Statistical table of technical mining conditions for each pit (area) in the Xi’an Coal Mine.
Within the study area, Xi’an Coal Mining Company currently operates only one mine in District 6. This mine employs both upper and lower layer mining methods at depths ranging from 330 to 480 m with a dip angle of 25 degrees. From 1969 until 2002, it employed both longwall filling and longwall complete mining techniques. Following a suspension of mining operations, the method was adjusted to exclusively employ longwall filling for progressive mining, a practice that continues to this day. At Delong Coal Mine, the coal mining face adopts a longwall layout with inclined cutting and layering, using a retreating mining method. The mining method employed is comprehensive mechanized mining with roof coal recovery, and the roof management method is the full caving system. The mining period spans from 2014 to 2019.
No localized subsidence or collapse events occurred within the study area during the monitoring period. Comparison of cumulative subsidence maps with abandoned mine area distributions revealed a high degree of alignment between subsidence zones and historical abandoned mine boundaries. Despite decades of cessation in most areas, slow and persistent subsidence deformation continues to occur at the surface above abandoned mine pits. Statistical analysis of subsidence data from other areas using QGIS revealed that, except for the active mining areas of Delong Coal Mine and Xi’an District 6, subsidence values over abandoned mining areas generally ranged from −6.73 mm to −35.46 mm. Given the absence of large-scale construction or development in the study area in recent years and the long-term cessation of mining activities, residual subsidence is the primary cause of these observed deformations.
The current subsidence rates in Xi’an District 6 and Delong Coal Mine range from −12.35 mm to −59.59 mm. Due to the implementation of high-ratio post-mining backfilling, Xi’an District 6 has significantly controlled mining-induced subsidence. The observed subsidence may result from the combined effects of residual subsidence and coal mining activities, with mining being the dominant factor.
Delong Coal Mine (Area C) employs full caving mining methods. Surface subsidence typically peaks during the “active mining period” and “within 1–3 years after cessation of mining,” when overlying strata undergo severe collapse and fracturing. The current monitoring period coincidentally missed this “active phase” of significant subsidence. The relatively minor subsidence captured through SBAS-InSAR processing may indicate a transition toward residual settlement. Furthermore, with an annual production capacity of 130,000 tons, this mine’s annual disturbance volume is limited compared to million-ton-scale mines. Therefore, the approximately 60 mm cumulative subsidence recorded represents residual settlement following the rapid subsidence phase and the characteristics of entering a slow decay phase after mining cessation.
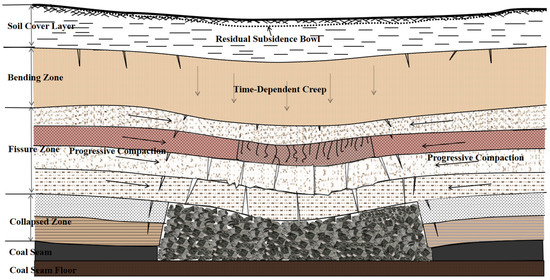
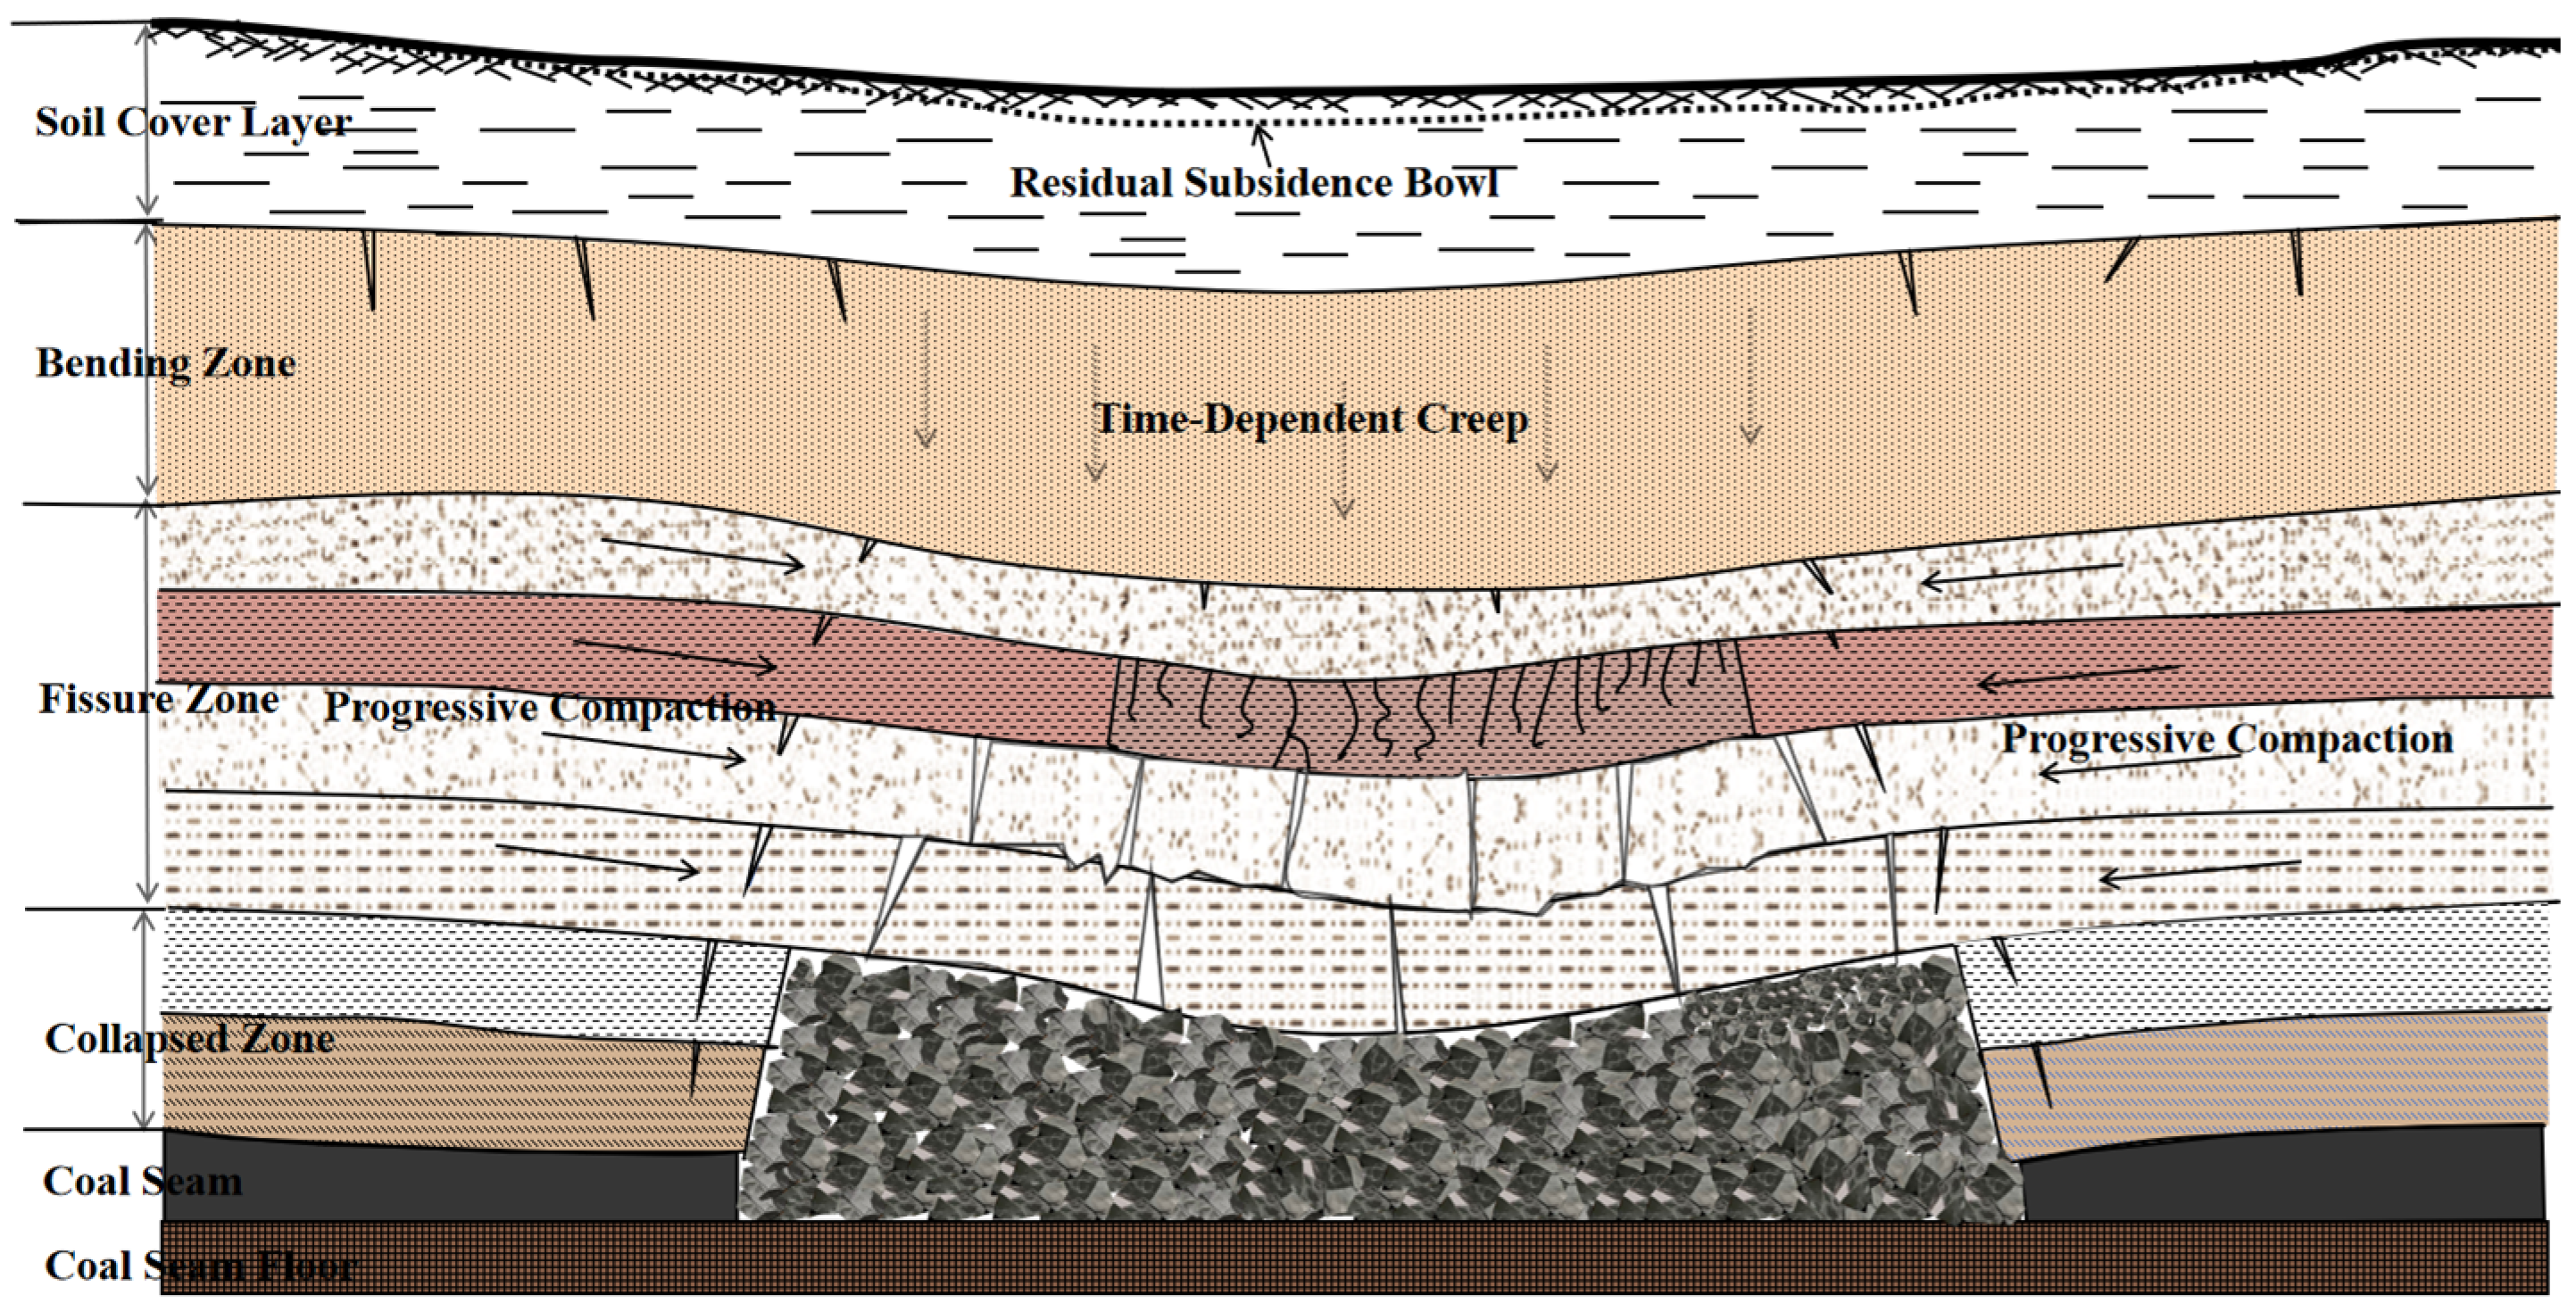
As the study area is a post-mining terrain that has been inactive for many years, significant subsidence has already occurred. During the monitoring period, residual settlement has been the primary mechanism driving long-term surface subsidence. This subsidence has formed sinkholes and currently manifests primarily as progressive consolidation, as shown in Figure 11. Based on the classical “three-zone” model, time-dependent creep occurs in the overlying strata of the bend zone under self-weight stress. Progressive consolidation of fractured blocks and voids takes place in the fracture zone and collapse zone. These slow dynamic processes, driven by gravity (G), persist for years to decades, ultimately forming extensive residual subsidence basins at the surface.
Figure 11.
Schematic diagram of residual settlement mechanism after stabilization of abandoned mine areas.
3.5. Validation of Monitoring Results
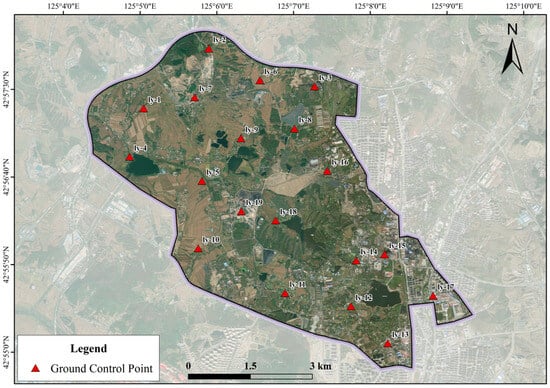
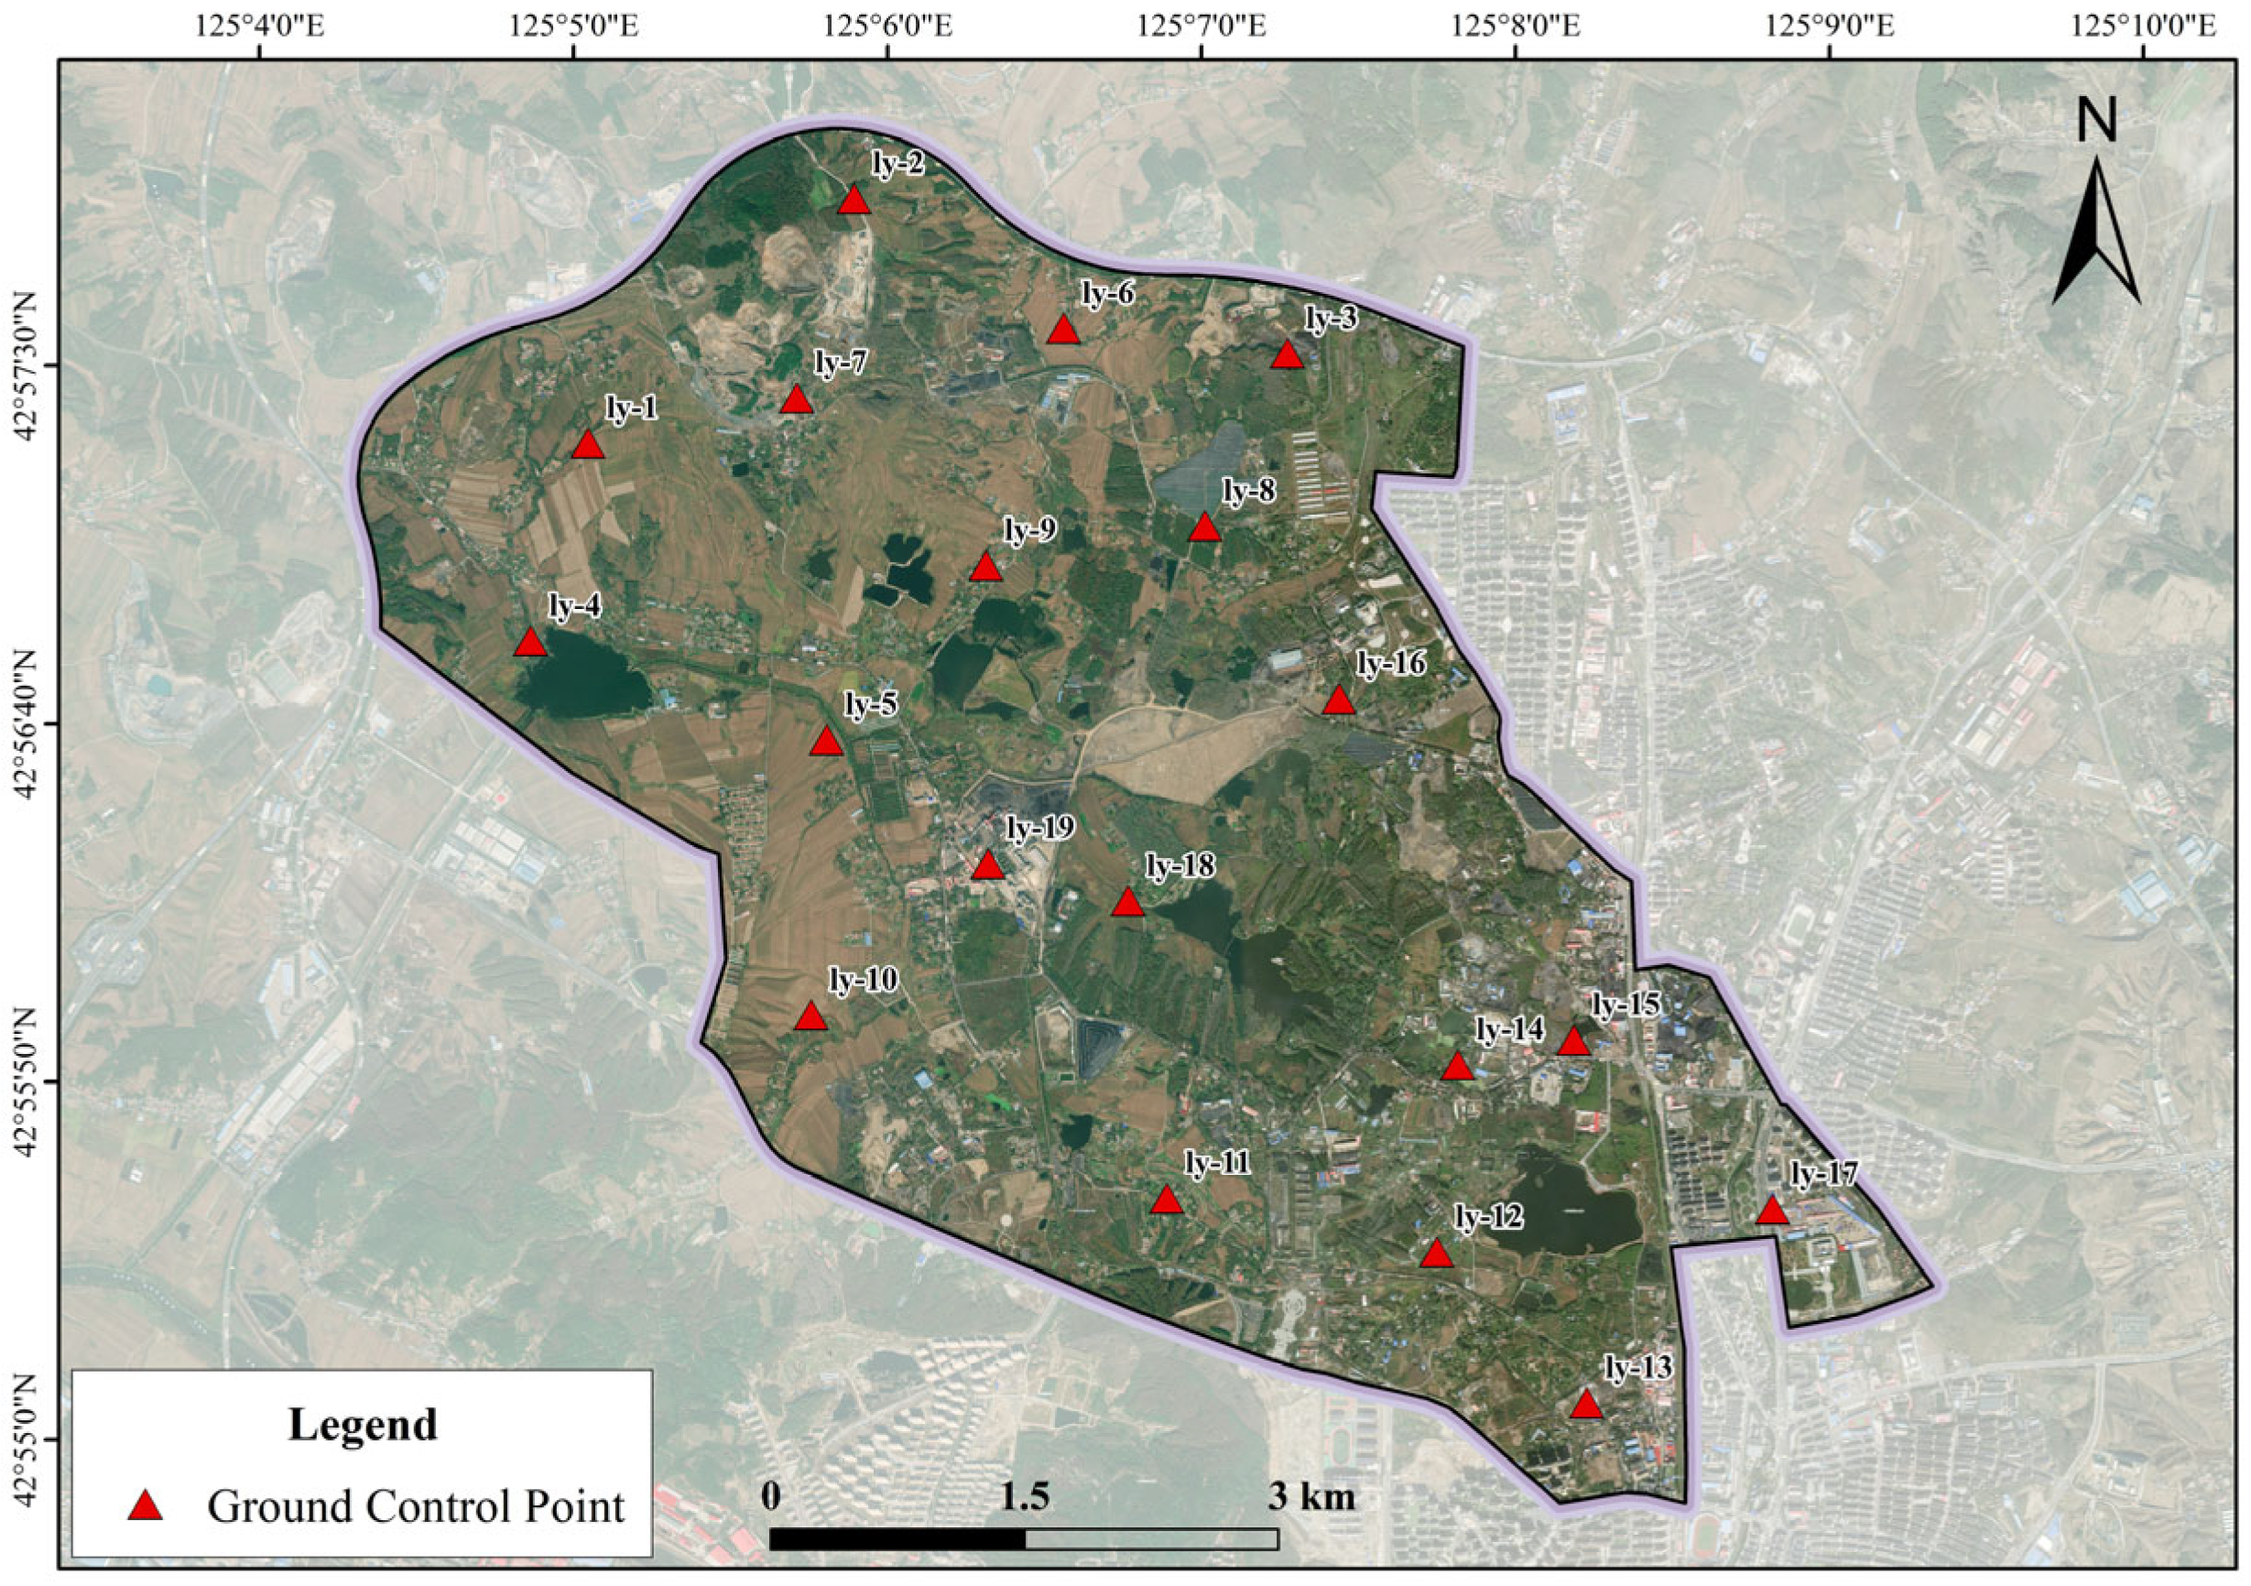
The InSAR monitoring results were validated using unmanned aerial vehicle (UAV) aerial photography. The UAV platform used was a CW-10 drone, equipped with a post-processing kinematic (PPK) GNSS module and carrying a CA502 oblique aerial camera. This system integrates PPK technology, multi-sensor fusion, and oblique photogrammetry. UAV flights were conducted on two occasions: 19–20 August 2022 and 12–13 March 2025. These flight periods were strategically chosen to correspond with the start and end dates of the Sentinel-1A image acquisition, thereby ensuring close temporal alignment and consistency between the UAV and satellite datasets. Over the four-day campaign, eight low-altitude flights (at 50 m above ground level) were conducted to complete the aerial survey. The key UAV flight parameters are summarized in Table 3. A network of 19 ground control points (GCPs) was uniformly distributed across the work area (Figure 12) to ensure globally consistent geometric correction of the UAV data. This configuration helps to mitigate alignment errors induced by local terrain slopes and subsidence, thereby reducing random errors and enhancing overall accuracy. Each GCP was measured multiple times, and the average coordinate was used to minimize observational noise.
Table 3.
List of selected UAV flight parameters.
Figure 12.
Distribution map of ground control points.
Additionally, SBAS-InSAR provides areal average measurements, whereas UAVs yield point cloud variations. To ensure a fair comparison, we spatially averaged and aggregated the ultra-high-resolution settlement difference maps generated by UAVs within the spatial extent of each SBAS-InSAR pixel. This process yielded UAV-derived areal average settlement values matching the InSAR pixel scale. The UAV imaging period was selected based on the Sentinel-1 imaging cycle, with precise matching of temporal endpoints to guarantee spatiotemporal consistency between SBAS-InSAR and UAV monitoring.
The UAV imagery was processed using iTwin Capture Modeler (24.1.1.100) software to construct a tilted three-dimensional (3D) model of the study area, which accurately represents the surface conditions of the Liaoyuan Northern New District. The derived digital elevation model (DEM) has a spatial resolution of approximately 1–2 cm. Following correction using the ground control points (GCPs), the vertical accuracy of the DEM is improved to approximately 0.5–1 cm. Subsidence data were obtained by differencing the DEMs generated at the start and end of the monitoring period. Through GCP correction and repeated surveys, the UAV-derived data achieved an accuracy standard suitable for validating the SBAS-InSAR results, demonstrating good monitoring capability.
While traditional leveling can achieve high accuracy, it requires repeated, high-precision measurements that incur substantial time costs. Furthermore, conducting surveys in mining areas entails safety risks, and some GCPs are located in complex environments where data collection may be incomplete. In contrast, UAV monitoring offers advantages in cost-effectiveness, operational efficiency, safety, and adaptability to complex terrain typical of mining areas. Therefore, this study utilized UAV-based data instead of leveling surveys to validate the InSAR monitoring results.
Settlement monitoring results obtained using SBAS-InSAR technology were compared with those acquired via unmanned aerial vehicles (UAVs). Figure 13 displays the cumulative settlement results for SBAS-InSAR monitoring control points. This study processed SBAS-InSAR monitoring data using QGIS, yielding time-series settlement data covering 99,325 points across the entire region. Figure 13 illustrates the selection scheme for five ground control points used to process and analyze SBAS-InSAR time-series settlement data. The time-series settlement data for these five control points were obtained by averaging the settlement data from each control point with the settlement data from the surrounding four points, totaling 25 data points. Cross-validation of SBAS-InSAR monitoring results was performed using UAV monitoring data, with comparison results presented in Table 4. The error was controlled within 5 mm [11]. Statistical analysis using the following three metrics quantitatively demonstrated the reliability of settlement results obtained through SBAS-InSAR processing for the Northern New District of Liaoyuan.
where DInSAR,i and DUAV,i represent the SBAS-InSAR and UAV monitoring values at point i, respectively, and DUAV denotes the average value of the UAV monitoring results.
Figure 13.
Cumulative settlement of control points monitored by SBAS-InSAR.
Table 4.
Comparison of SBAS-InSAR sedimentation monitoring results with UAV sedimentation monitoring results.
SBAS-InSAR technology provides distinct advantages for ground deformation monitoring, including wide-area coverage, millimeter-level measurement accuracy, all-weather operational capability, and relatively low cost. However, its application is constrained by challenges such as signal decorrelation in vegetated or rapidly changing areas and the computational complexity of processing large time-series datasets. Consequently, SBAS-InSAR is well-suited for long-term, large-scale monitoring applications, such as in mining areas and urban settings, for detecting slow, cumulative deformation and for scientific studies requiring high spatial-resolution time series. In contrast, UAV-based monitoring offers high flexibility and spatial resolution but is typically limited by a small spatial footprint, sensitivity to weather conditions, and higher operational costs associated with manpower, equipment, and maintenance. Its strengths make it particularly effective for the precise, targeted monitoring of high-risk, localized subsidence zones within mining areas. The SBAS-InSAR and UAV monitoring techniques are highly complementary. Their integration leverages the broad-scale, continuous surveillance capability of InSAR with the precise, high-resolution snapshot capability of UAVs, thereby providing a more robust and comprehensive solution for monitoring ground subsidence in mining areas.
3.6. Discussion
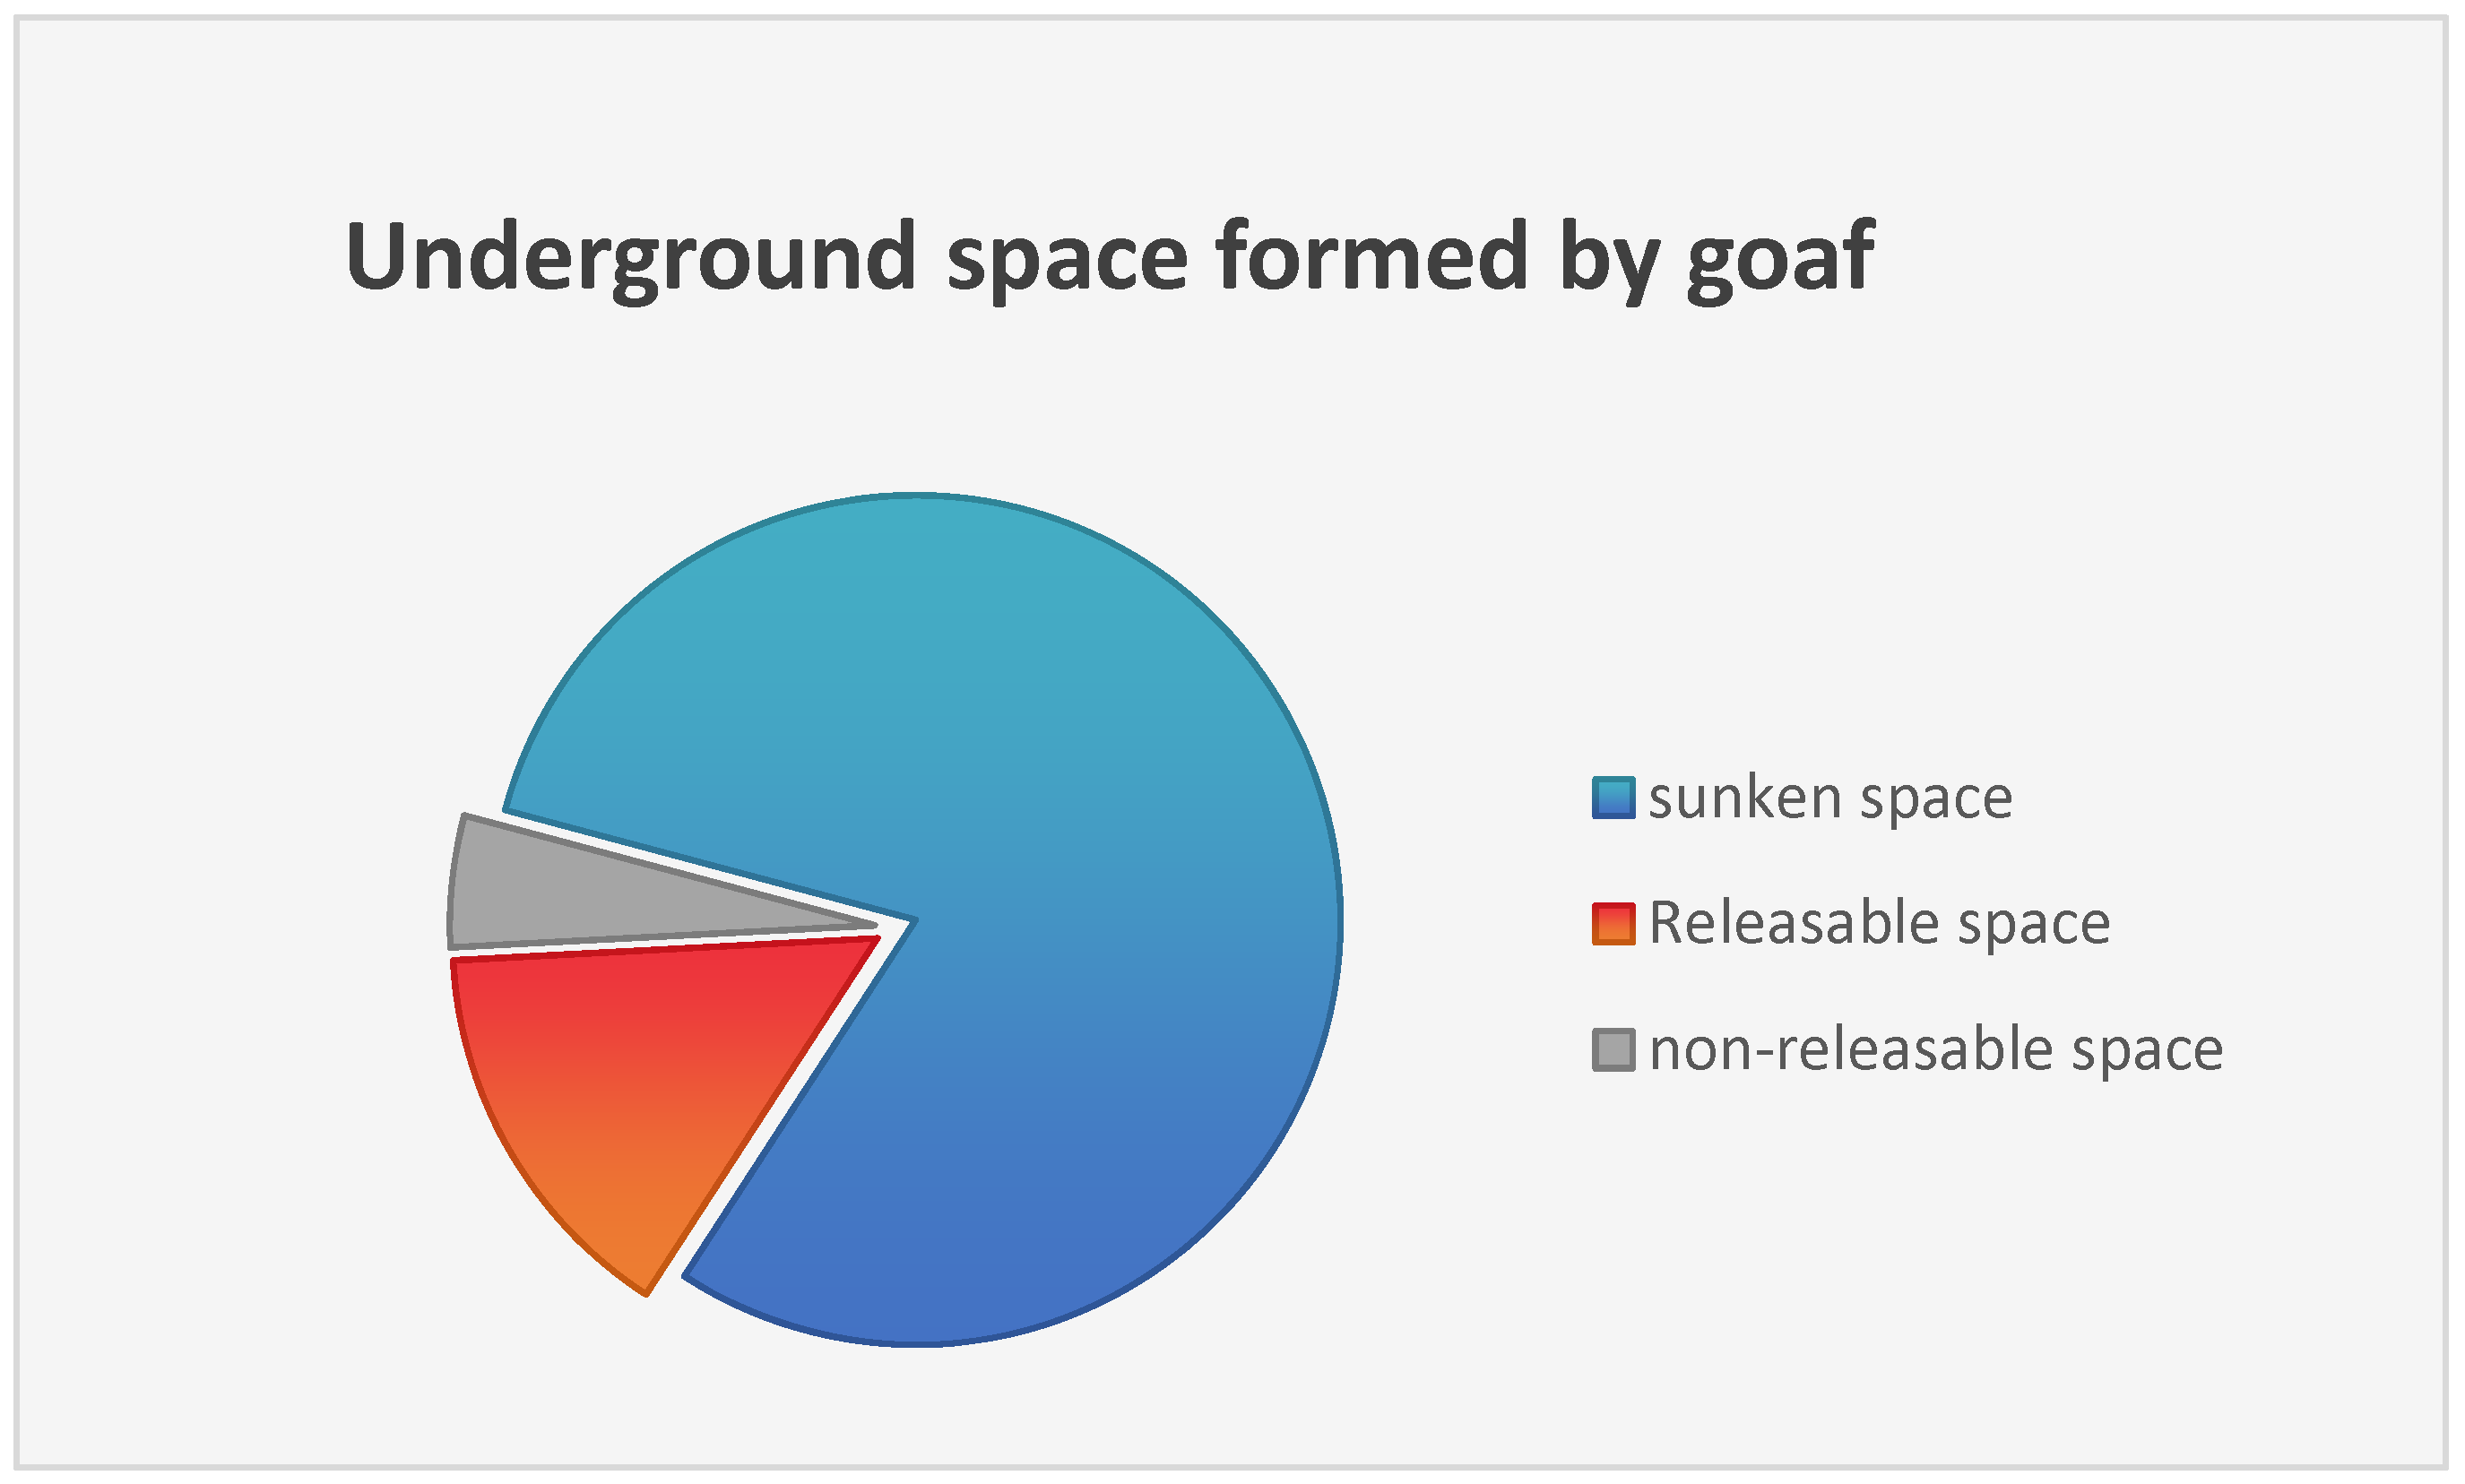
Ground subsidence in mining areas primarily results from the release of underground void space created by coal extraction. Based on the mode and timing of release, this void space can be categorized into three types: subsidence space, non-releasable space, and releasable space (Figure 14).
Figure 14.
Schematic diagram of the underground space formed by the goaf.
- Subsidence Space: This constitutes the void space that is transmitted to the surface, typically forming a funnel-shaped subsidence basin due to collapse and failure of the overburden following resource extraction. This process occurs during and for a limited period (typically 1–3 years) after mining. Subsidence space accounts for 80–90% of the total void volume generated.
- Non-releasable Space: This refers to void space that is permanently accommodated within the rock mass through mechanisms such as fracturing, bulking, and expansion of the strata, and is not subsequently released to the surface.
- Releasable Space: This denotes void space temporarily stored within the rock mass that can be released to the surface over an extended period. This release, which leads to residual surface displacement and deformation, can be triggered by factors such as external loading, water infiltration (flooding), and long-term weathering.
During the concentrated surface movement phase, most of the surface deformation has been completed, and the subsidence space has been filled. At this point, the surface subsidence has reached 80–90% of the total and may even exceed 90%. After the concentrated surface movement phase, the surface has reached a stable state of mining subsidence, where the cumulative subsidence over six consecutive months is less than 30 mm. At this point, surface deformation becomes residual deformation.
The formation of a goaf (the void formed underground after mineral resources have been extracted) can induce rapid surface subsidence, progressing through the initial, active, and declining phases of surface movement. During roof collapse, distinct overburden deformation zones are formed, commonly termed the “three zones”: the caved zone, the fractured zone, and the continuous deformation (bending) zone. After the primary surface movement period, residual deformation can be further influenced by rising groundwater levels. Water infiltration into the goaf can weather and weaken the fragmented rock mass, which may then undergo gradual reconsolidation under the overburden pressure, leading to additional settlement. The definitions and formation mechanisms of these three zones are summarized in Table 5.
Table 5.
Definition of the ‘three zones’ and mechanisms for their formation.
The subsidence patterns revealed by SBAS-InSAR monitoring in this study show a spatial distribution that closely aligns with the historical scope of mining voids, indicating that current surface deformation represents a sustained response to mining disturbance. Given that mining operations ceased several years ago, the study area as a whole entered the late stage of subsidence attenuation during the monitoring period. The captured millimeter-level annual rate signals primarily reflect residual subsidence processes.
From a spatiotemporal perspective, the settlement rate exhibited a sustained decline trend throughout the monitoring period, consistent with the theoretical pattern of deformation stabilizing over time following mining cessation. Spatially, the long-term rheological behavior of overlying medium-to-thick sandstone layers and other hard rocks, along with the gradual consolidation of their internal fracture systems, coupled with the creep of weak intercalations such as mudstone, jointly dominated the slow subsidence of the surface during post-mining stress adjustment.
4. Prediction and Analysis of Mine Subsidence
4.1. Overview of Models
In this study, subsidence prediction was performed using three deep learning models adept at handling sequential data: Long Short-Term Memory (LSTM) networks, Gated Recurrent Unit (GRU) networks, and a hybrid Temporal Convolutional Network–Gated Recurrent Unit (TCN-GRU) model. The TCN-GRU model is a hybrid architecture that combines the aforementioned TCN and GRU networks. These models are widely employed in time-series forecasting due to their effectiveness in capturing long-term temporal dependencies and their robustness against noise and interference.
4.2. Forecasting Methods
4.2.1. LSTM
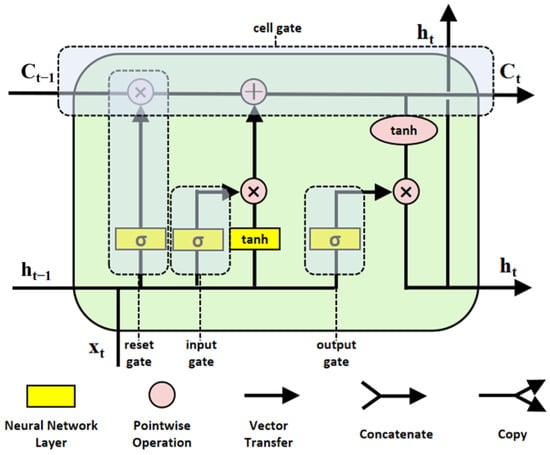
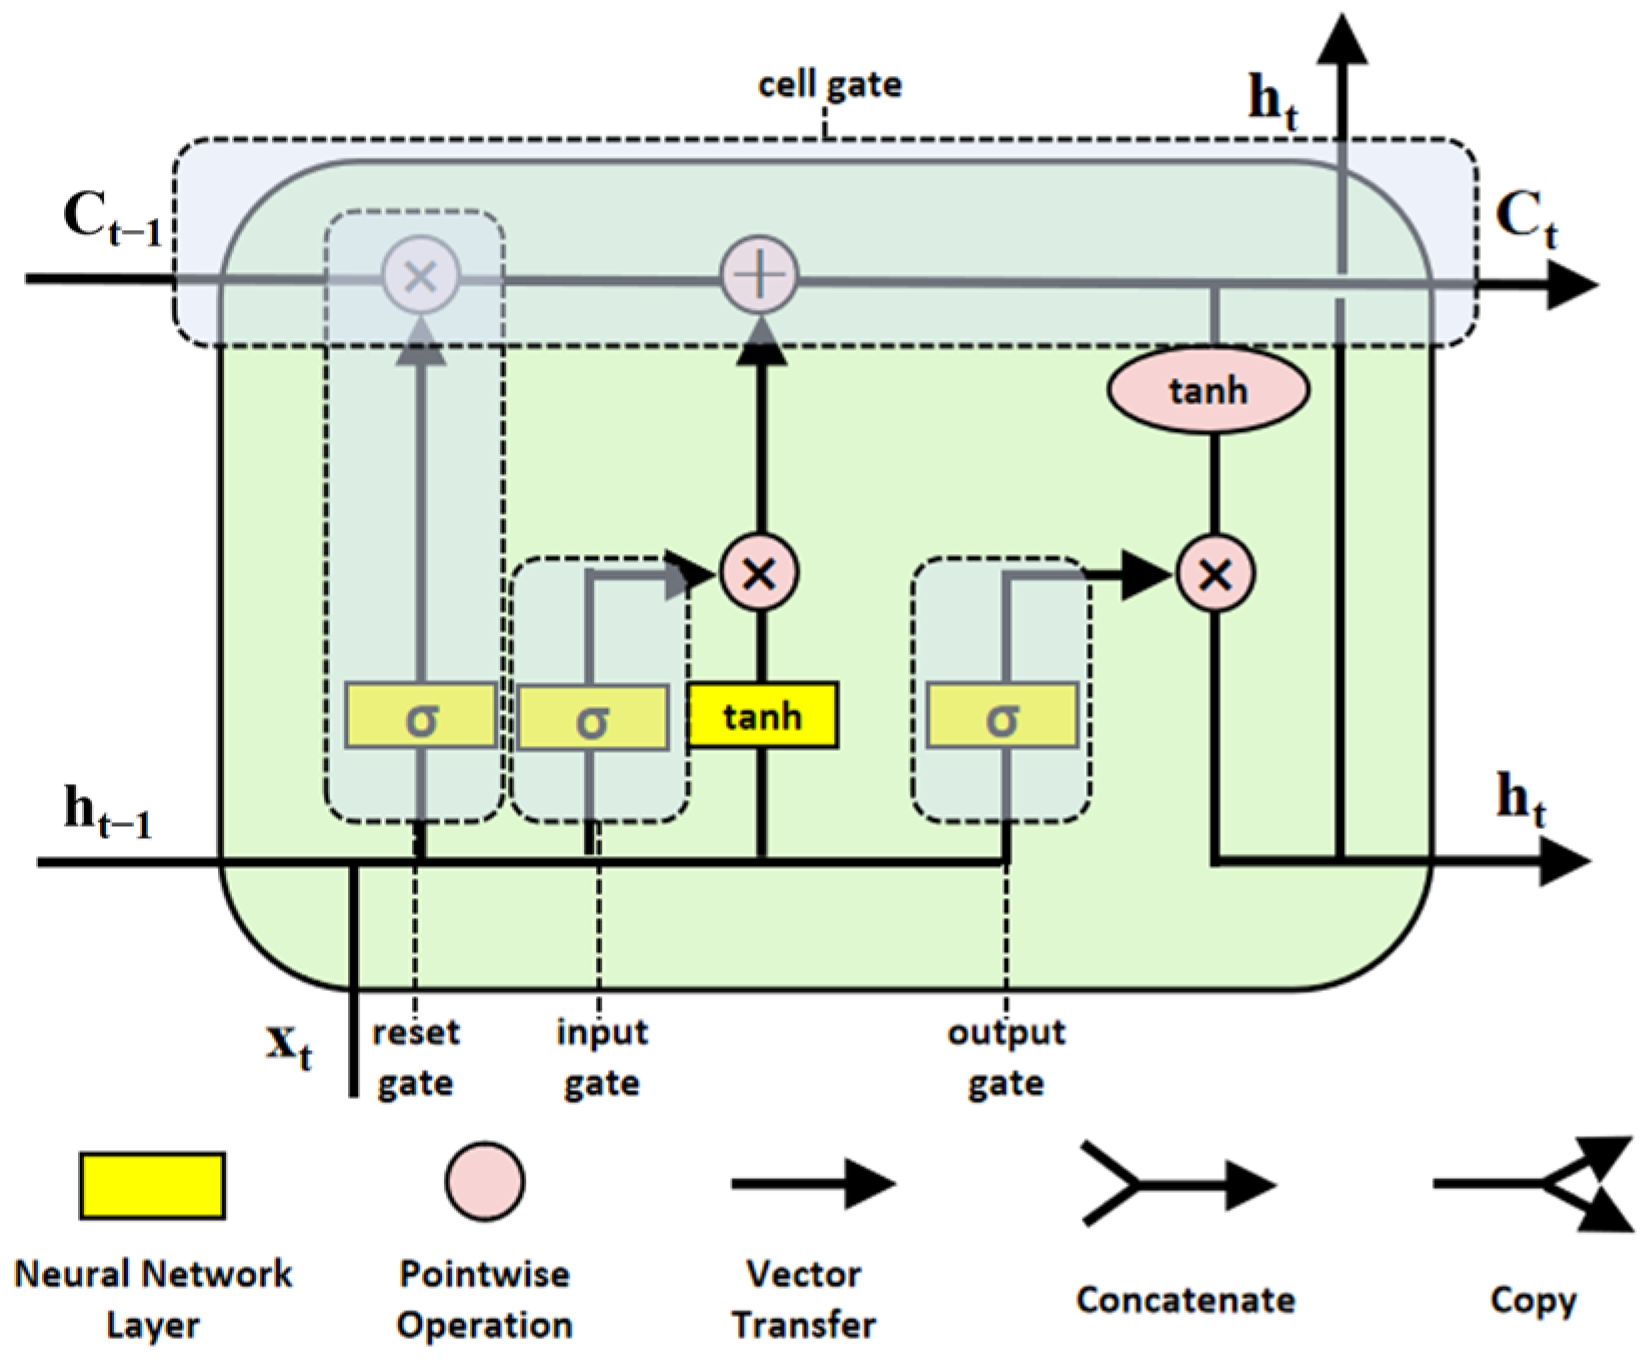
Long Short-Term Memory networks (LSTM) are formed by improving Recurrent Neural Networks (RNN). The main aim of LSTM is to resolve the challenges of gradient vanishing and gradient explosion that can occur in RNNs when dealing with long-time sequences [34]. LSTM regulates the saving and forgetting of information by introducing three gating units (forgetting gate, input gate, and output gate). The gating units facilitate the efficient maintenance and updating of the unit state, enabling the capture of information in long-term dependencies.
As shown in Figure 15, where each cell contains three gate structures, the gate structure is implemented through a sigmoid layer. The nonlinear activation function is given in Equation (7) and is widely used in machine learning by introducing nonlinear features of the network to achieve better fitting of functional relationships. It can map the data to 0~1 and can indicate how much information is transmitted: An output of 1 allows all information to pass through this gate, while an output of 0 indicates that the information cannot pass through. The gate structure is defined as shown in Equation (8).
Figure 15.
LSTM structural unit.
The data processing procedure is shown below. The forgetting gate selectively discards the information in the cell state from the previous step through the gate structure:
The input gate selectively stores new information in the cell state:
Updating the cell state removes the old information partially and adds new information to obtain the new cell state:
The output gate outputs part of the cell state, related to Ct:
As shown in the above equation, xt denotes the input at moment t in the sample time series, ht denotes the hidden state output of the sample at moment t, b denotes the offsets, and W denotes the weight matrix. The input gate is denoted as i, the forgetting gate is denoted as f, the unit state is denoted as C, the outputs are denoted as o, and C1t denotes a candidate vector created by tanh.
4.2.2. GRU
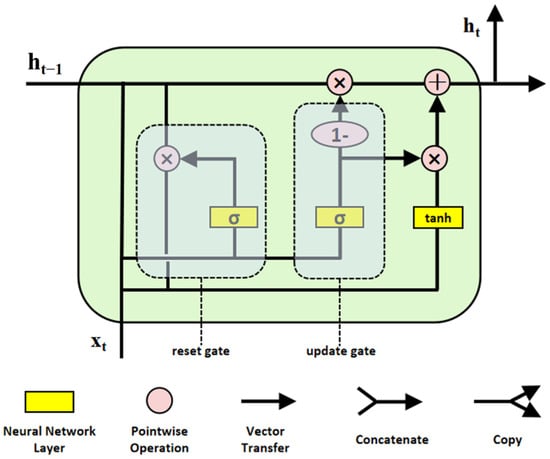
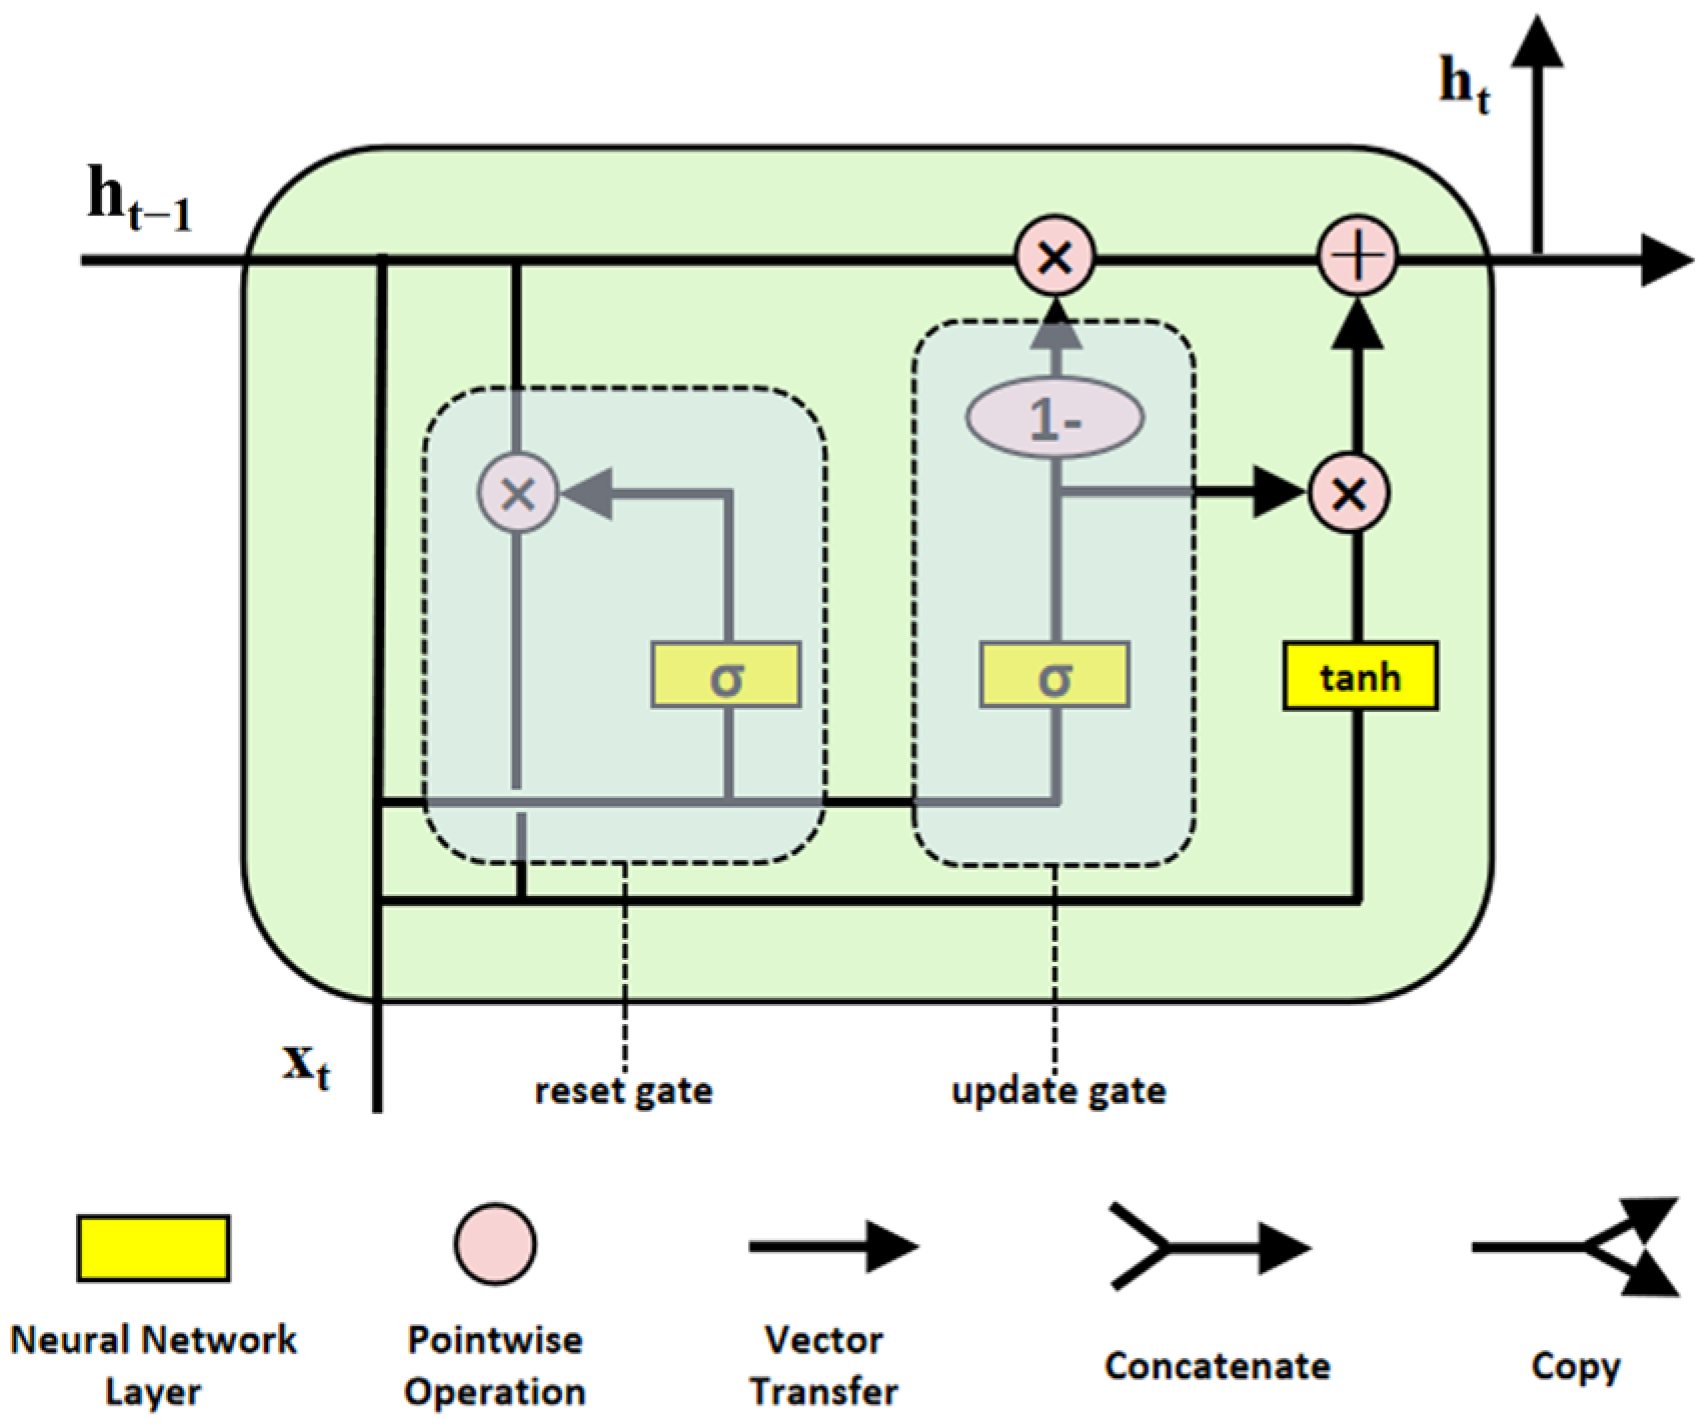
The new Recurrent Neural Network structure (GRU) is obtained by improving the LSTM. The GRU contains two gates: the reset gate and the update gate [35]. This design enables the model to efficiently capture long-term dependencies in time-series data. By replacing the two independent decision processes of the “forgetting gate” and “input gate” in LSTM with a single “update gate,” the smaller data units and simpler data flow result in faster training speeds compared to LSTM [36].
The structural unit of the GRU is illustrated in Figure 16, where xt represents the input data for the GRU, and ht signifies the output data. The influence of the previous hidden state ht−1 on the new hidden ht is regulated by the reset and update gates. The formulas for the update and reset gates are shown below.
Figure 16.
Structural unit of the GRU.
In the above equations, Wr, Wz, and Wht are the weight matrices of the reset gate, update gate, and newly stored information, respectively. b denotes bias, h1t denotes the candidate state, r denotes the reset gate, and z denotes the update gate.
4.2.3. TCN-GRU
TCN is a deep learning model explicitly designed to deal with time series data. The structure of TCN was developed based on the idea of Convolutional Neural Networks (CNNs) [37]. It enhances the model’s capacity to manage and model long-term dependencies in time series by incorporating advanced structures like convolution and dilated [38]. Compared to traditional Recurrent Neural Networks (RNN), TCN exhibits higher efficiency and accuracy in dealing with long temporal dependencies [39]. The extended convolution (DCC) method was utilized to improve the perceptual field while maintaining low computational cost. DCC facilitates more efficient feature and information gathering by selectively omitting certain elements [40].
The combination of multi-layer stacking with extended causal convolution and the mechanism of sliding convolutional kernels over the input data permits deep learning networks to attain a wider sensory field with several layers, and temporal convolutional networks (TCNs) can handle inputs of different lengths. As a result, the predicted values of the results from the previous step can be used as inputs for further prediction, allowing continuous computation and new predictions.
To address the degradation issue prevalent in deep learning networks, a residual block (RB) is used in this paper [41]. The main idea is to introduce “jump connections” that allow information to be passed around one or more layers. Suppose the input of the residual block is x, and its output y is the result of linearly transforming and mapping the input by an activation function. In practice, the residuals (k(x)) are usually non-zero. It is guaranteed that the learning performance will not be degraded.
The activation function for the residual unit uses the ReLU function, which contains two convolutional units and a nonlinear mapping [42]. To prevent overfitting and to speed up model training, a Dropout operation is usually applied, in which neurons are randomly discarded at a specific rate. Nonlinear mapping can downscale high-dimensional data when the input and output dimensions of the residual cells do not coincide.
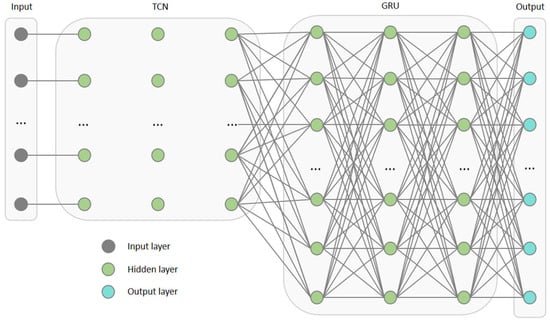
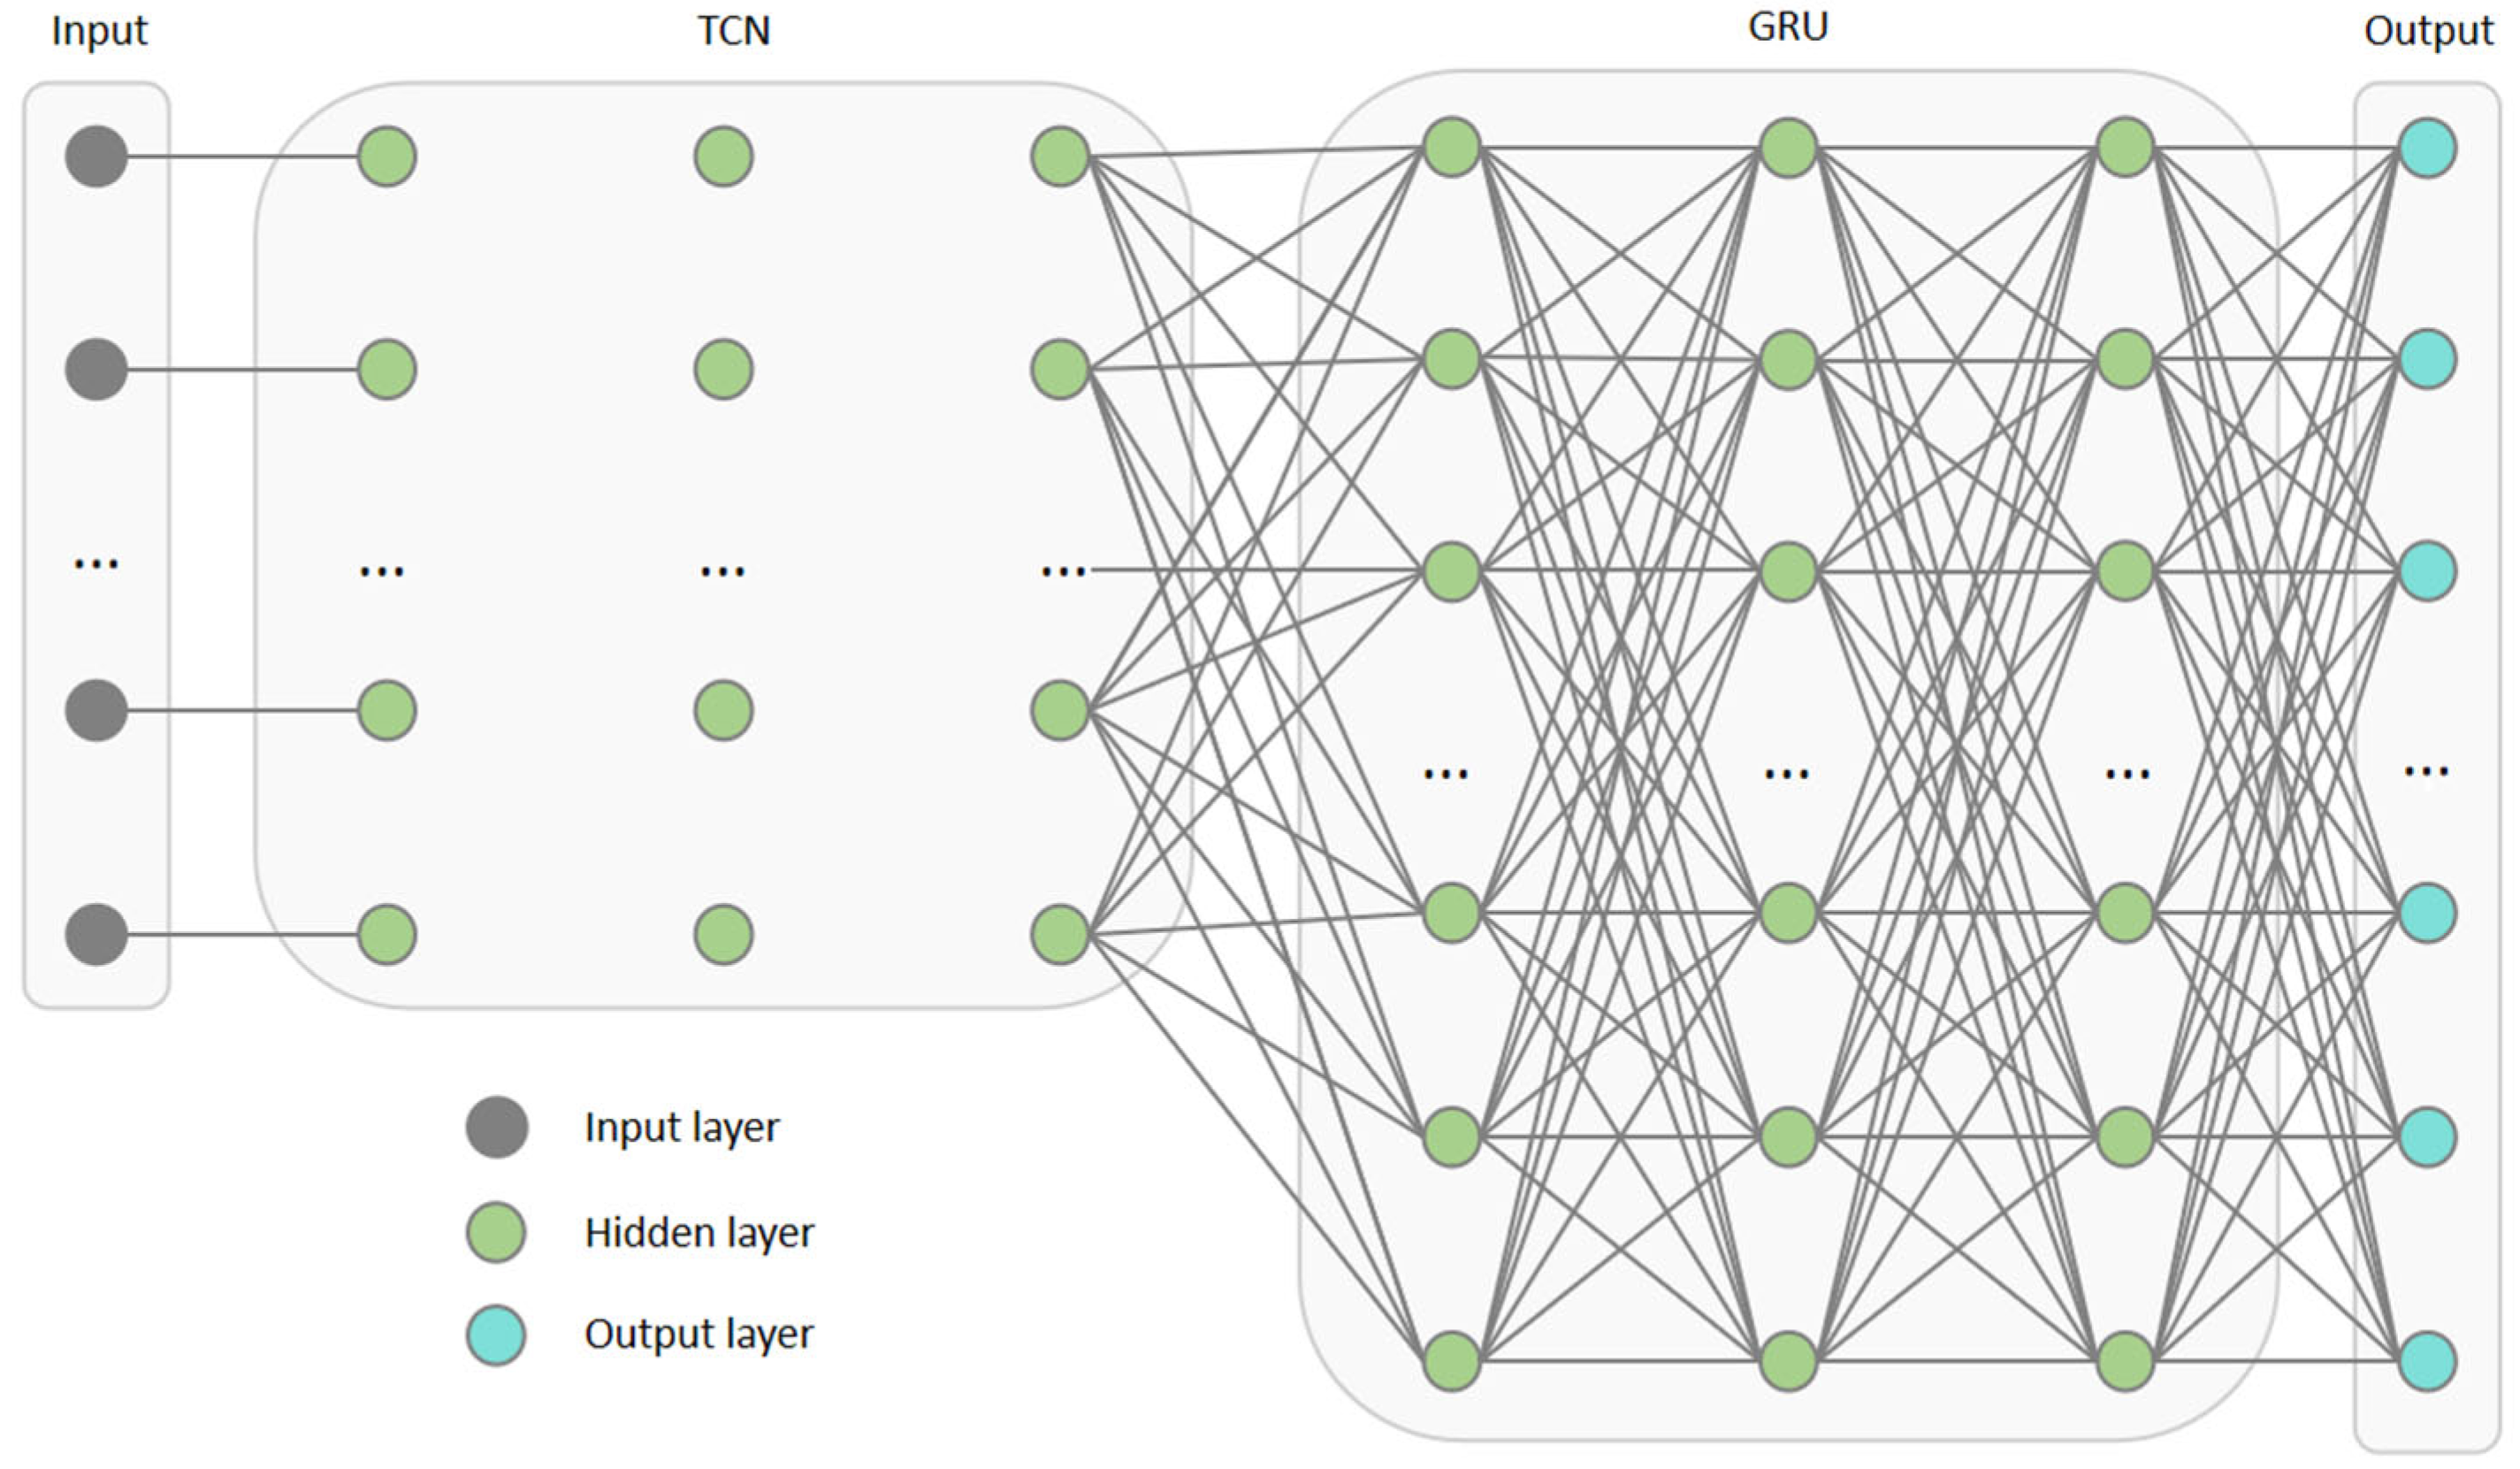
The proposed TCN-GRU model is a hybrid architecture that integrates a Temporal Convolutional Network (TCN) with a Gated Recurrent Unit (GRU) network. This integration leverages the TCN’s strength in capturing long-range dependencies and the GRU’s capability for dynamic temporal modeling, thereby enhancing overall data processing efficiency [43]. The architecture of the combined TCN-GRU model is illustrated in Figure 17.
Figure 17.
Structure of the TCN-GRU model.
In the temporal convolutional network (TCN), a two-layer residual unit is designed. Each residual unit incorporates two convolutional units and a nonlinear activation mapping. In the TCN-GRU model, the target point’s time-series settlement data is jointly processed with the time-series settlement data from four neighboring points as input variables. This design leverages information from surrounding points, thereby enhancing the model’s robustness against outliers and improving its ability to understand and predict settlement trends at the target point [44].
4.3. Model Parameters
The parameter settings for the LSTM, GRU, and TCN-GRU models used in this study were trained and evaluated on the same preprocessed dataset. The core experimental configurations are summarized in Table 6.
Table 6.
Model General Parameter Settings.
The LSTM model architecture consisted of a single LSTM layer with 64 hidden units, followed by a Dropout layer (rate = 0.2) to mitigate overfitting. The model was trained using the Adam optimizer to minimize the mean squared error (MSE) loss. Early stopping was implemented with a patience of 15 epochs on the validation loss, resulting in actual training durations of 80 to 120 epochs. Similarly, the GRU model comprised a single GRU layer with 64 hidden units and a subsequent fully connected output layer. A Dropout layer (rate = 0.2) was also applied after the GRU layer to ensure that performance differences were attributable to model architecture rather than regularization effects during training.
The TCN module within the TCN-GRU model contains two residual blocks. Each block consists of two causal convolutional layers, each with 128 filters. A kernel size of 3 was used for all convolutional layers. A dilation rate sequence of [1, 2, 4, 8] was employed, doubling at each subsequent layer. This exponentially expands the receptive field in the top layer, enabling effective capture of long-range temporal dependencies. The ReLU activation function was used throughout, with weight normalization applied after each convolution. Additionally, Dropout (rate = 0.4) was incorporated within the residual blocks. The GRU module consists of a single layer with 64 hidden units. It receives the 128-dimensional feature representations from the TCN module and maps them to a corresponding 64-dimensional hidden state.
Due to its greater architectural complexity, the TCN-GRU model converged more slowly; early stopping typically terminated training between 120 and 150 epochs. To ensure training stability and facilitate convergence, all model parameters were initialized using the He normal distribution. This initialization strategy is particularly compatible with the ReLU activations in the TCN module, helping to maintain healthy gradient flow in the early stages of training. Each model was trained for 10 independent runs, and the final prediction results reported are the average over these runs.
4.4. Model Training and Data Processing
We chose the settlement monitoring results from 16 March 2022 to 11 March 2024 at 12-day intervals as the experimental data, with the raw data denoted as M = {m1, m2, m3, …, mi, …, ms} and the data for each settlement point denoted as mi = {m1, m2, …, m3, …, mj, …, mt}. By processing the raw data M′ = {m1′, m2′, m3′, …, mi′, …, ms′}, the dataset was split into training and testing sets in an 8:2 ratio. Based on the number of training rounds of different models and the loss function, the relationship between the number of training rounds and the best fitness was determined. After model training, the predicted data Mp′ = {m1′, m2′, m3′, …, mi′, …, ms′} was used as input to generate the prediction result Np′ = {n1′, n2′, n3′, …, ni′, …, ns′}, which were then inverse-normalized to achieve the final prediction results for ground settlement, denoted as Np = {n1, n2, n3, …, ni, …, ns}.
Commonly used data processing techniques include data outlier processing and normalization. Since there will be anomalies in the data saved by the sensors, it is necessary to modify the anomalies to ensure that the time has continuity. This study adopts the 3σ principle to process the experimental data and discard the values of |vi| > 3σ, as shown in Equation (20) below.
The data normalization process, through the use of min-max departure normalization, allows the original data to be mapped to the range [0.0, 1.0], thereby mitigating the influence of varying magnitudes of different dimensional data on the model, minimizing prediction time, and improving model prediction accuracy. The specific reference formula is shown in Equation (21).
mj represents the jth value; mimax represents the maximum value of the time series data; and mi′ represents the normalized value.
4.5. Evaluation Indicators
To evaluate the forecasting capability of the model, we utilized evaluation metrics, namely the coefficient of determination (R2), root mean square error (MSE), and mean absolute error (MAE). Specifically, a higher R2, coupled with lower MSE and MAE values, indicates superior predictive capabilities of the model. The evaluation indices are shown in Equations (22)–(24).
m is the number of samples, yi is the monitoring truth value of SBAS-InSAR, and is the predicted value.
4.6. Predicted Results
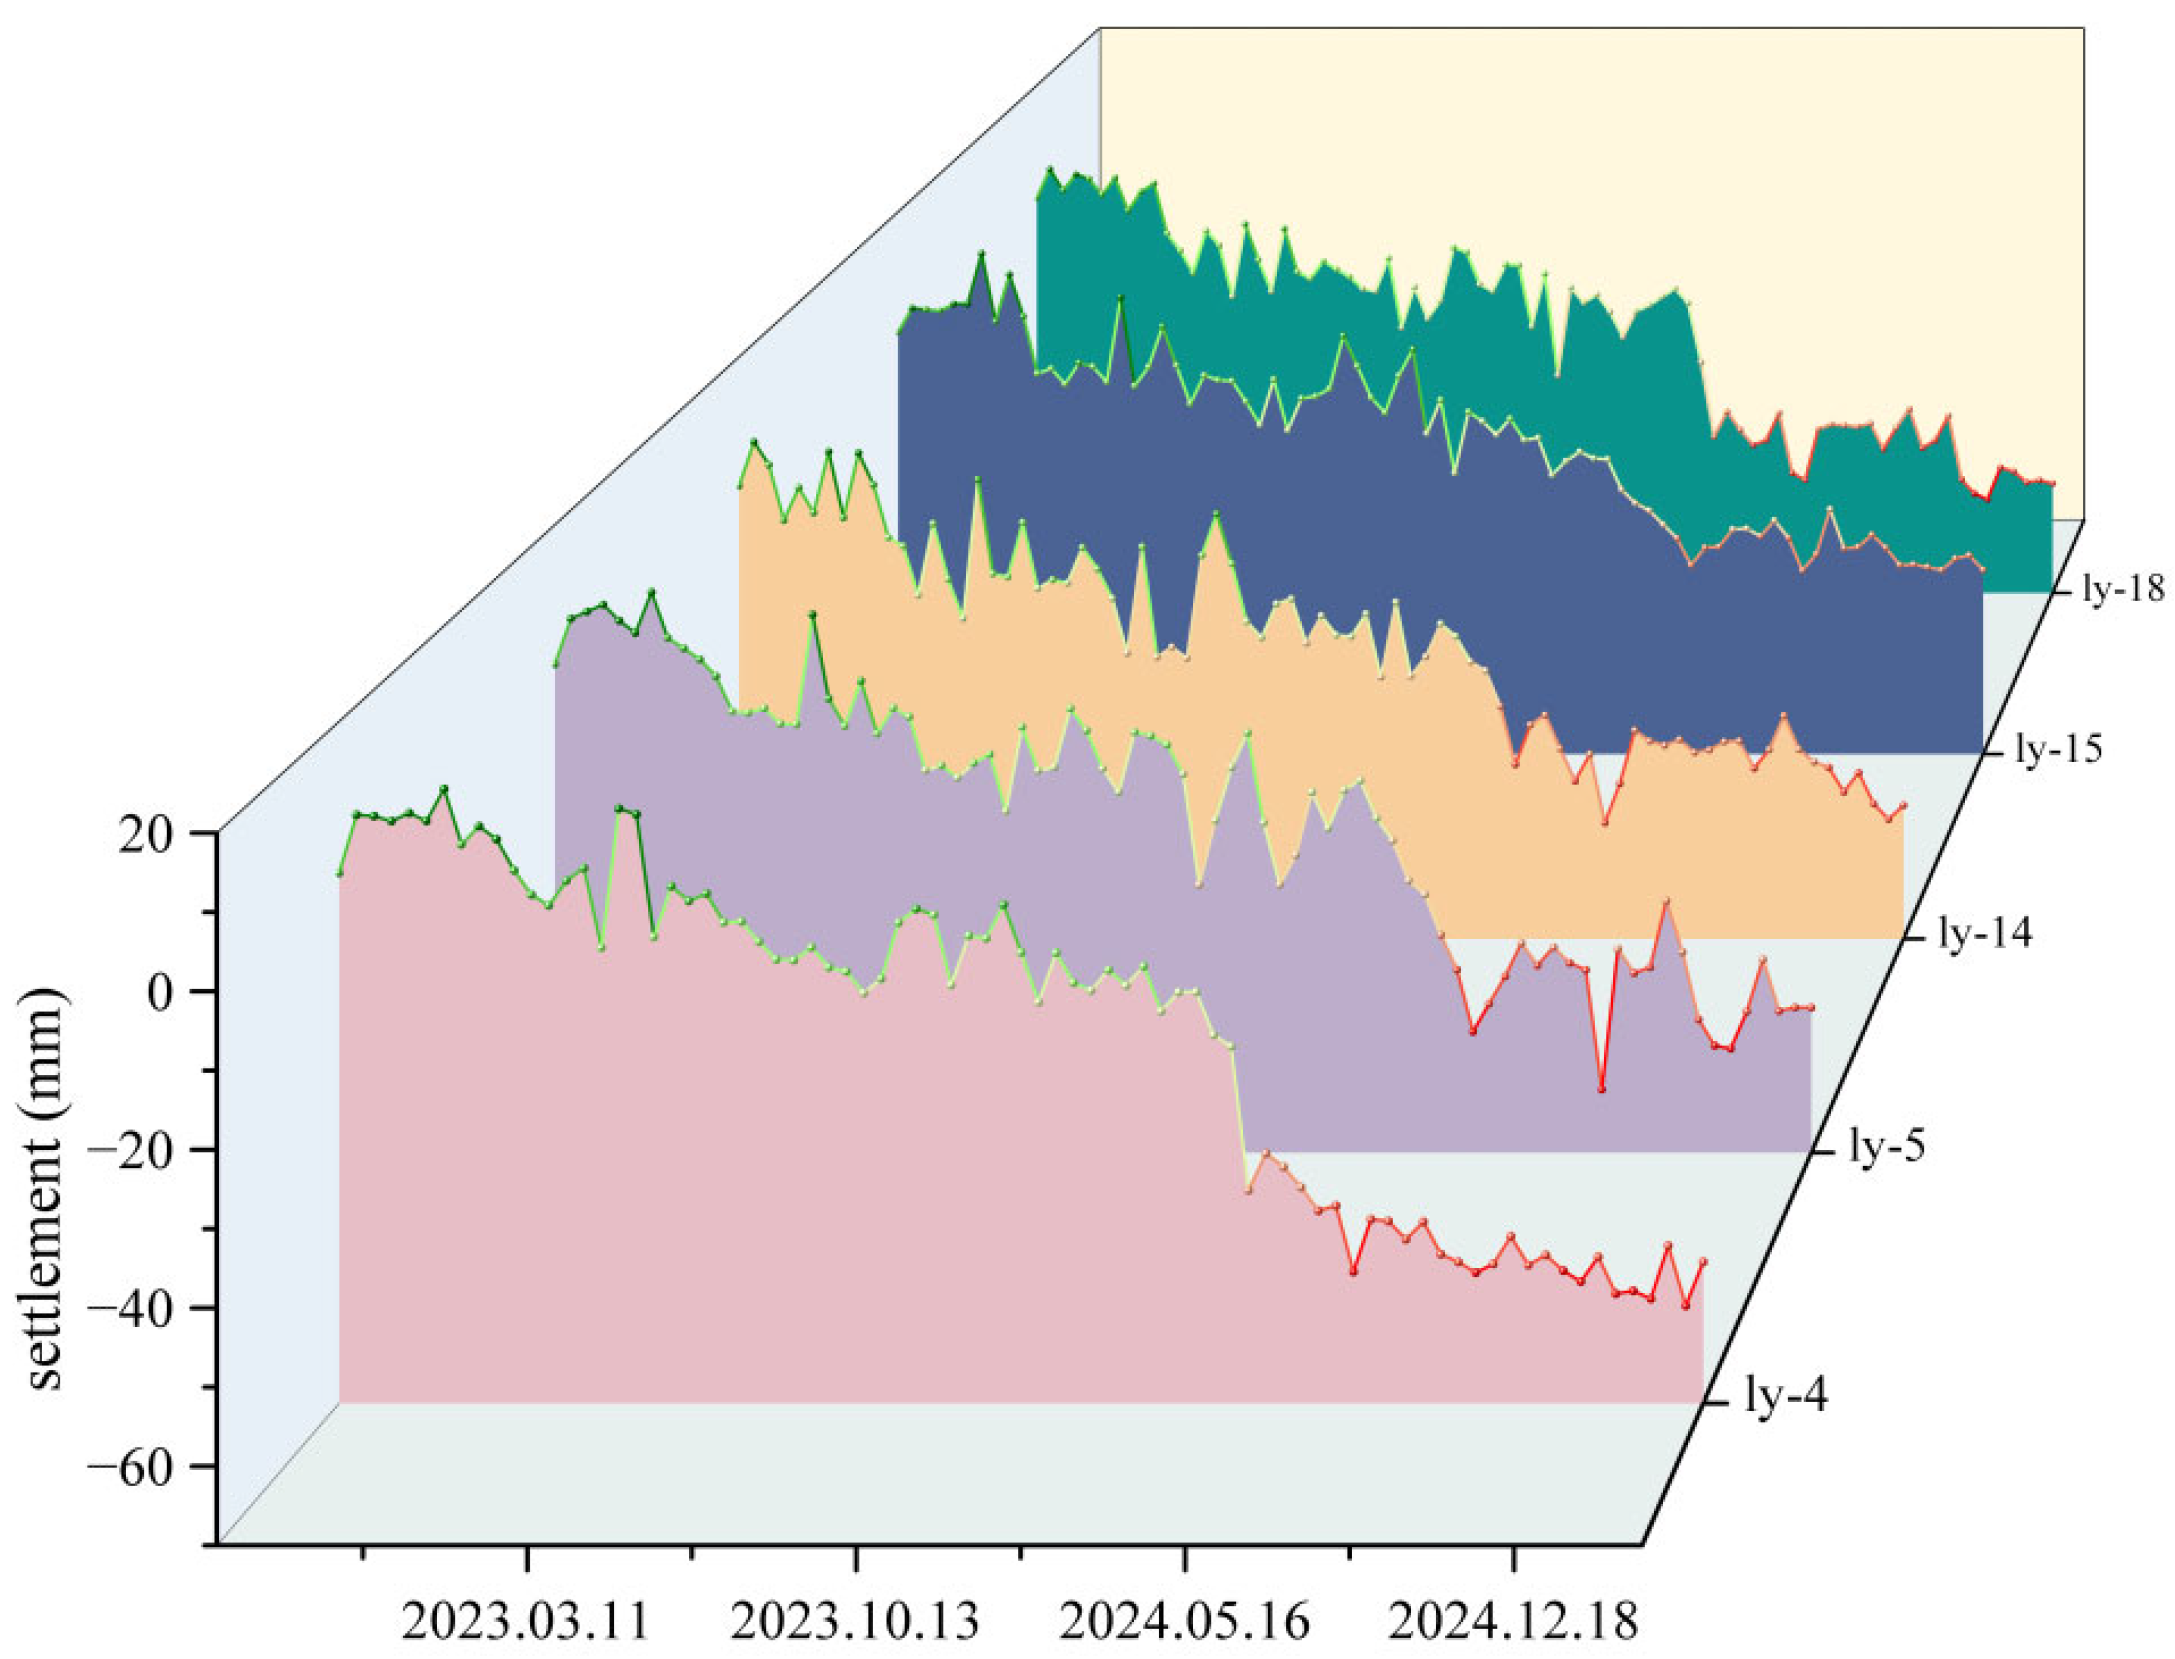
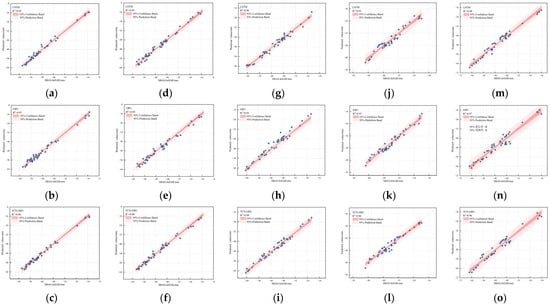
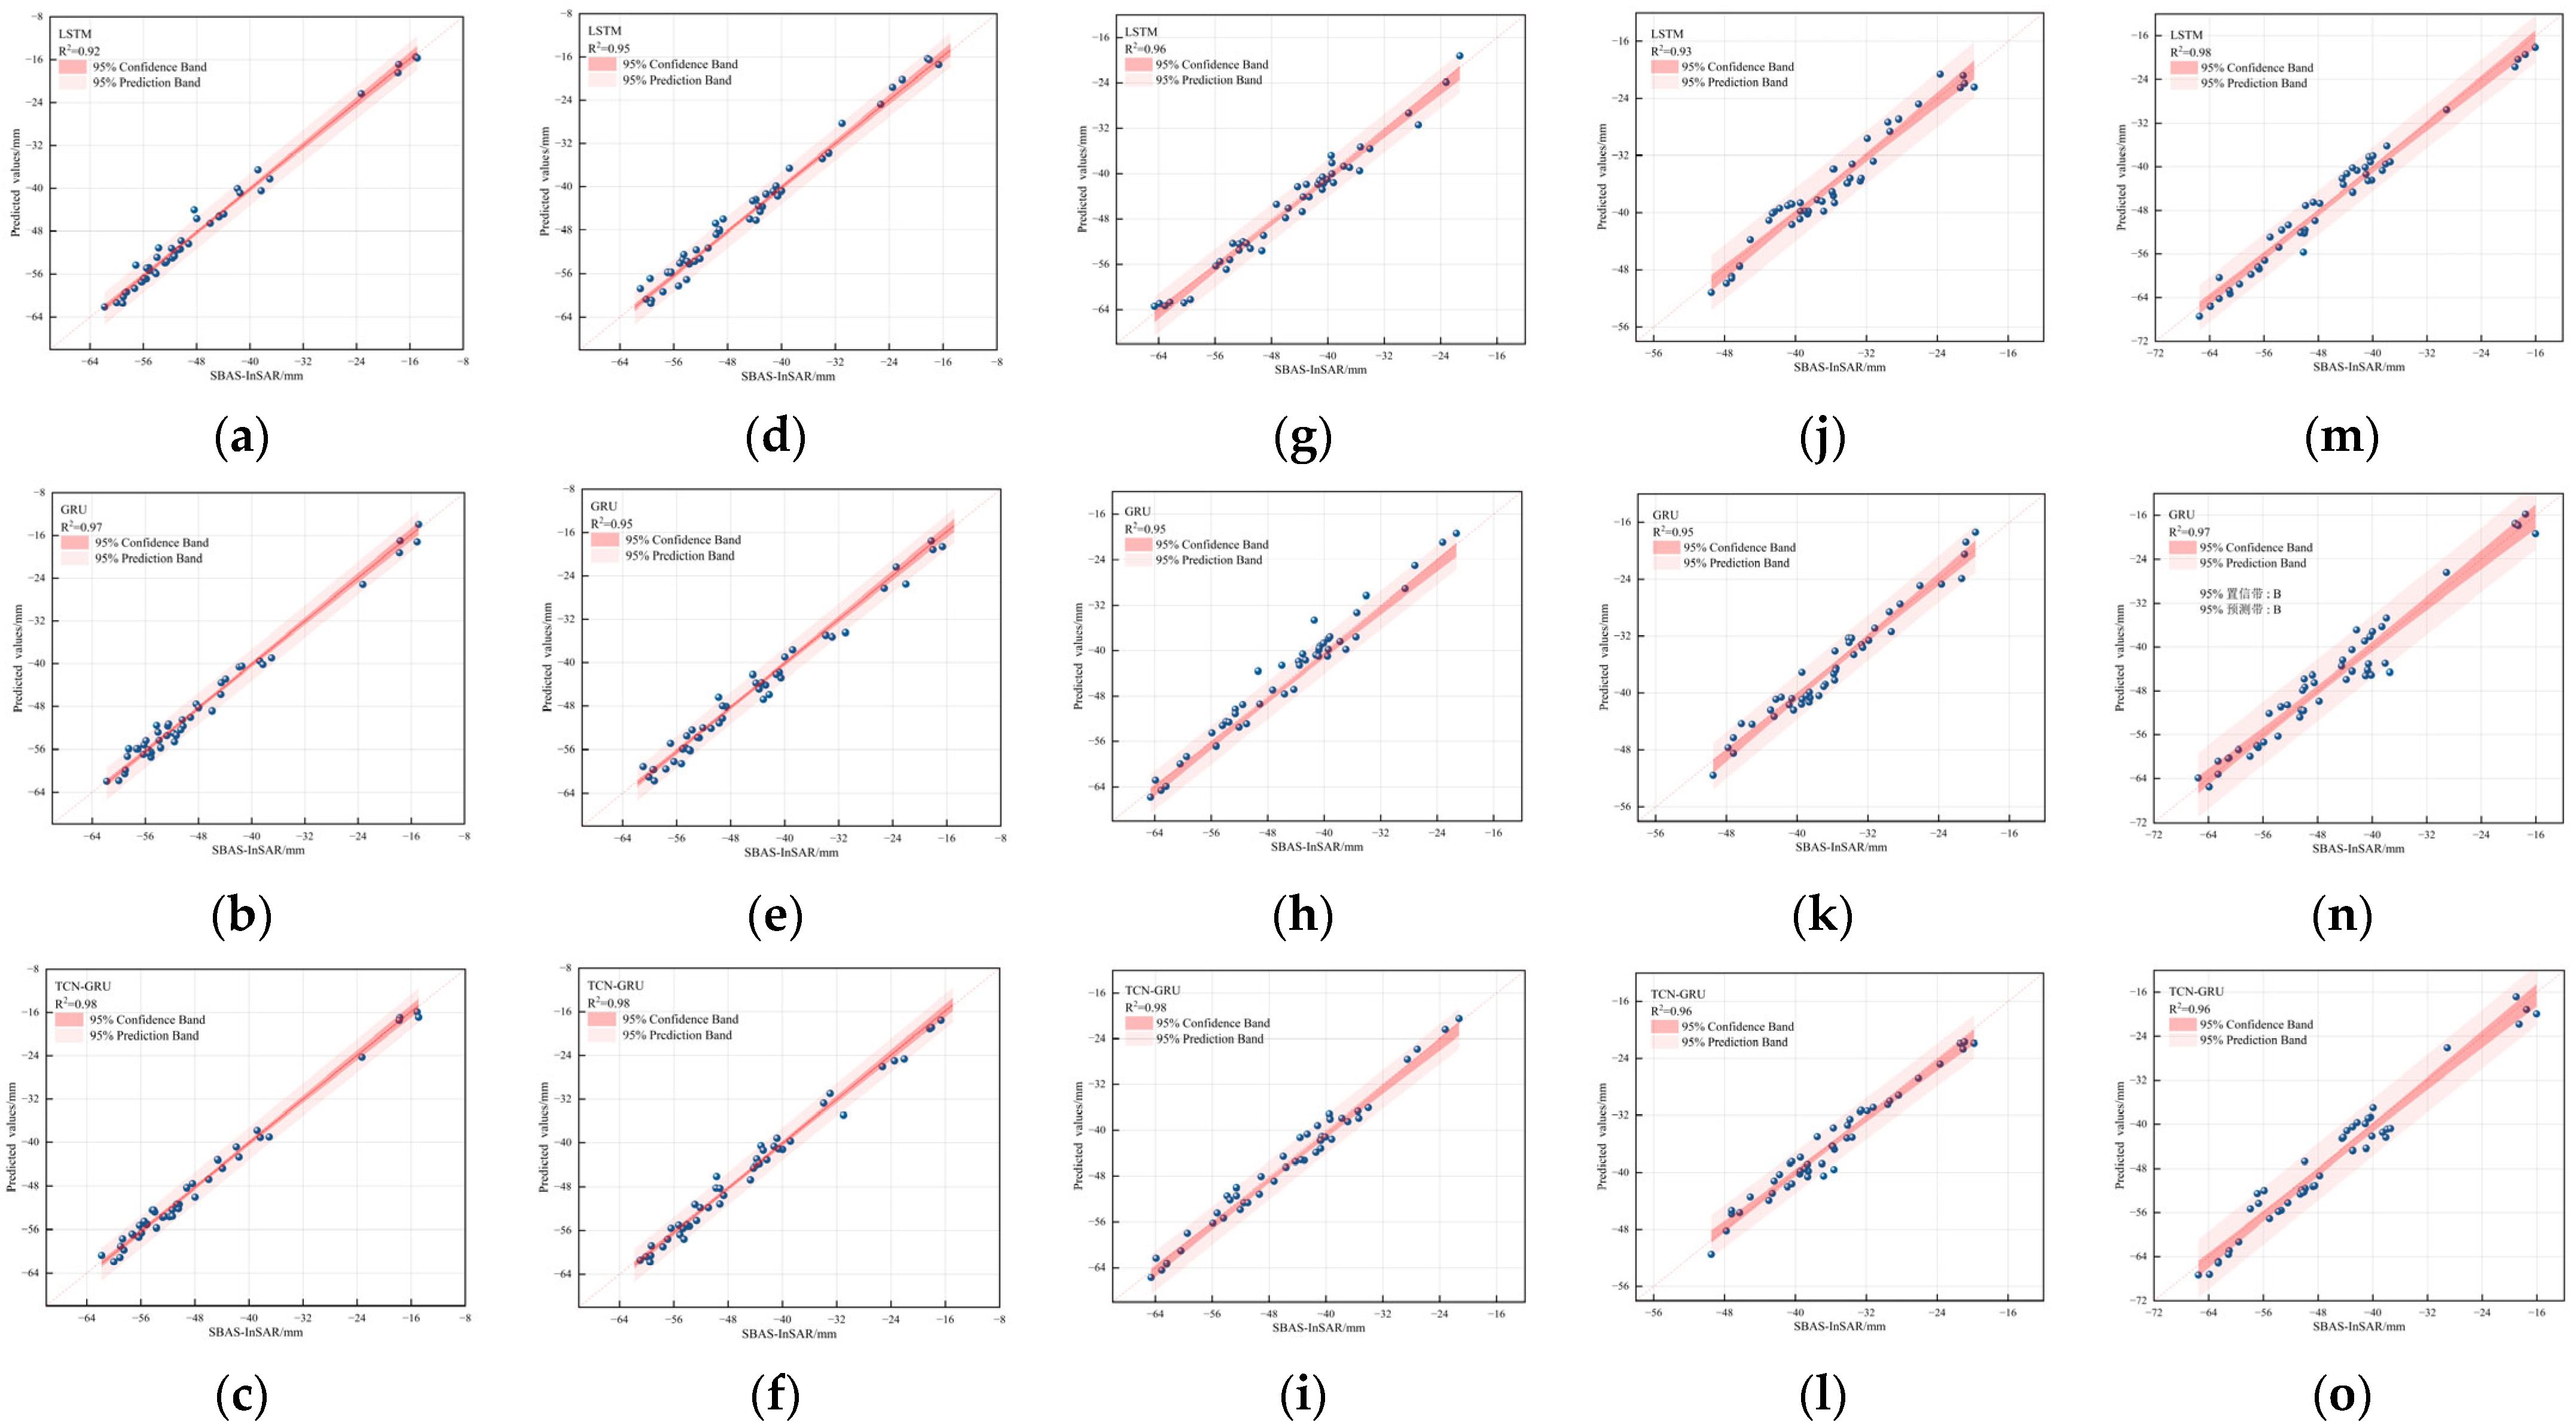
To validate the model’s reliability, predictions were generated using three distinct models—LSTM, GRU, and TCN-GRU—based on the trained models, yielding prediction results for each model. By selecting settlement monitoring data from 19 August 2022 to 11 March 2024 as model inputs, we generated predicted time-series data for five ground control points—ly-4, ly-5, ly-14, ly-15, and ly-18—from 11 March 2024 to 30 August 2025. This data was then compared with and analyzed against the monitoring results from SBAS-InSAR. As shown in the correlation analysis in Figure 18, the determination coefficients R2 for all three models exceeded 0.9. Combined with the time-series settlement plots of the ground control points (Figure 19) and the prediction accuracy table (Table 7), it is evident that all three models demonstrate good predictive performance. Comparing the three models indicates that the TCN-GRU model exhibits stronger learning capabilities when processing time-series data. This sufficiently demonstrates the feasibility of the TCN-GRU model for handling time-series settlement data.
Figure 18.
Correlation analysis of LSTM, GRU, and TCN-GRU models: (a–c) ly-4; (d–f) ly-5; (g–i) ly-14; (j–l) ly-15; (m–o) ly-18.
Figure 19.
Comparison and verification of ground control point sequential settlement and predicted settlement: (a) ly-4; (b) ly-5; (c) ly-14; (d) ly-15; (e) ly-18.
Table 7.
Predictive accuracy.
TCN-GRU exhibits the smallest MAE (1.22–1.28 mm) and MSE (2.68–6.50 mm2) among the three models at most points, with a narrower corresponding error range. Prediction data points for all three models are concentrated within the 95% confidence band and prediction band. Among them, TCN-GRU exhibits a narrower confidence band width and higher data point conformity to the fitted line, indicating lower prediction uncertainty and greater reliability. Figure 19 shows that during spring, settlement increases rapidly. Given that the study area primarily features residual settlement terrain, the settlement remains largely stable. This phenomenon is likely primarily caused by thaw settlement.
5. Conclusions
This study applied SBAS-InSAR techniques to Sentinel-1 data covering the Liaoyuan Northern New District, successfully monitoring ground subsidence from 19 August 2022 to 12 March 2025. The SBAS-InSAR results were validated against UAV-derived measurements to ensure accuracy. Three deep learning models—LSTM, GRU, and TCN-GRU—were employed. These models were trained and validated using monitoring data from 19 August 2022 to 11 March 2024, and subsequently applied to predict surface subsidence from 11 March 2024 to 30 August 2025.
The main findings of this study are as follows:
- (1)
- The recent ground deformation rate in the Liaoyuan Northern New District ranged from −26.80 mm/year to 13.12 mm/year. Most areas have entered a terminal subsidence phase, with settlement trends stabilizing.
- (2)
- The integration of UAV monitoring data for ground control point verification confirmed SBAS-InSAR as an accurate and high-precision technique for subsidence monitoring.
- (3)
- The proposed TCN-GRU model achieved optimal performance in predicting the settlement time series. By integrating local feature extraction via temporal convolutions with the long-term dependency modeling of gated recurrent units, it demonstrated superior fitting and predictive accuracy compared to the standalone LSTM and GRU models.
- (4)
- The study results are based on single-track SAR data (descending orbit) processing, reflecting one-dimensional deformation along the radar line-of-sight. In areas with significant non-vertical motion, this may lead to misjudgments in deformation direction or magnitude deviations. The model demonstrated good performance within the training period. As subsidence mechanisms may evolve over time, the model requires updating and calibration when applied beyond the training data timeframe. The predictive model developed in this study is suitable for post-mining subsidence-stable regions. When applied to other mining areas, it must be retrained and learned based on local conditions. The model’s predictions are highly reliable for trend identification. However, when making absolute millimeter-level determinations, the combined effects of the model and monitoring technology uncertainties must be fully considered.
In summary, this study conducted comprehensive monitoring and predictive analysis in the Liaoyuan Northern New District. The results validate the TCN-GRU model’s strong potential for application in ground subsidence prediction.
Author Contributions
Conceptualization, M.L. and Z.W.; methodology, M.L.; software, M.L. and J.H.; validation, M.L.; formal analysis, M.L.; investigation, M.L.; resources, M.L.; data curation, M.L.; writing—original draft preparation, M.L. and H.L.; writing—review and editing, Y.Z.; visualization, M.L.; supervision, J.Z.; project administration, Y.Z.; funding acquisition, Y.Z. All authors have read and agreed to the published version of the manuscript.
Funding
This research received no external funding.
Data Availability Statement
The original contributions presented in this study are included in the article. Further inquiries can be directed to the corresponding author.
Acknowledgments
During the final stages of manuscript preparation, generative AI tools (GPT-4) were utilized to assist with text refinement and linguistic expression optimization, enhancing the clarity and fluency of the document. Special thanks also go to Wu Chenyang from Jilin University for his guidance on the grammar and logic of this article. The core academic ideas, research design, data analysis, interpretation of results, and conclusions were independently completed by the author. AI tools did not participate in any creative research work.
Conflicts of Interest
The authors declare no conflicts of interest.
References
- Li, Q.; Zhang, W.; Wang, D. Current Status, Challenges and Policy Recommendations Regarding the Sustainable Development of Mining Areas in China. J. Resour. Ecol. 2014, 5, 42–52. [Google Scholar] [CrossRef] [Scilit]
- Vyazmensky, A.; Elmo, D.; Stead, D. Role of Rock Mass Fabric and Faulting in the Development of Block Caving Induced Surface Subsidence. Rock Mech. Rock Eng. 2009, 43, 533–556. [Google Scholar] [CrossRef] [Scilit]
- Franczyk, A.; Bała, J.; Dwornik, M. Monitoring Subsidence Area with the Use of Satellite Radar Images and Deep Transfer Learning. Sensors 2022, 22, 7931. [Google Scholar] [CrossRef] [Scilit] [PubMed]
- Zheng, M.; Deng, K.; Fan, H.; Du, S. Monitoring and Analysis of Surface Deformation in Mining Area Based on InSAR and GRACE. Remote Sens. 2018, 10, 1392. [Google Scholar] [CrossRef] [Scilit]
- Tao, W.; Dai, L.; Zhang, Z.; Tang, B.; Yu, L.; Sun, G. Stability Analysis Model of Expressway Passing through Goaf Based on SBAS-InSAR Technology. Math. Probl. Eng. 2022, 2022, 7006464. [Google Scholar] [CrossRef] [Scilit]
- Yu, H.; Hu, X. Knowledge-Aided InSAR Phase Unwrapping Approach. IEEE Trans. Geosci. Remote Sens. 2022, 60, 5209508. [Google Scholar] [CrossRef] [Scilit]
- Zhao, J.; Yang, X.; Zhang, Z.; Niu, Y.; Zhao, Z. Mine Subsidence Monitoring Integrating DS-InSAR with UAV Photogrammetry Products: Case Studies on Hebei and Inner Mongolia. Remote Sens. 2023, 15, 4998. [Google Scholar] [CrossRef] [Scilit]
- Przyłucka, M.; Herrera, G.; Graniczny, M.; Colombo, D.; Béjar-Pizarro, M. Combination of Conventional and Advanced DInSAR to Monitor Very Fast Mining Subsidence with TerraSAR-X Data: Bytom City (Poland). Remote Sens. 2015, 7, 5300–5328. [Google Scholar] [CrossRef] [Scilit]
- Berardino, P.; Fornaro, G.; Lanari, R.; Sansosti, E. A new algorithm for surface deformation monitoring based on small baseline differential SAR interferograms. IEEE Trans. Geosci. Remote Sens. 2002, 40, 2375–2383. [Google Scholar] [CrossRef] [Scilit]
- Parizzi, A.; Brcic, R.; De Zan, F. InSAR Performance for Large-Scale Deformation Measurement. IEEE Trans. Geosci. Remote Sens. 2021, 59, 8510–8520. [Google Scholar] [CrossRef] [Scilit]
- Wang, H.; Li, K.; Zhang, J.; Hong, L.; Chi, H. Monitoring and Analysis of Ground Surface Settlement in Mining Clusters by SBAS-InSAR Technology. Sensors 2022, 22, 3711. [Google Scholar] [CrossRef] [Scilit]
- Wang, R.; Feng, Y.; Tong, X.; Li, P.; Wang, J.; Tang, P.; Tang, X.; Xi, M.; Zhou, Y. Large-Scale Surface Deformation Monitoring Using SBAS-InSAR and Intelligent Prediction in Typical Cities of Yangtze River Delta. Remote Sens. 2023, 15, 4942. [Google Scholar] [CrossRef] [Scilit]
- Wu, J.; Zhu, Q.; Qiao, N.; Wang, Z.; Sha, W.; Luo, K.; Wang, H.; Feng, Z. Ecological Risk Assessment of Coal Mine Area Based on “Source-Sink” Landscape Theory—A Case Study of Pingshuo Mining Area. J. Clean. Prod. 2021, 295, 126371. [Google Scholar] [CrossRef] [Scilit]
- Wang, Y.; Cui, X.; Che, Y.; Zhao, Y.; Li, P.; Kang, X.; Jiang, Y. Near Real-Time Monitoring of Large Gradient Nonlinear Subsidence in Mining Areas: A Hybrid SBAS-InSAR Method Integrating Robust Sequential Adjustment and Deep Learning. Remote Sens. 2024, 16, 1664. [Google Scholar] [CrossRef] [Scilit]
- Tang, L.; Na, S. Comparison of machine learning methods for ground settlement prediction with different tunneling datasets. J. Rock Mech. Geotech. Eng. 2021, 13, 1274–1289. [Google Scholar] [CrossRef] [Scilit]
- Stegmann, U.E. Physical models and embodied cognition. Synthese 2018, 197, 4387–4405. [Google Scholar] [CrossRef] [Scilit]
- Yang, Y.; Fan, W.; Long, L.; Xu, Z.; Zhao, Z.; Zhang, H. Application of the Richards Model in Settlement Prediction of Loess-Filled Foundations. Appl. Sci. 2022, 12, 11350. [Google Scholar] [CrossRef] [Scilit]
- Hewamalage, H.; Bergmeir, C.; Bandara, K. Recurrent Neural Networks for Time Series Forecasting: Current status and future directions. Int. J. Forecast. 2021, 37, 388–427. [Google Scholar] [CrossRef] [Scilit]
- Guo, H.; Hao, A.; Li, W.; Zang, X.; Wang, Y.; Zhu, J.; Wang, L.; Chen, Y. Land subsidence and its affecting factors in Cangzhou, North China Plain. North China Plain. Front. Environ. Sci. 2022, 10, 1053362. [Google Scholar] [CrossRef] [Scilit]
- Li, J.; Zang, M.; Xu, N.; Mei, G.; Yang, S. An Interferometric-Synthetic-Aperture-Radar-Based Method for Predicting Long-Term Land Subsidence in Goafs Through the Concatenation of Multiple Sources of Short-Term Monitoring Data. Remote Sens. 2023, 15, 4203. [Google Scholar] [CrossRef] [Scilit]
- Hu, D.; Hu, Y.; Yi, S.; Liang, X.; Li, Y.; Yang, X. Prediction method of surface settlement of rectangular pipe jacking tunnel based on improved PSO-BP neural network. Sci. Rep. 2023, 13, 5512. [Google Scholar] [CrossRef] [Scilit]
- Wang, Y.; Chen, X.; Wang, Z.; Gao, M.; Wang, L. Integrating SBAS-InSAR and Random Forest for Identifying and Controlling Land Subsidence and Uplift in a Multi-Layered Porous System of North China Plain. Remote Sens. 2024, 16, 830. [Google Scholar] [CrossRef] [Scilit]
- Zhou, D.; Zuo, X.; Zhao, Z. Constructing a Large-Scale Urban Land Subsidence Prediction Method Based on Neural Network Algorithm from the Perspective of Multiple Factors. Remote Sens. 2022, 14, 1803. [Google Scholar] [CrossRef] [Scilit]
- Dang, X.; Yin, X.; Liu, J.; Wu, J.; Wang, X.; Liu, Y.; Sun, S. Subway track foundation settlement deformation prediction based on the BiLSTM-AdaBoost model. Eng. Res. Express 2024, 6, 025116. [Google Scholar] [CrossRef] [Scilit]
- Kanmani, D.S.; Sujitha, B.; Subalakshmi, K.; Umamaheswari, S.; Reddy, K.P.S.T. Off-Line and Online Handwritten Character Recognition Using RNN-GRU Algorithm. Int. J. Res. Appl. Sci. Eng. Technol. 2023, 11, 2518–2526. [Google Scholar] [CrossRef] [Scilit]
- Liu, Y.; Zhang, J. Integrating SBAS-InSAR and AT-LSTM for Time-Series Analysis and Prediction Method of Ground Subsidence in Mining Areas. Remote Sens. 2023, 15, 3409. [Google Scholar] [CrossRef] [Scilit]
- Tariq, M.U.; Zhu, S.; Qin, Y.; Meng, X.; Xie, L.; Zhang, Y.; Yuan, Y. Prediction model of land surface settlement deformation based on improved LSTM method: CEEMDAN-ICA-AM-LSTM (CIAL) prediction model. PLoS ONE 2024, 19, e0298524. [Google Scholar]
- Cai, Y.; Jin, Y.; Wang, Z.; Chen, T.; Wang, Y.; Kong, W.; Xiao, W.; Li, X.; Lian, X.; Hu, H. A review of monitoring, calculation, and simulation methods for ground subsidence induced by coal mining. Int. J. Coal Sci. Technol. 2023, 10, 32. [Google Scholar] [CrossRef] [Scilit]
- Lian, X.; Shi, L.; Kong, W.; Han, Y.; Fan, H. Residual subsidence time series model in mountain area caused by underground mining based on GNSS online monitoring. Int. J. Coal Sci. Technol. 2024, 11, 27. [Google Scholar] [CrossRef] [Scilit]
- Guo, Q.; Meng, X.; Li, Y.; Lv, X.; Liu, C. A prediction model for the surface residual subsidence in an abandoned goaf for sustainable development of resource-exhausted cities. J. Clean. Prod. 2021, 279, 123803. [Google Scholar] [CrossRef] [Scilit]
- Modeste, G.; Doubre, C.; Masson, F. Time evolution of mining-related residual subsidence monitored over a 24-year period using InSAR in southern Alsace, France. Int. J. Appl. Earth Obs. Geoinf. 2021, 102, 102392. [Google Scholar] [CrossRef] [Scilit]
- Hasan, M.F.; Smith, R.; Vajedian, S.; Pommerenke, R.; Majumdar, S. Global land subsidence mapping reveals widespread loss of aquifer storage capacity. Nat. Commun. 2023, 14, 6180. [Google Scholar] [CrossRef] [Scilit]
- Minderhoud, P.S.J.; Coumou, L.; Erban, L.E.; Middelkoop, H.; Stouthamer, E.; Addink, E.A. The relation between land use and subsidence in the Vietnamese Mekong delta. Sci. Total Environ. 2018, 634, 715–726. [Google Scholar] [CrossRef] [Scilit] [PubMed]
- Zhang, G.; Xu, Z.; Chen, Z.; Wang, S.; Cui, H.; Zheng, Y. Predictable Condition Analysis and Prediction Method of SBAS-InSAR Coal Mining Subsidence. IEEE Trans. Geosci. Remote Sens. 2022, 60, 5232914. [Google Scholar] [CrossRef] [Scilit]
- Dogani, J.; Khunjush, F.; Mahmoudi, M.R.; Seydali, M. Multivariate workload and resource prediction in cloud computing using CNN and GRU by attention mechanism. J. Supercomput. 2022, 79, 3437–3470. [Google Scholar] [CrossRef] [Scilit]
- Jiang, J.; Ding, L.; Zhou, Y.; Zhang, H. Differential Settlement of Track Foundations Identification Based on GRU Neural Network. Remote Sens. 2023, 15, 2378. [Google Scholar] [CrossRef] [Scilit]
- Fu, K.; Li, H.; Deng, P. Chaotic time series prediction using DTIGNet based on improved temporal-inception and GRU. Chaos Solitons Fractals 2022, 159, 112183. [Google Scholar] [CrossRef] [Scilit]
- Fan, J.; Zhang, K.; Huang, Y.; Zhu, Y.; Chen, B. Parallel spatio-temporal attention-based TCN for multivariate time series prediction. Neural Comput. Appl. 2021, 35, 13109–13118. [Google Scholar] [CrossRef] [Scilit]
- Yang, W.; Xia, K.; Fan, S. Oil Logging Reservoir Recognition Based on TCN and SA-BiLSTM Deep Learning Method. Eng. Appl. Artif. Intell. 2023, 121, 105950. [Google Scholar] [CrossRef] [Scilit]
- Qin, W.; Wei, P.; Peng, T.; Shu, H.; Zhao, Z. Enhanced multi-scale TCN ensemble for component chain prediction using evolutionary algorithms. Expert Syst. Appl. 2026, 298, 129824. [Google Scholar] [CrossRef] [Scilit]
- Lian, J.J.; Chen, H.; Ouyang, K.; Zhang, Y.; Zhong, R.; Chen, H. Twisted convolutional networks (TCNs): Enhancing feature interactions for non-spatial data classification. Neural Netw. 2026, 197, 108451. [Google Scholar] [CrossRef] [Scilit]
- Hansun, S.; Wicaksana, A.; Khaliq, A.Q.M. Multivariate cryptocurrency prediction: Comparative analysis of three recurrent neural networks approaches. J. Big Data 2022, 9, 50. [Google Scholar] [CrossRef] [Scilit]
- Liu, X.; Lin, Z.; Feng, Z. Short-term offshore wind speed forecast by seasonal ARIMA—A comparison against GRU and LSTM. Energy 2021, 227, 120492. [Google Scholar] [CrossRef] [Scilit]
- Zhou, S.; Song, C.; Wang, T.; Pan, X.; Chang, W.; Yang, L. A Short-Term Hybrid TCN-GRU Prediction Model of Bike-Sharing Demand Based on Travel Characteristics Mining. Entropy 2022, 24, 1193. [Google Scholar] [CrossRef] [Scilit] [PubMed]



Disclaimer/Publisher’s Note: The statements, opinions and data contained in all publications are solely those of the individual author(s) and contributor(s) and not of MDPI and/or the editor(s). MDPI and/or the editor(s) disclaim responsibility for any injury to people or property resulting from any ideas, methods, instructions or products referred to in the content. |
© 2026 by the authors. Licensee MDPI, Basel, Switzerland. This article is an open access article distributed under the terms and conditions of the Creative Commons Attribution (CC BY) license.