


Abstract
Cotton, a globally significant crop grown in over 100 countries, sustains a $40 billion market and provides employment for over 350 million people worldwide. However, plastic contamination remains a persistent challenge within the industry, degrading cotton fiber quality and disrupting ginning. Manual inspection and optical machine-vision systems struggle when plastic fragments are concealed by fibers or lack sufficient color contrast. To address these challenges, we developed an ultrasonic phased-array imaging system operating at 40 kHz under field-programmable gate array (FPGA) control. Transmitter elements emit pulsed ultrasound along radial paths, separate reflection receivers record echo amplitudes to form acoustic images, and a set of transmission receivers captures signal attenuation, which is overlaid onto the reflection-based image to highlight potential contaminants. In preliminary laboratory-based tests on both seed cotton and lint samples, the system successfully detected visually obscured plastic fragments as small as with an angular resolution limit of . Distinct reflection peaks and corresponding attenuation overlays were produced across the field of view, validating the system’s detection capabilities. These results demonstrate the feasibility of using ultrasonic imaging to reveal concealed plastics in cotton processing. Integrating this approach with existing optical methods could enhance contaminant-removal workflows and improve overall fiber quality and processing efficiency.
1. Introduction
Cotton (Gossypium spp.) is an important cash crop with an annual economic impact of at least $600 billion globally [1]. Sustaining an estimated $40 billion market and providing employment for over 350 million people worldwide, it remains a foundational pillar of the global agricultural economy [2]. The highest-value product from the plant is its lint, which is used as raw material in the textile industry. An important stage in the preparation of lint for use in textile manufacturing is ginning, wherein cotton fibers are separated from their seeds. After the seeds have been removed, the lint undergoes further processing. During each stage in processing, the cotton is often contaminated with both organic and inorganic extraneous matter that reduces both cotton quality and processing efficiency [3,4]. Plastic, primarily polyethylene, has been a major contaminant of concern for the cotton and textile industries. Plastic contamination sources include seed cotton module covers, free-floating plastic shopping bags near cotton field edges adjoining major roads and residential areas, and mulch films. These plastic contaminants manifest in the fiber in a variety of shapes, sizes, and colors [5,6].
Plastic contaminants are unique when compared to other contaminants in that they cannot be dyed or spun during processing [7]. Therefore, they present a disproportionate risk to the textile industry and are notably more challenging to isolate and remove. Plastics that are not removed from the fibers during the ginning process can end up in finished yarn and fabric products, leading to end products that are either unsellable or severely devalued [8]. Since plastic is the most common source of contamination, industries that rely on fiber yield quality have been motivated over recent decades to investigate solutions for its detection and removal [9,10].
As summarized in a review by Adeleke [11], mitigation strategies have been implemented at multiple stages of the cotton supply chain to address plastic contamination. In-field measures focus on prevention—such as training programs for growers and equipment operators, rigorous field maintenance practices, and the use of unmanned aerial vehicles (UAVs) to survey large cotton fields—aiming to reduce the volume of plastic extraneous matter that enters the cotton during harvesting [12,13,14,15,16]. However, these preventive approaches cannot entirely eliminate plastic contamination.
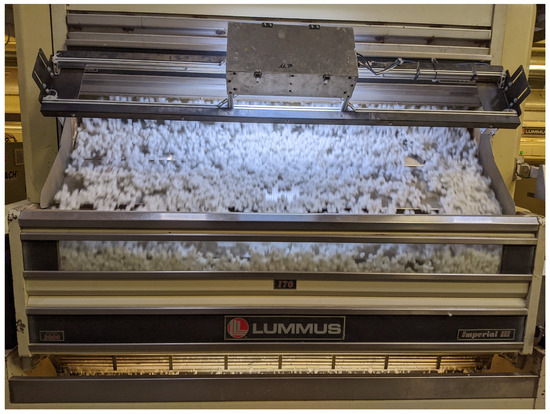
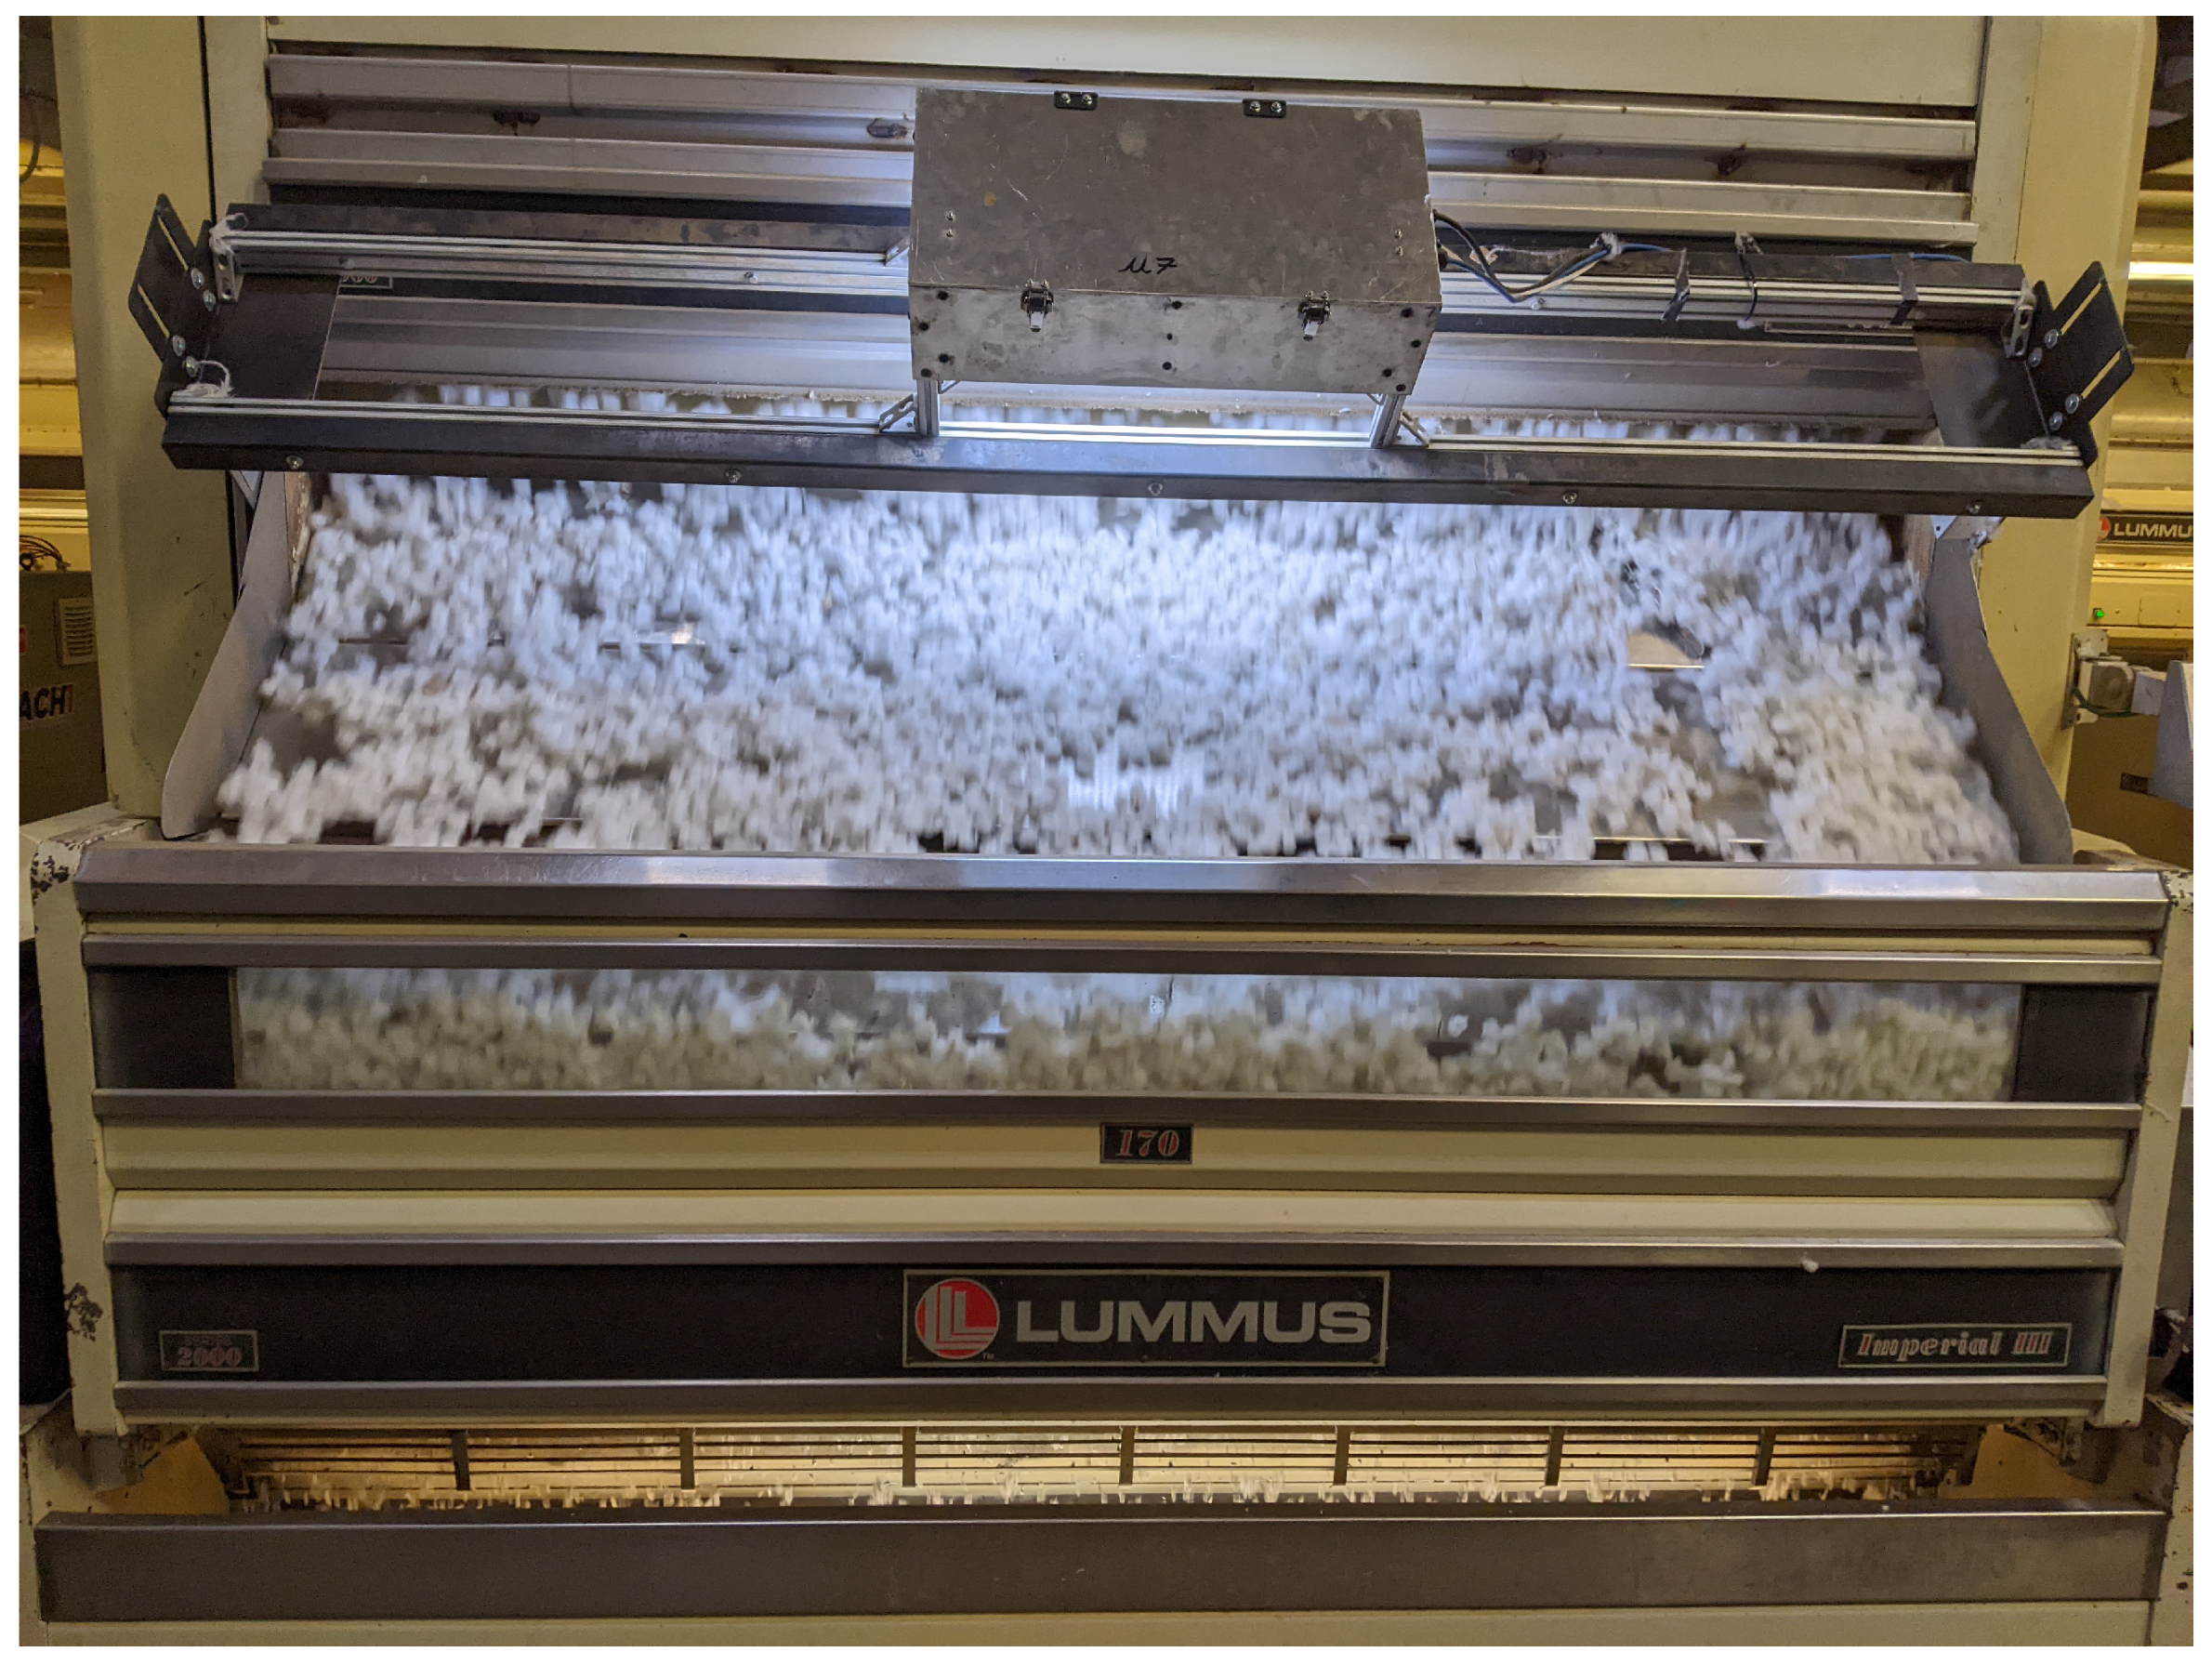
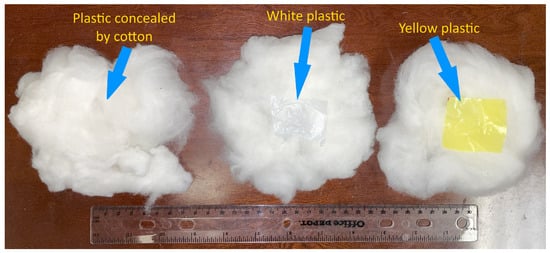
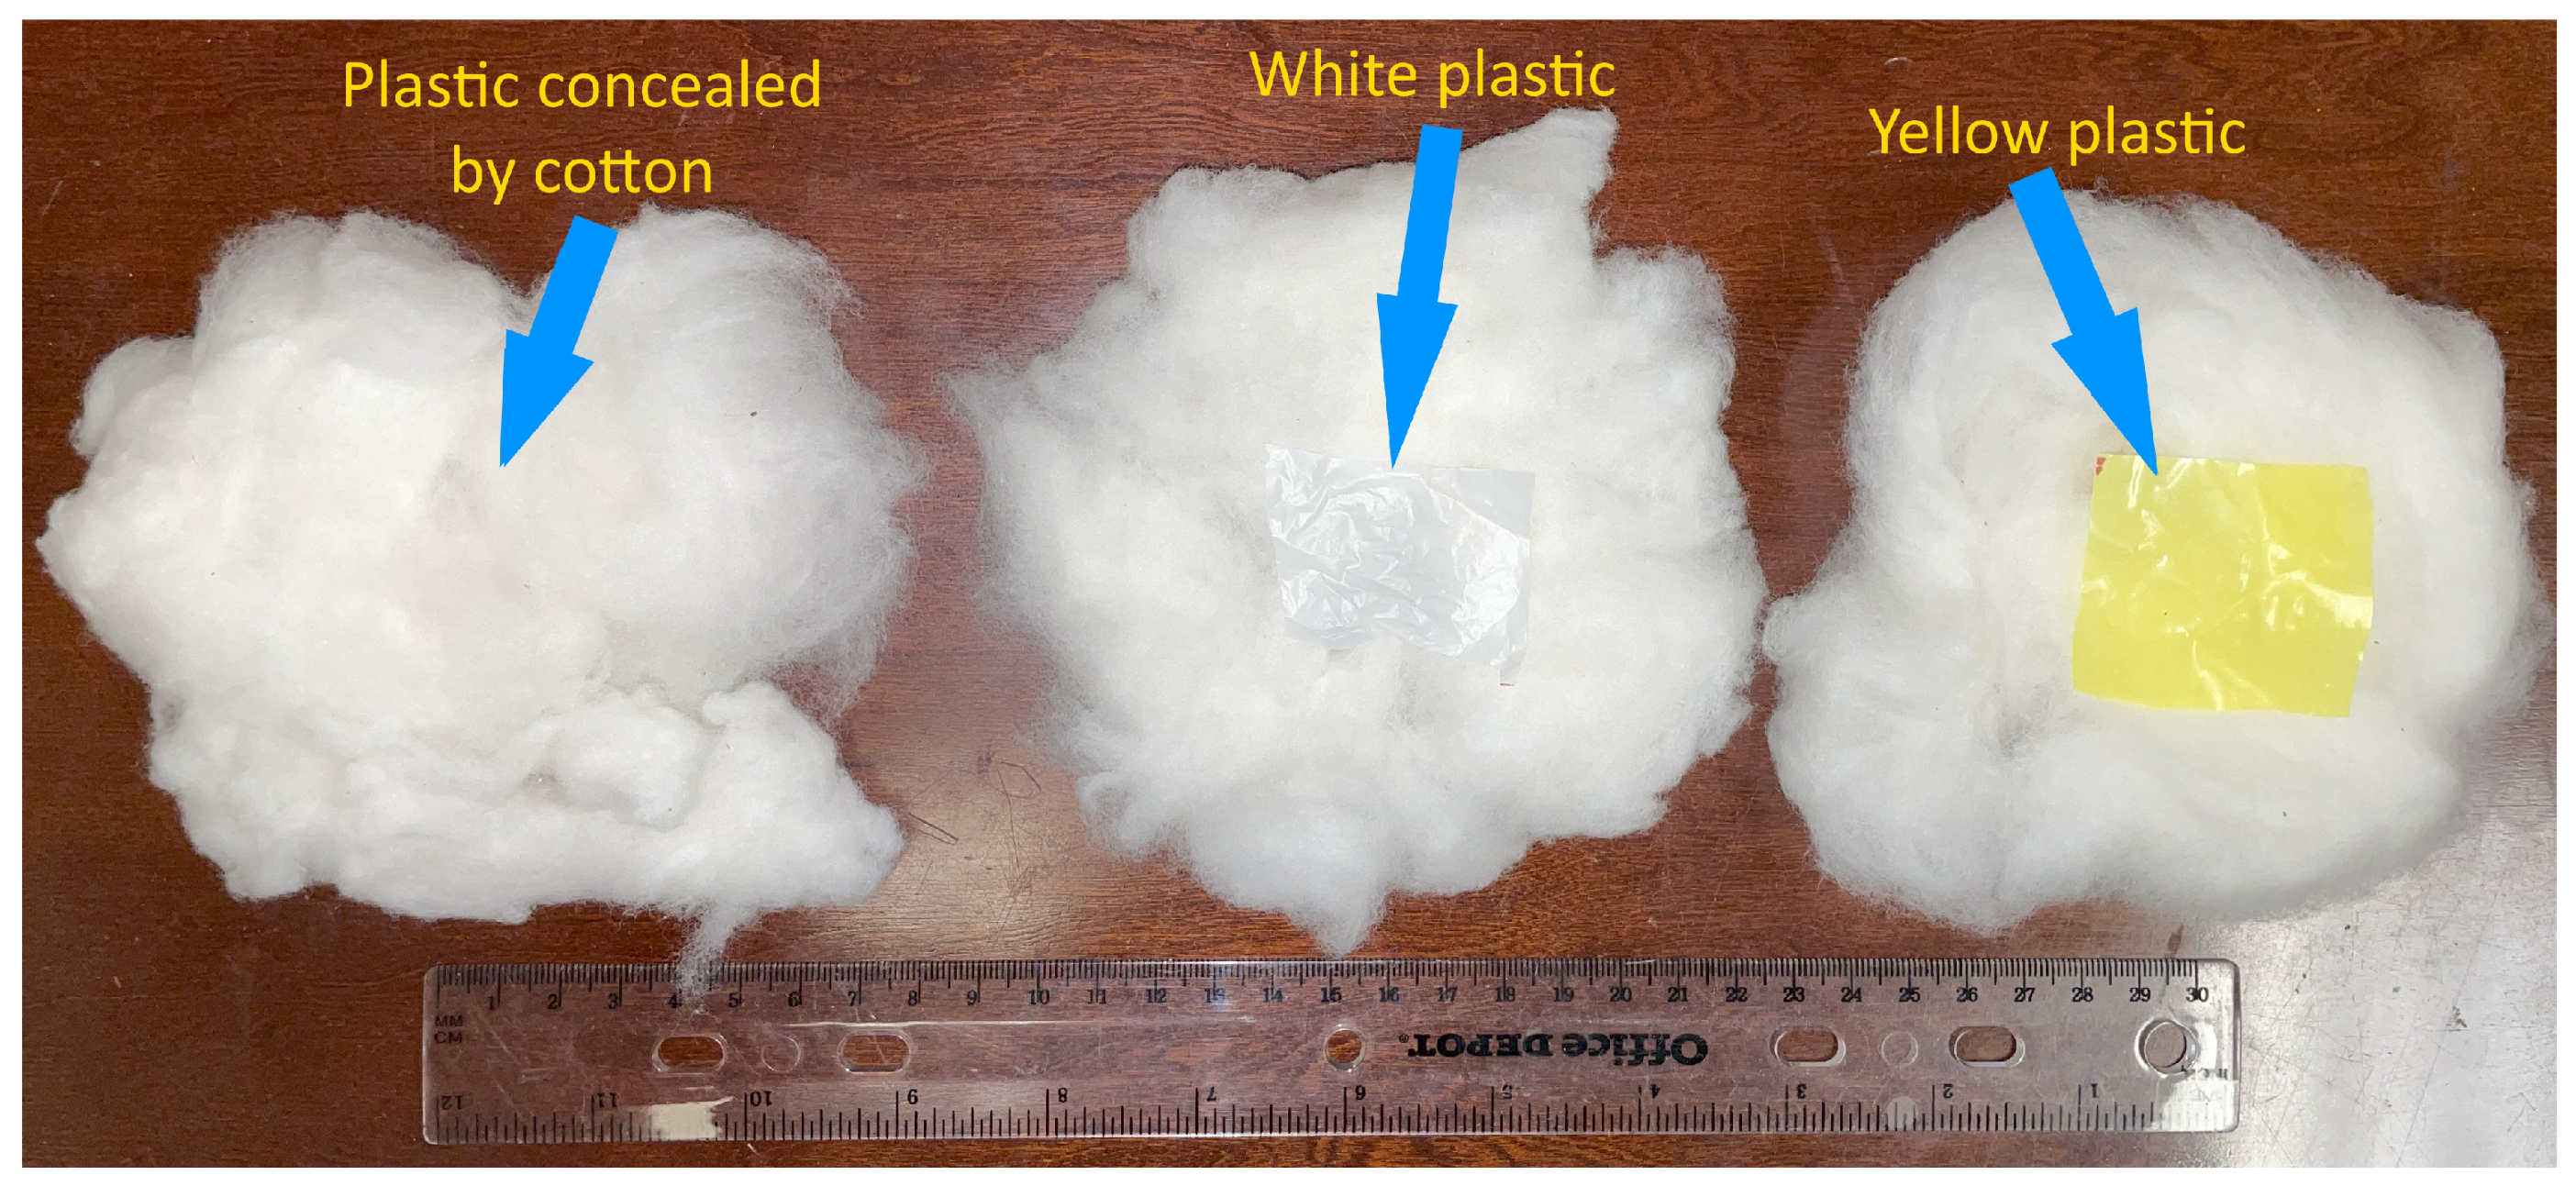
At the ginning stage, various detection and removal systems have been tested [11,17,18,19,20]. Optical detection systems, such as the USDA-developed Visual Imaging Plastic Removal (VIPR™) system (Figure 1), have shown the most promise due to their ability to rapidly process large volumes of cotton. These systems typically employ low-cost, high-resolution cameras coupled with tailored image processing algorithms to identify plastic fragments based on visual-spectral and texture differences. However, despite their promise, optical methods have key limitations. Their effectiveness is strongly dependent on ambient lighting conditions and visual contrast; when plastic contaminants are obscured by cotton fibers or when the plastics exhibit an unfavorable range of colors, optical systems may fail to reliably detect them (see Figure 2). In addition, inconsistent lighting conditions and the heterogeneous nature of cotton during ginning further complicate the accuracy of optical detection.
Figure 1.
Optical detection system (VIPR™) deployed on a gin stand. Photograph taken at the United Cotton Growers gin in Lubbock, Texas.
Figure 2.
Cleaned cotton lint containing a concealed piece of plastic (left); cotton with a white plastic contaminant visible (center); and cotton with a yellow plastic contaminant visible (right).
Beyond the gin, textile mills typically rely on multimodal systems to detect any lingering contaminants before spinning and weaving. Prominent examples include the Loptex Sorter, the USTER JOSSI VISION SHIELD, and the Truetzschler T-SCAN TS-T5, each combining one or more optical sensors with various spectroscopic or acoustic sensors to identify foreign matter in fiber bundles [7,21,22]. The Loptex Optosonic Sorter, for instance, integrates ultrasonic detection alongside optical imaging, enabling it to find contaminants that might escape purely camera-based methods [23]. Reports indicate that while some of these mill-stage technologies demonstrate high efficiency (80%) in detecting mixed contaminants [24], they are unable to remove some types of plastics and can be prohibitively expensive [13]. The relative success of multimodal techniques has motivated the exploration into similarly integrated approaches, with our approach having potential for deployment in earlier processing stages such as gins and classing offices.
Existing detection techniques lack the capability to detect plastics in cotton when embedded or otherwise visually obscured. To address this, our research explores an ultrasonic phased array-based approach for detecting plastic contaminants in cotton. Building on earlier evidence that ultrasound can distinguish plastic films—regardless of visual obstruction—from cotton fibers [23,25], we expand these findings to a modular multi-element system capable of generating spatial maps of plastic contaminant distribution. By leveraging both ultrasonic reflection and transmission measurements, the system aims to resolve plastic that might otherwise remain hidden in visually cluttered environments.
The primary objective of this research is to develop and evaluate a 40 kHz ultrasonic phased-array imaging system capable of detecting visually obscured plastic contaminants in cotton. Specifically, this study aims to: (1) design a dual-modality sensor array that captures both echo reflections and signal attenuation; (2) implement beamforming and image-generation algorithms to spatially map acoustic responses; and (3) experimentally validate the system’s detection capabilities and resolution limits using seed cotton and lint samples containing varied plastic fragments under laboratory conditions. By establishing these foundational capabilities, this work seeks to demonstrate the feasibility of ultrasonic imaging as a robust supplement to existing optical detection methods.
2. Materials and Methods
2.1. Theory of Operation
Ultrasound, defined as acoustic waves with frequencies above 20 kHz, is widely used in diagnostic and sensing applications across a variety of fields, such as medical imaging, nondestructive testing, and sonar. Effective propagation of ultrasound typically requires an acoustic coupling medium that exhibits low attenuation (e.g., water or gel), enabling the use of higher frequencies for enhanced spatial resolution. In contrast, air-coupled ultrasound must contend with higher attenuation, which necessitates the use of lower frequencies. Consequently, a 40 kHz operating frequency was chosen for this application. This selection was made not only because off-the-shelf transducers are readily available at this frequency and cost-effective, but also because at a frequency f = 40 kHz, the wavelength in air—given by
where the speed of sound in air m/s—is approximately 8.6 mm. This wavelength is small enough to detect plastic fragments, yet long enough to propagate effectively through air and moderately thick cotton before excessive attenuation or scattering occurs.
Plastic surfaces, being smoother and more rigid, exhibit a higher acoustic impedance compared to the porous, inhomogeneous structure of cotton. Consequently, plastic reflects ultrasound more efficiently than cotton. This contrast in reflection characteristics enables detection using both reflection and transmission modalities. In reflection mode, a receiver is positioned to detect echoes that return from the target’s front surface, with plastic generating stronger echoes if it is oriented to optimally reflect back in the original direction. In transmission mode, the receiver is positioned to measure the degree to which the ultrasonic signal is attenuated. Since cotton is relatively transparent to 40 kHz ultrasound—despite some inherent scattering and absorption—a substantial reduction in transmitted energy strongly indicates the presence of a denser foreign object, such as plastic. Transmission data provide an additional feature to the system that can be particularly valuable when contaminants are oriented in a manner that yields weak reflections. In such cases, partial obstruction of the transmission path can still be detected by these receivers. This enhances the system’s capability to localize targets and, in some scenarios, improves spatial resolution, especially when objects are closer to the transmission receivers (i.e., far away from the reflection receivers). Both types of receivers are utilized in this system, and their respective setup details will be discussed in the coming sections.
Ultrasonic transmitting systems can operate in either continuous or pulsed modes [26]. In continuous mode, the transmitter emits an uninterrupted ultrasonic signal, whereas pulsed mode involves transmitted bursts of short pulses followed by a period wherein no signal is transmitted. In general, pulsed mode is preferred for non-Doppler diagnostic applications because it possesses depth acuity, unlike continuous mode. For this reason, we have chosen to use pulsed mode for this application.
Ultrasonic detection generally relies on measuring the time-of-flight (TOF) of the acoustic waves along either a direct or reflected path. In principle, differences in density between plastic and cotton would result in variations in the speed of sound; however, the thickness of the plastic contaminants can be very small (100–300 m) while possessing a larger surface area. Any TOF differences due to the presence of these plastics are below the experimental system’s resolution and are not exploited in this application. Instead, the focus is on detecting changes in echo and transmission amplitudes, which provide a more robust indication of plastic contamination in the cotton.
Ultrasonic transducers form the core of our sensing system by converting electrical signals into ultrasonic waves and vice versa. In our implementation, we utilize commercial transducers—specifically, the CUSA-T80-15-2400-TH transmitters (Same Sky, Lake Oswego, OR, USA) and CUSA-R80-15-2500-TH receivers (Same Sky, Lake Oswego, OR, USA)—which were chosen for their availability, high maximum operating voltage to improve signal-to-noise ratio (SNR), and desirable operating frequency of 40 kHz [27,28]. While a single transducer is capable of delivering ultrasonic energy in a beam, its radiation pattern typically features a relatively broad main lobe. Such a broad beam width limits spatial resolution and the ability to precisely locate small targets, such as plastic contaminants within cotton, because the signal energy is distributed over a wide angular span.
These limitations can be overcome by designing a system that utilizes multiple elements—in other words, an array—rather than relying on a single transducer. By combining the outputs of several transducers, the system is able to synthesize a narrower main lobe, thereby improving both directivity and spatial resolution. Although a narrower beam inherently reduces the system’s field of view, this limitation can be addressed by enabling the system to steer the beam’s angle across the field of view. When arranged properly, a phased array configuration achieves this by providing the capability to electronically steer the beam [29,30].
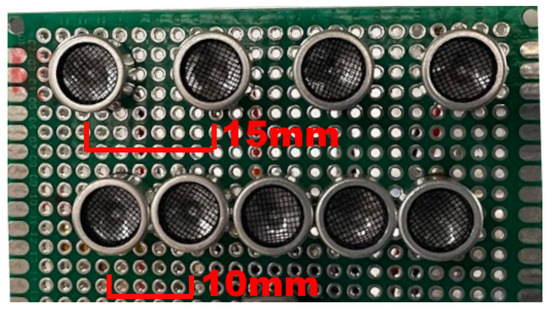
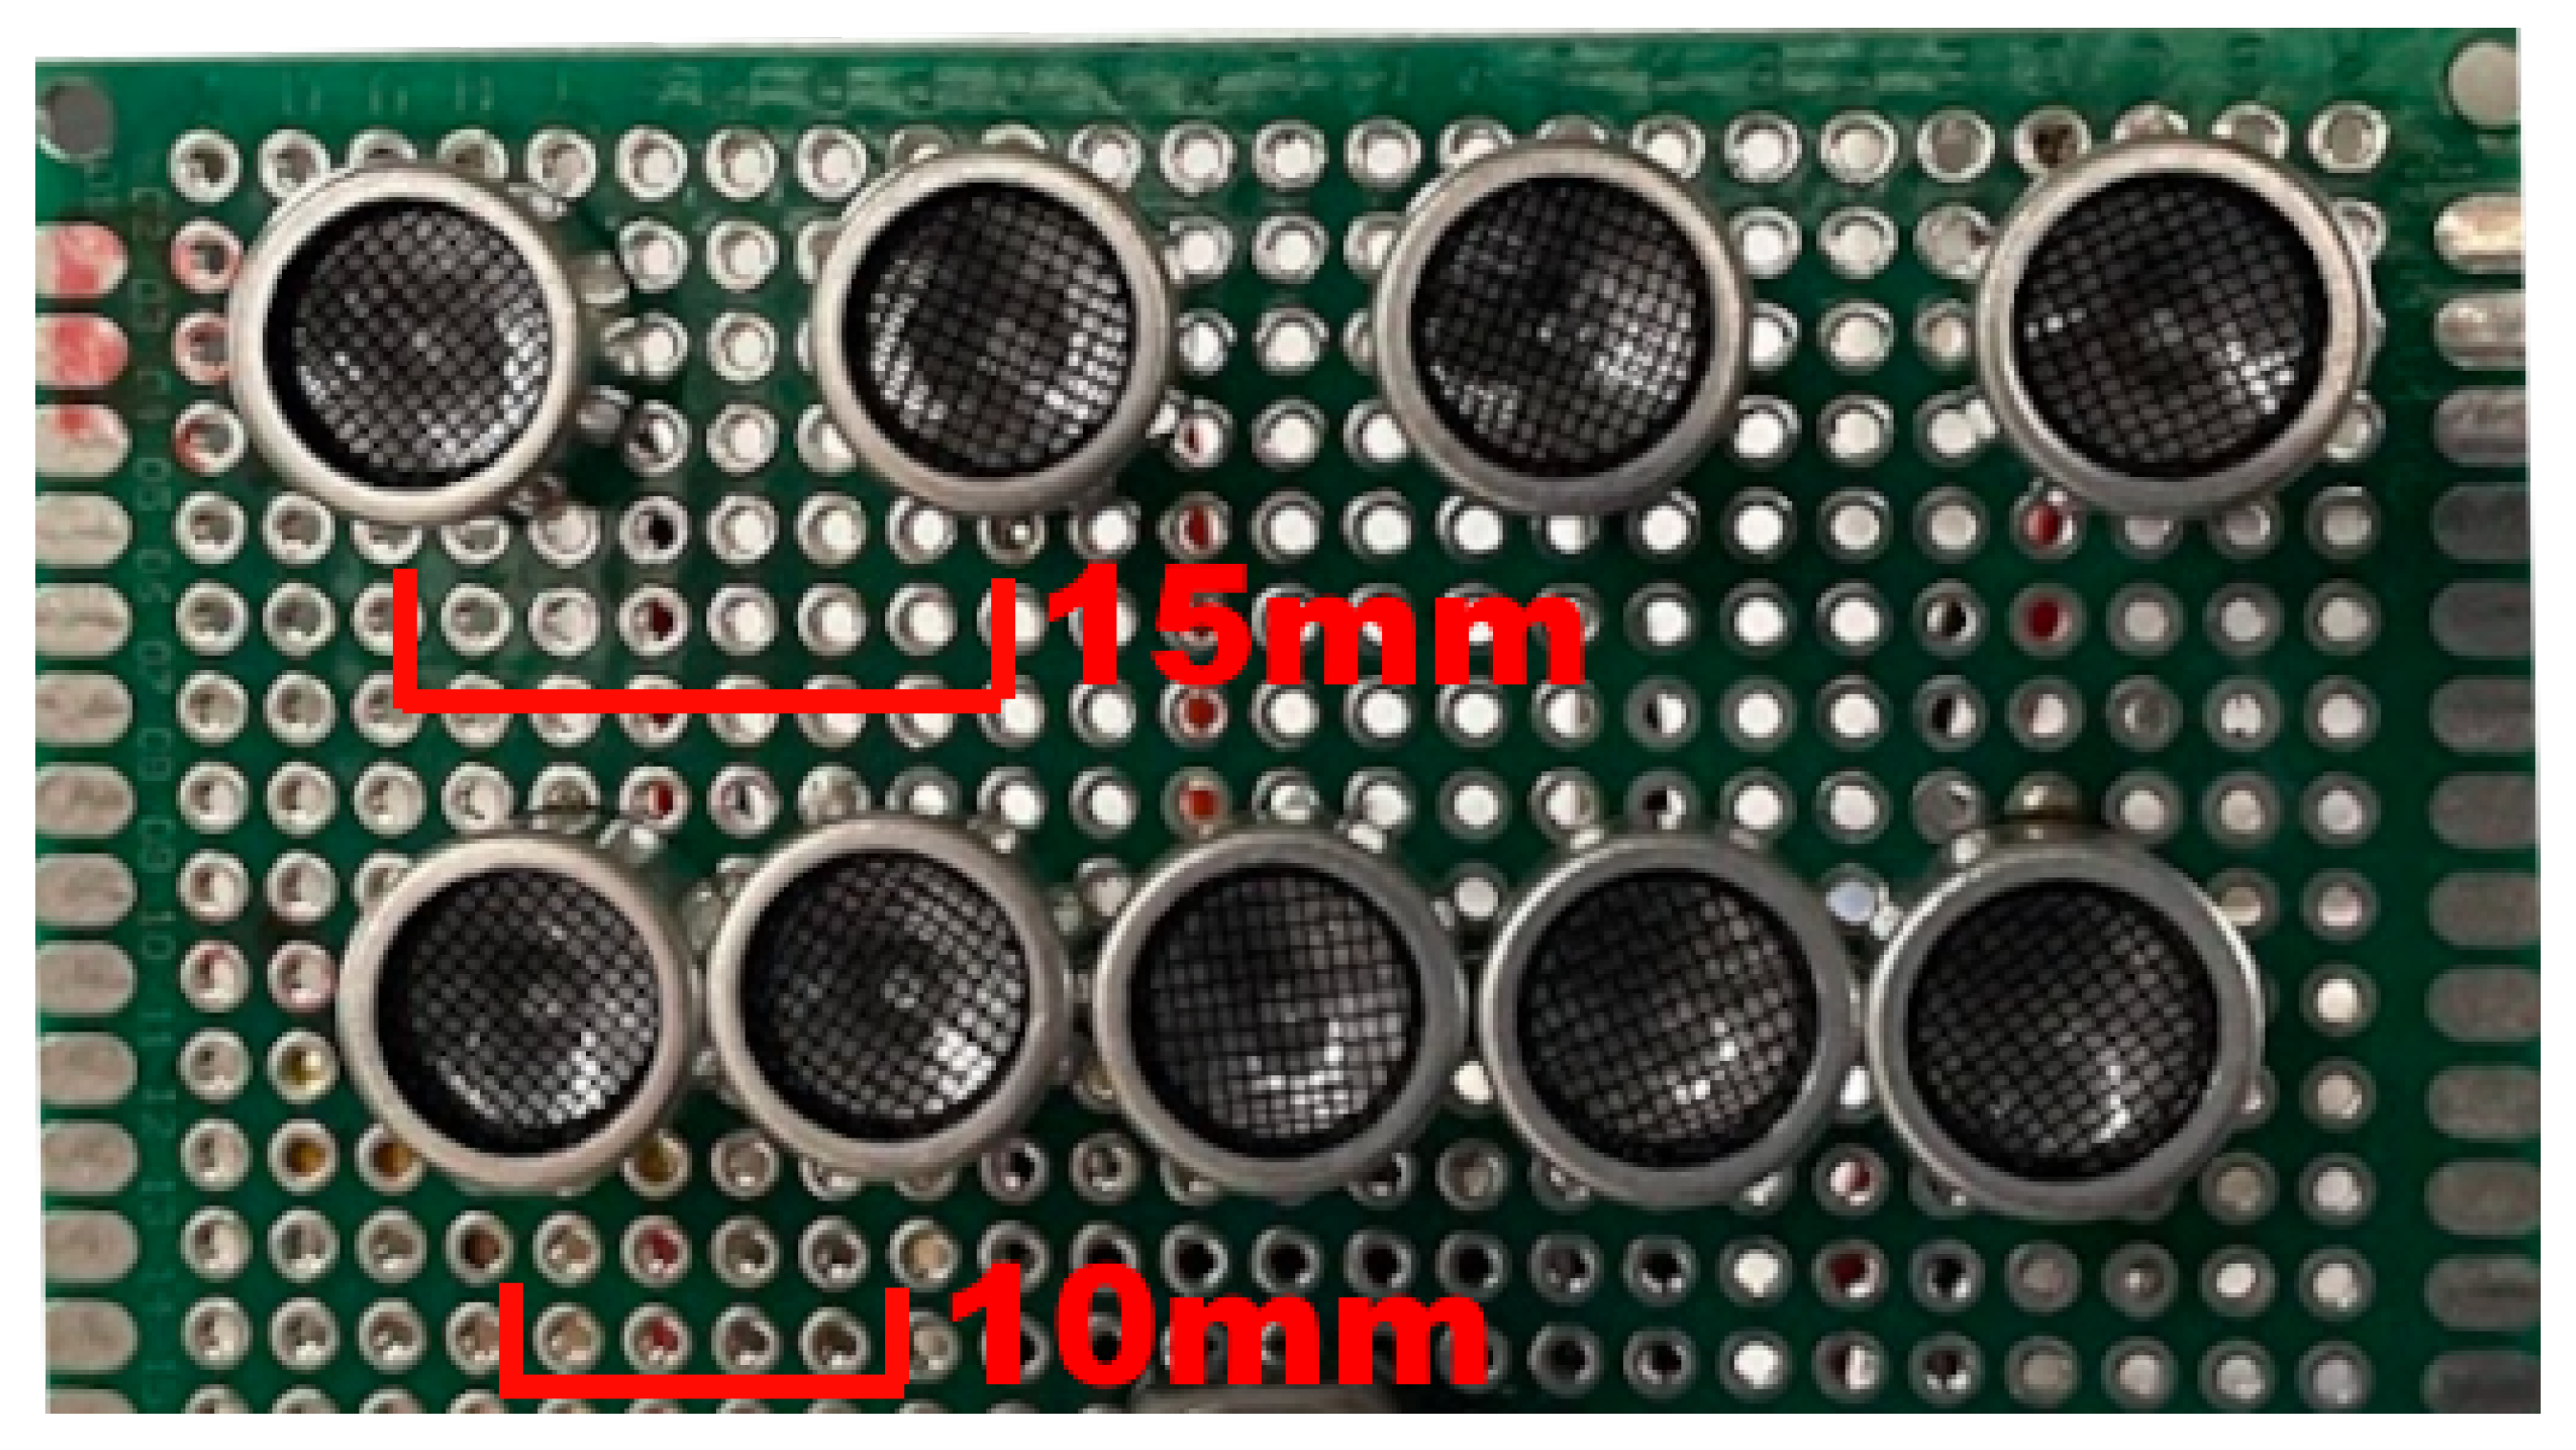
A phased array is a configuration of multiple transducer elements whose individual outputs can be electronically controlled to form a combined beam of acoustic energy. The central idea is that by introducing specific time delays—or equivalently, phase shifts—between the signals applied to each element, the focused beam can be steered toward a desired direction without any mechanical movement. In an ideal linear phased array, elements are equally spaced at half the operating wavelength to avoid grating lobes. For a 40 kHz system in air, with a wavelength mm, the optimal spacing would be about 4.3 mm. However, our implementation is constrained by practical considerations, the most impactful of which is that the commercial transducers we use have a nominal diameter of approximately 10 mm. As a result, our transmitter array is arranged with the minimum allowable center-to-center spacing of 10 mm, which corresponds to roughly . Because we are not constrained by the need for multi-dimensional scanning, we chose to utilize a phased linear array.
To minimize the impact of grating lobes, the receiver array—mounted 10 mm above the transmitters, as shown in Figure 3—is specifically designed in terms of both its number of transducers and their spatial arrangement [30,31]. By utilizing a spacing of 15 mm (approximately , or 1.5× the transmitter spacing), this relative offset aligns the secondary lobes (sidelobes and grating lobes) of the transmitter array with the nulls in the receiver array’s response. Multiplying the transmitter and receiver array factors in this manner effectively suppresses these unwanted artifacts, ensuring the main lobe remains the primary contributor to the overall acoustic signal.
Figure 3.
Transmitter array (bottom) and receiver array (top).
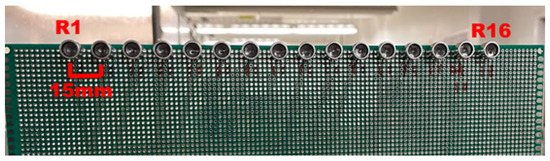
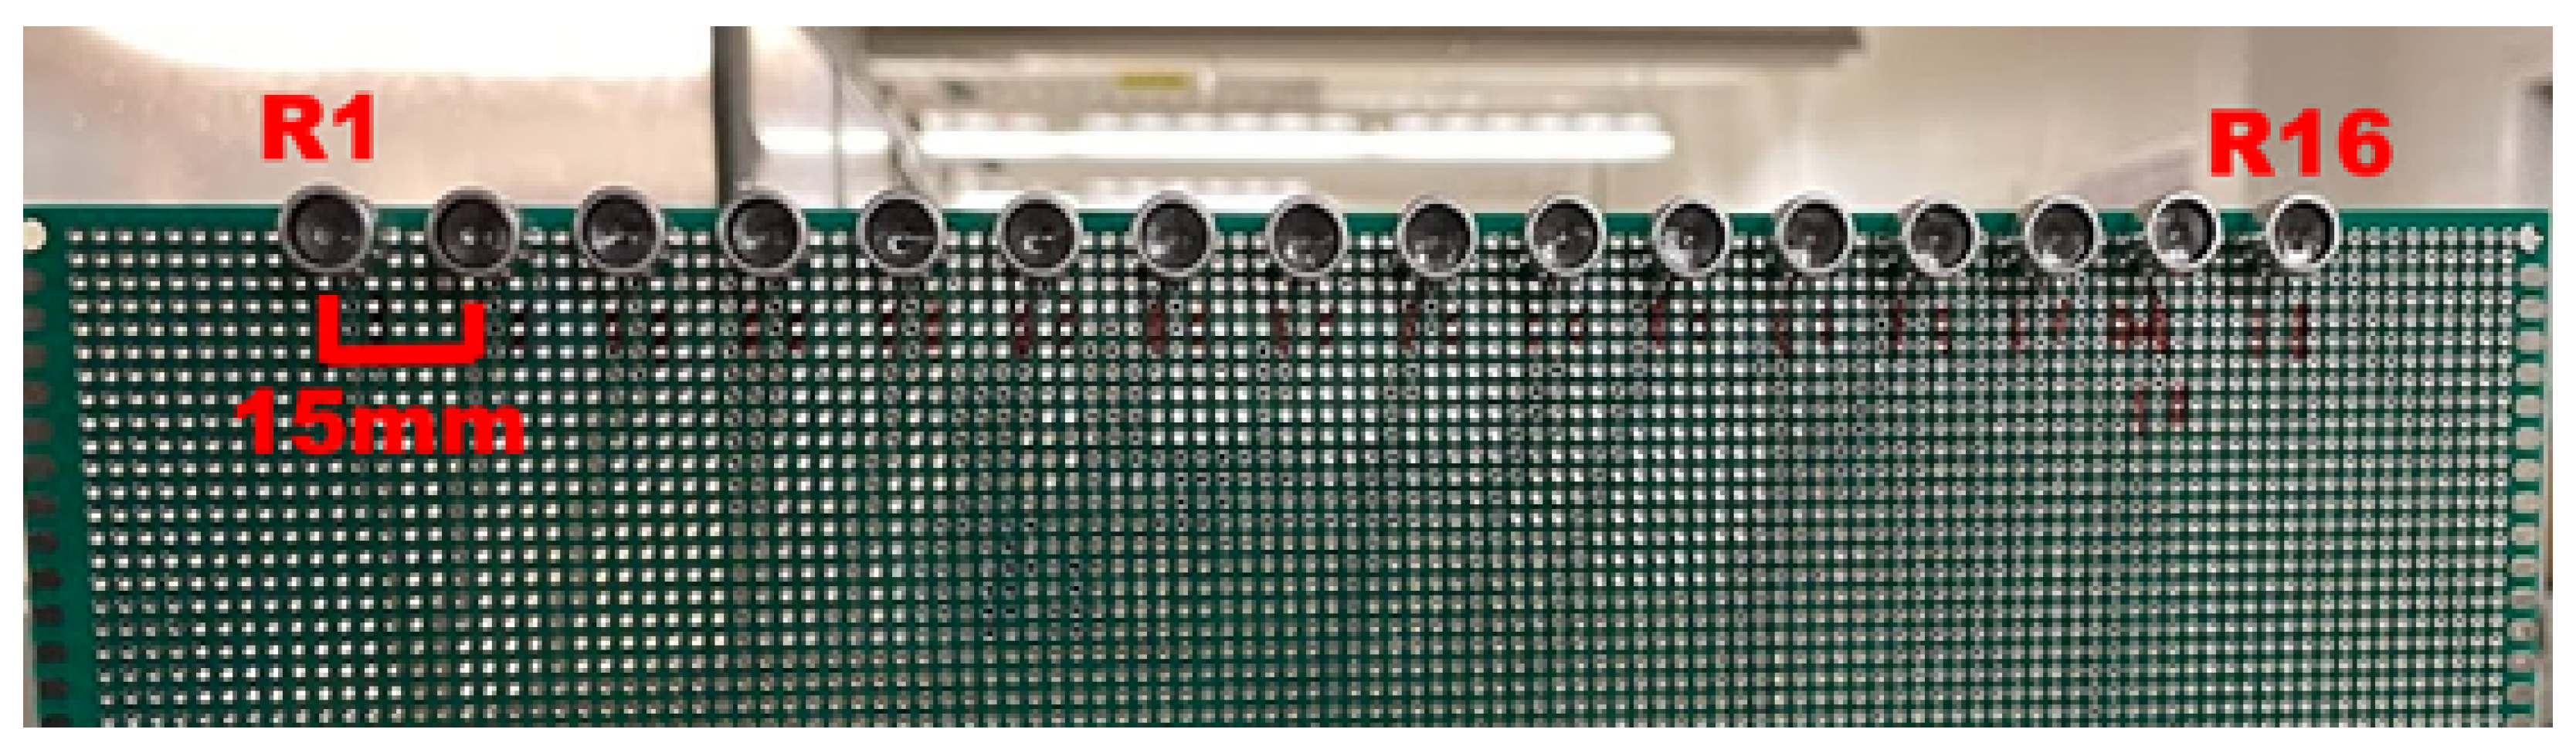
In addition to having reflection receivers, the system incorporates 16 transmission receivers arranged in a linear configuration with 15 mm spacing and positioned 65 cm from the transmitter array (see Figure 4). Their centroid is aligned with that of the transmitter array to ensure symmetric spatial referencing. Unlike the reflection receivers, which are combined via beamforming to localize echoes, each transmission receiver operates independently, capturing the cumulative attenuation of the ultrasonic signal along its path of transmission.
Figure 4.
Linear transmission receiver layout (16 channels).
The overall directivity and lateral resolution of the system are largely dictated by the array factor (AF) of the transmitter and reflection receiver arrays. For a uniform linear array in the far field with N elements, angular wave number k, inter-element spacing d, observation angle , and steered to angle , the array factor—derived in [29]—is
A key parameter in steering the beam is the time delay required between consecutive elements to direct the beam toward a desired angle . From the array geometry,
where c is the speed of sound in air. For instance, to steer elements spaced by 10 mm to , 509 ns of delay between transducers is required. Implementing such sub-microsecond delays requires precise digital control, which is provided by our FPGA-based driver.
2.2. Hardware Setup
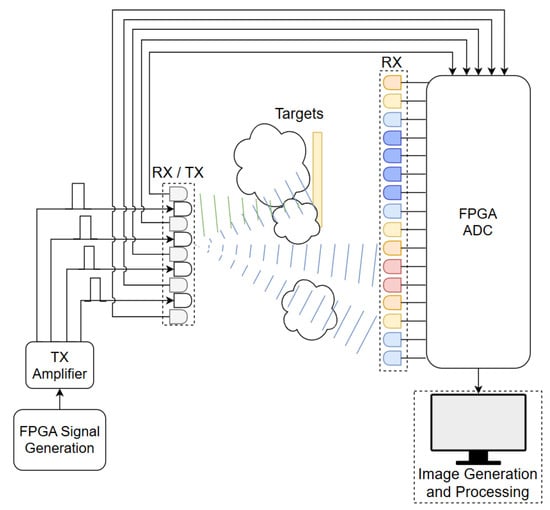
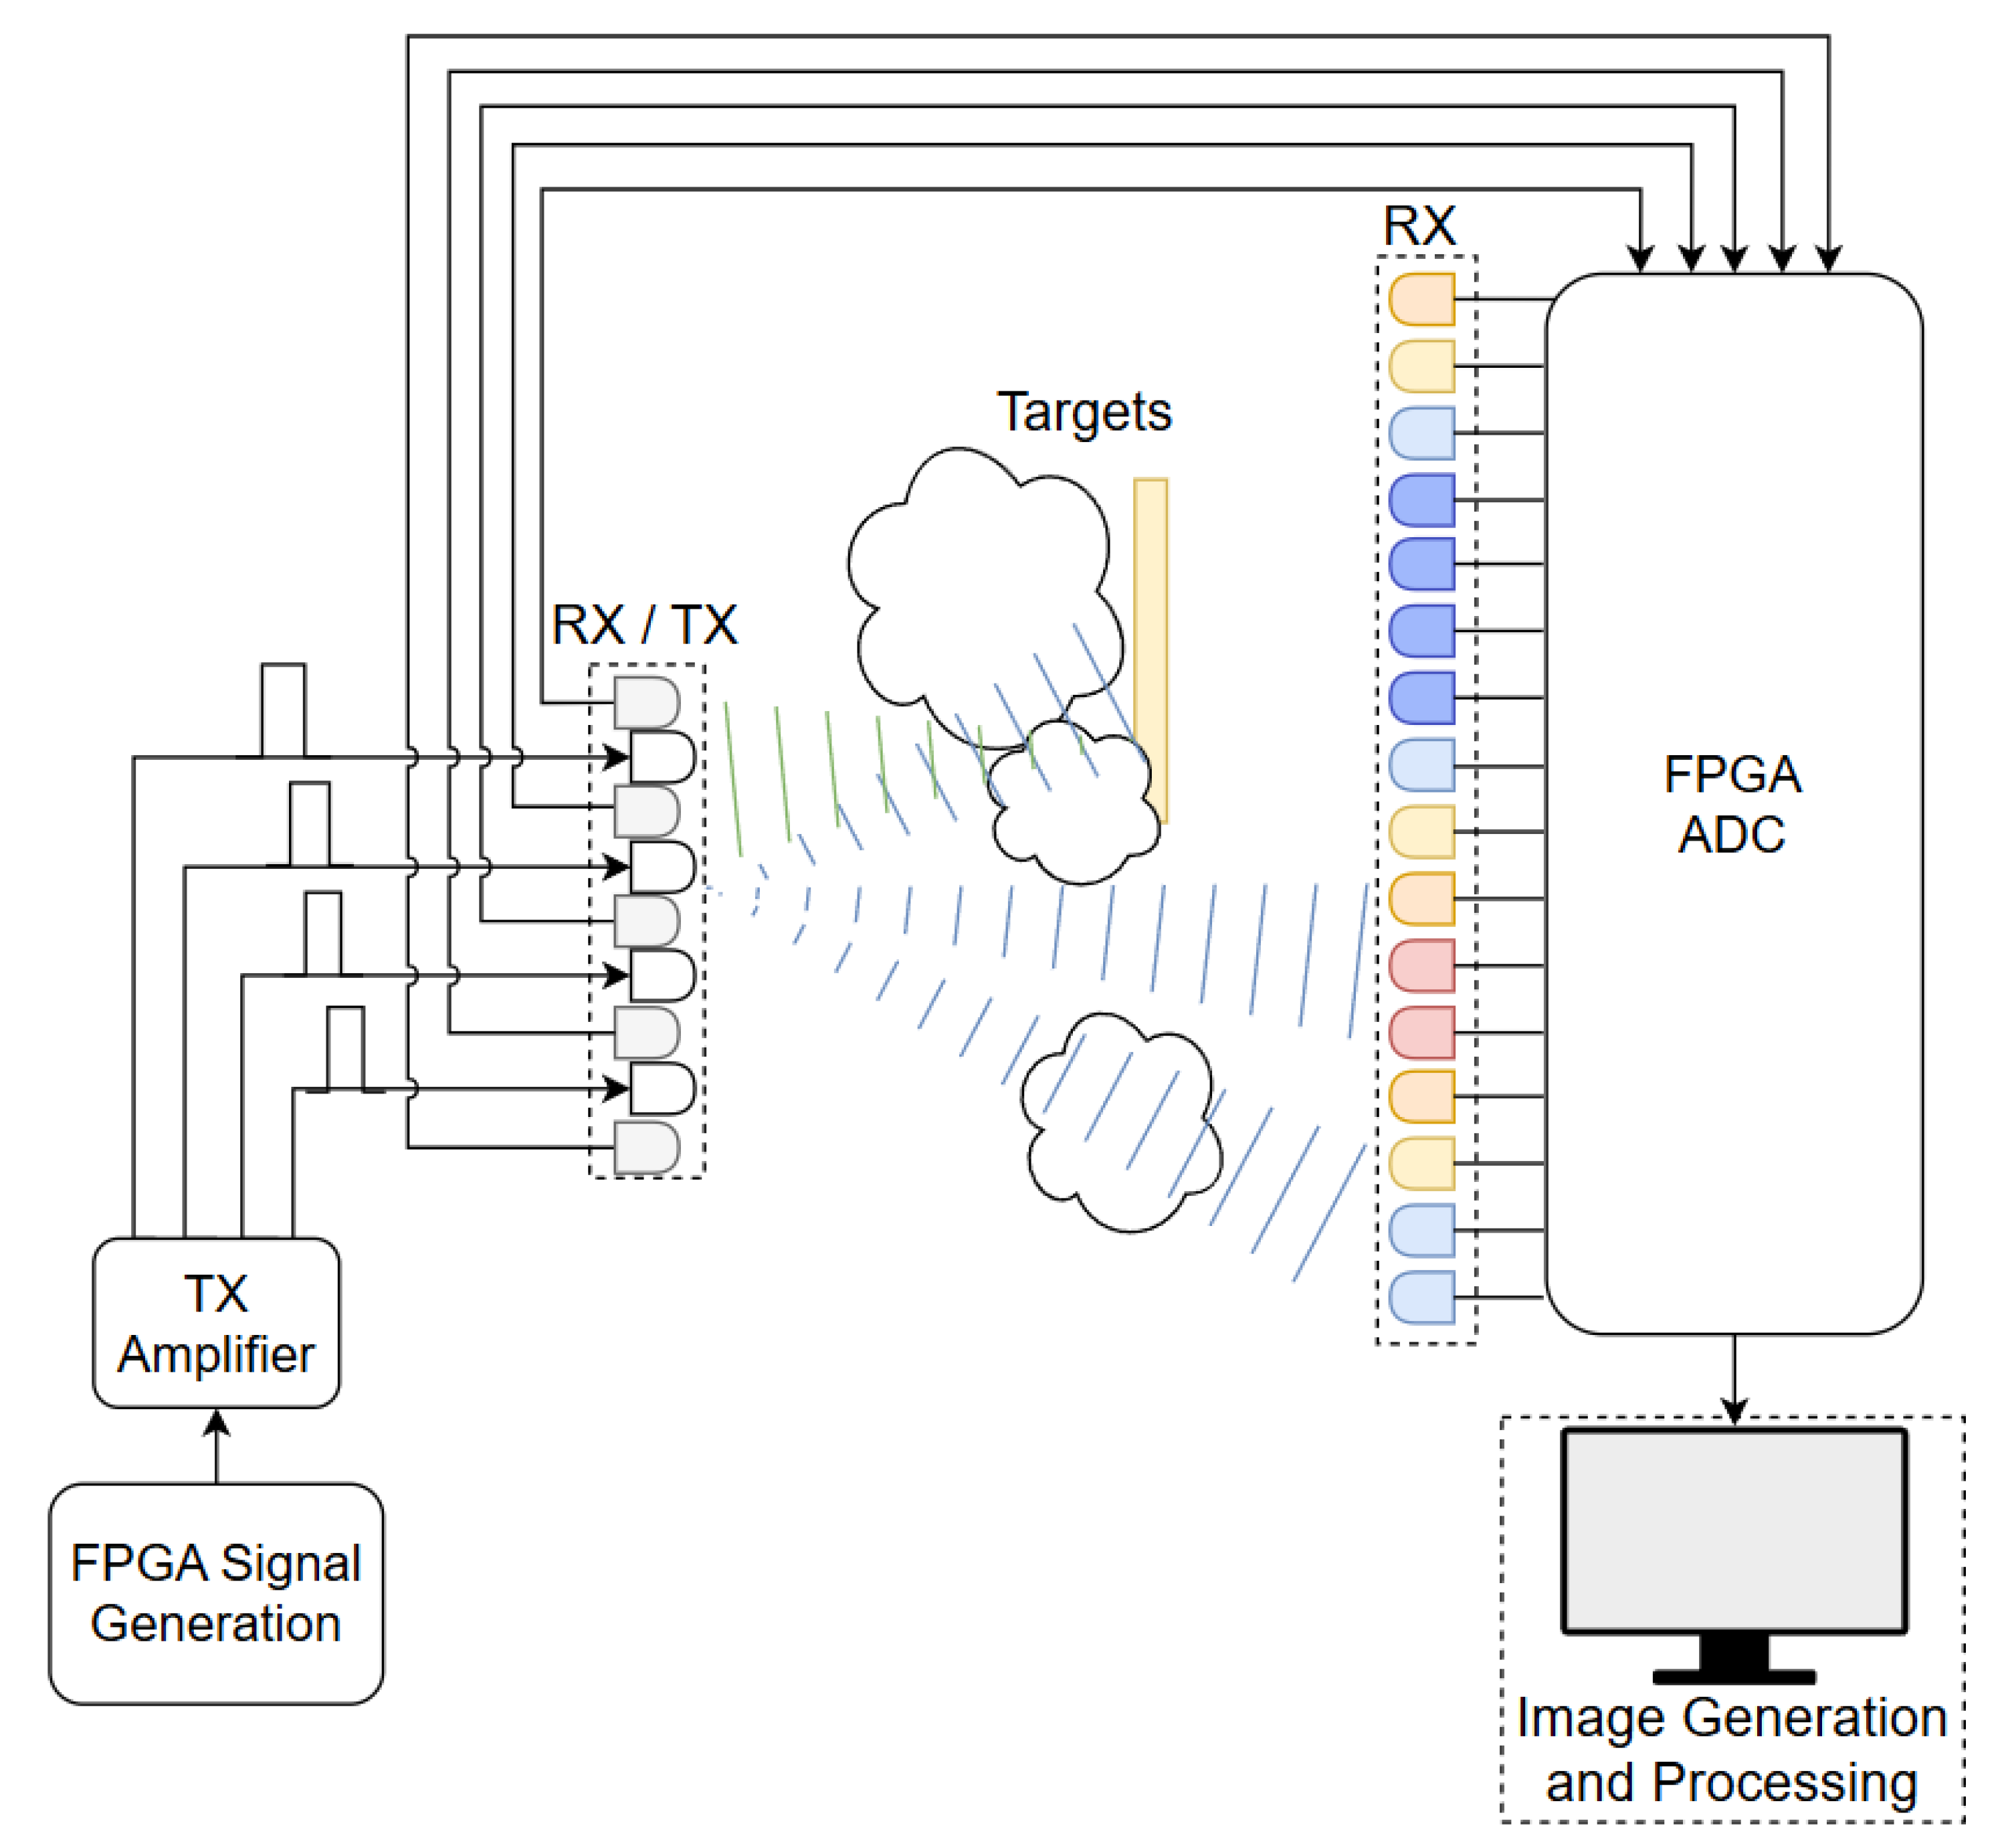
The system comprises several key hardware elements and signal pathways, as shown in Figure 5. At the core of the control architecture, an FPGA generates precisely time-delayed signals that feed into the transmitters after amplification. Co-located with these transmitters is an array of reflection receivers designed to detect the ultrasonic echoes returned by the targets. On the opposite side of the target area, a separate array of transmission receivers captures the ultrasound waves propagating through the medium. The analog signals from both sets of receivers are routed into an analog-to-digital converter (ADC), which digitizes and outputs the data to a computer for downstream image generation and processing. Physically, targets are introduced between the two sets of receivers by tethering them to a stationary overhead support using a fine string sewn into the cotton samples. The entire assembly is mounted on an optical breadboard with a 1-inch grid, allowing the transducers and targets to be elevated to a level plane and positioned precisely using adjustable poles.
Figure 5.
Block diagram of the ultrasonic phased-array system hardware and signal flow. Arrows indicate the directionality of electrical signals, dashed lines illustrate ultrasonic wave propagation, and transmission receivers are color-coded to reflect signal attenuation, ranging from low (cool colors) to high (warm colors) transmission. Illustrated targets include cotton and yellow plastic.
The driver for the ultrasonic transmitter array is implemented in Verilog using Vivado v2023.1 (Xilinx, San Jose, CA, USA) on a Zybo Z7-10 FPGA board (Digilent, Pullman, WA, USA). An FPGA was selected over a microcontroller for two primary reasons. First, its ability to implement digital logic allows the design to execute multiple operations in parallel rather than sequentially. Second, it provides direct access to a reliable, high-speed system clock—both of which are critical when driving phased arrays that require microsecond-scale delays and simultaneous, precisely-timed outputs. The Zybo Z7-10 was chosen because it offers an onboard 1 megasample per second (MSPS) differential ADC, enough high-speed PMOD output ports, and a sufficiently fast oscillator while also being relatively inexpensive [32]. To simplify some operations, we derive a 100 MHz system clock from the 125 MHz oscillator using the FPGA’s phase-locked loop and constrain it via a Xilinx Design Constraints file; the hardware description language (HDL) code runs at 100 MHz (10 ns resolution).
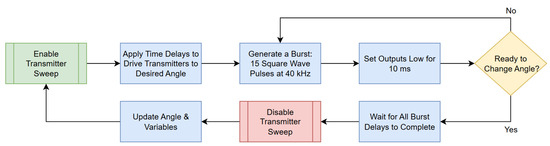
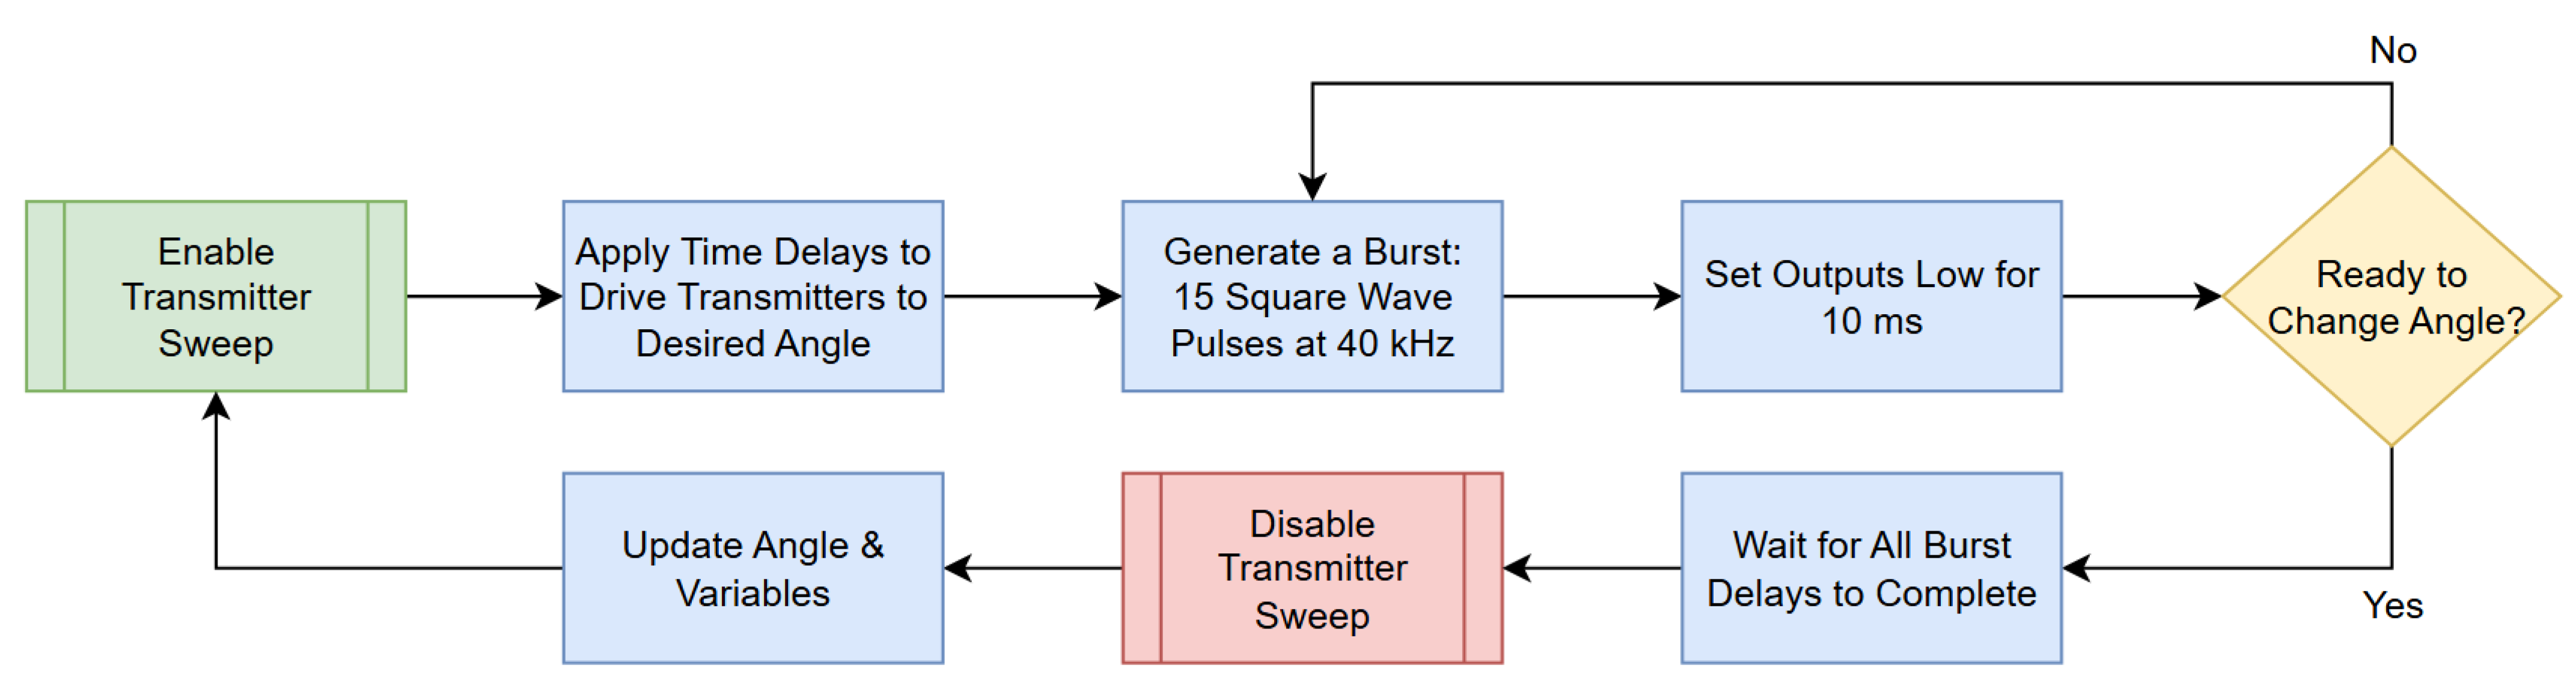
The core function of the HDL transmitter driver logic, shown in Figure 6, is to generate ultrasonic drive signals organized into bursts. Each burst consists of 15 pulses operating at a nominal frequency of 40 kHz. To generate these pulses, a pulse-generation module (the pulser) divides the 100 MHz clock by 1250. This division creates a half-cycle duration of 12.5 s (since 1250 cycles × 10 ns equals 12.5 s) and thus a full cycle of 25 s, which corresponds directly to a 40 kHz square wave. A counter within the pulser tracks each 10 ns interval, toggling the output once the counter reaches 1250. This toggling continues until 15 pulses have been generated; at that point, the module resets its internal counters and flags that the burst is complete.
Figure 6.
Flowchart detailing the HDL process (with experimentally used values shown) for generating phased-array ultrasonic transmissions via the FPGA. This process yields a system capable of producing 40 kHz square waves with precise control over output-to-output time delays, burst periods, signal duty cycles, and sweep parameters.
Before any burst is generated, the system initializes its beam steering logic using a preselected steering angle, starting with the minimum angle defined by the system. Beam steering is achieved by introducing precise time delays in the signals that drive each transducer. The necessary delays for beam steering angles ranging from −90° to +90° in increments of 1° are precomputed and stored in a lookup table, with each delay value specified in clock cycles (10 ns per cycle). Upon initialization, the current steering angle is used to index the lookup table, and the corresponding delay is applied to each transducer channel. For each channel, a dedicated delay counter waits until it reaches its designated delay () and then emits a short status pulse. This pulse signals the burst controller to allow the pulser to start generating the burst with the correct phase offset.
Once the phase delays are in place, the burst controller instructs the pulser to generate a burst. After the burst concludes, the controller enforces a fixed delay between successive bursts by counting clock cycles until a predetermined period (in this system, 10 ms is used) has elapsed. At the end of this delay, an enable pulse is issued to restart the pulser for the next burst. The time from the start of one burst to the next is referred to in later sections as the “burst period.” The overall control logic continuously monitors the burst completions across all channels. When the designated number of bursts has been transmitted at the current steering angle, the system reinitializes and increments the steering angle. The system proceeds to “sweep” through a range of angles in integer steps (in our system, 1° is used) from a parametrized minimum to a maximum value, before resetting back to the minimum angle.
2.3. Software Pipeline
Data from reflection receivers and transmission receivers are captured and processed in a series of software steps using MATLAB R2025a (MathWorks, Natick, MA, USA). The main steps are initialization, reflection receiver data preprocessing, transmission receiver data preprocessing, beamforming, and image formation. Each step is described in greater detail in the following section.
2.3.1. Initialization
During the acquisition phase, the system gathers ultrasonic signals under two main conditions. The first is a baseline condition, where calibration data are acquired under conditions intended to be as close to an “empty” or baseline scenario as possible. These are used later to subtract out or normalize the consistent artifacts in the measurements, such as inherent noise, circuit offsets, and environmental echoes that appear even in the absence of a primary target.
The second is a test condition, where measurement data are acquired when the system is interacting with an actual test scenario; for instance, when various materials (cotton, plastic, etc.) or other targets are positioned in the system’s line of sight. In reflection-mode, these data represent echoes returning to the sensors. In transmission-mode, they represent signals traveling through or around the target.
Following acquisition, the raw ultrasonic signals are organized into data segments corresponding to the transmitter sweep angle at which they were collected. For both reflection- and transmission-mode measurements, each segment comprises multiple burst periods recorded at a specific angle, with separate segments maintained for calibration and measurement data. This yields data segments for the reflection receivers and data segments for the transmission receivers, where is the number of discrete angular steps taken in the full transmitter sweep.
2.3.2. Reflection Receiver Data Preprocessing
Reflection data consist of the time-domain waveforms captured by the four reflection receivers as they detect ultrasonic echoes bouncing back from a target or environment. Each waveform is composed of raw ADC values that are converted from 12-bit counts (0–4095) to a corresponding voltage range (0–1 V). In addition, each waveform contains multiple burst periods, with an accompanying burst semaphore marking the start of each ultrasonic burst. The preprocessing of these reflection signals involves the following steps for each reflection data segment:
- 1.
- The system utilizes a 4th-order Butterworth bandpass filter centered at 40 kHz with a 2 kHz bandwidth to process reflection waveforms. This topology was chosen to leverage its maximally flat passband and steep roll-off, ensuring that the 40 kHz signal is isolated from unwanted noise and DC components without introducing distortions. This configuration ensures high signal fidelity for the subsequent imaging algorithms.
- 2.
- Burst segmentation and averaging: the burst semaphore is used to segment the filtered waveform into individual burst periods. Each segment corresponds to the received echoes for a single transmitted ultrasonic burst. These segments are averaged together to form a single burst period in order to reduce random noise.
- 3.
- Calibration: the upper envelope of each averaged burst period is taken in order to smooth out amplitude fluctuations. Then, the averaged burst period obtained from the calibration data is subtracted from the averaged burst period from the measurement data. This subtraction helps to remove (unwanted) signal data from the invariant parts of the scene, e.g., transducer coupling and reflections coming from the transmission receiver setup.
The output of the reflection data preprocessing is a set of calibrated, averaged reflection signals—one for each transmitter sweep angle.
2.3.3. Transmission Data Preprocessing
Transmission receiver data capture the attenuation of the ultrasonic signal as it passes through or around target(s). Each transmission data segment—corresponding to a specific transmitter sweep angle—is composed of transmissions over multiple burst periods with voltage-converted amplitudes, similar to the reflection data. However, the key goal in transmission mode is to obtain one representative voltage measurement for each of the 16 transmission receivers. The process for achieving this is described in the following two steps.
The first step is receiver-specific peak extraction. As with reflection signals, the raw transmissions are filtered and broken into burst periods, which are then averaged. For each transmission receiver, the system selects the transmission data segment that best matches its true angular position (for instance, if Receiver 16 is located at +10.6°, and a transmitter step size of 1° is used, then the best-match data segment would be the one acquired when the transmitted beam was steered to +11°). From the averaged burst period in that segment, the peak voltage is extracted to represent the transmitted signal strength for that receiver.
The second step is normalization using calibration data. For each transmission receiver, a normalization factor is computed by dividing a common reference value—the maximum calibration peak observed across all receivers—by the individual receiver’s calibration peak. This factor is then applied to the corresponding measurement peak, effectively scaling the data so that all receivers are brought onto a common sensitivity scale. For example, if the maximum calibration peak is 500 mV, a receiver with a calibration peak of 100 mV would have its measured peak multiplied by 5, while another receiver with a calibration peak of 250 mV would be scaled by a factor of 2. This procedure compensates for inherent sensitivity differences between receivers.
The output of the transmission data preprocessing stage is a vector of normalized voltage measurements—one per transmission receiver.
2.3.4. Beamforming
The beamforming stage combines the calibrated, averaged reflection signals from the four reflection receivers to produce a single, beamformed signal for each transmitter sweep angle. By aligning the echoes in time using appropriate delays based on array geometry and angle of transmission, beamforming enhances spatial resolution and target localization. The process proceeds as follows:
- 1.
- Interpolation and downsampling: each reflection signal is interpolated to achieve a finer temporal resolution so that the required fractional delays can be implemented as integer sample shifts. To achieve this, the desired time resolution is determined based on the receiver spacing, transmitter sweep step, and propagation speed. The formula for calculating is described by Equation (3), with the transmitter sweep step substituted for in order to produce . The ratio between the original sampling period and is computed and approximated as a rational number . The signal is interpolated by factor and downsampled by factor , resulting in an effective sampling rate ofThis interpolated sampling rate gives a precise temporal resolution that matches the required delay adjustments for each signal.
- 2.
- Delay calculation: based on the known geometry of the reflection receiver array and the transmitter sweep angle, the relative time delays () for each receiver are computed from Equation (3) for each angle. These delays account for the differences in arrival times of echoes due to the spatial separation of the receivers.
- 3.
- Time-shifting and summation: each receiver’s interpolated signal is then circularly shifted by its computed delay. This step aligns the echoes from all receivers so that signals originating from the same spatial location add constructively, helping “steer” sensitivity in the angle of interest. Then, the time-shifted signals are summed to form a composite signal for the given angle.
The final composite output is an × matrix of beamformed signals, with being the number of interpolated samples in one burst period, being the number of transmitter sweep steps, and cells being populated by summed amplitudes. This matrix, representing the spatial distribution of echo amplitudes, forms the basis for the subsequent image formation stage.
2.3.5. Image Formation
The image formation stage converts the spatially distributed beamformed reflection data and the normalized transmission voltage measurements into a composite ultrasound visualization. It is important to note that the response from the transmission receivers does not constitute a beamformed acoustic image; rather, it consists of discrete scalar values representing localized signal attenuation. In this stage, the beamformed reflection data form a continuous grayscale background representing echo intensity, while the discrete transmission data points are overlaid using a color scale to highlight potential contaminants. The process proceeds as follows:
- 1.
- Mapping reflection data: each point in the composite reflection matrix, which is indexed by time (providing distance information) and beamformed angle, is mapped from polar coordinates into Cartesian coordinates. This conversion assigns a physical x-y location to each amplitude value, with the centroid of the transmitter array acting as the origin of the mapping.
- 2.
- Scaling reflection intensities: the reflection intensities are linearly scaled to a standard grayscale range (e.g., 0–255) so that variations in echo amplitude are visually represented as differences in brightness. Intensities below the noise level are masked to improve the image quality.
- 3.
- Interpolating reflection intensities: gaps in the image arising from discrete angular sampling are filled using two-dimensional interpolation, resulting in a smooth and continuous grayscale background.
- 4.
- Overlaying transmission data: the normalized transmission voltage measurements are assigned to spatial locations based on the known geometry of the transmission receivers. These values are color-coded according to a predetermined colormap and overlaid onto the grayscale image, thereby providing additional information about signal attenuation in the scene. In this setup, values mapped to cooler colors correspond to greater obstructions in the path of transmission (i.e., reflective or highly absorbing targets), whereas values mapped to warmer colors correspond to lesser obstructions (i.e., air).
- 5.
- Local maxima filtering: to reduce axial blurring (an artifact characterized by the width of the transmitted pulse), local maxima in the reflection image are detected to identify distinct reflectors. A filter is then applied to retain only those intensities within a narrow axial band around each detected local maximum. This selective filtering confines the image data to regions immediately surrounding the reflectors, thereby sharpening the axial definition.
This stage produces a composite ultrasound image, as presented in Section 3, that integrates the detailed spatial distribution of echo intensities with the localized transmission data. This output can be used as an aid in the analysis of experiments imaging a variety of targets.
2.4. Experimental Target Configurations
A series of preliminary experiments were conducted to evaluate the system’s ability to detect plastic contaminants in cotton. These experiments examined various target configurations—including different spatial arrangements and plastic sizes—and compared them against a baseline (air). In all experiments, the transmission receivers were positioned 65 cm from the transmitters, which were electronically swept from to in increments, with the transmitters each driven at 30 V.
In the initial single-target experiments, a non-uniform piece of cleaned cotton lint, weighing 8.6 g and measuring approximately , was suspended in air at an axial distance of 27 cm from the transmitters. Subsequently, a yellow polyethylene square (average measured thickness of 170 m) was inserted behind the cotton lint sample. The dimensions of the plastic targets, including the primary square, were intentionally selected to establish a baseline detection capability that addresses known limitations in existing optical sorting systems. Recent commercial testing by USDA researchers evaluating machine-vision detection systems demonstrated that while optical removal efficiencies exceed 90% for larger plastics, efficiency drops to approximately 75% for fragments [33]. By utilizing a target of this specific size, our preliminary experiments aim to validate the ultrasonic system’s performance at a threshold that represents a realistic, documented challenge for conventional machine-vision approaches. To test lateral sensitivity, the assembly was translated approximately 5 cm to the left and again 5 cm to the right.
In a subsequent dual-target configuration, two plastic targets were positioned with a lateral separation of cm at an axial distance of 28 cm from the transmitters.
To determine the minimum detectable square area of plastic, an additional configuration was established. In this setup, the same cleaned cotton lint sample was suspended at an axial separation of 27 cm from the transmitters, and a series of increasingly smaller square plastic targets—, , , , and —were sequentially introduced. To further establish a baseline for target-induced attenuation, supplemental measurements were made on cotton with naturally occurring seeds. Although the lint used in our primary experiments was thoroughly cleaned, real-world samples typically contain seeds. In a single supplemental test, 13 cotton seeds were introduced into the suspended sample. For this entire set of comparisons, the transmitters were each driven at 30 V.
To validate the system’s theoretical lateral resolution limit, two specific sets of experiments were conducted. In the first, a single acrylic reflector of varying widths (from 3 mm up to 50.8 mm) was positioned 41 cm from the transmitters and imaged. In the second, two parallel acrylic sheets (each 2.54 cm wide) were positioned at varying lateral edge separations (e.g., 11 mm and 16 mm) and axial distances (36.3 cm and 38.7 cm) to observe echo merging.
Finally, to evaluate axial resolution, an initial calibration experiment was performed using a single transmitter and receiver separated by 96 mm. A burst of 15 square wave pulses at 40 kHz was applied, and the output was recorded on an SDS1104X-U oscilloscope (Siglent Technologies, Shenzhen, China) to characterize the effective burst duration. To verify this resolution under practical conditions, a smaller acrylic reflector (2.54 cm wide) was fixed 30 cm from the transmitters, while a larger reflector (5.08 cm wide) was positioned slightly elevated behind it. The back reflector was gradually moved closer to the front target until the system could no longer resolve distinct echoes.
3. Results and Discussion
3.1. Cotton and Plastic Experiments
For the single-target configurations, normalization of the voltages was based on the maximum reflection voltage from the center configuration (plastic plus cotton) and the maximum transmission voltage from the baseline (air). In this configuration, reflection voltages ranged from a noise floor of 20 mV to a peak of 475 mV, while transmission values ranged from 0 mV (complete obstruction) to 405 mV (no obstruction).
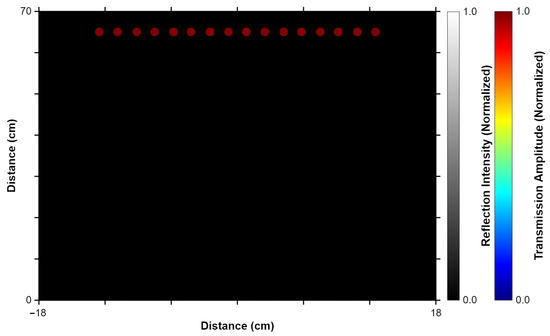
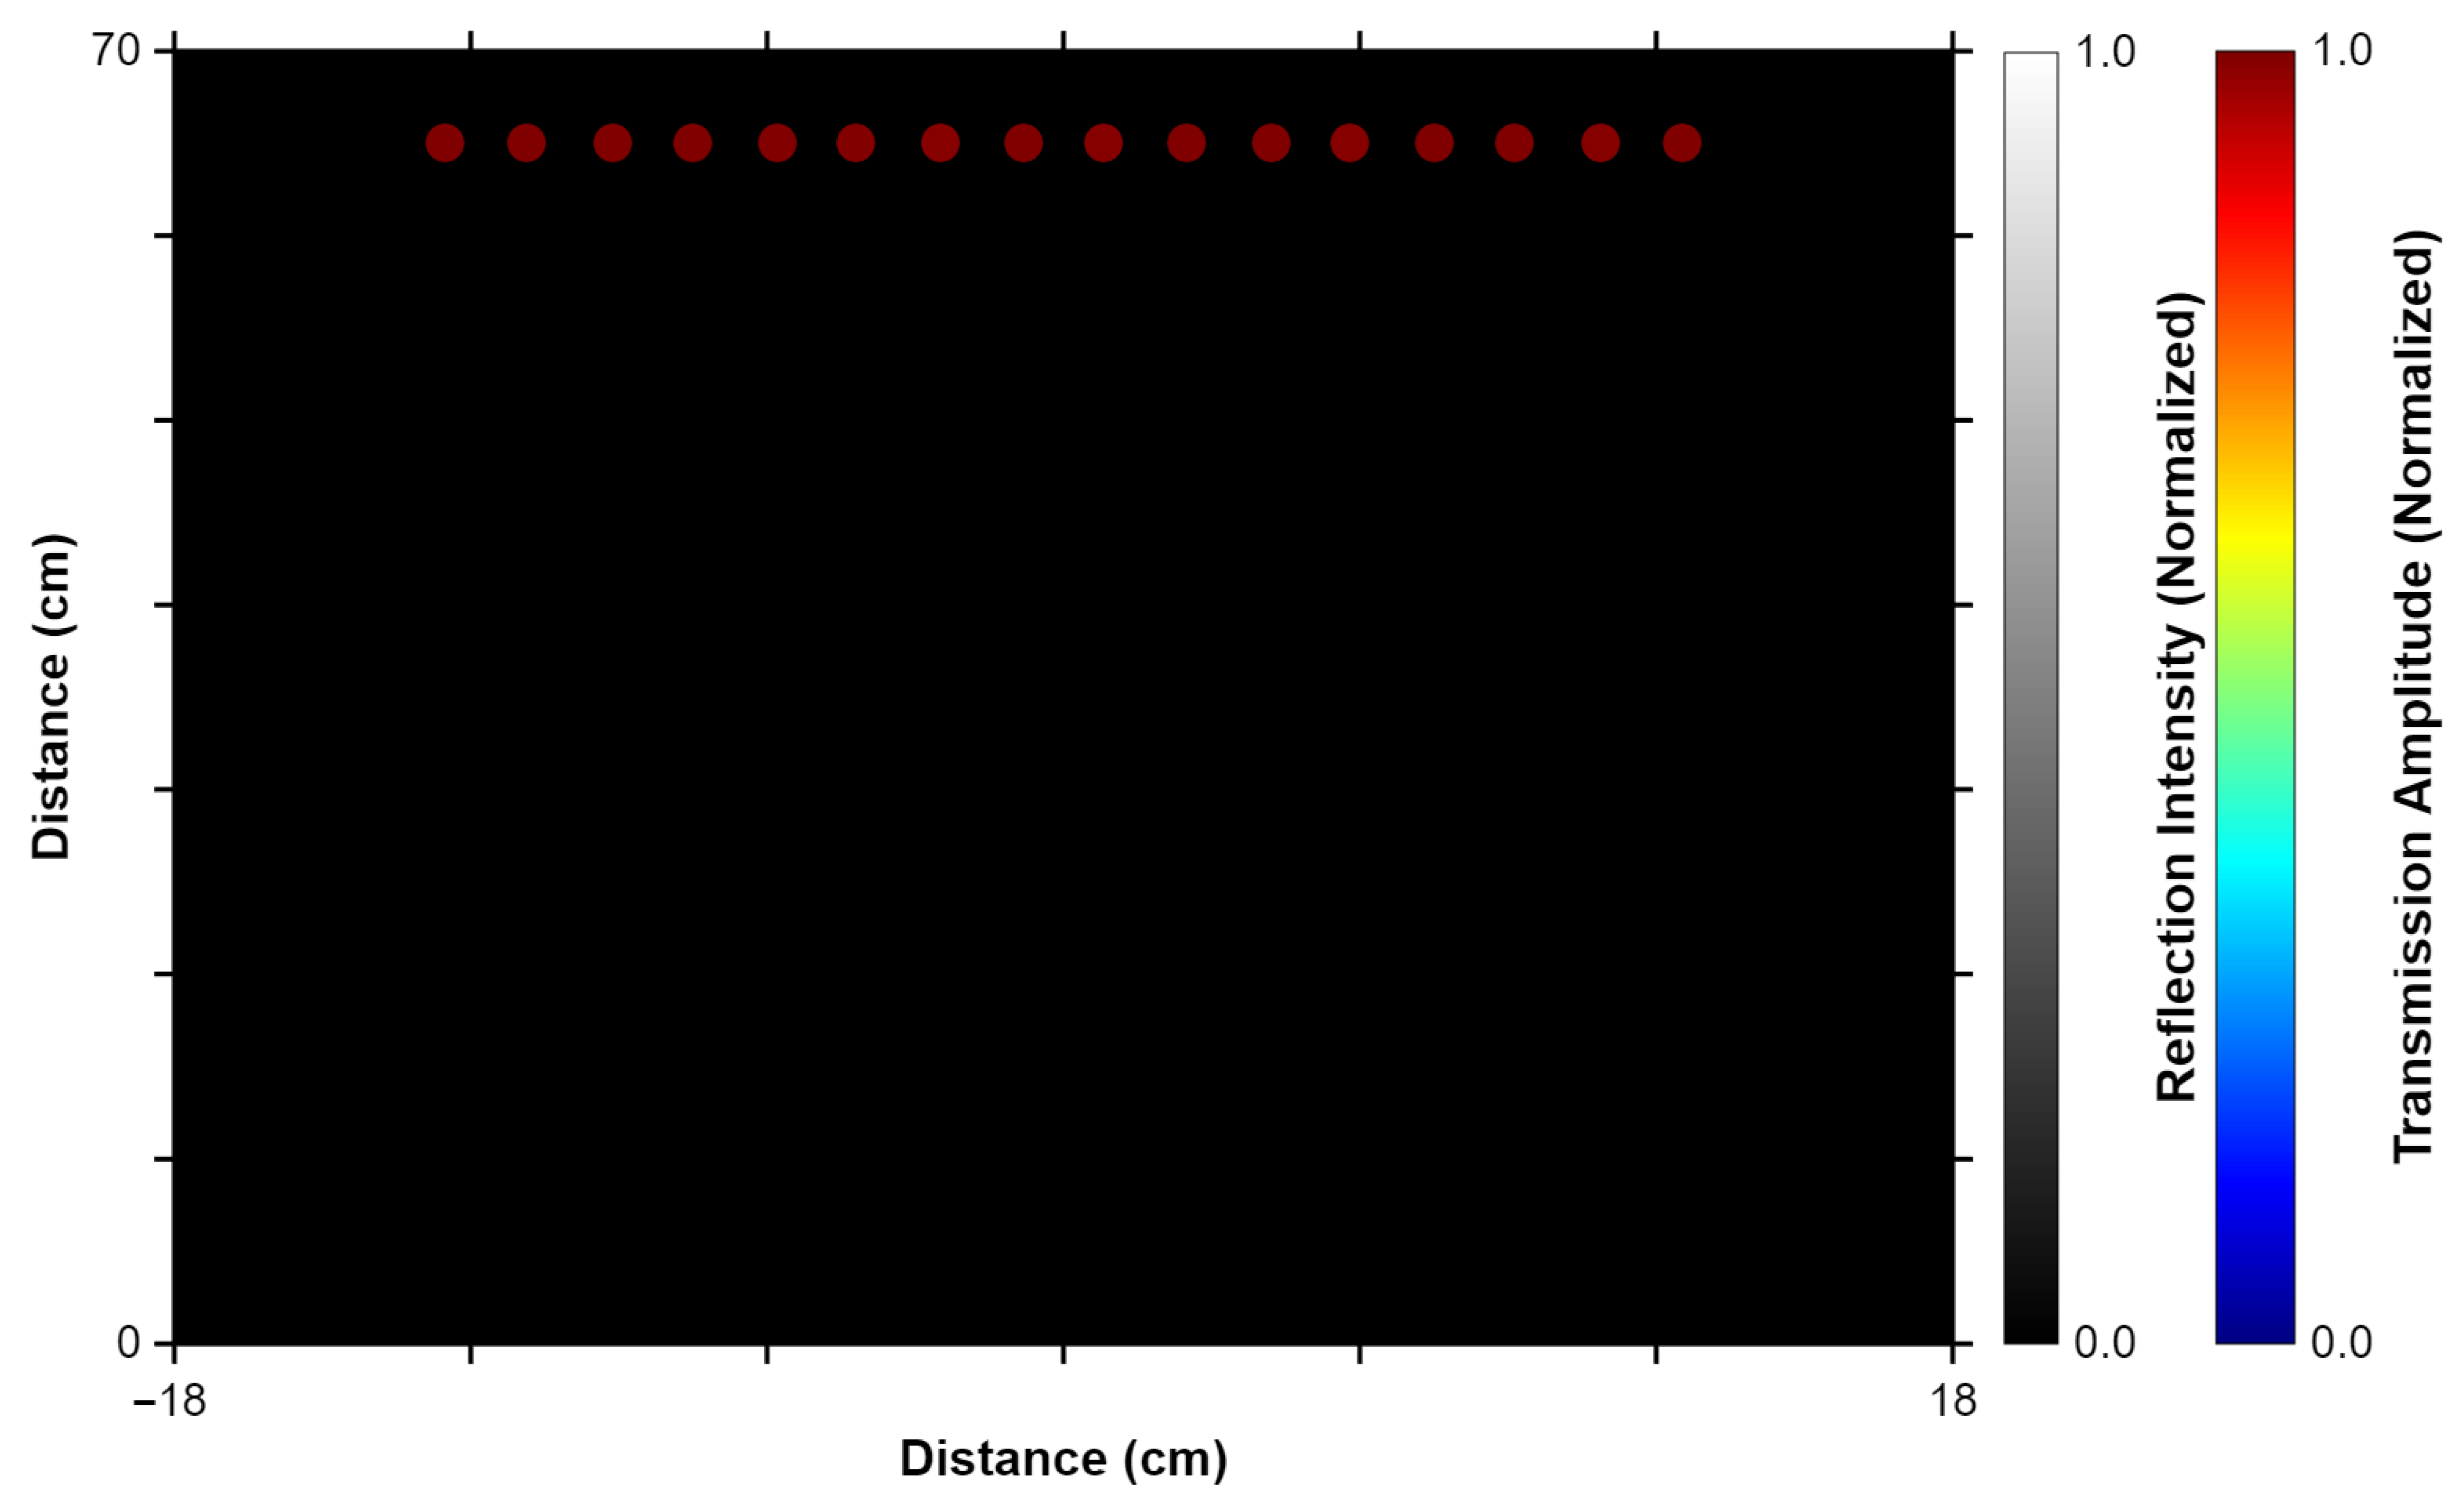
The reference image (Figure 7), obtained with all targets removed (i.e., the target condition matches the baseline condition), shows no significant reflections. In this visualization, the transmitters and reflection receivers are centered around the coordinate. The physical locations of the sixteen transmission receivers correspond to the sixteen positions shown at the top of the image. Each transmission receiver is color-coded according to the amplitude of the ultrasonic signal it detects: warmer colors correspond to higher transmission (1.0 or red corresponds to 405 mV), while cooler colors correspond to lower transmission (0.0 or blue corresponds to 0 mV). Because no targets are present, grayscale-coded reflections are absent, and every transmission receiver registers the relative full amplitude of the incoming signal, indicating an unobstructed signal path.
Figure 7.
Ultrasonic image of the test setup in the baseline (air-only) condition. Transmission receivers are represented by the top row of circles, color-coded by normalized detected signal amplitude from 0.0 (blue) to 1.0 (red).
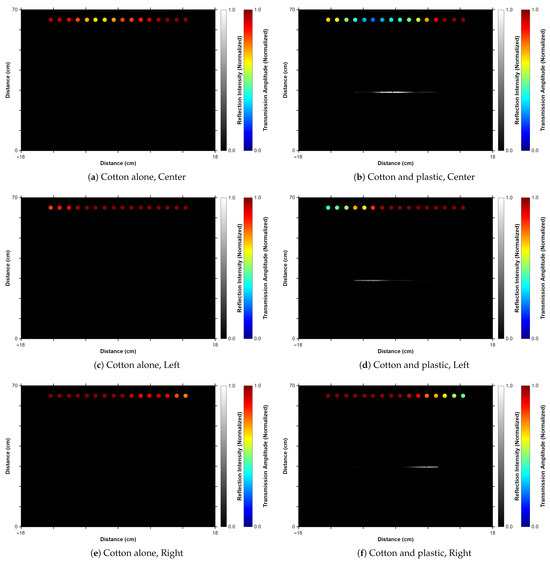
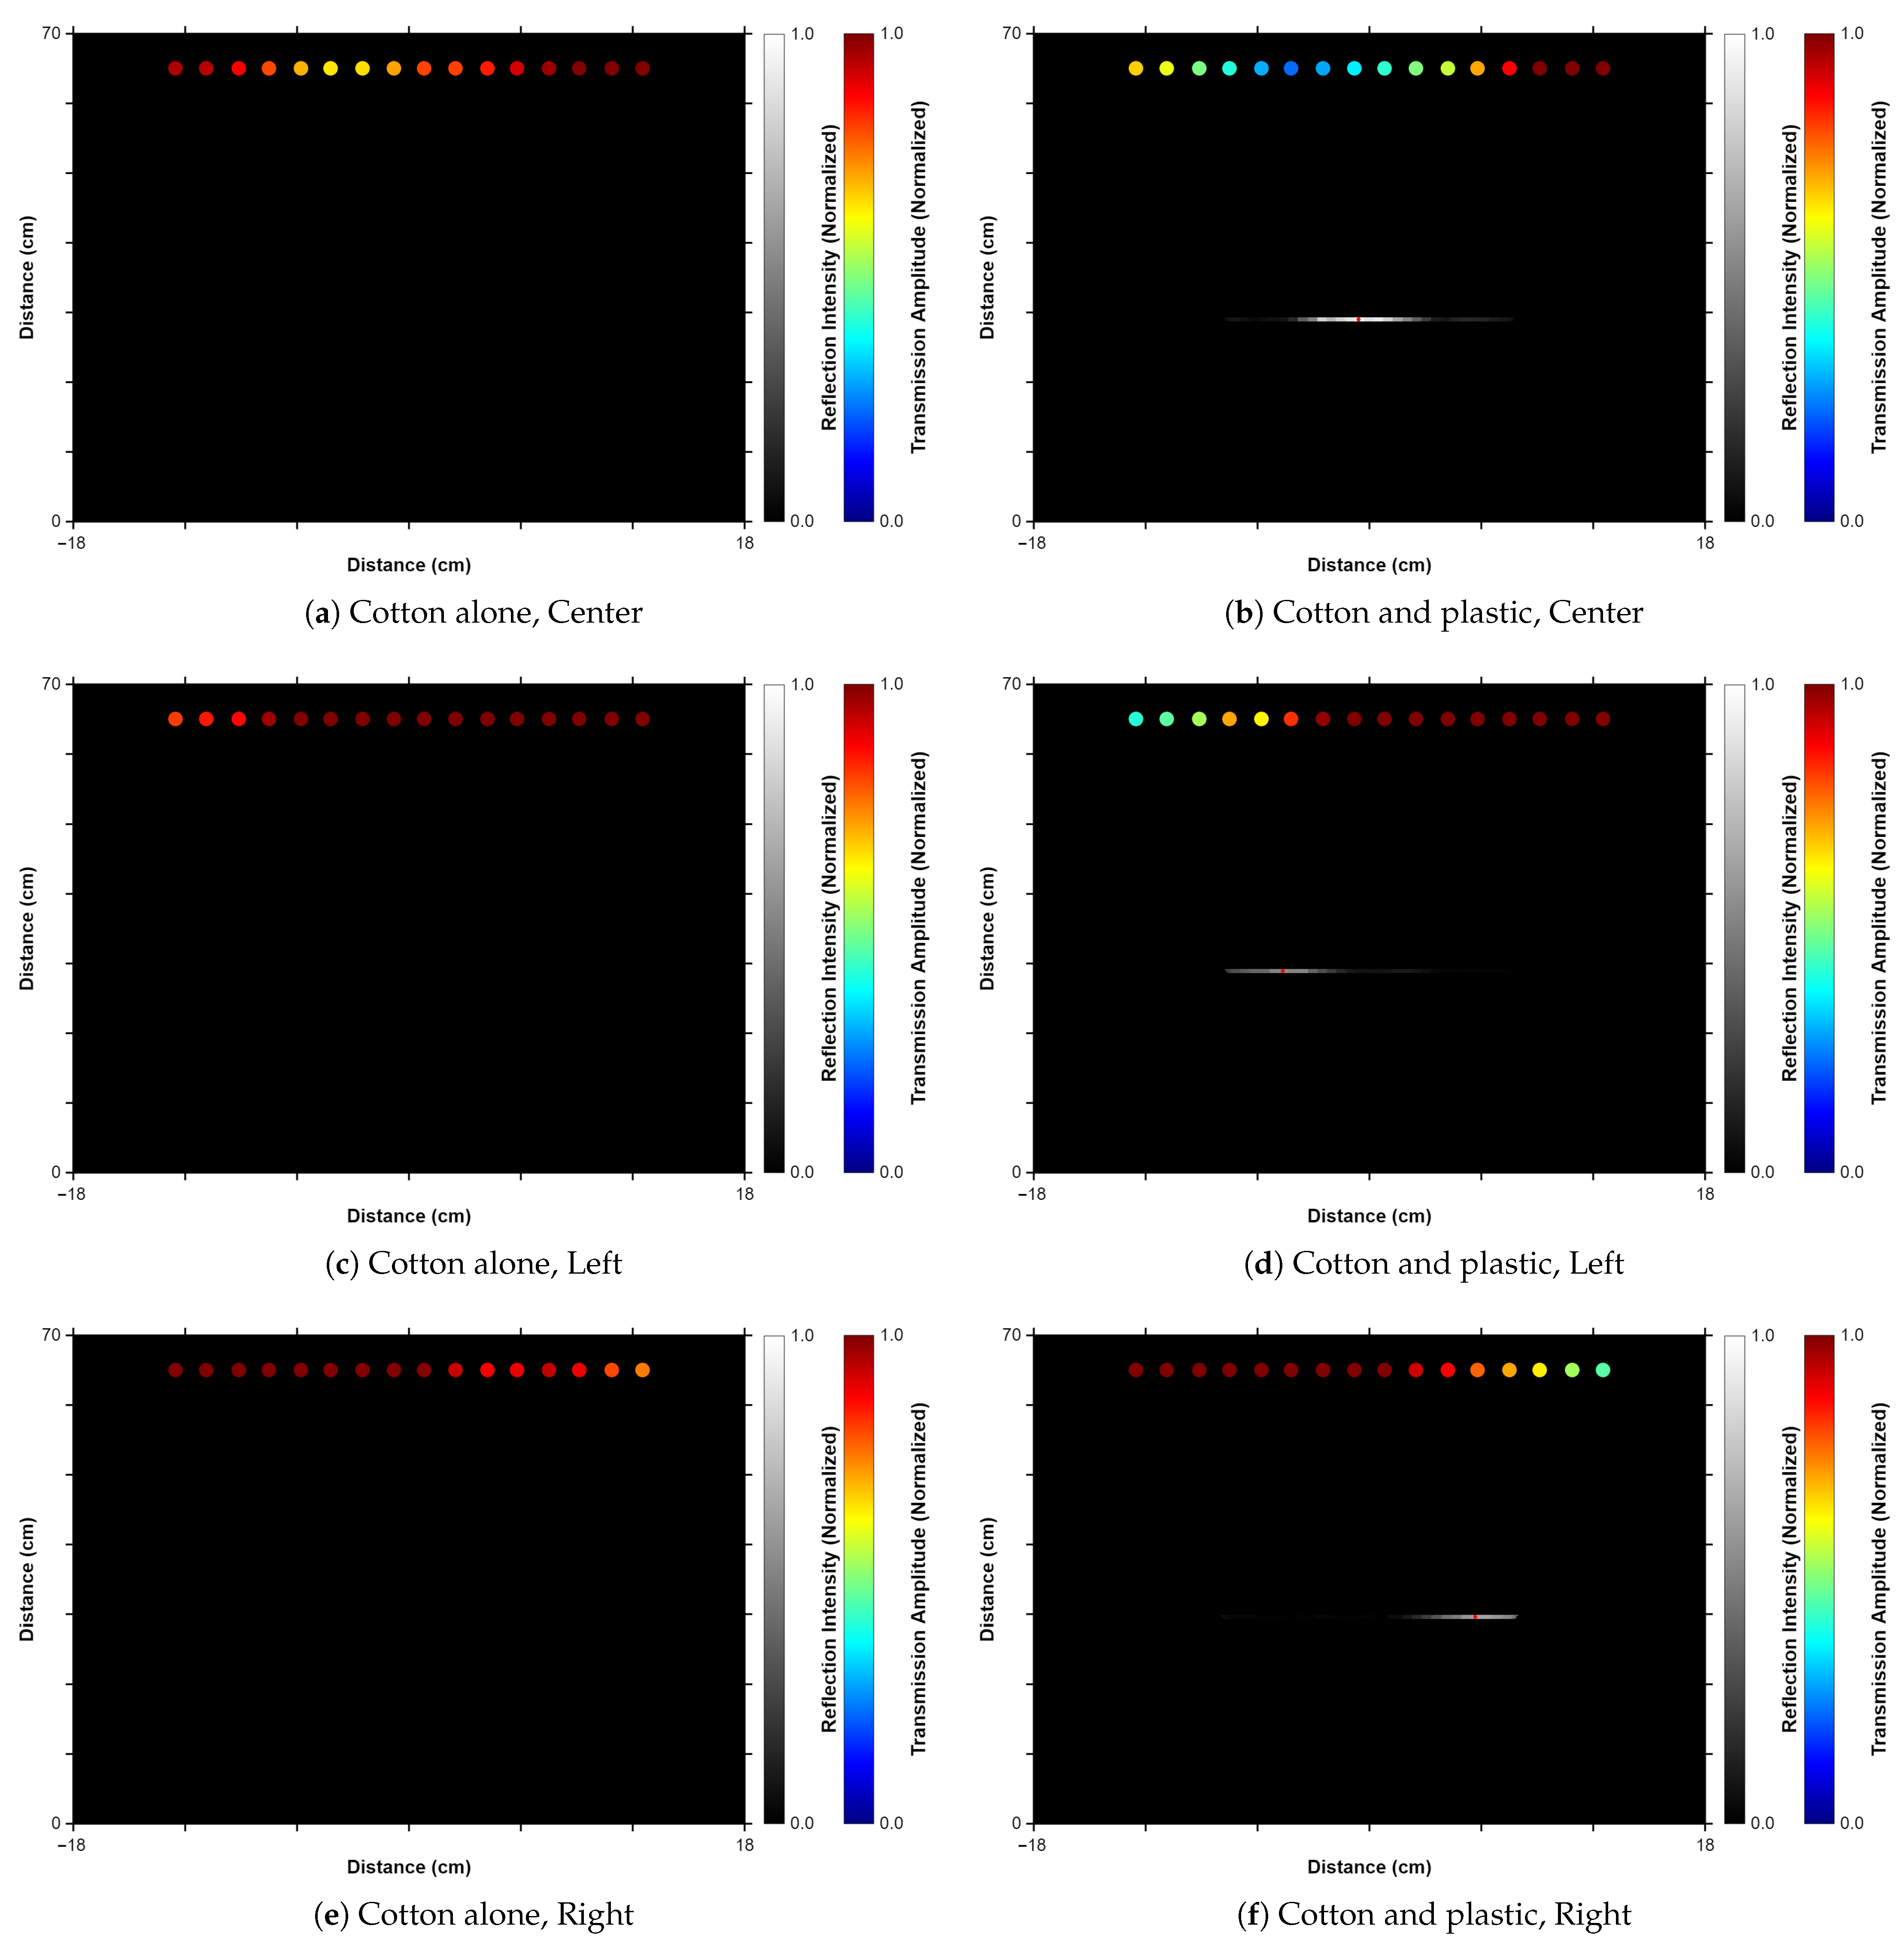
A comparison of the images shown in Figure 8 illustrates the impact of introducing cotton and subsequently plastic, as well as the system’s response to lateral translation. In the centrally-located cotton-only configuration (Figure 8a), reflections are minimal, with only slight attenuation in transmission observed in areas corresponding to the cotton. As the cotton becomes sparser at the edges, transmission levels increase. In contrast, the introduction of plastic (Figure 8b) produces a distinct echo at the plastic’s location, and a high-prominence local maximum is identified near the center of the plastic. Additionally, transmission values are notably reduced where the plastic is present due to the compounded obstruction from both the plastic and cotton. Furthermore, lateral translation of the target assembly—shifting it left and right, as demonstrated in Figure 8c–f—causes both the reflection peak and the spatial distribution of transmission voltages to shift accordingly. Shifting the setup in this manner demonstrates how, even when the plastic is translated off-center, detection is still feasible and consistently reinforced by the localized contrasts in transmission voltages.
Figure 8.
Ultrasonic images comparing the cotton-only baseline (left column) against cotton with an embedded plastic fragment (right column). The rows demonstrate the system’s response as the single-target assembly is positioned in the center (a,b), translated to the left (c,d), and translated to the right (e,f). The bright gray horizontal lines in the right column indicate ultrasonic reflections from the embedded plastic target. The top row of circles represents the transmission receivers, color-coded by normalized detected signal amplitude from low (cool colors) to high (warm colors). The isolated red dots plotted on the reflection echoes indicate detected local maxima.
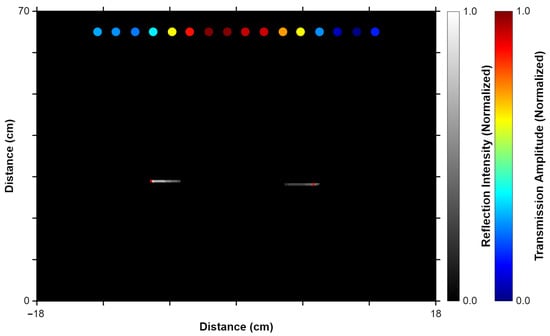
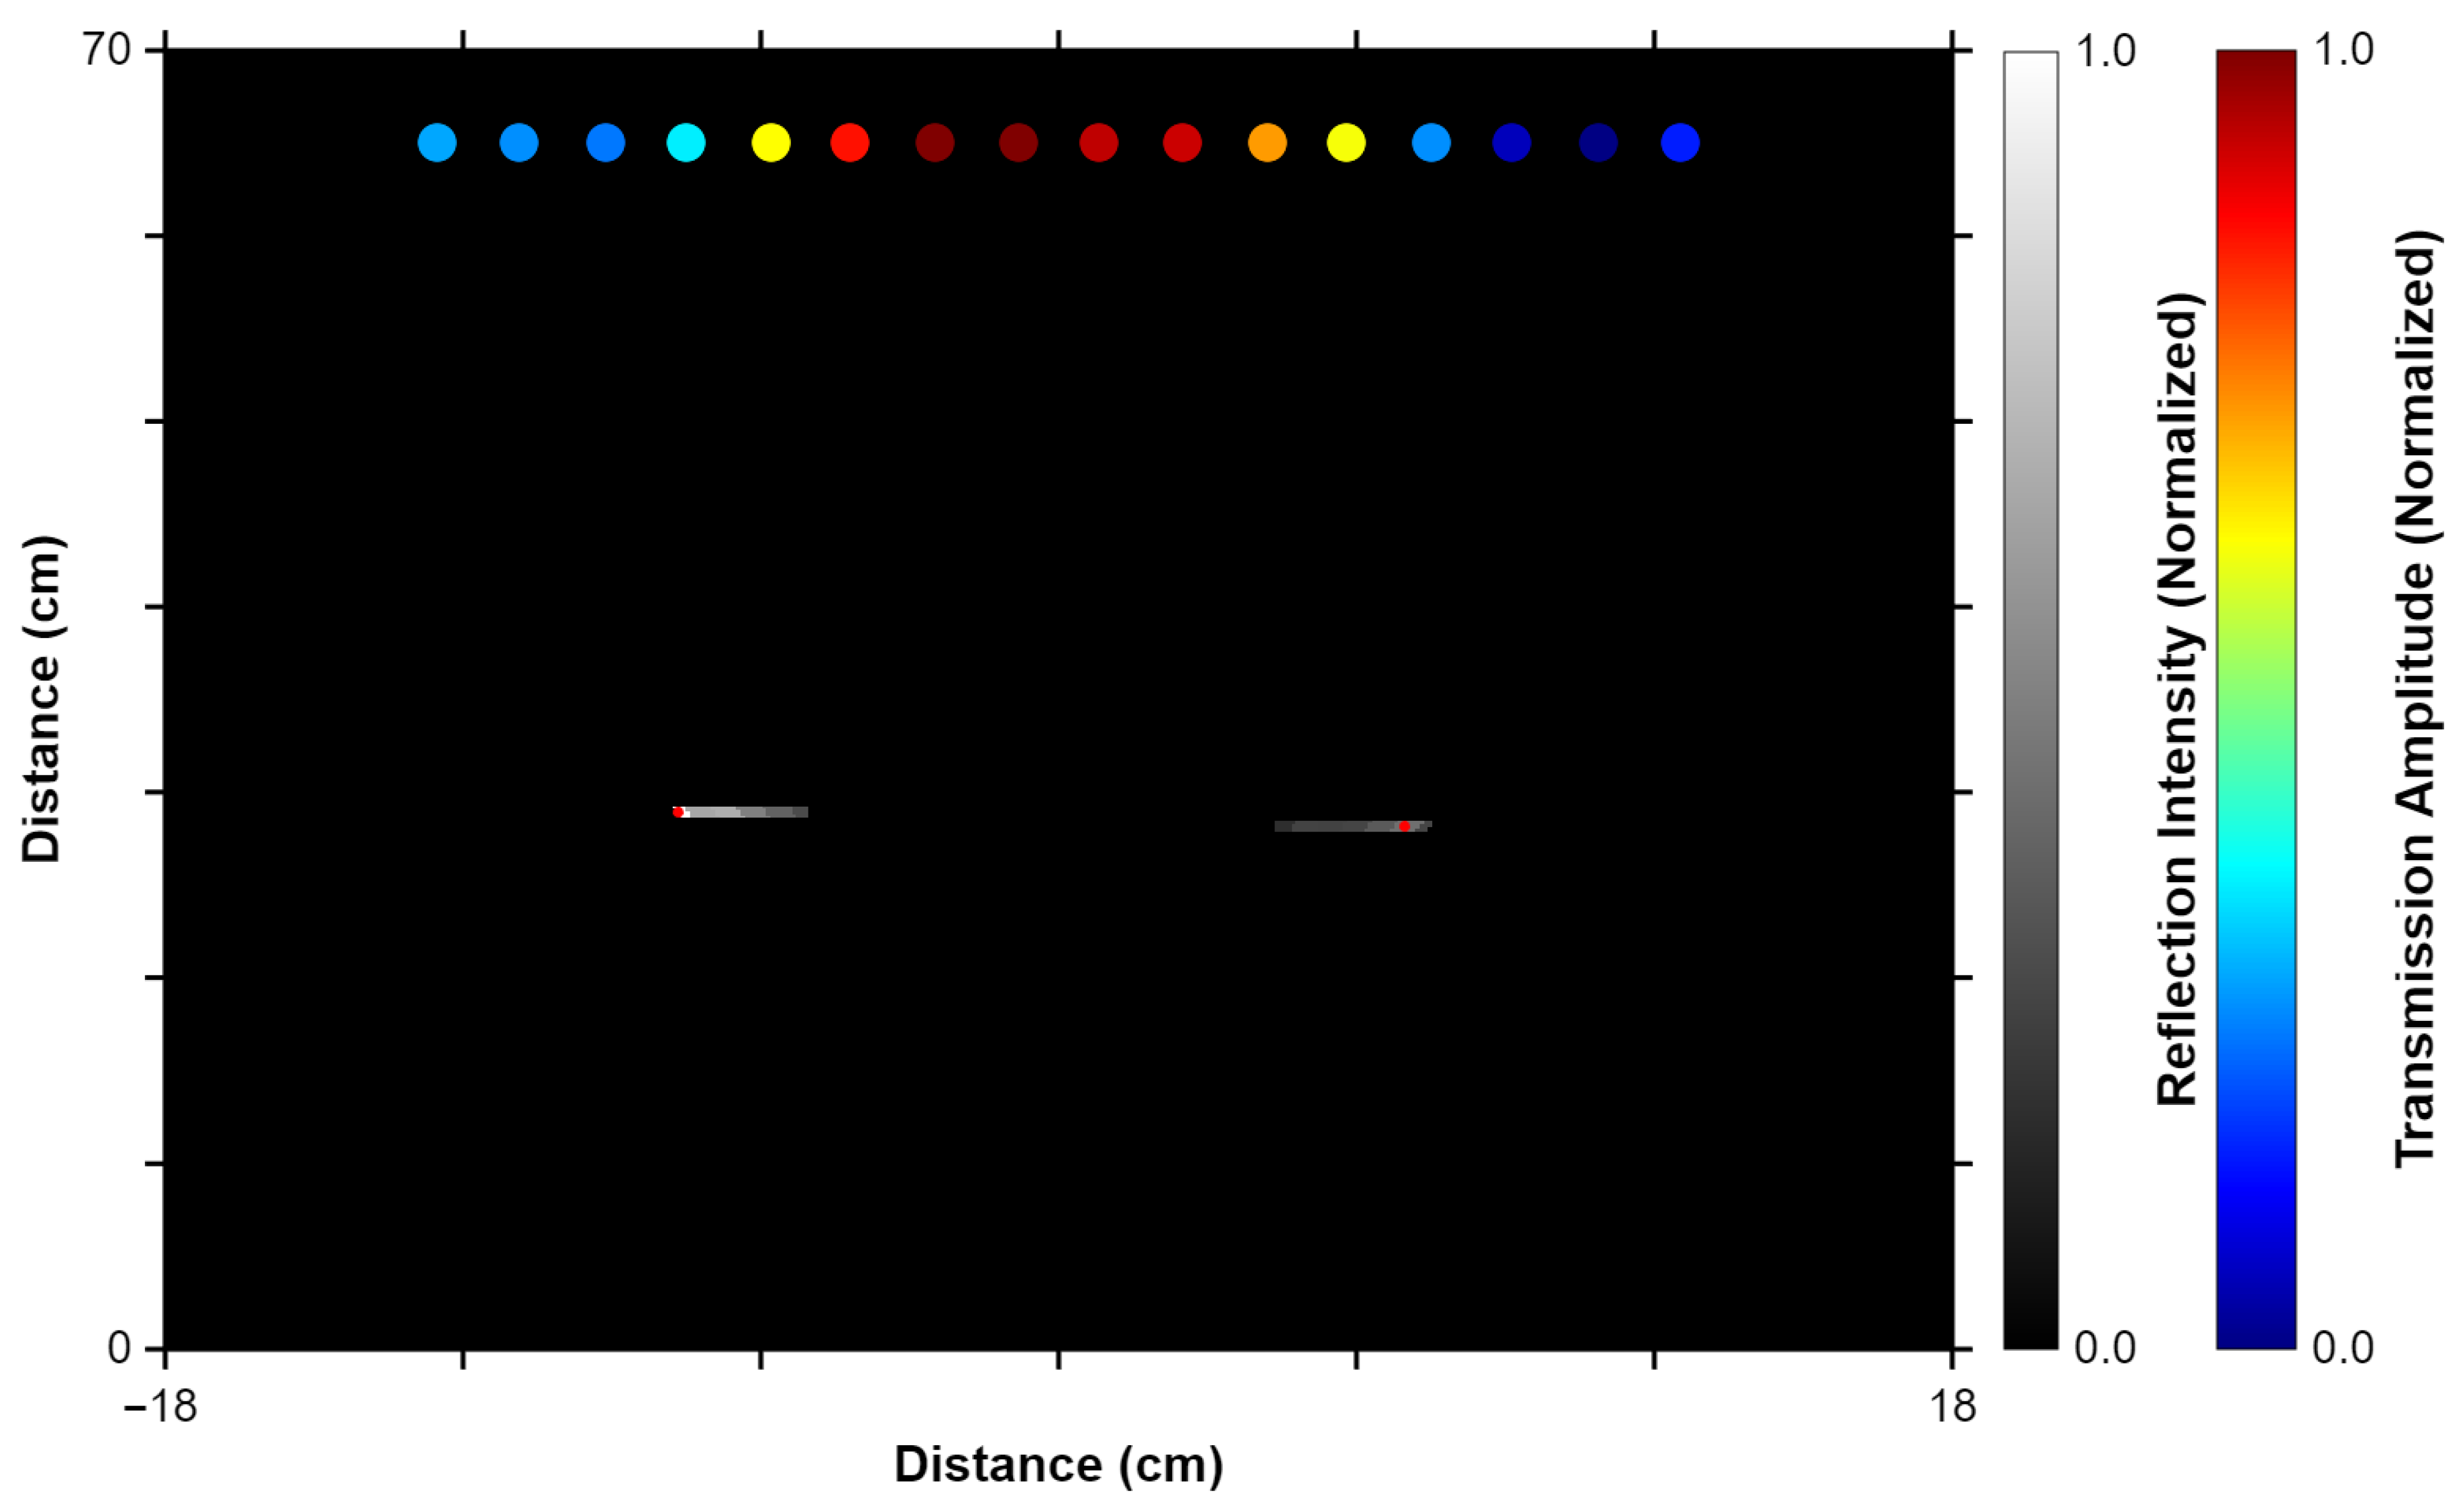
For the dual-target configuration, reflection normalization was performed using data specific to that setup (20 mV to 1.1 V). The resultant image, shown in Figure 9, demonstrates how two local maxima—and therefore two distinct targets—are produced from the data.
Figure 9.
Ultrasonic image produced from setup with two plastics separated by air with local maximum lateral filtering applied to mitigate lateral blurring. The top row of circles represents the transmission receivers, color-coded by normalized detected signal amplitude from low (cool colors) to high (warm colors). The isolated red dots plotted on the reflection echoes indicate detected local maxima.
The system’s sensitivity to target size was evaluated by analyzing the reflection and transmission data from the sequentially scaled plastic squares, alongside the supplemental seed cotton sample. For this specific set of comparisons, reflection voltages are normalized with respect to a range of 0 to 552 mV, and transmission voltages are normalized with respect to a range of 0 to 400 mV. The measured peak reflection voltages and effective transmission values for each target are summarized in Table 1.
Table 1.
Reflection and transmission voltages corresponding to various targets.
The primary objective was to identify the minimum plastic area that the system can reliably detect. The strength of the reflection from a plastic target is inherently determined by its physical properties—its size, shape, and orientation—which are fixed by the environment. In contrast, the most important controllable factor affecting our detection capability is the system’s signal-to-noise ratio (SNR). Improvements in SNR, which directly determine our ability to discern small differences in reflection, could be achieved by increasing the transmitted driver voltage or by focusing the beam more tightly to enhance lateral resolution. It is also important to note that these experiments were conducted with the cotton sample fixed at an axial distance of 27 cm from the transmitters—a realistic configuration for practical applications—but detection performance will vary with axial distance.
Our results indicate that under the current conditions, plastic targets with an area of approximately produce a clearly distinguishable reflection. In contrast, when the target size is reduced to , the reflection voltage noticeably attenuates, suggesting that the system’s detection threshold lies around the mark for this distance. Furthermore, findings from the supplemental test show that, although abundant seeding does have a minor impact on transmitted voltages, the presence of seeds themselves does not induce prominent reflections.
3.2. Lateral Resolution
Lateral resolution refers to the minimum angular separation at which two laterally adjacent targets can be resolved as distinct reflectors. In this system, the theoretical lateral resolution is governed by the half-power beamwidth () of the receiver array factor. For an object (or pair of objects) at a radial distance r from the transmitter, the smallest resolvable lateral distance is given by
Given the geometry of this setup, Equation (2) predicts a half-power beamwidth of . Objects separated by angles larger than this threshold should appear distinctly—if otherwise detectable—whereas those below it merge into a single echo in reflection-mode images.
Based on the first lateral resolution experiment involving single acrylic reflectors of varying widths, the lateral (x-axis) intensity profile was extracted at the y-coordinate belonging to the dominant local maximum in the reflection image. For small reflectors—with center-to-edge angular widths (relative to the transmitters) well below ––the echo amplitude decreased to of its peak value at from the center. This value represents the baseline lateral spread arising from the system’s beam profile and is consistent with the expected half of the beamwidth. In contrast, larger reflectors, such as a 50.8 mm target with a center-edge angular width of , exhibited a broader lateral spread of approximately . The results, summarized in Table 2, indicate that when the angular size of a target remains below the half-power beamwidth, the measured lateral width remains essentially constant at about . However, as the target’s angular extent increases beyond this threshold, the measured lateral spread increases accordingly. This indicates that the main lobe shape plays a primary role in dictating the apparent echo width (and by extension, the amount of lateral blurring).
Table 2.
Object size and corresponding measured lateral blur.
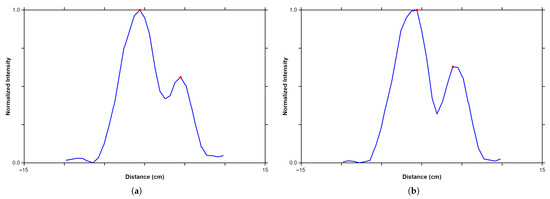
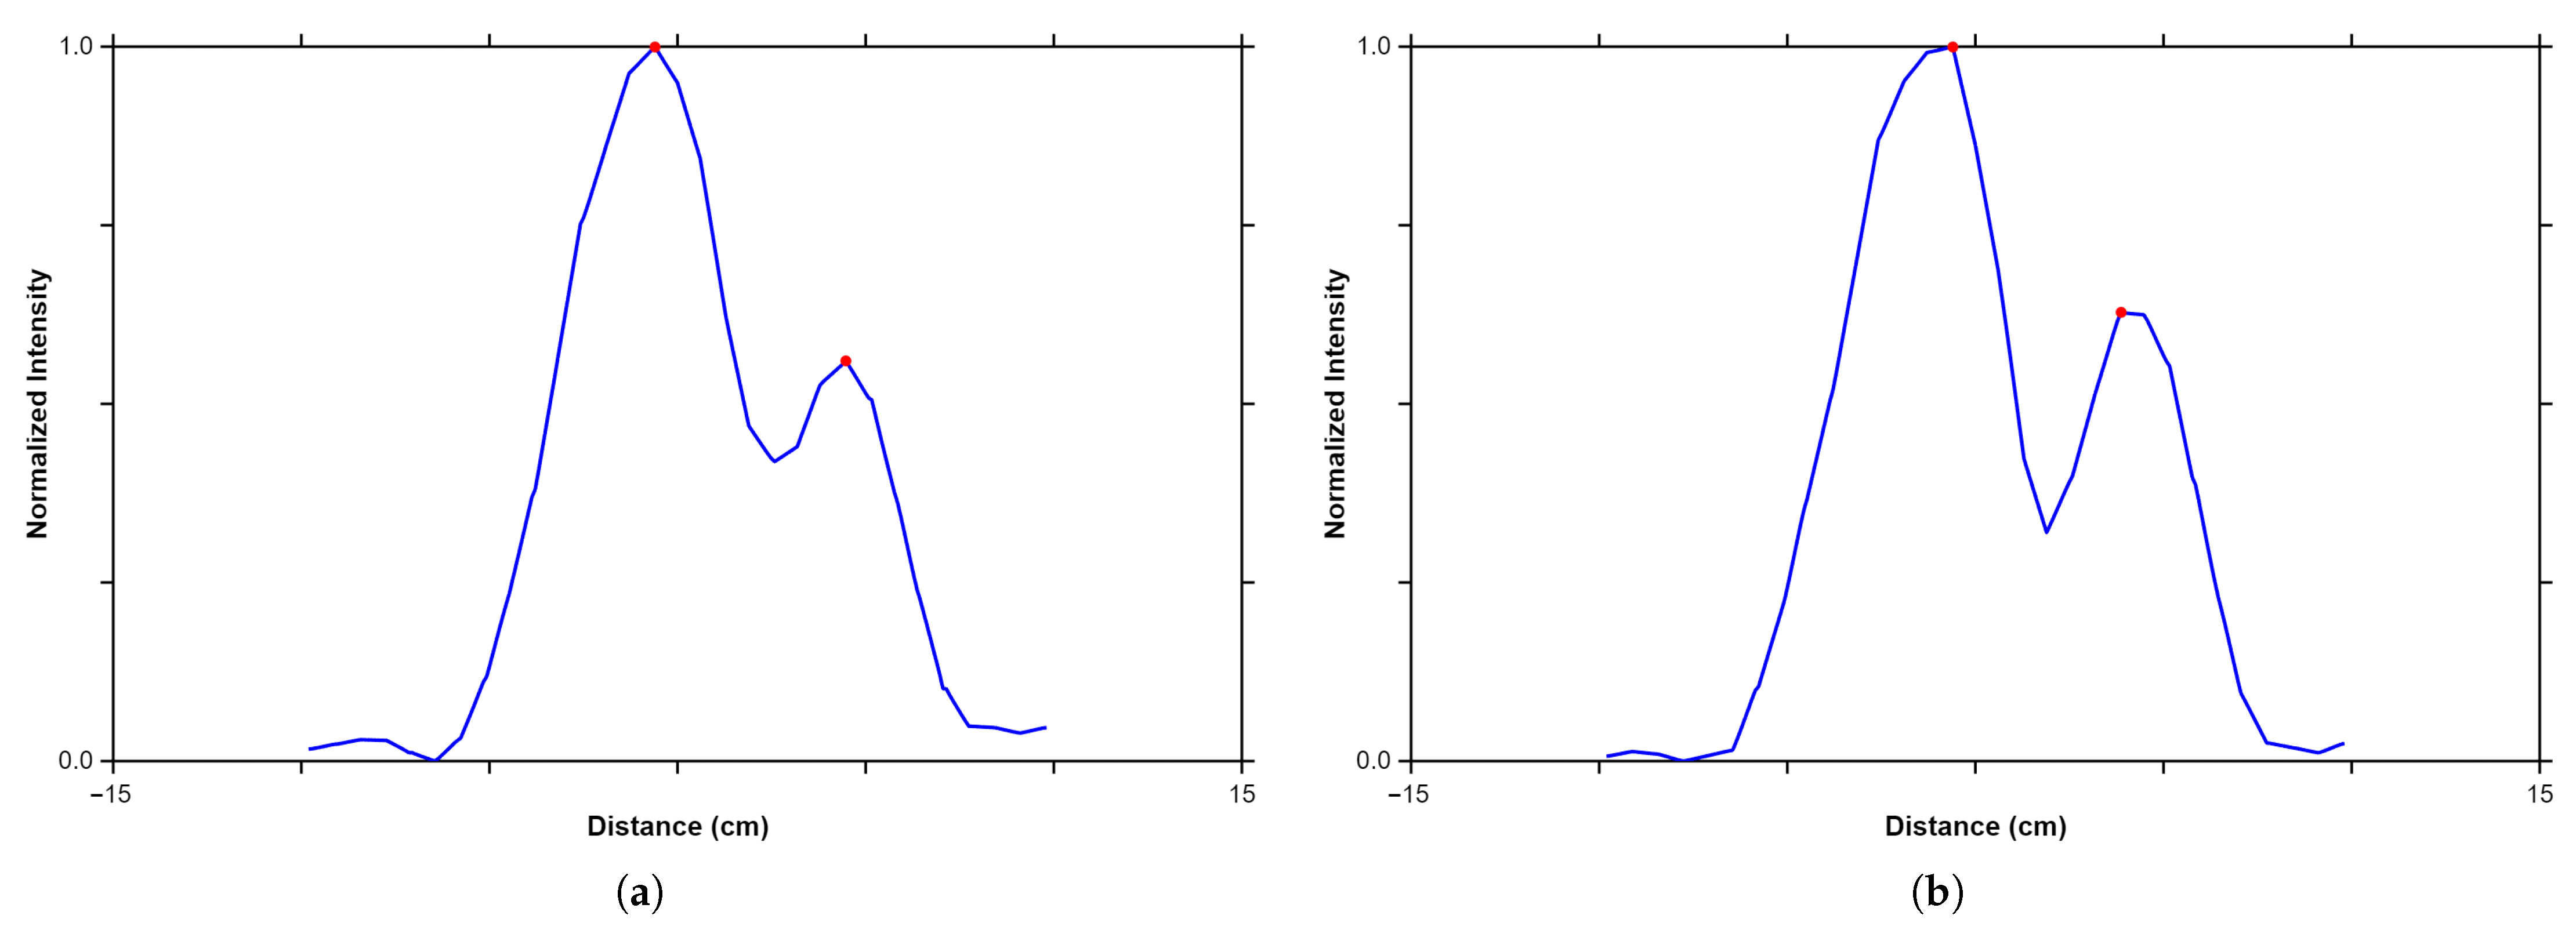
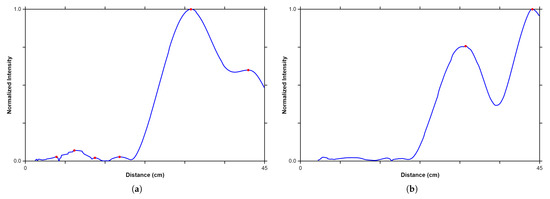
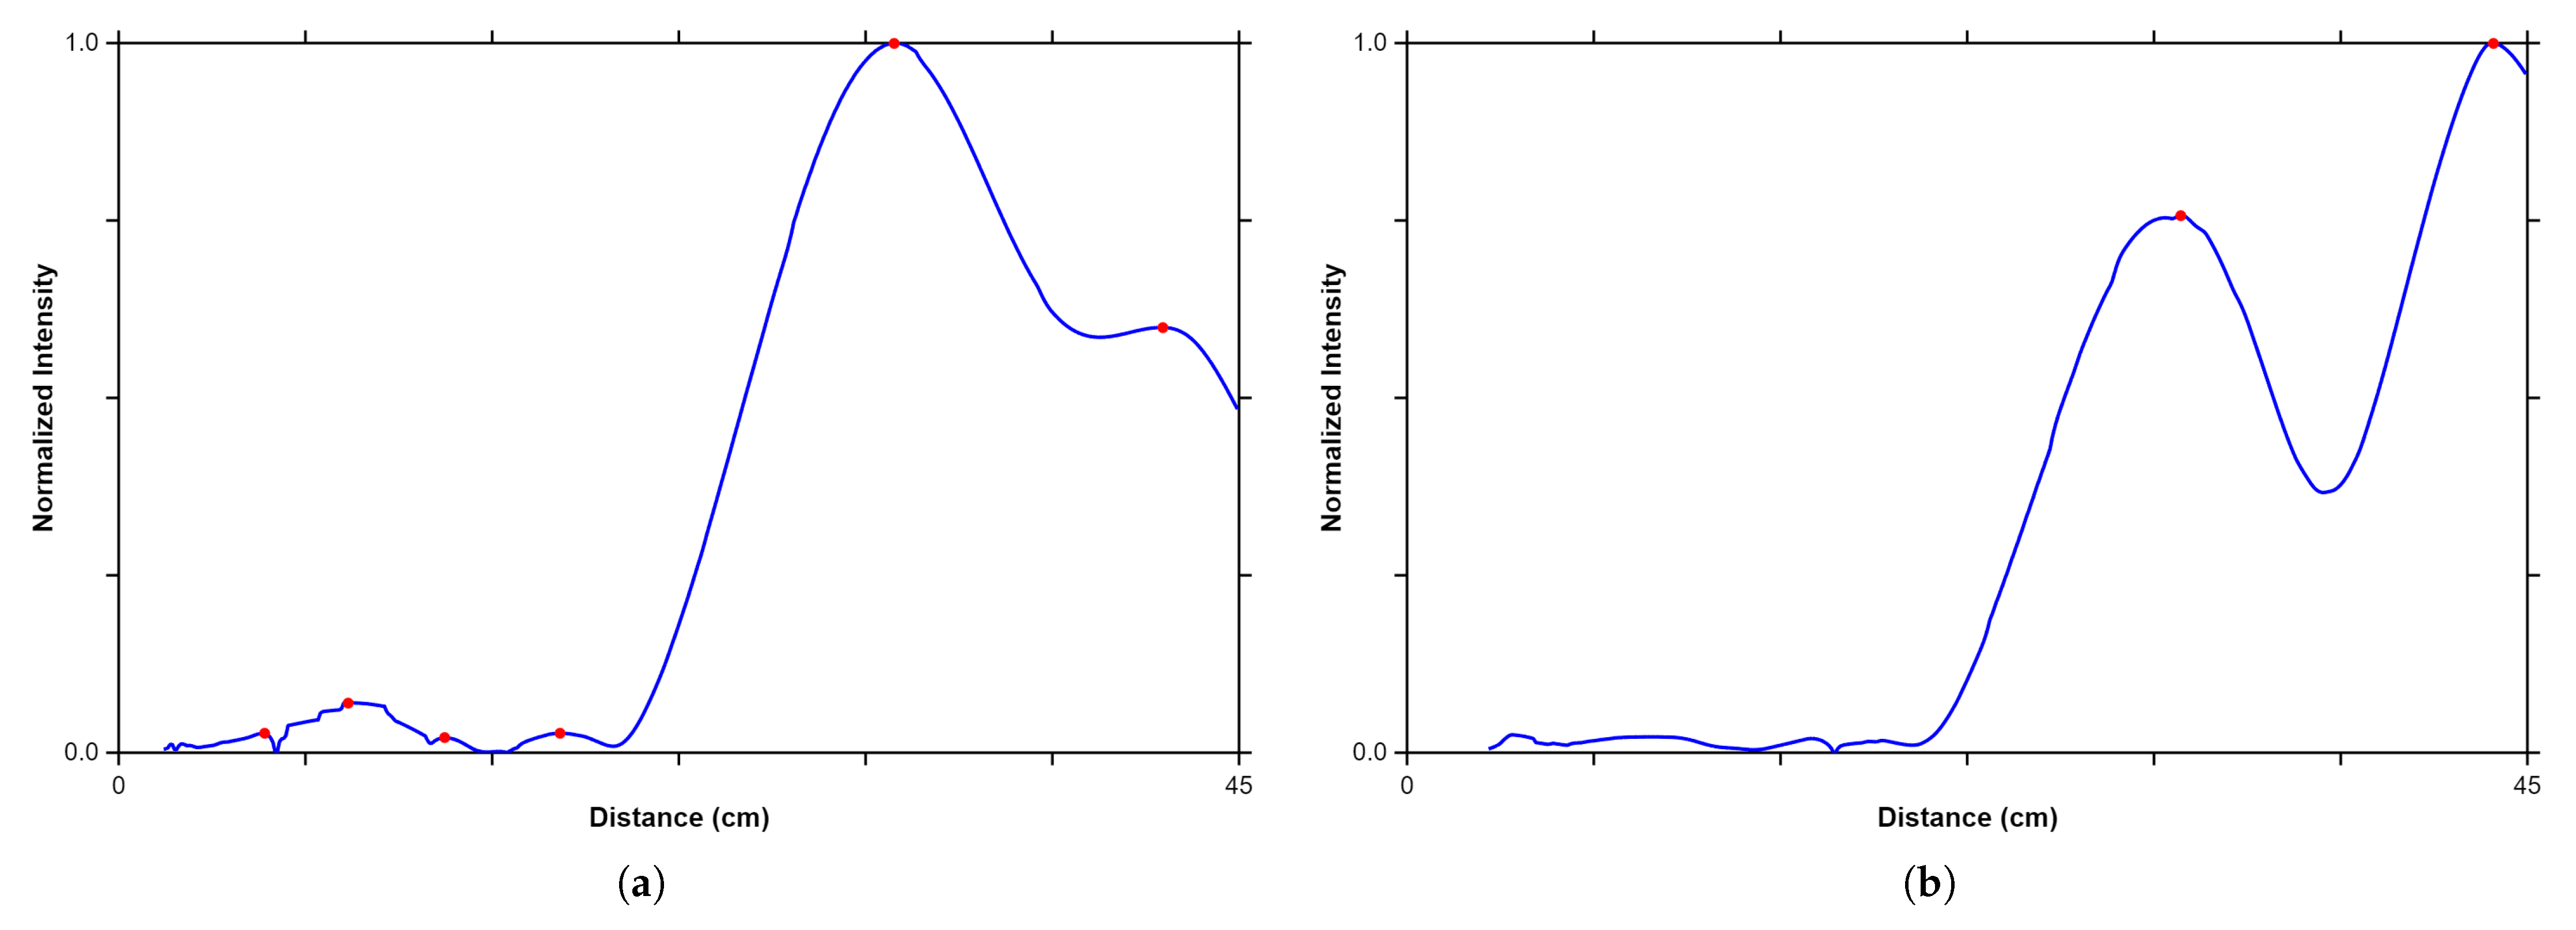
For the second experiment involving two parallel acrylic sheets, a lateral (x-axis) line profile, sampled at the axial depth of the ultrasound image where the reflection echo exhibits its 2D local maximum (see Figure 10), was extracted to illustrate how the two echoes merge as the sheets move closer together. In one configuration (16 mm edge separation), the minimum center-to-center angular separation was approximately 6.71°; in another (11 mm edge separation), it was approximately 5.74°. These center-to-center measurements closely match the 5.6° theoretical limit, indicating that once the reflector centers are separated by less than this value, their echoes nearly completely overlap.
Figure 10.
Lateral (x-axis) line profile, sampled at the axial depth of the ultrasound image where the reflection echo exhibits its 2D local maximum. (a) shows a lateral separation of 11 mm and (b) shows a lateral separation of 16 mm. The red dots indicate detected local maxima.
Enhancing lateral resolution requires narrowing the half-power beamwidth. This can be achieved by increasing the array size, corresponding to an increase in the number of transmitters/receivers (and therefore the system’s monetary and computational cost). A secondary requirement is that the transmitter sweep must be done in finer step increments to yield denser lateral data.
3.3. Axial Resolution
Axial resolution, defined as the system’s ability to distinguish two reflectors along the depth (propagation) axis, is primarily determined by the duration of the transmitted burst. In theory, the axial resolution can be expressed as
where c is the speed of sound in air and is the effective duration—or width—of a burst. Although each transmitter is excited with a 40 kHz burst of 15 cycles, the shape of the actual pressure wave is influenced by the transducer’s transfer function. Based on the initial calibration experiment recorded via oscilloscope, and using the 3 dB points on the received signal, was found to be approximately 597 s. This yields a theoretical axial resolution of about 10.2 cm.
For the practical verification involving two acrylic reflectors, resolution was evaluated by analyzing the axial intensity profile of the reflection image (see Figure 11). A y-axis profile at the location of the highest overall echo intensity was used, and local maximum detection identified distinct reflection peaks. As the axial separation between the two reflectors decreased, the two peaks merged into a single maximum when the separation dropped below the system’s resolution limit. In this analysis, the reflectors were considered resolved when two distinct local maxima, separated by a clear valley, were identifiable. This condition was lost when the back reflector was positioned closer than 10.3 cm behind the front reflector, a result that closely matches the theoretical 10.2 cm limit. Enhancing axial resolution would require a driver signal or transducer capable of producing a shorter pulse duration.
Figure 11.
Axial (y-axis) line profile, sampled at the lateral point of the ultrasound image where the reflection echo exhibits its 2D local maximum. (a) shows an axial separation of 103 mm and (b) shows an axial separation of 121 mm. The red dots indicate detected local maxima.
3.4. Future Work
The results of this study establish that ultrasonic phased-array imaging holds promise as a complementary approach to existing optical machine-vision systems for detecting obscured plastic contaminants. To translate this laboratory-based proof-of-concept into a viable industrial product, several key areas of research and system development must be addressed in subsequent iterations.
First, the system must be transitioned from evaluating static targets to performing real-time acquisition within a dynamic, fast-moving stream of cotton. At present, the system cannot make measurements in real-time as cotton moves past the array because the non-optimized acquisition and software processing pipeline is relatively slow. To theoretically determine the maximum velocity () at which cotton can move while still allowing for accurate contaminant detection, the system’s geometric and processing constraints can be modeled as
where is the maximum active interaction depth within the beam, B is the number of acoustic bursts per angle, N is the number of angles per sweep, is the burst period, and is the computational processing overhead incurred per frame.
To illustrate this constraint, consider a target positioned 50 cm away axially. Given the transducers’ directivity, this yields a maximum interaction depth of cm. Assuming a minimal scanning configuration of one acoustic burst () for a single angle () with a burst period of ms, an idealized system with negligible processing overhead () achieves a fundamental acoustic tracking limit of approximately 111 m/s. However, incorporating an example unoptimized software processing time of ms drops this maximum trackable velocity to roughly 7.8 m/s. Because overwhelmingly dominates the denominator in its current state, achieving dynamic tracking requires migrating the software to a dedicated, high-speed embedded architecture.
Second, future testing should explore a wider variety of materials. While this initial study focused on a single type of polyethylene and one variety of cotton, working gins process different cotton cultivars and encounter multiple types of plastic contaminants, such as polypropylene and polyvinyl chloride [8]. It will be important to evaluate how these differing acoustic impedances and fluctuating cotton moisture levels affect the system’s overall detection capabilities.
Finally, subsequent hardware iterations must focus on industrial system integration and comparative benchmarking. Future field-ready prototypes will need to be tailored in terms of physical footprint and power consumption to interface seamlessly with existing cotton processing environments. Furthermore, conducting large-scale, head-to-head empirical benchmarking against mature industrial sorting systems will be required to fully quantify the competitive advantages and economic viability of the phased-array approach in a high-throughput environment.
4. Conclusions
Cotton is a sustainable, natural fiber that supports a $40 billion global market and provides employment for over 350 million people. Protecting this vital agricultural economy requires robust contaminant detection. This study demonstrated that an ultrasonic phased-array imaging system can successfully identify plastic contaminants even when they are entirely obscured by cotton fibers or lack visual contrast, effectively overcoming the limitations of traditional optical inspection. Furthermore, the phased-array configuration, enabled by precise electronic beam steering and synchronized data acquisition, provides a cost-effective scanning approach without moving parts. This solid-state design inherently enhances system reliability and mechanical longevity in demanding processing environments.
Experiments revealed that both reflection and transmission configurations offer valuable information for distinguishing plastic contaminants from the surrounding cotton and other materials. Preliminary results indicate that the system’s amplitude-based detection strategy effectively differentiates between contaminants and non-contaminants, validating the underlying principles of ultrasonic imaging in this application. Ultimately, this research aims to lay a foundational engineering framework for advancing plastic contaminant detection in the cotton processing industry.
Author Contributions
V.B.M., N.K., A.B. and H.S.-S. conceived the original idea. A.B., M.S. and H.S.-S. designed, analyzed, and supervised the project. E.E. and A.F. designed and executed the experiments, implemented the algorithms, and analyzed the results. E.E. wrote and revised the final manuscript based on input and feedback from all authors. V.B.M. and N.K. provided critical industry-related feedback. All authors have read and agreed to the published version of the manuscript.
Funding
This research was funded by Cotton Incorporated under grant 22-760.
Institutional Review Board Statement
Not applicable.
Informed Consent Statement
Not applicable.
Data Availability Statement
All code and data necessary to produce the main figures and content have been made available at https://github.com/xanderel/UltrasonicPlasticDetection (accessed on 27 February 2026).
Conflicts of Interest
The authors declare no conflicts of interest. The funders had no role in the design of the study; in the collection, analysis, or interpretation of data; in the writing of the manuscript; or in the decision to publish the results.
References
- Khan, M.A.; Ahmad, S.; Hasanuzzaman, M. World Cotton Production and Consumption: An Overview. In Cotton Production and Uses; Ahmad, S., Hasanuzzaman, M., Eds.; Springer: Singapore, 2020. [Google Scholar] [CrossRef] [Scilit]
- Adeleke, A.A. Technological advancements in cotton agronomy: A review and prospects. Technol. Agron. 2024, 4, e008. [Google Scholar] [CrossRef] [Scilit]
- Allen, A.; Foulk, J.; Gamble, G. Preliminary Fourier-transform infrared spectroscopy analysis of cotton trash. J. Cotton Sci. 2007, 11, 68–74. [Google Scholar]
- Himmelsbach, D.S.; Akin, D.E.; Kim, J.; Hardin, I.R. Chemical structural investigation of the cotton fiber base and associated seed coat: Fourier-transform infrared mapping and histochemistry. Text. Res. J. 2003, 73, 281–288. [Google Scholar] [CrossRef] [Scilit]
- USDA-AMS C&T. Plastic Contamination Remains Industry-Wide Focus. 2020. Available online: https://content.govdelivery.com/attachments/USDAAMS/2020/07/24/file_attachments/1502672/2%20-Plastic%20Contamination%20Remains%20Industry-Wide%20Focus,%20final%20Plastic%20article%20with%20header,%207-7-20.pdf (accessed on 10 January 2026).
- Blomquist, G. We Can Stop Contamination—This Is the Way to Do It. In Proceedings of the 1997 Beltwide Cotton Conferences, New Orleans, LA, USA, 6–10 January 1997. [Google Scholar]
- Loptex. The Most Comprehensive and Accurate System for the Detection and Removal of Contamination. 2025. Available online: https://www.loptex.it/spinning.html (accessed on 10 January 2026).
- Haney, B.; Byler, R.K. Plastic Impurities Found in Cotton. In Proceedings of the 2017 Beltwide Cotton Conferences, Dallas, TX, USA, 4–6 January 2017. [Google Scholar]
- Valco, T. Industry Must Stop Contamination. Cotton Farming. 2014. Available online: https://www.cottonfarming.com/research-promotion/industry-must-stop-contamination/ (accessed on 10 January 2026).
- Adeleke, A.A.; Hardin, R.G.; Pelletier, M.G. Design of a plastic removal mechanism for cotton gin. In Proceedings of the 2021 Beltwide Cotton Conferences, Virtual, 5–7 January 2021. [Google Scholar]
- Adeleke, A.A. A review of plastic contamination challenges and mitigation efforts in cotton and textile milling industries. AgriEngineering 2023, 5, 193–217. [Google Scholar] [CrossRef] [Scilit]
- Georgia Cotton Council. Prevention of Plastic Contamination. 2025. Available online: https://georgiacottoncommission.org/prevention-of-plastic-contamination/ (accessed on 25 February 2025).
- Bange, M.P.; van der Sluijs, M.H.J.; Constable, G.A.; Gordon, S.G.; Long, R.L.; Naylor, G.R.S. A Guide to Improving Australian Cotton Fibre Quality, 1st ed.; The Cotton Research and Development Corporation: Narrabri, NSW, Australia, 2017. [Google Scholar]
- Hardin, R.G.; Huang, Y.; Poe, R. Detecting plastic trash in a cotton field with a UAV. In Proceedings of the 2018 Beltwide Cotton Conferences, San Antonio, TX, USA, 3–5 January 2018; pp. 3–5. [Google Scholar]
- Zhiqiang, Z.; Xuegeng, C.; Ruoyu, Z.; Fasong, Q.; Qingjian, M.; Jiankang, Y.; Haiyuan, W. Evaluation of residual plastic film pollution in pre-sowing cotton field using UAV imaging and semantic segmentation. Front. Plant Sci. 2022, 13, 991191. [Google Scholar] [CrossRef] [Scilit] [PubMed]
- Xiong, Y.; Zhang, Q.; Chen, X.; Bao, A.; Zhang, J.; Wang, Y. Large scale agricultural plastic mulch detecting and monitoring with multi-source remote sensing data: A case study in Xinjiang, China. Remote Sens. 2019, 11, 2088. [Google Scholar] [CrossRef] [Scilit]
- Rutherford, R.D.; Arthur, D.L.; Sweers, G.J.; Cory, M.D. Field evaluation update on the VIPR™ system—2020. In Proceedings of the 2020 Beltwide Cotton Conferences, Austin, TX, USA, 8–10 January 2020. [Google Scholar]
- Wanjura, J.D.; Pelletier, M.G.; Holt, G.A.; Barnes, E.M.; Wigdahl, J.; Doron, N. An Integrated Plastic Contamination Monitoring System for Cotton Module Feeders. AgriEngineering 2021, 3, 907–923. [Google Scholar] [CrossRef] [Scilit]
- Pelletier, M.G.; Wanjura, J.D.; Wakefield, J.R.; Holt, G.A.; Kothari, N. Cotton Gin Stand Machine-Vision Inspection and Removal System for Plastic Contamination: Hand Intrusion Sensor Design. AgriEngineering 2024, 6, 1–19. [Google Scholar] [CrossRef] [Scilit]
- Pelletier, M.G.; Wanjura, J.D.; Holt, G.A. Vision-Transformer Model Validation Image Dataset. AgriEngineering 2024, 6, 4476–4479. [Google Scholar] [CrossRef] [Scilit]
- Uster Technologies AG. Uster Jossi Vision Shield: The Most Efficient Solution for Contamination Control. Available online: https://www.uster.com/products/in-line-process-control/uster-jossi-vision-shield/ (accessed on 23 September 2025).
- Truetzschler Group SE. T-SCAN TS-T5: High-End Quality Foreign Part Separation. Available online: https://www.truetzschler.com/en/spinning/products/blow-room/detailed-information/foreign-part-seperator/ (accessed on 23 September 2025).
- Kiron, M.I. Loptex: An Optosonic Sorter; Textile Learner: Dhaka, Bangladesh, 2022; Available online: https://textilelearner.net/loptex-an-optosonic-sorter/ (accessed on 25 February 2025).
- Knitting Industry. New Loepfe Tool for More Efficient Yarn Clearing. 2025. Available online: https://www.knittingindustry.com/new-loepfe-tool-for-more-efficient-yarn-clearing/ (accessed on 25 February 2025).
- Zhang, Q.; Hua, L.; Yao, J. Development of detection system for cotton plastic covering using ultrasonic. Appl. Mech. Mater. 2013, 411–414, 1439–1444. [Google Scholar] [CrossRef] [Scilit]
- Reeder, G.S.; Currie, P.J.; Hagler, D.J.; Tajik, A.J.; Seward, J.B. Use of Doppler techniques (continuous-wave, pulsed-wave, and color flow imaging) in the noninvasive hemodynamic assessment of congenital heart disease. Mayo Clin. Proc. 1986, 61, 725–744. [Google Scholar] [CrossRef] [Scilit] [PubMed]
- CUI Devices. CUSA-T80-15-2400-TH Datasheet; Technical Report; CUI Devices: Lake Oswego, OR, USA, 2020. [Google Scholar]
- CUI Devices. CUSA-R80-15-2500-TH Datasheet; Technical Report; CUI Devices: Lake Oswego, OR, USA, 2020. [Google Scholar]
- Balanis, C.A. Antenna Theory: Analysis and Design, 3rd ed.; John Wiley & Sons: Hoboken, NJ, USA, 2005. [Google Scholar]
- Harput, S. Ultrasonic Phased Array Device for Acoustic Imaging in Air. Master’s Thesis, Sabancı University, Tuzla, Türkiye, 2007. [Google Scholar]
- Elliott, E. An Ultrasonic Phased Array System for Detection of Plastic Contaminants in Cotton. Master’s Thesis, Texas Tech University, Lubbock, TX, USA, 2025. [Google Scholar]
- Digilent, Inc. Zybo Z7 Reference Manual; Technical Report; Digilent, Inc.: Pullman, WA, USA, 2025; Available online: https://digilent.com/reference/programmable-logic/zybo-z7/reference-manual (accessed on 8 February 2025).
- Pelletier, M.G.; Holt, G.A.; Wanjura, J.D. Plastic Imaging, Detection, and Ejection System (PIDES) for Cotton Gins: Results from Commercial Testing and System Updates; Technical Report; U.S. Department of Agriculture, Agricultural Research Service (USDA-ARS): Washington, DC, USA, 2023. [Google Scholar]

Disclaimer/Publisher’s Note: The statements, opinions and data contained in all publications are solely those of the individual author(s) and contributor(s) and not of MDPI and/or the editor(s). MDPI and/or the editor(s) disclaim responsibility for any injury to people or property resulting from any ideas, methods, instructions or products referred to in the content. |
© 2026 by the authors. Licensee MDPI, Basel, Switzerland. This article is an open access article distributed under the terms and conditions of the Creative Commons Attribution (CC BY) license.