


Abstract
Fresh produce are highly perishable products whose properties constantly change throughout post-harvest handling, storage, transport, and distribution. Existing methods for shelf-life prediction typically use constant storage environments or the quality at the end of the shelf-life as metrics and thus fail to capture the changing thermal environment of a shipment. In this paper, we propose an event-aware adaptive physics-informed digital twin (EA-PI-DT) for dynamic remaining shelf-life (RSL) prediction of fresh produce in the cold chain. This approach utilizes cold chain sensor observations, data quality control, event detection, thermal state reconstruction, respiration kinetics, carbon dioxide dynamics in sealed packaging, relative deterioration modeling, shelf-life consumption calculation, and physics-informed RSL prediction. We introduce an adaptive residual correction module to account for systematic differences between mechanistic prediction and actual deterioration trajectory, and cold chain events are explicitly modeled using state variables. This framework is compared with a physics-driven model baseline as well as residual-learning models such as Ridge regression, Random Forest, and XGBoost. The framework was validated through a proof-of-concept evaluation by means of six experimentally obtained disturbed trajectories for three fresh produce commodities. The results clearly indicate that the proposed framework can be feasibly applied to the considered trajectories but do not imply any generalizability of the results beyond these commodities and cultivars; we attain an MAE of 0.441 days and RMSE of 0.450 days against 0.708 days and 0.877 days of the physics-based method, respectively, with R2 increasing from 0.815 to 0.951.
1. Introduction
1.1. Background and Motivation
Fruits and vegetables are highly perishable biological products that continually deteriorate after harvest due to respiration, ripening, moisture loss, degradation in texture and color, and deterioration due to microbes. This depends significantly on storage and transportation conditions, specifically temperature, and therefore determines the usable shelf life of the produce. It has recently been shown that temperature-dependent and dynamic models are essential in determining the shelf life of fresh produce [1,2].
The measurement of environmental factors such as temperature, humidity, and other storage and transport conditions is part of typical cold chain systems. Such measurement of environmental factors gives vital information on the environmental history of the shipment, but does not give any indication of the usable shelf life of the produce. Therefore, sensor-based cold chains are increasingly incorporating methods that relate environmental data to product quality information [3,4]. With the help of digital and Internet-of-Things technologies, it is possible to obtain continuous information on the environmental conditions of produce. However, deriving this information into continuous updates of the RSL of the produce is difficult.
The spoilage process of fresh food items is dependent upon the total thermal and physiological history of the item rather than only on the average temperature. Temperature spikes, delayed cooling, multiple interruptions, packing environment, thermal inertia of product, physiological state, and the total thermal history of the produce can make two produce items subjected to similar average environmental temperature display different deterioration behavior. Therefore, RSL should not be considered a constant factor but rather a dynamic condition that changes with time.
A dynamic model of shelf life can offer a way to describe this state change in produce. Temperature-dependent models of shelf life have been developed for produce such as kiwifruit at different temperatures [5], and uncertainty-based dynamic models of shelf life prove the significance of considering changing storage conditions during long periods of cold storage [6]. Reviews of fruit and vegetable shelf-life evaluation also highlight the shift from conventional methods to instrument- and computation-based methods of shelf-life assessment [7].
The difficulty for the engineers then becomes one not only of knowing what temperature the shipment is experiencing but also of being able to estimate how much the history of exposure has impacted the condition of the product. The Digital Twin concept is ideally suited to meeting this goal since it allows for an updated digital model of the physical product, data assimilation of the cold chain, and state estimation of the product.
1.2. Digital Twins for Fresh-Produce Cold Chains
A Digital Twin is a digital model of a physical system that can be continuously refreshed through the use of observations obtained from the actual physical process. Applications of Digital Twins in the context of food and agri-food supply chains have shifted from the modeling perspective of system architecture towards the use of monitoring, planning, control, and decision-making based on the use of Digital Twins [8,9].
Digital Twin-based frameworks have also been suggested for virtual agri-food supply chains with a focus on system architecture, control, transparency, and integration in complex agricultural ecosystems [10]. Digital Twin-based solutions have then been explored for the planning, monitoring, and control of food supply chains in real time [11]. This illustrates how Digital Twins can provide an appropriate infrastructure for continuous sensing and dynamic estimation of system states.
The more recent body of literature has concentrated on applying Digital Twins in order to manage quality and shelf-life of products. The dynamic shelf-life modeling of fruits based on Digital Twins has been suggested in order to model a connection between supply chain conditions and food loss reduction [1], whereas the integration of Digital Twins has been examined for the purpose of dynamic control of quality loss in the supply chain of fruits [3]. Physics-based Digital Twins offer an extra value since mechanistic models are capable of preserving the relations between the environment, the product, and the process of deterioration. For instance, physics-based Digital Twins have been employed for the optimization of imported fresh produce post-harvest supply chains [12].
Nevertheless, the current body of literature on Digital Twins usually concentrates on supply chain architecture, monitoring, planning, quality loss modeling, or optimization. The lack of a product-level framework that continuously reconstructs the thermal state of the product, describes physiological deterioration, identifies cold chain disturbances, consumes shelf-life, and correctively adjusts mechanistic prediction errors is evident.
1.3. Limitations of Existing Approaches
There are several challenges involved when one takes into account the process of continuous product-level RSL prediction.
The first challenge concerns the environmental temperature, which does not necessarily reflect the real temperature of the produce itself. The change in the product temperature is a delayed phenomenon due to its thermal inertia, and thus the deterioration models based on ambient temperature do not necessarily reflect the thermal history of the product. It is essential to monitor temperature and use sensors properly in order to manage the cold chain of fresh produce [3]. The machine-learning approaches have also been studied in order to estimate the temperature of the product during the forced-air cooling of apples, showing that such reconstruction is possible from the environmental data [13].
The second challenge concerns the traditional shelf-life models, which are usually created for specific products and under particular storage conditions. While these models can precisely model the deterioration process under certain conditions, they do not necessarily provide continuous updating of the RSL based on the entire thermal history of the product.
Third, while physics-based models offer interpretability and mechanistic representation of the deterioration process, biological variability might be a source of systematic errors in predictions compared to reality. Factors such as produce cultivar, product maturity, packaging, humidity, gas composition, history of handling, and physiological state might affect the deterioration. On the contrary, data-driven approaches allow representing the non-linearities and complex interactions, but they normally require a representative dataset to be trained on, as well as raising physical interpretability and transferability issues.
Recent studies in artificial intelligence and machine learning reveal the great prospects of fresh-produce quality prediction. Scientific machine-learning frameworks to combine scientific knowledge with data-driven prediction were suggested [2]. The AI-based approaches have been reviewed for the purpose of preservation and quality management of fruits and vegetables [14]. Machine learning methods have also been studied in the context of shelf-life management [15], transfer-learning-based approach to kiwifruit quality prediction [16], tomato ripeness and shelf-life prediction [17], and temporal deep-learning framework for banana shelf-life prediction [18].
Another drawback of the model is the lack of explicit representation of cold chain disturbances as state variables. The real-world scenario can include loading/unloading delays, cooling disruption, door opening, transportation delay, multiple heating episodes, and so forth. Such events depend not only on peak temperature but also on their duration, amplitude, frequency, and cumulative thermal history. Thus, the event-aware representation can be valuable for obtaining data that cannot be captured sufficiently well through an average temperature or a single violation of a temperature threshold.
All these limitations imply the need for an integration framework that would allow reconstruction of product temperature based on cold chain observations, representation of physiological degradation, explicit representation of thermal disturbances, estimation of cumulative shelf-life use, and adaptive correction of discrepancies via machine learning.
1.4. Research Gap, Objectives, and Main Contributions
1.4.1. Research Gap
There is considerable progress in the current literature on the applications of Digital Twins in food supply chains, dynamic shelf life modeling, physics-based deterioration models, and AI/ML-based quality prediction for fresh produce. However, the integration among these research directions is still partial. The existing literature deals either with Digital Twins for the supply chain, environment monitoring, dynamic shelf life modeling, temperature predictions, or data-driven quality prediction as independent modules.
The research gap filled by this study is, thus, a product-level Digital Twin that incorporates thermal state reconstruction, deterioration modeling, representation of cold chain events, shelf-life consumption, and adaptive residual learning into one RSL prediction framework.
1.4.2. Research Objectives
The goals of the present work include development of an event-aware physics-informed Digital Twin for dynamic RSL estimation of fresh produce subjected to cold chain conditions; reconstruction of temperature of the product/pulp based on cold chain temperature data; formulation of the temperature-driven physiological aging and CO2 dynamics for corresponding packaging; explicit characterization of cold chain events depending on their timing, intensity, duration, and cumulative thermal load; estimation of shelf-life depletion and physics-based RSL; applying residual machine learning for correcting biases in physics-informed predictions; testing the proposed approach against machine learning-based RSL predictors via leave-one-trajectory-out cross-validation; and providing uncertainty analysis and counterfactuals for cold chain design.
1.4.3. Main Contributions
The central novelty of this paper is the development of an Event-Aware Adaptive Physics-Informed Digital Twin (EA-PI-DT) that combines aspects of thermal state reconstruction, modeling of physiological deterioration, representation of cold chain events, shelf-life consumption, and residual machine learning in one system.
Contrary to the purely data-driven model for RSL, our approach preserves the mechanistic Digital Twin as the core mechanism for describing deterioration, while using machine learning to predict the residual difference between the physics-based prediction and the actual behavior. The system also features event-specific thermal characterization, conditional CO2 modeling, uncertainty quantification, SHAP-based explainability, and counterfactual cold chain simulations. All this makes it possible for the Digital Twin not only to predict the RSL of the product but also to investigate the effect of different cold chain histories on its shelf life.
2. Literature Survey
2.1. Digital Twin-Based Food and Agri-Food Supply Chains
In this context, Digital Twin technology has appeared as a solution to maintain a continually updated digital twin of the physical system. Digital twins for food supply chains have been researched as a method for merging the physical processes with digital monitoring, modeling, planning, and control [8]. Digital Twin architectures have even been suggested to create virtual agri-food supply chains, focusing on system-level design and control of the chain [10]. Digital Twin-based real-time planning, monitoring, and control have also been proposed as a promising direction for food supply chain management [11].
Some studies have already considered Digital Twins for shelf life and product quality issues. Zhang et al. developed the concept of a Digital Twin-based dynamic shelf-life for fruit supply chains [1], whereas Zou et al. researched Digital Twin implementation for dynamic quality loss control [3]. Monteiro and Barata surveyed Digital Twin-enabled regional food supply chains and identified possible directions of research for real-time data integration and decision-making [19]. Another particularly significant approach would be physics-based Digital Twins. Shoji et al. illustrated the utility of physics-based Digital Twins for the optimization of postharvest supply chain systems for imported fresh produce [12]. This is critical since mechanistic models could help relate environmental factors to the actual physical state of products as opposed to only using statistical correlations.
In general, there is evidence that Digital Twin technology is indeed a viable approach for food and agri-food supply chain systems monitoring, planning, quality management, and optimization. Nevertheless, there is still insufficient attention to continuous prediction of product-level RSL, incorporating thermal-state reconstructions, physiological degradation, cold chain events, and adaptive residual correction. The application of Digital Twin technology to food and agri-food supply chains is provided in Table 1.
Table 1.
Digital Twin applications in food and agri-food supply chains.
2.2. Dynamic Shelf-Life and Postharvest Quality Modeling
Prediction of shelf-life traditionally involved conducting controlled storage studies with quality or spoilage criteria predefined. The temperature dependence model serves as the basis for modeling the effect of storage conditions on shelf-life. Shelf-life prediction models of Xuxiang kiwifruit were constructed using different storage temperatures by Niu et al., illustrating the significance of the correlation between temperature and shelf-life dynamics [5].
Dynamic shelf-life models go further by making updates to the shelf-life predictions according to variations in storage conditions. Dynamic shelf-life prediction models were designed by Chen et al., incorporating actual uncertainty in long-term cold storage of fresh produce [6]. ElManawy et al. presented recent methods used in shelf-life estimation of fruits and vegetables, focusing on increased application of instrumental and intelligent modeling techniques [7].
Quality and shelf-life estimation techniques using empirical modeling and machine learning have also been developed. For instance, Zhang et al. used a combination of partial least squares and an artificial neural network to predict quality changes and shelf life of postharvest apples [20]. On the other hand, Putri et al. examined an accelerated shelf-life test for freeze-dried strawberries under a tropical climate [21]. The use of these two techniques is clearly seen in studying quality development, although their main weakness lies in the absence of a continuously updated Digital Twin of products under the cold chain.
Furthermore, packaging conditions affect shelf-life since they determine the thermal and physiological conditions of the product. In this regard, packaging conditions were explored in packaging whole strawberries, where shelf-life extension was achieved [22]. From the above discussion, it is important for a Digital Twin to take into account the packaging conditions and others in predicting product deterioration. The main dynamic shelf-life and postharvest modeling studies are listed in Table 2.
Table 2.
Dynamic shelf-life and postharvest modeling studies.
2.3. Physics-Based Thermal and Physiological Modeling
Temperature is one of the key environmental parameters affecting postharvest deterioration. Yet, there may be differences between the environmental temperature measured by sensors and the internal temperature of the produce due to thermal inertia. Lamberty and Kreyenschmidt considered technical, process-related, and sustainability aspects of IoT-based temperature monitoring in fruit and vegetable supply chains, stressing the significance of precise temperature measurement and monitoring processes [4].
The use of machine-learning algorithms has also been studied for estimating product temperatures. Kumar et al. developed models for predicting the temperature of apples during forced air cooling based on machine-learning and artificial neural network techniques [13]. This is an example of how product temperature can be estimated from process data using machine-learning techniques.
Physics-based Digital Twins represent an alternative approach that explicitly accounts for the product’s thermal response. The value of mechanistic Digital Twin modeling for postharvest fresh-produce supply chains has been demonstrated by Shoji et al. [12]. Using a product-level model, ambient temperature can be estimated to obtain the product temperature before calculating its effect on deterioration rates.
Deterioration modeling, therefore, may be undertaken using mechanistic functions that use variables such as temperature, respiration rate, physiological status, and total deterioration. This gives a physically intuitive connection from the environmental measurements to the condition of the product and eventually to RSL. However, the parameters of physiological models vary for various products and packaging, thus requiring independent calibration. The corresponding literature on modeling is provided in Table 3 below.
Table 3.
Thermal and physics-based modeling studies.
2.4. AI and Machine-Learning-Based Fresh-Produce Quality Prediction
The use of artificial intelligence and machine learning for predicting fresh-produce quality has gained importance due to its capability to model nonlinear relationships between the environmental factors and quality attributes. Guo et al. developed a scientific machine learning approach for fruit and vegetable quality prediction based on the combination of scientific knowledge and data-driven learning [2]. Wang et al. discussed AI-assisted approaches for fruit and vegetable preservation and noted the rising significance of intelligent computational approaches in post-harvest quality control [14].
Li et al. reviewed machine learning approaches for increasing and controlling the shelf life of fruits and vegetables [15]. Product-specific investigations included studies on using transfer learning for quality prediction of kiwifruits [16], machine learning techniques for prediction of ripeness and shelf life of tomatoes [17], and causal convolution with a lightweight Transformer architecture for banana shelf life prediction [18].
General machine learning research also confirms the usefulness of ensemble regression techniques in engineering prediction. The Random Forest regression approach, for instance, was applied to state estimation in another engineering application [23]. These approaches are valuable methodological options in comparison to data-driven prediction with hybrid physics-informed residual learning.
Even with their capacity to make predictions, data-driven models alone might be sensitive to the completeness of training data and lack physical interpretation. This is especially critical in the application of cold chains, since there could be a limited number of trajectories that can be conducted independently and conditions that could change significantly. The physics-informed residual-learning approach can thus allow machine learning to correct the discrepancy between models. The study shows the application of neural networks to the risk assessment of agricultural supply chains. Fresh-produce quality prediction using AI/ML technologies is illustrated in Table 4.
Table 4.
AI/ML-based fresh-produce quality prediction.
2.5. Sensor, Imaging, Spectroscopy, and Intelligent Freshness Monitoring
In addition to temperature sensing and machine learning, sensing techniques provide significant information related to the quality of fresh produce. Digital cold chain technology based on sensing and artificial intelligence was introduced by Elashmawy et al. as an instrument for quality monitoring of products [24]. Visual techniques are another promising way of detecting and forecasting quality degradation of fresh foods in supply chains [25]. Near-infrared spectroscopy was used for non-destructive quality control and shelf life prediction of kiwifruit, showing the usefulness of spectroscopic information in estimating the internal properties of products [26]. Infrared thermal imaging is another example of a technique used to predict quality changes in various varieties of pineapples while in storage [27]. Information obtained by time-temperature indicators in terms of RGB data was applied for fruit quality prediction, being one of the relatively accessible approaches to establish the connection between thermal exposure and quality [28].
Multimodal sensing techniques were recently used to combine the information provided by time-temperature indicators, pH-responsive colorimetric sensors, and deep learning algorithms in order to monitor the dynamic quality of fresh-cut fruits [29]. More research has been conducted on postharvest losses in general in relation to the significance of machine learning technology for quality management and risk evaluation. The review by Singh et al. discussed machine learning algorithms for postharvest loss reduction and quality management of fruits and vegetables [30], whereas the work by Feng et al. analyzed optimized neural network strategies for the evaluation of risks associated with a sustainable fresh grape supply chain [31]. Digitization of agricultural supply chains has also covered AI, IoT, and other digital technology integration for improving efficiency and sustainability of the supply chain [32]. Three machine learning models, namely Ridge Regression, Random Forest, and XGBoost, were considered for residual learning alternatives [33]. Agricultural forecasting and prediction have been studied using machine-learning and regression techniques as well, showing how data-based modeling can be useful for decision-making in agriculture [34].
But these methods are mostly used for quality assessment/classification/monitoring/risk prediction, not for maintaining the physics-based RSL state of a particular cargo consistently. Their integration with the proposed digital twin might be a future perspective. Sensor and intelligent quality-monitoring approaches are discussed in Table 5.
Table 5.
Sensor and intelligent quality-monitoring approaches.
3. Materials and Methods
3.1. Overall Architecture and Data Processing
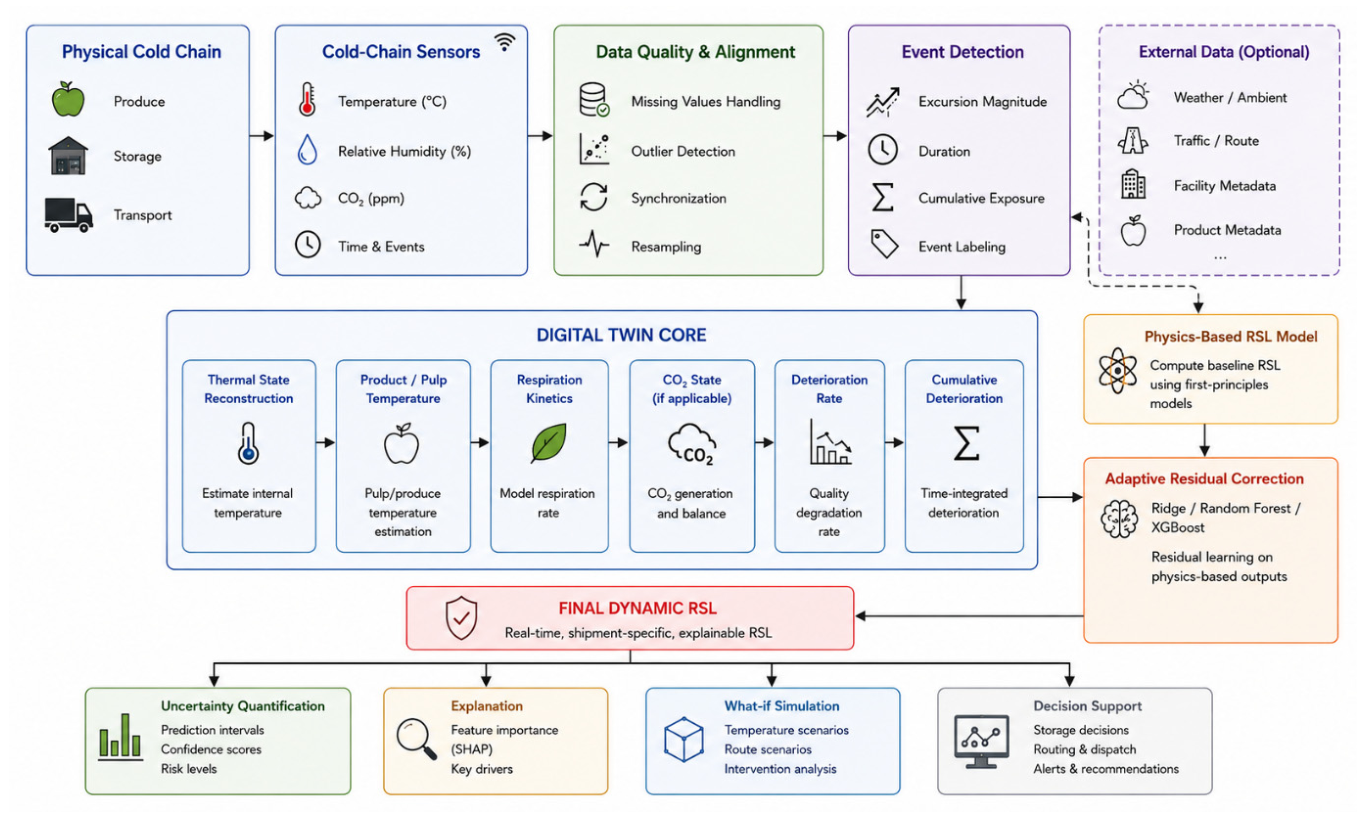
This framework, called the Event-Aware Adaptive Physics-Informed Digital Twin (EA-PI-DT), will model the physical state of the fresh-produce shipment using an adaptive virtual state that updates itself in real time. This framework uses the data from cold chains to estimate the physical state and remaining shelf life (RSL) of the produce.
The computational pipeline involved in this procedure includes the following steps:
Observations → Data quality control → Event detection → Thermal digital twin → Product temperature → Respiration modeling → CO2 state modeling → Relative deterioration rate → Shelf-life consumption → Physics-based RSL → Adaptive residual correction → Final RSL → Uncertainty and explanation → What-if simulation.
The observation input at time is given by
where ambient temperature is represented by Ta, relative humidity by RH, carbon dioxide by CO2 where applicable, cold chain events are denoted by E, and product or shipping details are denoted by P.
Xt = [Ta(t), RH(t), CO2(t), E(t), P]
Prior to any modeling effort, the observations are first aligned with respect to their timestamp and checked for missing data, duplicates, outliers, and physically implausible measurements. The cleaned observations are then normalized in time.
Digital Twin Internal State
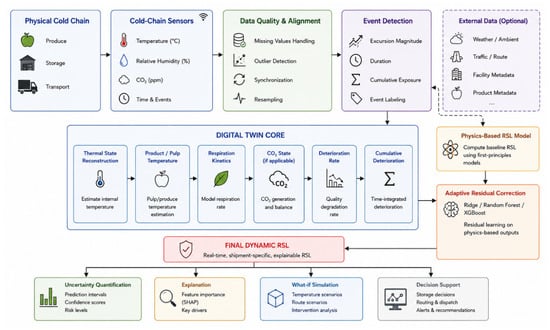
where Tp = product temperature, R = respiration rate, CCO2 = internal CO2 condition, rd = deterioration rate, and D = total deterioration. The general structure of the suggested system is depicted in the following Figure 1.
Zt = [Tp (t), R(t), CCO2 (t), rd (t), D(t), E(t), RSL(t)]
Figure 1.
Overall architecture of the proposed Event-Aware Adaptive Physics-Informed Digital Twin.
Data Set and Experimental Setup
The dataset used in this research has been obtained from the cold chain experimental study by Abougharib et al. [35], where three kinds of fresh produce, namely, strawberries (cv. Elsanta), red spinach (cv. Amaranthus dubius), and apricots (cv. Prunus armeniaca L.), have been used. The total number of samples used in the experiment was nine, and there were three homogeneous samples of each kind of produce allocated to the control, one door opening (1DO), and three doors opening (3DO) cases. In the current research, six disturbed trajectories corresponding to the 1DO and 3DO cases have been utilized for Digital Twin development and validation. The temperature trajectories have been derived from the experimental data obtained in the context of this study and the respective open-access data repository [36]. Ambient/product temperature was measured at 3 min intervals with the help of the Efento Bluetooth Low Energy wireless temperature sensor attached to a data acquisition unit. The stated accuracy of the measurement is ±2 °C. Relative humidity measurements were not taken since there was no measurement channel for it in the sensor. For that reason, relative humidity was not utilized as the experimental observation input within the current validation process. In this case, the RSL calculation was mainly based on the trajectories of ambient temperatures, reconstructed product temperatures, event states, and physiological parameters generated by the model. No experimentally measured values of RH were utilized at all. The open access data repository includes the data on temperatures used for characterizing cold chain trajectories.
Computational Software and Environment: The proposed Event-aware Adaptive Physics-Informed Digital Twin (EA-PI-DT) was implemented with the help of Python (v3.11.9). NumPy (v1.26.4) and Pandas (v2.2.2) were used for numerical computing and preprocessing of the dataset, respectively. Scikit-learn (v1.5.2) was used to build Ridge Regression and Random Forests models and also to compute the metrics for the evaluation of the models. Gradient Boosting Regression was built using XGBoost (v2.1.1). SHAP (v0.46.0) was used to explain the models, whereas visualizations were made using Matplotlib (v3.9.2).
Six cold chain trajectories were used in this analysis; their total duration is approximately 45.29 trajectory days, while the number of analyzed temperature observations is 21,744 (3 min interval). Individual trajectory durations vary from about 5.00 to 10.25 days. Trajectory-level statistics are listed in Table 6 below. The 21,744 temperature recordings are repeated observations in these six trajectories and are not to be regarded as 21,744 independent experimental data points. Thus, the number of independent experimental data points for trajectory validation is six.
Table 6.
Comparative positioning of the proposed framework.
The experimentally observed remaining shelf life, RSLobs, was determined using the time of spoilage based on visual observations rather than using any instrumental physicochemical measurements. The product was checked for spoilage visually during storage. In the case of strawberries and apricots, spoilage was noted upon the first appearance of white mold. In the case of red spinach, spoilage was recognized using typical symptoms of the bacterial soft rot disease, including wilting and sagging of the leaves. Thus, RSLobs is the time of experimental observation of the product from the start of the storage/trajectory until a certain pre-defined point of spoilage. Neither firmness, colorimetric, nor any other instrumental quality measurements have been applied to determine the true RSL in the source experiment. In the source experiment, no information on hardness, color, texture, and quality was available; consequently, the experimentally determined spoilage point in vision was used to determine the RSL. Thus, the shelf-life point established through experiments for this study is only based on visual spoilage and not the overall quality of the food measured using instrumentation.
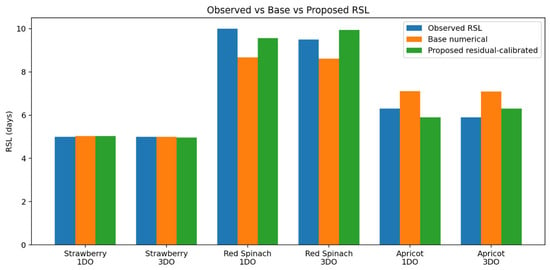
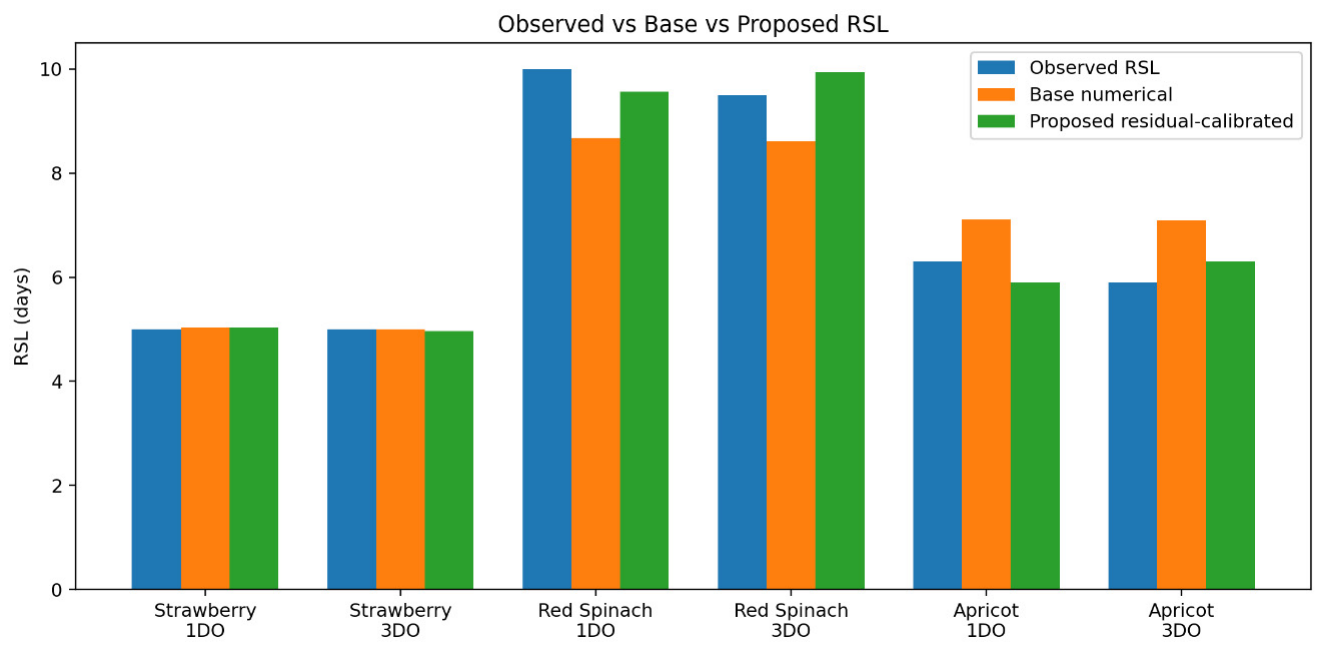
The six experimentally observed values of RSLobs that have been used for validation were 5.0 and 5.0 days for strawberries under 1DO and 3DO regimes, 10.0 and 9.5 days for red spinach, and 6.3 and 5.9 days for apricot, respectively.
Derivation of time-dependent observed RSL: Since the experimental observation gives only one observed spoilage endpoint per trajectory, rather than the remaining shelf life directly measured at each time, the observed RSL goal at each time was obtained by computing the remaining shelf-life using the spoilage endpoint observed in the experiment. If Tspoil is the experimentally observed time to spoilage of a trajectory and ti is the time elapsed since the start of that trajectory, then the endpoint-based observed RSL was computed as:
RSLobs(ti) = max(Tspoil − ti,0)
As such, the six observed spoilage endpoints obtained experimentally represent the ground-truth endpoints at the trajectory level, whereas the time-dependent RSLobs(ti) is a deterministic function of those endpoints. For instance, in the case of a strawberry trajectory where an observed spoilage endpoint of 5.0 days has been observed, the computed value of observed RSL will be 5.0 days at t = 0, 4.0 days at t = 1 day, 3.0 days at t = 2 days, and close to 0 days at the observed spoilage time. The method does not mean that RSL was independently observed at each time point. Consequently, the intermediate levels of RSL values serve as reference points instead of being obtained through independent measurements. The validation process would be based on the comparison between the model and the RSL curve built from the end point.
The benchmark trajectories employed in the current study are generated from experimental cold chain data, as opposed to simulated data or re-creation of scenarios. More precisely, the six benchmark trajectories are based on the experimentally observed 1DO and 3DO temperature profiles for strawberries, red spinach, and apricots. These data retain the temperature profiles obtained due to the cold chain disturbance experiments and were employed as input to the Digital Twin assessment.
The current evaluation consists of six experimentally determined disturbed trajectories, covering three types of produce, that is, strawberries, red spinach, and apricots. Two experimentally determined trajectories across three produce types, corresponding to the 1DO and 3DO conditions, have been used. While each trajectory includes a large number of observations at different time points, the total number of experimentally determined trajectories is rather low at six. This means that the current evaluation should be viewed as a proof-of-concept evaluation rather than as a demonstration of generalizability for fresh produce commodities under cold chain conditions. Due to a relatively small number of experimentally determined trajectories, the Ridge, Random Forest, and XGBoost approaches were not used as fully data-driven prediction models. Instead, the residual learning approach was used, with the physics-based Digital Twin providing an initial estimate for the shelf-life and the ML model learning the error of predictions.
Data Source Clarification: The spoilage experiments and RSLobs are obtained from the experimental study conducted by Abougharib et al. [35]. The temperature paths correspond to the latter study and can be found at the linked Mendeley Data repository [36]. Thus, this paper relies on the spoilage point determined through an experiment and the temperature paths for Digital Twin validation.
3.2. Event-Aware Thermal Digital Twin
The first physical entity of the Digital Twin replicates the temperature condition of the product. Since the internal temperature of the product is not instantaneously the same as the ambient temperature, the first-order thermal model is applied:
where Tp is the product temperature, Ta is the ambient temperature, and kT is the thermal-response coefficient.
For discrete observations:
Tp(t + Δt) = Tp(t) + kT[Ta(t) − Tp(t)]Δt
The resultant thermal condition is then adopted as the main temperature for modeling deterioration. Disruptions in the cold chain are explicitly modeled and not just considered as a stochastic disturbance. The excursion indicator is formulated as follows:
and the magnitude of thermal exposure is calculated as:
Me(t) = max(0,Ta(t) − Tref)
The cumulative thermal excursion exposure is then
While excursion duration is:
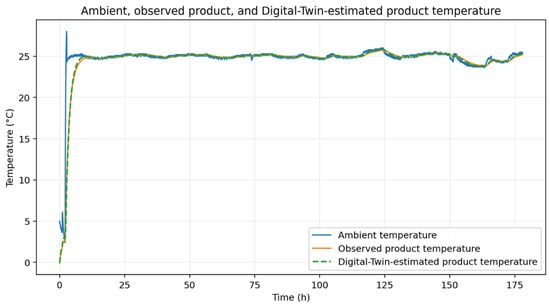
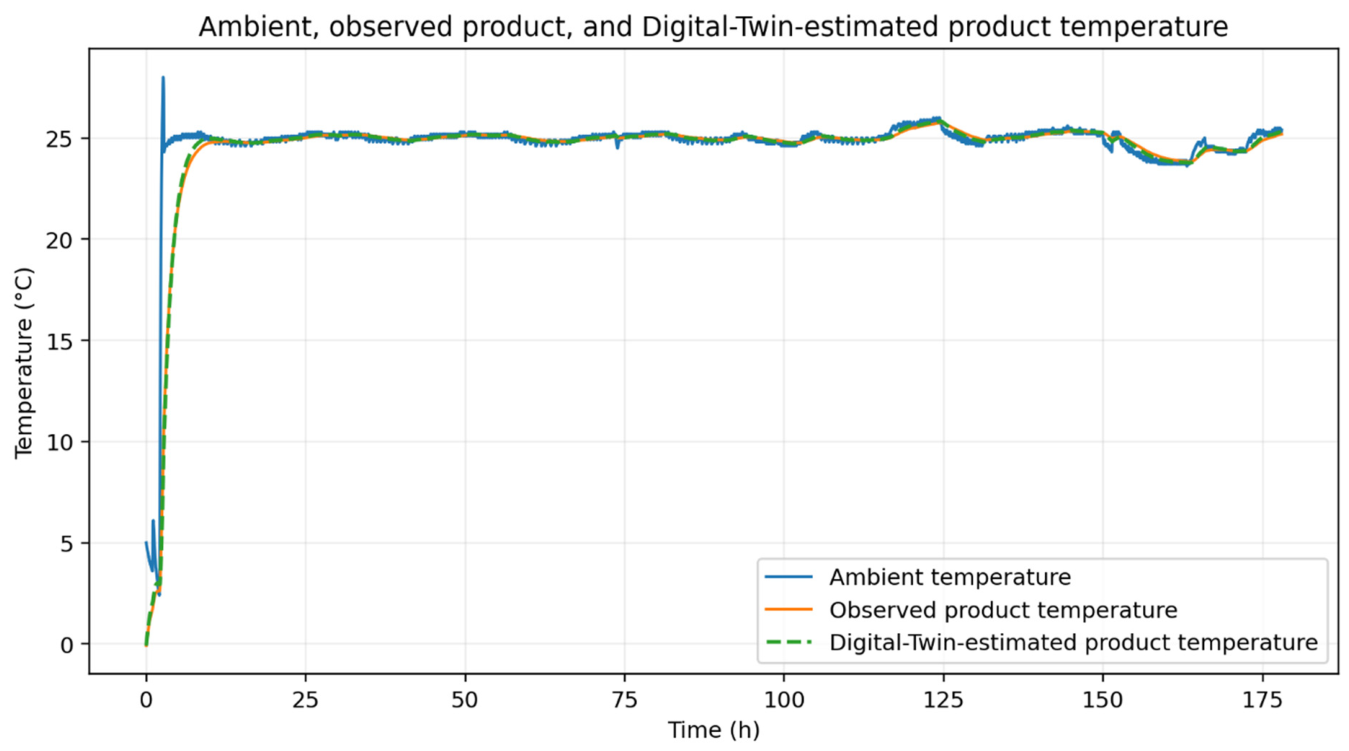
Thus, the Digital Twin can differentiate between a short excursion and a long excursion, despite both excursions having the same maximum temperature. From Figure 2, it can be seen that the Digital-Twin-estimated product temperature responds to the observed product temperature while showing the anticipated thermal inertia with respect to the ambient temperature.
Figure 2.
Ambient temperature, observed product temperature, and Digital-Twin-estimated product temperature for the cold chain trajectory.
Cold Chain Event Detection Rules
Quantitative assessment of reconstruction accuracy of product temperature. Besides the visual comparison depicted in Figure 2, quantitative assessment of the reconstructed product temperature accuracy was performed with respect to the measured temperature profile. For this, mean absolute error (MAE), root mean square error (RMSE), and mean bias were computed, where the temperature difference was computed as ΔT = Tpred − Tmeas. Mean absolute error (MAE) and root mean square error (RMSE) characterize the magnitude of reconstruction error, whereas mean bias reflects whether product temperature was over- or underestimated. The above-mentioned indicators were computed based on the entire temperature trajectory available for each test case. Reconstructed product temperature was further used as a thermal state input in the following physiological deterioration analysis.
Detection of cold chain events relied on a threshold that was configurable in terms of reference temperature. An event was defined if the ambient temperature went above the set reference temperature by more than 2 °C. The 2 °C exceedance condition was used to determine the start and end points of individual thermal events. In addition, temperature >10 °C was used exclusively as a criterion for characterizing major thermal excursions within the experimental trajectory. Therefore, the 2 °C and >10 °C conditions play distinct roles in the study; the former defines event activation, while the latter characterizes major thermal excursions within the trajectory.
3.3. Physiological Deterioration and Shelf-Life Consumption
The temperature estimated by the Digital Twin is used to determine the temperature-dependent respiration rate according to an Arrhenius-type equation:
where R0 is the reference respiration rate, Ea is the activation energy, and Rg is the universal gas constant. CO2 dynamics can be accounted for by means of the following equations:
where Vh is the headspace volume, and kCO2 is the gas exchange coefficient of sealed or controlled-package fruits and vegetables. In this regard, the CO2 state equation is appropriate if there is an adequately enclosed headspace in the package, since CO2 accumulation plays a role in the product and package system. This equation is not applicable to open packages and products where gas exchange is unconstrained; hence, CO2 accumulation cannot be appropriately modeled by the headspace approach. The parameters used in the model are described in Table 7.
Table 7.
Parameters used in the thermal and physiological Digital Twin modules.
As the relative humidity, respiration rate, concentration of CO2, and gas exchange were not experimentally determined in the source database, the physiological part of the Digital Twin is modeled and was not separately validated on the basis of physiological measurements. Since experimental data on CO2 levels were not available in the source data set, the values of CO2 in the Digital Twin model are model-based internal values and not experimentally verified.
As a result, it is appropriate that the physiological and CO2-dependent variables of this investigation be considered as model variables for the development of the mechanistic Digital Twin and not as physiologically determined constants from the experimental calibration of respiration, CO2 concentration, or gas exchange from the present data set. More specifically, this refers to R0, Ea, Vh, and kCO2 that have not been separately determined from the aforementioned measurements.
However, the physical parameters R0, Ea, Vh, and kCO2 could not be independently derived from the current experimental data set, as the source experiment did not perform any measurement of respiration rate, concentration of CO2, or gas exchange in the package. This resulted in those parameters being model parameters, and their lack of independent calibration being a limitation of the current approach. The universal gas constant Rg was taken to be equal to Rg = 8.314 J mol−1 K−1. The reference shelf-life L0 was computed using the spoilage endpoints of Section Data Set and Experimental Setup.
Thus, in the current study, the CO2 component was regarded as a conditional physiological module and not as a universal model applicable to any packaging-product combination. The experimental dataset comprises products that have quite different respiratory properties under various packaging conditions, such as strawberries packed in vented PET clamshells, red spinach packaged in aseptic polyethylene bags, and apricots placed in expanded-polystyrene trays. The CO2-state model can be used for the aseptic packaging condition, while its application for very ventilated/open conditions needs specific packaging gas exchange parameters.
Respiration and gas-exchange parameters specific to each product were not calibrated separately based on CO2 measurements for each individual product in this dataset. This means that the CO2 module can be seen as a part of the proposed approach and not as an independent product-specific CO2 predictor. The lack of an independent calibration of the CO2 values for each product is a shortcoming of the present research and can have an influence on the accuracy of the estimate of physiological deterioration of products under consideration.
The relative deterioration rate is then represented as
where FT, FR, FC, and FE are the impacts of temperature, respiration, CO2 state, and cold chain event, respectively. Shelf-life consumption is defined as:
or, for discrete observations:
rd(t) = r0FT(t)FR(t)FC(t)FE(t)
Dt = Dt−1 + rd(t)Δt.
The normalized shelf-life consumption is:
RSLphys(t) = L0[1 − S(t)]
With:
RSLphys(t) ≥ 0.
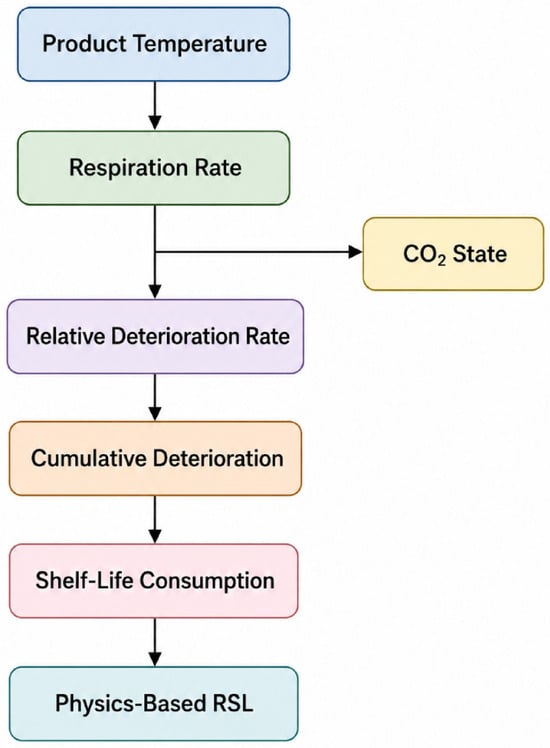
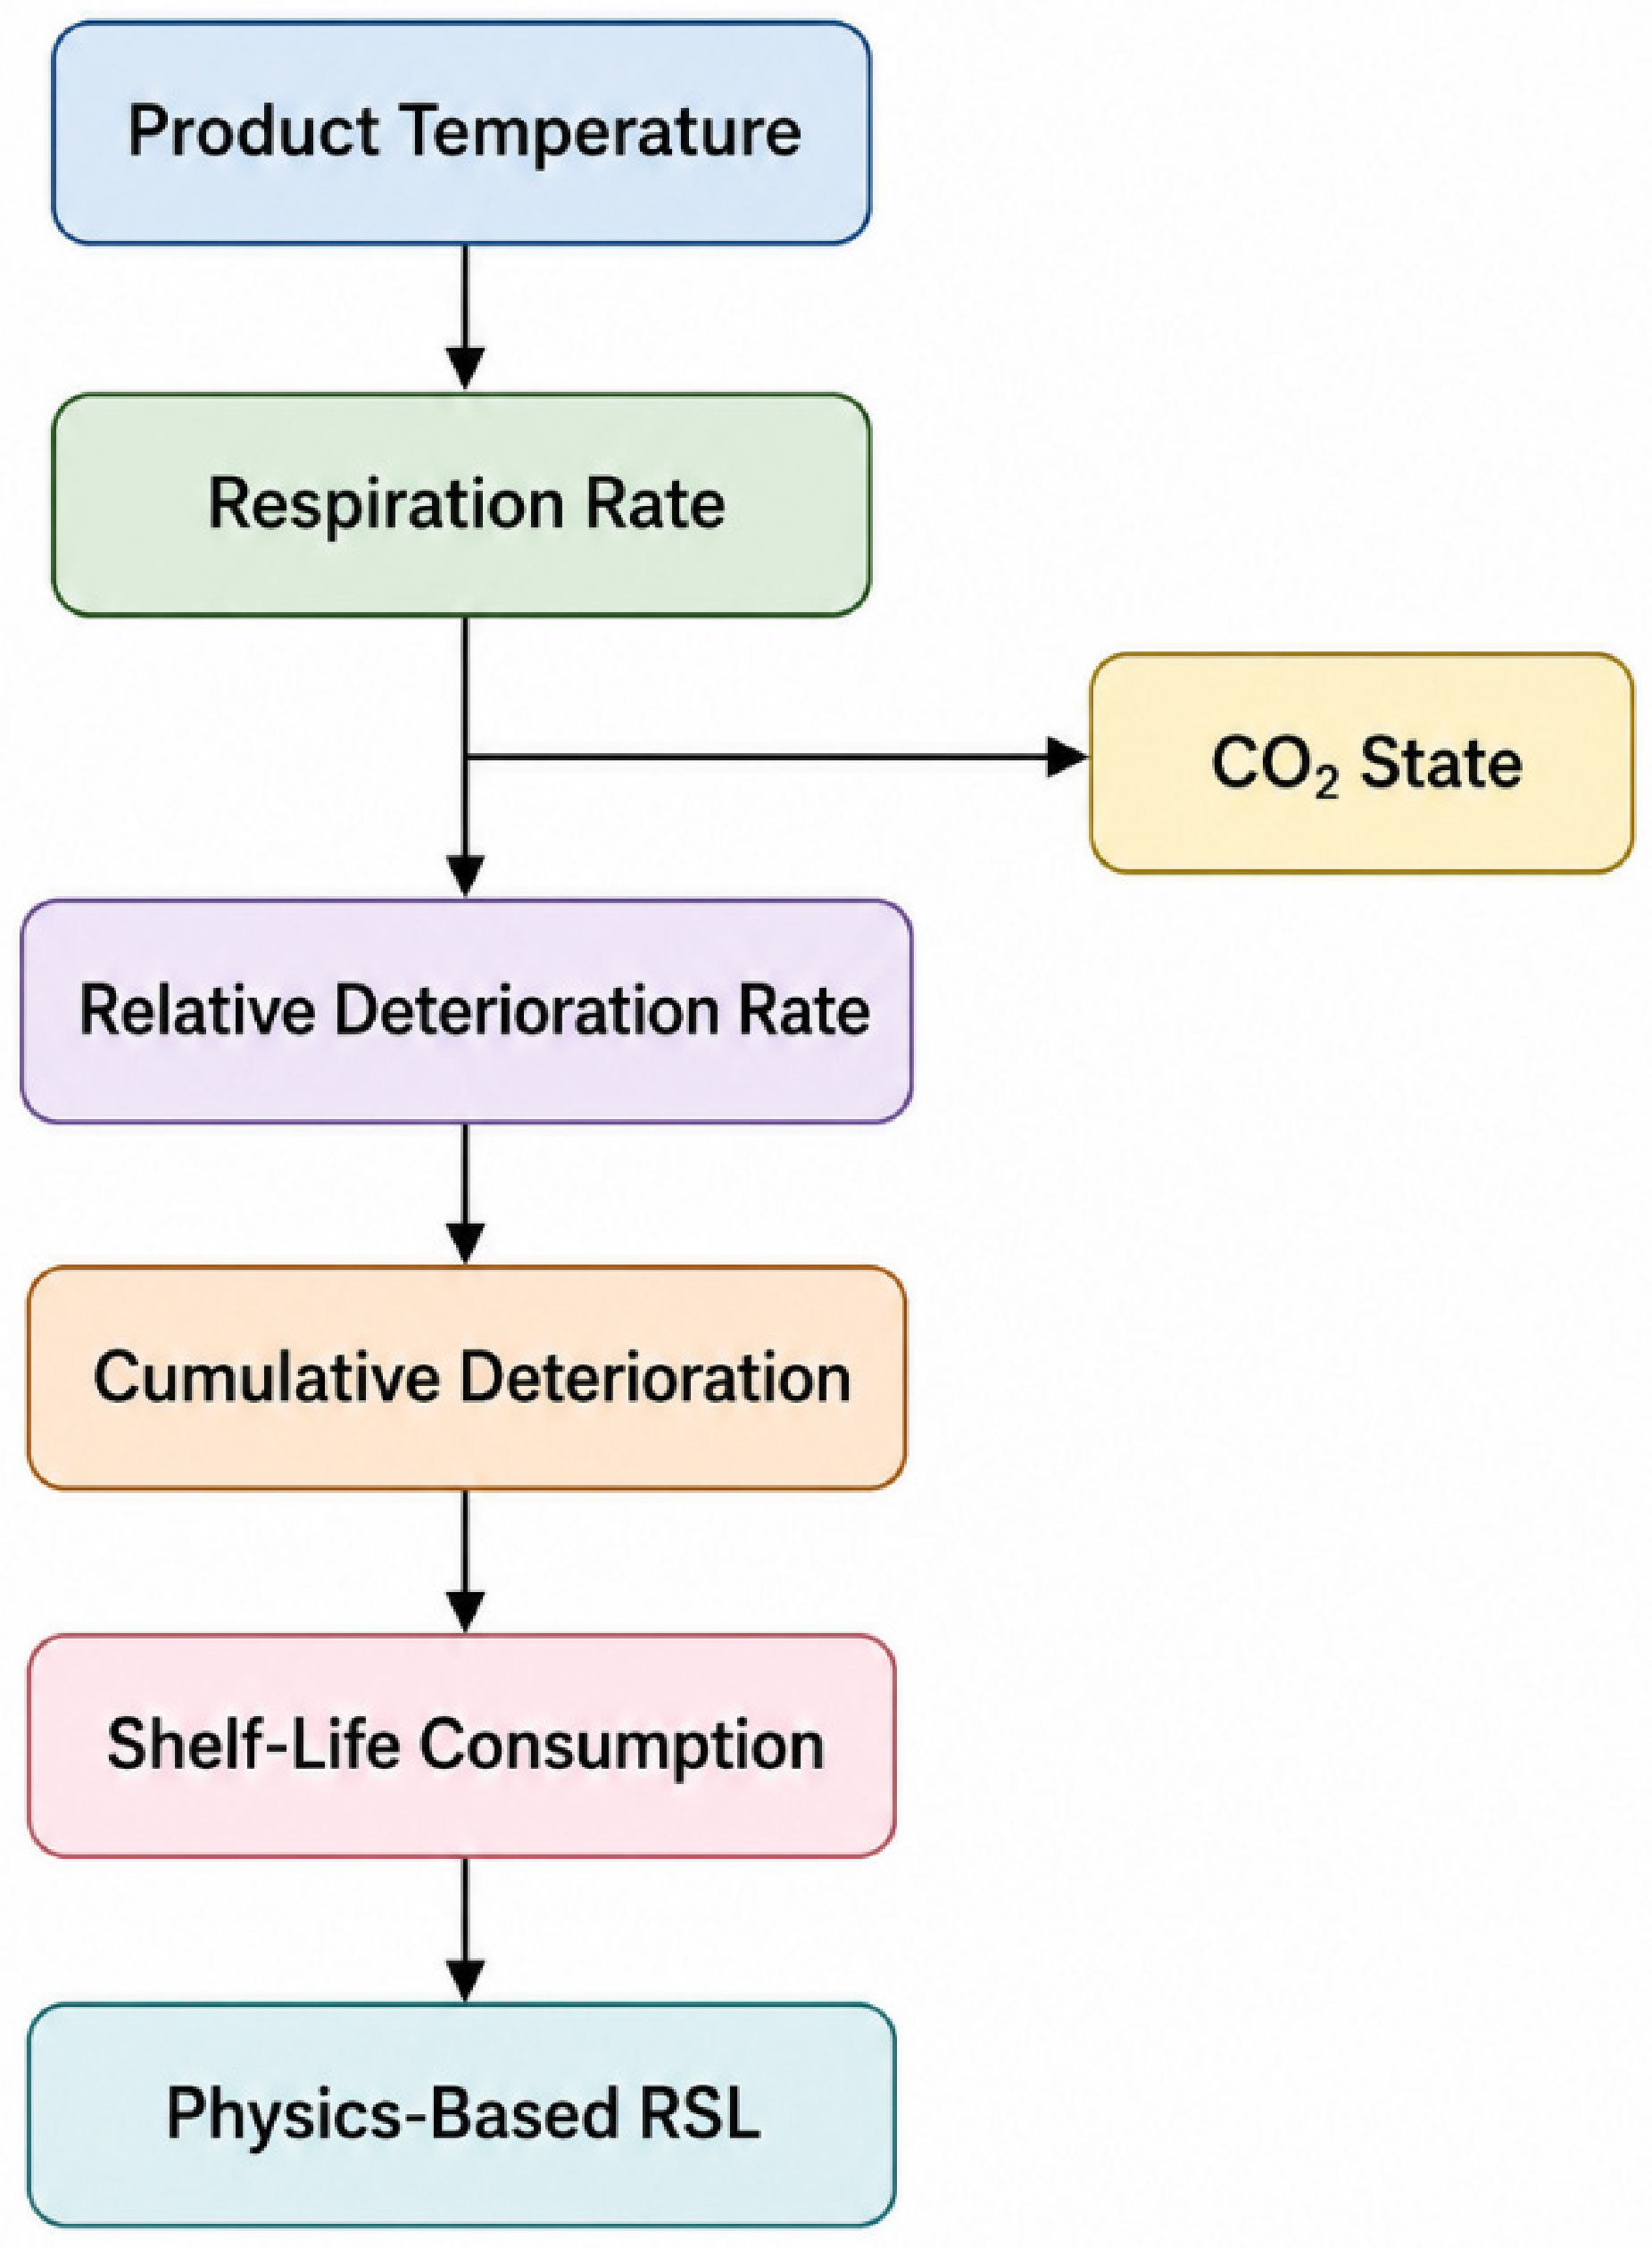
L0 is the reference shelf life under the chosen baseline conditions. The product temperature is subsequently translated into respiration rate, CO2 state, relative deterioration, cumulative deterioration, and eventually RSL, as indicated in Figure 3.
Figure 3.
Transformation of the reconstructed product temperature into physiological deterioration, shelf-life consumption, and physics-based remaining shelf life.
3.4. Adaptive Residual Learning and Final RSL
The Digital Twin model, which is mechanistic in nature, forms the main estimate of RSL. Biological systems could have some systematic bias against physical approximations. Rather than using a black-box machine learning model to replace the physical model, this framework learns only the residual of the model.
The residual is defined as
e(t) = RSLobs(t) − RSLphys(t).
The residual model is fed with inputs that describe the current state and historical exposure of the cold chain:
Xt = [Tp, Ta, RH, CO2, rd, D, E, Xe, De, ΔT].
Here, E is the cold chain excursion binary indicator, defined in Section 3.2, whereby E = 1 in the case that the ambient temperature is greater than the configured reference threshold, and E = 0 otherwise. ΔT is the immediate difference between the ambient and the reference temperature, which is calculated using ΔT = Ta − Tref.
The learned residual is:
The final RSL estimate is therefore:
Three residual learning models are considered: Ridge Regression, Random Forest, XGBoost.
In the case of ridge regression, the coefficients are computed by minimizing:
The residual model retains the physical interpretation while accounting for the discrepancy in the system.
Validation is performed at the trajectory level as opposed to random splits of individual data points. The leave-one-trajectory-out method is employed where there are enough trajectories to use this strategy without temporal leakage. As there are six trajectories for three commodities, with two trajectories for each commodity, leave-one-trajectory-out validation can have a trajectory from a certain commodity in the testing data and the other trajectory for that commodity in the training data. Thus, leave-one-trajectory-out validation measures the generalization ability to an unknown trajectory of known commodities but does not measure generalization to an unknown product commodity.
In order to avoid any data leakage, the leave-one-trajectory-out methodology was performed by taking into account the full trajectory itself. In each validation fold, only one trajectory measured experimentally was kept separately for the purpose of testing, and for everything else such as parameter optimization, residual-model training, and machine learning hyperparameter setting, the other five training trajectories were used. No data from the held-out trajectory was used in the process of parameter estimation, feature scaling, model selection, and hyperparameter setting. Once the model was defined on the basis of the training trajectories, the model was used once on the held-out trajectory for validation purposes.
Direct machine learning baselines: In order to assess the advantage of keeping the physics-based approach in the model structure, three data-driven-only models predicting the RSL Direct Ridge, Direct Random Forest, and Direct XGBoost were assessed. As opposed to the introduced residual learning models, these models predict RSL based on the input features alone without making use of the physics-based estimate of the RSL as a predictor. The direct ML models were tested using the same leave-one-trajectory-out validation approach, preprocessing steps, and evaluation metrics as the proposed framework.
3.5. Uncertainty, Explainability, and What-If Decision Support
Model performance is evaluated using MAE, RMSE, MAPE, and R2.
Bootstrap resampling is used to estimate confidence intervals for the performance metrics. For explainability, the residual model can be interpreted using feature-attribution methods such as SHAP. The prediction can be expressed as
where ϕj represents the contribution of feature j.
Thirdly, the Digital Twin is used for counterfactual cold chain simulation. Various temperature profiles are provided to the Digital Twin, and the RSL profiles are computed accordingly. The change in RSL is
ΔRSL = RSLscenario − RSLbaseline.
This allows the system to solve practical problems such as whether a prolonged excursion or better cooling recovery makes a difference to the remaining shelf life.
Explanation through SHAP values. SHAP (SHapley Additive exPlanations) was calculated for the residual Ridge regression model using the leave-one-trajectory-out validation scheme to assess the importance of the input variables in the prediction of the residual value correction. The mean absolute SHAP values were averaged among the prediction points and used to rank the importance of the inputs.
4. Results and Discussion
4.1. Thermal-State and Deterioration Behavior
The thermal Digital Twin gives a more accurate model of product temperature compared to directly assuming instantaneous follow-up to ambient temperature changes. In temperature changes, the predicted product temperature has thermal inertia, and consequently has a smoother profile than ambient air temperature. This is critical in view of the fact that deterioration is driven by the thermal state of the product. An excursion thus influences the Digital Twin not only in terms of temperature but also duration.
The resulting modeling sequence provides a physically interpretable explanation of how cold chain conditions influence remaining shelf life.
4.2. Overall Predictive Performance
The Physics + Ridge residual approach showed the best performance out of all methods considered, with the MAE value equal to 0.441 days, RMSE—0.450 days, MAPE—6.78%, and R2—0.951. Comparing the Physics + Ridge method to the physics-based benchmark, the following improvements were observed:
- 37.7% decrease in the MAE score
- 48.7% decrease in the RMSE score
- R2 improvement from 0.815 to 0.951
This suggests that the adaptive residual layer is making a meaningful correction to the mechanistic Digital Twin on the considered data. Nevertheless, the results should be understood as specific to the current benchmark only, and not as the universal superiority of the approach to all fresh produce commodities.
4.3. Prediction Error Comparison
Figure 4 illustrates the comparison of observed remaining shelf-life (RSL), physics-based baseline RSL estimation, and the proposed residual-calibrated RSL for the analyzed fresh-produce trajectories. The proposed approach shows an accurate correlation with the observed remaining shelf life (RSL) for the analyzed fresh produce trajectories, especially for the red spinach trajectories, while minimizing the systematic underestimation in the physics-based baseline approach. For the strawberry trajectories, both methods show correlation with the observed RSL, but the proposed method is more adaptive than the baseline method for the red spinach and apricot trajectories. These results reveal that the residual-calibration method is able to compensate for the discrepancy in the physics-based RSL estimation approach while keeping the physics-based model intact.
Figure 4.
Comparative analysis at a case level of the observed RSL, the physics-based baseline, and the proposed residual-calibrated RSL for the evaluated fresh produce trajectories.
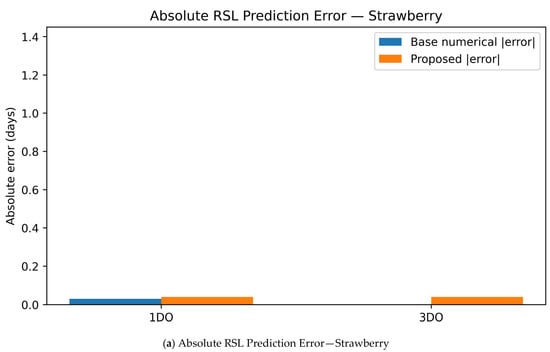
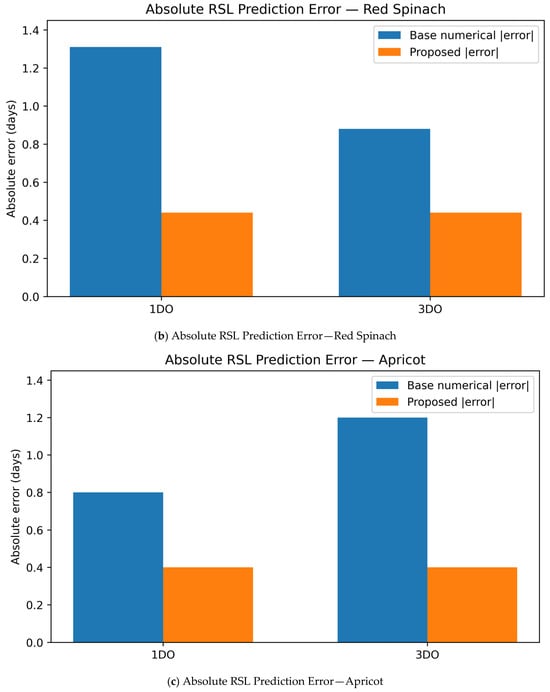
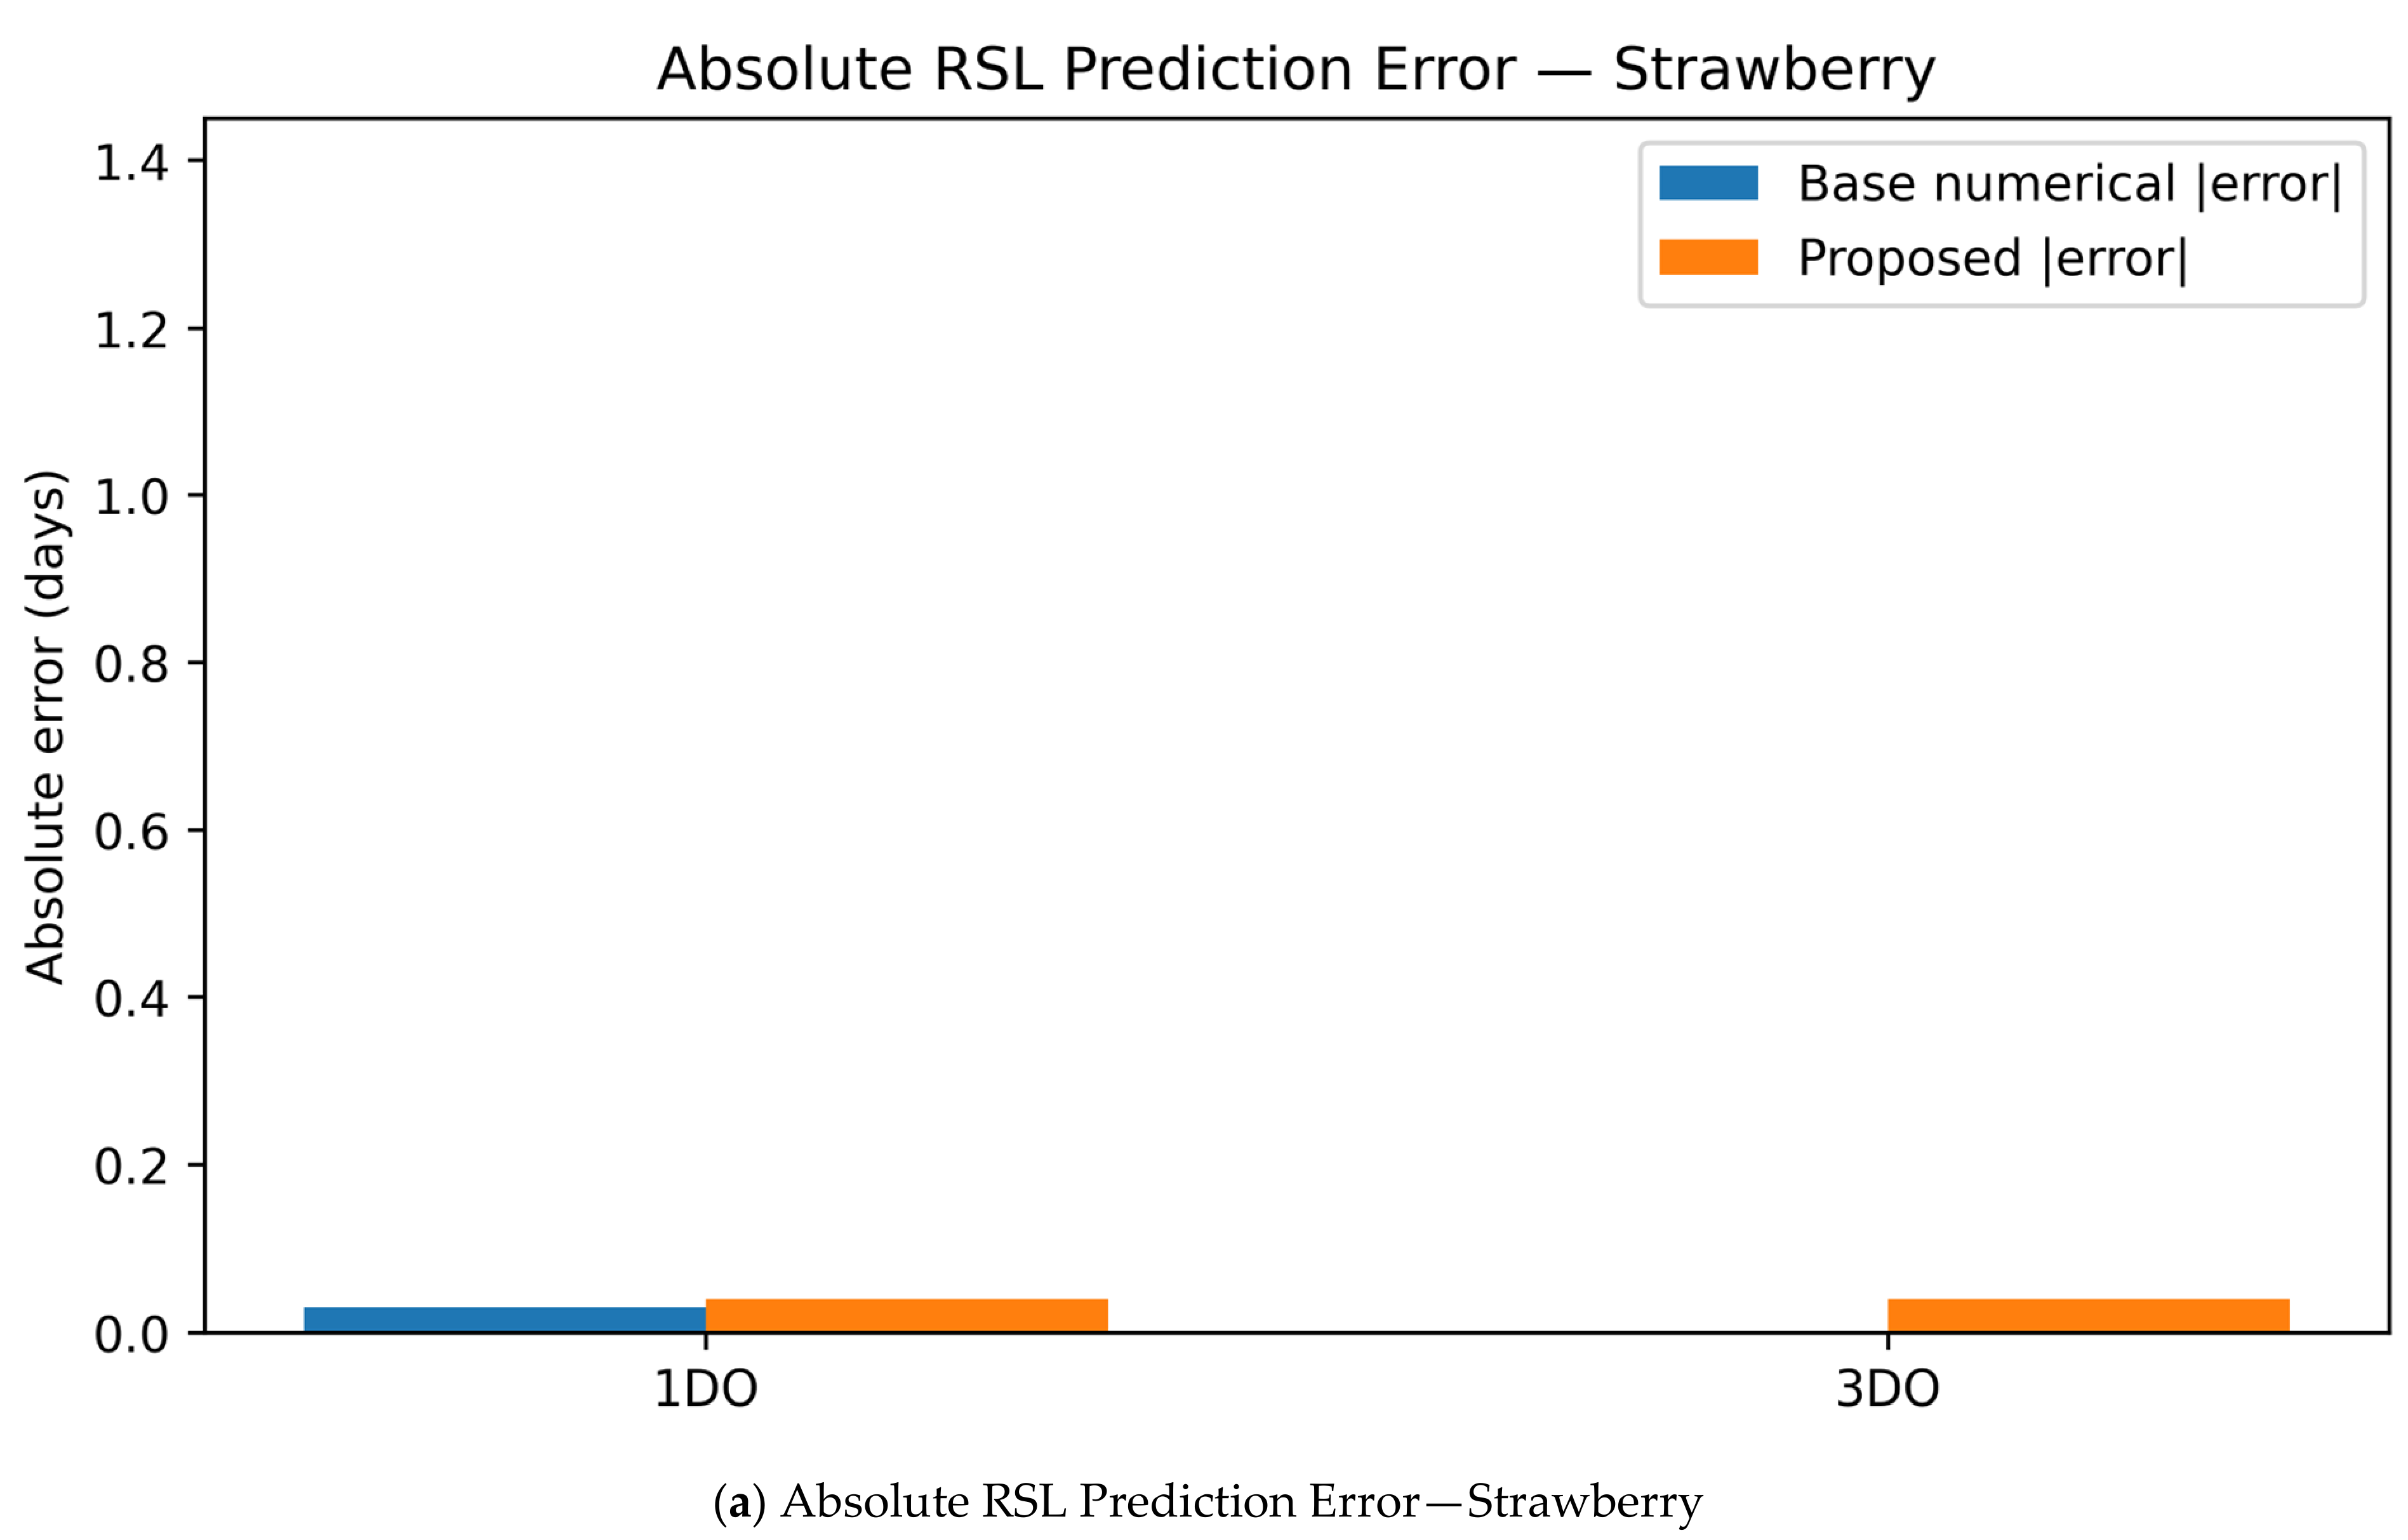
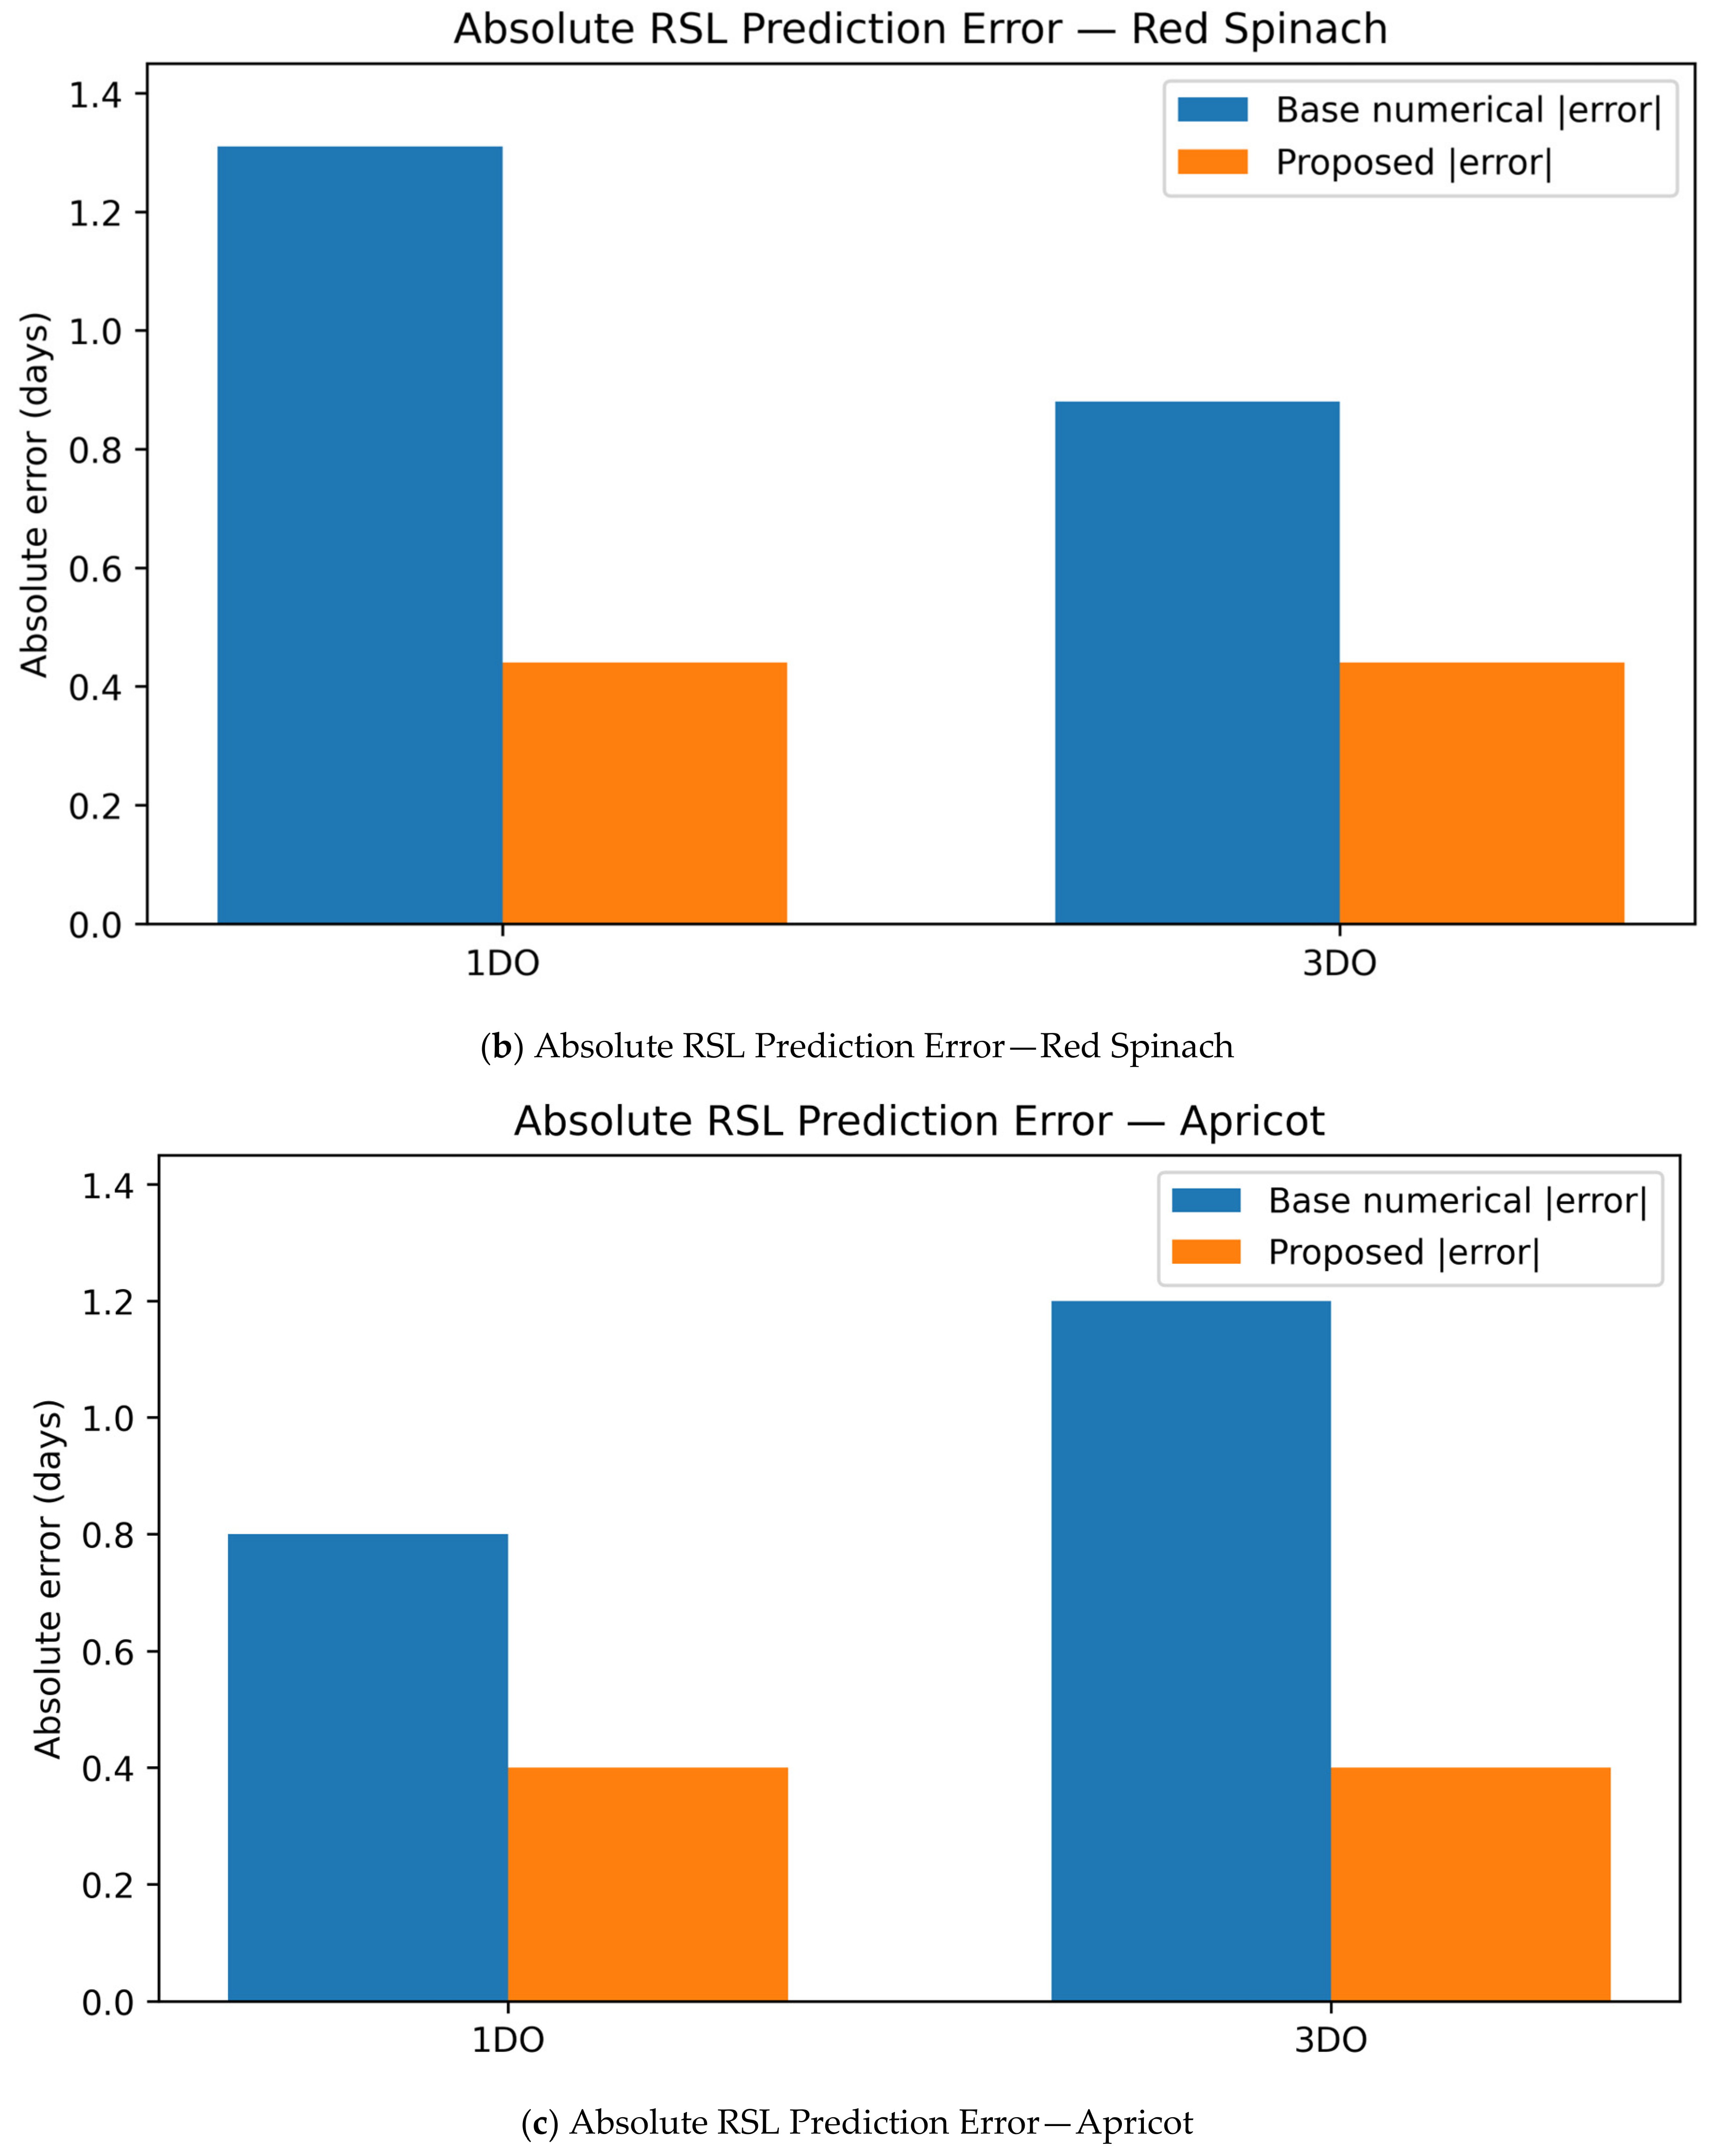
Moreover, the case-level errors highlight the improvement gained using the residual correction layer. In this regard, as illustrated in Figure 5, the proposed method provides lower absolute RSL errors than the physics-based numerical method; the difference in MAE at the level of trajectories being significant according to the Wilcoxon signed-rank test W = 21, p = 0.016. This improvement is more visible for the red spinach and apricot cases due to larger deviations of the physics-based approach from the observed RSL. In the case of the strawberry trajectories, the errors are relatively low for both approaches due to the small impact of the residual correction on the prediction because the underlying physics-based prediction is close to the observed value.
Figure 5.
The absolute remaining shelf-life (RSL) prediction error of the physics-based baseline and proposed residual-calibrated Digital Twin for (a) strawberry, (b) red spinach, and (c) apricot trajectories under 1DO and 3DO conditions.
Consistently with the overall performance numbers, the proposed approach resulted in an MAE of 0.441 days, which is 37.7% lower than 0.708 days for the physics-based baseline.
4.4. Uncertainty, Ablation and Cold Chain Scenario Analysis
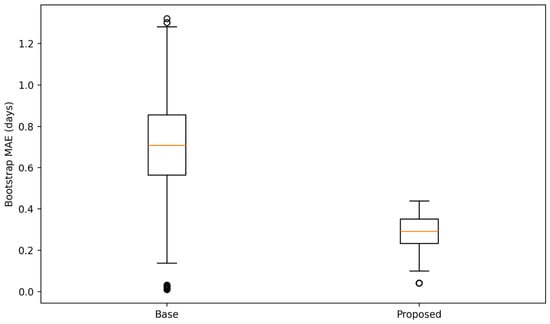
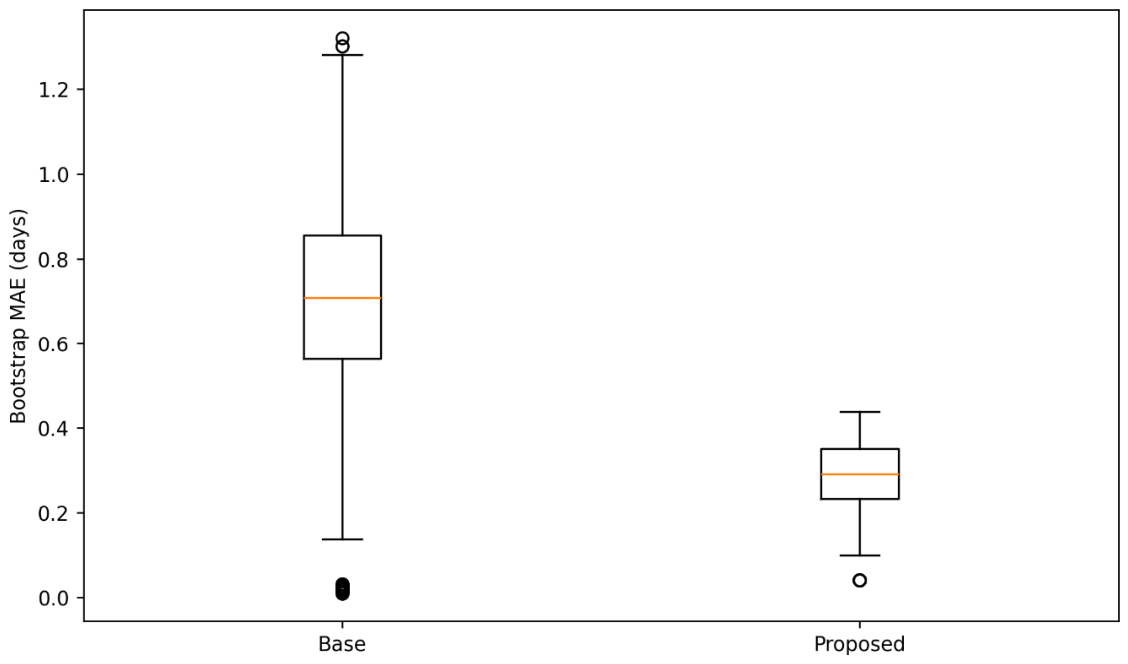
It is recommended to analyze the proposed framework incrementally in order to verify whether all its major components are necessary for achieving the final performance. As shown in Figure 6, the proposed framework exhibits a lower and more concentrated bootstrap MAE distribution than the physics-based baseline.
Figure 6.
Bootstrap distributions of MAE for the physics-based baseline and proposed residual-calibrated Digital Twin.
Ablation configurations analyzed in the proposed framework are presented in Table 8.
Table 8.
Ablation configurations evaluated in the proposed framework.
Ablation analysis: According to the findings from the ablation experiment, there appears to be a bigger MAE improvement due to the inclusion of the CO2 state, compared to the inclusion of the events feature vector alone. This is because of the complementary information brought forth by the CO2 state about the physiological state of the product. While temperature reflects the environmental thermal stress, the model-driven CO2 state gives additional information regarding the respiratory metabolism and its accumulation due to confined packaging of the product. Therefore, the CO2 state can give additional information about the deterioration process that is not captured by temperature alone. On the other hand, event features are more informative on the occurrence, severity, and duration of cold chain temperature disruptions, which are partly contained in the thermal trajectory itself.
A bootstrap resampling technique B = 1000 resamples using the six leave-one-trajectory-out error scores) was performed on each of the four performance measures for both the physics-based baseline method and the Physics + Ridge residual modeling method. The associated 95% confidence intervals are shown in Table 9 below.
Table 9.
Bootstrap 95% confidence intervals of performance metrics (B = 1000 resamples).
It can be observed that the bootstrap experiments show lower mean absolute error (MAE), root-mean-square error (RMSE), and higher R2 for the suggested Physics + Ridge residuals model than for the pure physics-based model. In addition, conducting a Wilcoxon signed-rank test on the six MAE pairs gives W = 21 and p = 0.016.
SHAP explainability analysis: SHAP analysis was conducted in order to understand the residual correction produced by the suggested Ridge model. The mean absolute SHAP values suggest that the physics-based RSL estimate is the most important feature affecting the residual prediction, followed by cumulative CO2 state, cumulative thermal burden, event magnitude, event duration, time since cold chain initiation, respiration rate, and current product temperature. Such an order suggests that the residual model mainly works by improving the physics-based estimate using accumulated physiological and thermal history data. Mean absolute SHAP values are given in Table 10.
Table 10.
Mean absolute SHAP values for the Ridge residual correction model.
Mean absolute SHAP values are the average values of the absolute impact that each variable has on the predicted residual adjustment. Higher values imply a higher degree of influence on the prediction.
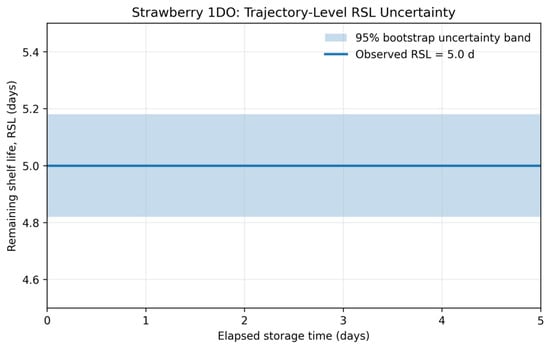
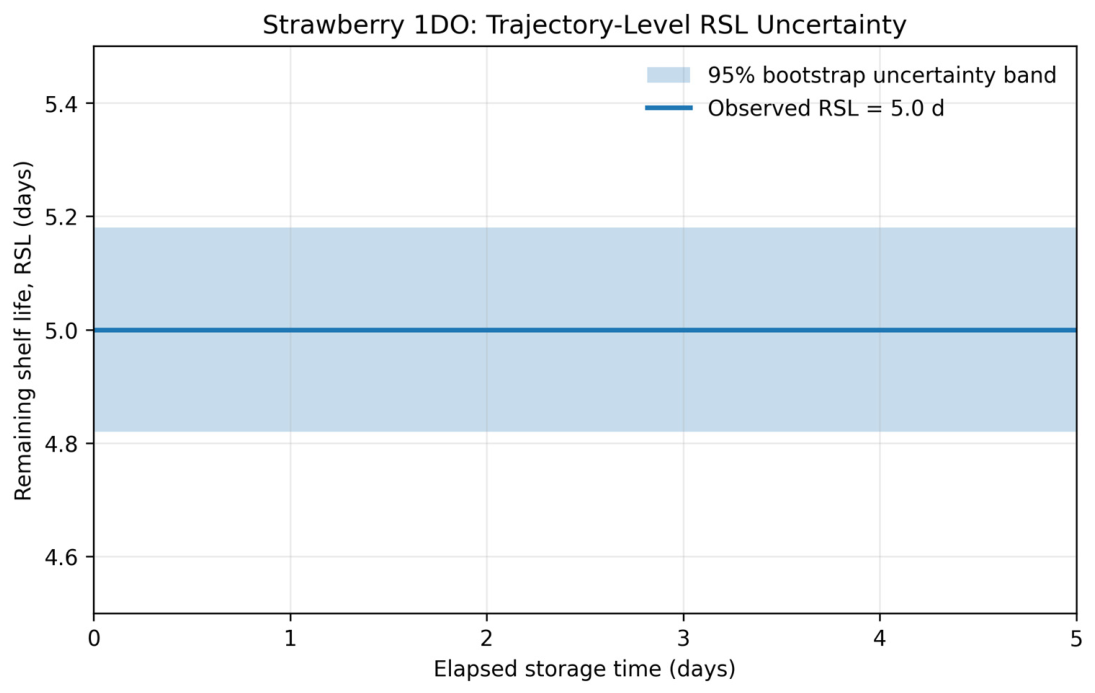
Analysis of trajectory-level uncertainty: In addition to the aggregate bootstrap distributions, the prediction uncertainty at the trajectory level was determined by 1000 bootstrap replications for one representative trajectory for the strawberry 1DO. The resulting 95% bootstrap prediction interval for the RSL prediction. The uncertainty interval shows the variability of the residual adjustment within bootstrap replicates, and the physics-based baseline and observed RSL are included for comparison. The mean half-width of the 95% prediction interval was about 0.18 days, suggesting that there is low prediction uncertainty along the trajectory under evaluation. Prediction of trajectory-level RSL is shown in Figure 7.
Figure 7.
Prediction of trajectory-level RSL using the 95% bootstrap confidence band B = 1000 for the trajectory of strawberry 1DO. The shaded area indicates the uncertainty in the residual correction, and the physics-based baseline and measured RSL are also shown for reference.
Given that the statistics are based on just six observations at the trajectory level, there is a need to exercise caution when interpreting the bootstrap confidence intervals and Wilcoxon signed-rank test results. This is because of the limited sample size at the trajectory level, which means that any inference drawn from the statistical findings cannot be conclusive.
One shortcoming of the present validation is the fact that the shelf-life endpoint of the experiment was obtained based on observations of visual spoilage rather than quality measurements from instrumentation. Quality parameters such as firmness, color, microbial population, respiration rate, or any other physicochemical quality parameter were not obtained in the source experiment. It is important to note that the current performance of the RSL in relation to the shelf life is based on the visual spoilage endpoint chosen for the experiment.
4.5. Comparison of Baseline and Proposed Models
Results of the assessment prove evident superiority over the purely physical baseline model. Quantitative comparison of the tested RSL models is summarized in Table 11.
Table 11.
Comparison of the performance of the tested RSL models.
Direct machine learning predictions had higher prediction error rates than their counterparts based on the physics-informed residual learning framework. For example, the Direct Ridge, Direct Random Forest, and Direct XGBoost models had MAEs of 0.810, 0.740, and 0.772 days, respectively, while the physics-informed proposed model had an MAE of 0.441 days. On the other hand, RMSEs of the three direct machine learning methods were 0.975, 0.893, and 0.932 days, while the RMSE of the proposed model was 0.450 days. Thus, these results suggest that for the tested low-data cold chain problem, having the Digital Twin model (mechanistic) as the principal RSL predictor and applying machine learning to predict residuals is more effective than directly predicting RSL via machine learning.
Adaptive correction based on the Ridge regression model showed a reduction in MAE from 0.708 days to 0.441 days.
Relative improvement of MAE equals:
RMSE decreased from 0.877 days to 0.450 days:
The coefficient of determination increased from R2 0.815 to 0.951.
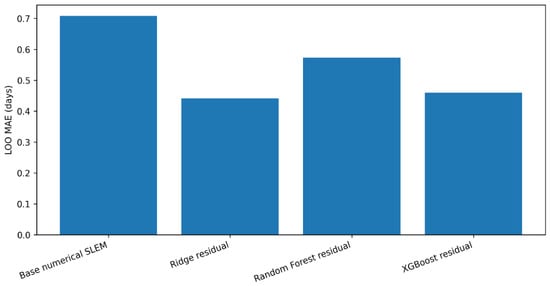
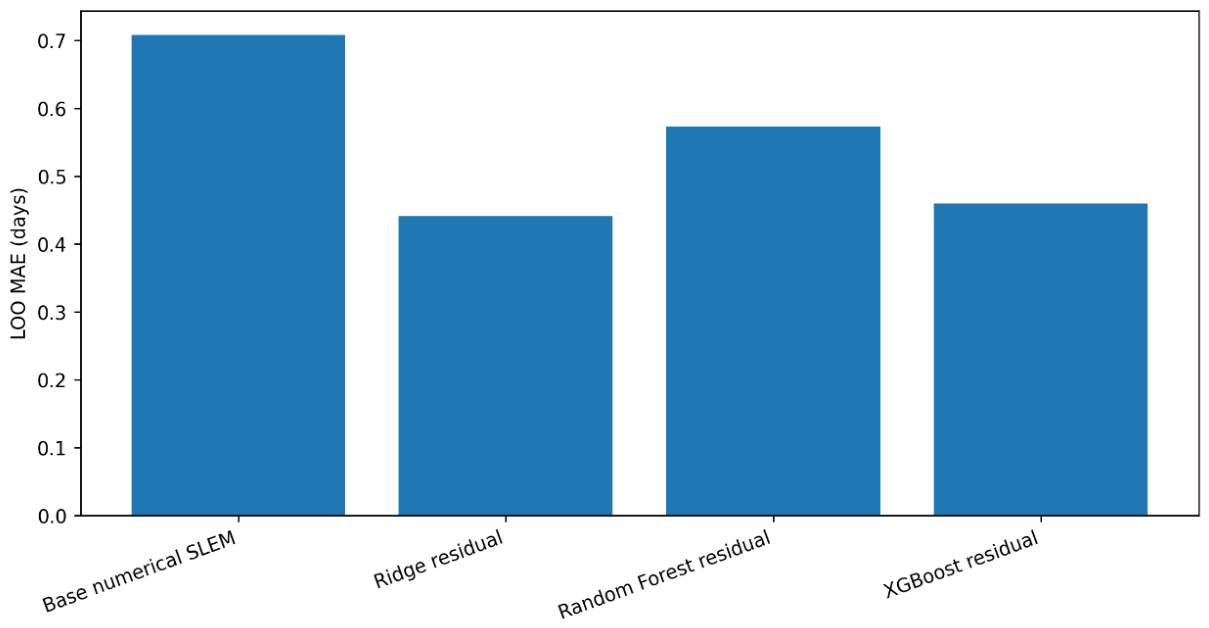
Figure 8 shows that the Ridge residual learning model provides the best leave-one-trajectory-out MAE in comparison to all other residual-learning models.
Figure 8.
Leave-one-trajectory-out mean absolute error of the physics-based baseline versus the alternative residual-learning models.
It is clear from the results that the physics-based Digital Twin has captured a large part of the underlying degradation pattern, while the residual-learning model can compensate for any systematic errors that occur in the mechanistic trajectory. A significant point to note is that the XGBoost model provided the best MAPE (6.35%), while Ridge provided the best MAE and RMSE and the highest R2. Therefore, the results do not show that a more complex model automatically delivers better results.
Rather, the results provide support to the hypothesis that the residual pattern in the given data can be captured with a simple model.
4.6. Error Behavior and Contribution of the Hybrid Architecture
The decrease in RMSE is especially critical because, unlike MAE, RMSE gives extra weight to larger prediction errors. The drop of approximately 48.7% shows that the adaptively corrected version is better at dealing with large discrepancies from the reference path in the benchmark used. The increase also justifies the proposed hybrid architecture: Physics Model + Residual Learning
Instead of using machine learning as an alternative to the physical model entirely. The physics model provides the mechanism, while the residual part models the systematic deviations from the approximation with simplified equations of deterioration. It is especially relevant for cold chain applications because the system itself is complicated, but the amount of labeled data available is insufficient for a completely data-driven Digital Twin.
4.7. Cold Chain Decision-Support Interpretation
The event-aware representation of the problem allows interpreting the temperature excursions in the context of remaining shelf life.As opposed to merely stating:
the Digital Twin records:
T > Tthreshold,
Magnitude + Duration + Cumulative Exposure.
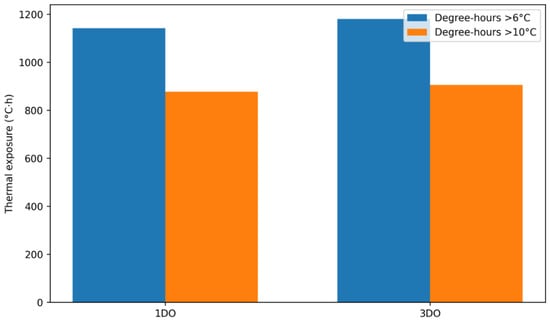
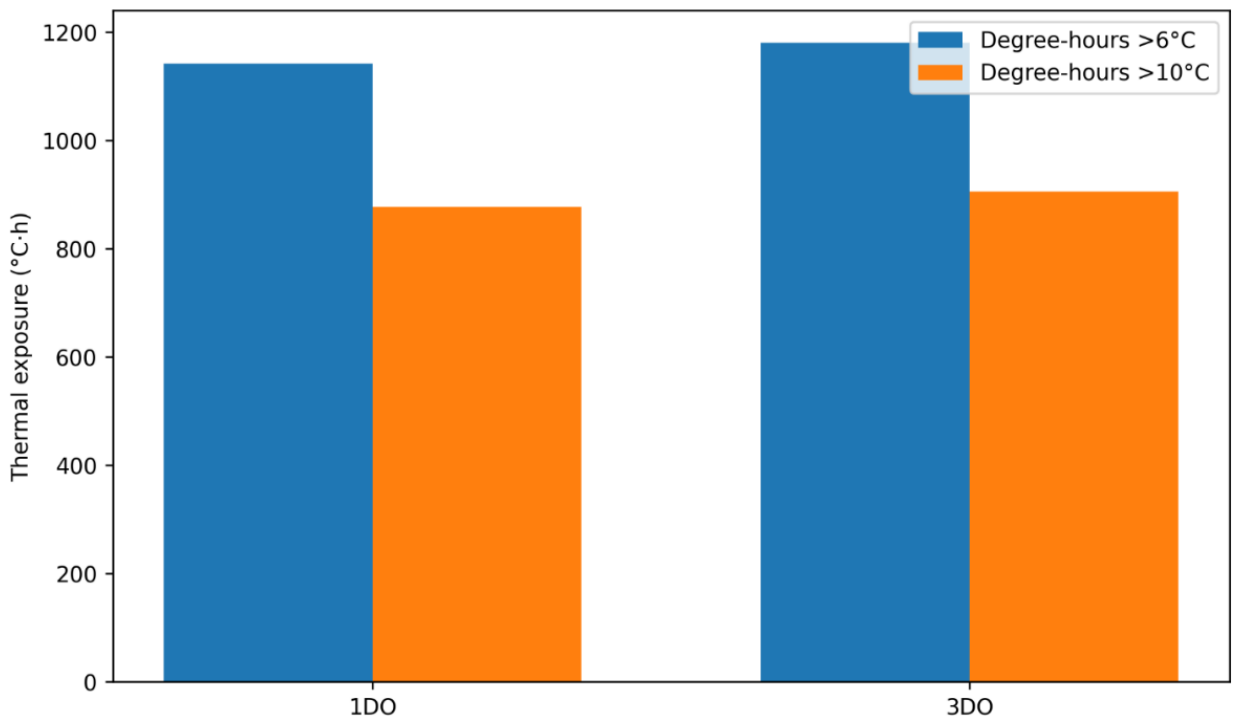
This is the reason why two seemingly identical cold chain profiles will result in distinct histories of deterioration. As is shown in Figure 9, the cumulative cold chain thermal burden varies between the 1-day and 3-day cold chain profiles, indicating the impact of prolonged temperature exposure on the cold chain.
Figure 9.
Cumulative thermal burden under different cold chain exposure duration scenarios.
The thermal burden scenario analysis reveals how prolonged temperature exposure increases the cumulative cold chain burden. A full counterfactual RSL analysis can be derived based on the Digital Twin framework. Cumulative thermal burden is shown in Figure 9 under different cold chain exposure duration scenarios.
Counterfactual cold chain simulation. The Digital Twin was subjected to further assessment by considering counterfactual temperature conditions to investigate the impact of cold chain disruption on remaining shelf life. Three cases were considered for the delivery of strawberries with a nominal shelf life of 7 days: (S1) no temperature deviation, indicating an optimal condition for the cold chain; (S2) one temperature deviation of +6 °C above the reference threshold for 4 h on day 2; and (S3) two temperature deviations of +6 °C above the reference threshold for 4 h each on days 2 and 4. Counterfactual RSL under alternative cold chain temperature scenarios are given in Table 12. The value of 7 days is only used as an arbitrary shelf life in the theoretical simulation and is not based on the experimental data, where the strawberry spoilage endpoints are around 5 days. It should not be considered to be an experimental shelf life of strawberries.
Table 12.
Counterfactual RSL under alternative cold chain temperature scenarios.
For the ideal cold chain (S1), the expected value of RSL at day 6 was 2.38 days. Adding one thermal excursion (S2) led to an expected value of RSL falling to 1.79 days, representing a decrease of 0.59 days or 24.8% compared to S1. Adding two thermal excursions (S3) led to an expected value of RSL falling to 1.11 days, which represented a decrease of 1.27 days or 53.4% compared to S1. These results illustrate that the Digital Twin is capable of translating different thermal histories of the cold chain into RSL implications.
It should be noted that this performance is a proof-of-concept study carried out through six different trajectories from three different produce types. Though the performance is based on many time points in each trajectory, it does not contribute to increasing the number of independent experimental samples. Therefore, the performance results are not to be considered a sign of generalization to other fresh produce commodities and packaging environments.
4.8. Study Scope and Generalizability
In its current state, the study should be regarded as an examination of the proof of concept, rather than a thorough demonstration of the ability to generalize. The set of experimental trajectories contains six perturbed cold chain sequences for three different types of fresh produce; each trajectory is perturbed twice (1DO and 3DO). Although the total number of temperature measurements per time point equals 21,744, the number of independently created experimental trajectories is still six. Therefore, the outcomes yielded using the EA-PI-DT technique must be considered proof of feasibility on the considered trajectories and not generalizability to other products, varieties, packing structures, cold chains, or environmental conditions. An additional limitation to note is that the shelf-life end points were determined using visual spoilage criteria. There were no instrumental measures, such as firmness, color, microbial population, and respiration rates, available from the source experiment. Hence, the current model validation will be performed using the visually determined spoilage endpoint from the experiment. Furthermore, the time-dependent reference values for RSL from the onset of a trajectory to the spoilage endpoint were mathematically determined from the spoilage time, which was experimentally determined. These values have not been independently measured and must thus be seen as endpoint-based reference values. However, the deterioration and CO2 components could not be independently validated since data on respiration rates, CO2 levels, and gas exchange from packages were not available in the original dataset. Future research should validate these components based on physiological and packaging data for specific products.
5. Conclusions and Future Work
This paper proposes and assesses the performance of an Event-Aware Adaptive Physics-Informed Digital Twin for predicting the dynamic remaining shelf life of fresh produce in cold chains. The performance of the digital twin was assessed using a proof-of-concept experiment involving six experimental disturbed trajectories with three produce items, including strawberries, red spinach, and apricots. The framework includes cold chain observations, data quality analysis, event detection, thermal state estimation, respiration rate dependent on temperature, CO2 dynamics, cumulative deterioration modeling, physics-informed RSL prediction, and residual correction. Unlike a data-driven predictor, the framework maintains the mechanistic model of deterioration and leverages machine learning to adaptively correct any systematic deviation of the physics-informed estimate. When tested on the evaluation benchmark, the Physics + Ridge regression residual model was able to decrease MAE from 0.708 to 0.441 days and RMSE from 0.877 to 0.450 days, which amounts to roughly 37.7% and 48.7% reduction, respectively; R2 increased from 0.815 to 0.951.
The findings need to be interpreted in the context of the proof-of-concept experiment. There were only six independent disrupted trajectories using three produce types. While there are 21,744 temperature observations per time point, they represent only six independent trajectories of the experiment, and hence cannot be considered to be 21,744 independent samples. As a result, the current experiment does not have generalizable findings for fresh produce commodities under different cold chain scenarios.
Author Contributions
Conceptualization, B.P.S., K.S.S., B.K.S., H.K. and B.N.S.; methodology, B.P.S., K.S.S., B.K.S., H.K. and B.N.S.; software, B.P.S., K.S.S., B.K.S., H.K. and B.N.S.; validation, B.P.S., K.S.S., B.K.S., H.K. and B.N.S.; formal analysis, B.P.S., K.S.S., B.K.S., H.K. and B.N.S.; investigation, B.P.S., K.S.S., B.K.S., H.K. and B.N.S.; resources, B.P.S., K.S.S., B.K.S., H.K. and B.N.S.; data curation, B.P.S., K.S.S., B.K.S., H.K. and B.N.S.; writing—original draft preparation, B.K.S., H.K. and B.N.S.; writing—review and editing, B.P.S. and K.S.S.; visualization, B.P.S., K.S.S., B.K.S., H.K. and B.N.S. All authors have read and agreed to the published version of the manuscript.
Funding
This research received no external funding.
Data Availability Statement
The data are publicly available at https://data.mendeley.com/datasets/kphtgxn3ff/4 (accessed on 13 August 2026) [35,36].
Conflicts of Interest
The authors declare no conflicts of interest.
References
- Zhang, Y.; Zou, Y.; Liu, L.; Manzardo, A.; Wang, X.; Wu, J. A digital twin–driven dynamic shelf life approach for mitigating food loss across fruit supply chains. J. Stored Prod. Res. 2026, 117, 103016. [Google Scholar] [CrossRef] [Scilit]
- Guo, X.; Harbers, C.J.; Heuer, H.E.J.M.; Min, Q.; Liu, Y.; Woltering, E.J.; Marcelis, L.F.M.; van der Sman, R.G.M. A generic scientific machine learning framework for fruit and vegetable quality prediction. Postharvest Biol. Technol. 2026, 234, 114103. [Google Scholar] [CrossRef] [Scilit]
- Zou, Y.; Wu, J.; Meng, X.; Wang, X.; Manzardo, A. Digital twin integration for dynamic quality loss control in fruit supply chains. J. Food Eng. 2025, 397, 112577. [Google Scholar] [CrossRef] [Scilit]
- Elashmawy, R.; Doron, M.; Kanjilal, R.; Brecht, J.K.; Uysal, I. The digital cold chain: Sensor-driven product quality with AI. Postharvest Biol. Technol. 2025, 230, 113714. [Google Scholar] [CrossRef] [Scilit]
- Monteiro, J.; Barata, J. Digital twin-enabled regional food supply chain: A review and research agenda. J. Ind. Inf. Integr. 2025, 45, 100851. [Google Scholar] [CrossRef] [Scilit]
- Lamberty, A.; Kreyenschmidt, J. Technical, process-related and sustainability requirements for IoT-based temperature monitoring in fruit and vegetable supply chains. Discov. Food 2025, 5, 151. [Google Scholar] [CrossRef] [Scilit]
- Niu, Y.; Ye, L.; Shi, Y.; Gu, H.; Luo, A. Development of shelf-life prediction models and programs for ‘Xuxiang’ kiwifruit stored at different temperatures. Postharvest Biol. Technol. 2025, 223, 113428. [Google Scholar] [CrossRef] [Scilit]
- ElManawy, A.I.; Maratab, A.; Ghazal, A.F.; Li, F.; Li, X.; Zhang, X. Shelf-life assessment techniques for fruit and vegetables: Recent trends and future prospects. Postharvest Biol. Technol. 2025, 226, 113521. [Google Scholar] [CrossRef] [Scilit]
- Huang, Y.; Ghadge, A.; Yates, N. Implementation of digital twins in the food supply chain: A review and conceptual framework. Int. J. Prod. Res. 2024, 62, 6400–6426. [Google Scholar] [CrossRef] [Scilit]
- Guidani, B.; Ronzoni, M.; Accorsi, R. Virtual agri-food supply chains: A holistic digital twin for sustainable food ecosystem design, control and transparency. Sustain. Prod. Consum. 2024, 46, 161–179. [Google Scholar] [CrossRef] [Scilit]
- Wang, D.; Zhang, M.; Li, M.; Lin, J. Fruits and vegetables preservation based on AI technology: Research progress and application prospects. Comput. Electron. Agric. 2024, 226, 109382. [Google Scholar] [CrossRef] [Scilit]
- Li, D.; Bai, L.; Wang, R.; Ying, S. Research progress of machine learning in extending and regulating the shelf life of fruits and vegetables. Foods 2024, 13, 3025. [Google Scholar] [CrossRef] [Scilit] [PubMed]
- Qiao, J.; Zhang, M.; Qiu, L.; Mujumdar, A.S.; Ma, Y. Visual early warning and prediction of fresh food quality deterioration: Research progress and application in supply chain. Food Biosci. 2024, 58, 103671. [Google Scholar] [CrossRef] [Scilit]
- Zhou, Y.; Ma, Y.; Sun, X.; Peng, A.; Zhang, B.; Gu, X.; Wang, Y.; He, X.; Guo, Z. Quality prediction of kiwifruit based on transfer learning. J. Intell. Fuzzy Syst. 2024, 46, 7389–7400. [Google Scholar] [CrossRef] [Scilit]
- Li, H.; Zhu, L.; Li, N.; Liu, Z.; Wang, L.; Chitrakar, B.; Xu, D.; Cui, Z.; Tang, Y.; Hu, L.; et al. NIR spectroscopy for quality assessment and shelf-life prediction of kiwifruit. Postharvest Biol. Technol. 2024, 218, 113201. [Google Scholar] [CrossRef] [Scilit]
- Goyal, K.; Kumar, P.; Verma, K. Tomato ripeness and shelf-life prediction system using machine learning. J. Food Meas. Charact. 2024, 18, 2715–2730. [Google Scholar] [CrossRef] [Scilit]
- Jia, H.; Wu, C.; Huang, M.; Zhu, Q.; Zhang, M. TTI and pH-responsive dual colorimetric sensor arrays combined with a cascaded deep learning approach for dynamic monitoring of freshness of fresh-cut fruits. Food Chem. 2025, 492, 145495. [Google Scholar] [CrossRef] [Scilit] [PubMed]
- Chen, Q.; Li, J.; Yang, H.; Qian, J. A dynamic shelf-life prediction method considering actual uncertainty: Application to fresh fruits in long-term cold storage. J. Food Eng. 2023, 349, 111471. [Google Scholar] [CrossRef] [Scilit]
- Maheshwari, P.; Kamble, S.; Belhadi, A.; Venkatesh, M.; Abedin, M.Z. Digital twin-driven real-time planning, monitoring, and controlling in food supply chains. Technol. Forecast. Soc. Change 2023, 195, 122799. [Google Scholar] [CrossRef] [Scilit]
- Kumar, A.; Kumar, R.; Subudhi, S. Temperature predictions during forced-air cooling of apples based on machine learning and ANN algorithms. Comput. Electron. Agric. 2025, 230, 109842. [Google Scholar] [CrossRef] [Scilit]
- Zhang, Y.; Li, X.; Xing, X.; Zhu, L.; Du, Y. Banana shelf life prediction method based on novel causal convolution lightweight Transformer network. J. Imaging Sci. Technol. 2025, 69, 010402. [Google Scholar] [CrossRef] [Scilit]
- Mohd Ali, M.; Hashim, N.; Abd Aziz, S.; Lasekan, O. Quality prediction of different pineapple (Ananas comosus) varieties during storage using infrared thermal imaging technique. Food Control 2022, 138, 108988. [Google Scholar] [CrossRef] [Scilit]
- Zhang, Y.; Zhu, D.; Ren, X.; Shen, Y.; Cao, X.; Liu, H.; Li, J. Quality changes and shelf-life prediction model of postharvest apples using partial least squares and artificial neural network analysis. Food Chem. 2022, 394, 133526. [Google Scholar] [CrossRef] [Scilit] [PubMed]
- Shoji, K.; Schudel, S.; Shrivastava, C.; Onwude, D.; Defraeye, T. Optimizing the postharvest supply chain of imported fresh produce with physics-based digital twins. J. Food Eng. 2022, 329, 111077. [Google Scholar] [CrossRef] [Scilit]
- Singh, A.; Vaidya, G.; Jagota, V.; Darko, D.A.; Agarwal, R.K.; Debnath, S.; Potrich, E. Recent advancement in postharvest loss mitigation and quality management of fruits and vegetables using machine learning frameworks. J. Food Qual. 2022, 2022, 6447282. [Google Scholar] [CrossRef] [Scilit]
- Anand, S.; Barua, M.K. Modeling the key factors leading to post-harvest loss and waste of fruits and vegetables in the agri-fresh produce supply chain. Comput. Electron. Agric. 2022, 198, 106936. [Google Scholar] [CrossRef] [Scilit]
- Yang, J.; Xu, Y. Prediction of fruit quality based on the RGB values of time–temperature indicator. J. Food Sci. 2021, 86, 932–941. [Google Scholar] [CrossRef] [Scilit] [PubMed]
- Paulsen, E.; Barrios, S.; Lema, P. Production of packaged ready-to-eat whole strawberries (cv. San Andreas): Packaging conditions for shelf-life extension. Food Packag. Shelf Life 2021, 29, 100696. [Google Scholar] [CrossRef] [Scilit]
- Feng, J.; Yuan, B.; Li, X.; Tian, D.; Mu, W. Evaluation on risks of sustainable supply chain based on optimized BP neural networks in fresh grape industry. Comput. Electron. Agric. 2021, 183, 105988. [Google Scholar] [CrossRef] [Scilit]
- Putri, R.M.; Jumeri; Falah, M.A.F. Shelf-life prediction of freeze-dried strawberries using accelerated shelf-life testing method in a tropical environment. Int. J. Agric. Technol. 2024, 20, 329–342. [Google Scholar]
- Vinothini, A.; Priya, S.B. Survey of machine learning methods for big data applications. In Proceedings of the 2017 International Conference on Computational Intelligence in Data Science (ICCIDS), Chennai, India, 2–3 June 2017; pp. 1–5. [Google Scholar] [CrossRef] [Scilit]
- Sai, B.K.; Baghavathi Priya, S. Enhancing Agricultural Supply Chains with Industry 6.0 Technologies for Sustainable Efficiency: Blockchain, AI, and IoT for Smart Agriculture. In Industry 6.0 for Sustainable Supply Chains in Agriculture, Healthcare, and Asset Management; Murugan, T., Ahamed, N.N., Varalakshmi, P., Eds.; IGI Global Scientific Publishing: Hershey, PA, USA, 2026; pp. 53–86. [Google Scholar] [CrossRef] [Scilit]
- Anitha, K.; Szymański, J.R.; Zurek-Mortka, M.; Sathiyanarayanan, M. Data-Driven Approach Using Random Forest Regression for Accurate Electric Vehicle Battery State of Health Estimation. Int. J. Electr. Electron. Eng. 2025, 12, 104–113. [Google Scholar] [CrossRef] [Scilit]
- Chauhan, N.; Sulochana, V.; Kumar, R.P. FARMER: Forecasting agricultural results with machine learning evaluation and regression. In Proceedings of the 11th International Conference on Reliability, Infocom Technologies and Optimization (ICRITO), Noida, India, 14–15 March 2024. [Google Scholar]
- Abougharib, A.; Awad, M.; Ndiaye, M.M. Remaining Shelf-Life Estimation of Fresh Fruits and Vegetables During Transportation. IEEE Access 2023, 11, 8845–8859. [Google Scholar] [CrossRef] [Scilit]
- Abougharib, A.; Awad, M. A Real-Time Shelf-Life Estimation Model. In Mendeley Data Version 4; American University of Sharjah College of Engineering: Sharjah, United Arab Emirates, 2023. [Google Scholar] [CrossRef]

Disclaimer/Publisher’s Note: The statements, opinions and data contained in all publications are solely those of the individual author(s) and contributor(s) and not of MDPI and/or the editor(s). MDPI and/or the editor(s) disclaim responsibility for any injury to people or property resulting from any ideas, methods, instructions or products referred to in the content. |
© 2026 by the authors. Licensee MDPI, Basel, Switzerland. This article is an open access article distributed under the terms and conditions of the Creative Commons Attribution (CC BY) license.