1. Introduction
Traffic crashes constitute a major public health concern in urban environments worldwide, with pedestrians representing the most vulnerable road users [
1]. In developing countries, these risks are exacerbated by inadequate infrastructure, limited enforcement, and socioeconomic conditions that shape mobility patterns [
2]. In Ecuador, pedestrians account for roughly 18% of all traffic fatalities, a proportion that highlights persistent deficiencies in urban safety systems [
3]. The problem is especially acute in dense urban areas, where frequent conflicts between vehicular traffic and pedestrian movements—exacerbated by limited traffic control infrastructure, inadequate pedestrian facilities, and mixed traffic flows including buses, motorcycles, and informal transport—amplify exposure to crash risk [
4]. Understanding how pedestrians decide when and where to cross is therefore essential for designing effective safety interventions that account for both objective infrastructure attributes and subjective behavioral factors.
The growing integration of intelligent transportation systems (ITS) offers new opportunities to understand and manage pedestrian behavior in urban environments. Advances in sensors, artificial intelligence, and data analytics enable real-time monitoring of pedestrian movements, detection of unsafe behaviors, and adaptive traffic management responsive to pedestrian demand [
4]. Machine learning approaches, including large language models applied to urban mobility recognition, further expand the ability to analyze pedestrian travel patterns and mode choices, complementing traditional behavioral models [
5]. These developments are especially relevant in developing countries, where rapid urbanization and limited resources intensify the need for efficient, data-driven pedestrian safety interventions. Integrating behavioral insights from stated preference experiments with ITS capabilities can support targeted measures, such as adaptive signal timing or real-time safety messaging based on observed crossing behavior. Understanding the psychological and contextual factors shaping pedestrian decisions, as examined in this study, is therefore essential for designing ITS applications that align with actual user behavior.
Pedestrian crossing behavior is a multidimensional phenomenon influenced by environmental, psychological, socioeconomic, and trip-related factors. Environmental attributes such as road width, traffic flow, crosswalk design, signage, weather, and characteristics of the built environment strongly shape decision-making [
6,
7,
8,
9,
10,
11]. Psychological and social factors, including habits, perceived behavioral control, risk tolerance, and group dynamics, add further complexity [
8,
9,
11,
12,
13,
14]. Demographic and socioeconomic variables such as age, gender, income, and education also influence compliance and walking speeds, reflecting how structural inequalities and mobility cultures affect safety outcomes [
15,
16,
17]. Trip characteristics, such as traveling with minors or walking under time pressure, can shift preferences toward more convenient but riskier options [
18,
19]. These overlapping determinants underscore the need for integrative approaches to pedestrian safety research that capture both observable attributes and latent psychological constructs.
Pedestrian crossing behavior is also strongly conditioned by the type of crossing facility provided, which has been examined across a range of infrastructure contexts. Signalized crossings equipped with countdown timers have been shown to influence perceived waiting time and compliance behavior, with timer design and feedback frequency affecting pedestrians’ temporal judgments [
20]. Grade-separated facilities such as footbridges offer high levels of physical protection but are often underutilized, as pedestrians weigh additional walking distance, effort, and perceived security against safety benefits [
21]. At-grade facilities, including zebra crossings, present complex interaction dynamics in mixed traffic environments, particularly where bicycles and pedestrians coexist [
22]. Similarly, pedestrian crossings at roundabouts pose distinct challenges related to gap acceptance, driver yielding behavior, and pedestrian risk perception [
23]. Together, these studies highlight that compliance and safety outcomes depend not only on the presence of crossing infrastructure, but also on how different facility types are perceived, experienced, and integrated into everyday mobility patterns.
The design and availability of crossing facilities also play a crucial role in shaping pedestrian choices. Signalized crosswalks and marked crossings generally increase compliance and reduce crash risk, though long waiting times may lead to violations [
24,
25]. Grade-separated facilities offer physical protection but are often avoided due to longer walking distances, accessibility concerns, or perceived insecurity [
26,
27,
28]. Poorly designed or poorly maintained infrastructure can even encourage unsafe crossings, diminishing the intended safety benefits [
29,
30]. Thus, effective interventions must balance safety with convenience and user behavior, recognizing that pedestrians perform implicit cost–benefit calculations when selecting crossing alternatives.
Despite extensive research documenting how physical infrastructure, sociodemographic factors, and psychological variables influence pedestrian behavior, the role of visual context—situational cues embedded in survey instruments themselves—remains largely unexplored. While studies have examined how real-world environmental features affect crossing intentions [
7], empirical evidence on whether visual stimuli in stated preference surveys systematically alter choice patterns is limited. For example, research using photo-based scenarios typically treats imagery as neutral illustration rather than as experimental variables that might activate normative expectations or frame risk perceptions. This represents a methodological gap with practical implications: if survey imagery functions as behavioral prime, stated preference results may be sensitive to seemingly minor presentation choices, affecting both parameter estimates and policy recommendations derived from such studies.
Methodological advances, particularly discrete choice models based on random utility theory, have greatly improved the quantitative analysis of pedestrian decisions [
31,
32,
33]. However, traditional multinomial logit models often fail to capture subjective motivations such as safety perceptions, personal security concerns, or attitudes toward different facility types. The Integrated Choice and Latent Variable (ICLV) framework overcomes these limitations by incorporating psychological constructs directly into utility functions, offering a more behaviorally realistic representation of pedestrian choices [
34,
35,
36]. While full ICLV specifications remain computationally demanding and data-intensive, exploratory analysis of perception indicators can provide valuable contextual insights.
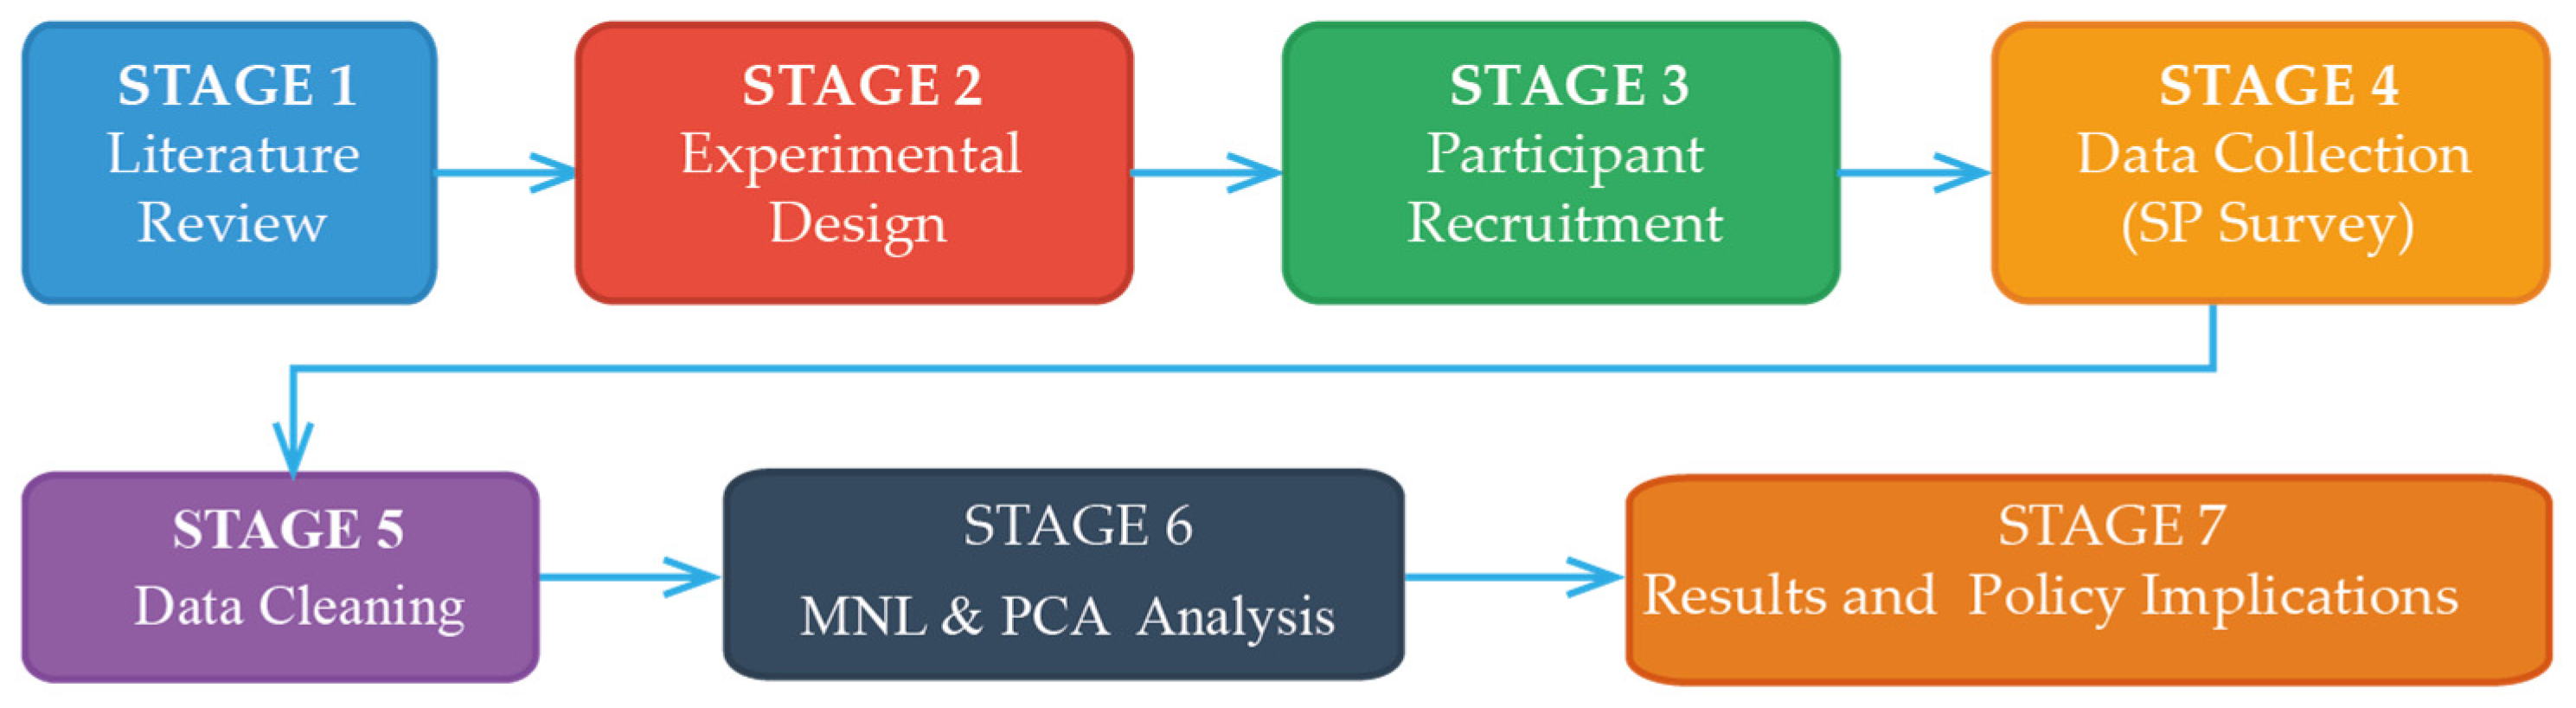
This study addresses these gaps by investigating how visual context influences pedestrian crossing preferences in Ecuadorian urban environments through a controlled stated preference experiment with randomly assigned imagery conditions and multiple hypothetical scenarios. Each scenario required choosing among three alternatives: direct mid-block crossing, pedestrian bridge, or signalized crosswalk, with attributes varied systematically to enable discrete choice modeling. Our analytical approach uses multinomial logit models as the primary estimation method with Principal Component Analysis to identify latent perception constructs related to safety, security, and convenience. For cities with adequate sample sizes, we also estimated exploratory ICLV models (presented in
Appendix A) to demonstrate the technical feasibility of formally integrating psychological constructs into utility functions.
The hypothesized influence of visual context on pedestrian decisions draws on three complementary theories from behavioral psychology and decision science. Social norm activation theory suggests that environmental cues can activate descriptive or injunctive norms, shaping perceptions of appropriate crossing behavior [
10,
37]. Framing effects indicate that visual presentation can establish reference points that influence how alternatives are evaluated [
37]. Dual-process theory further implies that visual stimuli may trigger intuitive System 1 judgments that influence the more deliberative trade-offs captured in stated preference tasks [
37]. Our experimental design tests whether these mechanisms manifest empirically through systematic changes in choice distributions, parameter estimates, and response consistency. While the dominant mechanism cannot be isolated, the observed shifts in baseline preferences, attribute sensitivities, and response consistency are consistent with visual context operating through these established psychological pathways.
By examining how visual context correlates with both stated choices and the behavioral parameters governing those choices, this research provides new evidence on the sensitivity of stated preference methods to visual framing effects. The findings offer practical insights for pedestrian facility design and urban planning in developing countries, where infrastructure constraints and behavioral adaptations interact strongly. The study also contributes methodologically by demonstrating how visual context can be embedded within stated preference experiments as a treatment variable and by illustrating the value of latent perception constructs for interpreting behavioral responses, even when full hybrid choice estimation proves infeasible. While we observe systematic differences between visual treatments, we acknowledge that multiple cognitive pathways may contribute to these effects, and caution is warranted in attributing them to specific psychological mechanisms without additional experimental controls.
The remainder of this paper is organized as follows:
Section 3 describes the materials and methods, including the experimental design and data collection.
Section 4 presents the results of the multinomial logit models and latent variable analysis.
Section 5 discusses the findings and policy implications, and
Section 5 concludes with final remarks and future research directions.
3. Results
3.1. Sample Characteristics
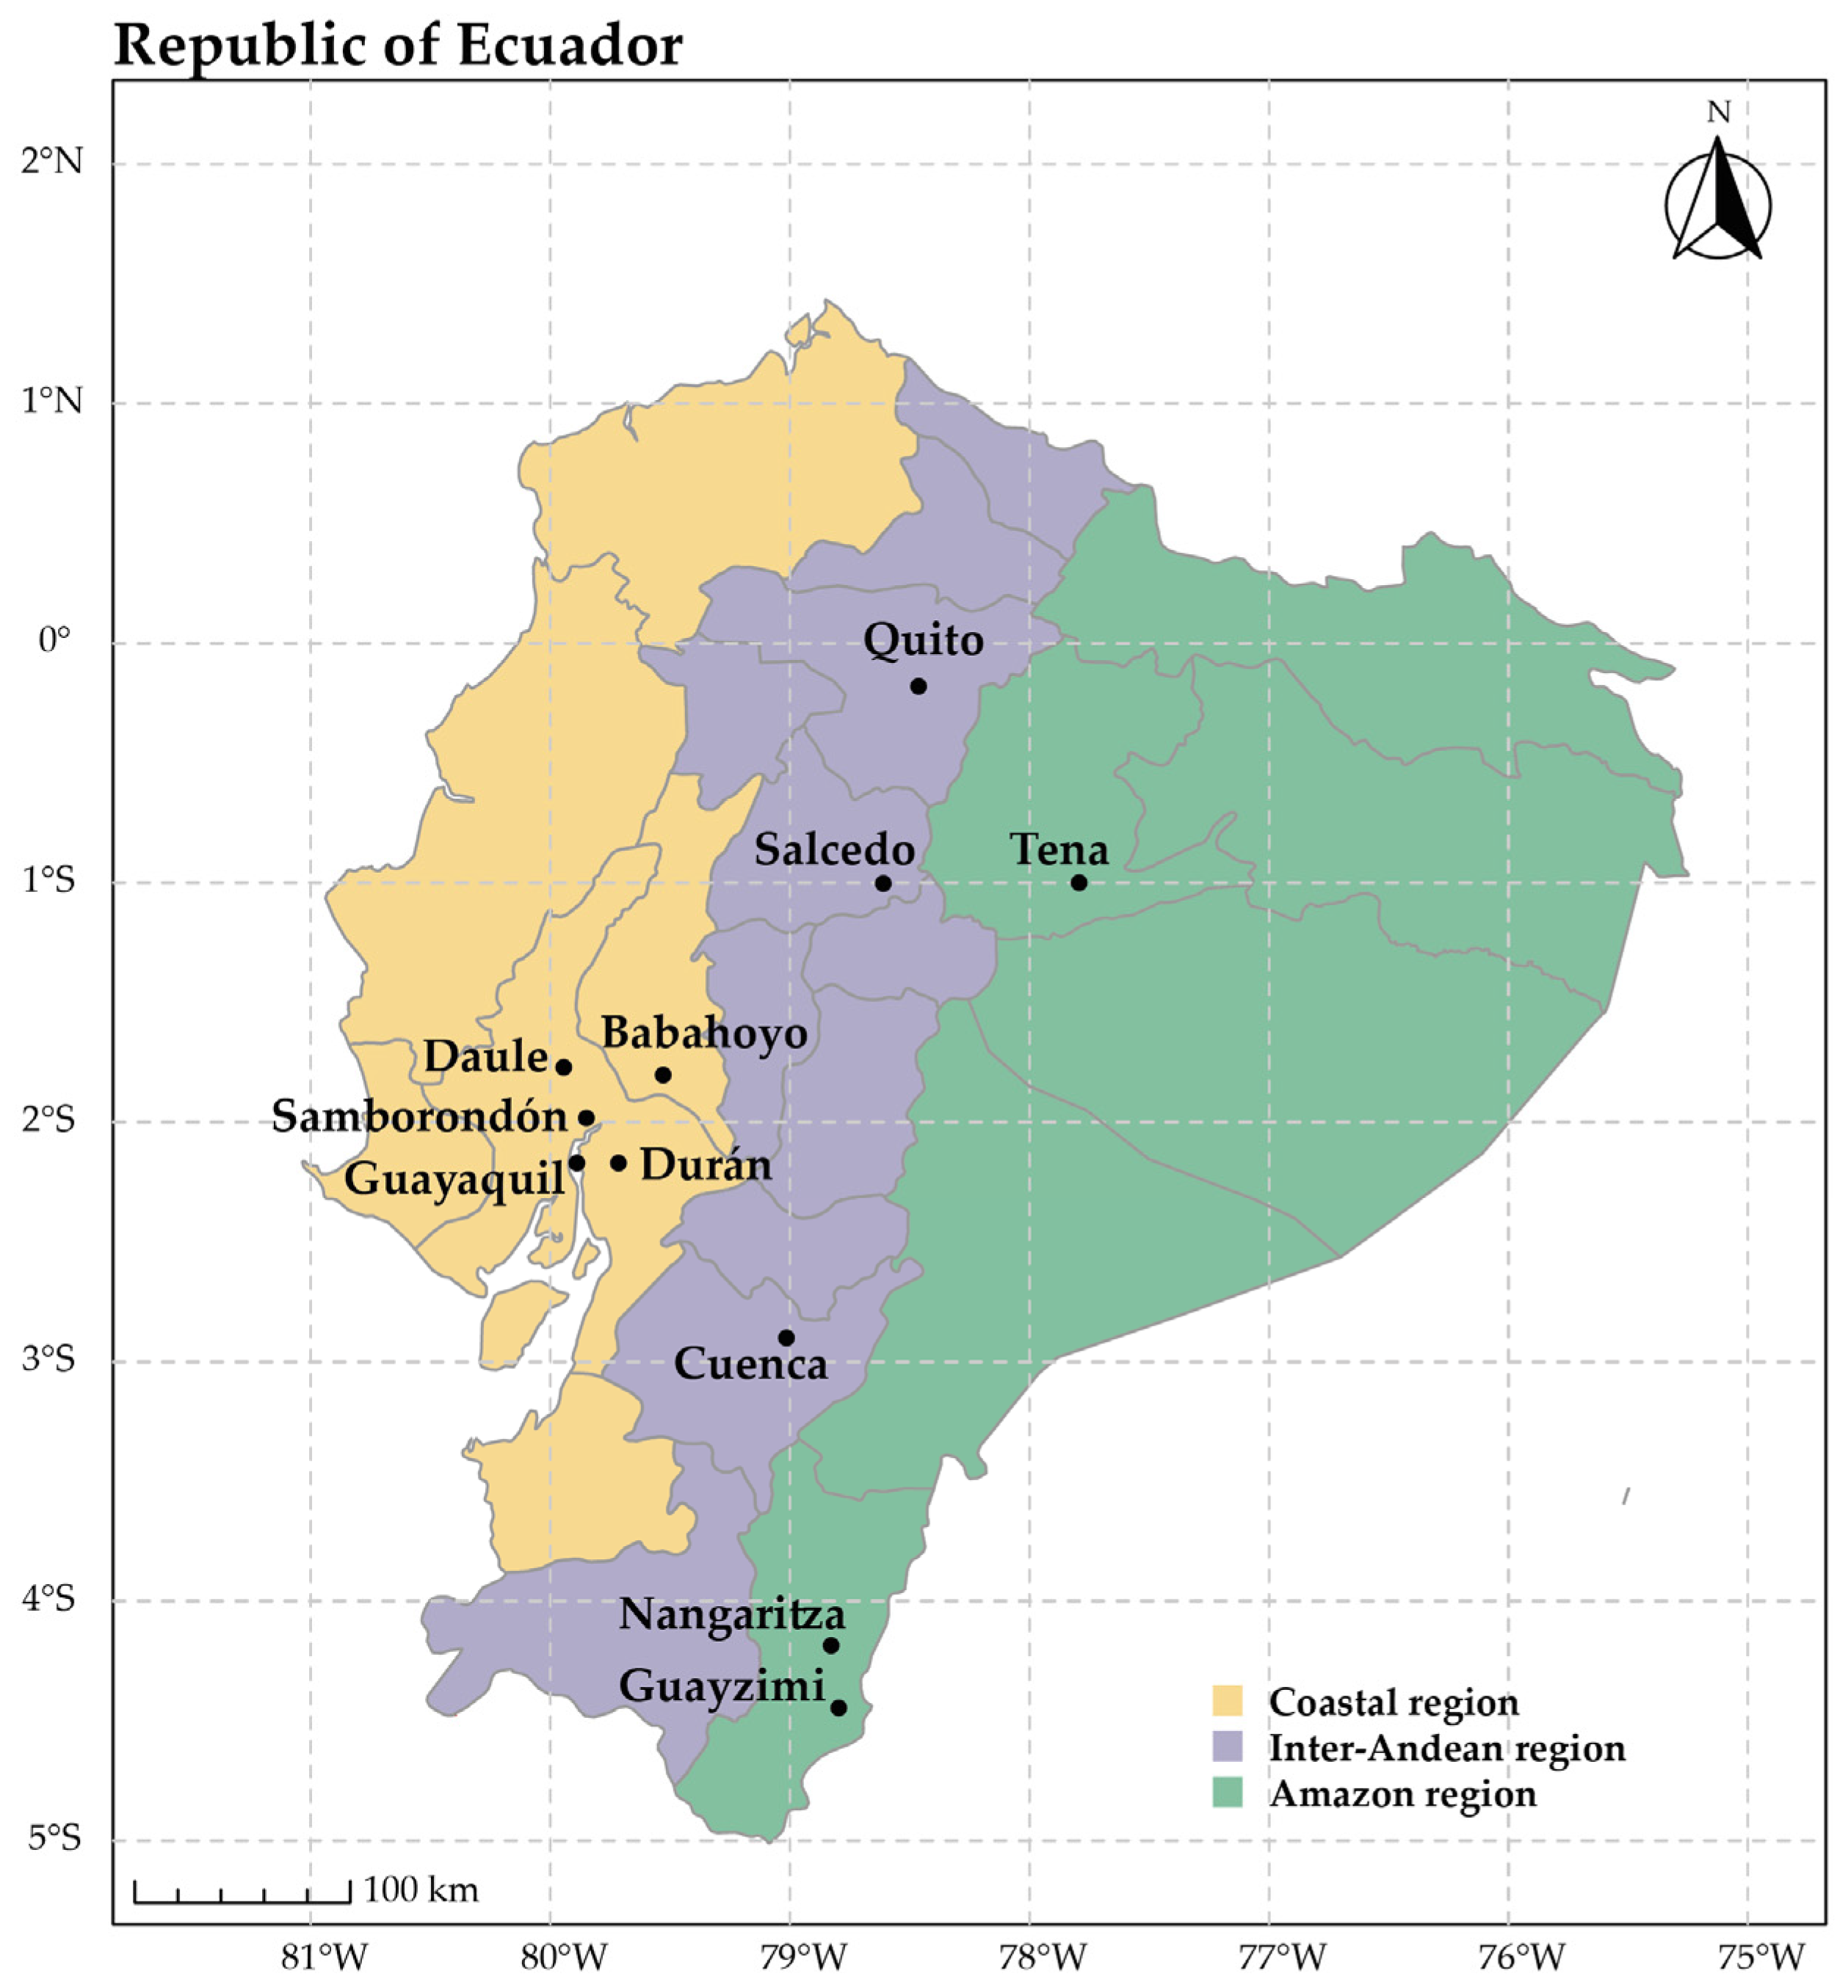
Table 2 summarizes the sociodemographic and mobility characteristics of respondents in the two experimental conditions. The sample includes participants from the major Ecuadorian urban centers of Quito and Guayaquil; from medium-density cities such as Babahoyo and Cuenca; and from lower-density urban contexts including Daule, Durán, Guayzimi, Nangaritza, Samborondón, Salcedo, and Tena. This city-level coverage ensures broad geographic and socioeconomic diversity. The distribution of age groups, occupations, and educational attainment is balanced across experiments, with no statistically significant differences between groups (all
p > 0.05). This comparability confirms that the visual treatment was the primary source of systematic variation between experiments.
After data cleaning, which involved removing incomplete or irrational responses, the final sample consisted of 483 respondents in Experiment 1 and 392 in Experiment 2. Relative to the initial samples, attrition was 15.1% in Experiment 1 and 30.6% in Experiment 2, yielding an overall attrition rate of 22.8%. Although attrition was higher in Experiment 2, comparisons of key sociodemographic and mobility variables indicate no statistically significant differences between the retained samples across experimental conditions (all p > 0.05), suggesting no systematic selection bias related to the visual treatments.
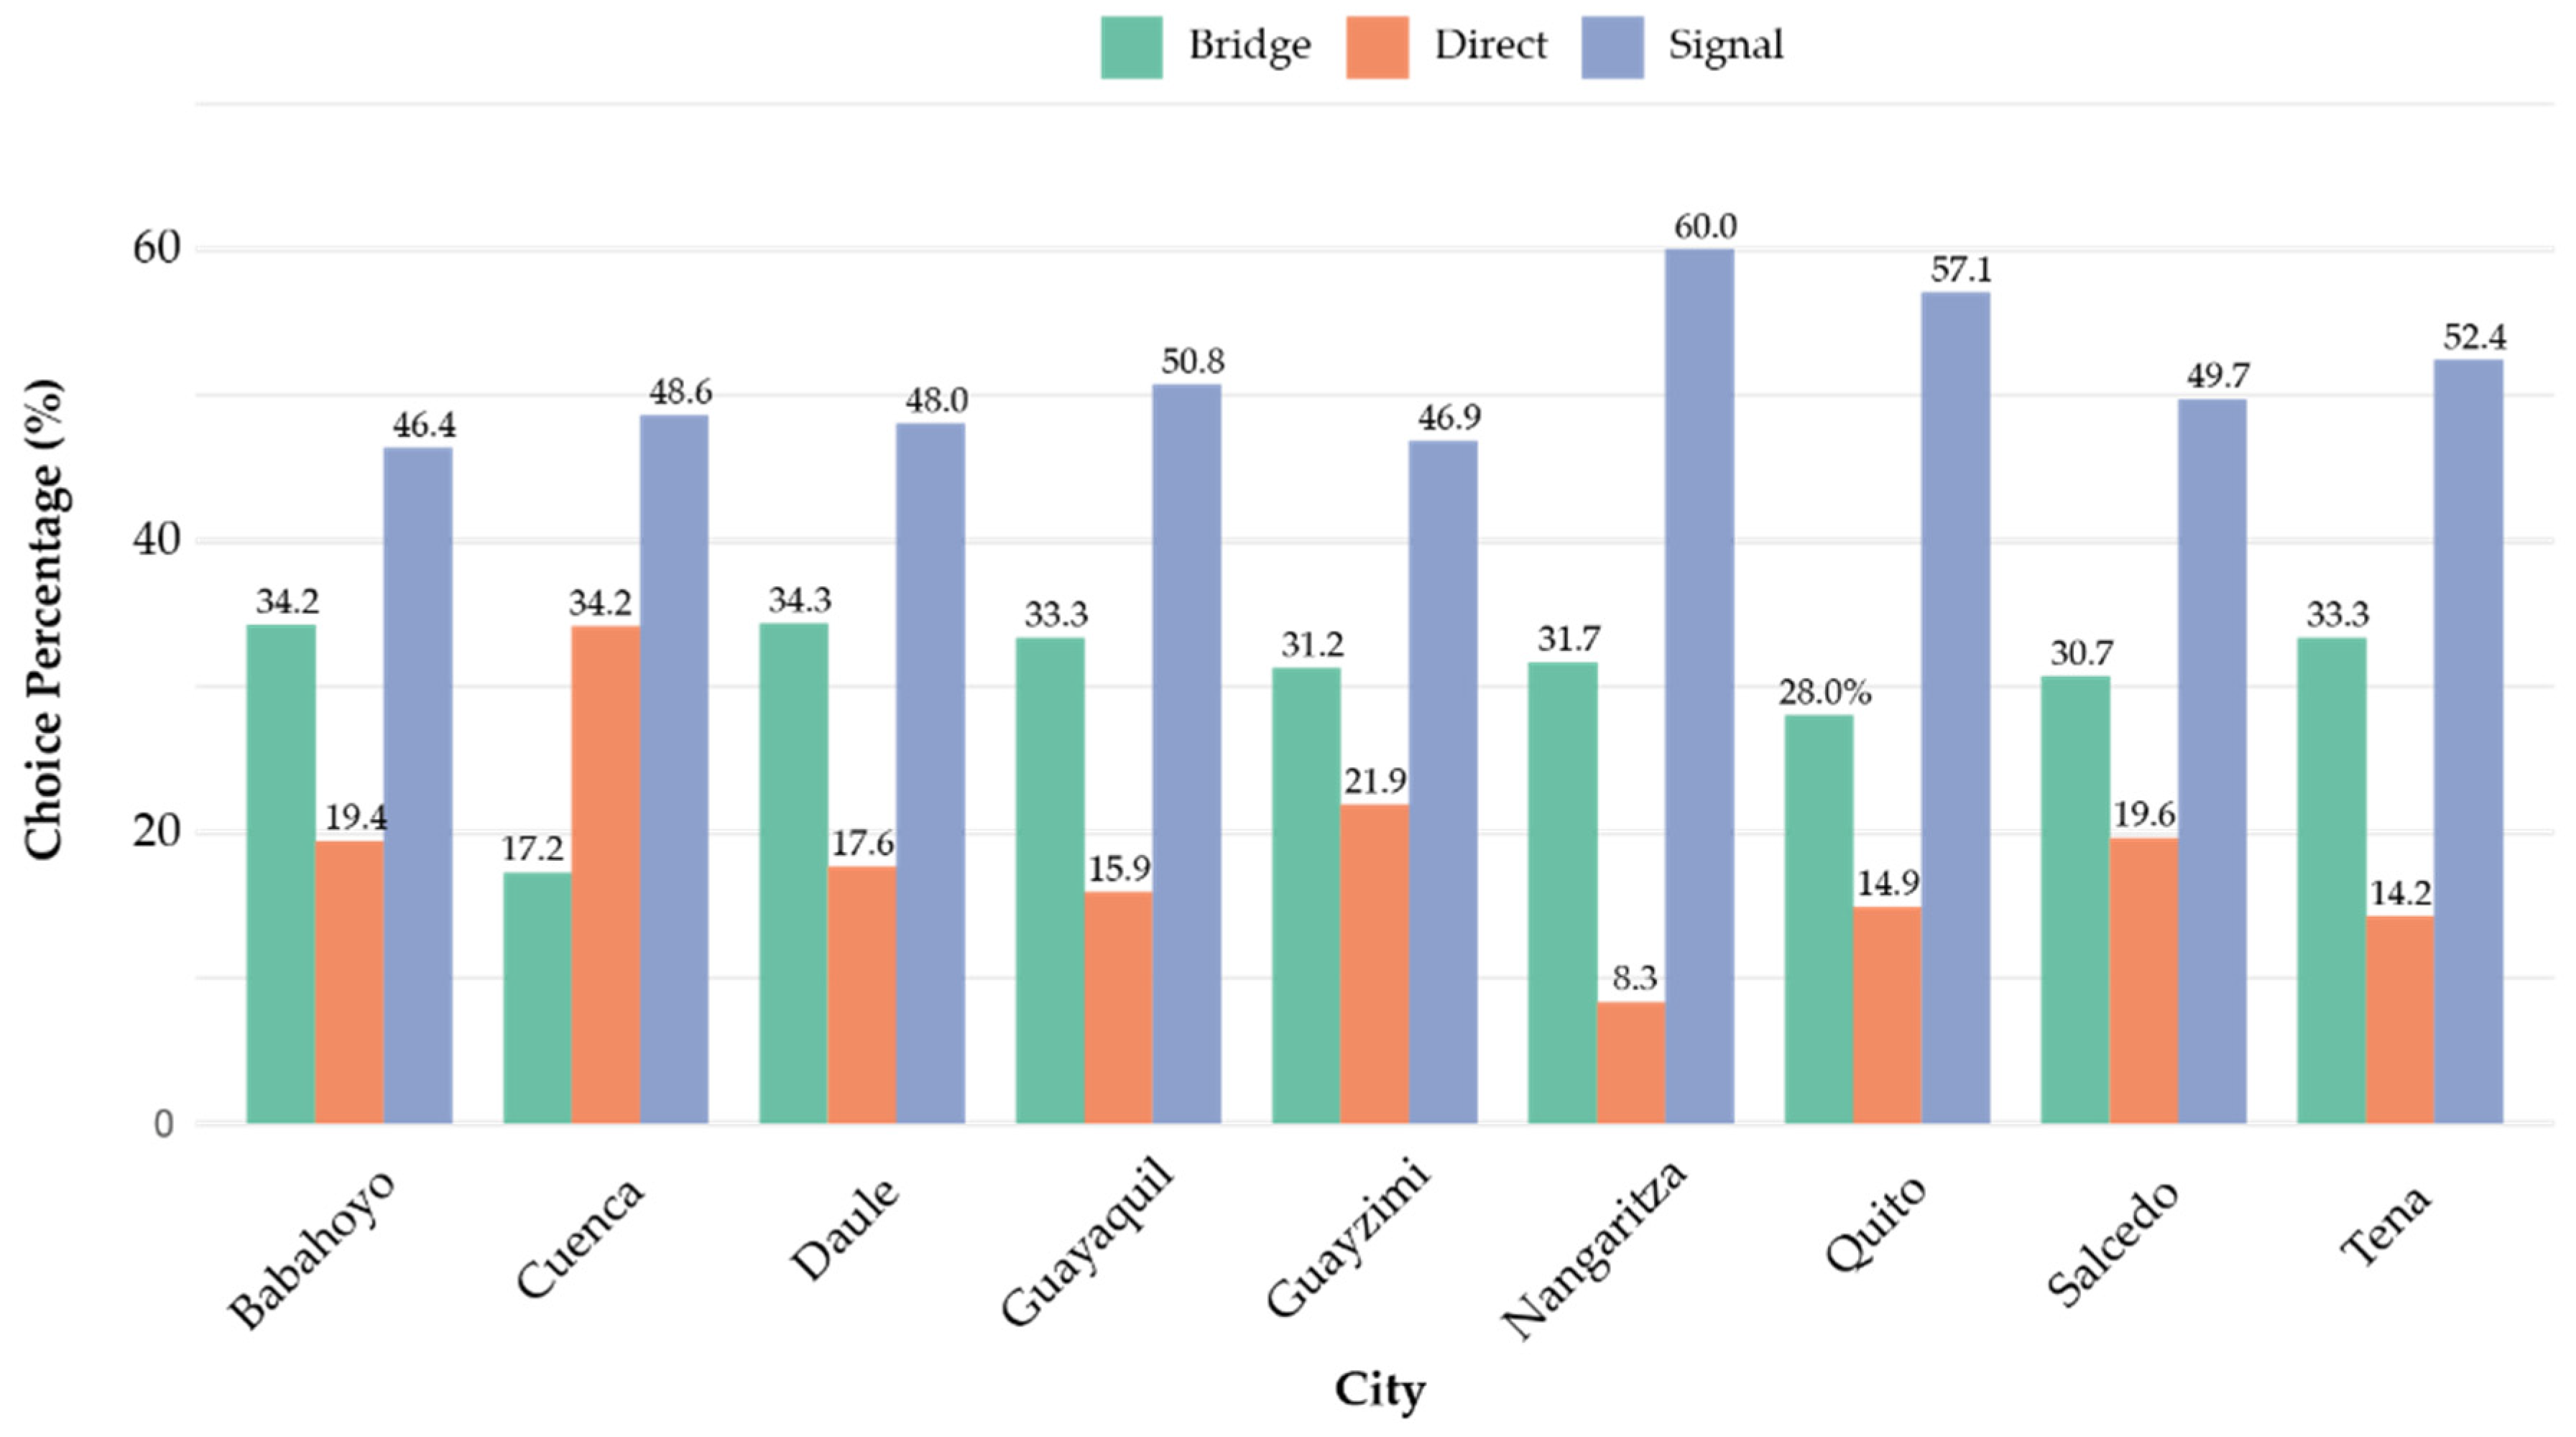
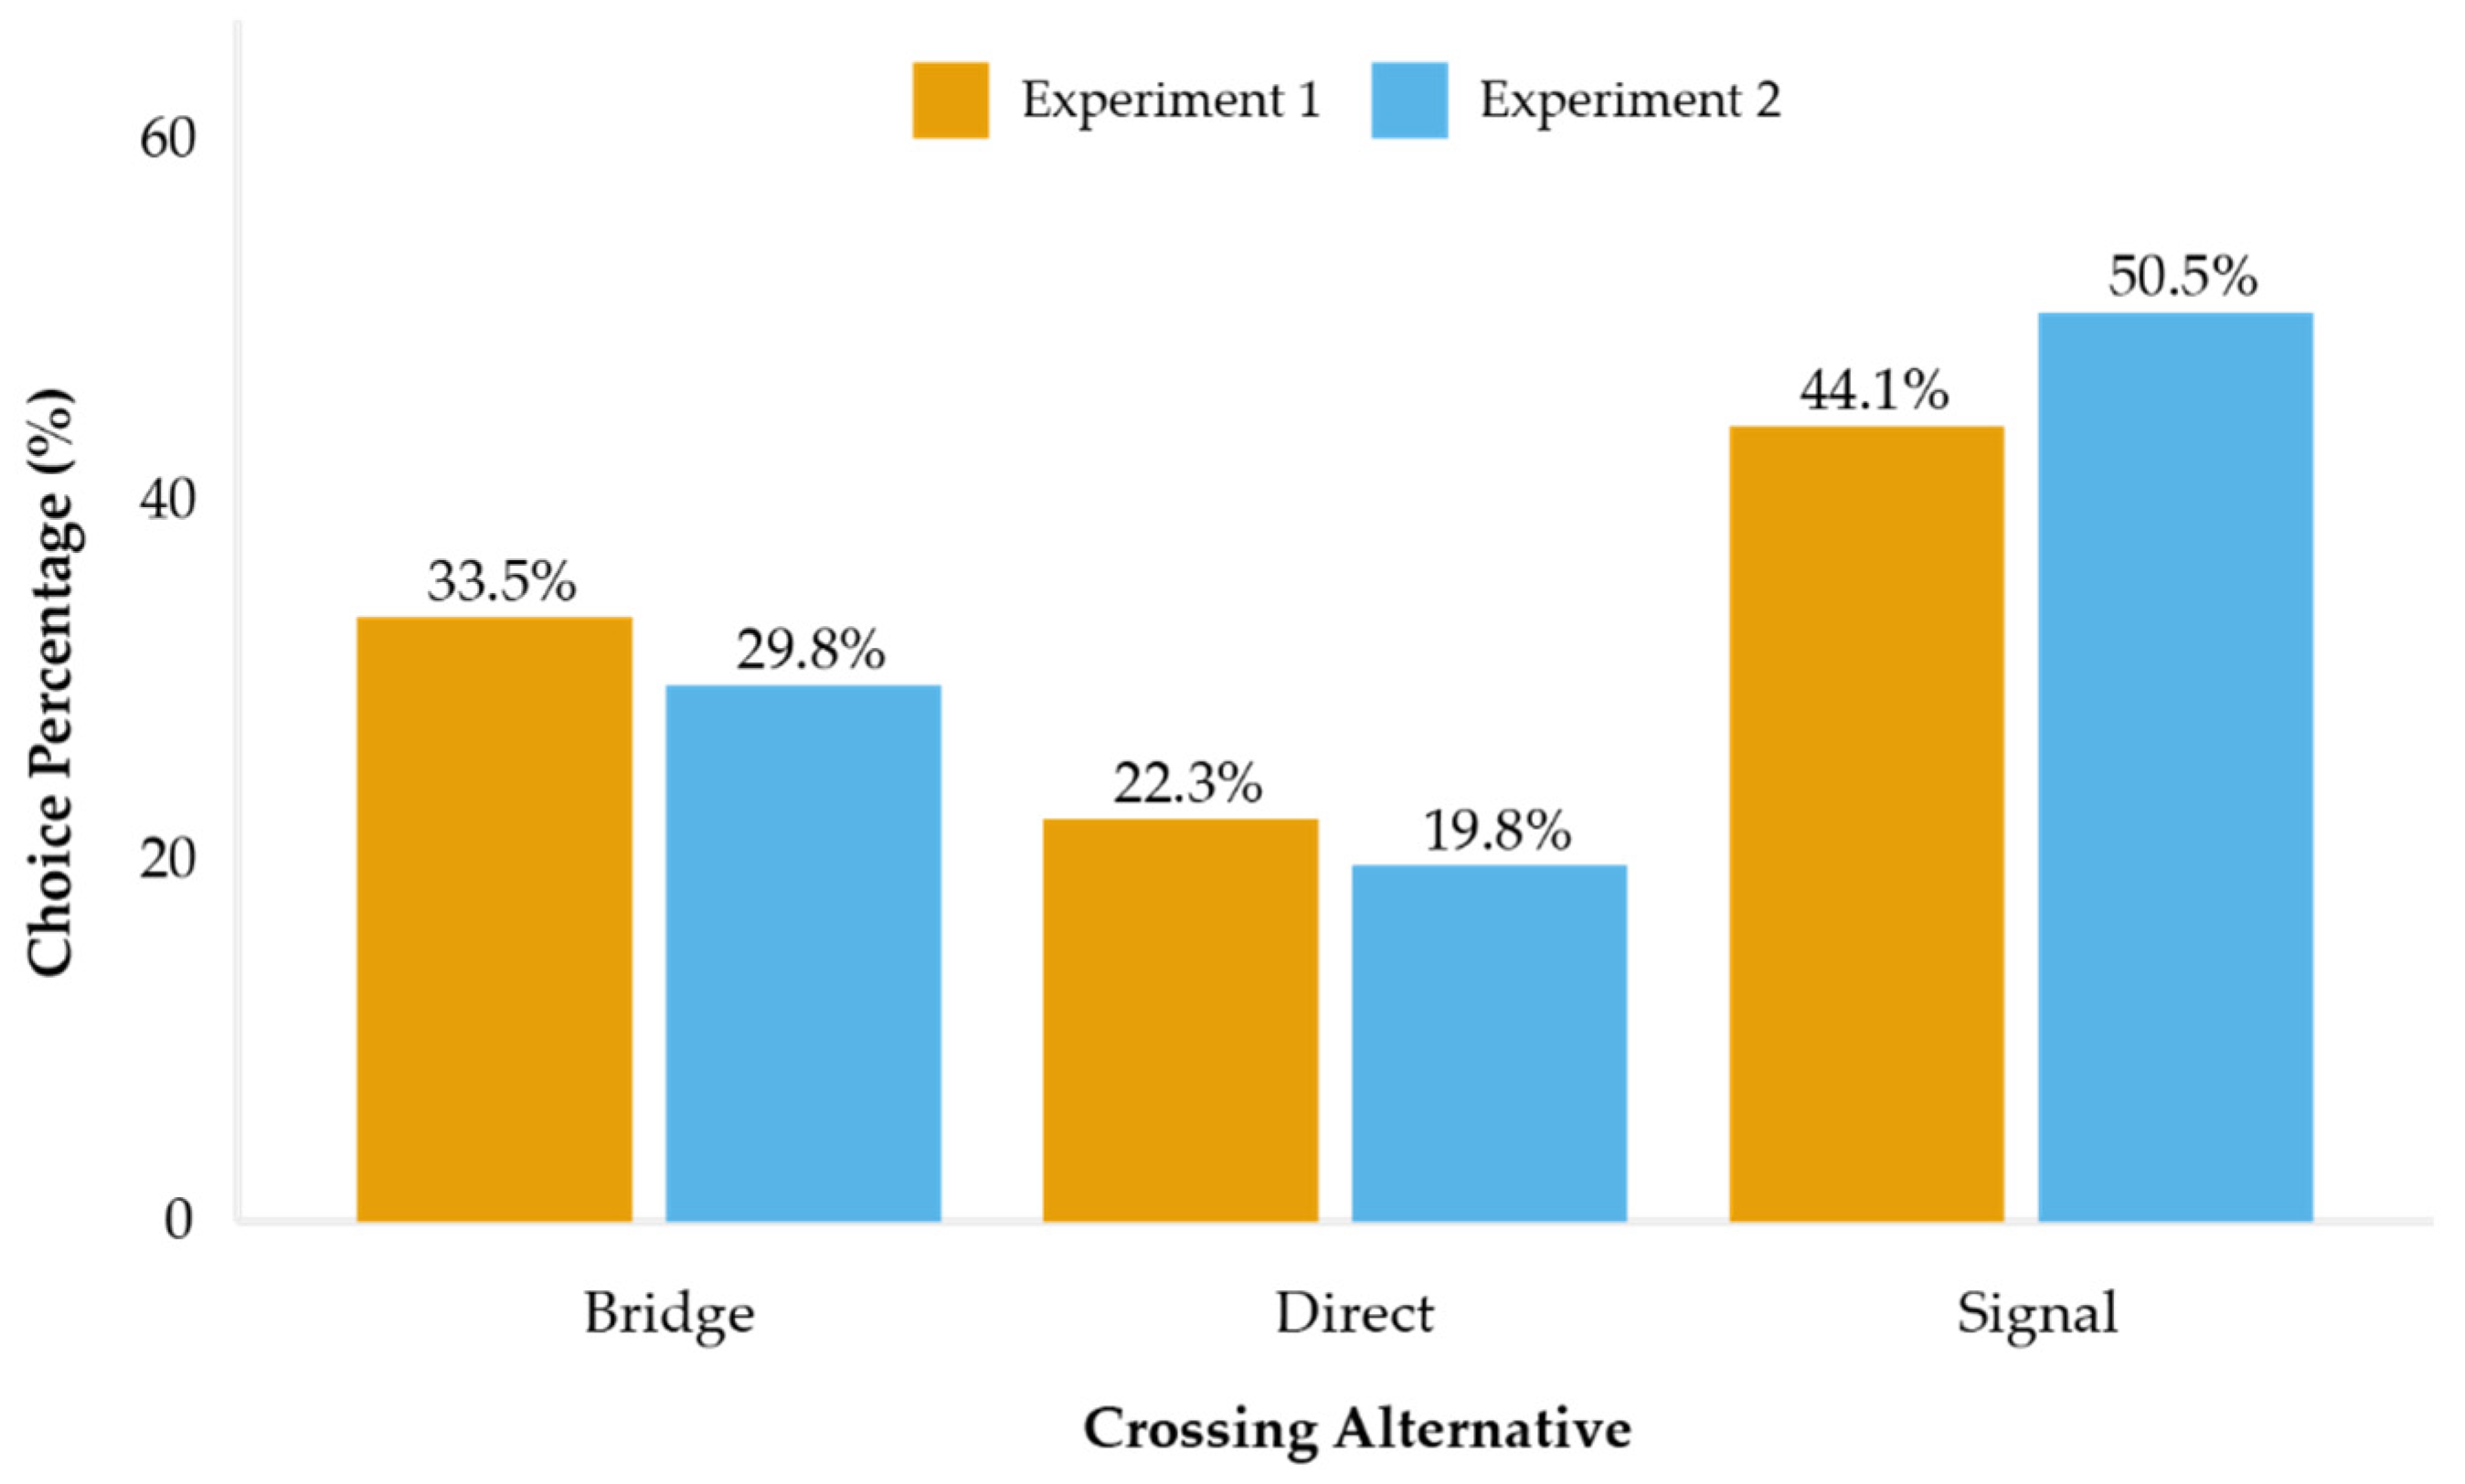
Figure 4 shows the distribution of selected alternatives across the full dataset. All three options—Bridge, Direct Cross, and Signalized Crosswalk—were chosen frequently, with none dominating the choice set. This balanced selection supports good model identification and reduces concerns about response bias.
3.2. Behavioral Model Results
3.2.1. Multinomial Logit Estimates
Table 3 presents the Multinomial Logit (MNL) estimates for the two experimental groups. Several attributes demonstrated significant behavioral influence.
Waiting time (Delay) showed directionally inconsistent effects that require careful interpretation. In Experiment 1, both DelayDirect (β = 0.044, p < 0.01) and DelaySignal (β = 0.058, p < 0.001) are positive and significant, which counterintuitively suggests that respondents preferred alternatives with longer waiting times. In Experiment 2, DelayDirect became negative (β = −0.040, n.s.) while DelaySignal remained positive (β = 0.067, p < 0.001). These unexpected signs, particularly the consistently positive DelaySignal coefficient, suggest potential model misspecification or that respondents may have interpreted delay scenarios in unexpected ways—for example, associating longer signalized delays with safer, more controlled crossing environments. The Wald test confirms these coefficients differ significantly between experiments (p = 0.014), indicating that visual context influenced delay sensitivity, though the behavioral interpretation remains ambiguous given the unexpected coefficient signs.
Alternative-specific constants (ASCs) indicate that, controlling for attributes, respondents systematically favored the signalized crosswalk in both experiments (Experiment 1: β = 0.673, p < 0.01; Experiment 2: β = 0.934, p < 0.001), suggesting strong baseline preference for formal protected infrastructure.
Traveling with a minor significantly decreased the probability of selecting direct mid-block crossing in both experiments (Experiment 1: β = −0.278, p < 0.01; Experiment 2: β = −0.627, p < 0.001), with the effect nearly doubling in magnitude under compliant visual priming. This provides strong evidence for situational risk aversion when accompanied by children.
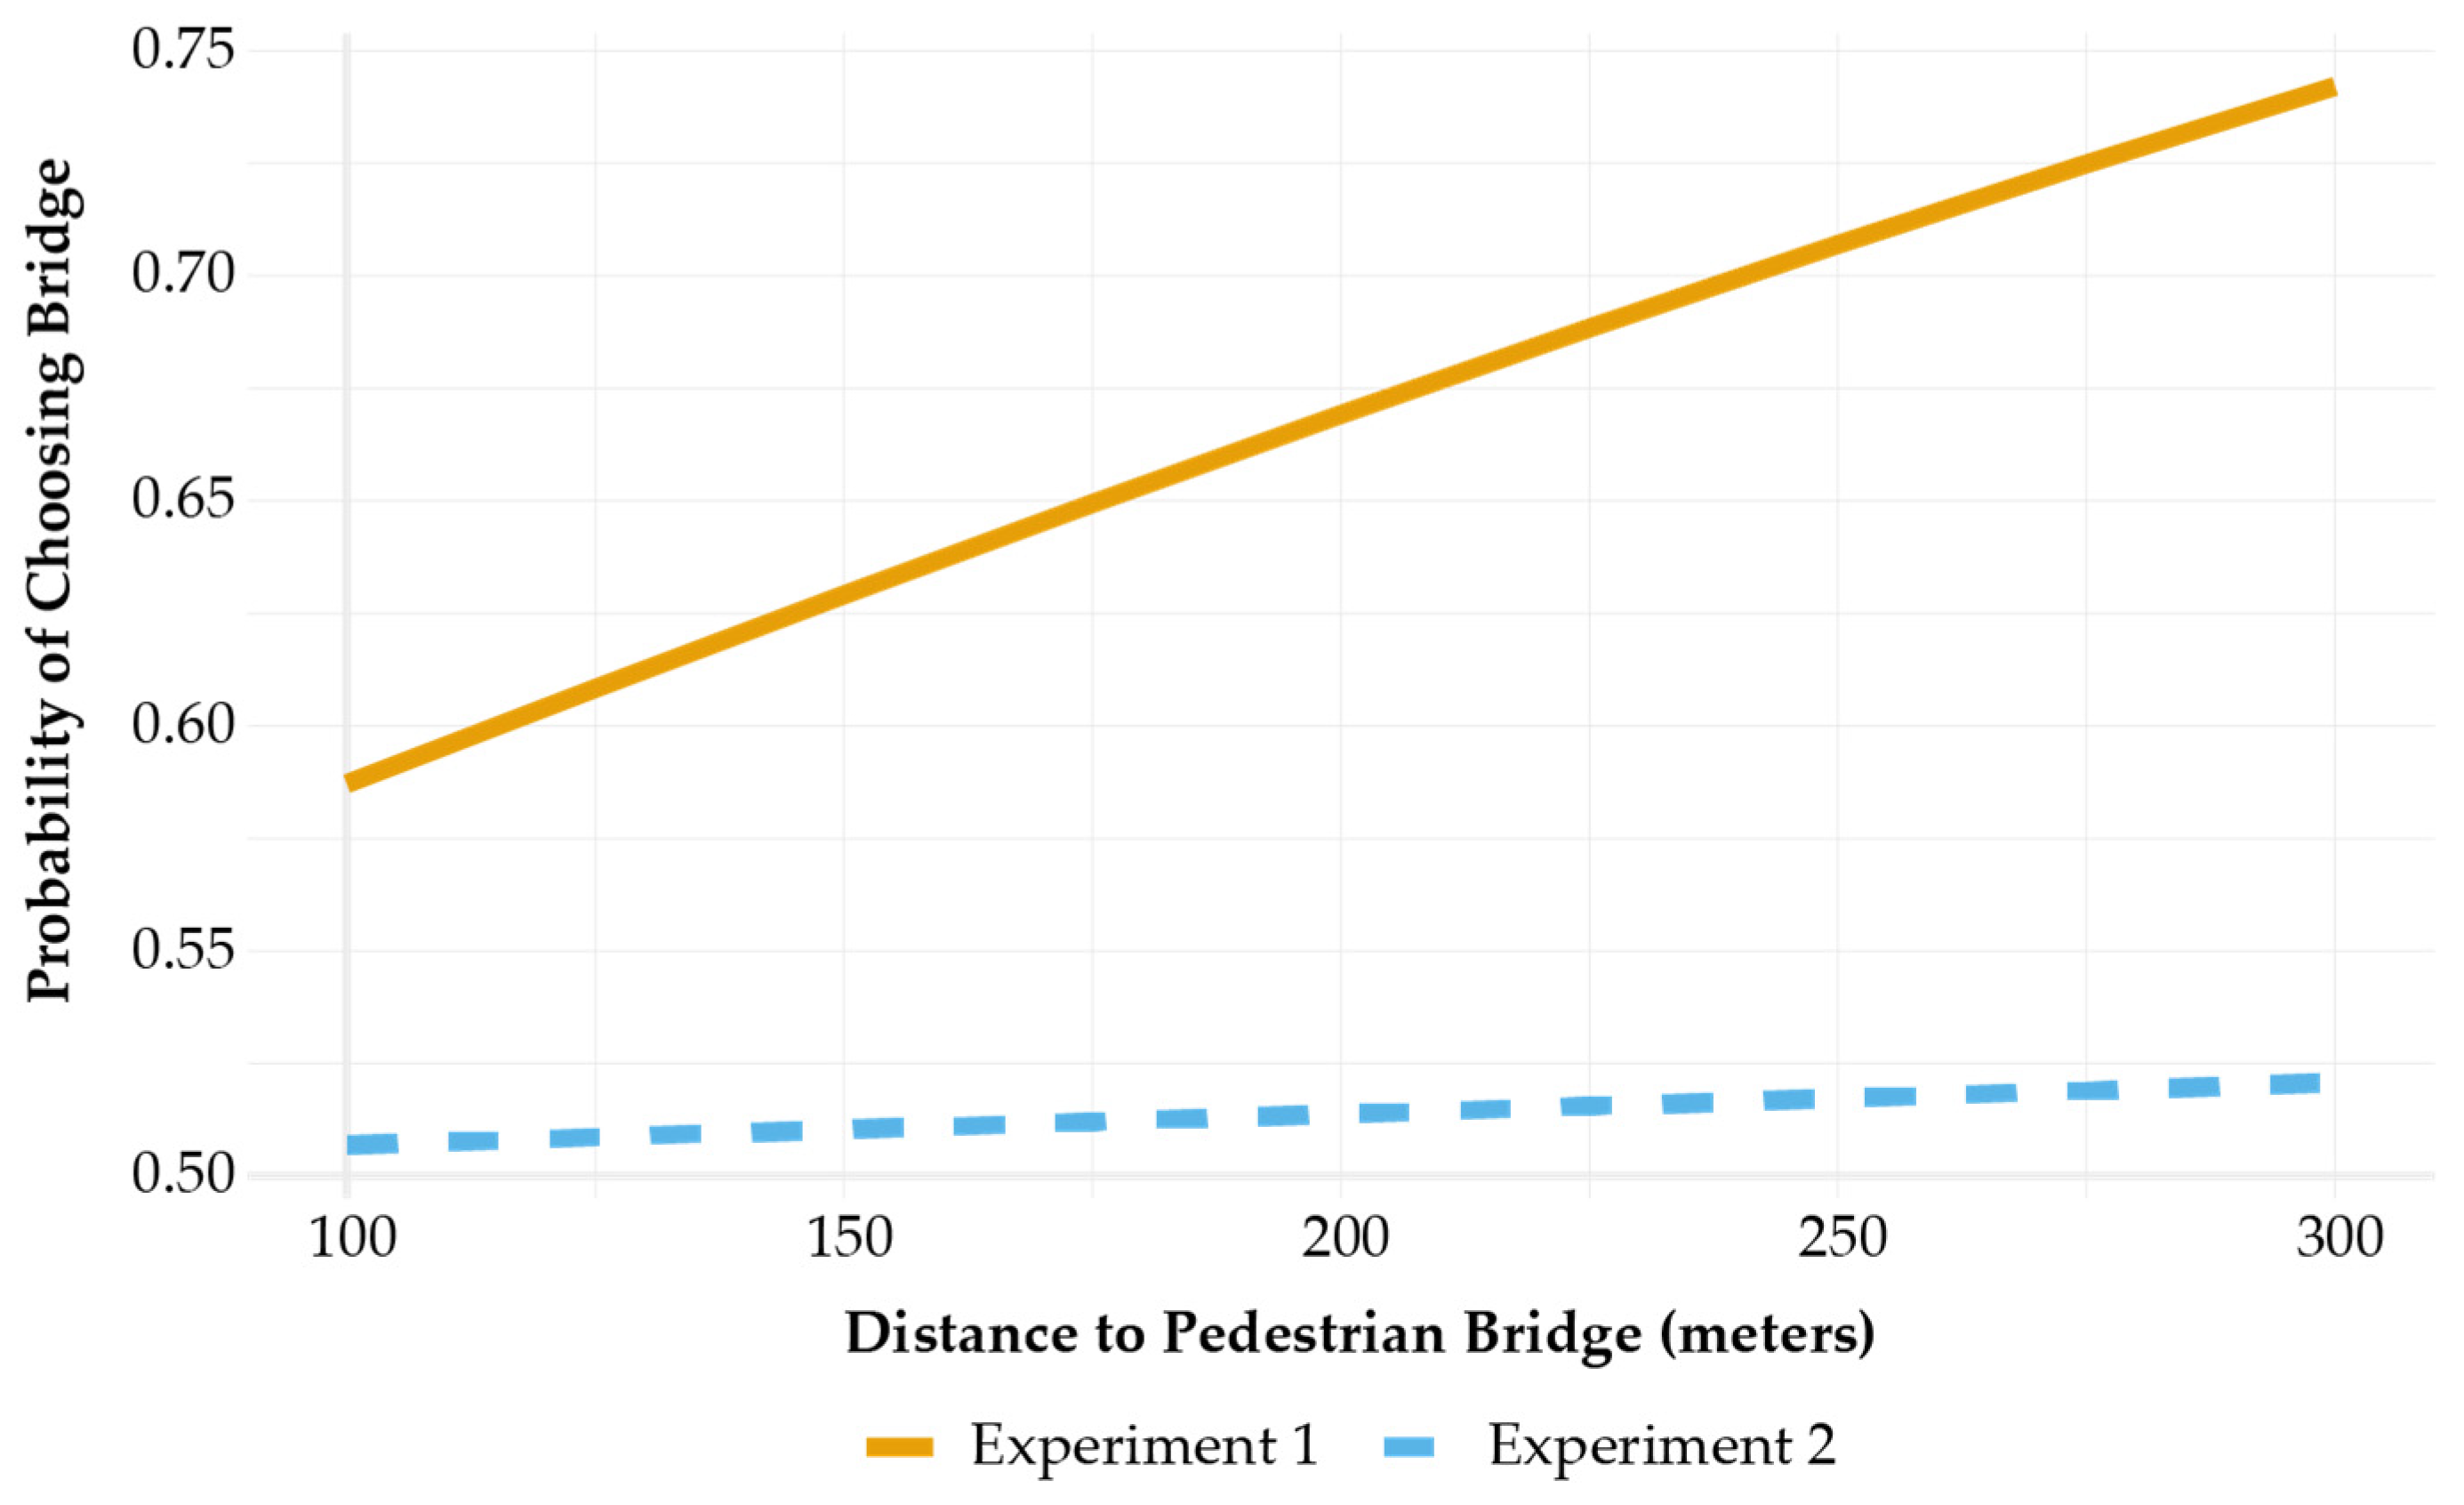
Walking distance effects were modest and often non-significant. The Bridge distance coefficient was near zero and non-significant in both experiments. The Signal distance coefficient was negative in Experiment 2 (β = −0.005, p < 0.10), suggesting that longer distances to signalized crosswalks slightly reduced their selection probability, though the effect size is very small (0.5% reduction in utility per 100 m).
Experiment 2, which included a compliant visual cue (formal crossing), produced stronger and more consistent parameter magnitudes, resulting in higher log-likelihood and lower AIC values. This indicates that the visual context improved behavioral explanation.
The McFadden R2 values for both models are modest (0.005 and 0.013), which requires careful interpretation. McFadden himself noted that values between 0.2 and 0.4 represent excellent fit in discrete choice models—substantially lower than linear regression standards. Our values, while below this range, are not unusual for exploratory models in developing country contexts where behavioral heterogeneity is high and infrastructure familiarity varies substantially across respondents.
The alternative-level hit rates reveal an important pattern: the models achieve high accuracy for signalized crosswalks (84.4% in Exp1, 100% in Exp2) but near-zero accuracy for direct crossing and bridge alternatives. This indicates that the models successfully predict the dominant choice but struggle with alternatives selected by smaller proportions of respondents. This pattern is common in unbalanced choice data and suggests that model improvements should focus on capturing preference heterogeneity rather than indicating fundamental specification failure.
Critically, the improvement from Experiment 1 to Experiment 2 (ΔR2 = 0.008, Δ accuracy = 6.7 percentage points) demonstrates that visual treatment correlates with more consistent behavioral responses. The increased log-likelihood and reduced AIC in Experiment 2 indicate genuine improvement in model fit, not merely random variation. The modest fit statistics suggest caution in generalizing parameter estimates and reinforce the need for preference heterogeneity models (mixed logit, latent class) in future research with larger samples.
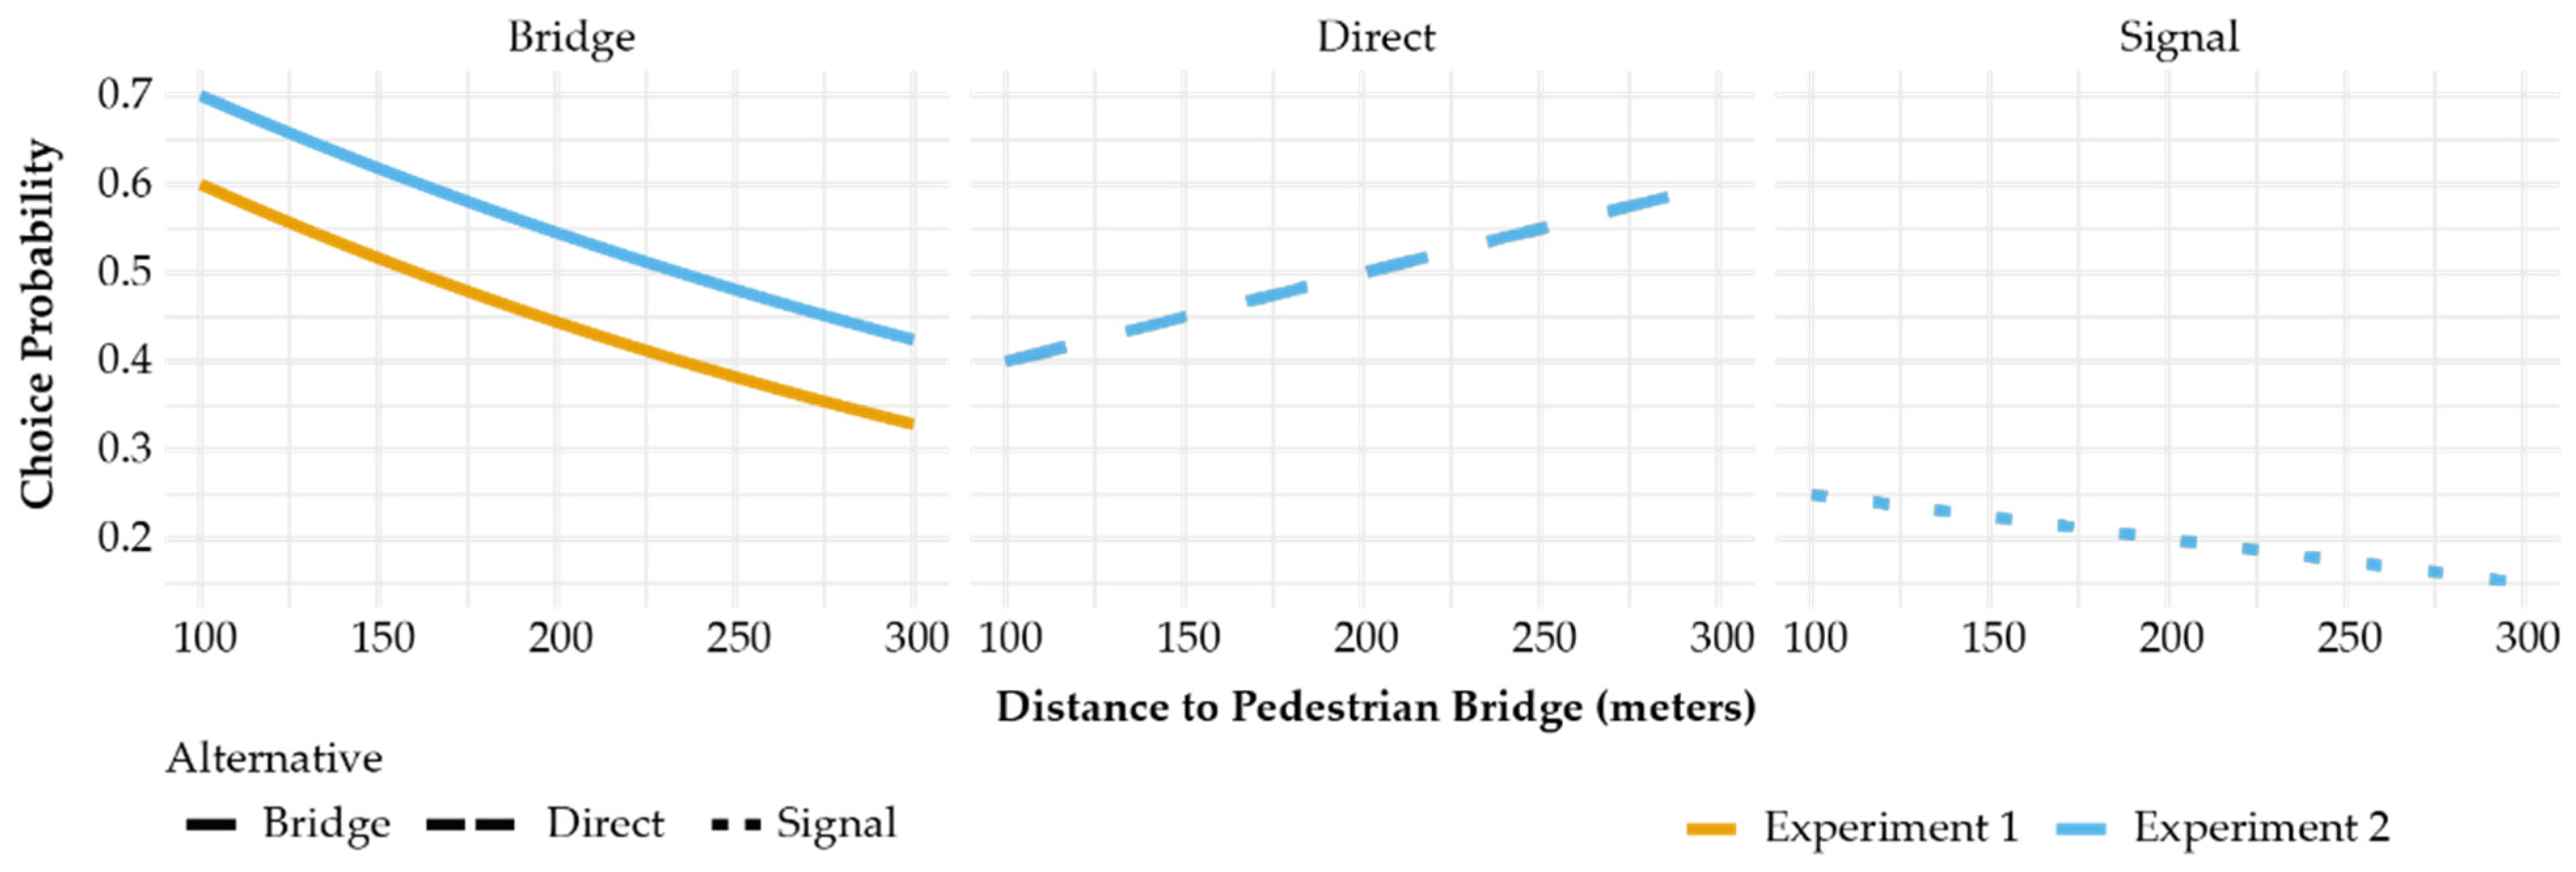
Elasticities represent the percentage change in choice probability resulting from a 1% change in each attribute, holding other attributes constant. Values shown separately for Experiment 1 (non-compliant image) and Experiment 2 (compliant image). Negative elasticities for Bridge and Signal distances indicate that longer walking distances reduce the probability of selecting these alternatives. Elasticities displayed in
Figure 5 confirm high sensitivity to perceived risk and waiting time. Improvements in perceived safety showed the largest proportional effects on choice probabilities, highlighting the central role of safety perceptions in pedestrian decision-making.
3.2.2. Factor Loadings and Measurement Model Diagnostics
Table 4 reports the rotated factor loadings from the perception indicators. Across both experiments, two latent dimensions emerged consistently:
Table 4.
Rotated Factor Loadings for Perception Indicators (Varimax Rotation).
Table 4.
Rotated Factor Loadings for Perception Indicators (Varimax Rotation).
| Indicator | Exp1_F1 | Exp1_F2 | Exp2_F1 | Exp2_F2 |
|---|
| Direct Crossing—Road Safety | 0.581 | 0.05 | 0.517 | −0.055 |
| Direct Crossing—Personal Safety | 0.465 | 0.115 | 0.457 | 0.208 |
| Direct Crossing—Comfort | 0.617 | −0.002 | 0.628 | −0.033 |
| Direct Crossing—Convenience | 0.577 | −0.031 | 0.561 | −0.150 |
| Direct Crossing—Ease of Access | 0.552 | −0.022 | 0.529 | −0.107 |
| Pedestrian Bridge—Road Safety | 0.035 | 0.739 | 0.036 | 0.735 |
| Pedestrian Bridge—Personal Safety | −0.017 | 0.704 | 0.109 | 0.733 |
| Pedestrian Bridge—Comfort | 0.001 | 0.813 | 0.016 | 0.831 |
| Pedestrian Bridge—Convenience | 0.106 | 0.766 | 0.017 | 0.801 |
| Pedestrian Bridge—Ease of Access | 0.147 | 0.628 | 0.023 | 0.647 |
| Signalized Crosswalk—Road Safety | 0.622 | 0.064 | 0.618 | 0.05 |
| Signalized Crosswalk—Personal Safety | 0.523 | 0.177 | 0.542 | 0.295 |
| Signalized Crosswalk—Comfort | 0.621 | 0.034 | 0.692 | 0.195 |
| Signalized Crosswalk—Convenience | 0.669 | 0.051 | 0.712 | 0.095 |
| Signalized Crosswalk—Ease of Access | 0.697 | 0.006 | 0.709 | 0.152 |
Indicators loaded strongly on their corresponding latent constructs, supporting good convergent validity and internal consistency.
Factor naming was based on conceptual interpretation of loading patterns: Factor 1 loads strongly on safety, security, comfort, and convenience indicators for Direct and Signalized alternatives, suggesting a unified “safety/security” dimension for street-level protected crossing. Factor 2 loads exclusively on Bridge indicators, particularly comfort and convenience, suggesting “bridge-specific convenience” concerns related to vertical effort and accessibility.
Structural model goodness-of-fit statistics (
Table 5) summarize the performance of the estimated MNL models.
3.2.3. Latent Perception Constructs and Behavioral Interpretation
The Principal Component Analysis provides descriptive insights into the psychological dimensions underlying respondents’ perceptions of crossing alternatives, though these constructs are not formally integrated into the choice models. The two identified factors explain 42.2% (Experiment 1) and 44.8% (Experiment 2) of the variance in perception indicators:
Factor 1 (Safety/Security Dimension): This dimension loads strongly on indicators related to direct crossing and signalized crosswalk alternatives, capturing perceived traffic safety, personal security from crime, comfort, convenience, and ease of access. The consistency of loadings across both alternatives (0.52–0.70) suggests respondents formed a unified perception of “formal infrastructure safety” that applied to street-level protected alternatives.
Factor 2 (Bridge-Specific Dimension): This dimension is dominated by perceptions specific to the pedestrian bridge alternative, with particularly high loadings on comfort (0.81–0.83) and convenience (0.77–0.80). The distinct factor structure indicates that bridge usage involves unique perceptual considerations beyond general safety, likely reflecting concerns about vertical displacement, physical effort, and accessibility.
These latent dimensions provide useful context for interpreting the MNL results, though we emphasize they do not directly explain choices within our modeling framework. The strong negative effect of delay on bridge selection observed in
Table 3 may partly reflect respondents’ integrated assessment of temporal costs, vertical effort, and accessibility concerns—dimensions partially captured by Factor 2. Similarly, the significant effect of traveling with a minor on avoiding direct crossing aligns with situations where safety and security considerations (Factor 1) become more salient.
The emergence of these perception dimensions also helps contextualize the visual treatment effect. The compliant imagery in Experiment 2 may have increased respondents’ attention to formal infrastructure safety attributes (Factor 1), though this remains a descriptive interpretation rather than a mechanistically tested relationship. The stronger parameter magnitudes in Experiment 2 could reflect this heightened salience, though alternative explanations—such as reduced measurement error or greater response consistency—cannot be ruled out.
We emphasize three critical limitations of this analysis. First, the PCA constructs are derived from post-choice attitudinal ratings, creating potential endogeneity if ratings were influenced by choices rather than predicting them. Second, these constructs are not integrated into utility functions, meaning we cannot quantify their marginal effects on choice probabilities or test whether they mediate visual treatment effects. Third, the constructs explain less than half of perception variance, indicating substantial unobserved heterogeneity. Future research should employ ICLV specifications that formally integrate these constructs into choice models, use pre-choice perception measures to establish temporal precedence, and test mediation pathways linking visual treatment to perceptions to choices. The exploratory ICLV models in
Appendix A demonstrate the feasibility of such integration, though sample size constraints prevented their use as primary specifications.
To assess internal consistency of the identified perception dimensions, we computed Cronbach’s alpha for indicators loading on each factor:
Factor 1 (Safety/Security): α = 0.78 (Experiment 1), α = 0.81 (Experiment 2).
Factor 2 (Bridge-Specific): α = 0.84 (Experiment 1), α = 0.86 (Experiment 2).
These values exceed the conventional 0.70 threshold for acceptable internal consistency, indicating that indicators loading on each factor reliably measure a coherent underlying dimension. The slightly higher reliability in Experiment 2 is consistent with the overall pattern of improved response consistency under compliant visual priming.
While these reliability coefficients support the measurement quality of our PCA-derived constructs, we emphasize that they represent descriptive internal consistency rather than validated measurement scales. Proper scale validation would require CFA with independent samples, test–retest reliability assessment, and convergent/discriminant validity testing against established measures—procedures beyond the scope of this exploratory study focused primarily on discrete choice modeling.
3.2.4. Wald Test Results for Parameter Restrictions
Wald tests assessing parameter equality across experiments are shown in
Table 6. Most coefficients did not differ significantly between the two visual treatments; however, Delay displayed a statistically significant difference (
p = 0.014), indicating that visual cues influenced respondent sensitivity to waiting time.
Prediction accuracy is one indicator of model adequacy, but it must be interpreted cautiously in the presence of unbalanced choice data.
Table 7 reports both overall accuracy and alternative-specific hit rates for the predicted choices.
Both models achieved prediction accuracies well above random choice (33.3% with three alternatives), with overall hit rates of 43.8% in Experiment 1 and 50.5% in Experiment 2. However, these values require appropriate contextualization. In both datasets, the signalized crosswalk is the dominant alternative, accounting for 43.9% of observed choices in Experiment 1 and 50.6% in Experiment 2. As a result, a modal-choice rule—predicting the most frequently chosen alternative for all observations—would yield accuracies of approximately 44% and 51%, respectively, comparable to the observed model performance.
The alternative-level hit rates in
Table 7 reveal a highly asymmetric prediction pattern. The model correctly predicts a large share of signalized crosswalk choices (84.4% in Experiment 1 and 100% in Experiment 2), while performance for bridge crossings is limited and direct crossings are never predicted. Importantly, these values represent the proportion of actual choices of each alternative that were correctly classified, not their contribution to overall accuracy. The zero hit rate for direct crossing therefore indicates that the model fails to identify this minority alternative even when it is selected by respondents.
Such patterns are typical of multinomial logit models estimated on unbalanced data. Because the likelihood function rewards correct prediction of the most frequent outcome, the model tends to favor the dominant alternative and has limited capacity to recover heterogeneous preferences underlying fewer common choices.
This prediction structure has three main implications. First, the models effectively capture population-level tendencies, particularly the strong preference for protected, signalized crossings, while remaining limited in their ability to represent individual-level heterogeneity. This reflects the homogeneous preference assumption of the aggregate MNL specification; predicting minority choices would require richer models such as mixed logit or latent class formulations.
Second, the improvement in overall accuracy from Experiment 1 to Experiment 2 (a 6.7 percentage point increase) is meaningful despite its modest absolute magnitude. This improvement is consistent with enhanced model fit across multiple diagnostics and suggests that compliant visual priming produced more homogeneous and predictable choice behavior.
Third, the limited predictive performance for minority alternatives does not undermine the validity of the estimated parameters for observed attributes. Rather, it indicates the presence of unobserved individual-specific factors—such as risk tolerance, physical ability, or time pressure—that are not captured by the current specification, while the average effects of modeled attributes remain reliably identified.
Crucially, the primary objective of this study is comparative rather than predictive: to assess whether visual context influences stated preferences. In this respect, the results are consistent across multiple indicators, including higher overall accuracy, improved log-likelihood and McFadden R2 values, systematic parameter changes, and a statistically significant Wald test for delay sensitivity differences (p = 0.014). Together, these results provide robust evidence that visual treatment affects pedestrian decision-making, even though absolute predictive accuracy remains constrained by preference heterogeneity.
3.3. Simulated Choice Probabilities
To illustrate the practical implications of the estimated parameters,
Figure 6 presents simulated choice probabilities under four hypothetical policy scenarios: (1) baseline conditions reflecting sample mean attributes, (2) improved safety perceptions through infrastructure upgrades and visibility enhancements, (3) reduced waiting times via optimized signal timing and strategic facility placement, and (4) combined improvements integrating both safety and temporal enhancements.
The simulations reveal substantial behavioral sensitivity to policy interventions. Under Experiment 1 (non-compliant visual context), moderate safety improvements increase signalized crosswalk selection from 43.8% to approximately 52%, while delay reductions produce a comparable shift to 51%. Combined interventions generate synergistic effects, raising formal infrastructure usage to nearly 60%. Under Experiment 2 (compliant visual context), the baseline preference for protected alternatives is already higher (50.5%), and policy interventions amplify this tendency more strongly. Safety improvements alone increase signalized crosswalk selection to 58%, delay reductions to 59%, and combined strategies to 68%.
These patterns confirm that modest infrastructure optimizations—reducing delays by 3–5 min or enhancing perceived safety through design interventions—can produce meaningful behavioral shifts toward safer crossing choices. Critically, the larger response magnitudes in Experiment 2 indicate that policy effectiveness is moderated by normative context: interventions achieve greater impact when implemented alongside awareness campaigns or enforcement strategies that establish formal crossing as the socially expected behavior.
3.4. Perceptions and Additional Indicators
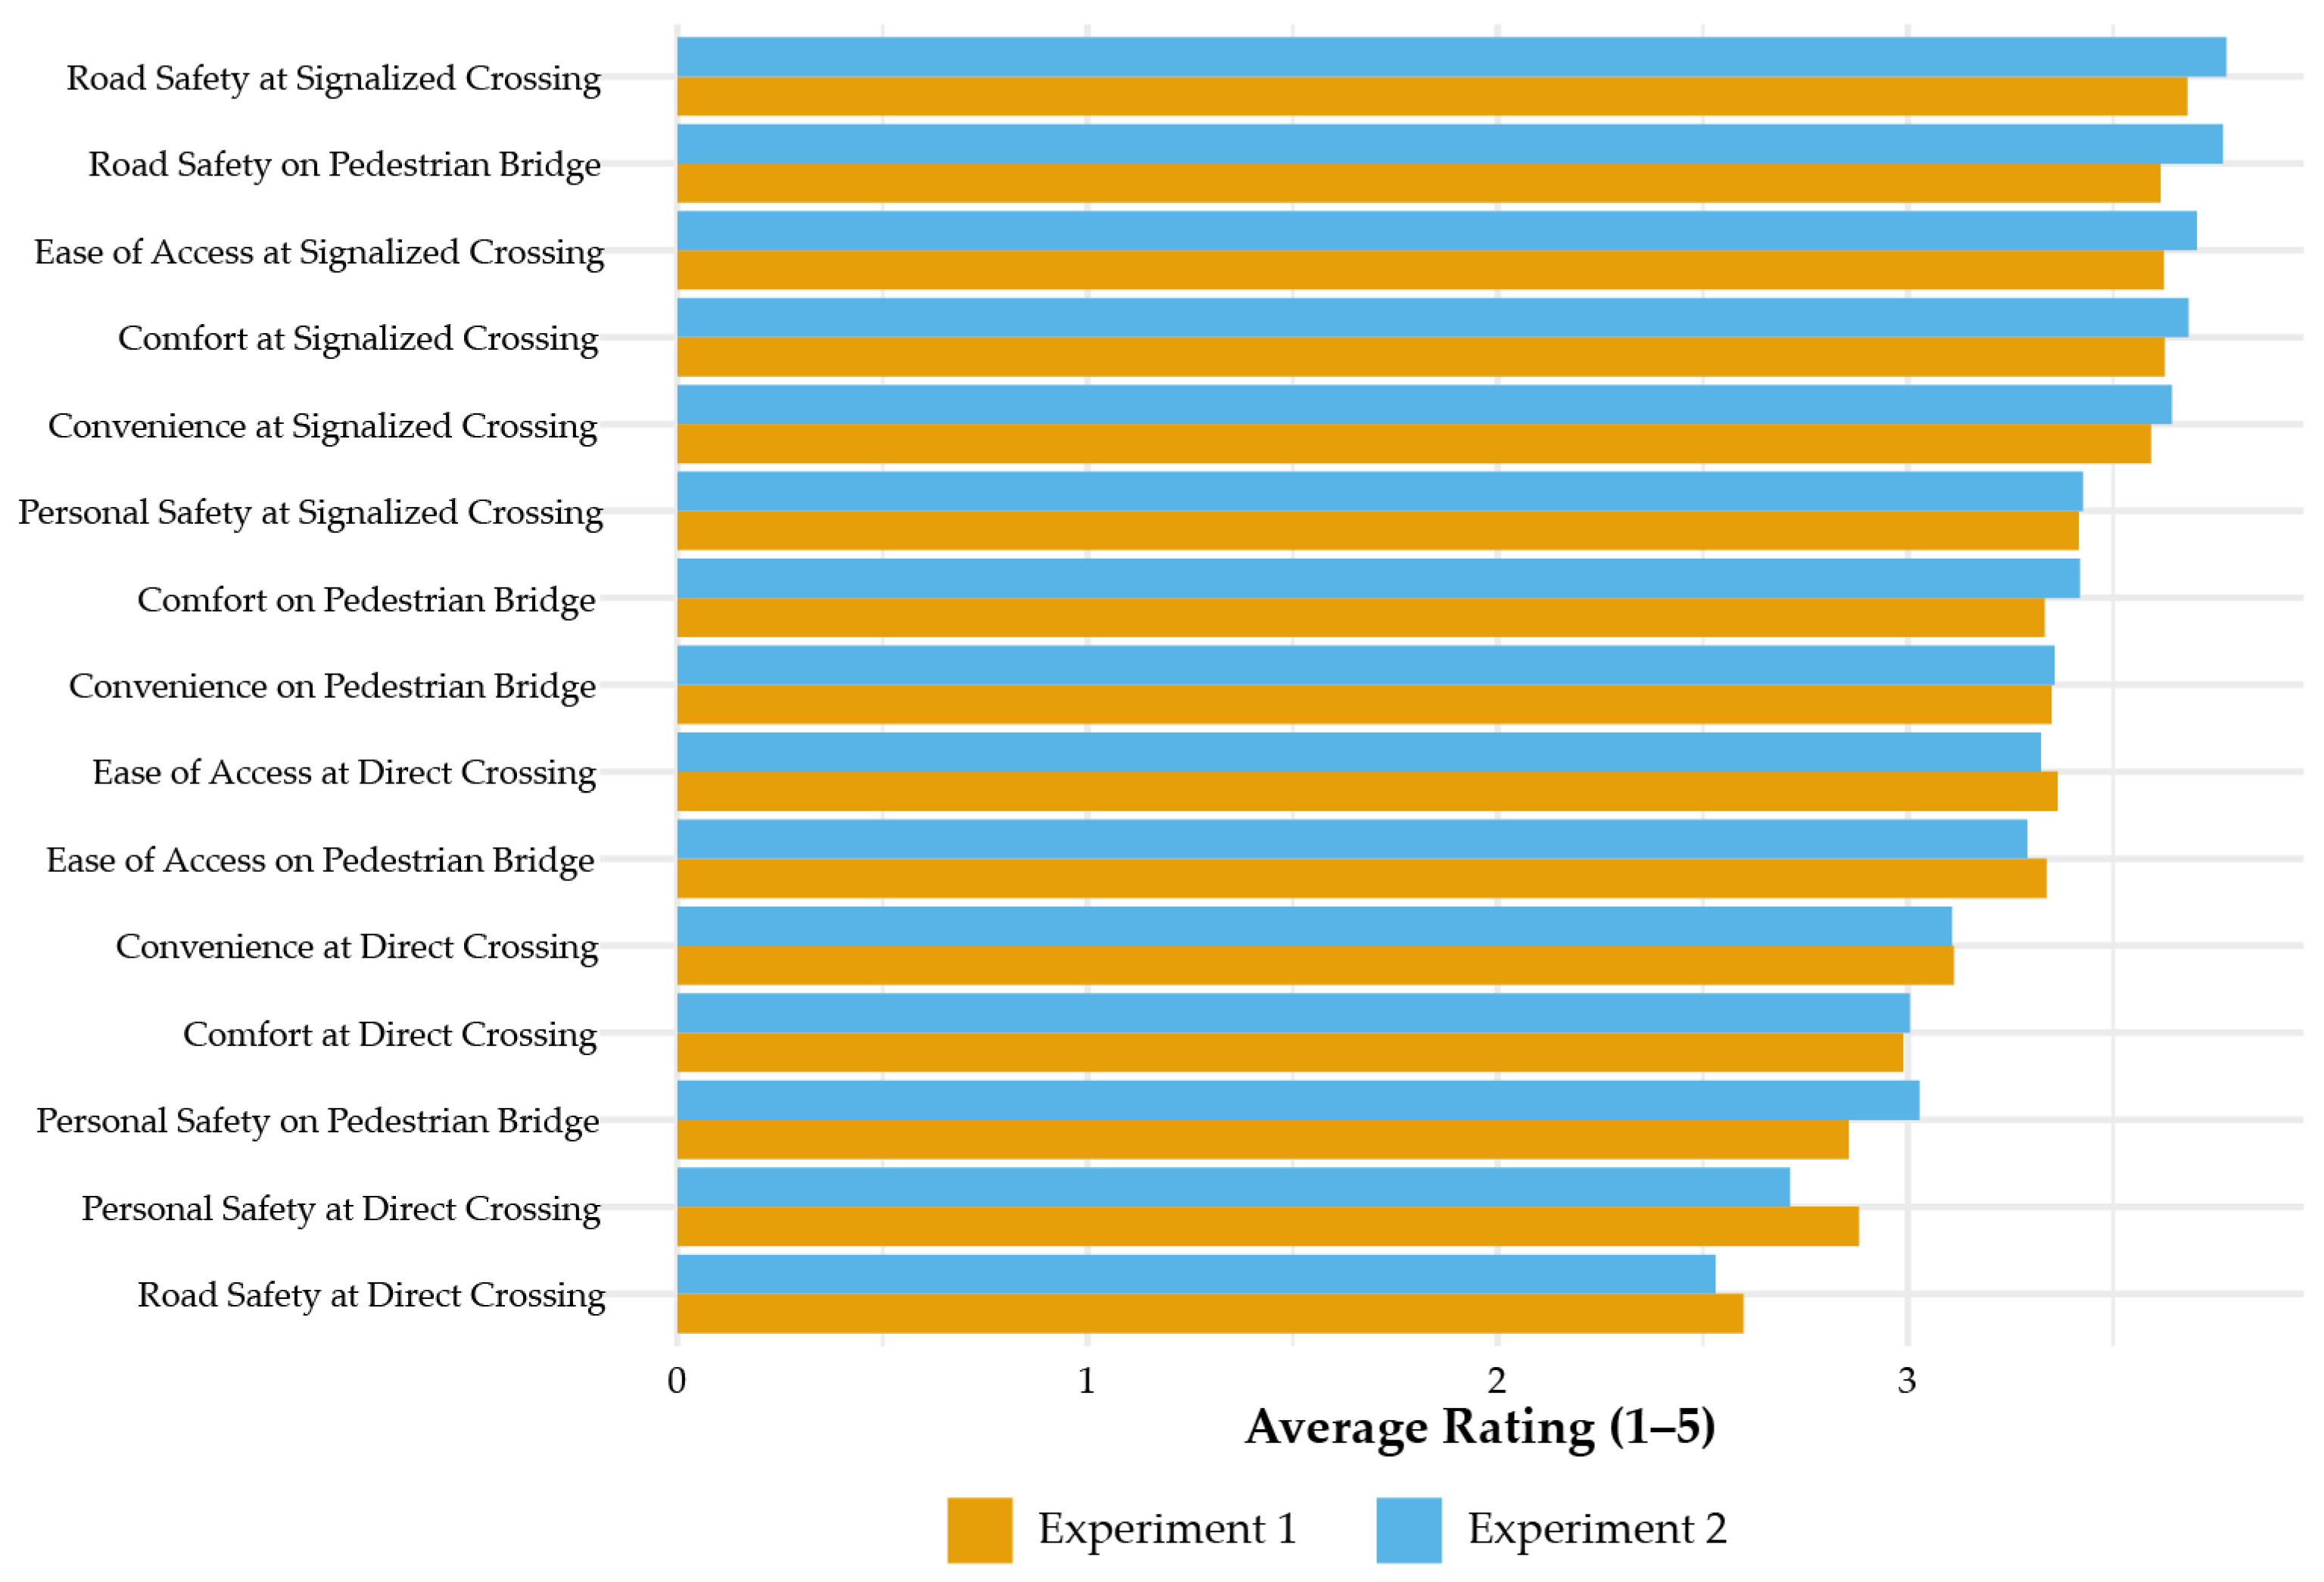
Figure 7 summarizes auxiliary perception indicators not directly included in the main MNL specification but used to derive the exploratory latent perception constructs. Respondents expressed consistent concern regarding personal safety, vehicular risk, and the inadequacy of current pedestrian infrastructure. These patterns provide important context for interpreting behavioral results, reinforcing the role of perceived risk and comfort in shaping crossing decisions.
3.5. City-Level Analysis
City-level results should be interpreted with caution due to substantial heterogeneity in sample sizes and potential selection biases. Estimates from cities with small samples (n < 60) are inherently unstable, with large standard errors and sensitivity to minor data variations; therefore, these findings are interpreted as directional and exploratory rather than policy-relevant. Convenience sampling may further introduce context-specific biases, particularly in smaller Amazonian cities, where respondents may disproportionately represent university-affiliated or socioeconomically advantaged groups, limiting the representativeness of local mobility practices. In addition, weak or inconsistent visual priming effects in some cities may reflect either genuine differences in sensitivity to normative cues or insufficient statistical power, which cannot be disentangled with the current data.
Despite these limitations, city-level analysis serves three purposes: documenting spatial heterogeneity in crossing preferences across infrastructure and mobility culture contexts, testing whether visual treatment effects vary by levels of urban formalization, and identifying cities where behavioral patterns diverge from aggregate trends. While results from underpowered cities are presented primarily for transparency and hypothesis generation, chi-square tests confirm significant spatial heterogeneity in both experiments. Consistent patterns observed in well-powered cities support the conclusion that urban context and infrastructure formality condition responses to visual priming.
3.5.1. Descriptive Choice Patterns by City
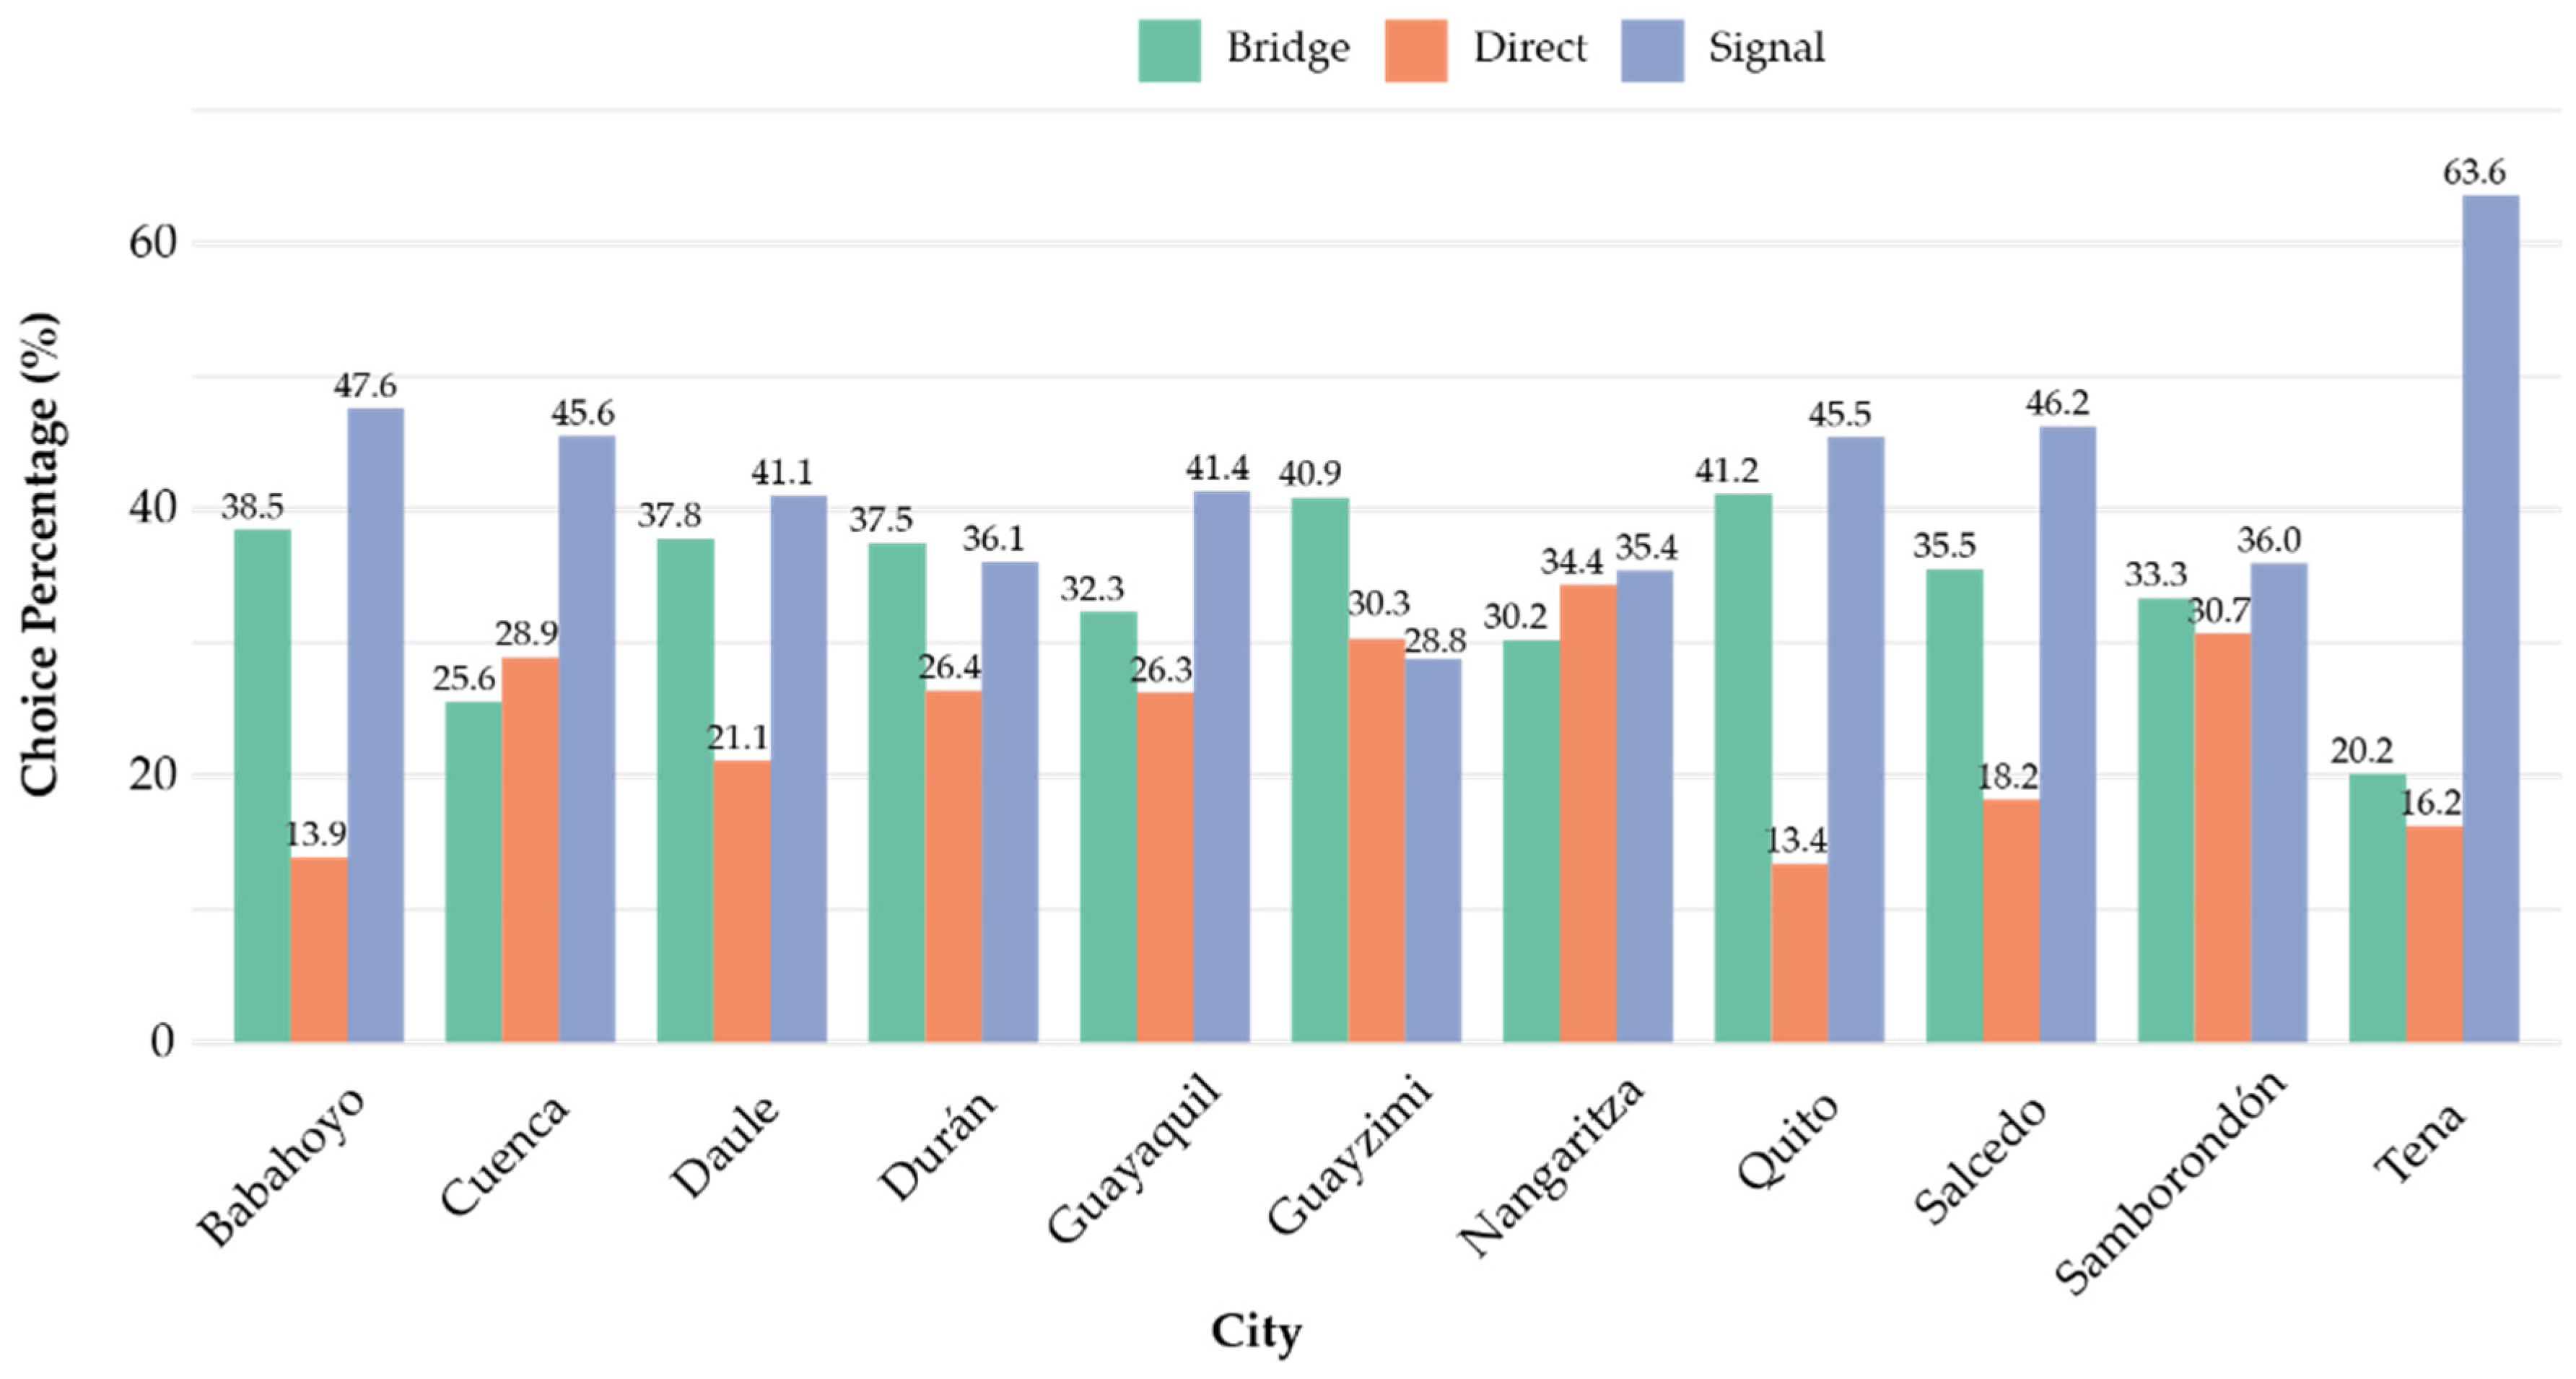
Figure 8 and
Figure 9 show the distribution of choices across cities for each experiment. Across both experimental conditions, chi-square tests revealed statistically significant differences across cities:
Experiment 1: χ2 = 124.10, df = 20, p < 0.001, Cramér’s V = 0.152.
Experiment 2: χ2 = 84.74, df = 16, p < 0.001, Cramér’s V = 0.140.
These results indicate substantial spatial heterogeneity in crossing preferences. Larger cities (e.g., Quito, Cuenca) generally showed greater inclination toward protected facilities, while smaller Amazonian cities exhibited more dispersed choice patterns, consistent with differing mobility cultures and infrastructure familiarity.
3.5.2. City-Specific MNL Models
City-specific MNL models (
Table 8 and
Table 9) demonstrate that visual context was associated with differences in not only the distribution of choices but also the strength, sign, and stability of the estimated coefficients:
Under the compliant crosswalk image (Experiment 2), several cities exhibited stronger negative sensitivity to delay, suggesting possible heightened expectations regarding crossing safety and efficiency.
Safety-related parameters became steeper in multiple cities under Experiment 2, indicating that the image may have increased the salience of formal infrastructure attributes.
In smaller Amazonian cities, parameter magnitudes were flatter and sometimes directionally inconsistent across experiments, reflecting more flexible or informal crossing norms.
Cities such as Quito, Cuenca, and Daule showed the strongest cross-experiment parameter shifts, suggesting that residents of larger cities may be more responsive to visual cues embedded in the imagery.
Table 8.
City-Specific MNL Estimates for Experiment 1.
Table 8.
City-Specific MNL Estimates for Experiment 1.
| City | Parameter | Coefficient | SE | t Stat |
|---|
| Cuenca | (Intercept)Direct | 0.7628 | 0.8350 | 0.9136 |
| Cuenca | (Intercept)Signal | 1.0677 | 0.7294 | 1.4637 |
| Cuenca | Bridge | 0.0027 | 0.0055 | 0.4807 |
| Cuenca | Signal | 0.0004 | 0.0048 | 0.0817 |
| Cuenca | DelayDirect | 0.0173 | 0.0508 | 0.3402 |
| Cuenca | DelaySignal | 0.0040 | 0.0456 | 0.0875 |
| Cuenca | MinorDirect | −0.4012 | 0.2959 | −1.3558 |
| Cuenca | MinorSignal | −0.0646 | 0.2711 | −0.2384 |
| Quito | (Intercept)Direct | −0.3233 | 1.0992 | −0.2941 |
| Quito | (Intercept)Signal | 0.7056 | 0.7535 | 0.9363 |
| Quito | Bridge | 0.0030 | 0.0073 | 0.4069 |
| Quito | Signal | −0.0051 | 0.0072 | −0.7116 |
| Quito | DelayDirect | 0.0044 | 0.0682 | 0.0644 |
| Quito | DelaySignal | 0.1185 | 0.0471 | 2.5152 |
| Quito | MinorDirect | −0.5438 | 0.4184 | −1.2998 |
| Quito | MinorSignal | 0.3204 | 0.2760 | 1.1612 |
| Daule | (Intercept)Direct | −0.4646 | 1.0433 | −0.4453 |
| Daule | (Intercept)Signal | −0.0911 | 0.8555 | −0.1064 |
| Daule | Bridge | −0.0007 | 0.0070 | −0.1059 |
| Daule | Signal | 0.0029 | 0.0066 | 0.4376 |
| Daule | DelayDirect | 0.0570 | 0.0676 | 0.8422 |
| Daule | DelaySignal | −0.0081 | 0.0525 | −0.1534 |
| Daule | MinorDirect | −1.1779 | 0.3872 | −3.0420 |
| Daule | MinorSignal | −0.6798 | 0.3271 | −2.0786 |
| Salcedo | (Intercept)Direct | 0.4640 | 1.1437 | 0.4057 |
| Salcedo | (Intercept)Signal | 0.9125 | 0.8763 | 1.0412 |
| Salcedo | Bridge | 0.0083 | 0.0076 | 1.0820 |
| Salcedo | Signal | 0.0033 | 0.0071 | 0.4649 |
| Salcedo | DelayDirect | 0.1148 | 0.0703 | 1.6341 |
| Salcedo | DelaySignal | 0.1070 | 0.0542 | 1.9738 |
| Salcedo | MinorDirect | −0.0865 | 0.4173 | −0.2074 |
| Salcedo | MinorSignal | −0.0330 | 0.3233 | −0.1020 |
| Babahoyo | (Intercept)Direct | 0.0664 | 1.3476 | 0.0493 |
| Babahoyo | (Intercept)Signal | 1.4871 | 0.9776 | 1.5212 |
| Babahoyo | Bridge | 0.0053 | 0.0091 | 0.5836 |
| Babahoyo | Signal | −0.0005 | 0.0086 | −0.0617 |
| Babahoyo | DelayDirect | 0.0694 | 0.0915 | 0.7589 |
| Babahoyo | DelaySignal | 0.0020 | 0.0590 | 0.0335 |
| Babahoyo | MinorDirect | −0.8431 | 0.4929 | −1.7107 |
| Babahoyo | MinorSignal | −0.2616 | 0.3524 | −0.7422 |
| Tena | (Intercept)Direct | 0.8505 | 1.5591 | 0.5455 |
| Tena | (Intercept)Signal | 1.4316 | 1.2278 | 1.1660 |
| Tena | Bridge | 0.0061 | 0.0104 | 0.5890 |
| Tena | Signal | 0.0040 | 0.0085 | 0.4697 |
| Tena | DelayDirect | 0.0534 | 0.0940 | 0.5684 |
| Tena | DelaySignal | 0.0643 | 0.0719 | 0.8940 |
| Tena | MinorDirect | −0.2510 | 0.5811 | −0.4319 |
| Tena | MinorSignal | 0.0595 | 0.4397 | 0.1354 |
| Guayaquil | (Intercept)Direct | −0.1456 | 1.3113 | −0.1110 |
| Guayaquil | (Intercept)Signal | −0.0338 | 1.0835 | −0.0312 |
| Guayaquil | Bridge | 0.0007 | 0.0087 | 0.0780 |
| Guayaquil | Signal | 0.0000 | 0.0084 | 0.0037 |
| Guayaquil | DelayDirect | 0.0019 | 0.0796 | 0.0242 |
| Guayaquil | DelaySignal | 0.0413 | 0.0722 | 0.5725 |
| Guayaquil | MinorDirect | 0.1345 | 0.4810 | 0.2795 |
| Guayaquil | MinorSignal | 0.4074 | 0.4249 | 0.9588 |
| Samborondón | (Intercept)Direct | −0.1346 | 1.8495 | −0.0728 |
| Samborondón | (Intercept)Signal | 0.7247 | 1.4818 | 0.4891 |
| Samborondón | Bridge | −0.0037 | 0.0121 | −0.3022 |
| Samborondón | Signal | −0.0111 | 0.0117 | −0.9418 |
| Samborondón | DelayDirect | −0.1401 | 0.1049 | −1.3352 |
| Samborondón | DelaySignal | 0.0670 | 0.1054 | 0.6353 |
| Samborondón | MinorDirect | −0.0680 | 0.6397 | −0.1063 |
| Samborondón | MinorSignal | −0.1441 | 0.5696 | −0.2530 |
| Durán | (Intercept)Direct | −0.6918 | 2.2675 | −0.3051 |
| Durán | (Intercept)Signal | −0.9890 | 1.7720 | −0.5581 |
| Durán | Bridge | 0.0025 | 0.0150 | 0.1697 |
| Durán | Signal | −0.0053 | 0.0156 | −0.3402 |
| Durán | DelayDirect | 0.0463 | 0.1289 | 0.3594 |
| Durán | DelaySignal | 0.3022 | 0.1414 | 2.1377 |
| Durán | MinorDirect | 1.3504 | 0.8609 | 1.5686 |
| Durán | MinorSignal | 1.3643 | 0.7606 | 1.7938 |
Table 9.
City-Specific MNL Estimates for Experiment 2.
Table 9.
City-Specific MNL Estimates for Experiment 2.
| City | Parameter | Coefficient | SE | t Stat |
|---|
| Quito | (Intercept)Direct | 0.2089 | 1.1659 | 0.1792 |
| Quito | (Intercept)Signal | 0.7966 | 0.8255 | 0.9649 |
| Quito | Bridge | 0.0029 | 0.0078 | 0.3710 |
| Quito | Signal | −0.0002 | 0.0070 | −0.0286 |
| Quito | DelayDirect | −0.0372 | 0.0679 | −0.5486 |
| Quito | DelaySignal | 0.0852 | 0.0499 | 1.7080 |
| Quito | MinorDirect | −0.2963 | 0.4427 | −0.6693 |
| Quito | MinorSignal | 0.1817 | 0.2974 | 0.6108 |
| Cuenca | (Intercept)Direct | 2.4890 | 1.2008 | 2.0727 |
| Cuenca | (Intercept)Signal | 2.7137 | 1.1015 | 2.4636 |
| Cuenca | Bridge | 0.0080 | 0.0077 | 1.0385 |
| Cuenca | Signal | −0.0036 | 0.0055 | −0.6516 |
| Cuenca | DelayDirect | 0.0008 | 0.0669 | 0.0125 |
| Cuenca | DelaySignal | 0.1038 | 0.0643 | 1.6139 |
| Cuenca | MinorDirect | −0.3915 | 0.3969 | −0.9864 |
| Cuenca | MinorSignal | −0.0643 | 0.3668 | −0.1752 |
| Salcedo | (Intercept)Direct | 0.7612 | 1.1833 | 0.6433 |
| Salcedo | (Intercept)Signal | 1.4743 | 0.8683 | 1.6979 |
| Salcedo | Bridge | 0.0044 | 0.0078 | 0.5623 |
| Salcedo | Signal | −0.0026 | 0.0072 | −0.3604 |
| Salcedo | DelayDirect | −0.0762 | 0.0683 | −1.1156 |
| Salcedo | DelaySignal | 0.0419 | 0.0547 | 0.7663 |
| Salcedo | MinorDirect | −0.1070 | 0.4313 | −0.2481 |
| Salcedo | MinorSignal | 0.1527 | 0.3093 | 0.4936 |
| Daule | (Intercept)Direct | 1.5684 | 1.1633 | 1.3482 |
| Daule | (Intercept)Signal | 1.8690 | 0.9303 | 2.0090 |
| Daule | Bridge | 0.0143 | 0.0079 | 1.8237 |
| Daule | Signal | 0.0044 | 0.0072 | 0.6204 |
| Daule | DelayDirect | 0.1703 | 0.0772 | 2.2077 |
| Daule | DelaySignal | 0.1212 | 0.0555 | 2.1858 |
| Daule | MinorDirect | −0.5635 | 0.4340 | −1.2982 |
| Daule | MinorSignal | 0.1709 | 0.3287 | 0.5198 |
| Tena | (Intercept)Direct | −2.3900 | 1.4969 | −1.5966 |
| Tena | (Intercept)Signal | 0.2713 | 1.0101 | 0.2686 |
| Tena | Bridge | −0.0083 | 0.0098 | −0.8477 |
| Tena | Signal | −0.0127 | 0.0091 | −1.3985 |
| Tena | DelayDirect | 0.0296 | 0.0919 | 0.3219 |
| Tena | DelaySignal | 0.0830 | 0.0600 | 1.3825 |
| Tena | MinorDirect | −0.6028 | 0.5006 | −1.2042 |
| Tena | MinorSignal | 0.0667 | 0.3725 | 0.1791 |
| Babahoyo | (Intercept)Direct | −1.2842 | 1.3537 | −0.9487 |
| Babahoyo | (Intercept)Signal | −0.0399 | 1.0413 | −0.0383 |
| Babahoyo | Bridge | −0.0092 | 0.0090 | −1.0247 |
| Babahoyo | Signal | −0.0097 | 0.0084 | −1.1482 |
| Babahoyo | DelayDirect | −0.0970 | 0.0853 | −1.1379 |
| Babahoyo | DelaySignal | 0.0124 | 0.0646 | 0.1915 |
| Babahoyo | MinorDirect | −1.4761 | 0.5124 | −2.8809 |
| Babahoyo | MinorSignal | −0.2070 | 0.3937 | −0.5259 |
| Guayaquil | (Intercept)Direct | −0.1126 | 1.8069 | −0.0623 |
| Guayaquil | (Intercept)Signal | 0.6383 | 1.3633 | 0.4682 |
| Guayaquil | Bridge | 0.0044 | 0.0122 | 0.3591 |
| Guayaquil | Signal | 0.0048 | 0.0114 | 0.4213 |
| Guayaquil | DelayDirect | 0.0950 | 0.1207 | 0.7875 |
| Guayaquil | DelaySignal | 0.0063 | 0.0827 | 0.0761 |
| Guayaquil | MinorDirect | −0.5378 | 0.6686 | −0.8044 |
| Guayaquil | MinorSignal | −0.1658 | 0.5013 | −0.3307 |
These findings suggest that visual stimuli are associated with changes in the cognitive weighting of attributes, though the specific mechanisms—whether through normative priming, attention shifts, or other pathways—cannot be definitively isolated in this design.
The results reveal a clear visual treatment effect, as Experiment 2 shows stronger preferences for safe crossings. Distance to crossing facilities emerges as the most influential observable attribute, while traveling with a minor consistently reduces the preference for riskier alternatives in both experiments. The analysis also indicates substantial cross-city heterogeneity, confirming that urban context plays a critical role in shaping behavioral patterns. Together, these findings provide a coherent summary of the behavioral mechanisms underlying pedestrian crossing decisions across Ecuadorian cities.
3.6. Visual Context Effects Across Experiments
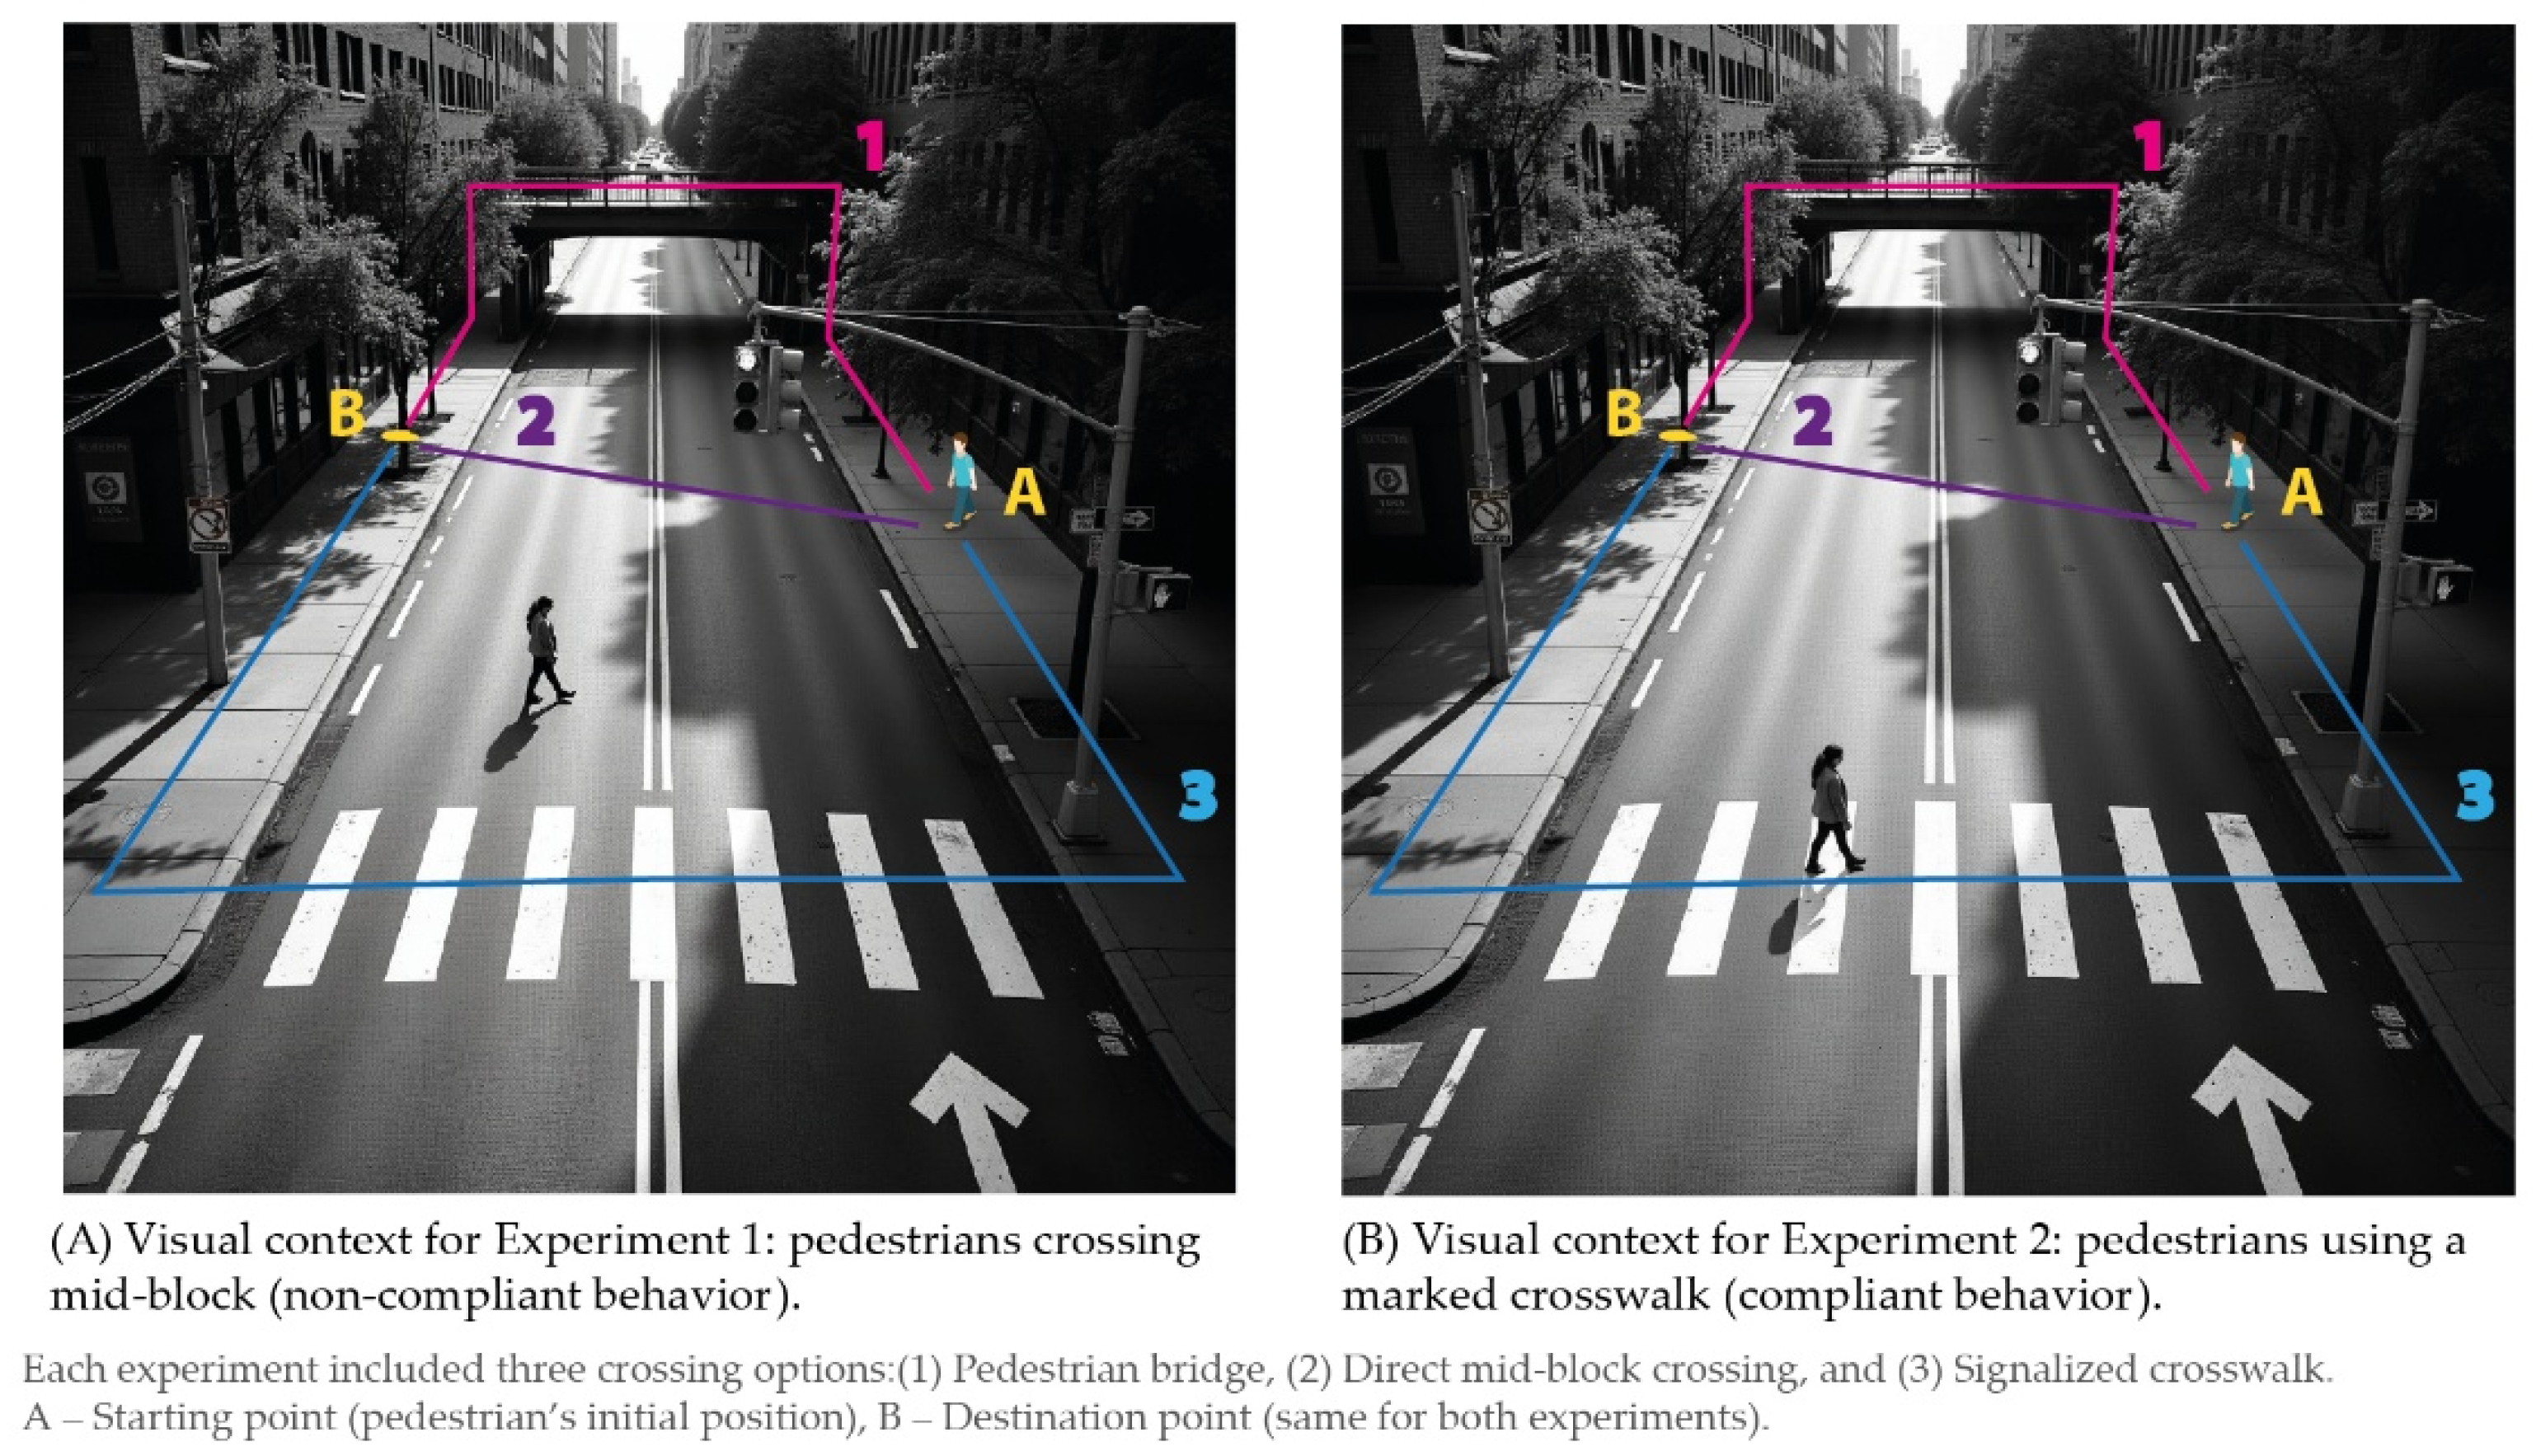
A central objective of this study was to determine whether visual context—operationalized through the introductory images presented to respondents—systematically influences pedestrian crossing choices. This question connects directly to the theoretical expectation that visual stimuli shape risk perception, cognitive appraisal, and heuristic-based decision making in urban mobility environments. The comparison between Experiment 1, which displayed an image of a non-compliant mid-block crossing, and Experiment 2, which presented a formal signalized crosswalk, enables a controlled assessment of these effects.
3.6.1. Evidence from Aggregate Choice Patterns
Figure 7 and
Figure 8 reveal clear cross-experiment differences in choice distributions across cities. In several cities, the proportion of respondents selecting safer alternatives, particularly the signalized crosswalk, increased substantially under Experiment 2′s compliant imagery. The shift is especially pronounced in cities with more formalized traffic systems such as Quito, Cuenca, and Salcedo.
Chi-square tests reinforce these observations. Both experiments demonstrated statistically significant associations between city and chosen alternative (Experiment 1: χ2 = 124.10, p < 0.001; Experiment 2: χ2 = 84.74, p < 0.001). However, the magnitude of association differed between experiments, with slightly stronger spatial structuring under the non-compliant image. This suggests that informal visual cues amplify the influence of local mobility culture, whereas compliant cues create more uniform behavioral responses across cities.
These results indicate that visual framing modifies how respondents interpret identical attribute profiles, shifting baseline preferences before attribute trade-offs even occur.
3.6.2. Evidence from Behavioral Parameters
City-specific MNL models (
Table 8 and
Table 9) demonstrate that visual context was associated with differences in the distribution of choices and the magnitude of estimated coefficients, though interpretation is complicated by unexpected coefficient signs for some parameters:
Delay parameters showed inconsistent signs across cities and experiments. In some cities (e.g., Quito-1: βDelaySignal = 0.119, p < 0.05; Daule-2: βDelayDirect = 0.170, p < 0.05), positive coefficients suggest counterintuitive associations between longer waiting times and increased alternative selection. In others (e.g., Tena-1, Salcedo-2), coefficients were near zero. These inconsistencies may reflect city-specific differences in how respondents interpreted delay scenarios, variation in baseline exposure to traffic delays, or limitations in the stated preference design for capturing temporal trade-offs.
Minor presence showed more consistent effects, with negative coefficients for Direct crossing in most cities (particularly Daule-1: β = −1.178, p < 0.01; Babahoyo-2: β = −1.476, p < 0.01), confirming that traveling with children strongly reduces willingness to use unprotected crossings.
Distance effects remained weak and inconsistent across cities, with most coefficients near zero and non-significant.
Cities such as Quito, Cuenca, and Daule showed the strongest cross-experiment parameter shifts in terms of magnitude, though not always in terms of sign consistency, suggesting that residents of larger cities may show more variable responses to visual cues.
These city-level results underscore substantial behavioral heterogeneity and suggest that aggregate models may mask important contextual variation. The unexpected coefficient signs in several specifications indicate that the model may not adequately capture the decision-making process for some subgroups or contexts.
3.6.3. Interaction Between Visual Cues and Latent Perceptions
The two latent constructs identified through Principal Component Analysis—safety/security (Factor 1) and bridge-specific convenience (Factor 2)—provide context for understanding the visual treatment effects. The compliant crosswalk imagery in Experiment 2 appears to have increased the salience of the safety/security construct, as evidenced by stronger parameter magnitudes for delay and minor presence in that condition. This suggests the visual prime heightened respondents’ attention to formal infrastructure safety attributes before they evaluated specific attribute trade-offs.
Conversely, the non-compliant mid-block crossing image in Experiment 1 may have activated risk normalization heuristics, making informal crossing behavior seem more contextually acceptable, particularly in cities where such behavior is common. This cognitive anchoring is consistent with the stronger spatial heterogeneity and lower parameter stability observed in Experiment 1 (Cramer’s V = 0.152 vs. 0.140, χ2 = 124.10 vs. 84.74).
These results indicate that visual context functions as a perceptual filter, modifying the relative weight of latent psychological constructs in the decision-making process rather than creating entirely new motivations.
3.6.4. Implications for Stated Preference Research
The systematic differences between experimental conditions demonstrate that visual context in stated preference surveys operates as an active treatment variable rather than neutral illustration. Four key mechanisms emerged from our analysis:
First, visual stimuli function as behavioral primes that shape reference points and normative expectations before choice evaluation begins. Second, they act as perceptual filters that modify how respondents interpret identical attribute levels—the same 5 min delay was weighted differently depending on which image respondents viewed. Third, visual context amplifies or dampens latent psychological constructs such as safety concerns and convenience preferences. Fourth, visual priming effects interact with spatial context, making cities with formalized mobility norms especially sensitive to compliant visual cues.
These findings carry important methodological implications: stated preference studies examining risk-related behaviors must treat visual stimuli as experimental variables requiring careful control and manipulation. Small changes in survey imagery can meaningfully alter both choice distributions and behavioral parameter estimates. This is particularly critical when studying vulnerable road users, where risk perception and social norms substantially influence decision-making. Future research should explicitly incorporate visual framing as a design factor and test multiple visual conditions to assess the robustness of behavioral inferences.
4. Discussion
This study provides robust empirical evidence that visual context systematically influences pedestrian crossing decisions in Ecuadorian urban environments through multiple cognitive pathways. By integrating a controlled visual manipulation within a stated preference framework, we demonstrate that seemingly minor changes in survey imagery can meaningfully alter both aggregate choice patterns and the underlying behavioral parameters that govern crossing decisions.
4.1. Core Behavioral Determinants
Our findings confirm that pedestrian crossing behavior reflects a complex optimization process balancing multiple competing objectives. Three attributes emerged as primary decision drivers across all experimental conditions and geographic contexts. The consistent negative effect of waiting time on protected facility usage, significant in both experiments with Experiment 2 showing β
Delay_Signal = 0.067 (
p < 0.001), aligns with established research demonstrating that temporal costs drive non-compliance with formal crossing infrastructure [
24,
25]. However, our contribution extends beyond mere confirmation. The marginal effects analysis reveals that even moderate delay reductions in five minutes produce substantial behavioral shifts, increasing signalized crosswalk selection probability by 4.9 percentage points in Experiment 1 and 10.2 percentage points in Experiment 2. The amplified effect under compliant visual priming suggests that temporal sensitivity is not fixed but contextually modulated by normative expectations.
The marked influence of traveling with a minor on crossing choice (β
Minor_Direct = −0.278 in Exp1, −0.627 in Exp2, both
p < 0.01) provides strong evidence for situational risk aversion. Consistent with theory on protective decision-making [
19], the presence of a child substantially reduced willingness to engage in direct mid-block crossing [
42]. Notably, this effect nearly doubled in magnitude under compliant visual priming in Experiment 2, suggesting that normative cues amplify already-present safety motivations rather than creating them de novo. This finding has direct policy implications, as infrastructure interventions targeting school zones or family-oriented destinations may achieve disproportionate safety benefits.
The modest and often non-significant effects of additional walking distance to bridge and crosswalk alternatives, as shown in
Table 3, initially appear counterintuitive given literature emphasizing accessibility barriers [
26,
28,
45]. However, this pattern likely reflects two mechanisms. First, the relatively short distances tested in our scenarios, ranging from 100 to 250 m, may fall below critical thresholds for behavioral change. Second, distance effects may be overshadowed by more salient psychological factors captured in our latent perception constructs. The elasticity analysis presented in
Figure 3 supports this interpretation, showing that perceived safety improvements produce larger proportional choice shifts than equivalent changes in physical distance.
4.2. Visual Context Effects on Choice Patterns
The systematic differences between experimental conditions demonstrate that visual context correlates meaningfully with pedestrian crossing decisions. Our results show that visual treatment was associated with changes in choice behavior through multiple observable patterns, though we acknowledge that the specific underlying cognitive mechanisms cannot be definitively determined from our design.
First, the compliant crosswalk imagery in Experiment 2 was associated with shifts in baseline preferences toward formal infrastructure use. This manifested in stronger alternative-specific constants for signalized crosswalks (ASC = 0.934 versus 0.673 in Experiment 1), increased overall model predictive accuracy (50.5% versus 43.8%), and reduced spatial heterogeneity (Cramér’s V = 0.140 versus 0.152). These patterns are consistent with visual stimuli influencing how respondents cognitively framed the choice task, though whether this occurs through reference point shifts (as suggested by prospect theory), normative anchoring, or other mechanisms requires additional investigation.
Second, visual treatment was associated with changes in how respondents weighted identical attribute levels. The Wald test results presented in
Table 6 revealed significant differences in delay sensitivity (
p = 0.014), with other parameters showing directional shifts despite not reaching conventional significance thresholds. This finding indicates that the compliant imagery may have altered expectations for safety and efficiency at formal crossings, making delays more cognitively salient, though alternative explanations such as differential attention or response patterns cannot be ruled out. The doubled Minor coefficient in Experiment 2 (from −0.278 to −0.627) suggests amplified concern for child safety under compliant visual conditions, though this could reflect either normative activation or increased salience of safety considerations more generally.
Third, the Principal Component Analysis revealed two distinct psychological dimensions underlying crossing preferences: a general safety and security construct and a bridge-specific convenience construct. The visual treatment appears to correlate with which latent dimension more strongly influences decision-making, with Experiment 2 showing patterns consistent with greater weight on safety considerations. However, we emphasize that these latent constructs were not formally integrated into the choice models, and thus their role remains descriptive rather than mechanistically verified.
The visual treatment varied not only in depicted behavior (compliant vs. non-compliant) but potentially also in familiarity, perceived realism, and institutional trust cues. The images showed different physical locations, which may have triggered associations with different infrastructure quality levels or enforcement contexts. Additionally, we tested only two visual conditions, limiting our ability to systematically vary specific visual elements and trace their individual effects. The modest number of statistically significant parameter differences (
Table 6) suggests that visual effects, while systematic, may be more nuanced than implied by aggregate choice patterns alone. Future research should employ pooled models with formal interaction terms between attributes and visual treatment, multiple visual conditions systematically varying specific elements, pre- and post-treatment perception measures to trace cognitive changes, and attention-tracking methods to identify which visual elements drive observed effects.
Visual Context Effects: Theoretical Interpretation
The systematic differences observed between the two experimental conditions provide empirical support for visual context operating as a behavioral prime, in line with established theories from behavioral psychology and decision science. Although the experimental design does not allow definitive isolation of individual mechanisms, the observed patterns can be meaningfully interpreted through the combined lenses of social norm activation, framing effects, and dual-process decision-making.
Visual representations of compliant behavior appear to activate normative expectations regarding appropriate crossing behavior. In particular, the compliant imagery used in Experiment 2 likely cued injunctive norms associated with rule-following, increasing baseline preferences for formal infrastructure, as reflected in stronger alternative-specific constants for signalized crosswalks. The substantially larger effect of the presence of minors under compliant priming further supports this interpretation, suggesting that normative cues amplify caregiving considerations and reinforce socially approved behavior. The reduced spatial heterogeneity observed in Experiment 2 is also consistent with norm activation, as shared normative reference points tend to produce more uniform responses across contexts.
At the same time, the visual treatments likely altered cognitive reference points, consistent with framing effects. Non-compliant imagery implicitly framed mid-block crossing as a default behavior, whereas compliant imagery established signalized crossing as the reference option. This shift affects how respondents evaluate trade-offs, such that waiting time at a signal may be perceived as a necessary cost under compliant framing but as an avoidable inconvenience under non-compliant framing. The significant difference in delay sensitivity between experiments, confirmed by the Wald test, and the overall improvement in model fit under compliant imagery suggest that framing reduced ambiguity in evaluating alternatives and led to more consistent preference structures.
These effects can also be interpreted through dual-process theory. Visual stimuli primarily engage intuitive, heuristic-based processing, shaping rapid judgments about safety and appropriateness that subsequently influence deliberative evaluations of attributes in stated preference tasks. Compliant imagery likely aligned intuitive and analytical processes, reducing cognitive conflict and resulting in more predictable choices, as reflected in higher prediction accuracy and improved model fit. In contrast, non-compliant imagery may have heightened tension between intuitive recognition of common informal behavior and analytical evaluation of formal safety benefits, leading to greater variability in responses.
Taken together, these mechanisms likely operate jointly rather than independently. Visual context appears to activate norms, establish reference points, and guide intuitive judgments, producing systematic shifts in baseline preferences, attribute sensitivities, response consistency, and spatial heterogeneity. While causal attribution to any single mechanism remains limited by the experimental design, the convergence of evidence across multiple behavioral indicators provides credible support for visual context functioning as a behavioral prime in pedestrian crossing decisions.
4.3. Spatial Heterogeneity
The substantial cross-city variation in both baseline preferences and visual context sensitivity (χ
2 statistics ranging from 84.74 to 124.10, both
p < 0.001) confirms that pedestrian behavior is deeply embedded in local mobility cultures and infrastructure realities. Our city-specific analyses (
Table 8 and
Table 9) reveal systematic patterns:
Formalized urban contexts (Quito, Cuenca, Guayaquil, Daule):
Exhibited stronger baseline preferences for protected facilities.
Showed greater responsiveness to visual priming, with parameter shifts consistently favoring formal infrastructure in Experiment 2.
Produced more stable and interpretable ICLV model estimates, suggesting behavioral consistency within these populations.
Demonstrated significant effects of delay and minor presence across both experiments.
Smaller Amazonian cities (Guayzimi, Nangaritza):
Displayed more dispersed choice patterns with no single alternative dominating.
Showed weaker visual context effects, with minimal parameter differences between experiments.
Exhibited ICLV estimation challenges (convergence issues, poor model fit in Experiment 1).
Revealed flatter or sometimes directionally inconsistent parameter estimates.
This urban-rural gradient in behavioral consistency and visual context sensitivity suggests that normative cues are most effective in contexts where formal infrastructure and traffic rules are already salient in daily mobility experiences. Where informal crossing practices dominate—often due to infrastructure scarcity or limited enforcement—survey imagery alone may be insufficient to override established behavioral norms.
The policy implication is clear: one-size-fits-all pedestrian safety interventions will likely fail. Cities with strong informal mobility cultures require fundamentally different approaches than those with established formal systems. In the former, infrastructure provision must be accompanied by sustained community engagement and enforcement to establish new behavioral norms. In the latter, optimizing existing formal infrastructure (signal timing, maintenance, accessibility) may yield greater marginal safety improvements.
4.4. Latent Perceptions
The two perception dimensions identified through Principal Component Analysis—safety/security (Factor 1) and bridge-specific convenience (Factor 2)—provide descriptive context for interpreting our discrete choice results, but several important limitations constrain their explanatory value.
These constructs help frame several patterns in the MNL results. The strong negative delay effect on bridge selection likely reflects the compound psychological burden of vertical displacement, additional walking distance, and time costs—concerns partially captured by Factor 2′s convenience dimension. The amplified minor effect under compliant priming aligns with situations where safety and security considerations (Factor 1) become more salient due to caregiving responsibilities. The relatively weak distance effects may partly reflect perceptual offsetting, where positive safety perceptions compensate psychologically for additional walking distance.
However, we emphasize that these interpretations remain hypothetical because the latent constructs are not formally integrated into our choice models. Three specific limitations constrain causal or mechanistic inference:
Endogeneity concern: Perception ratings were collected after choice tasks, creating ambiguity about causal direction. Respondents may have justified their choices by adjusting perception ratings post hoc rather than perceptions driving choices prospectively.
No formal utility integration: The PCA constructs do not enter utility functions, meaning we cannot quantify their marginal effects on choice probabilities, test whether they mediate visual treatment effects, or determine whether they add explanatory power beyond observable attributes.
Unexplained variance: The constructs explain less than half of perception variance (42–45%), indicating substantial heterogeneity not captured by our two-factor solution.
The exploratory ICLV models in
Appendix A demonstrate that formal integration is technically feasible when sample sizes are adequate and behavioral consistency is high (Experiment 2). These models show significant latent variable effects in several cities, confirming that psychological constructs can improve explanatory power when properly specified. However, convergence challenges and identification issues in smaller samples prevented us from using ICLV as our primary specification.
Future research should prioritize three methodological improvements: (1) collect perception measures before choice tasks to establish temporal precedence and reduce endogeneity, (2) use ICLV specifications as primary models rather than exploratory supplements, with adequate sample sizes for stable estimation, and (3) test formal mediation models to determine whether visual treatment effects operate through latent perceptions or via alternative pathways. Until these steps are taken, the latent constructs in our study should be understood as providing interpretive context rather than constituting explanatory mechanisms.
4.5. Methodological Contributions and Limitations
This study makes three primary methodological contributions. First, we demonstrate that visual stimuli in stated preference surveys function as active treatments that systematically alter behavioral responses, with significant implications for survey design in domains involving risk perception and social norms. Second, our use of Principal Component Analysis to derive latent perceptions provides a pragmatic middle ground between pure multinomial logit models and full hybrid choice specifications, offering behavioral insight without the computational complexity often problematic in data-constrained developing country contexts. Third, the exploratory ICLV models in
Appendix A establish proof-of-concept that latent psychological constructs can be formally integrated into pedestrian choice models when behavioral consistency is adequate.
The modest McFadden R2 values (0.005–0.013) and unbalanced hit rates warrant explicit discussion of model adequacy. These fit measures indicate substantial unexplained variation in crossing choices, likely reflecting omitted individual heterogeneity, context-specific factors not captured in our attributes, and measurement error inherent in stated preference responses. The low R2 values do not invalidate our primary findings—the Wald test for delay sensitivity (p = 0.014) and systematic improvement in Experiment 2 provide clear evidence of visual treatment effects—but they do suggest that our models capture only a portion of the decision-making process. The unbalanced hit rates, with high accuracy for signalized crosswalks but near-zero for other alternatives, reveal that the models predict the modal choice well but do not adequately represent preference heterogeneity. Future research should employ mixed logit specifications to capture random taste variation, latent class models to identify behaviorally distinct segments, and panel effects to account for individual-specific preferences across repeated choices. These extensions would likely improve fit substantially while preserving the core finding that visual context systematically influences crossing preferences.
A key limitation of the analysis concerns the unexpected signs of the delay coefficients. Although theory suggests that longer waiting times should reduce utility, DelaySignal exhibits consistently positive coefficients and Delay-Direct shows mixed signs, possibly due to confounding with perceived safety at signalized crossings, limited realism in how delay was presented, reference point effects, or omitted interactions with traffic and infrastructure attributes. These issues do not undermine the main findings on visual context effects, as sensitivity to delay differs significantly between experiments regardless of coefficient sign, but they do call for caution when drawing policy conclusions related to waiting time.
Several limitations qualify our findings. Stated preferences may not fully translate to revealed behavior, and convenience sampling likely over-represents educated urban residents. We tested only two visual conditions, limiting generalizability across the full range of environmental contexts. Cross-sectional data cannot assess whether visual priming effects persist over time or fade through habituation. Sample size constraints precluded exploration of individual heterogeneity through mixed logit or latent class models. Future research should integrate field validation, more diverse sampling strategies, and longitudinal designs to address these limitations.
4.6. Policy Implications and Implementation Pathways
Our findings support context-sensitive policy recommendations for pedestrian safety in developing countries. The dominant role of waiting time indicates that infrastructure investments must minimize temporal costs through pedestrian-responsive signal timing, countdown timers, strategically located grade-separated facilities near high-demand destinations, and mid-block crossings with refuge islands where detours exceed 150–200 m. The amplified safety sensitivity when traveling with minors suggests prioritizing school zones, family-oriented destinations, and design features accommodating caregivers such as wider walkways and tactile paving.
Visual priming effects suggest that normative interventions can amplify infrastructure benefits. High-visibility enforcement at new formal crossings, painted crosswalks and signage cueing pedestrians toward crossing points, public awareness campaigns featuring compliant behavior in local contexts, and community ambassadors during initial implementation periods can establish desired norms. However, these interventions show diminishing returns where informal crossing dominates, requiring sustained behavioral change efforts.
The pronounced spatial heterogeneity argues against standardized policies. Large, formalized cities benefit most from optimizing existing infrastructure through signal timing and maintenance. Medium cities with mixed systems should prioritize high-traffic corridors while accepting informal crossing on lower-volume streets. Small cities with predominantly informal mobility may find traffic calming and environmental design more cost-effective than expensive grade-separated facilities that remain underutilized. This tiered approach recognizes that behavioral change requires alignment between infrastructure, enforcement capacity, and existing mobility cultures.
Finally,
Table 10 summarizes key policy-relevant recommendations derived from the study findings, linking identified behavioral mechanisms to practical interventions and their expected benefits for different stakeholder groups.
4.7. Future Research Directions
Future research should pursue three complementary directions. Methodologically, virtual reality experiments could capture dynamic crossing decisions with full sensory realism, combined stated-revealed preference models could validate whether survey-based visual priming translates to actual behavior, and eye-tracking or neuroimaging studies could identify specific cognitive mechanisms underlying these effects. Substantively, testing additional visual manipulations including enforcement presence, social crowding, and infrastructure quality variations would map the full parameter space of context effects, while examining interactions with individual characteristics such as risk tolerance and disability status could identify responsive population segments. Geographically, replication across diverse developing countries in Sub-Saharan Africa, South Asia, and Southeast Asia would assess cultural moderators, comparison with developed countries would isolate infrastructure quality from mobility culture effects, and systematic rural-urban gradient studies would test whether our findings represent universal relationships or context-specific phenomena.





 ,
,