


Highlights
What are the main findings?
- In the Lazio Region, accessibility to local education and health services shows pronounced intra-municipal and inter-provincial disparities, amplified by distance from the capital and the concentration of specialized facilities (i.e., secondary school services, particularly hospitals and emergency units). Disparities are due to population density and topographic or traffic-related barriers that impede public service accessibility.
- Public service accessibility patterns in Lazio and Madrid follow similar metropolitan–peripheral gradients, but differ because Madrid shows higher centralization and better performance in specialized services while Lazio exhibits lower centralization, greater variability, and more extreme peripheral outliers.
What are the implications of the main findings?
- The study provides a modular, replicable workflow to compute distance- and time-based accessibility to essential services (cars with traffic and public transport), enabling transparent cross-regional benchmarking and supporting evidence-based, place-sensitive planning and mobility policies.
Abstract
This article presents a modular and replicable framework to assess spatial accessibility to essential public services in the Lazio Region (Italy). Current policies, framed within the EU Urban Agenda and the UN Sustainable Development Goals, emphasize improving accessibility rather than mobility, integrating land-use and transport planning, and supporting sustainable modes. The study adopts urban centres, densely populated sub-municipal units, as the main spatial unit to capture intra-municipal variability. Accessibility is measured as distance and travel time to the nearest education and healthcare facilities, for both private car and public transport, considering traffic conditions. Distances and times are computed using routing APIs and aggregated into service-specific indicators at urban-centre and municipal levels. Due to GTFS availability, the public transport analysis is restricted to the Province of Rome. Indicators are published as Linked Open Data following DCAT-AP, exposed via a SPARQL endpoint, and visualized through an interactive web map viewer. Results highlight pronounced disparities: car accessibility is relatively uniform, while public transport shows critical gaps in peripheral and mountainous areas. The framework enables transparent benchmarking and supports evidence-based, place-sensitive planning across different European contexts.
1. Introduction
Accessibility to essential public services such as healthcare and education is a fundamental dimension of urban sustainability, liveability, spatial equity, and territorial cohesion [1]; while European cities often benefit from comparatively well-developed infrastructures, gaps in mobility supply and service provision persist, especially in peripheral and non-metropolitan areas [2,3,4]. Urban planning strategies now emphasise accessibility over mere mobility, seeking to ensure equitable access to opportunities rather than simply facilitating movement [5]. Accessibility is conceptualised as a multidimensional concept encompassing distance, travel time, and impedance. This study focuses on distance and travel time due to their interpretability and relevance for transport and land-use planning.
This work examines the Lazio Region (Italy), a socio-spatially heterogeneous territory including the metropolitan area of Rome as well as rural and mountainous municipalities, where sharp contrasts emerge between service-rich urban areas and underserved peripheries [6]. The analysis concentrates on municipalities with fewer than 40,000 inhabitants, where accessibility challenges are most evident due to dispersed settlement patterns and limited infrastructure. Urban centres, as defined by the Italian National Institute of Statistics (ISTAT), are adopted as the spatial unit of analysis: as real population concentrations within municipalities, they provide a granular and policy-relevant perspective and enable the assessment of intra-municipal inequalities [7]. The proposed methodology computes multimodal accessibility to education and healthcare services by combining GIS, routing technologies, and Linked Open Data (LOD) standards. Travel distances and durations are estimated for both private car and public transport, incorporating traffic conditions through time-dependent routing. Due to data availability constraints, public transport accessibility is assessed for the Province of Rome. Indicators are aggregated at the municipal level and published through a web-based interactive viewer. A benchmarking exercise with the Community of Madrid, selected for its comparable size and demographic structure, provides an external reference for interpreting accessibility patterns under different infrastructural and planning contexts. The framework is developed within the LoDCORE Madrid initiative and relies on a shared Linked Open Data (LOD) ontology [8,9]. Beyond accessibility, the same semantic structure supports additional dimensions of territorial cohesion (e.g., attractiveness, socio-economic, environmental, and infrastructural indicators), enabling interoperability across datasets, departments, and policy domains. This unified publication framework facilitates cross-service analysis and more coordinated decision-making, contributing to breaking down traditional silos in urban service planning.
The objectives of this research are as follows:
- 1.
- To develop a scalable and replicable methodology for computing multimodal accessibility indicators using harmonised open datasets;
- 2.
- To define an ontological model and an open data structure;
- 3.
- To enhance the interpretability and usability of accessibility analysis by implementing a visual, interactive platform for geographic exploration and benchmarking;
- 4.
- To identify and map spatial inequalities in service access, offering evidence to inform targeted and place-based policy interventions.
Based on the study objectives, four research questions were formulated, each linked to a specific hypothesis guiding the empirical analysis. Table 1 summarises the correspondence between research questions and hypotheses. RQ4 extends the analysis beyond Lazio, assessing whether the observed dynamics are reproducible in another European context and thereby providing an additional validation of the methodological framework.
Table 1.
Research questions and corresponding hypotheses.
The remainder of this article is structured as follows. Section 2 reviews the relevant literature and provides the conceptual foundations of accessibility measurement. Section 3 outlines data collection, multimodal routing, and indicator construction. Section 4 presents the empirical results, and Section 5 discusses implications for planning and benchmarking with the Comunidad de Madrid. Finally, Section 6 concludes with limitations and future developments.
2. Background
This section outlines the main definitions, methodological approaches, and policy references related to accessibility analysis, highlighting current limitations and the need for replicable and open frameworks.
2.1. Accessibility: Definitions and Key Components
Accessibility is a foundational concept in urban and transport planning, commonly defined as the ease or potential with which individuals can reach spatially distributed opportunities, such as healthcare, education, or employment [3,4]. It is increasingly recognised not only as a performance metric for transportation systems, but also as a critical dimension of social equity, spatial justice, and territorial cohesion. From an analytical standpoint, accessibility integrates two main components: (i) the cost or impedance of travel, typically measured in terms of distance, time, or effort; and (ii) the availability and attractiveness of destinations. These components can be combined in various ways to construct indicators aligned with specific planning goals [3]. Páez et al. [4] distinguish between normative and positive definitions of accessibility.
Normative approaches define desired standards of access (e.g., acceptable travel times to hospitals), while positive approaches measure actual patterns of movement or reachability. This distinction has important implications for policy design, as it helps bridge evidence-based planning with socially desirable outcomes. In recent years, accessibility has been increasingly used as a planning tool that supports the integration of land use and transport policies in a common framework. It provides a diagnostic lens to identify underserved areas and a strategic instrument to promote inclusive urban development. The relevance of accessibility is particularly evident in rural and peripheral areas, where limitations in transport infrastructure or service provision can exacerbate spatial inequalities [7].
2.2. Methodological Approaches to Accessibility Measurement
Accessibility is inherently multidimensional, and indicators vary according to the components they emphasise (transport impedance, land-use opportunities, and behavioural preferences), as well as the spatial scale and data availability [3,10].
A concise taxonomy distinguishes four families that are most relevant for positioning this study. Spatial separation measures quantify travel cost (e.g., distance or time) between origins and destinations and remain widely used due to their transparency and limited data requirements [3,11]. Cumulative opportunity measures (contour-based) count the opportunities reachable within a fixed threshold, but depend on arbitrary cut-offs and may mask gradual accessibility gradients [3]. Gravity- and competition-based models, including floating catchment approaches (e.g., 2SFCA), weight opportunities through impedance decay and can incorporate supply–demand interactions, but often require calibration choices (decay functions, capacities, demand assumptions) that reduce interpretability and transferability in data-scarce contexts [10,12]. Finally, activity- and utility-based approaches represent accessibility through time budgets or utility formulations, offering behavioural richness but typically relying on travel diaries or preference data that are rarely available at regional scale [3]. In parallel, network-theoretical indicators assess structural properties of transport systems (e.g., centrality, connectivity) and are useful for infrastructure diagnostics, although they do not directly quantify access to specific service opportunities [10]. Equity-oriented extensions increasingly link accessibility to inequality diagnostics (e.g., Gini, Lorenz, concentration indices) [13,14,15], and recent work shows how temporal variability in travel times can expose spatio-temporal inequities [16,17]. However, the present study focuses on transparent distance- and time-based indicators that can be computed and communicated consistently across territories.
2.3. Linked Open Data (LOD)
Public administrations commonly publish territorial cohesion data in formats such as CSV, Shape files, or Web Map/Feature Services, which formally qualify as open data [18]. However, combining heterogeneous datasets from multiple sources remains challenging, as they are rarely designed to be interoperable [19]. In many cases, data rely on locally meaningful identifiers or ad hoc structures, requiring substantial manual work to reconcile and integrate information from different providers [20].
Moreover, the discovery of relevant datasets is often limited: information essential for a specific analytical task (e.g., territorial accessibility assessment) may be difficult to find, or distributed across institutions that publish complementary datasets independently.
Traditional workflows based on manual comparison and integration unavoidably delay knowledge production. Instead, automated pipelines that convert heterogeneous datasets into Linked Open Data (LOD) allow continuous, machine-actionable access without human intervention. LOD principles also support the integration of complementary datasets, enabling richer insights and more robust analyses [21]. To address these limitations, Tim Berners-Lee proposed the Five-Star Open Data model, which encourages the publication of data using open standards and semantic technologies. Compliant datasets can be linked to external resources, providing contextual information and supporting the creation of interconnected knowledge graphs. When data are published as five-star LOD, users benefit from enhanced discoverability: graph-based queries allow the identification of relationships that are not explicitly encoded at the source [22]. Publishing data as LOD relies on standard web technologies and semantic descriptions that can be interpreted by machines. The process typically involves identifying relevant data sources, integrating heterogeneous information through ETL workflows, and modelling the domain using an ontology. Whenever possible, adopting common or widely recognised ontologies ensures compatibility across datasets and facilitates reuse at national and international levels [23].
Overall, LOD publication enhances the discoverability and reuse of territorial datasets, fosters innovation through the aggregation of high-value public information, supports continuous data improvement, and enables the development of new services built on interoperable, machine-readable data.
2.4. European and Italian Reference Projects and Limitations of Existing Solutions
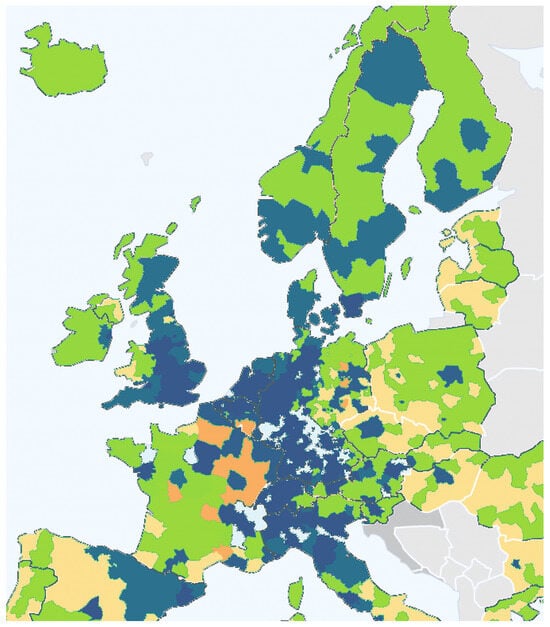
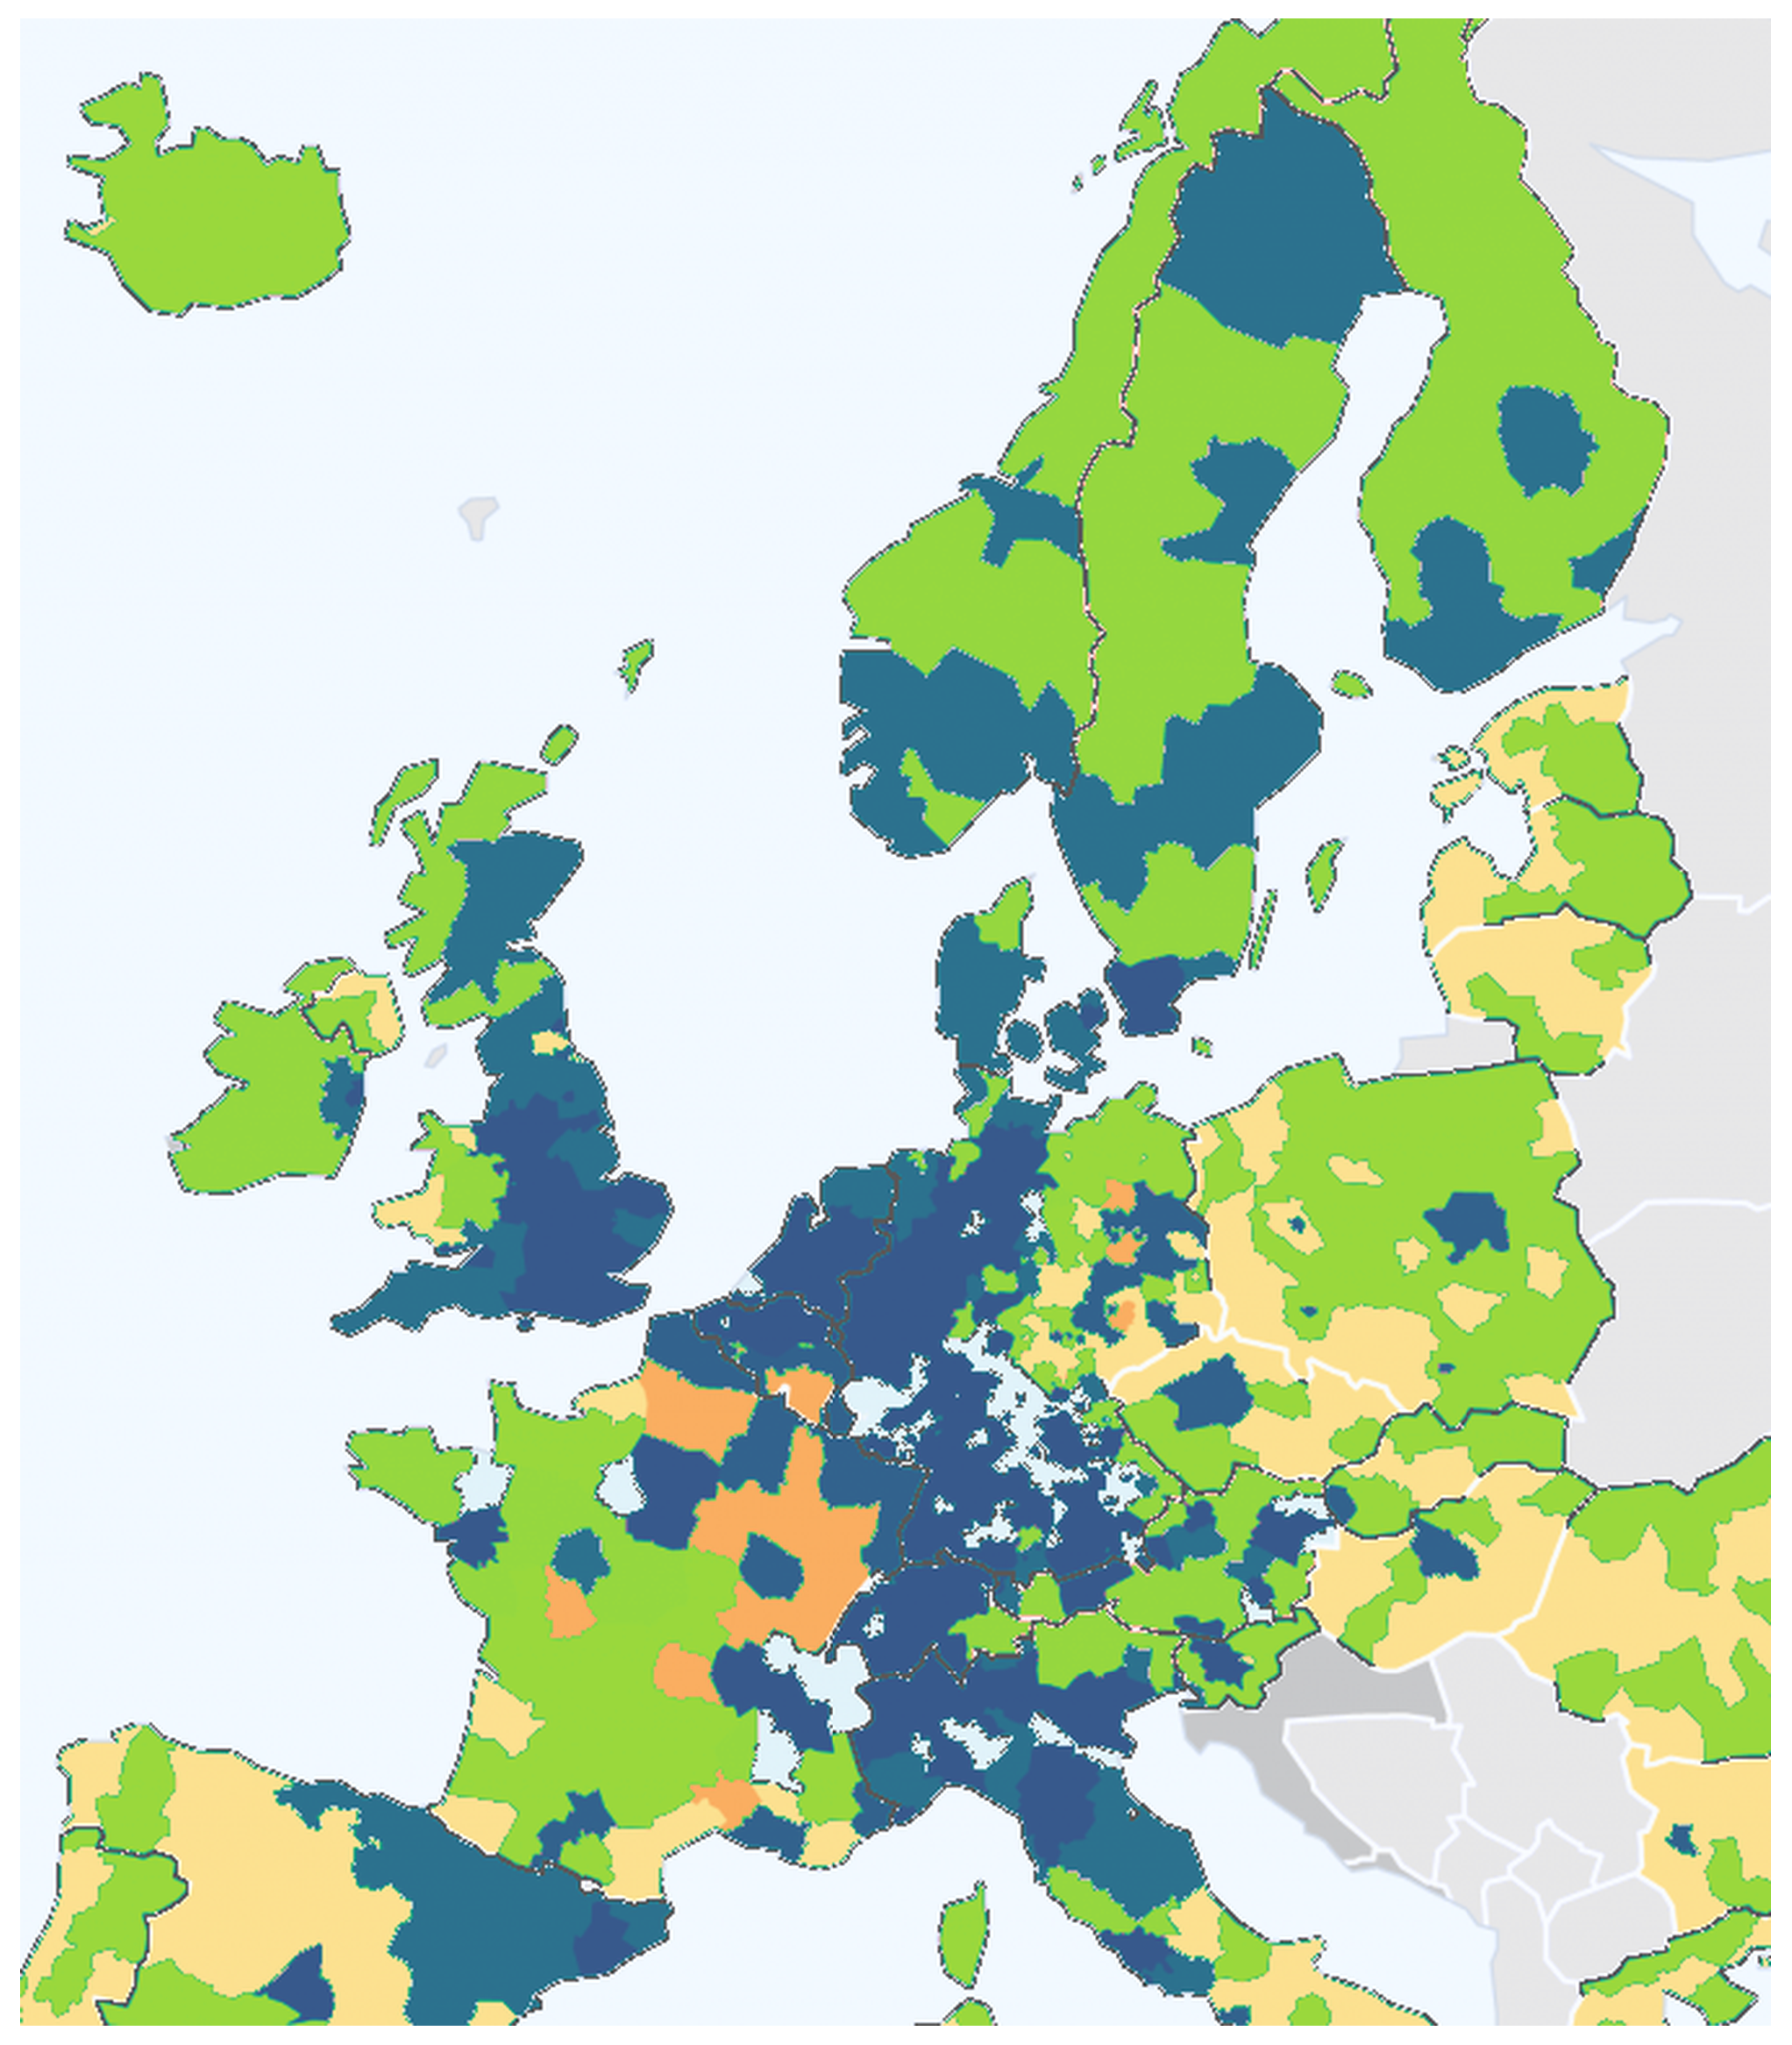
Over the past two decades, various European research initiatives have highlighted the strategic importance of accessibility for regional development and territorial cohesion. Among them, the ESPON PROFECY project is particularly relevant: it introduced the concept of “inner peripheries” to identify areas that, despite being geographically central, suffer from persistent deficits in access to essential services due to infrastructural, demographic, or institutional constraints [24,25]. These areas were mapped using composite indicators and demographic trends to inform cross-national policy strategies. Figure 1 shows examples of such accessibility visualisations developed under ESPON, offering clear evidence of spatial disparities across the European territory. In the Italian context, the Openpolis project has played a key role in disclosing territorial inequalities by publishing open data dashboards on education, healthcare, and welfare services. Their work emphasizes accessibility gaps between urban and rural municipalities and advocates for greater data transparency and spatial awareness in policymaking [26]. Despite these contributions, several limitations persist. Many planning support systems (PSSs) are designed for expert audiences, lack interactivity, or embed accessibility metrics in static reports or proprietary platforms, reducing their applicability in participatory governance processes [27,28]. Moreover, the current landscape is fragmented in terms of data standards, spatial granularity, and methodological transparency. Indicators are often pre-aggregated at municipal or regional levels, obscuring intra-municipal disparities. Reproducibility is further hampered by the absence of clear computational pipelines or openly accessible code. Although some progress has been made through the use of web-based mapping libraries and open formats (e.g., GeoJSON, RDF), there is still a lack of comprehensive, automated, and interoperable frameworks capable of generating high-resolution accessibility indicators in an open and updateable manner. This study addresses these gaps by developing a fully transparent workflow based on public datasets, open-source tools, and semantic web technologies. The aim is to build a model that is not only replicable across other European regions but also understandable by stakeholders without technical expertise, such as local administrators, planners, or citizens.
Figure 1.
Accessibility indicator representation in European Union—adapted from ESPON [29].
2.5. Remarks from the Literature and How to Go Beyond
Despite the growing recognition of accessibility as a key dimension of sustainable planning, many initiatives still face recurrent limitations: fragmented and heterogeneous datasets that are difficult to harmonise across services and scales, limited updateability for policy monitoring, and outputs that are often delivered as static statistics or expert-oriented tools with constrained operational uptake by local administrations.
Accessibility measures also differ substantially in spatial resolution and modelling assumptions. Grid-based analyses, including ESPON initiatives [24,25], offer fine spatial detail but are computationally demanding and not directly aligned with common policy units. Threshold-based indicators (e.g., L(5), L(10)) are intuitive yet rely on arbitrary cut-offs and may obscure gradual accessibility degradation and intra-municipal disparities. Gravity- and competition-based approaches [10] provide richer representations of interaction effects, but often require decay parameters, capacities, or demand assumptions that reduce transparency and limit applicability in data-scarce regional contexts.
A complementary challenge concerns interoperability and long-term reuse. Linked Open Data (LOD) can support semantic alignment, comparability, and cross-domain integration of accessibility indicators, but adoption remains uneven due to the effort required for vocabulary alignment and the limited accessibility of LOD publication and querying workflows for public administrations.
In response, there is a need for frameworks that balance analytical rigour with operational usability by (i) relying on interpretable indicators grounded in observed travel conditions (including congestion effects), (ii) adopting spatial units that reflect actual population concentrations and policy practice, such as urban centres [30], and (iii) enabling interoperable publication to support integration, benchmarking, and reuse [13,31].
Overall, the literature points to a consistent set of gaps: limited integration of heterogeneous datasets, coarse spatial aggregation that masks intra-municipal inequality, and insufficient interoperability and update-ability of published indicators for comparative monitoring. The methodological framework presented in the next section addresses these challenges by combining traffic-aware, network-based travel distance and time measures computed from urban centres with population-weighted aggregation, and by publishing the resulting indicators through an interoperable LOD structure designed for reuse and cross-regional benchmarking.
3. Methodology
The complete workflow of the methodology, summarized in Figure 2, illustrates the sequential steps from data collection and distance computation to aggregation and publication.
Figure 2.
Workflow of the methodology.
Public services considered for the construction of accessibility indicators were selected following the framework proposed in “Smart territories–Definition, attributes and requirements” [32], which identifies education and healthcare as essential services for smart and developed territories. Services were then classified according to their spatial scale, frequency of use, and institutional relevance, following Kompil [10] and Verachtert [31] as presented in Table 2. It is important to note that, within this classification, educational services are considered local services, as their provision and catchment areas are typically organised at the municipal or sub-municipal level. Conversely, higher-order healthcare services such as hospitals and emergency units operate at a broader, subregional scale, serving multiple municipalities.
Table 2.
Classification of public services considered to generate accessibility indicators.
For this reason, the subregional service category includes only healthcare services. This classification informs the zoning framework used to assess accessibility at urban, municipal, and sub-regional scales, ensuring policy relevance and cross-regional comparability.
3.1. Data Collection
A harmonised data infrastructure was built to compute accessibility indicators from ISTAT urban centres to education and healthcare services in the Lazio Region. The workflow relies on publicly available official datasets and produces interoperable geospatial layers for routing and aggregation.
3.1.1. Input
Core inputs include (i) municipal and urban-centre geometries and populations (ISTAT); (ii) school locations by level (MIUR); (iii) general practitioners from the regional health authority (ASL portals); and (iv) hospitals and emergency facilities from the Ministry of Health (PNE) and ASL Lazio.
3.1.2. Process
Datasets were pre-processed through spatial filtering to the Lazio Region, coordinate standardisation, and selection of relevant records. When only addresses were provided (notably for general practitioners), locations were obtained via automated extraction from official ASL portals and geocoding through the Google Maps API. Municipal adjacency relations were derived through spatial joins to support service assignment when a municipality did not host a given local service.
3.1.3. Output
Outputs were exported as GeoJSON/CSV layers (urban-centre centroids, municipal boundaries and adjacency, service locations, and population attributes), providing the inputs required for multimodal routing and indicator construction.
3.2. Distance Computation and Multimodal Routing
This phase focuses on assigning each urban centre to the most appropriate public service and calculating the corresponding accessibility in terms of travel distance and time. Two different methodologies were applied depending on the nature of the service: local services (e.g., schools and general practitioners) and subregional services (e.g., hospitals and emergency facilities).
Within this context, routing-based estimation is central to ensuring policy relevance. While open-source engines such as OSRM or GraphHopper provide transparent solutions, they typically lack native support for time-dependent traffic modelling; recent evidence suggests that this limitation is more critical for travel time than for distance [33]. For this reason, the present study adopts the Google Distance Matrix API to incorporate congestion through departure-time routing, while keeping the workflow modular so that alternative engines can be used for scenario analyses without traffic or cost-free applications.
3.2.1. Input and Assignment Rules
Inputs include urban-centre centroids, service locations (schools, general practitioners, hospitals, emergency units), municipal boundaries and adjacency relations, and ASL boundaries for hospital assignment.
Urban centres were assigned to services using simple, policy-consistent rules. For local services, destinations were searched within the same municipality and, when unavailable, within adjacent municipalities. For hospitals, assignments were constrained to facilities within the same Local Health Authority (ASL), whereas emergency services were assigned based on proximity, irrespective of ASL boundaries.
3.2.2. Process: Routing
Travel distance and time between each urban centre and its assigned services were computed using the Google Distance Matrix API in two modes, driving and public transport (transit), both evaluated at 08:00 local time on a representative weekday during the school period to incorporate time-dependent traffic conditions for both modes.
3.2.3. Output
The output is a unified dataset reporting, for each urban centre and service category, travel distance (minutes) and duration (seconds) to the assigned destinations, used as input for indicator construction.
3.3. Indicator Design and Aggregation
Accessibility indicators are generated from raw distance and travel time data by applying A two-level aggregation process, first at the urban centre level and then at the municipal level, with population-weighted metrics.
3.3.1. Input
The input for this phase should include a series of datasets generated during the previous phase and datasets with demographic variables useful for creating accessibility indicators. In particular, the following is included:
- JSON files containing distance and time values for each urban centre to the assigned services (distance and travel times);
- Population for each urban centre.
3.3.2. Process
The process is described by dividing it into three distinct steps: urban centre-level aggregation, municipal-level aggregation, and, before aggregating by municipality, imputation of missing data.
Urban centre level aggregation
For each service type, multiple facilities may be associated with a given urban centre. To summarise the accessibility at this level, unweighted mean and standard deviation values are computed:
where and denote, respectively, the distance (in km) and travel time (in minutes), N is the number of destinations, and and are the mean.
These indicators are stored for each urban centre along with its population. Furthermore, the standard deviation is calculated using the python pandas library, following the formulas below:
where
- is the standard deviation;
- represents each individual distance or duration value;
- is the mean of distances or durations;
- N is the total number of distances or durations.
In this case, the standard deviation, together with the mean measure, gives us an indication of the spatial availability of facilities for that urban centre. In the case where the distance to the urban centre has only been calculated for one facility, the standard deviation will be 0.
Municipal-level aggregation
Municipal indicators were obtained by aggregating the values of all urban centres within each municipality m, using population-weighted averages:
where and are mean distances and times from urban centres, represents the population of urban centre i, and n is the number of urban centres in municipality m. This ensures that more populated areas contribute proportionally to the municipal indicator. Furthermore, in the case of aggregation by municipality, the standard deviation is calculated, and in this case, it gives us important information on the variability of the indicator value created within the municipality, meaning how accessibility differs among the urban centres within the municipality.
Handling missing data in public transport
Given the spatial nature of the data and the lack of strong predictive variables available at the urban-centre level, regression-based imputation methods were deemed inappropriate. In particular, the absence of homogeneous covariates related to public transport supply (e.g., service frequency, timetable structure, or network connectivity) and the strong spatial heterogeneity driven by topography and network configuration would likely result in biased or overly smoothed estimates. Instead, a conservative penalised approach was adopted, leveraging the maximum observed value at the municipal level as a bounding reference. The penalty was scaled according to the proportion of available data, following principles commonly applied in territorial accessibility and spatial inequality studies [34,35]. This strategy explicitly avoids underestimation of travel times in low-coverage contexts and allows flexible control of uncertainty through tunable penalisation parameters.
Missing public transport distance and travel time values were therefore imputed using a penalised maximum-based formulation, applied independently for each service category c ∈ {Kindergarten, Primary, Secondary, General Medicine, Hospitals} and for each urban centre i.
where
- is the maximum observed travel time for service c in municipality m;
- represents the proportion of valid data available for that service and municipality;
- is a tunable penalisation factor controlling the strength of the correction;
- is a fixed multiplier applied to prevent underestimation in low-coverage contexts.
This formulation penalises municipalities with sparse public transport coverage by proportionally inflating missing values towards the local maximum. The method was applied independently to each service category, ensuring consistency across education and healthcare domains.
In the empirical application presented in this study, a moderate penalisation regime was adopted: the factor was set to control the strength of the correction, while the multiplier was found to balance robustness against underestimation and stability of municipal-level aggregated indicators. The selection criterion was based on preserving the stability of municipal-level rankings and mean accessibility values, while avoiding systematic underestimation of travel times in low-coverage contexts. In detail, the penalisation factors and were selected through a sensitivity analysis over a grid of candidate values . This analysis showed that the municipal-level indicators vary monotonically with the penalisation factor, with modest changes for most municipalities and larger effects concentrated in low-coverage contexts. In particular, the identification of the worst-performing municipalities remained stable across the tested parameter range.
3.3.3. Output
The results of this phase, for each service, include an urban centre-level indicator table (CSV dataset), comprising the following for each centre: mean_km, mean_min, std_km, std_min, and population. Furthermore, there is a municipal-level indicator table, comprising the following for each municipality: weighted average of time and distance and intra-municipal standard deviation.
3.4. Semantic Publication of Indicators
To ensure interoperability, comparability, and long-term reusability of the accessibility indicators, the datasets were semantically enriched and published as Linked Open Data (LOD). The publication process follows European DCAT-AP specifications and leverages the LoDCOREMadrid ontology [9]. This ontology extends beyond accessibility indicators to cover other dimensions of territorial cohesion, including economic, social, environmental, and spatial development indicators. As a result, all datasets can be queried and combined within a single interoperable LOD ecosystem. This approach provides a unified conceptual framework for modelling accessibility indicators and their geographic context, facilitating cross-domain integration and enabling comprehensive territorial analysis.
3.4.1. Input
Inputs consist of municipal- and urban-centre-level CSV tables containing spatial unit identifiers, distance/time metrics, population attributes used for weighting, and service disaggregation (education level, healthcare category). These fields are mapped to ontology entities and aligned with administrative classifications (NUTS/LAU) and geometries to support spatial queries.
3.4.2. Process
The semantic transformation converts the tabular indicators into RDF resources with explicit metadata (publisher, method, parameters) and measurement semantics (magnitude and unit), and links each indicator to its corresponding administrative unit and geometry.
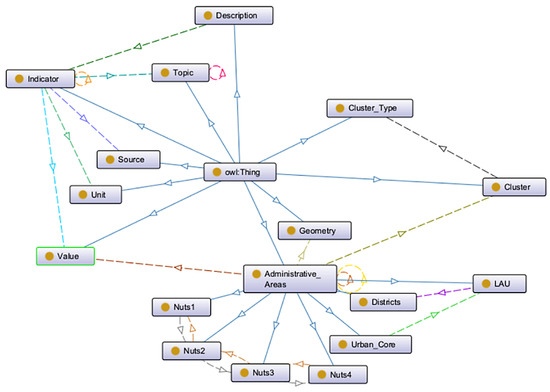
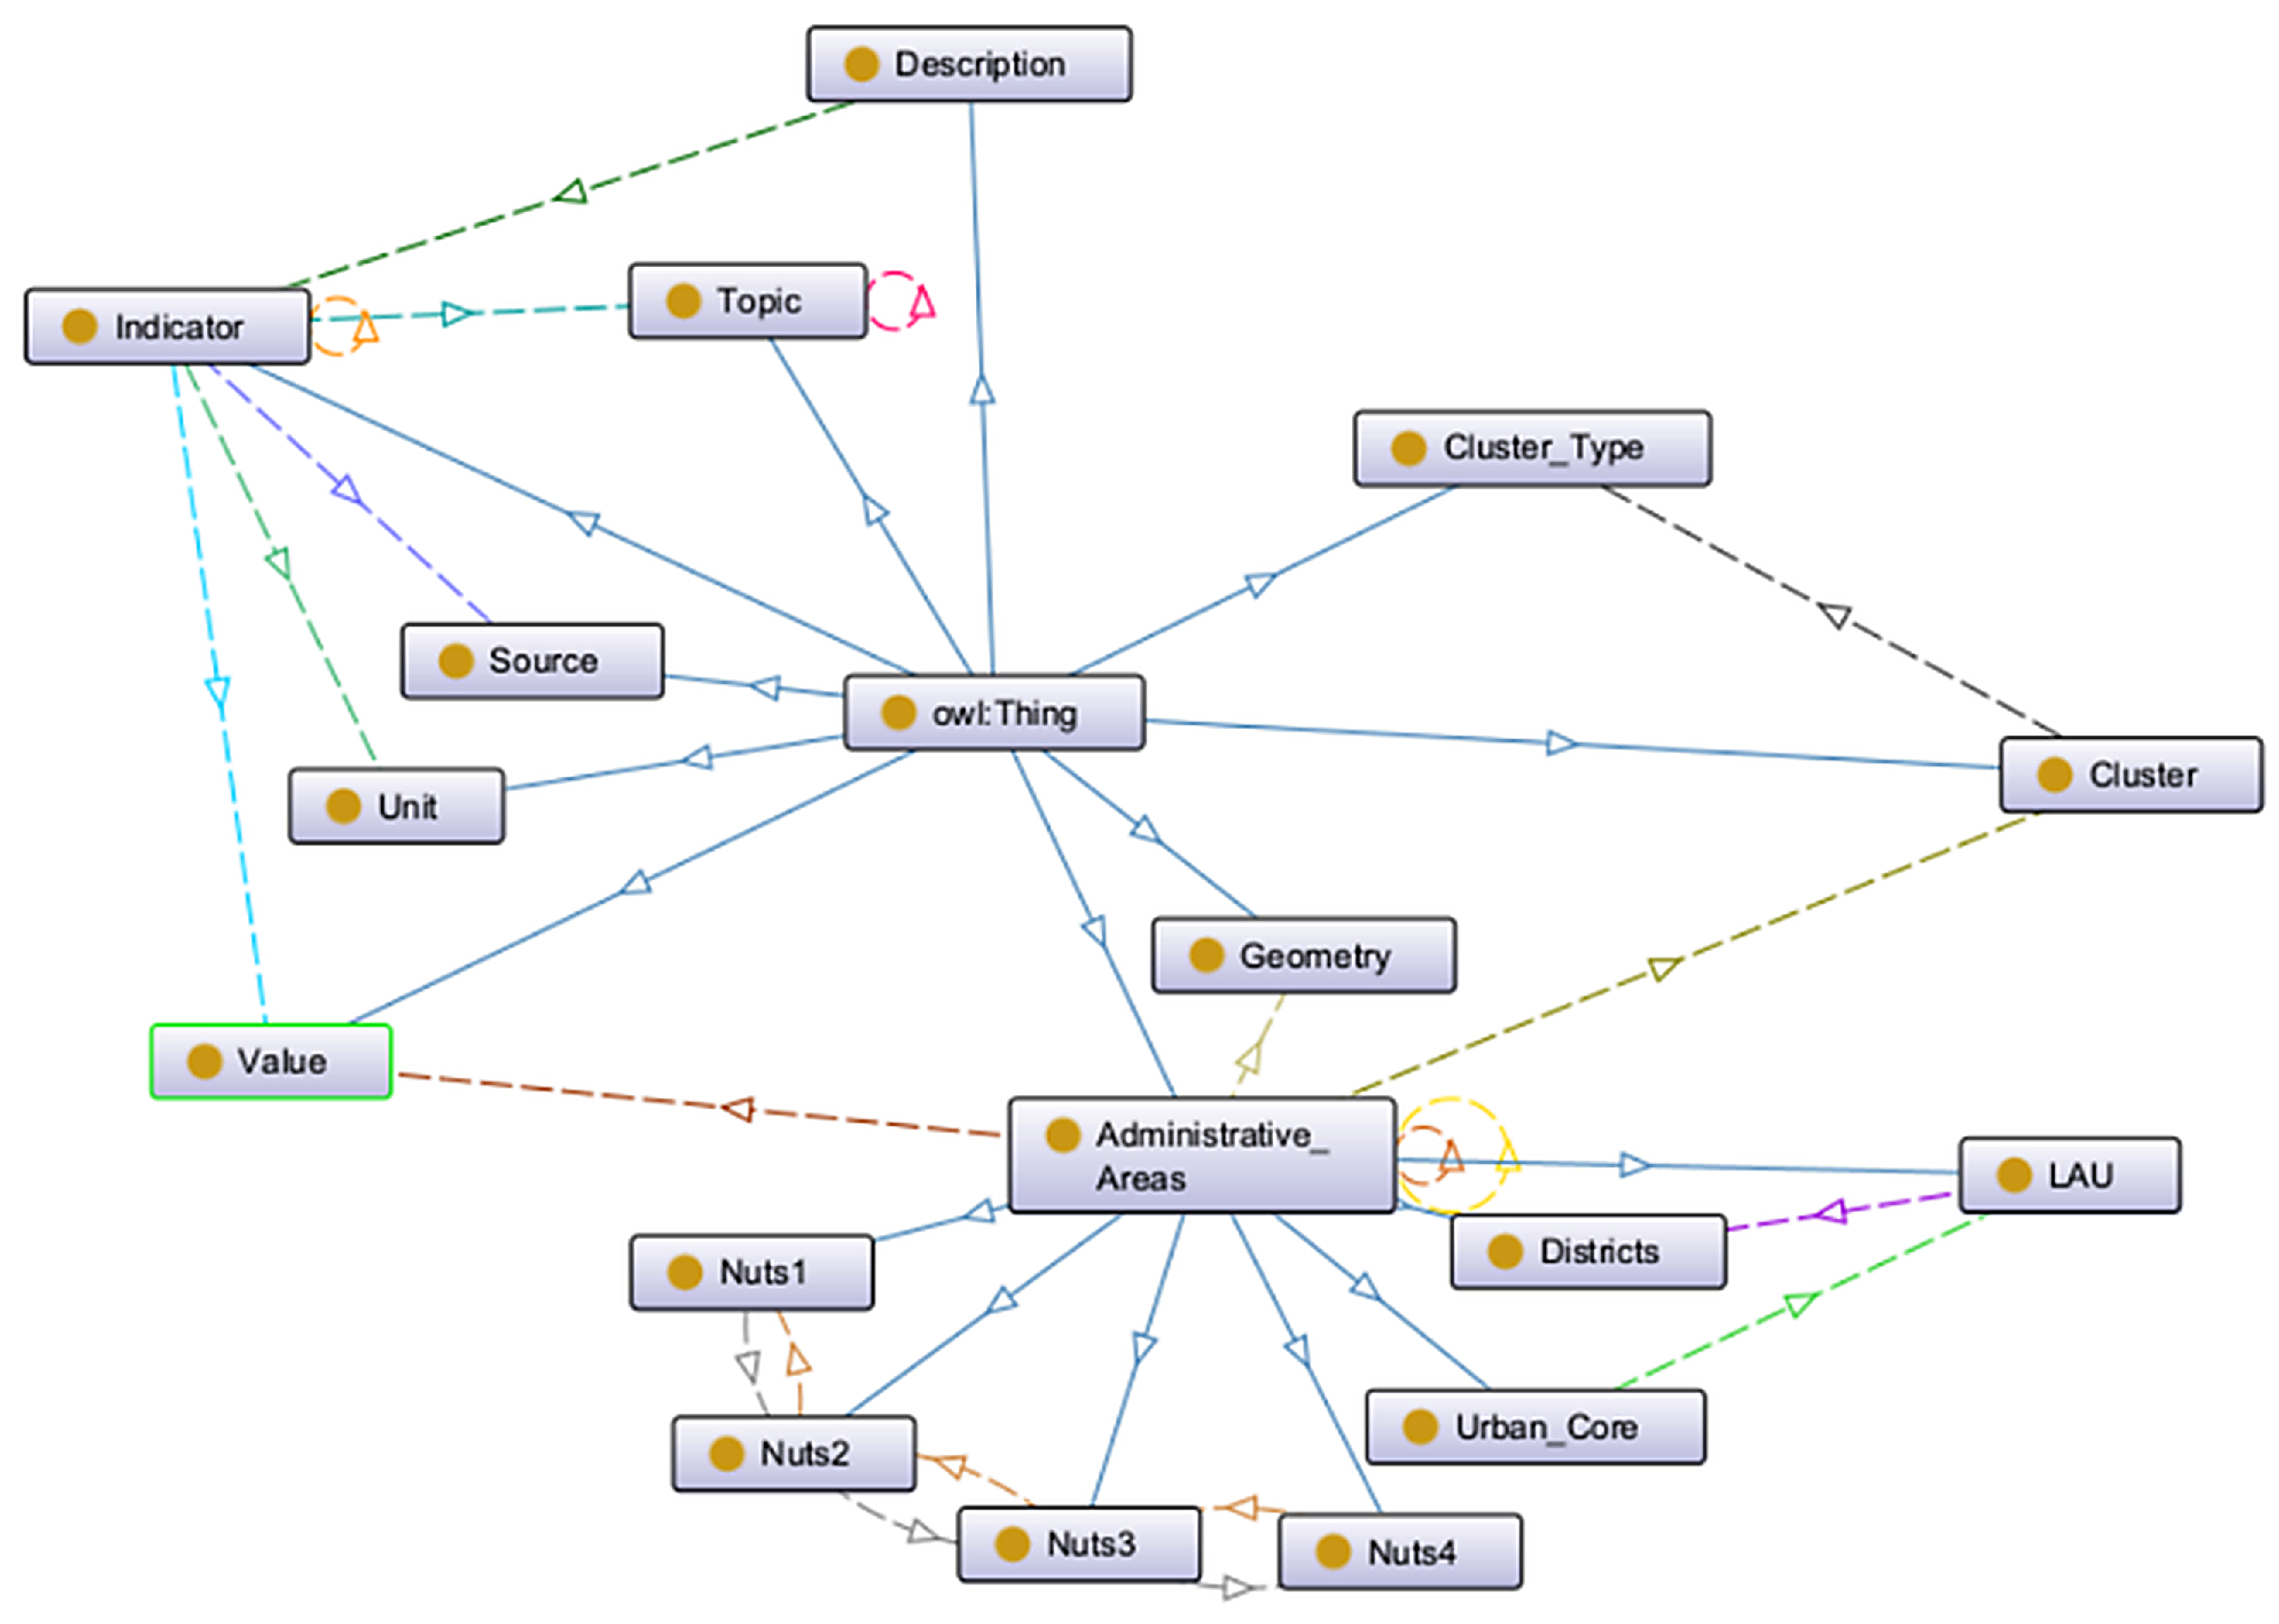
Key modelling components include (i) Topic for indicator definitions and semantic linking; and (ii) Facilitator and Indicator Catalogue for provenance, publisher metadata, and dataset organisation. To represent service disaggregation without generating a separate indicator for every service–subtype combination, the ontology adopts a two-level structure: Cluster encodes the main domain (e.g., education, healthcare), and ClusterType represents the internal category (e.g., secondary school, emergency care). This design, shown in Figure 3, preserves scalability while keeping all combinations queryable in SPARQL.
Figure 3.
Overview of the LoDCOREMadrid ontology used for modelling the indicators.
3.4.3. Output
The output is a set of RDF datasets exposed through a SPARQL endpoint, supporting reuse, cross-regional comparison, and integration with other LoDCOREMadrid indicators.
3.5. Web-Based Visualisation Platform Design
To promote accessibility and stakeholder engagement, an interactive web application was developed using OpenLayers, JavaScript ES6, and Flask. The web application is available on the online map viewer (http://lodcoremadrid-viewers.sel.inf.uc3m.es:8083/—accessed on 20 January 2026).
4. Results
This section presents the main findings derived from the computed indicators. The results are structured to address the research questions. Section 4.1 describes overall accessibility to education and healthcare services (RQ1) and identifies spatial disparities. Section 4.2 compares public transport and private car accessibility to highlight service gaps (RQ2). Section 4.3 examines how traffic and road infrastructure affect accessibility outcomes (RQ3). Finally, Section 4.4 presents a comparative benchmarking analysis between two European contexts (RQ4).
4.1. Accessibility to Educational and Healthcare Services
Accessibility to educational services in the Lazio Region displays clear differences across school levels. Table 3 summarises the distribution of distances from urban centres to the nearest kindergarten, primary, and secondary school, while Table 4 reports the corresponding travel times.
Table 3.
Summary statistics of school accessibility—distance (km).
Table 4.
Summary statistics of school accessibility—travel time (min).
Primary and kindergarten schools exhibit comparable accessibility levels, with similar average distances and travel times and no statistically significant differences between the two categories. By contrast, secondary schools are systematically less accessible. Although the values may appear “statistically proximate”, a repeated-measures ANOVA, accounting for multiple observations per urban centre, reveals a statistically significant effect of school level on both accessibility distance (F(2, 4130) = 43.92, p < 0.001) and travel time (F(2, 4130) = 57.69, p < 0.001). Post hoc paired comparisons with Bonferroni correction indicate that secondary schools are significantly less accessible than both kindergartens and primary schools (p < 0.001 in all cases), while no significant difference emerges between kindergarten and primary schools.
These results reflect the greater concentration of secondary schools in larger municipalities and their more limited territorial coverage in rural and mountainous areas. At the upper tail of the distribution, several peripheral urban centres exceed 30 km or 50 min of travel time. Overall, these results answer RQ1 and support H1: local educational services display relatively homogeneous and favourable accessibility, whereas access to secondary schools is more uneven and strongly affected by geographic isolation and population density.
Accessibility to healthcare services
Table 5 and Table 6 summarise the distribution of distances and travel times from urban centres to the nearest family doctor, hospital, and emergency unit. The results show clear differences in accessibility across service types.
Table 5.
Descriptive statistics for distance to health services (km).
Table 6.
Descriptive statistics for average time to health services (min).
Local services (family doctors) are the most accessible, with average distances below 5 km and relatively low variability.
Accessibility decreases sharply for hospitals and becomes critical for emergency units, which display the highest mean distance (35.26 km), longest travel times (38.14 min), and the widest spread of values.
This confirms that specialised and urgent care services are more centralised and less uniformly distributed across the region. Differences are also spatially structured. Peripheral and mountainous municipalities in the province of Rieti show the highest distances and travel times across all categories, often exceeding 50–60 min for emergency care. In contrast, Viterbo and Latina exhibit more homogeneous accessibility, with median values for hospitals below 20 min. The Rome metropolitan area combines good averages with substantial internal disparities: central municipalities are well served, but peri-urban and rural areas within ASL ROMA 4 experience significantly worse access.
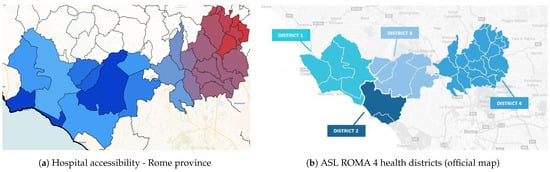
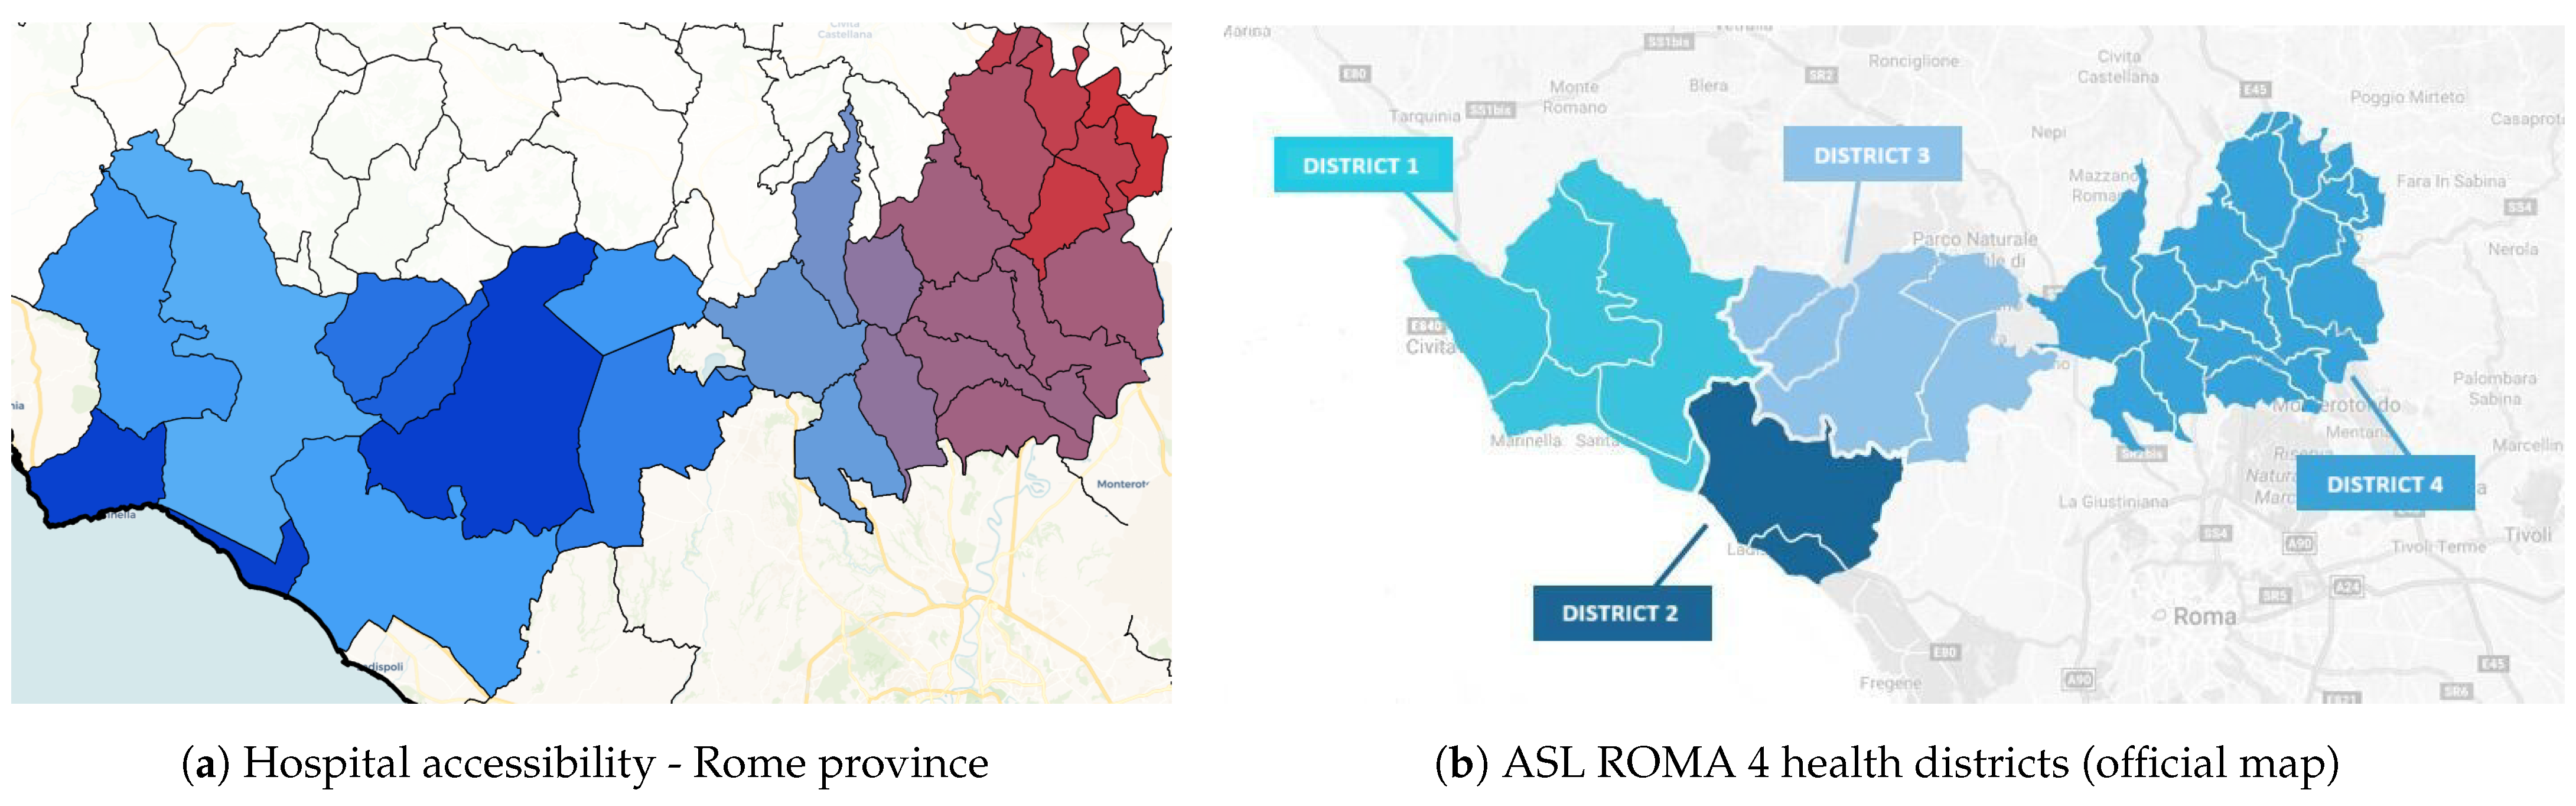
The maps in Figure 4 highlight that poor accessibility in the northern Rome province is not the result of missing data but of the organisational structure of ASL ROMA 4, whose hospital infrastructure is concentrated in Districts 1 and 2. Municipalities located in Districts 3 and 4 remain underserved despite belonging to the same health authority. This illustrates how accessibility indicators can reveal misalignments between administrative boundaries and infrastructure distribution.
Figure 4.
Territorial disparities due to health zone centralization in ASL ROMA 4.
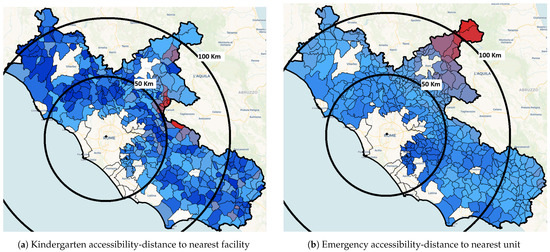
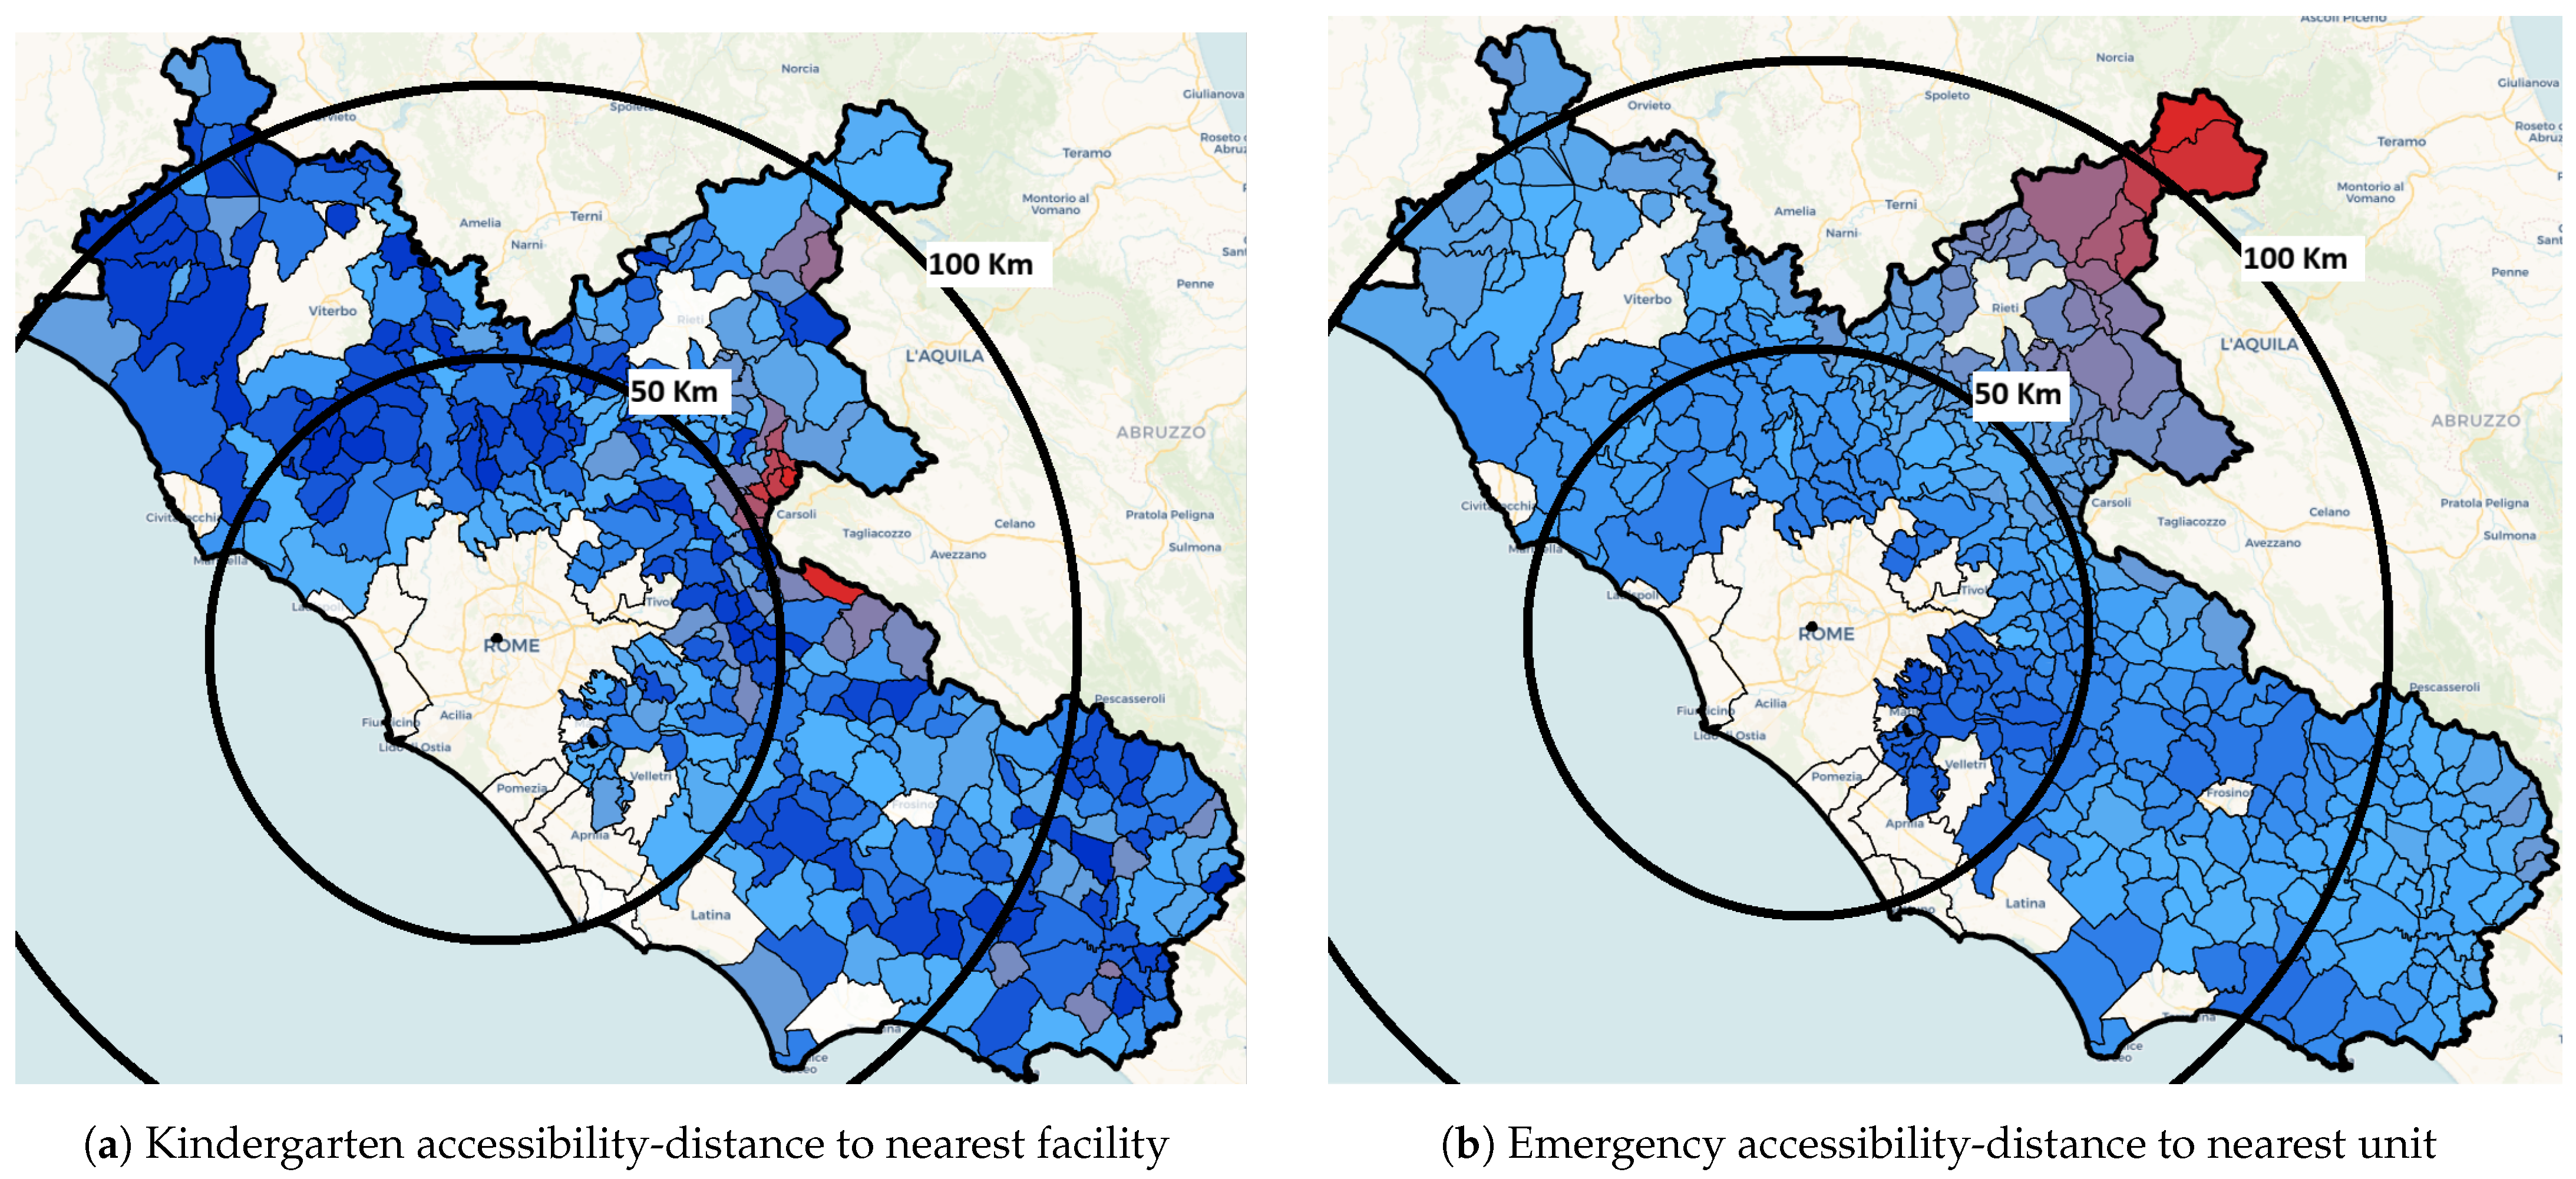
To further examine whether accessibility patterns vary systematically with distance from the capital, Figure 5 presents two illustrative examples using concentric 50 km and 100 km distance buffers centred on Rome. The first map refers to access to kindergarten services (local service), while the second depicts access to emergency units (specialized service). Colours range from dark blue (shorter distances; higher accessibility) to dark red (longer distances; lower accessibility).
Figure 5.
Accessibility gradients from Rome using 50 km and 100 km distance rings.
To assess whether these disparities present structured spatial gradients, accessibility patterns were analysed as a function of distance from Rome.
When accessibility is analysed in terms of distance from Rome, different spatial behaviours emerge depending on the type of service. For local services such as kindergarten, accessibility does not tend to deteriorate progressively as the distance from Rome increases, as dark-blue municipalities are also observed at large distances from the capital, indicating a non-monotonic pattern influenced by local factors such as terrain morphology and road quality.
On the contrary, emergency services show a more pronounced effect of distance from Rome: The best accessibility conditions are found in the municipalities closest to the capital, while worse accessibility conditions are observed in municipalities located far from Rome, particularly in the north-eastern mountainous areas. This can be clearly confirmed from the Figure 5, which highlights that the municipalities coloured in dark blue (better accessibility) are located in the first band within 50 km, and then as one moves away from the capital, the blue lightens until it turns red in the north-eastern areas of the region.
These spatial patterns indicate that proximity to the regional capital acts as a significant structuring factor of accessibility, particularly for higher-level and centralised services. The effect is less pronounced for local facilities, which remain more evenly distributed, but becomes dominant for example for emergency units. This provides additional support to H1, showing that accessibility disparities intensify with distance from Rome and interact with topographic constraints.
Overall, healthcare results strongly support H1: while local services show relatively homogeneous accessibility, hospitals and emergency units display pronounced intra-municipal and inter-provincial disparities, amplified by distance from Rome and the spatial concentration of specialised facilities. These combined results clarify the spatial structure of accessibility inequalities in Lazio, fully addressing RQ1.
4.2. Public Transport Accessibility to Educational Services
Public transport accessibility to educational services is substantially lower than car-based accessibility across all school levels.
As shown in Table 7, public transport journeys require on average 20–26 min more than car travel. Secondary schools experience the largest mean penalty (+25.95 min), followed by kindergartens (+24.16 min), while primary schools are slightly less affected (+20.59 min). This indicates that transit coverage is weakest for the most centralised education level, as formulated by the hypothesis H2. Furthermore, the same pattern occurs with health services: general medical services have access times to clinics by public transport that are more or less similar to those by car, while emergency services and hospitals are greatly affected by accessibility by public transport.
Table 7.
Difference in travel time between public transport and private car—education level.
The disparity is largely independent of physical distance. Correlation analysis shows that public transport travel time is almost perfectly associated with the accessibility gap (), whereas car travel times and distances have only weak associations (both ). A moderate association with public transport distance () suggests that indirect routes and low network connectivity further intensify delays. Maximum penalties close to three hours reveal municipalities where certain school levels are practically unreachable by transit.
When considering educational accessibility, extreme delays are observed in a small set of municipalities located in the eastern mountainous areas of the Lazio Region; detailed accessibility values for these municipalities, directly derived from the computed public transport and car-based accessibility indicators, are reported in Table 8. While network structure, topographic constraints, and distance from Rome emerge as the primary spatial drivers of poor public transport accessibility, these extreme cases are also likely influenced by socio-demographic conditions such as low population density.
Table 8.
Municipalities with the largest public transport penalties in educational accessibility: public transport (PT) vs. private car (car).
Although a systematic analysis of socio-economic determinants lies beyond the scope of this study, these findings highlight important territorial equity issues, as residents in small and remote municipalities face disproportionate accessibility penalties despite relatively short physical distances to services.
These findings therefore provide direct evidence for RQ2 and strong empirical support for H2, confirming that public transport accessibility is worse in more centralised services (secondary education, emergency services, and hospitals), but the analysis shows that the most severe penalties are in mountainous and peripheral municipalities.
4.3. Effect of Traffic and Road Infrastructure on Accessibility
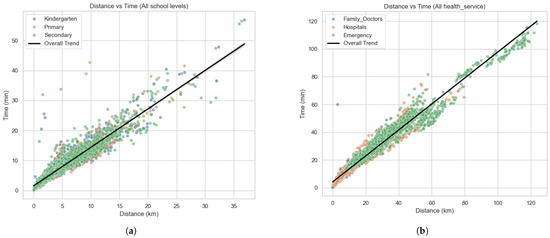
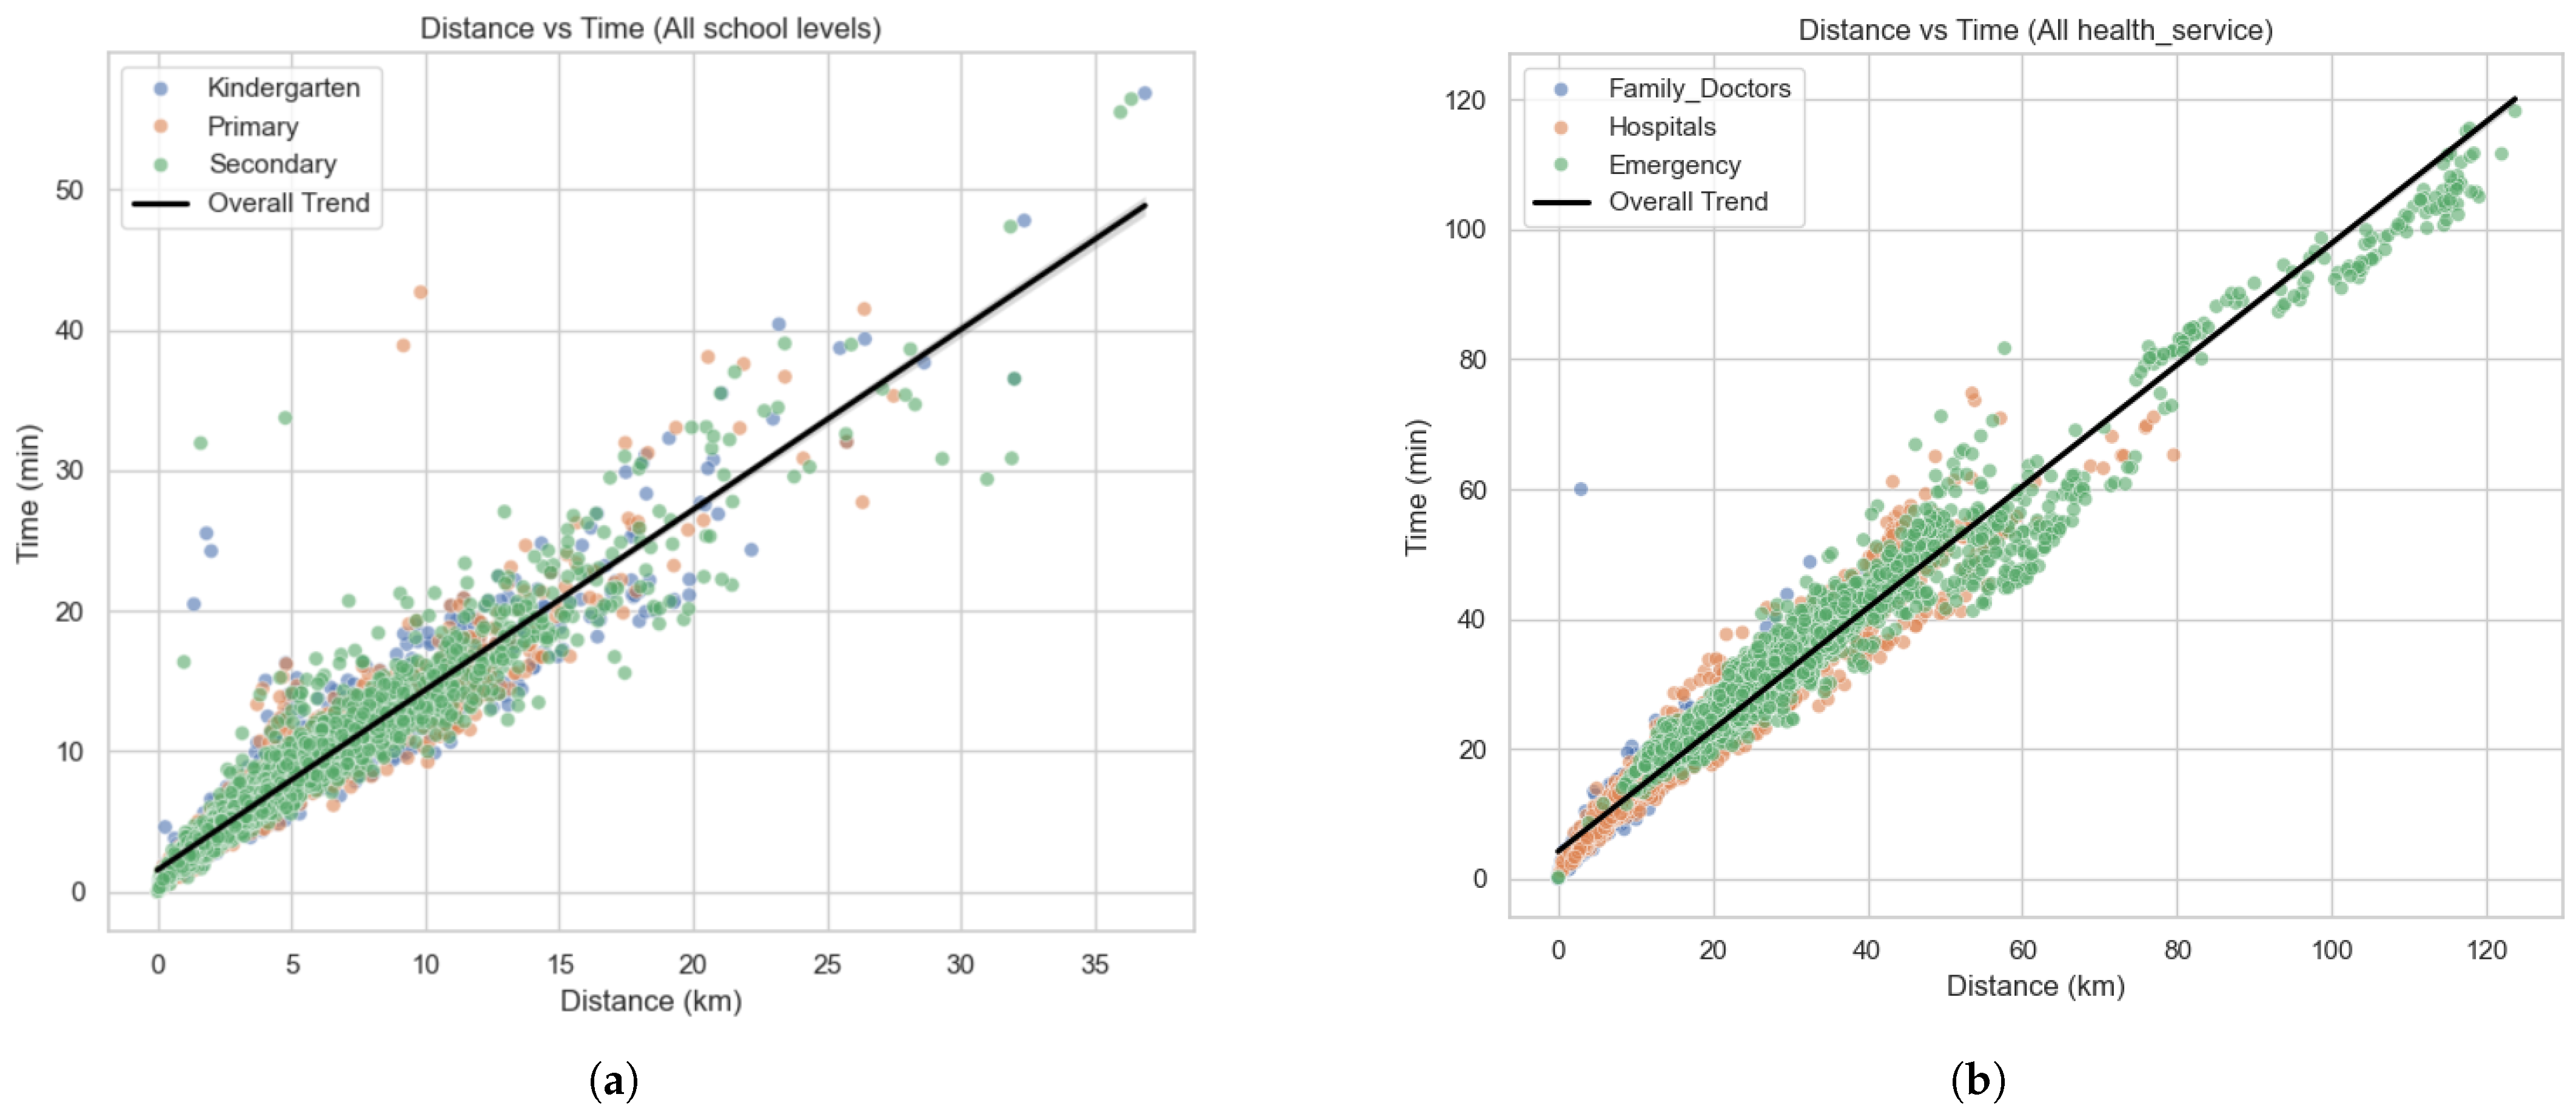
A comparison between travel distance and travel time reveals that traffic conditions and road infrastructure influence accessibility unevenly across service types. For educational services, the relationship between distance and time is strongly linear (Figure 6a, ), indicating that most urban centres experience predictable increases in travel time with longer distances. Nevertheless, several outliers, typically small or isolated towns, show disproportionately long travel times even for short distances, suggesting winding roads, indirect routes, or congestion in urbanised areas.
Figure 6.
Relationship between distance and travel time for (a) education and (b) healthcare.
Healthcare services display an even stronger correlation (Figure 6b, ), reflecting the dominant role of road transport in accessing hospitals and emergency units. However, deviations from the expected linear pattern are more severe for specialised services: in mountainous municipalities, emergency care can require over an hour of travel despite distances below 15 km, revealing critical infrastructural bottlenecks.
To illustrate which services are most affected by traffic, Table 9 reports the mean residuals between observed and expected travel time across all urban centres. Higher residuals correspond to a stronger impact of road conditions.
Table 9.
Average residuals between observed and expected travel time (time–distance model).
Overall, the analysis shows that secondary schools are the most affected among educational services, due to their higher centralisation and the need to reach larger towns via indirect routes. Hospitals and especially emergency units are the most impacted overall, showing the highest residuals and the largest deviations from the expected time–distance relationship. Traffic and road infrastructure have a much stronger effect on specialised services, where longer travel times are driven not only by distance but also by topographic barriers, low-speed roads, and limited direct connections.
These findings directly address RQ3, demonstrating that the severity of traffic-related accessibility penalties increases with service complexity. They also underline that distance alone is not an adequate proxy for accessibility, particularly for emergency care.
4.4. Benchmarking with the Community of Madrid
To contextualise the results obtained for the Lazio Region, a comparative analysis was conducted using equivalent accessibility indicators computed for the Community of Madrid. Although the methodologies were adapted to each regional context, the indicators are sufficiently harmonised to enable a meaningful cross-regional comparison.
Table 10 and Table 11 present the main descriptive statistics for distances and travel times to educational and healthcare services in both regions. Three key patterns emerge:
- Early education (Kindergarten) is slightly more accessible in Madrid, with lower mean distance and travel time, while primary schools are more accessible in Lazio, reflecting a denser distribution of basic education facilities;
- Secondary education exhibits the strongest disparities in both regions, but the accessibility penalty is significantly higher in Madrid (mean distance 7.72 km vs. 4.70 km; mean time 10.21 min vs. 7.70 min), suggesting a more centralised provision of higher-level education;
- Furthermore, for healthcare services, Madrid performs better for general medicine (although the Lazio region has a less centralised service than that of the Community of Madrid, where family doctors do not have their own surgeries but work alongside other doctors in clinics located throughout the city), while Madrid performs better for emergency services, with substantially lower mean travel times (25.47 min vs. 37.21 min in Lazio);
- Hospital accessibility shows mixed results, with shorter distances in Lazio, but slightly shorter travel times in Madrid; this may indicate improved road infrastructure and effective traffic management.
Table 10.
Accessibility distance (km) in Lazio and Madrid.
Table 11.
Accessibility time (min) in Lazio and Madrid.
Overall, both regions exhibit highly accessible metropolitan cores and a progressive decline toward peripheral and mountainous areas. In Madrid, lower accessibility is concentrated in the northern part of the region, while in Lazio, it is more pronounced in the eastern mountainous belt. In both cases, this pattern is driven by topography and increasing distance from the capital. However, Lazio’s more dispersed settlement structure produces more extreme outliers in remote municipalities, whereas Madrid shows stronger service centralisation.
To further explore the accessibility data of Madrid, an interactive map viewer with the accessibility indicator of the Comunidad de Madrid (http://lodcoremadrid-viewers.sel.inf.uc3m.es:8081/—accessed on 20 January 2026) is available.
5. Discussion
The results highlight both the strengths and limitations of service accessibility in Lazio; while the methodology enabled fine-grained quantification of disparities, its main contribution lies in contextualising these findings through cross-regional benchmarking and comparative analysis.
5.1. Contribution and Relation to Previous Research
This study refines and, in part, challenges common practices in accessibility analysis by addressing two persistent limitations of existing approaches. First, it questions the widespread reliance on static municipality-level aggregates and arbitrary contour thresholds typical of cumulative opportunity measures [3,10]. By adopting urban centres as the spatial unit and deriving travel cost from time-dependent, network-based routing that accounts for traffic conditions (Google Distance Matrix), the proposed framework reduces modifiable areal unit bias and improves interpretability at policy-relevant spatial scales. Second, it strengthens equity diagnostics through population-weighted aggregation and explicit reporting of intra-municipal variability.
Relative to gravity and utility based models, the proposed method is less suited to behavioural inference or welfare analysis, as it does not rely on discrete-choice calibration or preference estimation. However, it is well aligned with data-scarce planning contexts because it is parameter-light and relies on transparent inputs (network-based travel times/distances and population) that are widely available.
The novelty of the framework lies in an end-to-end workflow that integrates (i) traffic-aware, time-dependent routing, (ii) urban-centre scale indicators that capture intra-municipal disparities, and (iii) standardised semantic publication, enabling interoperability and cross-regional policy benchmarking (see Section 5.2).
Regarding 2SFCA-style models, which typically require catchment definitions, capacity and demand assumptions, and calibrated decay functions, the present implementation deliberately omits supply–demand components due to the limited availability of harmonised capacity data; this extension is therefore left for future work.
In line with European evidence bases such as ESPON’s work on inner peripheries and territorial inequalities [25], the results confirm that peripheral and mountainous areas exhibit systematically lower accessibility even when absolute distances are moderate, highlighting the role of network efficiency and multimodal supply. The benchmark with the Community of Madrid further supports the transferability of the workflow, as comparable patterns emerge under similar demographic and infrastructural conditions.
In synthesis, the contribution is fourfold: (1) a fine-grained, centre-based, traffic-aware impedance measure; (2) explicit representation of intra-municipal inequality; (3) a reproducible workflow suited to routine updates; and (4) an open semantic publication layer enabling interoperability and cross-regional benchmarking.
5.2. Open Publication, Interoperability and Benchmarking
A key strength of this study is the semantic publication of accessibility indicators as Linked Open Data (LOD). By adopting a shared ontology [9], the data model ensures consistent identification of places, services, and indicators, enabling interoperability, reuse, and integration with complementary territorial dimensions (e.g., attractiveness) within the same semantic framework [8]. This publication strategy also facilitates cross-regional benchmarking: indicators can be queried and compared across territories using the same definitions, supporting comparative monitoring and evidence-based planning beyond single-case analyses [36,37,38]. In operational terms, the indicators are accessible through an interactive viewer (http://lodcoremadrid-viewers.sel.inf.uc3m.es:8082/—accessed on 20 January 2026) and a microservice API (https://attractiveness-api.sel.inf.uc3m.es/—accessed on 20 January 2026), allowing integration into existing analytical workflows.
5.3. Methodological Insights
Beyond simple indicator computation, the platform demonstrates how accessibility analysis can support multiple layers of spatial diagnostics. The public transport vs. car analysis, for instance, shows that accessibility gaps are rarely about physical distance, but rather about structural inefficiencies in the public transport network. The strong correlation between public transport time and the accessibility gap () confirms that improving route coverage, frequency, and inter-modality could significantly reduce inequalities. Similarly, the analysis of residuals between time and distance identifies critical outliers, enabling planners to detect areas where infrastructure bottlenecks or disconnected road networks distort otherwise predictable patterns.
The proposed approach bridges the gap between classical spatial separation models and more complex interaction-based methods. By incorporating both travel distance and time, and population weighting, it provides a balanced representation of accessibility that remains interpretable while accounting for demographic relevance. Unlike gravity or utility-based models [10], it does not rely on calibration parameters or behavioural assumptions, which makes it particularly robust and transferable when detailed travel survey data are unavailable.
At the same time, the inclusion of variability metrics (standard deviation) adds an additional diagnostic layer, allowing the detection of uneven service distribution within the same urban centre.
Moreover, the methodology has proven to be transferable beyond the Italian case study. By relying on open and linked data, together with approximation techniques that remain simple and interpretable, the approach can be applied in different European contexts. This makes it a valuable tool for local administrations and planning bodies, providing comparable accessibility indicators that can inform policy design, prioritize investments, and monitor territorial inequalities over time. These spatial patterns and methodological outcomes are consistent with findings from previous accessibility research using potential-based and floating catchment approaches [3]. Similar subregional peripheral gradients have been reported in other European case studies [10,24], confirming that distance- and time-based accessibility indicators can effectively capture territorial cohesion gaps at multiple scales.
5.4. Policy Relevance
The indicators are designed to be both scalable and interpretable, enabling not just technical analysis but also direct policy applications. As seen in the standard deviation maps and correlation matrices, the methodology supports decision-makers in identifying where interventions are most urgent, not only in terms of which municipalities are underserved, but also which ones suffer from inconsistency or unpredictability in service access. This is especially relevant in the field of education and healthcare, where continuity and reliability are crucial.
From a citizen perspective, accessibility is not only a technical metric but a tangible determinant of opportunity and well-being. The OECD [39] and WHO [40] frameworks emphasise that reducing average travel times to essential services directly improves quality of life, health outcomes, and social inclusion. In the context of healthcare, faster access to emergency and primary care can significantly influence survival rates and treatment effectiveness, reinforcing the social and ethical importance of addressing spatial inequalities identified in this study.
5.5. Scalability and Adaptability
Finally, the modular structure of the methodology enables future extensions. Additional services can be integrated, alternative transport modes (e.g., cycling, ride-sharing) evaluated, and demographic data (e.g., age structure, socio-economic status) incorporated to refine equity assessments. Moreover, the tools developed are not tied to a specific region and can be adapted to other contexts with similar open data availability.
5.6. Limitations
A key limitation of this study concerns the availability of public transport data. Many local transport providers in the Lazio Region do not publish GTFS feeds or make their routes accessible via routing platforms like Google Maps. As a result, the analysis of public transport accessibility was limited to the Province of Rome, and even there, some routes had to be manually collected due to missing open data. This significantly reduces the scalability and automation potential of the methodology, limiting its ability to be updated over time and its application to other territories.
6. Conclusions
This study demonstrates the feasibility and value of a data-driven framework for assessing spatial accessibility to education and healthcare services at a fine spatial resolution. By combining open geospatial and demographic data with time-dependent routing, the proposed workflow generates interpretable indicators of distance and travel time from urban centres, enabling the detection of both inter- and intra-municipal inequalities. The benchmarking with the Community of Madrid further supports the transferability of the approach and provides an external reference for interpreting territorial gradients of accessibility.
Beyond indicator production, the semantic publication layer enables interoperability and reuse: accessibility indicators can be queried, combined, and compared across domains and territories, supporting integrated planning applications and long-term monitoring within an open-data infrastructure.
Future developments include two main directions. First, integrating supply–demand dynamics would allow the assessment of service adequacy by relating accessibility to service capacity and population needs. Second, artificial intelligence techniques could support automated data updates, anomaly detection, and scenario-based forecasting of service coverage under alternative planning strategies. These extensions would strengthen the framework as a practical tool for evidence-based and equity-oriented territorial governance.
Author Contributions
Conceptualization, J.G.G.; Methodology, K.G. and J.G.G.; Software, K.G.; Validation, K.G., E.B.R. and A.C.T.; Formal Analysis, K.G. and J.G.G.; Investigation, K.G. and J.G.G.; Resources, J.G.G.; Data Curation, K.G.; Writing—Original Draft Preparation, K.G.; Writing—Review and Editing, J.G.G., E.B.R. and A.C.T.; Visualization, K.G.; Supervision, J.G.G.; Project Administration, J.G.G.; Funding Acquisition, E.B.R. and A.C.T. All authors have read and agreed to the published version of the manuscript.
Funding
The authors disclose receipt of the following financial support for the research, authorship, and/or publication of this article: This research is developed as part of the LoDCOREMadrid project, funded by the Regional Ministry of the Presidency, Justice and Local Administration, through the Directorate-General for Territorial Rebalancing of the Community of Madrid, collaborating together with the Department of Computer Science and Engineering of Carlos III University of Madrid.
Institutional Review Board Statement
Not applicable.
Informed Consent Statement
Informed consent was obtained from all subjects involved in the study.
Data Availability Statement
Data Availability Statements are available on the interactive map viewer available online at http://lodcoremadrid-viewers.sel.inf.uc3m.es:8083/—accessed on 20 January 2026).
Acknowledgments
We would like to thank the team of LODCore Madrid project for their insightful support during the stages of this research and acknowledge the use of generative AI tools (OpenAI, San Francisco, CA, USA; model: GPT-4) only to support language refinement and clarity during the manuscript preparation.
Conflicts of Interest
The authors declare no potential conflicts of interest with respect to the research, authorship, and/or publication of this article.
References
- Bibri, S.E.; Krogstie, J. Smart Sustainable Cities of the Future: An Extensive Interdisciplinary Literature Review. Sustain. Cities Soc. 2017, 31, 183–212. [Google Scholar] [CrossRef] [Scilit]
- Parra-Domínguez, J.; López-Blanco, R.; Pinto-Santos, F. Approach to the Technical Processes of Incorporating Sustainability Information—The Case of a Smart City and the Monitoring of the Sustainable Development Goals. Processes 2022, 10, 1651. [Google Scholar] [CrossRef] [Scilit]
- Geurs, K.T.; van Wee, B. Accessibility Evaluation of Land-Use and Transport Strategies: Review and Research Directions. J. Transp. Geogr. 2004, 12, 127–140. [Google Scholar] [CrossRef] [Scilit]
- Páez, A.; Scott, D.M.; Morency, C. Measuring Accessibility: Positive and Normative Implementations of Various Accessibility Indicators. J. Transp. Geogr. 2012, 25, 141–153. [Google Scholar] [CrossRef] [Scilit]
- Ferreira, A.; Beukers, E.; Bremmelstroet, M.T. Accessibility is Gold, Mobility is Not: A Proposal for the Improvement of Dutch Transport-Related Cost-Benefit Analysis. Environ. Plan. B Plan. Des. 2012, 39, 683–697. [Google Scholar] [CrossRef] [Scilit]
- ISTAT. Atlante Statistico dei Comuni; Istituto Nazionale di Statistica: Rome, Italy, 2022. [Google Scholar]
- OECD. Territorial Review of Italy; Organisation for Economic Co-Operation and Development: Paris, France, 2020. [Google Scholar]
- Ortiz Guiño, A.A. Un Visor Web GIS para Explorar la Comunidad de Madrid: Cohesión Territorial a Escala Municipal. Bachelor’s Thesis, Universidad Carlos III de Madrid, Leganés, Spain, 2025. [Google Scholar]
- UC3M. LoDCOREMadrid Project Ontology. An Ontology for Publishing Territorial Indicators as Linked Open Data. 2024. Available online: https://lodcoremadrid.es/ontology/myOntology/doc/index-en.html (accessed on 20 January 2026).
- Kompil, M.; Jacobs-Crisioni, C.; Dijkstra, L.; Lavalle, C. Mapping Accessibility to Generic Services in Europe: A Market-Potential Based Approach. Sustain. Cities Soc. 2019, 47, 101372. [Google Scholar] [CrossRef] [Scilit]
- Mohri, S.S.; Mortazavi, S.; Nassir, N. A Clustering Method for Measuring Accessibility and Equity in Public Transportation Service: Case Study of Melbourne. Sustain. Cities Soc. 2021, 74, 103241. [Google Scholar] [CrossRef] [Scilit]
- Xia, Y.; Chen, H.; Zuo, C.; Zhang, N. The Impact of Traffic on Equality of Urban Healthcare Service Accessibility: A Case Study in Wuhan, China. Sustain. Cities Soc. 2022, 86, 104130. [Google Scholar] [CrossRef] [Scilit]
- Tahmasbi, B.; Mansourianfar, M.H.; Haghshenas, H.; Kim, I. Multimodal Accessibility-Based Equity Assessment of Urban Public Facilities Distribution. Sustain. Cities Soc. 2019, 49, 101633. [Google Scholar] [CrossRef] [Scilit]
- Tao, Z.; Yao, Z.; Kong, H.; Duan, F.; Li, G. Spatial accessibility to healthcare services in Shenzhen, China: Improving the multi-modal two-step floating catchment area method by estimating travel time via online map APIs. BMC Health Serv. Res. 2018, 9, 345. [Google Scholar] [CrossRef] [Scilit]
- Tsou, K.-H.; Hung, Y.-T.; Chang, Y.-L.; Chen, C.-L. An Accessibility-Based Integrated Measure for Evaluating Urban Public Facilities. Geogr. Anal. 2005, 37, 30–49. [Google Scholar] [CrossRef] [Scilit]
- Arranz-López, A.; Antón-Alonso, F.; García-Palomares, J.C.; Gutiérrez, J. Public Transport Accessibility and Social Inequality in Metropolitan Areas: The Case of Madrid. Transp. Res. Part A Policy Pract. 2019, 121, 105–122. [Google Scholar] [CrossRef] [Scilit]
- Rad, T.G.; Alimohammadi, A. Modeling Relationships between the Network Distance and Travel Time Dynamics for Assessing Equity of Accessibility to Urban Parks. Geo-Spat. Inf. Sci. 2021, 24, 509–526. [Google Scholar] [CrossRef] [Scilit]
- Patroumpas, K.; Georgomanolis, N.; Stratiotis, T.; Alexakis, M.; Athanasiou, S. Exposing INSPIRE on the Semantic Web. J. Web Semant. 2015, 35, 53–62. [Google Scholar] [CrossRef] [Scilit]
- Ivánová, I.; Fa, J.S.H.; McMeekin, D.A.; Arnold, L.M.; Deakin, R.; Wilson, M. From Spatial Data to Spatial Knowledge Infrastructure: A Proposed Architecture. Trans. GIS 2020, 24, 1526–1558. [Google Scholar] [CrossRef] [Scilit]
- Shaparev, N.; Yakubailik, O. Usage of Web Mapping Systems and Services for Information Support of Regional Management. MATEC Web Conf. 2016, 79, 01081. [Google Scholar] [CrossRef] [Scilit]
- Hawkins, A. Enriching, Empowering, and Future-Proofing: The Benefits of Linked (Open) Data for Archives. Doctoral Dissertation, University of Liverpool, Liverpool, UK, 2022. [Google Scholar]
- Bizer, C.; Heath, T.; Berners-Lee, T. Linked Data The Story So Far. In Linking the World’s Information: Essays on Tim Berners-Lee’s Invention of the World Wide Web; Seneviratne, O., Hendler, J., Eds.; Association for Computing Machinery: New York, NY, USA, 2023; pp. 115–143. [Google Scholar] [CrossRef] [Scilit]
- Zotti, M.; La Mantia, C. Open Data from Earth Observation: From Big Data to Linked Open Data, through INSPIRE. J. e-Learn. Knowl. Soc. 2014, 10, 91–100. [Google Scholar]
- ESPON EGTC. PROFECY: Processes, Features and Cycles of Inner Peripheries in Europe; Applied Research Final Report—Executive Summary; ESPON EGTC: Luxembourg, 2017; Available online: https://archive.espon.eu/sites/default/files/attachments/D5%20Executive%20Summary%20PROFECY.pdf (accessed on 20 January 2026).
- ESPON EGTC. PROFECY: Processes, Features and Cycles of Inner Peripheries in Europe; Applied Research Final Report—Annex 2: Datasets and Database; ESPON EGTC: Luxembourg, 2017; Available online: https://archive.espon.eu/sites/default/files/attachments/D5%20Annex%202.%20Datasets%20and%20Database.pdf (accessed on 20 January 2026).
- Openpolis and Con i Bambini. Educational Opportunities Furthermore, Depend on School Accessibility. 2023. Available online: https://www.openpolis.it/le-opportunita-educative-dipendono-anche-dallaccessibilita-delle-scuole/ (accessed on 15 May 2025).
- Pelzer, P. Usefulness of Planning Support Systems: A Conceptual Framework and an Empirical Illustration. Comput. Environ. Urban Syst. 2015, 54, 229–239. [Google Scholar] [CrossRef] [Scilit]
- te Brömmelstroet, M. Characteristics of the Usefulness of Planning Support Systems: Findings from a Review of Dutch Planning Practice. Environ. Plan. B Urban Anal. City Sci. 2017, 44, 570–591. [Google Scholar]
- ESPON EGTC. Accessibility Update 2014 (NUTS 3, Version 2013); Source: ESPON EGTC, TOWN 2014; UMS RIATE: Paris, France, 2016. [Google Scholar]
- Jacobs-Crisioni, C.; Kompil, M.; Dijkstra, L. Big in the neighbourhood: Identifying local and regional centres through their network position. Pap. Reg. Sci. 2023, 102, 421–458. [Google Scholar] [CrossRef] [Scilit]
- Verachtert, E.; Mayeres, I.; Vermeiren, K.; Van der Meulen, M.; Vanhulsel, M.; Vanderstraeten, G.; Poelmans, L. Mapping Regional Accessibility of Public Transport and Services in Support of Spatial Planning: A Case Study in Flanders. Land Use Policy 2023, 133, 106873. [Google Scholar] [CrossRef] [Scilit]
- UNE. Smart Territories. Definition, Attributes and Requirements. 2016. Available online: https://www.une.org/encuentra-tu-norma/busca-tu-norma/norma?c=N0069862 (accessed on 26 May 2025).
- Magro Garrote, M.A. Geospatial Platform for Public Services Accessibility in the Community of Madrid. Bachelor’s Thesis, Universidad Carlos III de Madrid, Leganés, Spain, 2025. [Google Scholar]
- Ballas, D.; Clarke, G.; Dorling, D.; Eyre, H.; Thomas, B.; Rossiter, D. Geocomputation: A Primer; Routledge: London, UK, 2006. [Google Scholar]
- Longley, P.A.; Goodchild, M.F.; Maguire, D.J.; Rhind, D.W. Geographic Information Systems and Science, 3rd ed.; Wiley: Chichester, UK, 2015. [Google Scholar]
- Berners-Lee, T. Linked Data—Design Issues. World Wide Web Consortium. 2006. Available online: https://www.w3.org/DesignIssues/LinkedData.html (accessed on 11 May 2025).
- Chiarcos, C.; Cimiano, P.; Declerck, T.; Crae, J.P.M. Linguistic Linked Open Data (LLOD) Introduction and Overview. In Proceedings of the 12th International Conference on Computational Linguistics and Intelligent Text Processing, Tokyo, Japan, 20–26 February 2011; Association for Computational Linguistics: Pisa, Italy, 2013; pp. 7–14. [Google Scholar]
- Ullah, I.; Khusro, S.; Ullah, A.; Naeem, M. An Overview of the Current State of Linked and Open Data in Cataloging; Technical Report; University of Peshawar: Peshawar, Pakistan, 2018. [Google Scholar]
- OECD. Rural Well-Being: Geography of Opportunities; Organisation for Economic Co-Operation and Development: Paris, France, 2022. [Google Scholar]
- World Health Organization (WHO). Improving Access to Healthcare in the European Region; World Health Organization, Regional Office for Europe: Geneva, Switzerland, 2021. [Google Scholar]



Disclaimer/Publisher’s Note: The statements, opinions and data contained in all publications are solely those of the individual author(s) and contributor(s) and not of MDPI and/or the editor(s). MDPI and/or the editor(s) disclaim responsibility for any injury to people or property resulting from any ideas, methods, instructions or products referred to in the content. |
© 2026 by the authors. Licensee MDPI, Basel, Switzerland. This article is an open access article distributed under the terms and conditions of the Creative Commons Attribution (CC BY) license.