


Abstract
Multiphasic calcium phosphate (CaP) composites made of hydroxyapatite (HAp), α-tricalcium phosphate (α-TCP), or β-tricalcium phosphate (β-TCP) are promising for biomedical applications. In this paper, the changes in Raman spectra of a series of HAp/α-TCP and HAp/β-TCP were calibrated and new algorithms using microRaman spectroscopy were established for an efficient and quantitative analysis of the constituent phases in multiphasic CaP systems, taking advantages of their characteristic Raman bands. The reliability of the proposed Raman algorithms was further examined and verified by the investigation of a tri-phase CaP mixture and thermally treated monolithic ceramics of HAp, α-TCP and β-TCP using both Raman and XRD analyses. The results demonstrated the applicability of the proposed method for quantitative phase evaluation, as well as higher sensitivity of Raman spectroscopy to nonstoichiometric alteration for more precise phase control and quality evaluation in the presence of defects in multiphasic CaP systems.
1. Introduction
Calcium phosphate, CaP-based ceramics have been widely used as artificial bone, bone graft materials, and implant coatings, and are even considered as a promising approach for the treatment of bone infections, due to their excellent biocompatibility, bone conduction properties and the ability to be engineered for controlled drug delivery [1,2,3,4,5,6]. In particular, among the family of calcium phosphates, hydroxyapatite (HAp, Ca10(PO4)6(OH)2) has the same crystal structure as the inorganic main component of natural bone and is exceptionally biocompatible, chemically stable and sparingly soluble, thus widely utilized in medical implants, bone grafts, and dental care, whereas tricalcium phosphate (TCP, Ca3(PO4)2) exhibits excellent resorbability and solubility in vivo and can be used to promote bone replacement and regeneration [7,8].
In general, TCP exists in multiple polymorphic forms with different temperature dependencies: the most representative phases are β-TCP, stable at low temperatures, and α-TCP, which is stable at high temperatures with a crystallization temperature of 1125 °C, but can be maintained as a metastable phase by rapid cooling to room temperature [9,10]. α-TCP is more soluble and can react with water to form self-hardening calcium phosphate cement, so it has been used for applications different from those of β-TCP, which exhibits superior osteoconductive properties [11].
Therefore, in a multiphasic calcium phosphate CaP system made of two or more phases (i.e., HAp, α-TCP, or β-TCP coexist), HAp exhibits lower solubility in aqueous media and consequently a slower resorption rate, compared to either α-TCP or β-TCP and thus can maintain structural integrity as a more stable phase under physiological conditions, while the highly biodegradable TCP is resorbed to create space for new bone formation [3,7]. Accordingly, the reactivity of biphasic/triphasic CaP systems composed of HAp and TCP increases as the TCP/HA ratio increases, and the in vivo bioresorbability/biodegradation rate, bioactivity and osteoconductivity of the materials can be adjusted by tuning the phase composition fractions [9]. The calcium-to-phosphorus atomic ratio and the solubility of these compounds define their behavior in a physiological environment [3]. Indeed, for the biphasic calcium phosphate (BCP), HAp/β-TCP composite material, material design for adjusting the rate of in vivo resorption has been attempted by controlling the ratio of the two phases [12]. Accordingly, an accurate determination of the amount of each phase is extremely important for controlling the material’s resorption rate, mechanical properties, and in vivo behavior.
Rietveld analysis using X-ray diffraction (XRD) is a routine method for qualitative/quantitative evaluation of phase composition in composites [13]. However, because XRD uses a large X-ray spot size, it provides only average information about the entire sample and has limitations in detecting phase distributions in localized regions or trace amounts of second and third phases. In contrast, Raman spectroscopy exhibits strong sensitivity to atomic vibrational alterations with high spatial and spectral resolutions and can evaluate the microstructure of a composite in localized regions non-destructively and rapidly [14,15,16], which makes it attractive as an effective method for phase identification and phase monitoring, as well as the analysis of structural alterations in calcium phosphate-based materials [17,18,19,20,21,22].
The Raman spectra of calcium phosphate compounds are all characterized by a set of bands originating from the internal vibrational modes of the functional group PO4 [23]. In particular, the symmetric stretching vibration ν1 band of CaP shows a dependence on the crystal structure of each phase and the distortion of PO4 and can be used as an indicator for phase identification. According to previous reports, the position of the ν1 band is known to be located at near 960 cm−1 in HAp and varies in the range from 920 to 1000 cm−1 in α-TCP or β-TCP [23,24]. Although phase identification of HAp/TCP composites using differences in the positions and widths of their respective Raman bands has been reported [22,24], the spectral line shape of the overall ν1 Raman band of a multiphasic CaP can be quite complex because of the overlapping of different peaks of the constituent components, which requires a reliable spectral deconvolution for quantitative phase evaluation. In addition, the correlations between respective Raman band intensities and the actual component content for different phases and quantitative analysis algorithms for determining the weight fractions in CaP systems based on Raman band variations have not yet been fully established. Therefore, the objective of this study was to systematically calibrate the changes in Raman band intensity for each phase in different CaP systems using a series of mixtures of the three components—HAp, α-TCP, and β-TCP—and to develop new quantitative analysis algorithms applicable to bi/tri-phasic CaP systems, taking advantages of their characteristic Raman bands. The reliability of the Raman algorithms was then examined and verified on a tri-phase CaP mixture and three thermally treated monolithic ceramics of HAp, α-TCP, and β-TCP, using both Raman and XRD analyses. The established method can also be expected for quantitative evaluation of phase composition distribution in microscopic regions by Raman mapping, contributing to the phase control and quality evaluation in CaP systems for biomedical applications.
2. Experimental Procedure
In this study, in order to correlate the variation in Raman spectrum with the composition change in multiphasic calcium phosphate systems, HAp, α-TCP, and β-TCP powders (FUJIFILM Wako Pure Chemical Corporation, Osaka, Japan) stored in well-sealed bottles were used as starting materials to prepare the following two types of biphase powder mixture samples with systematically varied weight fractions: (i) HAp/β-TCP and (ii) HAp/α-TCP. The related raw powders were first ground and sieved to achieve a small particle size (~1 μm) for Raman calibration. Then, HAp/β-TCP powders and HAp/α-TCP powders were weighed and mixed using an alumina mortar, respectively, to prepare the biphase samples by varying the weight fraction of HAp from 0 to 1.0 (fHAp = 0, 0.1, 0.2, …, 1.0). In addition, to examine the reliability of the results obtained from the Raman calibration, an untreated 0.6HAp/0.2α-TCP/0.2β-TCP mixture pellet, and three pellets of HAp, α-TCP and β-TCP subjected to thermal treatment in air at 1200 °C for 12 h were also prepared and kept in a plastic sample box for the Raman experiments.
Raman spectra of the investigated samples were acquired at room temperature by using a 532 nm laser with a power of 50 mW and a single monochromator (T-64000, Jobin-Yvon/Horiba Group, Kyoto, Japan) equipped with a 1024 × 256 pixels CCD camera (CCD-3500V, Horiba Ltd., Kyoto, Japan). An objective lens with a magnification of 100×, a numerical aperture NA = 0.9, and a focal length f = 0.3 mm was used in this study, which corresponded to a laser lateral spot size of around 1 μm, but a larger indepth probe size. The accumulation time of one Raman spectrum was 10 s and the average spectrum for each sample was obtained from more than 10 measured locations to reduce the influence of the Raman probe size and inhomogeneity on the results upon Raman calibrations of HAp/β-TCP and HAp/α-TCP. Spectral deconvolution was performed by means of commercially available software (LabSpec5, Horiba/Jobin-Yvon, Kyoto, Japan) using a Gaussian function.
XRD analyses of the CaP samples were conducted on Rigaku Miniflex 600 system (Rigaku Corporation, Tokyo, Japan), using the CuKα radiation (40 kV and 15 mA) and a scan rate of 1 degree/min. The Rietveld method was applied to refine a theoretical line profile until it matched the measured profile for the characterization of crystalline phases, using the software RIETAN-FP, and Crystallographic Information Files were obtained from the AtomWork database (NIMS).
3. Results and Discussion
3.1. Raman Calibrations of HAp/α-TCP and HAp/β-TCP for Algorithm Determination
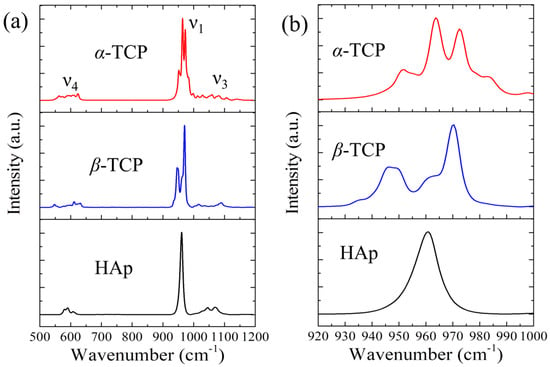
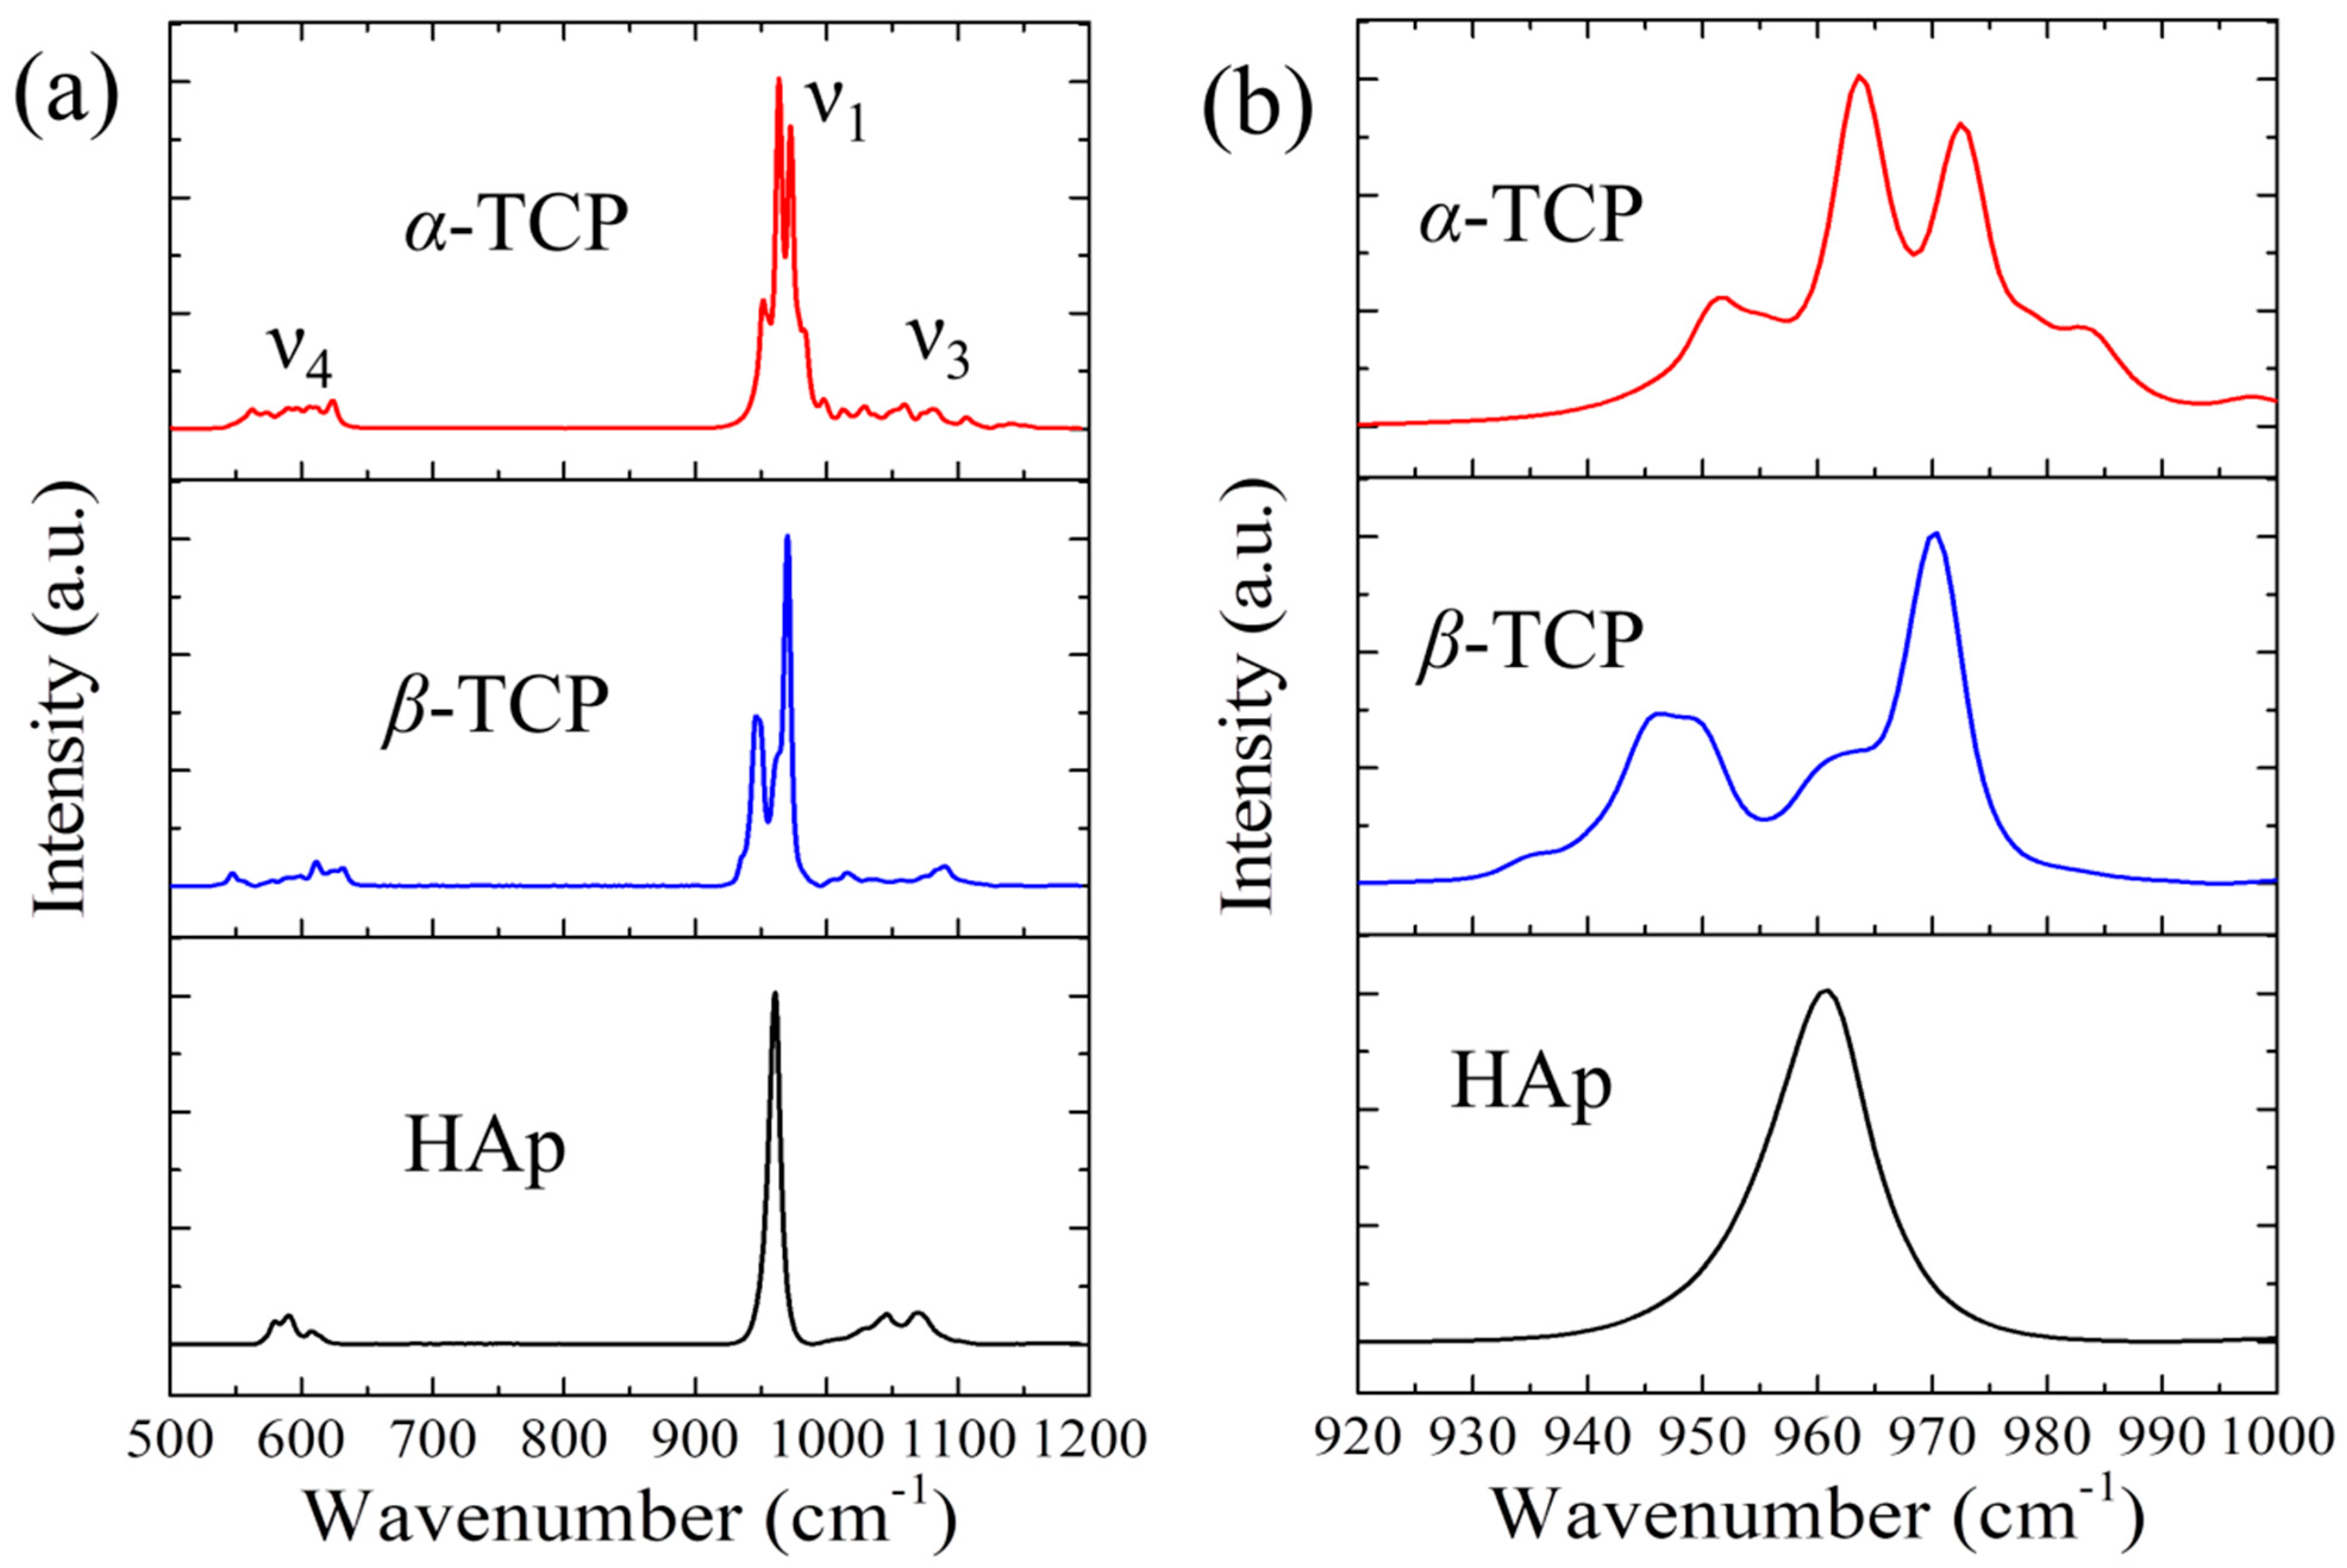
As can be seen in Figure 1a, the Raman spectra of pure HAp, α-TCP, and β-TCP exhibit somewhat similar spectral morphologies, showing several spectral band regions in the range from 500 to 1200 cm−1, with the strongest bands located at around 950 cm−1. Nevertheless, significant differences in the spectral line shape can also be observed among these samples. HAp, α-TCP, and β-TCP all contain PO4 tetrahedra as their basic structural units, but their arrangement patterns and crystal symmetries are quite different. HAp possesses a hexagonal crystal structure, which belongs to the space group of P63/m, and contains Ca, P, O and H sites in the unit cell [25]. β-TCP contains multiple independent PO4 sites within the unit cell, belonging to the rhombohedral crystal system with space group R3c, while α-TCP has a monoclinic crystal structure with space group P21/a and consists of multiple PO4 sites with a large unit cell volume and low symmetry [26,27]. The observed Raman bands in CaP systems arise from the stretching and bending of the PO4 group in respective structures, and their irreducible representations can be derived based on group theory [25,28]. In general, the P-O symmetric stretching ν1 mode of the PO4 tetrahedron shows intense characteristic peaks of the CaP phases in the spectral range from 930 to 990 cm−1, and the O-P-O bending ν4 mode exhibits several peaks in the lower wavenumber region (540~600 cm−1), while the antisymmetric stretching ν3 mode shows several peaks in the higher wavenumber range (1000~1100 cm−1).
Figure 1.
(a) Representative Raman spectra of α-TCP, β-TCP, and hydroxyapatite, and (b) respective ν1 band in the enlarged spectral region of 920–1000 cm−1.
This research focused on the ν1 mode Raman band, which shows a significant dependence of its line shape on the environment of the PO4 tetrahedron, and can be used as characteristics of the phases. The ν1 band of each phase consists of distinct peaks: an intense peak located at around 960 cm−1 in HAp, four peaks at 953, 964, 973, and 982 cm−1 in α-TCP and four peaks at 935, 947, 962, and 970 cm−1 in β-TCP (cf. Figure 1b). Therefore, in the Raman spectra of a multiphasic CaP system, these ν1 bands arising from all components may partly overlap, resulting in a broad band, and thus a precise spectral deconvolution is required to retrieve the individual components for accurate phase quantification.
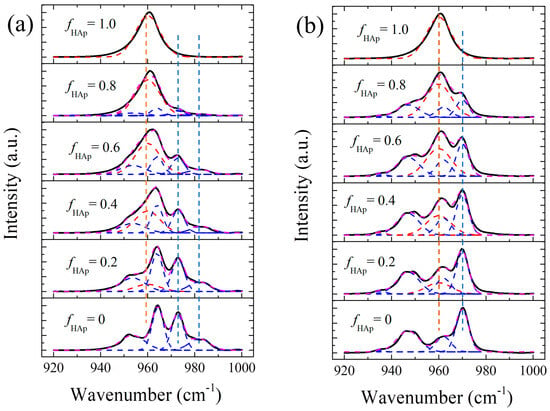
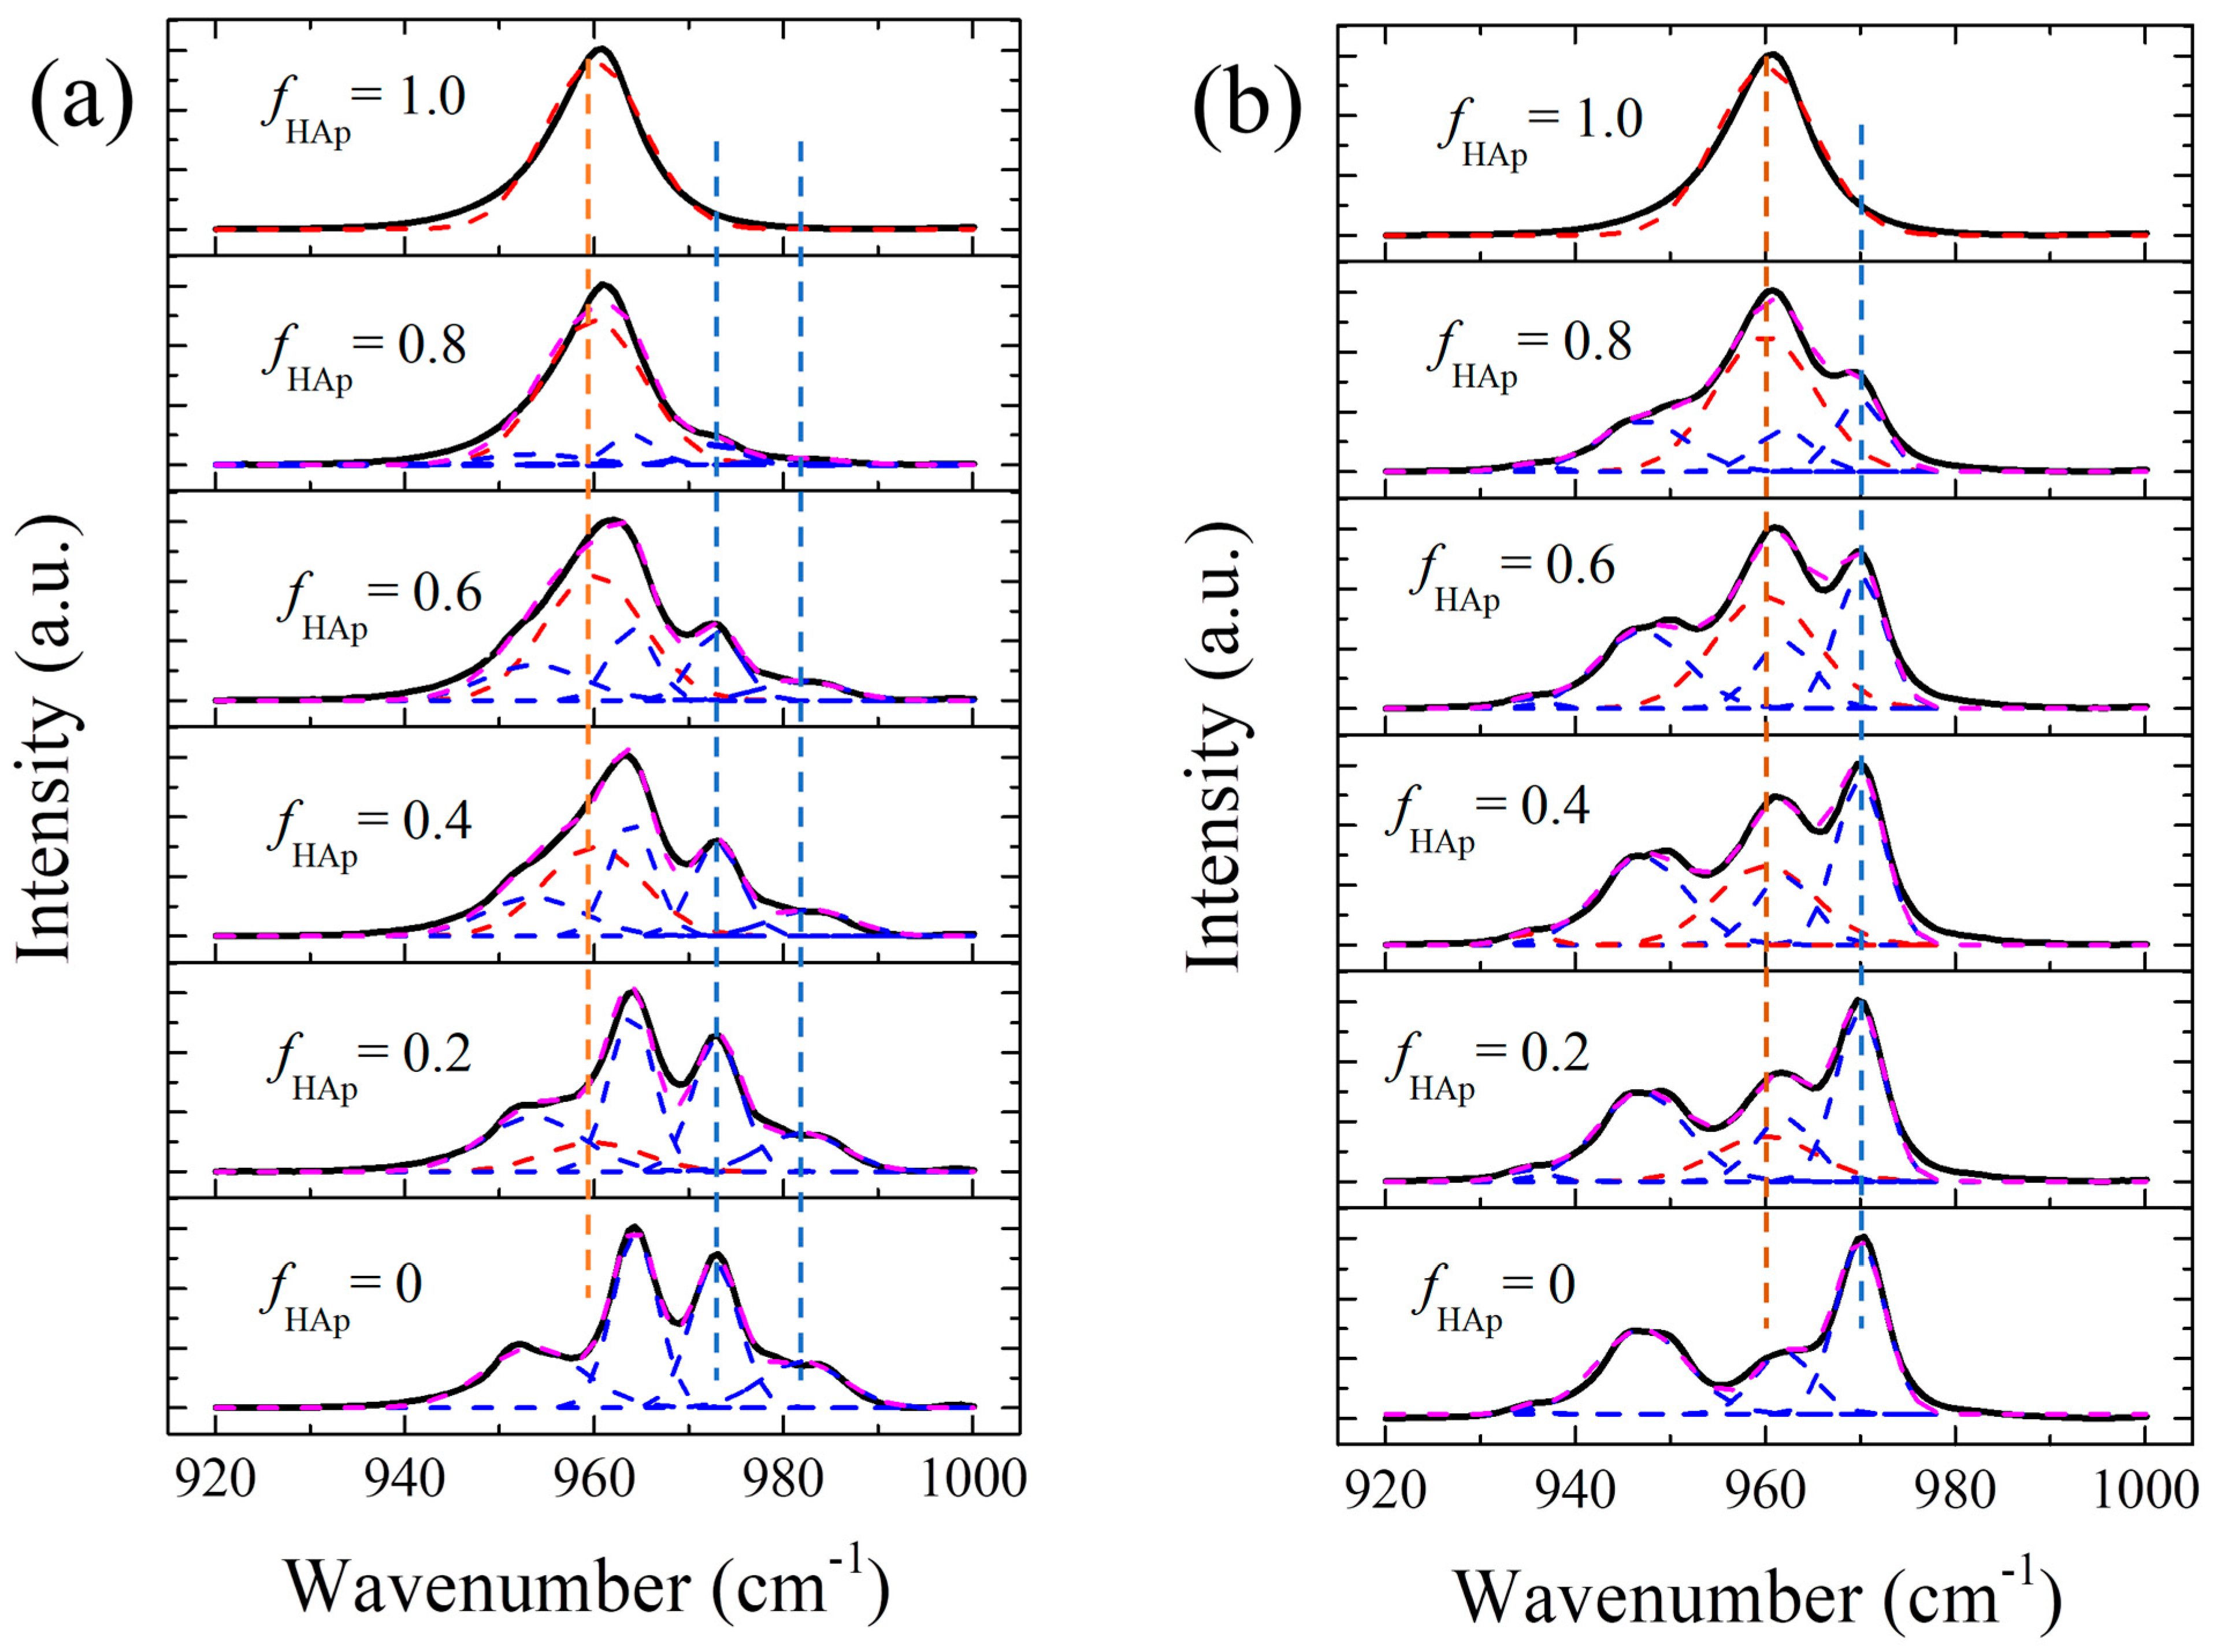
Accordingly, the calibration of band intensity variations with the weight fraction of HAp in different CaP systems can be conducted by taking advantages of these Raman peaks. Figure 2a,b show the variations in the average Raman spectra with the weight fraction of hydroxyapatite, fHAp, in the spectral range of 920–1000 cm−1, for the two sets of mixture samples, HAp/α-TCP and HAp/β-TCP, respectively. As can be seen, when the hydroxyapatite fraction increases from 0 to 1.0, the characteristic peaks of α-TCP at 973 and 982 cm−1 (Figure 2a) and β-TCP at 970 cm−1 (Figure 2b) are gradually weakened until disappearing at fHAp = 1.0, while the HAp peak at 960 cm−1 is gradually enhanced. Spectral deconvolution was performed for each Raman spectrum using Gaussian functions with the coefficient of determination R2 > 0.985, and the fitting results are also shown in Figure 2. Note that in order to reduce the error involved in the fitting procedure due to band overlapping, the position and width of the Raman peaks from respective pure samples were used (cf. Table 1) and fixed for fitting the spectra of the mixtures. Accordingly, the intensities of the peaks (peak areas) at 960, 973, and 982 cm−1 for HAp/α-TCP, as well as those at 960 and 970 cm−1 for HAp/β-TCP, could be calculated from the fitting.
Figure 2.
Variations in experimentally measured and deconvoluted Raman spectra of (a) HAp/α-TCP and (b) HAp/β-TCP with the weight fraction of HAp in the mixtures in the range of 920–1000 cm−1.
Table 1.
Spectral band position and full width at half maximum (FWHM) of Raman peaks of HAp, α-TCP and β-TCP.
For a homogeneous biphase mixture of A and B, the intensity I of any Raman band of either A or B is proportional to its content (mole, number of atoms) C, i.e., IA∝CAI0,A, where I0,A is the Raman intensity of the unit cell of A, and the weight fraction of A, fA in the mixture can be determined by [14]:
where m is the mass of each component and M is the molecular weight. The parameter p is defined as , and its value depends on the selected Raman bands and the molecular weight of the components. Note that the Raman intensity I0 of the selected optical mode is determined by the crystal structure and vibrational modes.
By rearranging Equation (1), a linear relationship can be derived between the intensity ratio of any Raman band of B to a band of A, IB/IA and the reciprocal of the weight fraction of A.
As can be seen in Figure 2, the Raman bands of α-TCP at 973 and 982 cm−1 and that of β-TCP at 970 cm−1 are relatively distinct and resolvable in the spectrum of the mixture, with respect to the HAp band at 960 cm−1. Note that in the presence of high lattice distortion and defects in HAp, a generation of amorphous HAp might induce a weak low-wavenumber shoulder to the HAp main peak (in general 940~955 cm−1), which may somewhat influence the fitting of the lower wavenumber bands of α-TCP and β-TCP [15,29]. Therefore, the intensity ratios I973/I960 and I982/I960, as well as I970/I960, were selected and considered more suitable for the Raman calibrations of the biphase mixtures, HAp/α-TCP and HAp/β-TCP.
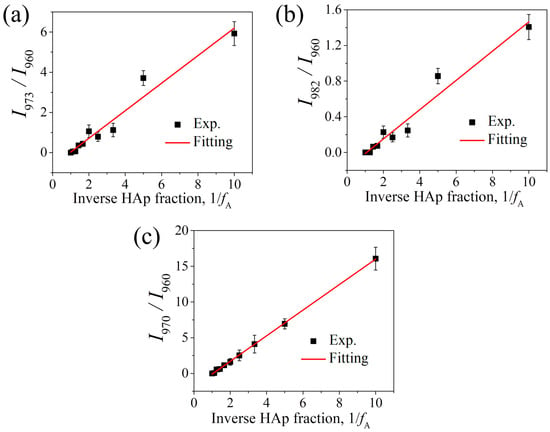
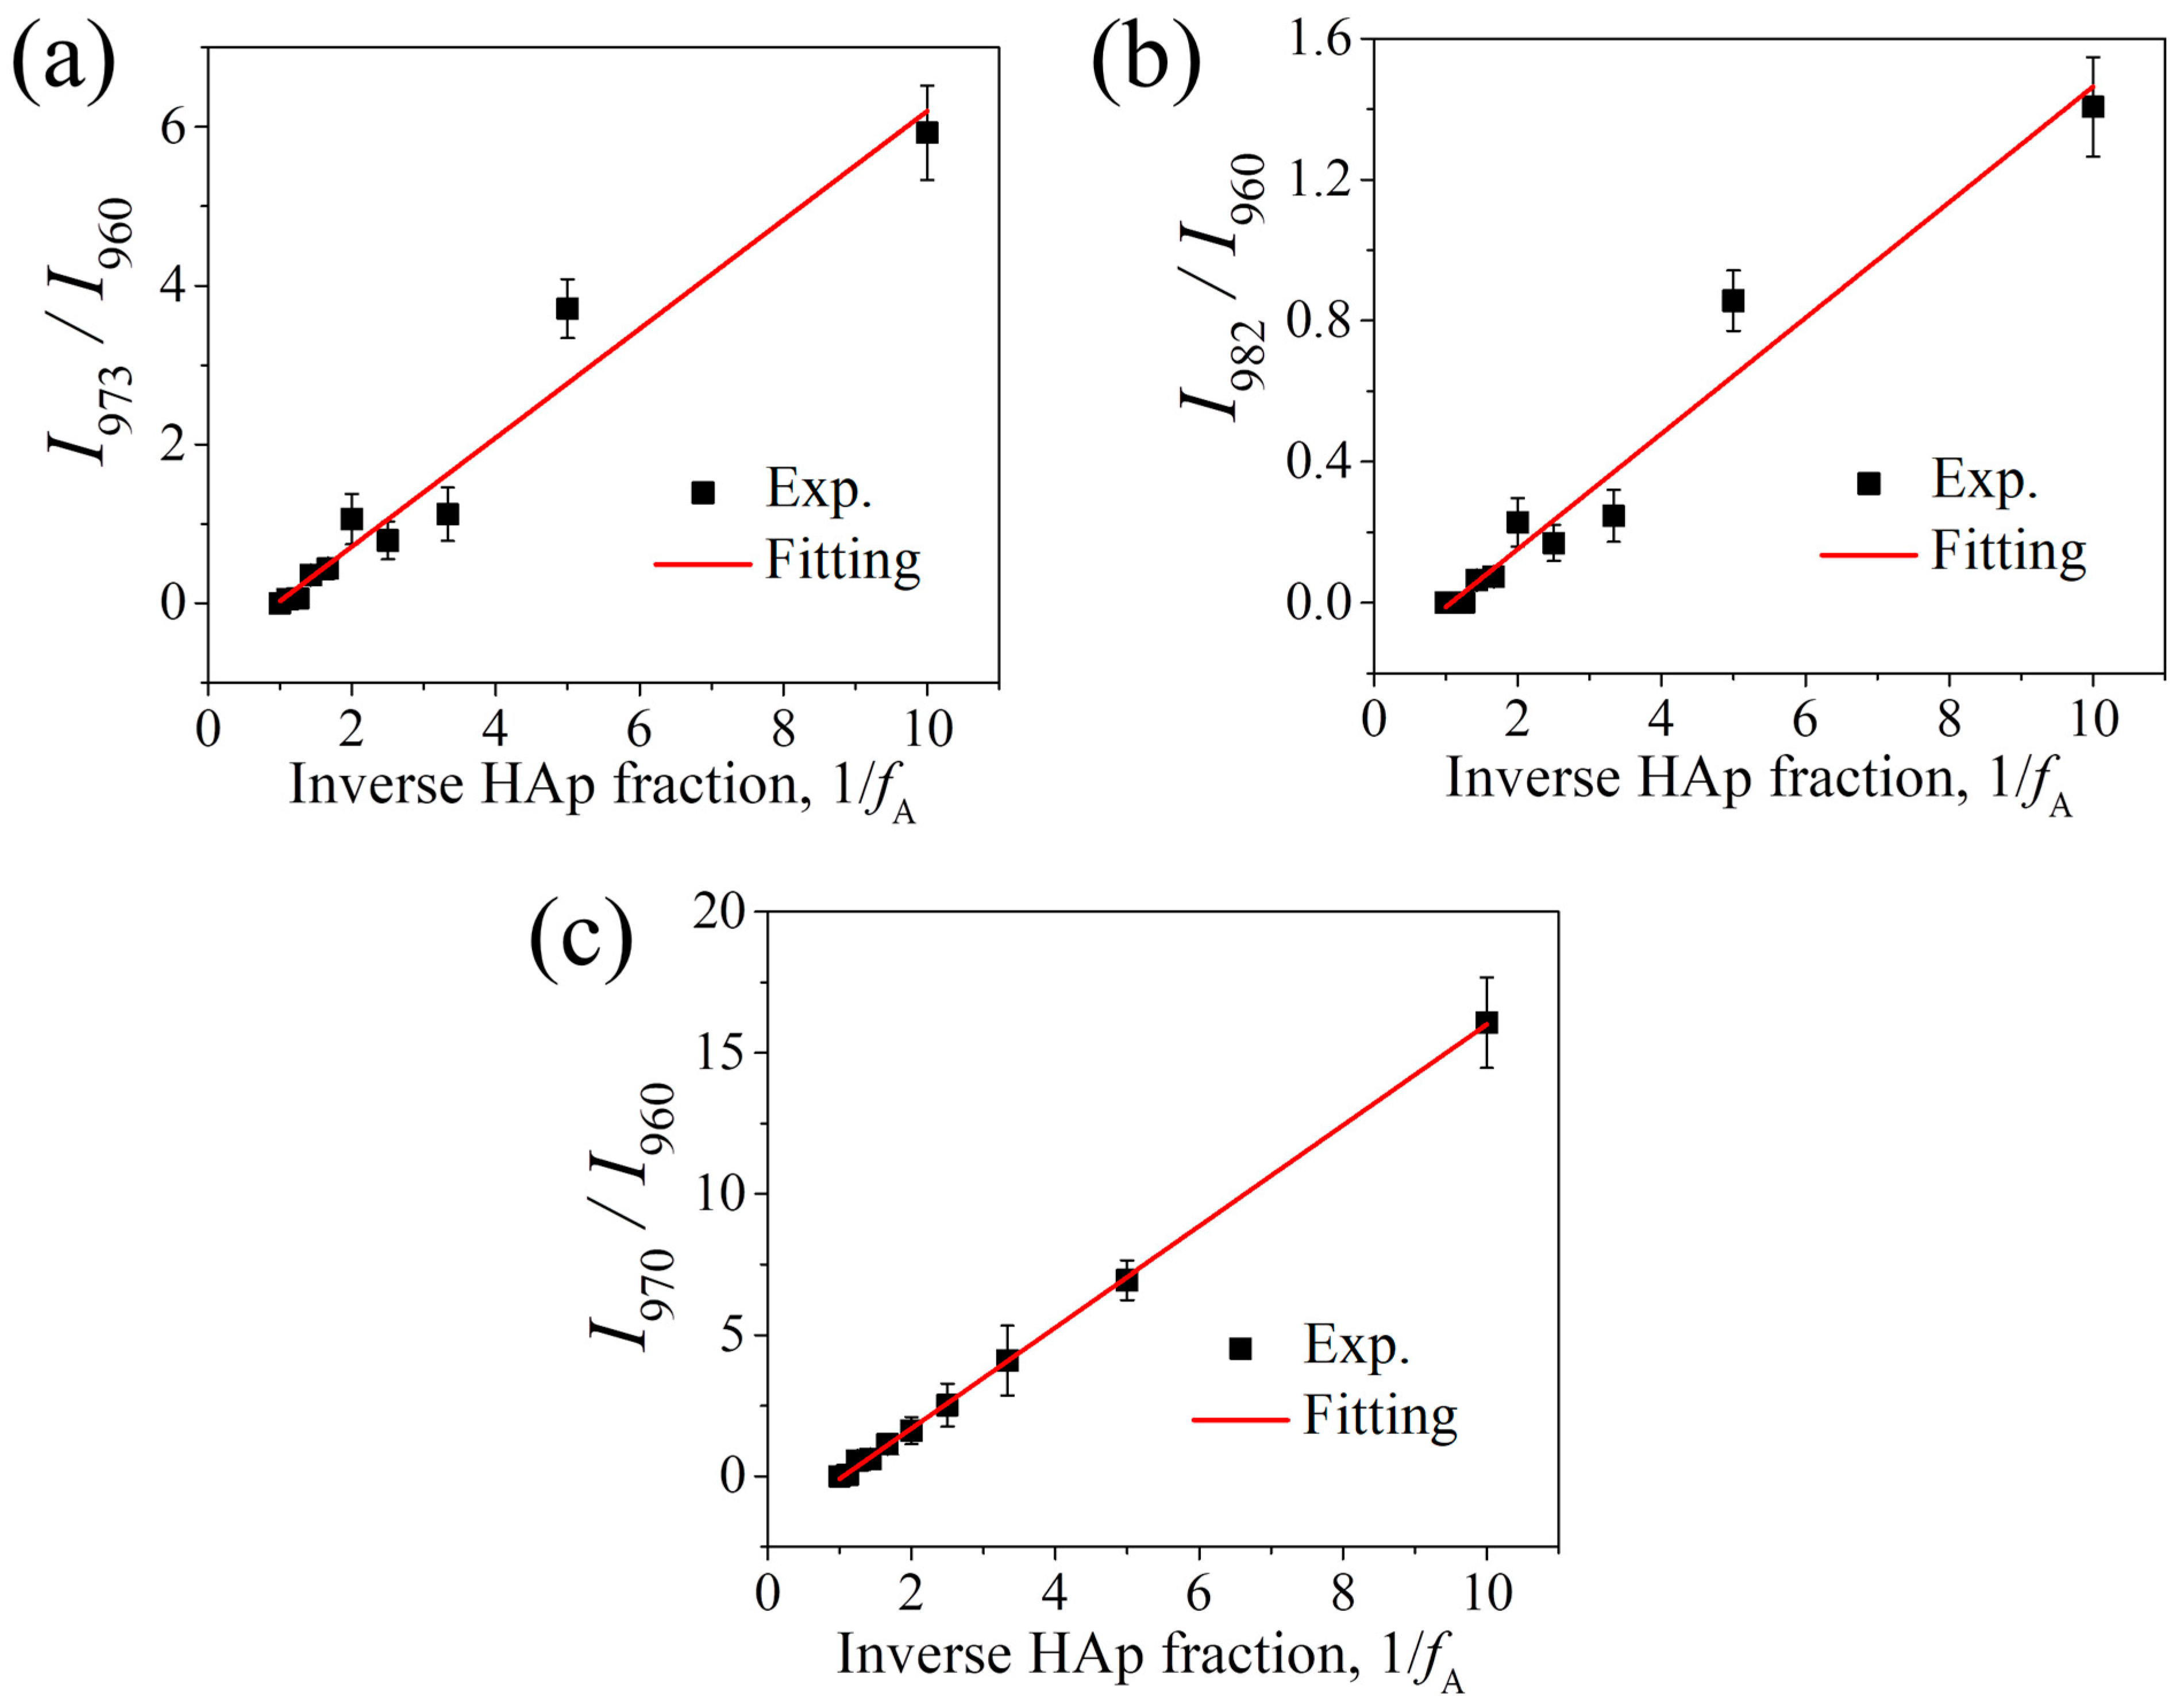
Figure 3a,b show the changes in the intensity ratios I973/I960 and I982/I960 as a function of the reciprocal of the HAp fraction, 1/fHAp for the HAp/α-TCP mixtures. As can be seen, both intensity ratios increase proportionally with the inverse HAp fraction. According to Equation (2), the respective parameter p can be determined from the slope of the linear fit to the experimental data using the least-squares method, as the fitting curves shown in each figure. The slope values (1/p) were thus determined to be 0.69 for I973/I960 and 0.16 for I982/I960, respectively. That is, these relationships can be expressed by the following equations:
and
Figure 3.
Variations in Raman band intensity ratios of (a) I973/I960 and (b) I982/I960 for HAp/α-TCP, and (c) I970/I960 for HAp/β-TCP, with the inverse hydroxyapatite weight fraction.
Similarly, for the HAp/β-TCP mixtures, the variation in the intensity ratio I970/I960 with the inverse HAp fraction, 1/fHAp can be obtained from the spectral deconvolution (cf. Figure 2b), which exhibits a clear linear relationship as shown in Figure 3c. According to the linear fitting, the slope was determined to be 1.77, and the relationship can be expressed by:
Based on these equations, it is thus possible to quantitatively analyze phase transitions in various systems of multiphasic CaP systems composed of HAp/α-TCP/β-TCP. In practice, for a three-phase composite (e.g., A = HAp, B = α-TCP, and C = β-TCP), the weight fraction of A, fA in the mixture can be derived by the following equation:
Similarly, the weight fractions of B and C, fB and fC in the mixture can be determined by:
From the above calibration results for the two sets of biphase mixtures, HAp/α-TCP and HAp/β-TCP, the values of pAB and pAC could be determined as follows: pAB = 1.45 (I973/I960) or 6.25 (I982/I960) for HAp/α-TCP and pAC = 0.56 (I970/I960) for HAp/β-TCP.
3.2. Verification of the Proposed Raman Algorithms for Phase Quantification in Multiphasic CaP Systems
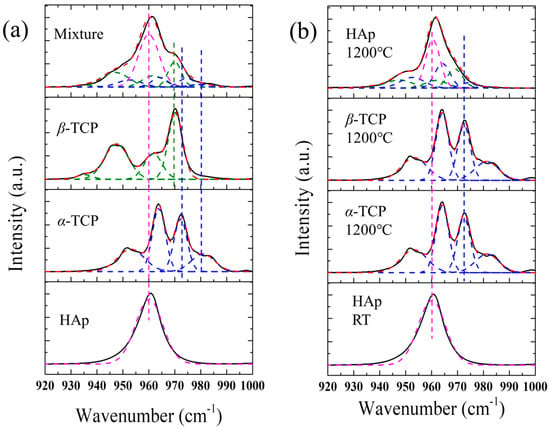
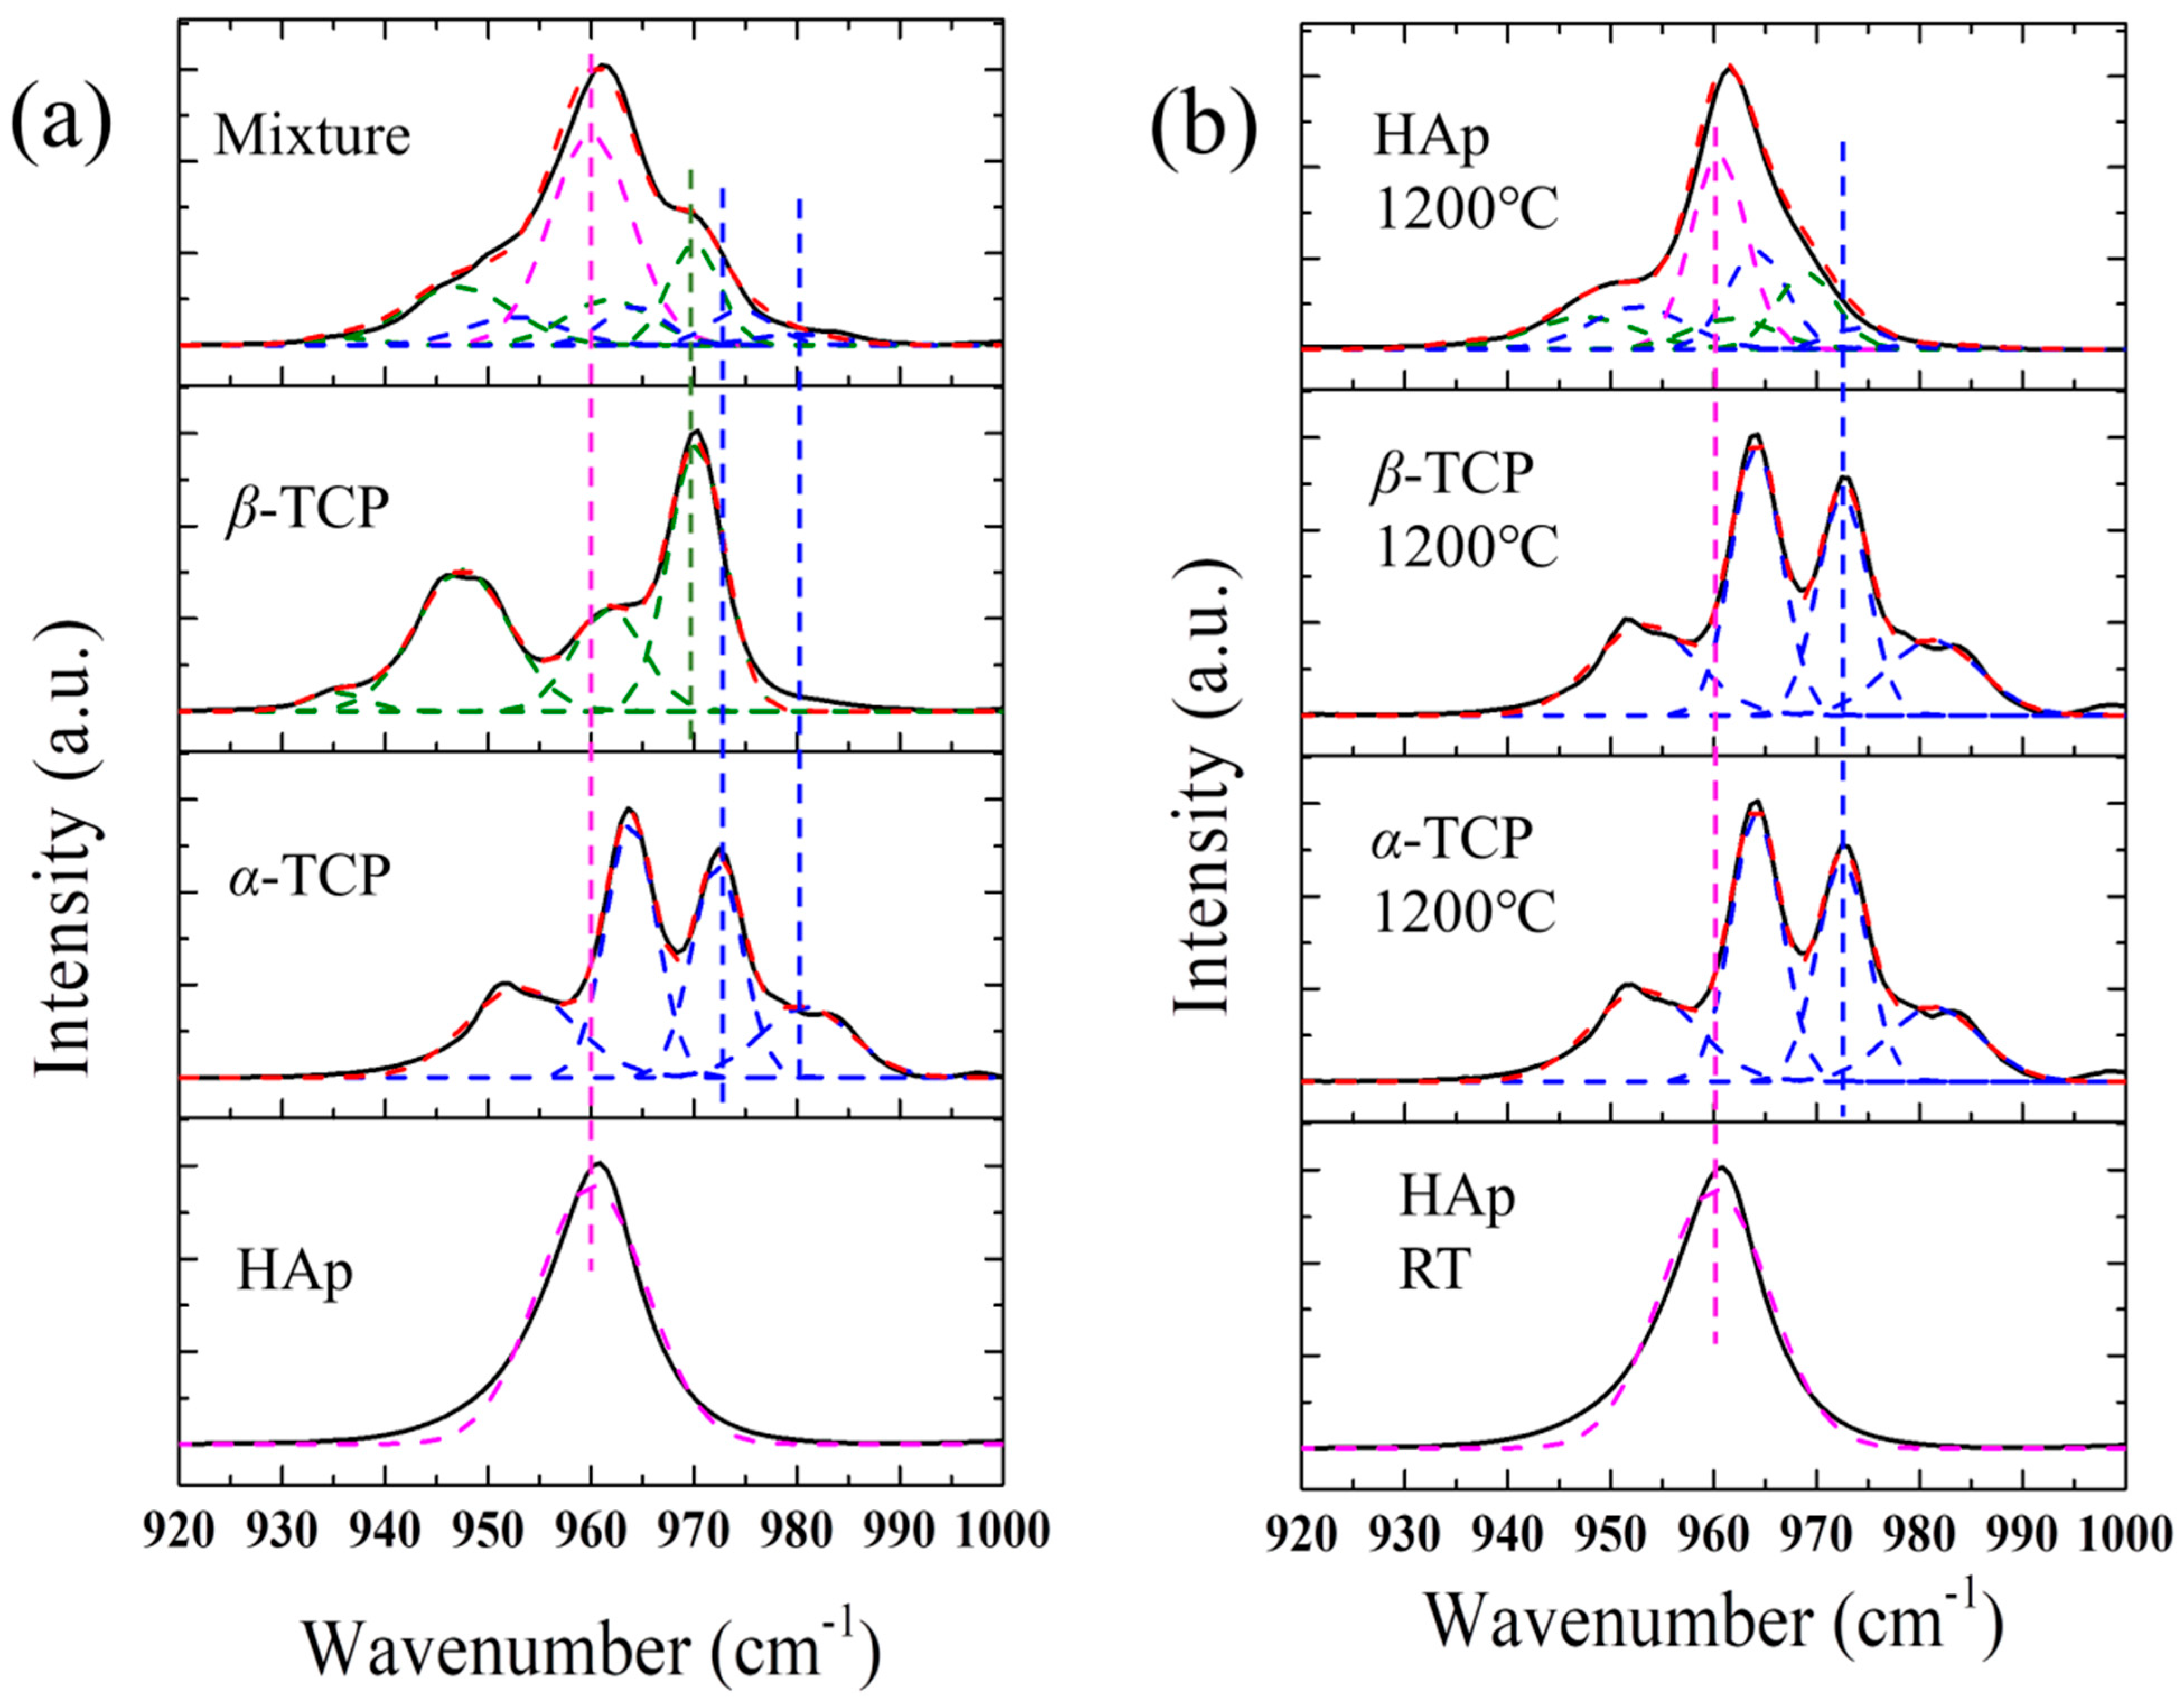
To examine the reliability of the algorithms obtained from the above Raman calibrations, further Raman experiments were conducted on an untreated 0.6HAp/0.2α-TCP/0.2β-TCP mixture and the monolithic pellets of HAp, α-TCP and β-TCP, which were subjected to thermal treatments in air at 1200 °C for 12 h, respectively, as their Raman spectra shown in Figure 4. As can be seen in Figure 4a, the untreated HAp/α-TCP/β-TCP sample exhibits an apparent overlapping of relevant Raman peaks of all components in the mixture. Accordingly, spectral deconvolution was performed for the Raman spectra using Gaussian functions, taking advantages of the position and width of the Raman bands from respective pure samples, as the fitting results shown in Figure 4a. According to Equations (6)–(8), respective fractions of HAp, α-TCP, and β-TCP could be calculated and given in Table 2. As can be seen, in the presence of α-TCP, consistent results of the component fractions could be obtained by using either selected Raman intensity ratio, I973/I960 or I982/I960, and the determined fractions are in good agreement with the real values (fHAp = 0.6, fα-TCP = 0.2, and fβ-TCP = 0.2), confirming the reliability of the proposed algorithms for phase quantification.
Figure 4.
Comparisons of Raman spectra of the ν1 band of (a) untreated 0.6HAp/0.2α-TCP/0.2β-TCP mixture, and (b) HAp, α-TCP, and β-TCP pellets thermally treated at 1200 °C.
Table 2.
Determined fractions of HAp, α-TCP, and β-TCP by Raman and XRD analyses.
The HAp pellet thermally treated at 1200 °C shows a clear alteration of its Raman spectrum, as the t spectral morphology is similar to that of the HAp/α-TCP/β-TCP mixture, i.e., an appearance of shoulder peaks on both sides of the main peak at 960 cm−1 (Figure 4b), demonstrating a structural alteration of HAp and phase transformation to TCP during thermal treatment at high temperatures. Note that no significant changes in the Raman spectrum of α-TCP were observed upon thermal treatment at 1200 °C, despite the occurrence of phase transformation from α-TCP to β-TCP at lower temperatures (<1150 °C [3]) and recrystallization of α-TCP because of the transformation of β-TCP back to α-TCP at this temperature (cf. Figure 4b). In the case of pure β-TCP, the Raman spectrum was found barely altered upon thermal treatment at 1000 °C before the transformation to α-TCP. However, it should be noted that the ν1 Raman band of HAp can be slightly altered upon thermal treatment due to the occurrence of hydroxylation and dehydroxylation before a possible phase transition to β-TCP at high temperatures (above ~800 °C) [29,30], and the fitting results are shown in Figure 4b and Table 2. For the spectral deconvolution here, the positions and widths of the Raman peaks from pure α-TCP and β-TCP were used (cf. Table 1) and fixed, while those of the ν1 band of HAp could not be fixed. The coefficients of determination R2 for all fitting shown in Figure 4 are all larger than 0.965. Similarly, the calculations using both selected Raman intensity ratios, I973/I960 and I982/I960 gave consistent results of the component fractions of α-TCP, and the determined fractions revealed an incomplete phase transformation of HAp at this temperature (fHAp = 0.71, fα-TCP = 0.12, and fβ-TCP = 0.17). In the case of thermal treatment of HAps, the structure of HAp has been reported to be temperature-dependent, owing to competitive occurrence of hydroxylation and dehydroxylation before a possible phase transition to β-TCP at high temperatures (above ~800 °C) [29], while β-TCP can further undergo a reversible phase transition into high-temperature stable α-TCP starting at temperatures above approximately 1150 °C until final thermal decomposition into CaO [3,31]. Indeed, it is interesting to find that in this study, β-TCP completely transformed to stable α-TCP in the monolithic β-TCP pellet, while it still exist in the incompletely transformed HAp pellet, which might be associated with the presence of residual stress or further phase transformation from α-TCP during cooling and needs a further investigation. Note that the phase transformation or structural alterations to nonstoichiometric phases can be quite complex [32], as the process can be influenced by different factors, i.e., temperature, heating time, particle size, residual stress, density, inhomogeneity, defects, etc. Accordingly, a quantitative analysis of the microstructural alteration of the CaP system at different temperatures is necessary.
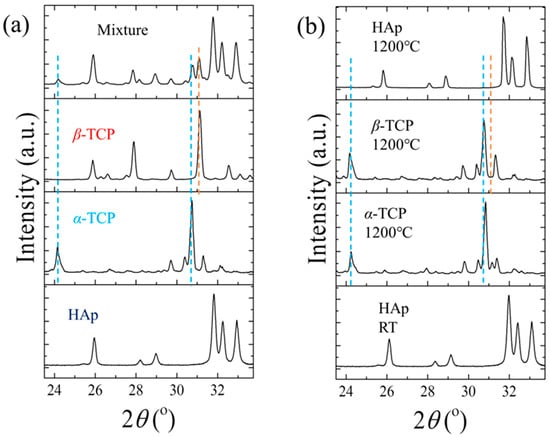
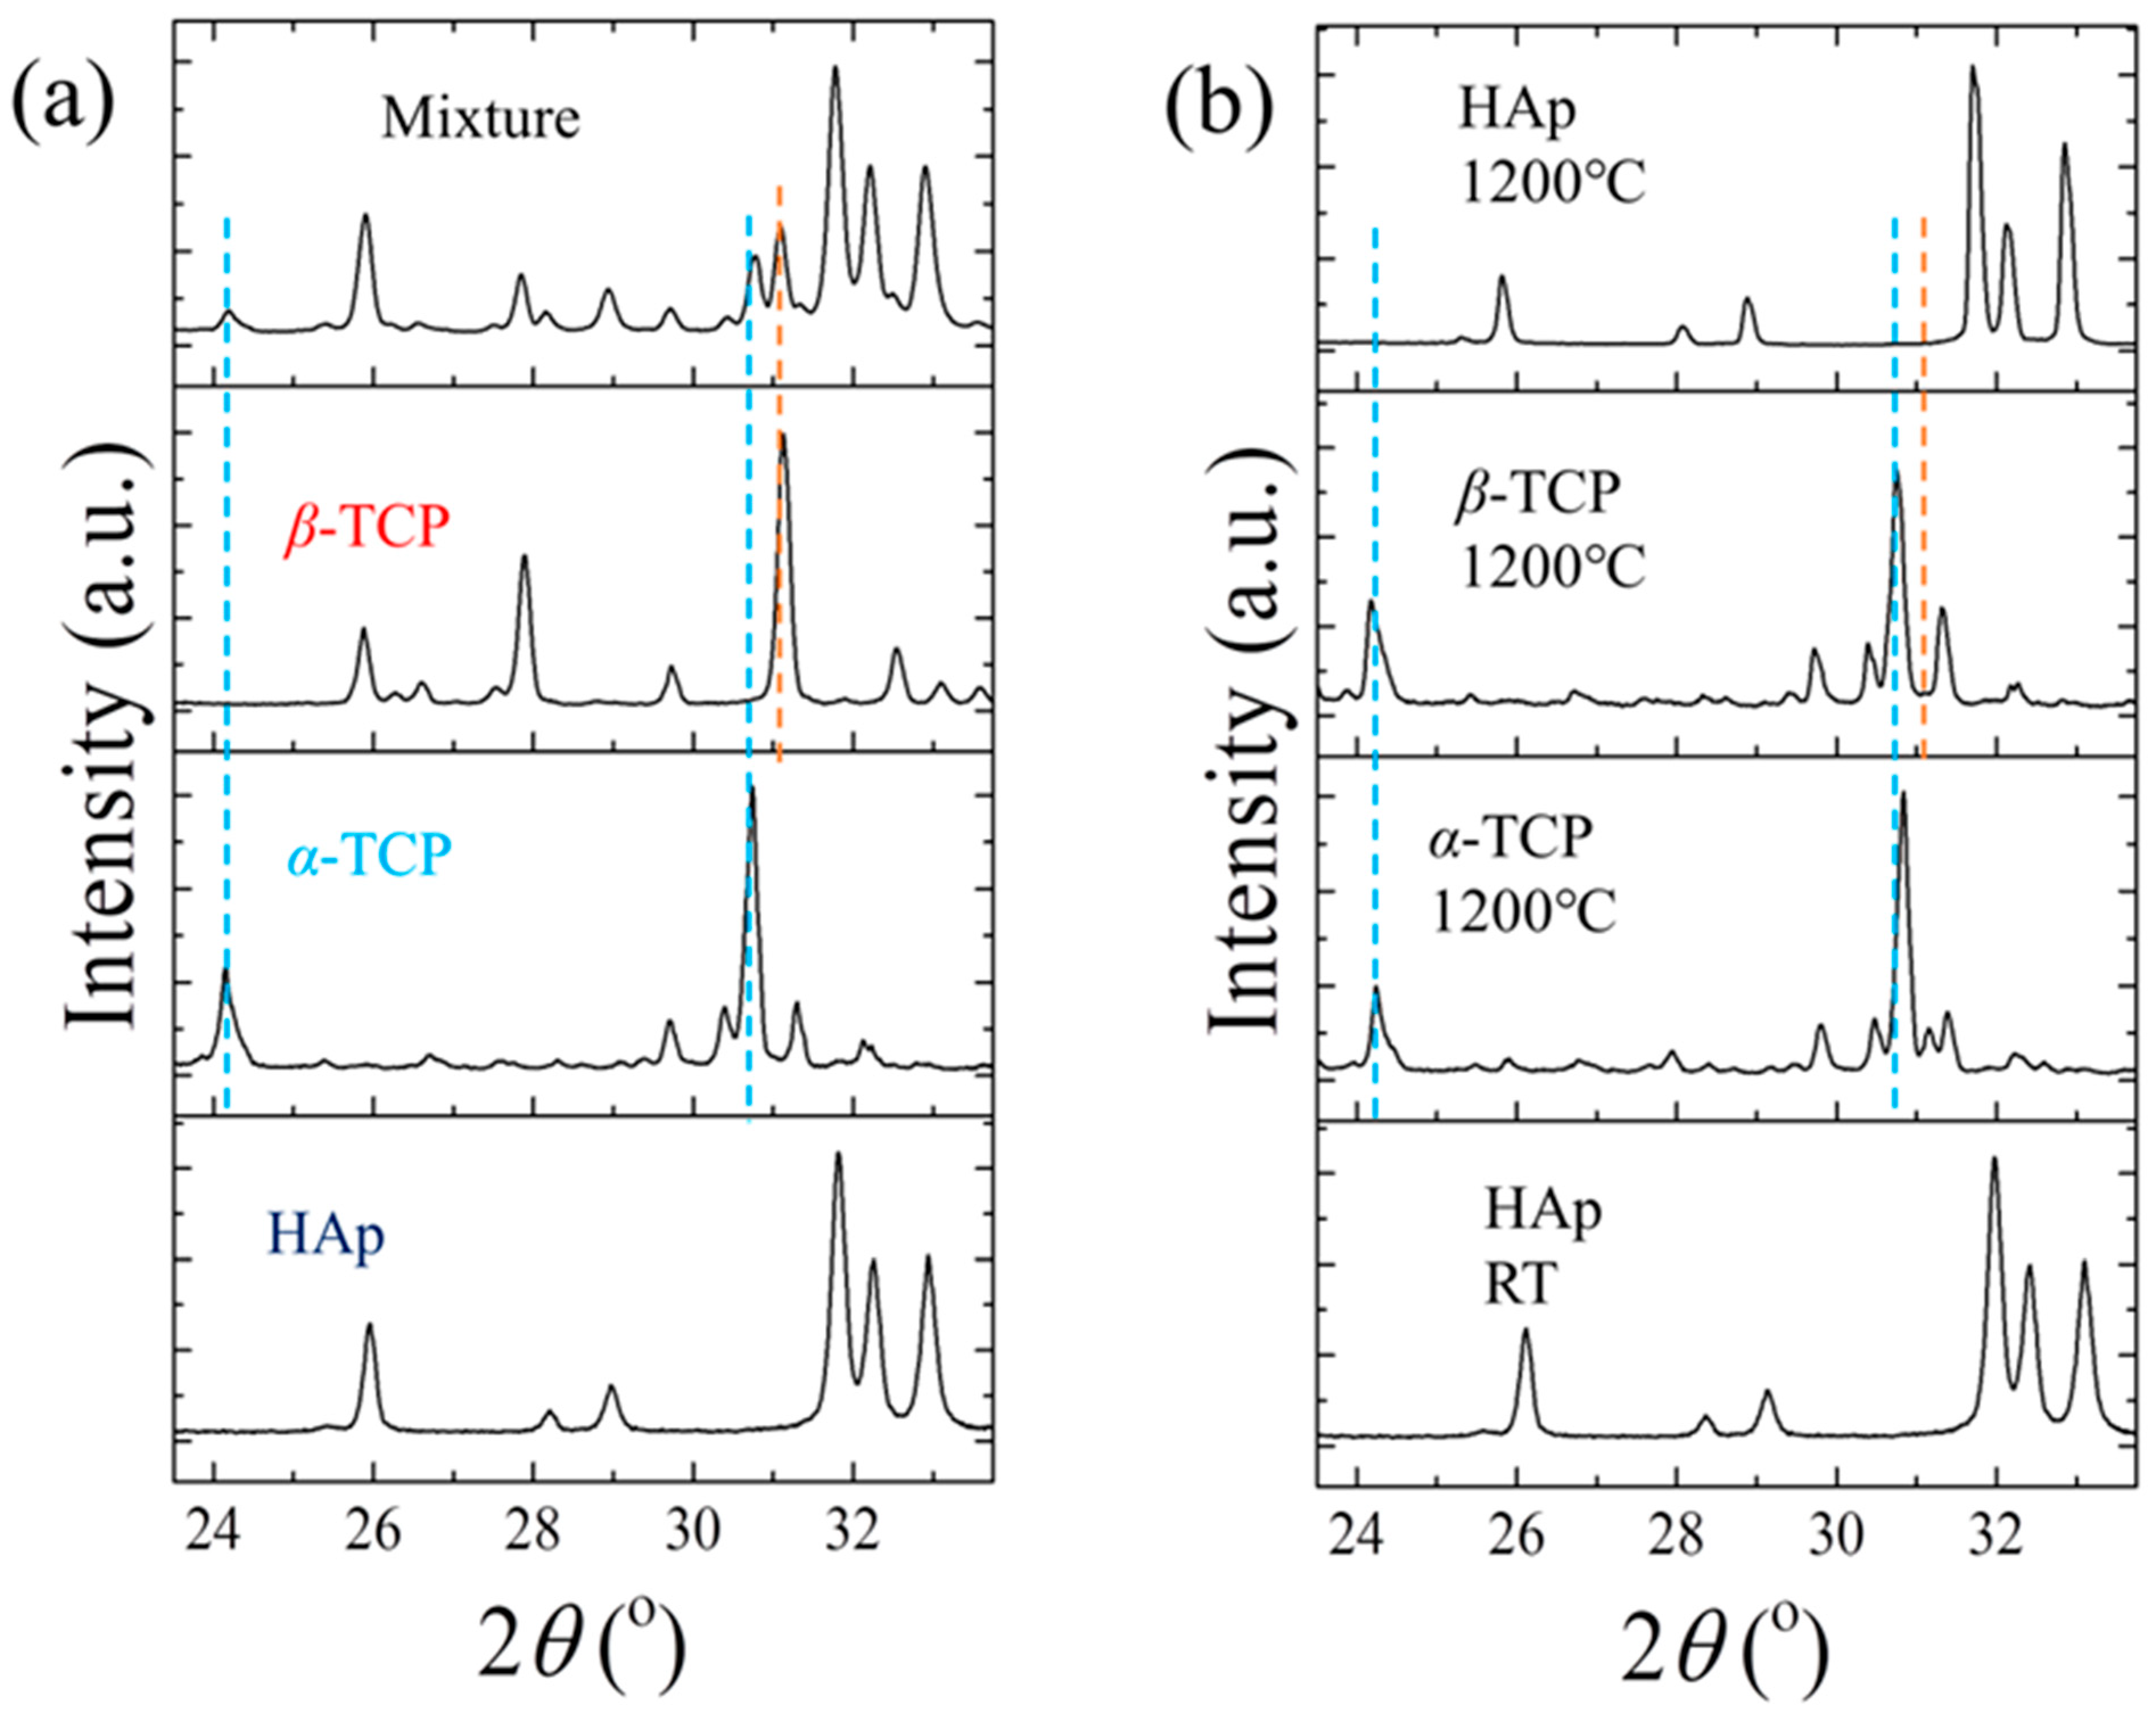
For comparison, conventional XRD analyses were also performed on these samples. Figure 5 shows typical XRD patterns of the untreated HAp/α-TCP/β-TCP mixture and the three ceramic pellets treated at 1200 °C, as well as pure α-TCP, β-TCP, and HAp powders. As shown in Figure 5a, the untreated mixture exhibits the characteristic diffraction peaks of all components, HAp, α-TCP and β-TCP, while the thermally treated HAp pellet shows only the specific diffraction peaks of HAp (JCPDS-9-0432), and no peaks of any other phosphate phases (α-TCP, β-TCP and triclinic CaHPO4) can be detected. On the other hand, both α-TCP and β-TCP pellets show only the diffraction peaks of α-TCP after thermal treatments at 1200 °C. The sharp peaks of XRD patterns suggest a good crystallinity of the investigated pellets after thermal treatment. According to the Rietveld refinement analysis, the respective fractions of the components in these samples were determined, as shown in Table 2. As can be seen, for the untreated HAp/α-TCP/β-TCP mixture, the XRD results (fHAp = 0.60, fα-TCP = 0.17, and fβ-TCP = 0.23) are in good agreement with those obtained from Raman analyses and the nominal values. However, for the thermally treated HAp sample, XRD patterns revealed no other phases except HAp (fHAp = 1.0, fα-TCP = fβ-TCP = 0), which is inconsistent with the Raman results.
Figure 5.
XRD patterns with 2θ in the range of 23.5°–35° for (a) the untreated 0.6HAp/0.2α-TCP/0.2β-TCP and (b) the thermally treated HAp pellets.
The detection of phase transformation in thermally treated HAp by Raman spectroscopy, but not by XRD, could be owing to a possible formation of disordered structure of TCP and higher sensitivity of Raman spectroscopy to structural alteration because Raman signals reveal local atomic vibrations even in the presence of short-range disorders, while the diffraction peaks reveal the periodicity of the crystal structure and are affected by the lattice distortion. Note that when the arrangement of atoms within a lattice lacks a long-range translational symmetry (periodic lattices), X-rays scatter incoherently in multiple directions rather than constructive interference angles, while the breakdown of the long-range symmetry relaxes the selection rules for Raman scattering and the vibrational modes across the entire phonon density of states can be active and sampled. However, it should be noted that in the case of highly disordered structure of HAp, or the presence of an amorphous phase, as mentioned above, the ν1 Raman band may shift to lower wavenumbers and become a broad and weak band that depends on the degree of lattice distortion, defects, and nonstoichiometry of the material [15,29], which may need to be taken into consideration for applications of CaP systems. Despite that, the influence of the presence of amorphous phases on the results obtained from the higher wavenumber region (>960 cm−1) is insignificant, and the established algorithms are still applicable for phase quantification. In the case of the formation of calcium hydrogen phosphate CaHPO4, or calcium dihydrogen phosphate Ca(H2PO4)2 in acidic environments, the ν1 band shifts to ~988 cm−1 for CaHPO4, together with an appearance of a new strong band at 899 cm−1, while for Ca(H2PO4)2, the specific major peaks are located at 902, 913, and 1110 cm−1 [22]. Therefore, further Raman calibrations will be needed for a quantitative analysis of these phases in the multiphasic CaP system. It should also be noted that the presence of dopants and residual stress/strain may cause a shift in the band position and a somewhat alteration of the width, and the influence was neglected here for the spectral deconvolution, which might be associated with the relatively low R2 for the spectral deconvolution of the thermally treated samples. In future studies of the effects of thermal treatments, the possible influence of thermal stress will be considered, but it should be considered in the case of a high-stress field or high-content dopant existent in the system. Finally, in combination with Raman mapping [15], the proposed method can be expected for quantitative evaluation of phase compositional distribution in microscopic regions, which can contribute to precise phase control and quality evaluation in CaP systems for applications as bone graft materials and scaffolds.
4. Conclusions
In this study, new algorithms were developed for phase quantification in multiphasic calcium phosphate systems, consisting of HAp, α-TCP, and/or β-TCP, taking advantages of their characteristic Raman bands of the constituent components. The variations in Raman band intensities for a series of HAp/α-TCP and HAp/β-TCP mixtures were calibrated, and the relationships between the composition fraction and respective intensity ratios were established to apply Raman spectroscopy for quantitative phase analysis in various CaP systems. The reliability of the proposed Raman algorithms were further examined and verified by the investigation of a tri-phase CaP mixture using both Raman and XRD analyses, showing the fractions in good agreement with the nominal values of the CaP mixture, which demonstrated the applicability of the proposed method for quantitative phase analysis. Further investigations of thermally treated monolithic ceramics of HAp, α-TCP and β-TCP by Raman spectroscopy revealed a nonstoichiometric variation in HAp with a partial phase transformation into TCP upon thermal treatments, which, however, could not be detected by XRD, demonstrating higher sensitivity of Raman spectroscopy to nonstoichiometric alteration, which can make it more suitable for phase quantification in multiphase CaP systems in presence of local structural disorders. Taking advantages of Raman mapping, this method may also enable quantitative evaluation of phase distribution in microscopic regions and is expected to be applied to phase composition control and quality evaluation in CaP bone graft materials and calcium phosphate-based ceramics.
Author Contributions
Conceptualization, W.Z.; investigation, T.Y., N.T., S.S., A.B. and T.A.; writing—original draft preparation, T.Y.; writing—review and editing, W.Z.; supervision, W.Z. and G.P. All authors have read and agreed to the published version of the manuscript.
Funding
This research received no external funding.
Data Availability Statement
The raw data supporting the conclusions of this article will be made available by the authors on request.
Conflicts of Interest
The authors declare no conflicts of interest.
References
- Dorozhkin, S.V. Biphasic, triphasic and multiphasic calcium orthophosphates. Acta Biomater. 2013, 8, 963–977. [Google Scholar] [CrossRef] [Scilit] [PubMed]
- Guastaldi, F.P.S.; Matheus, H.R.; Faloni, A.P.d.S.; Almeida-Filho, E.d.; Cominotte, M.A.; Moretti, L.A.C.; Verzola, M.H.A.; Marcantonio, E., Jr.; de Almeida, J.M.; Guastaldi, A.C.; et al. A new multiphase calcium phosphate graft material improves bone healing—An in vitro and in vivo analysis. J. Biomed. Mater. Res. Part B Appl. Biomater. 2022, 110, 2686–2704. [Google Scholar] [CrossRef] [Scilit] [PubMed]
- Drevet, R.; Fauré, J.; Benhayoune, H. Bioactive Calcium Phosphate Coatings for Bone Implant Applications: A Review. Coatings 2023, 13, 1091. [Google Scholar] [CrossRef] [Scilit]
- Younas, A.; Khan, M.U.A.; Abdullah, M.F.B.; Tayebi, L.; Wang, S.; Abdal-hay, A.; Xu, Y. Recent advances of bioceramics, fundamental properties and future perspective in biomedical applications—A review. Mater. Today Sustain. 2026, 35, 101418. [Google Scholar] [CrossRef] [Scilit]
- Moghaddam, S.A.M.; Mojtahedi, H.; Bahador, A.; Hakim, L.K.; Tebyaniyan, H. Clinical Advances in Calcium Phosphate for Maxillomandibular Bone Regeneration: From Bench to Bedside. Ceramics 2025, 8, 129. [Google Scholar] [CrossRef] [Scilit]
- Oliveira, C.S.F.; Negut, I.; Bita, B. The Use of Calcium Phosphate Bioceramics for the Treatment of Osteomyelitis. Ceramics 2024, 7, 1779–1809. [Google Scholar] [CrossRef] [Scilit]
- Jeong, J.; Kim, J.H.; Shim, J.H.; Hwang, N.S.; Heo, C.Y. Bioactive calcium phosphate materials and applications in bone regeneration. Biomater. Res. 2019, 23, 4. [Google Scholar] [CrossRef] [Scilit] [PubMed]
- Iglesias, N.J.; Munkwitz, S.E.; Shah, H.; Sturm, S.R.; Mirsky, N.A.; Sandino, A.I.; Almada, R.; Nayak, V.V.; Witek, L.; Coelho, P.G. Impact of 3D-Printed Tricalcium Phosphate Scaffold Polymorphism and Post-Processing Variations on Bone Regenerative Outcomes. Bioengineering 2026, 13, 34. [Google Scholar] [CrossRef] [Scilit] [PubMed]
- Li, Y.; Weng, W.; Tam, K.C. Novel highly biodegradable biphasic tricalcium phosphates composed of α-tricalcium phosphate and β-tricalcium phosphate. Acta Biomater. 2007, 3, 251–254. [Google Scholar] [CrossRef] [Scilit] [PubMed]
- Akter, T.; Rahman, M.H.; Hossain, M.S.; Maruf, M.M.S.; Alam, M.K.; Hossain, M.S. A review on the synthesis of β-TCP using different methods for biomedical applications. RSC Adv. 2026, 16, 33864–33889. [Google Scholar] [CrossRef] [Scilit] [PubMed]
- Pezzella, V.; Blasi, A.; Mauriello, L.; Trapanese, G.; Ramaglia, E.; Basilicata, M.; Iorio-Siciliano, V.; Ramaglia, L. Effectiveness of β-TriCalcium Phosphate for Alveolar Ridge Preservation: A Systematic Review. J. Funct. Biomater. 2026, 17, 247. [Google Scholar] [CrossRef] [Scilit] [PubMed]
- Tran, D.L.; Ta, Q.T.H.; Tran, M.H.; Nguyen, T.M.H.; Le, N.T.T.; Hong, A.P.N.; Park, H.-J.; Park, K.D.; Nguyen, D.H. Optimized synthesis of biphasic calcium phosphate: Enhancing bone regeneration with a tailored β-tricalcium phosphate/hydroxyapatite ratio. Biomater. Sci. 2025, 13, 969–979. [Google Scholar] [CrossRef] [Scilit] [PubMed]
- Rietveld, H.M. A profile refinement method for nuclear and magnetic structures. J. Appl. Crystallogr. 1969, 2, 65–71. [Google Scholar] [CrossRef] [Scilit]
- Taniyama, A.; Hirose, Y.; Sugahara, T.; Pezzotti, G.; Zhu, W. Quantitative analyses of microstructural alterations in titania by micro-Raman spectroscopy. J. Phys. D Appl. Phys. 2025, 58, 325103. [Google Scholar] [CrossRef] [Scilit]
- Imamura, H.; Zhu, W.; Adachi, T.; Hiraishi, N.; Marin, E.; Miyamoto, N.; Yamamoto, T.; Kanamura, N.; Pezzotti, G. Raman Analyses of Laser Irradiation-Induced Microstructural Variations in Synthetic Hydroxyapatite and Human Teeth. J. Funct. Biomater. 2022, 13, 200. [Google Scholar] [CrossRef] [Scilit] [PubMed]
- Zhu, W.; Nakashima, S.; Marin, E.; Gu, H.; Pezzotti, G. Microscopic mapping of dopant content and its link to the structural and thermal stability of yttria-stabilized zirconia polycrystals. J. Mater. Sci. 2020, 55, 524–534. [Google Scholar] [CrossRef] [Scilit]
- Montes-Hernandez, G.; Renard, F.o. Nucleation of Brushite and Hydroxyapatite from Amorphous Calcium Phosphate Phases Revealed by Dynamic In Situ Raman Spectroscopy. Phys. Chem. C 2020, 124, 15302–15311. [Google Scholar] [CrossRef] [Scilit]
- Rey, C.; Marsan, O.; Combes, C.; Drouet, C.; Grossin, D.; Sarda, S. Characterization of Calcium Phosphates Using Vibrational Spectroscopies. In Advances in Calcium Phosphate Biomaterials; Ben-Nissan, B., Ed.; Springer Series in Biomaterials Science and Engineering; Springer: Berlin/Heidelberg, Germany, 2014; Volume 2. [Google Scholar]
- Karampas, A.; Kontoyannis, C.G. Characterization of calcium phosphates mixtures. Vib. Spectrosc. 2013, 64, 126–133. [Google Scholar] [CrossRef] [Scilit]
- Gelli, R.; Tonelli, M.; Ridi, F.; Terefinko, D.; Dzimitrowicz, A.; Pohl, P.; Bielawska-Pohl, A.; Jamroz, P.; Klimczak, A.; Bonini, M. Effect of Atmospheric Pressure Plasma Jet Treatments on Magnesium Phosphate Cements: Performance, Characterization, and Applications. ACS Biomater. Sci. Eng. 2023, 9, 6632–6643. [Google Scholar] [CrossRef] [Scilit] [PubMed]
- Stammeier, J.A.; Purgstaller, B.; Hippler, D.; Mavromatis, V.; Dietzel, M. In-situ Raman spectroscopy of amorphous calcium phosphate to crystalline hydroxyapatite transformation. MethodsX 2018, 5, 1241–1250. [Google Scholar] [CrossRef] [Scilit] [PubMed]
- Nkebiwe, P.M.; Sowoidnich, K.; Maiwald, M.; Sumpf, B.; Hartmann, T.E.; Wanke, D.; Müller, T. Detection of calcium phosphate species in soil by confocal μ-Raman spectroscopy. J. Plant Nutr. Soil Sci. 2022, 185, 221–231. [Google Scholar] [CrossRef] [Scilit]
- Jillavenkatesa, A.; Condrate, R.A., Sr. The infrared and Raman spectra of β- and α-tricalcium phosphate (Ca3(PO4)2. Spectrosc. Lett. 1998, 31, 1619–1634. [Google Scholar] [CrossRef] [Scilit]
- Cuscó, R.; Guitián, F.; Aza, S.d.; Artús, L. Differentiation between hydroxyapatite and β-tricalcium phosphate by means of μ-Raman spectroscopy. J. Eur. Ceram. Soc. 1998, 18, 1301. [Google Scholar] [CrossRef] [Scilit]
- Sanchez-Pastenes, E.; Reyes-Gasga, J. Determination of the point and space groups for hydroxyapatite by computer simulation of CBED electron diffraction patterns. Rev. Mex. Fis. 2005, 51, 525–529. [Google Scholar]
- Kim, D.-H.; Hwang, K.-H.; Lee, J.D.; Park, H.-C.; Yoon, S.-Y. Long and short range order structural analysis of In-situ formed biphasic calcium phosphates. Biomater. Res. 2015, 19, 14. [Google Scholar] [CrossRef] [Scilit] [PubMed]
- Carrodeguas, R.G.; Aza, S.D. α-Tricalcium phosphate: Synthesis, properties and biomedical applications. Acta Biomater. 2011, 7, 3536. [Google Scholar] [CrossRef] [Scilit] [PubMed]
- Pezzotti, G.; Zhu, W.; Boffelli, M.; Adachi, T.; Ichioka, H.; Yamamoto, T.; Marunaka, Y.; Kanamura, N. Vibrational algorithms for quantitative crystallographic analyses of hydroxyapatite-based biomaterials: I, theoretical foundations. Anal. Bioanal. Chem. 2015, 407, 3325–3342. [Google Scholar] [CrossRef] [Scilit] [PubMed]
- Zhu, W.; Imamura, H.; Marin, E.; Adachi, T.; Miyamoto, N.; Yamamoto, T.; Kanamura, N.; Pezzotti, G. Effects of annealing in air on microstructure and hardness of hydroxyapatite ceramics. J. Phys. D Appl. Phys. 2021, 54, 315301. [Google Scholar] [CrossRef] [Scilit]
- Böhme, N.; Hauke, K.; Dohrn, M.; Neuroth, M.; Geisler, T. High-temperature phase transformations of hydroxylapatite and the formation of silicocarnotite in the hydroxylapatite–quartz–lime system studied in situ and in operando by Raman spectroscopy. J. Mater. Sci. 2022, 57, 15239–15266. [Google Scholar] [CrossRef] [Scilit]
- Brazete, D.; Torres, P.M.C.; Abrantes, J.C.C.; Ferreira, J.M.F. Influence of the Ca/P ratio and cooling rate on the allotropic α↔β-tricalcium phosphate phase transformations. Ceram. Int. 2018, 44, 8249–8256. [Google Scholar] [CrossRef] [Scilit]
- Heimann, R.B. Thermal spraying of biomaterials. Surf. Coat. Technol. 2006, 201, 2012–2019. [Google Scholar] [CrossRef] [Scilit]

Disclaimer/Publisher’s Note: The statements, opinions and data contained in all publications are solely those of the individual author(s) and contributor(s) and not of MDPI and/or the editor(s). MDPI and/or the editor(s) disclaim responsibility for any injury to people or property resulting from any ideas, methods, instructions or products referred to in the content. |
© 2026 by the authors. Licensee MDPI, Basel, Switzerland. This article is an open access article distributed under the terms and conditions of the Creative Commons Attribution (CC BY) license.