


Abstract
Phosphate glasses with the compositions 60P2O5–15ZnO–15CaO–10Li2O (PZCL) and 60P2O5–15ZnO–15CaO–10V2O5 (PZCV) (mol%, expressed as oxides) were synthesized by the melt-quenching method. The prepared glasses were characterized by using X-ray powder diffraction (XRD), Raman spectroscopy, scanning electron microscopy (SEM) and electrochemical impedance spectroscopy (EIS). X-ray diffraction shows only broad diffuse halos without Bragg reflections, indicating that both glasses are X-ray amorphous. Raman analysis confirms that PZCL behaves as a typical alkali-modified ultraphosphate glass containing Q3 and Q2 units, whereas PZCV contains characteristic V–O vibrational modes indicating that vanadate groups are integrated into the phosphate backbone. SEM observations reveal smooth surfaces at low magnification for both glasses; at higher magnification, PZCV shows a compact and homogeneous surface with fine, uniformly dispersed granules, whereas PZCL displays a more textured surface with agglomerates and plate-like features. EIS analysis using the Havriliak–Negami model reveals that the free-charge carrier contribution appears as a step in M′(ω,T) and a peak in M″(ω,T), allowing a clear distinction between conductivity relaxation and interfacial polarization or dipolar effects, with conductivity derived from the M″(ω,T) peak frequency. PZCV shows dc conductivity approximately one order of magnitude higher than PZCL (1.5 × 10⁻⁹ vs. 1.8 × 10⁻¹⁰ S·cm−1 at 120 °C). The temperature dependence follows Arrhenius behavior, with activation energies of about 0.89 eV for PZCV and 1.04 eV for PZCL. The electrode polarization observed at low frequencies with ion-blocking gold electrodes indicates a significant ionic contribution in both glasses, although a polaronic (V4+/V5+) contribution to the conductivity of PZCV cannot be excluded. Capacitance analysis reveals a slight increase with temperature for both samples, with PZCV consistently showing higher values (~7 pF) than PZCL (~5 pF). Although the absolute conductivities remain far below those required for practical solid electrolytes, these results clarify how the replacement of Li2O by V2O5 modifies charge transport and dielectric relaxation in P2O5-rich Zn–Ca phosphate glasses.
1. Introduction
The rapid growth of portable electronics, electric vehicles and renewable energy technologies has markedly increased the demand for efficient and reliable energy storage systems [1,2]. Among the various technologies currently under development, solid-state energy storage devices have attracted considerable attention due to their enhanced safety, long-term stability and improved electrochemical performance compared with conventional liquid-electrolyte systems. In this context, the development of solid electrolyte materials with suitable ionic conductivity and structural stability has become a key research focus [3,4,5,6,7,8,9]. Phosphate glasses represent an important class of materials for solid-state ionic conductors owing to their structural versatility, low melting temperature, and ability to incorporate a wide variety of modifier cations [10,11,12,13,14]. The phosphate network composed of PO4 tetrahedral units linked by bridging oxygen atoms can be easily modified by the introduction of metal oxides such as ZnO and CaO, which contribute to network stabilization and chemical durability and reduce the melting temperature [15,16,17]. These modifiers alter the connectivity of the phosphate network and create non-bridging oxygens that play a crucial role in facilitating ionic mobility within the glass matrix [15,18,19].
Lithium-containing phosphate glasses have been extensively investigated due to the high mobility of Li+ ions, which migrate through the disordered network via thermally activated hopping mechanisms [20,21,22]. However, recent studies suggest that the incorporation of transition metal oxides such as V2O5 can further enhance transport properties by introducing additional conduction pathways associated with mixed valence states (V4+/V5+) and by modifying the local structural environment [23,24,25]. These effects can significantly influence both ionic conductivity and dielectric relaxation behavior.
Recent studies illustrate both potential and open questions concerning these systems. Biswas et al. examined the influence of Li+ doping on the electrical and dielectric properties of zinc–borate–phosphate glasses [3], borophosphate glass-based composites have been developed as electrolytes with high Li+ conductivity [13], and the structural factors controlling ionic conduction in glassy lithium borophosphate electrolytes have been identified [21]. In vanadium-containing glasses, however, charge transport is generally mixed: small-polaron hopping between V4+ and V5+ sites coexists with ion migration, and the relative weight of the two mechanisms depends strongly on composition [26,27,28], whereas in alkali phosphate glasses conduction is essentially ionic [29]. Nandy et al. showed that progressively replacing Li2O by V2O5 in Li2O–V2O5–TeO2–P2O5 glasses modifies both their thermal and dielectric properties [22], and thermal treatment was shown to alter the dc conductivity of lithium–vanadium–iron phosphate glass-ceramics [20]. Most of these studies concern V2O5-rich or tellurite-based matrices, and comparatively little is known about P2O5-rich (ultraphosphate-type) glasses in which a small amount of V2O5 replaces Li2O at fixed ZnO and CaO contents. In addition, the dc conductivity of such glasses is usually extracted from a single representation of the impedance data, so that conductivity relaxation, electrode polarization and dipolar contributions are not clearly separated.
In this work, two samples of phosphate glasses with the nominal compositions (mol%) 60P2O5–15ZnO–15CaO–10Li2O (PZCL) and 60P2O5–15ZnO–15CaO–10V2O5 (PZCV were synthesized via the conventional melt-quenching technique. The structural, morphological, and electrical properties of the prepared glasses were systematically investigated using X-ray diffraction (XRD), Raman spectroscopy, scanning electron microscopy (SEM) and electrochemical impedance spectroscopy (EIS). The aim of this study is to compare, at fixed P2O5, ZnO and CaO contents, how the replacement of Li2O by V2O5 affects the dc conductivity, activation energy and dielectric relaxation of these glasses. To separate conductivity relaxation from electrode polarization, the dc conductivity is determined by two independent procedures (Bode diagrams and the loss peak of the electric modulus analyzed with the Havriliak–Negami formalism), and the nature of the charge carriers is discussed in terms of possible ionic and polaronic contributions.
2. Experimental Procedure
2.1. Sample Preparation
Phosphate-based glasses with nominal compositions 60P2O5–15ZnO–15CaO–10Li2O (PZCL) and 60P2O5–15ZnO–15CaO–10V2O5 (PZCV) (mol%) were synthesized via the conventional melt-quenching technique. High-purity reagents (99.99%, Sigma-Aldrich, Taufkirchen, Germany) sodium dihydrogen phosphate dihydrate (NaH2PO4·2H2O), zinc oxide (ZnO), calcium carbonate (CaCO3), vanadium pentoxide (V2O5), and lithium carbonate (Li2CO3).
The batches were melted in platinum crucibles at 1100 °C for 2 h. The resulting homogeneous melts were poured into a steel mold preheated to 200 °C and subsequently cooled slowly to room temperature. It should be noted that 200 °C corresponds to the preheating temperature of the steel mold and does not refer to a post-annealing treatment of the glass samples.
P2O5, CaO, and Li2O were introduced through NaH2PO4·2H2O, CaCO3, and Li2CO3 precursors, respectively. During heating and melting, NaH2PO4·2H2O undergoes dehydration and subsequent condensation/decomposition with the release of H2O, whereas CaCO3 and Li2CO3 undergo thermal decomposition with the release of CO2. Consequently, the compositions reported in this work correspond to nominal starting-batch formulations expressed on an oxide-equivalent basis and should not be interpreted as quantitative measurements of the final glass composition.
It should also be emphasized that NaH2PO4·2H2O introduces sodium into the starting batch, and a fraction of this sodium may be retained in the final glass. Since the present EDS measurements do not allow reliable quantitative determination of sodium, mainly because of the overlap between the Na Kα and Zn L emission lines, its actual concentration in the final glass could not be established. Therefore, the possible contribution of Na+ to the measured electrical response is acknowledged in the interpretation of the conductivity results.
2.2. Technical Measurements
The structure of the glass samples was examined by X-ray diffraction (XRD) (Philips X’PERTMPD, Eindhoven, The Netherlands) with CuKα radiation (λ = 1.54060 A), working at room temperature. The XRD pattern of the glasses was conducted using a wide range of Bragg angle θ (10° ≤ θ ≤ 80°) at a scanning rate of 3°/min. The Raman spectra were carried out with a Horiba Jobin Yvon LabRAM UV HR microspectrometer equipped with a thermoelectrically cooled multichannel CCD detector that allows a spectral resolution better than 2 cm−1. The Raman spectrum of the two phosphate glasses, excited with a HeNe laser (632.8 nm line) with a power of less than 10 mW, were collected in back-scattering geometry using a ULF Notch filter that allows for obtaining a 10 cm−1 signal. The surface morphology was investigated using scanning electron microscopy (SEM, TESCAN VEGA3) coupled with energy-dispersive X-ray spectroscopy (EDS, TESCAN VEGA3, TESCAN Orsay Holding, Brno, Czech Republic). The same angular range and scan conditions were used for both glasses.
Electrochemical impedance spectroscopy (EIS) measurements were carried out to study the transversal conductivity of the phosphates glass samples using a Novocontrol broadband dielectric spectrometer (BDS, Concept 80, (Hundsangen, Germany)) combined with an SR 830 lock-in amplifier with an alpha dielectric interface in the range of 10−1 to 107 Hz, utilizing a 0.1 V signal amplitude to avoid any non-linear effects, in a range of temperature between 20 and 200° in steps of 20 °C. The temperature was controlled by a Novocontrol cryosystem (Quatro Cryosystem, Novocool, Novotherm/Novotherm-HT), in which nitrogen was used as the heating/cooling gas. The average thickness of the phosphate glass samples tested were measured previously by taking the average of five measurements in different surface planes using a micrometer, and subsequently sandwiched between two gold electrodes of 10 mm diameter (S = 0.785 cm2) attached to the impedance spectrometer where the measurements were carried out in a vacuum cell working as blocking electrodes [30,31]. The samples were annealed at the highest experimental temperature (200 °C) prior to the dielectric measurement, in order to remove adsorbed moisture, relax the contacts between the glass and the electrodes, and erase the thermal history associated with sample handling, so that the subsequent isothermal measurements are reproducible. This temperature is expected to lie well below the glass transition of these P2O5-rich glasses, which contain 30 mol% of divalent modifiers known to raise the glass transition temperature of phosphate glasses [32].
3. Results and Discussion
3.1. XRD Analysis
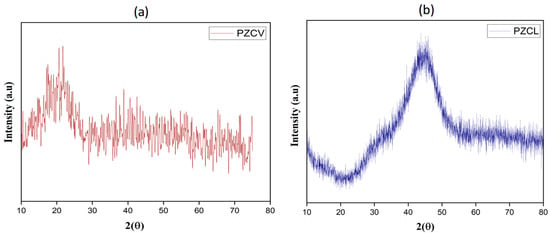
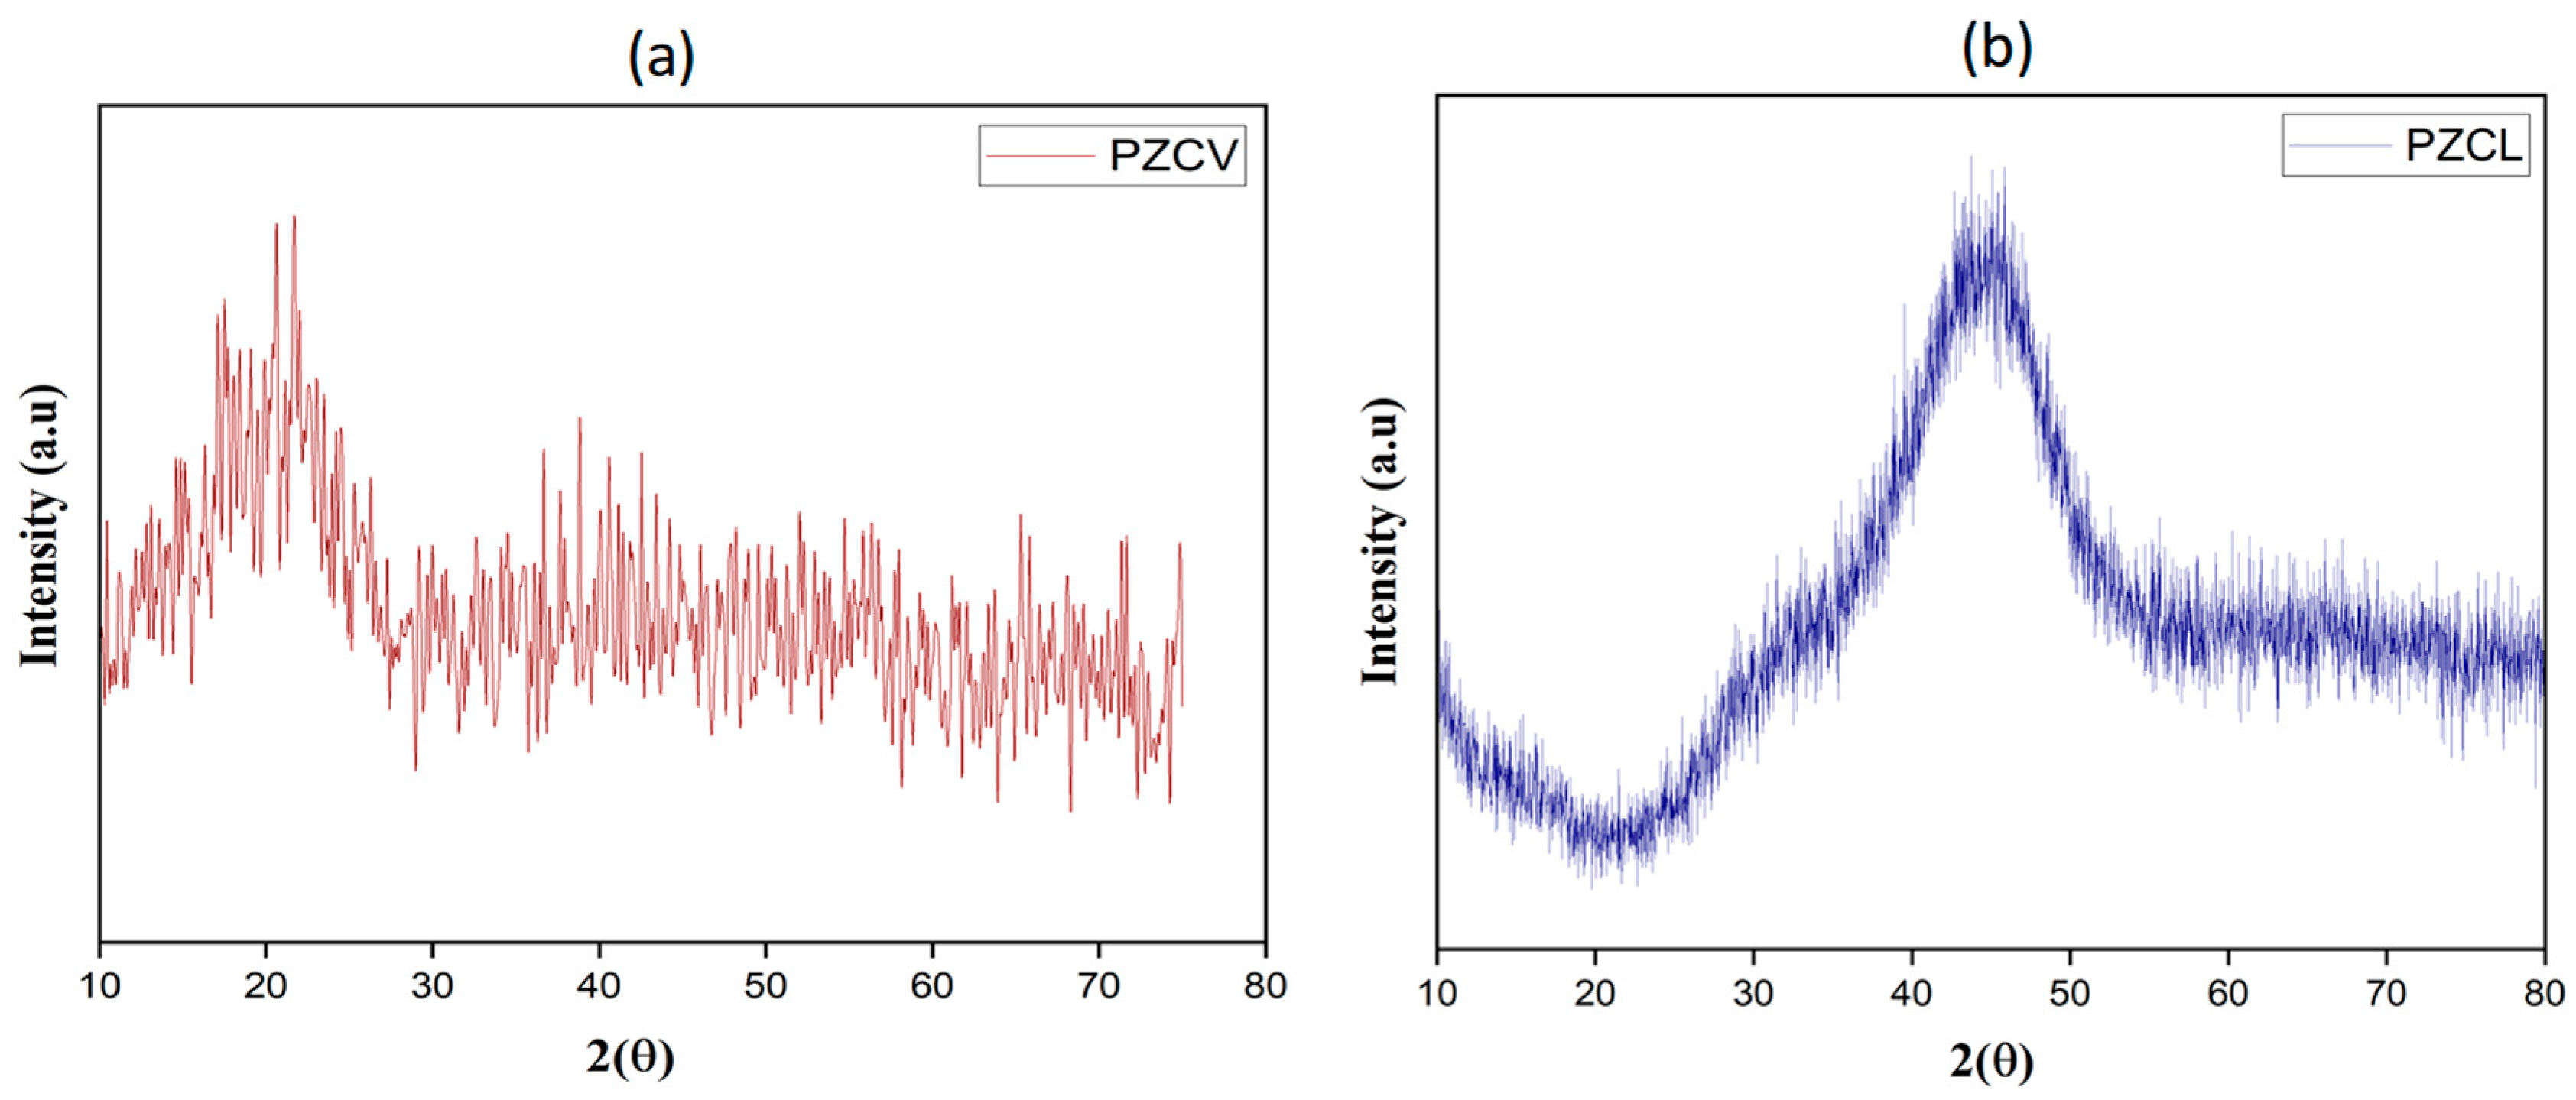
The X-ray diffraction (XRD) patterns of the prepared glasses are shown in Figure 1a for PZCV and Figure 1b for PZCL.
Figure 1.
X-ray diffraction patterns of PZCV (a) and PZCL (b).
In both patterns, a broad diffuse halo is observed in the absence of sharp Bragg reflections, indicating that both glasses are X-ray amorphous. Both patterns were recorded over the same angular range (2θ = 10–80°). The two halos nevertheless differ in position and shape: PZCV shows a broad maximum centered at 2θ ≈ 20–25°, typical of the diffuse scattering of P2O5-rich networks built from corner-sharing PO4 tetrahedra [32], whereas PZCL exhibits a broader hump centered at about 45°, together with a rising background at low angles. Such a difference in the position of the diffuse maximum reflects a different distribution of short-range interatomic distances and may be related to the different roles of Li+, which acts as a network modifier, and of vanadium, which is partly incorporated into the phosphate backbone as VOx units (Section 3.2). The pattern of PZCV is noisier, owing to the relatively fast scan rate (3°/min). The isolated spikes visible near 2θ ≈ 21° are confined to single data points, have the same amplitude as the statistical fluctuations observed over the whole angular range, and are not accompanied by any other reflection; they are therefore attributed to counting noise rather than to Bragg reflections. XRD cannot, however, exclude nanometer-sized crystallites or crystalline fractions below its detection limit (a few vol.%), and the samples are therefore described as X-ray amorphous.
3.2. Raman Spectra
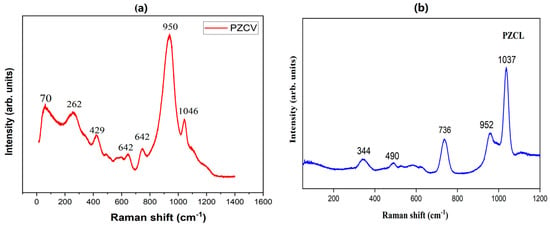
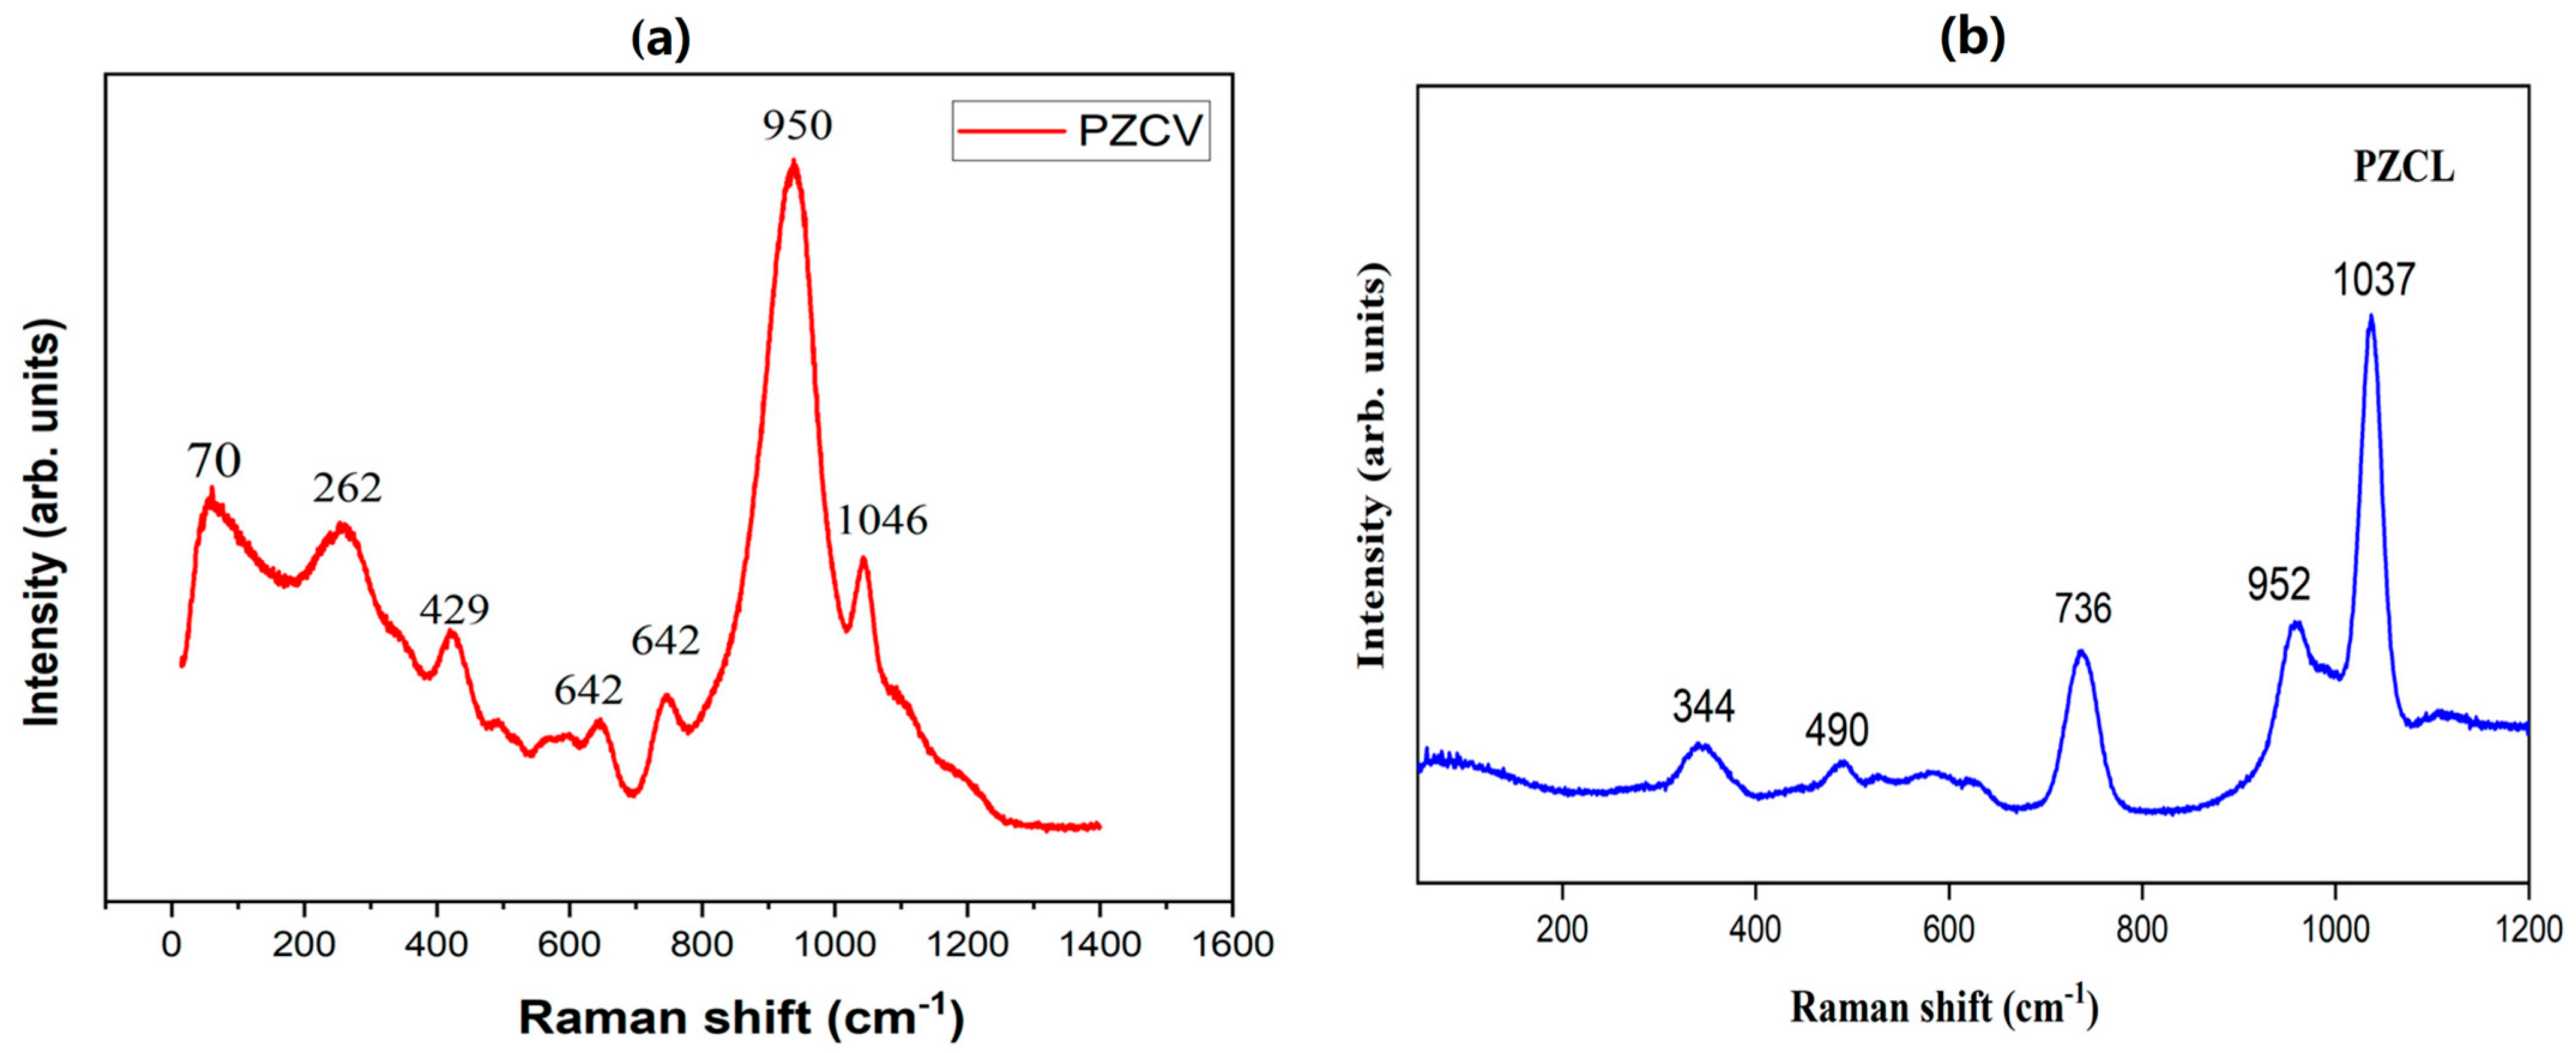
Figure 2a shows the Raman spectrum of the PZCV glass, which is dominated by a strong band near 950 cm−1 attributed to the symmetric stretching mode of terminal PO2 units, νs(PO2), a feature characteristic of Q2 phosphate groups in metaphosphate chains [33]. A nearby band around 1046 cm−1 is assigned to the corresponding asymmetric stretching vibrations, νas(PO2), of these PO2 entities (non-bridging oxygen in the middle of the chain) [34]. Weaker features at about 70, 262, 429, and 642 cm−1 are ascribed to M lattice vibrations of modifier cations (Zn2+, Ca2+), in-plane bending of PO33− units, and bending vibrations of V–O–V linkages, respectively [35]. In contrast, Figure 2b displays the Raman spectrum of the PZCL glass, characterized by well-defined bands located at approximately 344, 490, 736, 952, and 1037 cm−1. The low-wavenumber bands at around 344 and 490 cm−1 are attributed to the bending and deformation modes of P–O–P and O–P–O linkages of PO4 tetrahedra in the glass network [36,37,38]. The pronounced band near 736 cm−1 corresponds to the symmetric stretching of bridging P–O–P bonds in Q3 phosphate units, indicating relatively polymerized phosphate chains [39,40]. The higher-frequency peaks near 952 and 1037 cm−1 are assigned to the stretching vibrations of non-bridging P–O− bonds in PO2 groups and terminal P=O bonds in Q2 units, respectively, revealing partial depolymerization due to Zn2+, Ca2+ and Li+ [39,41].
Figure 2.
Raman spectra of (a) PZCV and (b) PZCL.
3.3. Morphological Analysis
3.3.1. SEM Analysis
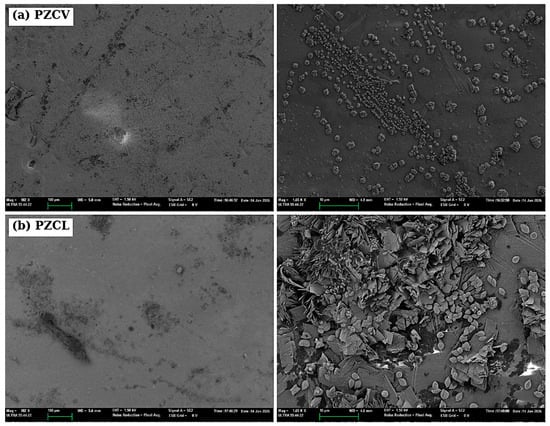
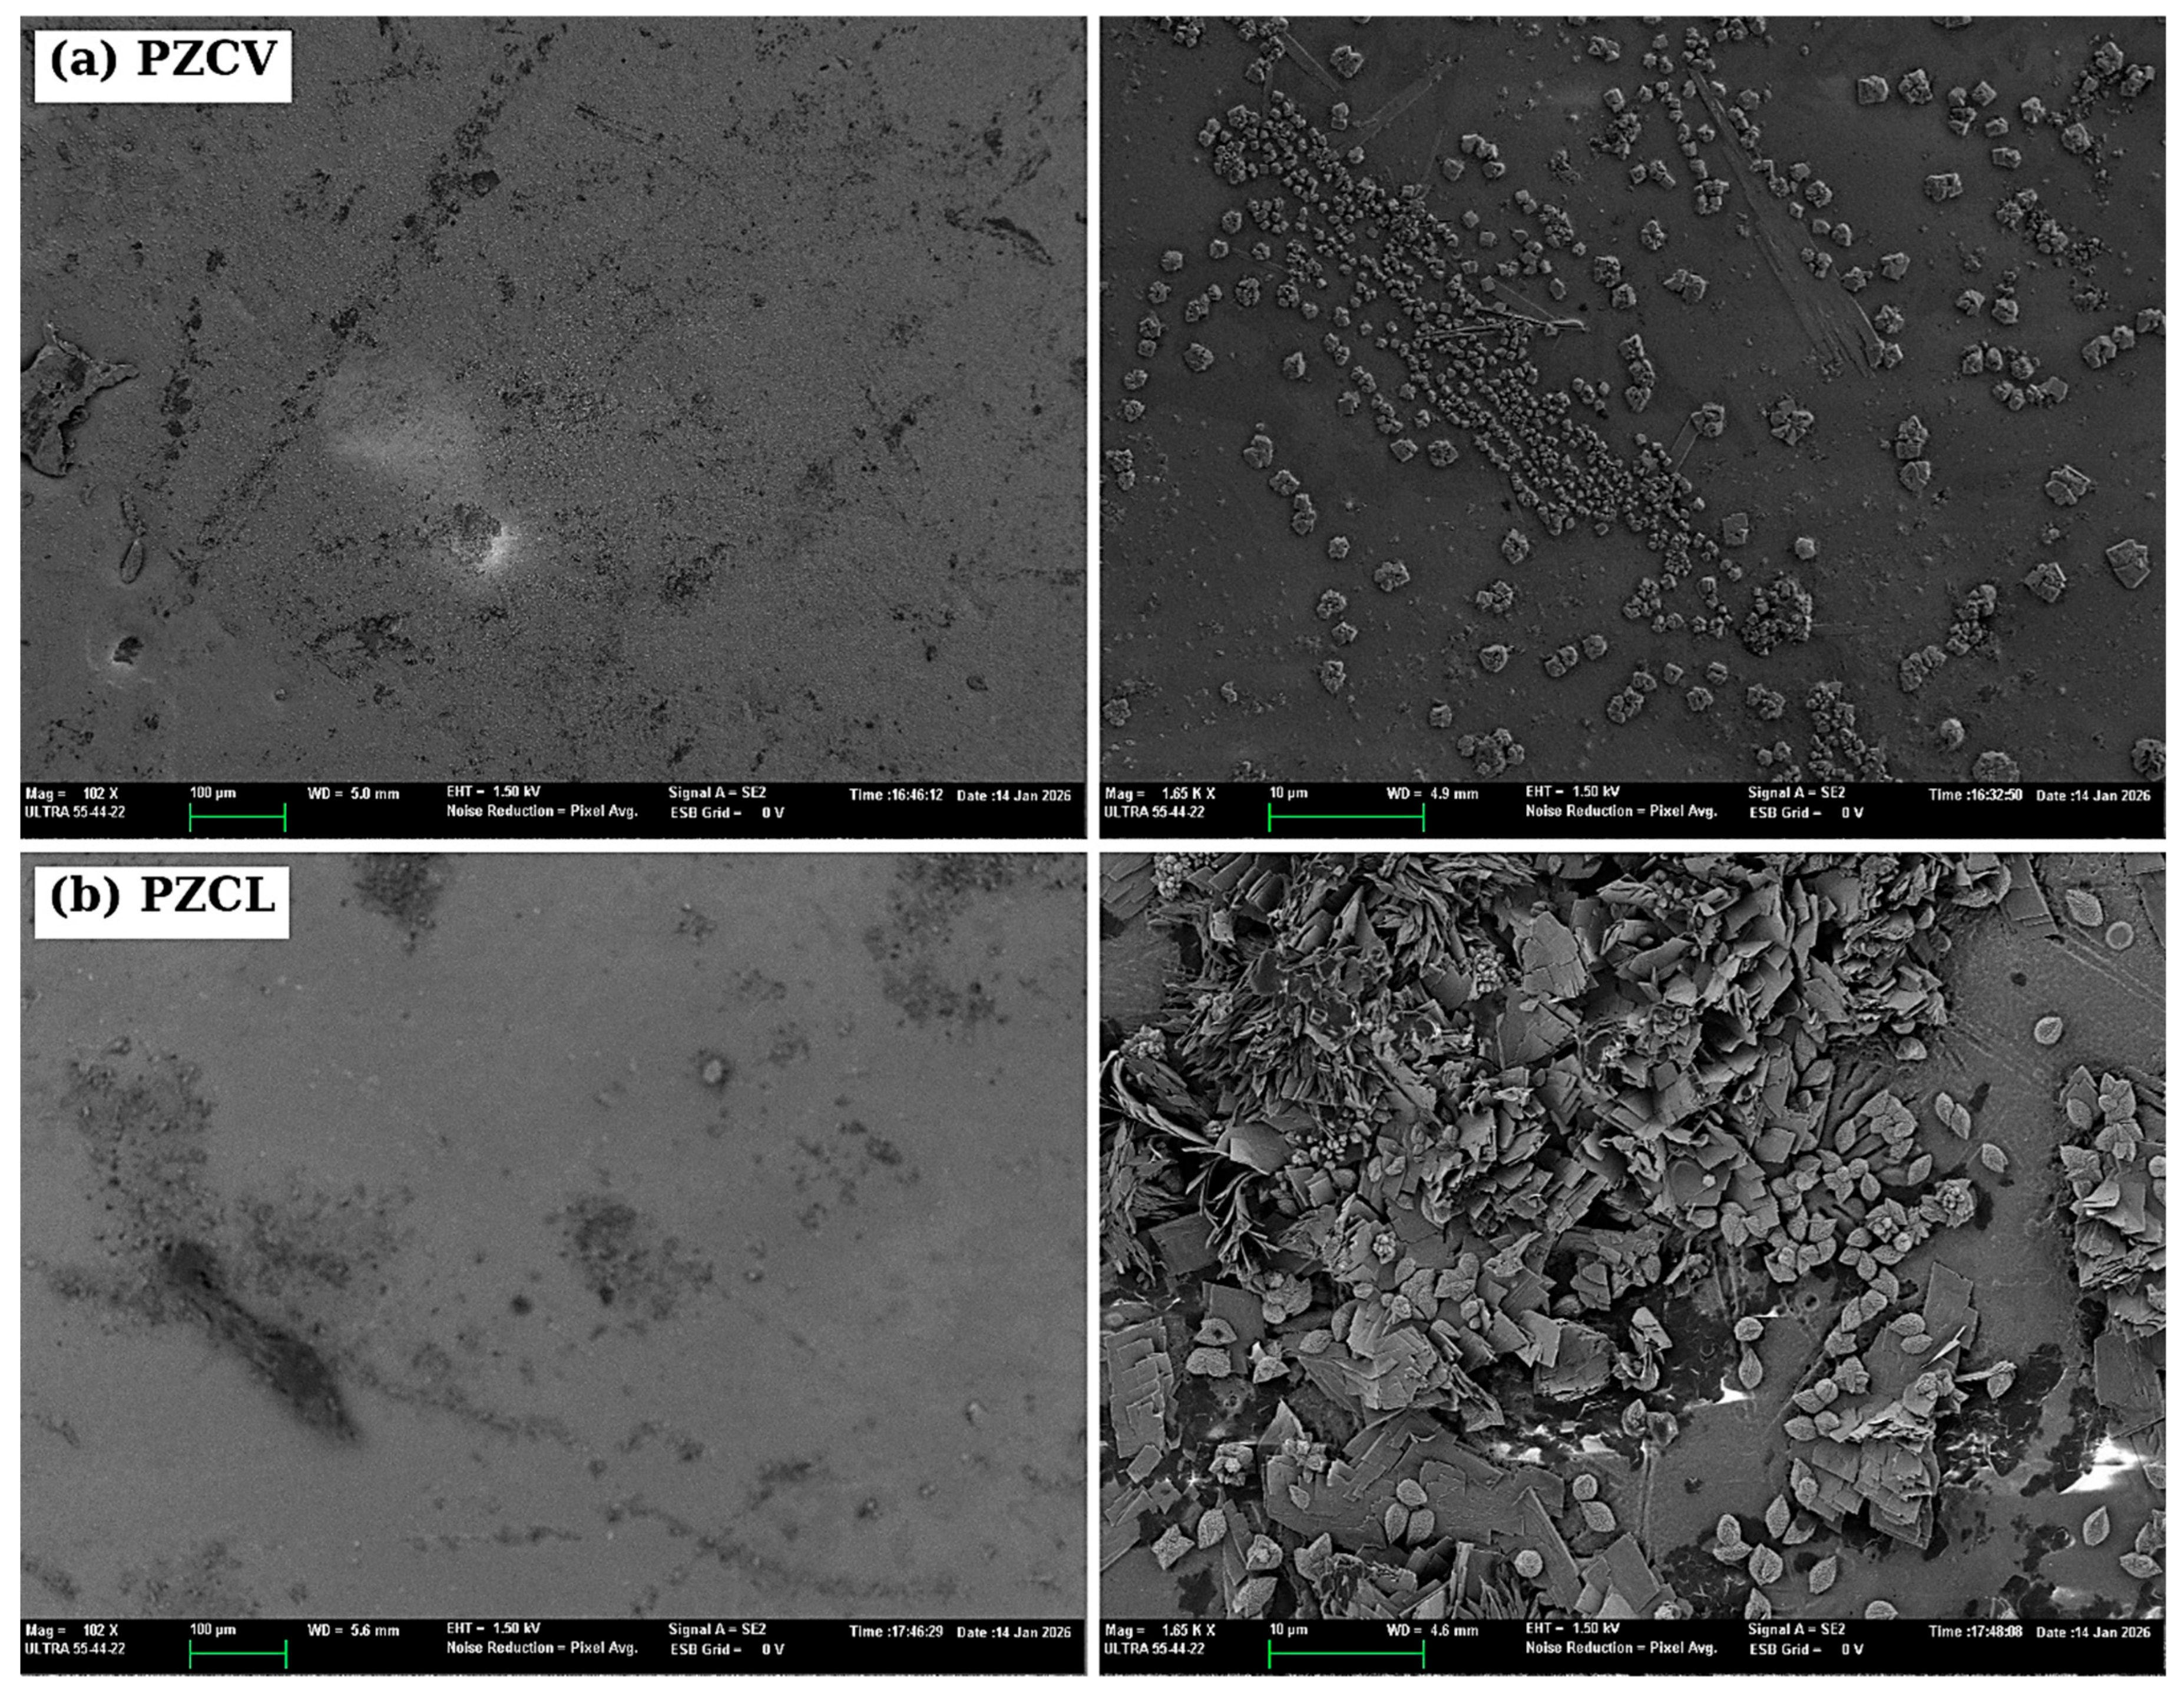
Figure 3a,b displays the surface microstructure of the PZCV (a) and PZCL (b) glasses at two magnifications (scale bars of 100 µm, left, and 10 µm, right). At low magnification, both glasses display smooth surfaces without grain boundaries, pores or cracks, as expected for melt-quenched glasses. At higher magnification, differences in surface texture appear: PZCV presents a compact and homogeneous surface on which fine, rounded, micrometer-sized granules are uniformly dispersed, whereas PZCL exhibits a more textured surface with agglomerates and plate-like features. PZCV therefore shows the more homogeneous surface and PZCL the more textured one. Since no Bragg reflections are detected by XRD (Section 3.1), these features are confined to the outermost surface, and their volume fraction is below the XRD detection limit. They are most likely related to the reaction of these hygroscopic, P2O5-rich glasses with atmospheric moisture and/or to residues of sample preparation rather than to bulk crystallization, although the presence of surface microcrystals cannot be completely ruled out from SEM observations alone. The micrographs shown were selected as representative of the regions examined on each sample, and XRD and SEM are thus consistent with X-ray amorphous bulk glasses whose surfaces show composition-dependent textures.
Figure 3.
SEM images of PZCV (a) and PZCL (b).
3.3.2. EDS Analysis
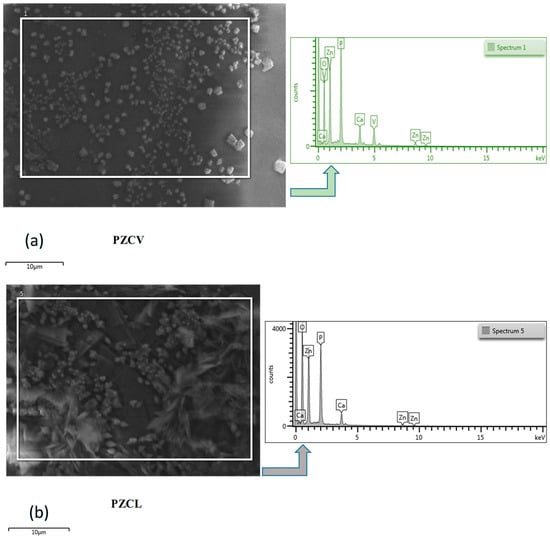
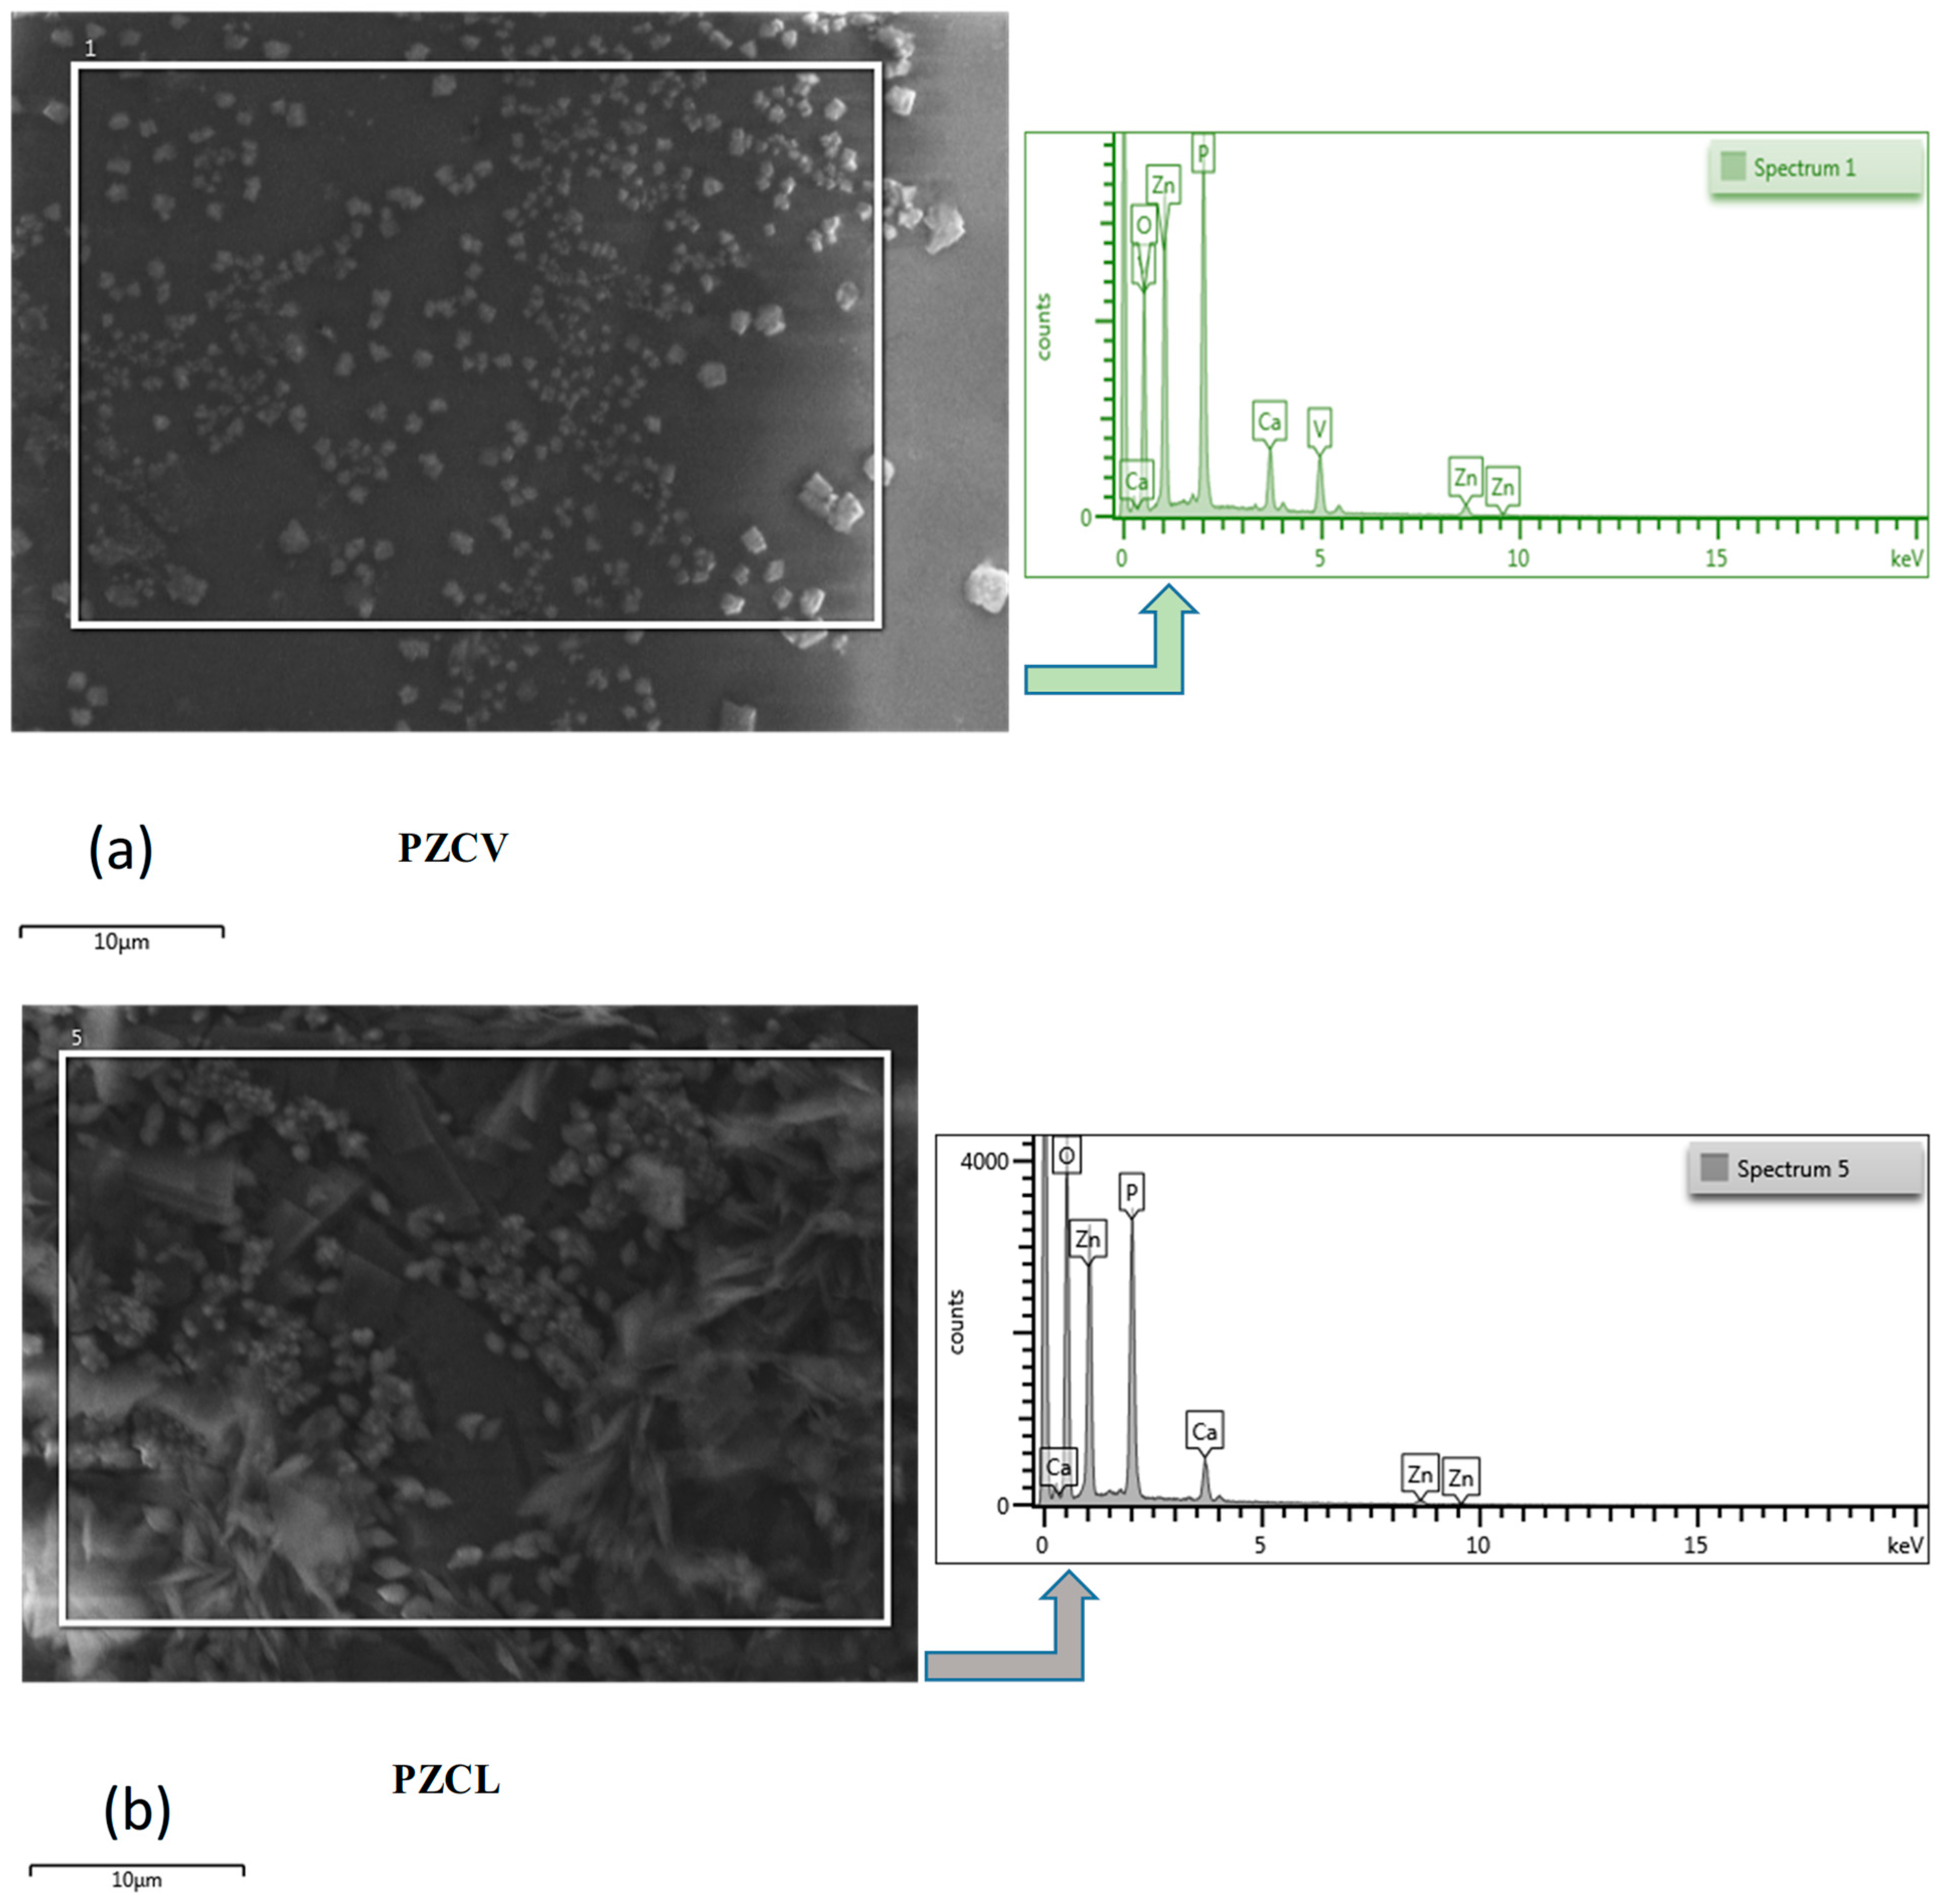
Figure 4a,b show the EDS analysis of the PZCV and PZCL samples. These spectra reveal the elements P, O, Zn, Ca and V, while lithium was not detected because its characteristic X-ray emission is of too low energy to be measured by conventional EDS. Carbon was not detected either: CaCO3 and Li2CO3 decompose completely during heating (CaCO3 → CaO + CO2 ↑; Li2CO3 → Li2O + CO2 ↑), well below the melting temperature of 1100 °C, the decomposition of Li2CO3 being further promoted by the acidic phosphate melt, so that carbon leaves the batch as CO2 and is not retained in the glass. Any residual carbon at trace level would, moreover, be below the detection limit of EDS for this light element. Likewise, no sodium is expected, since NH4H2PO4 was used as the phosphorus source. The close correspondence between the identified elements and the nominal compositions indicates that the glass network remained intact, with no significant ionic volatilization during melting. The corresponding chemical compositions are reported in Table 1 and show only minor variations in matrix elements. For the PZCL glass, the detected weight percentages P (35.82 wt.%), O (50.83 wt.%), Zn (6.91 wt.%), and Ca (7.04 wt.%) are of the same order as the nominal values calculated from the batch composition 60P2O5–15ZnO–15CaO–10Li2O (P 34.2, O 50.0, Zn 9.0, Ca 5.5, and Li 1.3 wt.%). Similarly, the PZCV glass exhibits P (26.84 wt.%), O (47.89 wt.%), Zn (6.91 wt.%), Ca (7.04 wt.%), and V (11.24 wt.%), to be compared with the nominal values (P 30.0, O 49.0, Zn 7.9, Ca 4.9, and V 8.2 wt.%) of its batch composition 60P2O5–15ZnO–15CaO–10V2O5. The successful incorporation of vanadium into the phosphate glass matrix is clearly evidenced. The deviations between measured and nominal values, which reach several tens of percent (relative) for the minor elements Zn, Ca and V, are attributed to the semi-quantitative character of standardless EDS analysis of glasses, to the overlap of the V L and O K lines (≈0.51 and 0.52 keV), which affects the quantification of both elements, and to the surface sensitivity of the technique, which probes only the first micrometers of the samples. The EDS results therefore confirm the presence of the expected elements and the incorporation of vanadium, but they are not used here for a precise quantitative determination of the glass composition.
Figure 4.
EDS spectra and analyzed areas of (a) PZCV and (b) PZCL.
Table 1.
Elemental composition of the glasses determined by EDS (wt.%).
3.4. Dielectric Spectroscopy Analysis
Electrochemical impedance spectroscopy (EIS) measurements were carried out on the PZCL and PZCV samples at different temperatures to investigate their electric conductivity and dielectric response. The data were analyzed in terms of the complex dielectric permittivity defined as
and the complex conductivity given by
where ω is the angular frequency (ω = 2π f), f the frequency of the externally applied electric field, T the temperature, ε0 the vacuum permittivity, and j the imaginary unit (j = (−1)1/2).
ε*(ω,T) = ε′(ω,T) − j ε″(ω,T)
σ*(ω,T) = j ω ε0 ε*(ω,T)
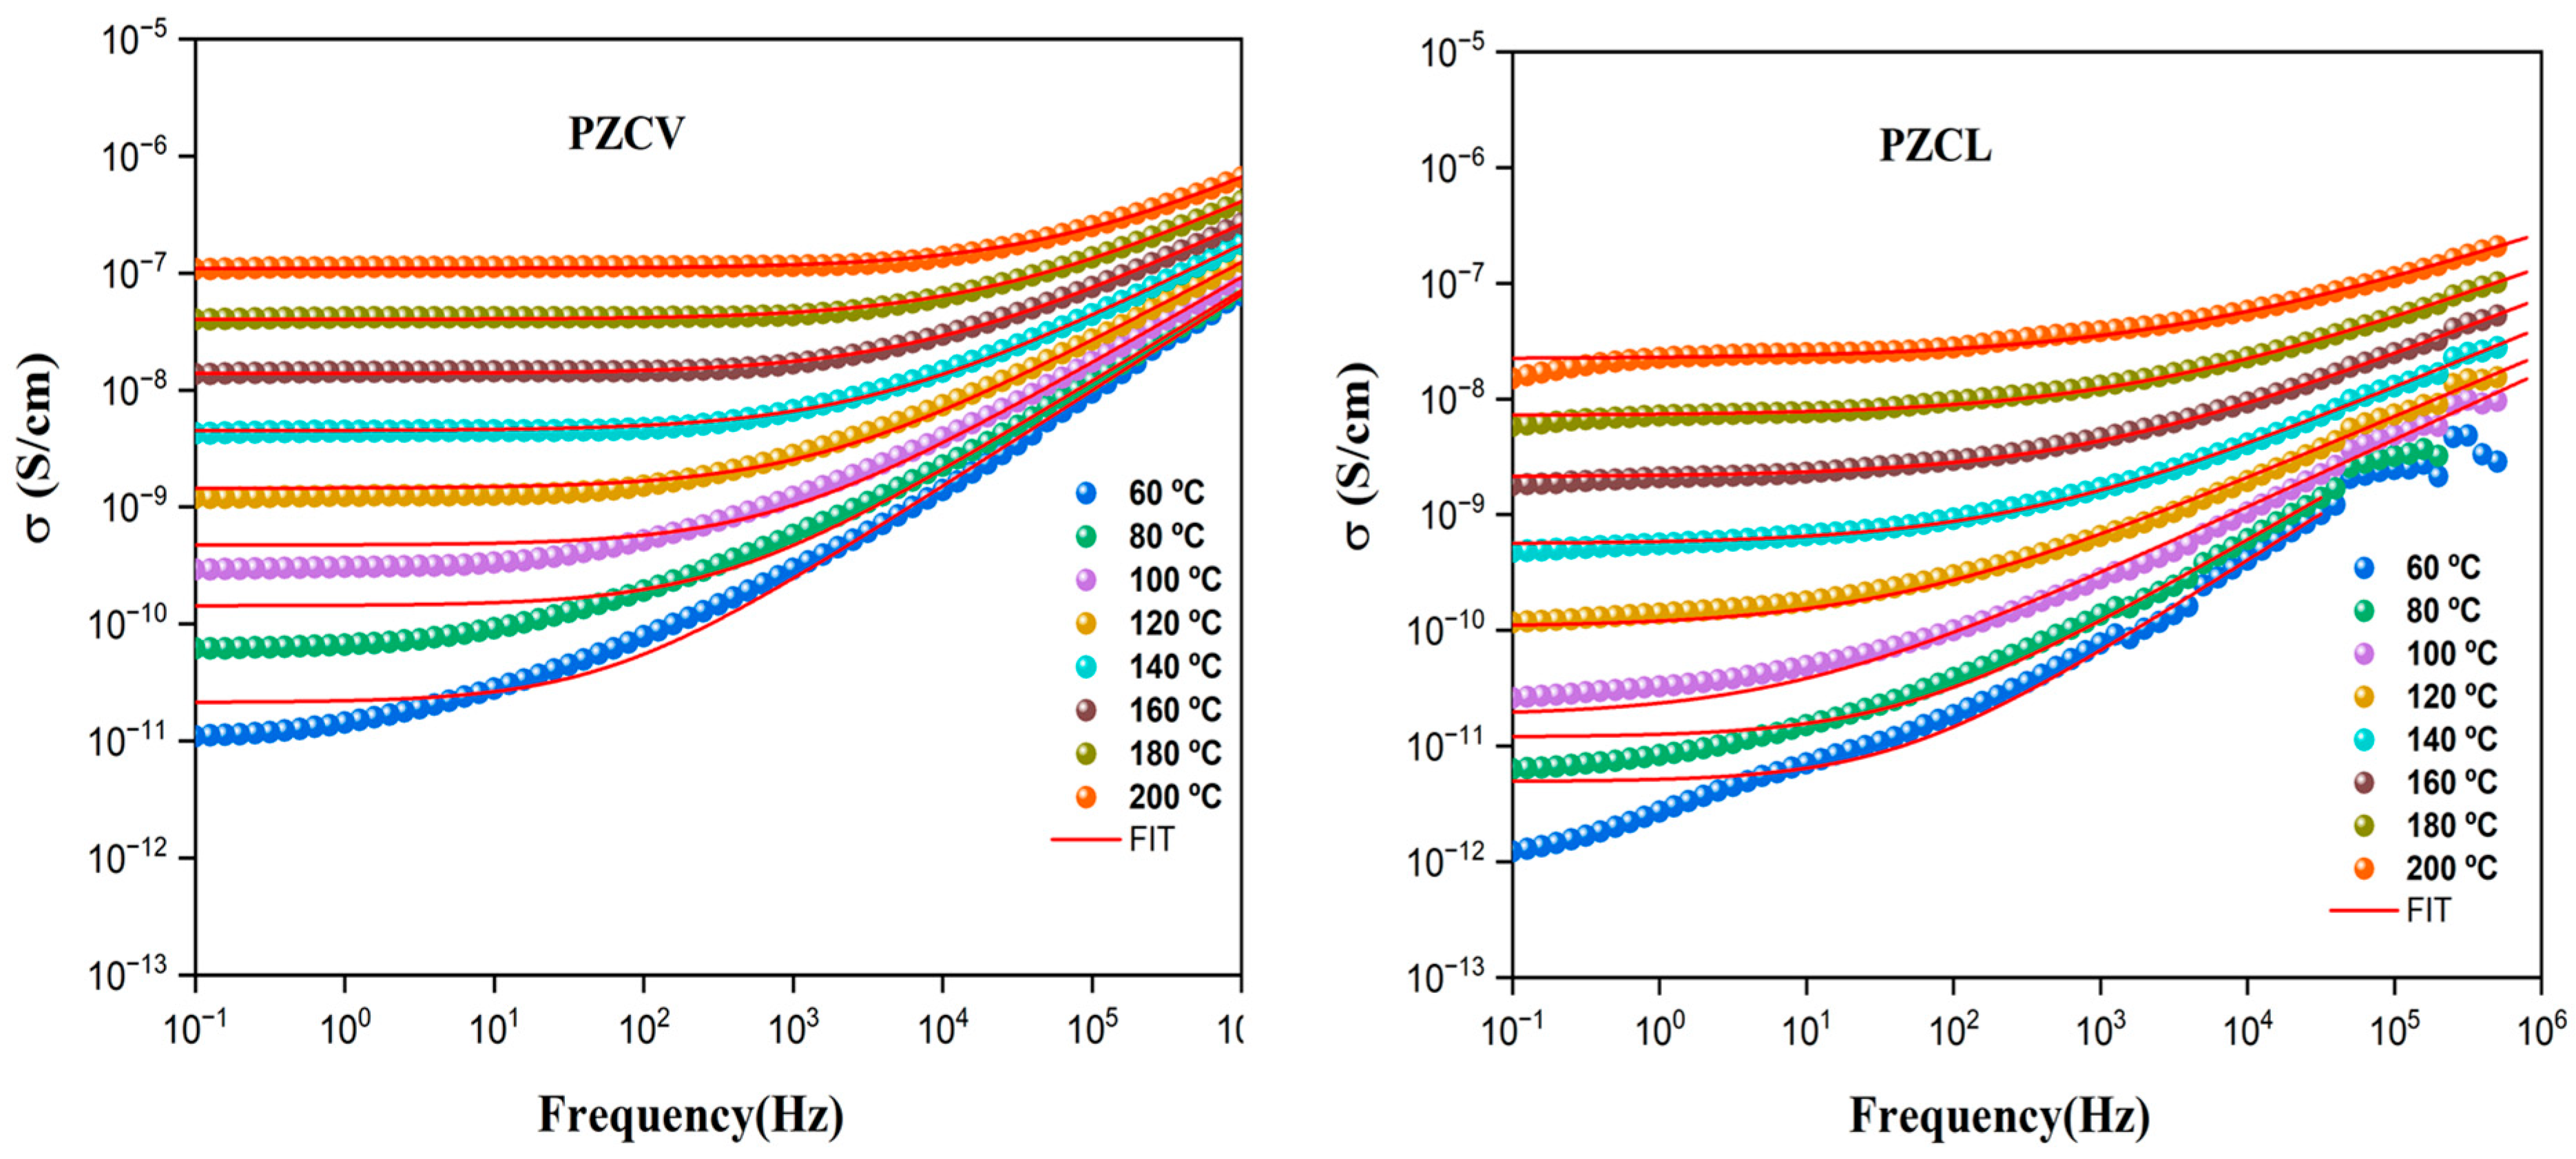
The electrical conductivity was determined using two different methodologies. The first approach is based on the analysis of Bode diagrams over the investigated temperature range from 20 °C to 200 °C. Figure 5 presents the Bode plots of the real part of the conductivity for the PZCV and PZCL samples. In addition, the phase angle is plotted to identify the frequency region where it approaches zero. In this region, the real part of the conductivity becomes frequency-independent, corresponding to the dc conductivity plateau.
Figure 5.
Bode diagrams for the samples PZCV and PZCL. The lines represent the fit of Jonscher’s power law given by Equation (3).
From this figure, dispersion phenomenon can be observed where the real part of the conductivity increasing with increasing frequency, following Jonscher’s power law in the range of 80 °C to 200 °C, expressing the conductivity as a frequency-dependent function σ(ω) = σdc + σac, where σdc is the direct-current and σac the alternate-current conductivity. This behavior for the phosphates glasses PZCL and PZCV can be described as follows [42]:
where σ(ω) is the conductivity at a given frequency ω, σ0 represents the dc conductivity, A is a constant, and n is the exponent characterizing the frequency dependence of the conductivity [42,43]. The values of n when the temperature is higher than 100 °C are 0.9 < n < 1, and σdc values are similar to those gathered in Table 2, as determined from the Bode diagrams at the frequency where the phase angle reaches approximately −45°.
σ(ω) = σo + Aωn
Table 2.
Relative permittivity values at high frequency and near-zero frequency obtained for the samples PZCV and PZCL in the temperature ranges studied. The dc conductivity determined from the Bode diagram and from the frequency-loss peak position in M″, (fM″,max) are also given.
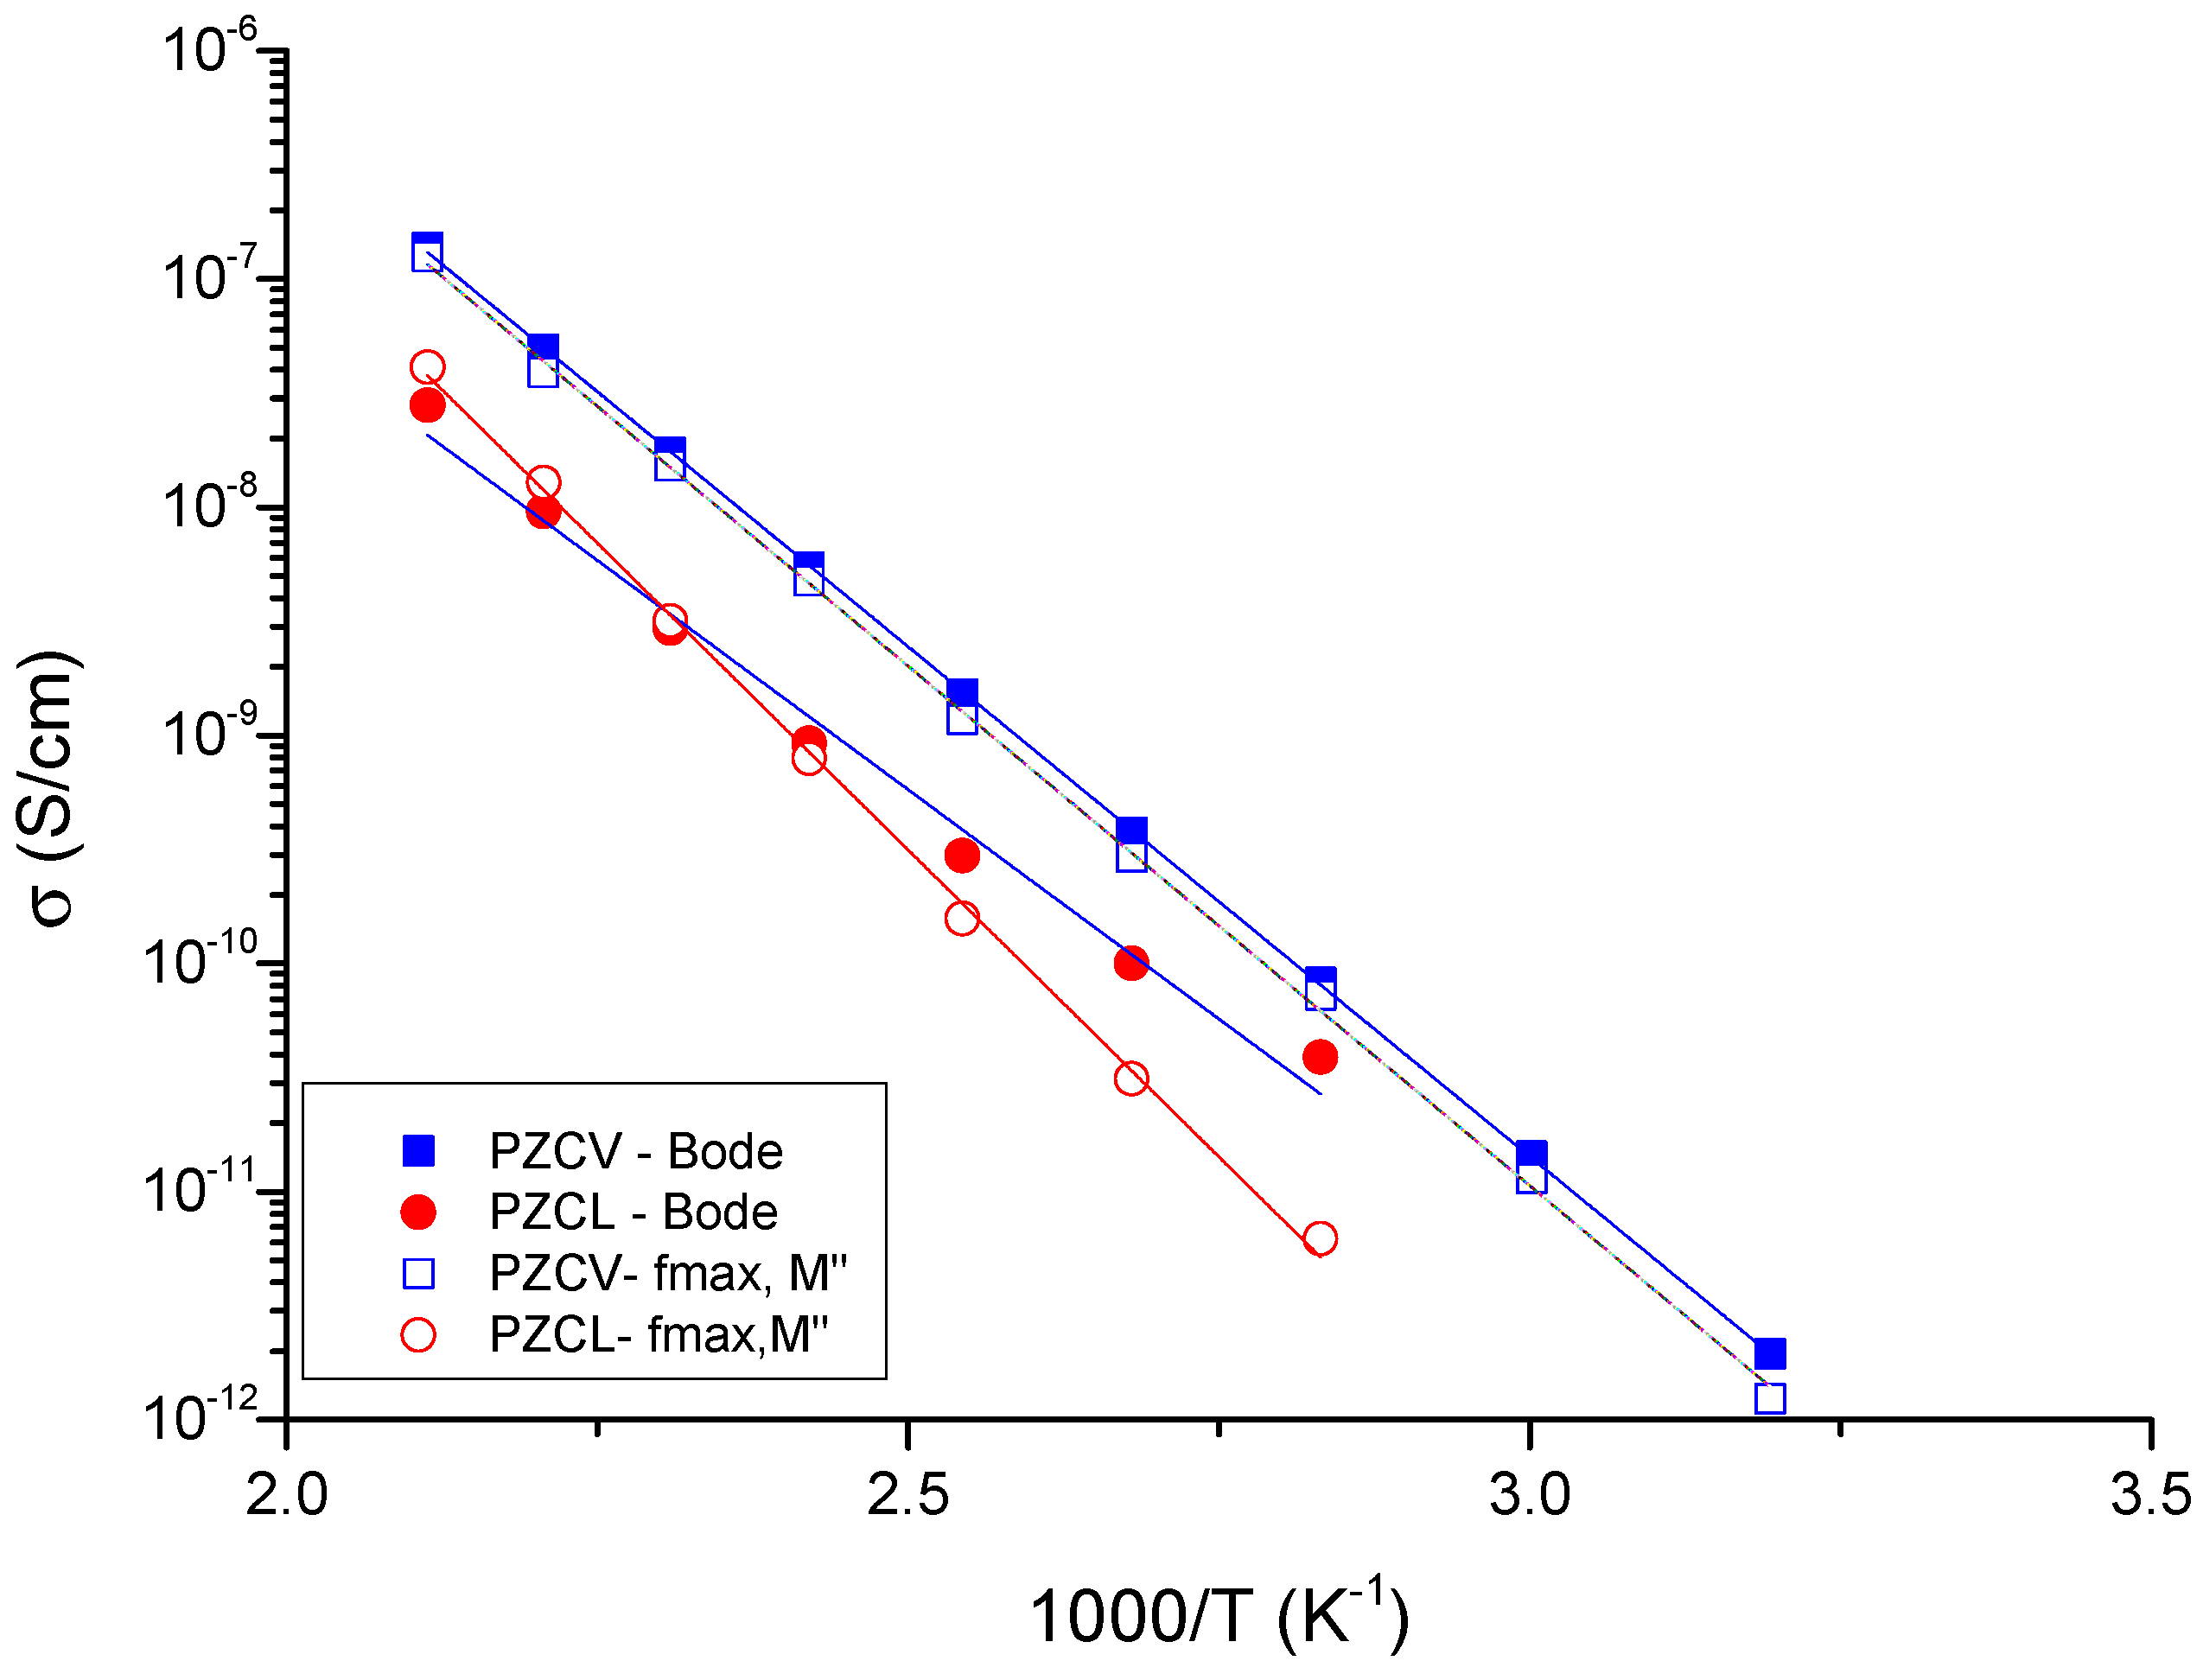
In this study, dc conductivity was determined from the Bode diagrams at the frequency where the phase angle reaches approximately −45°, corresponding to the inflection point in the phase angle versus frequency plot. The values obtained are presented for both samples in the Arrhenius plot, shown in Figure 6, where we can observe the conductivity values obtained using the Bode diagram, according to the chosen criterion and Figure 5, ranging from 80 °C to 200 °C for the PZCL sample, and from 40 °C to 200 °C in the case of the PZCV sample.
Figure 6.
Arrhenius plot showing the temperature dependence of the conductivity of PZCV and PZCL based on the ( ,
 ) conductivity values obtained from Bode diagram and (
 ,
 ) determined from the angular frequency-loss peak position in M”, (fM”,max). The lines represent the linear fit to the experimental values.
, ) conductivity values obtained from Bode diagram and (, ) determined from the angular frequency-loss peak position in M”, (fM”,max). The lines represent the linear fit to the experimental values.
From Figure 6 we can see that the conductivity follows a linear trend, increasing with temperature in accordance with the Arrhenius relation:
where is the dc conductivity of the sample (S/cm), is the pre-exponential factor (S·cm−1), is the activation energy (kJ·mol−1), R is the ideal gas constant (8.314 J·mol−1·K−1), and T is the temperature (K).
In the both phosphate glasses PZCV and PZCL, the conductivity increases with temperature, exhibiting a linear trend in the temperature range between 40 °C and 200 °C in case of sample PZCV and in the range between 80 °C and 200 °C for PZCL, with a significantly higher conductivity in PZCV relative to PZCL. Therefore, the substitution of Li2O by V2O5 in the glass structure leads to pronounced differences in the electrical properties of the materials.
The activation energy for each sample was calculated from the slopes of the Arrhenius plots. In the case of the PZCL sample, in the range from 80 °C to 200 °C, the activation energy was (100.6 ± 1.8) kJ/mol. However, in the case of the PZCV sample the activation energy was (85.9 ± 0.3) kJ/mol obtained in the range temperature from 40 °C to 200 °C.
From the results shown in the Bode diagrams (Figure 6), it can be observed that thermal activation is more pronounced for the PZCV sample compared to PZCL. The comparison between both samples indicates that PZCV exhibits a conductivity approximately one order of magnitude higher than PZCL. For example, at 80 °C, the conductivity of PZCV is 7.66 × 10⁻¹¹ S/cm, whereas for PZCL it is 7.23 × 10⁻¹² S/cm. At 120 °C, the corresponding values are 1.46 × 10⁻⁹ S/cm and 1.78 × 10⁻¹⁰ S/cm for PZCV and PZCL, respectively (rounded to 1.5 × 10⁻⁹ and 1.8 × 10⁻¹⁰ S/cm in Table 2).
From the temperature dependence of conductivity extracted from the Bode diagrams and presented in Figure 6, it can be concluded that the electrical conductivity is strongly dependent on the type of cation incorporated into the phosphate glass network. In particular, when vanadium is used as the modifying cation, the conductivity is about one order of magnitude higher than in the case of lithium.
The second method used to determine the conductivity is based on the complex electric modulus , where the complex modulus is defined as the inverse of the complex dielectric permittivity
where and are the real and imaginary parts of the complex electric modulus, respectively.
Considering a Havriliak–Negami (HN)-type relaxation, the complex dielectric permittivity can be expressed as:
where , with and denoting the static and high-frequency dielectric permittivities, respectively. The parameter represents the dielectric relaxation time in the system for the formulation of Havriliak–Negamy (HN) , while are the shape parameters of the HN model. The parameter () describes the symmetric broadening of the relaxation peak, whereas () accounts for its asymmetry. Debye relaxation is recovered for , while any deviation from these values indicates a non-Debye relaxation process characterized by a distribution of relaxation times.
Using Equation (5), the complex electric modulus is obtained as:
Defining Ms = 1/εs and M∞ = 1/ε∞, the complex electric modulus can be expressed in the standard Havriliak–Negami form as:
Calling , the real and imaginary components of the modulus in the Havriliak–Negami formalism are given as [44,45]
where
and
In this formalism, τ is the relaxation time of the total system, A is the shape parameter representing a symmetrical distribution of relaxation times, and β is the shape parameter of an asymmetric relaxation curve.
τ (i.e τ = τM) is related to the dielectric relaxation time through .
The experimental modulus spectra were fitted using the Havriliak–Negami expression to extract the relaxation parameters (τ), (α), and (β), which provide information about the relaxation dynamics and conduction mechanism in the investigated glasses.
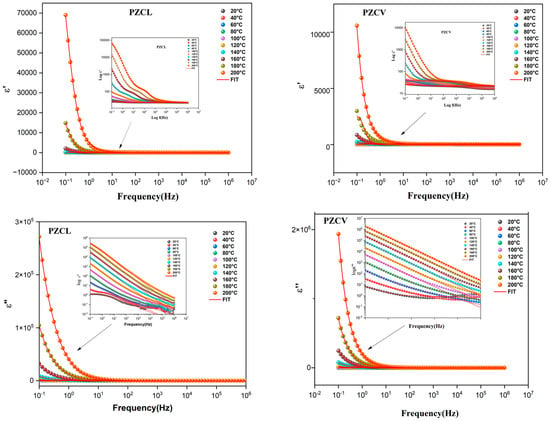
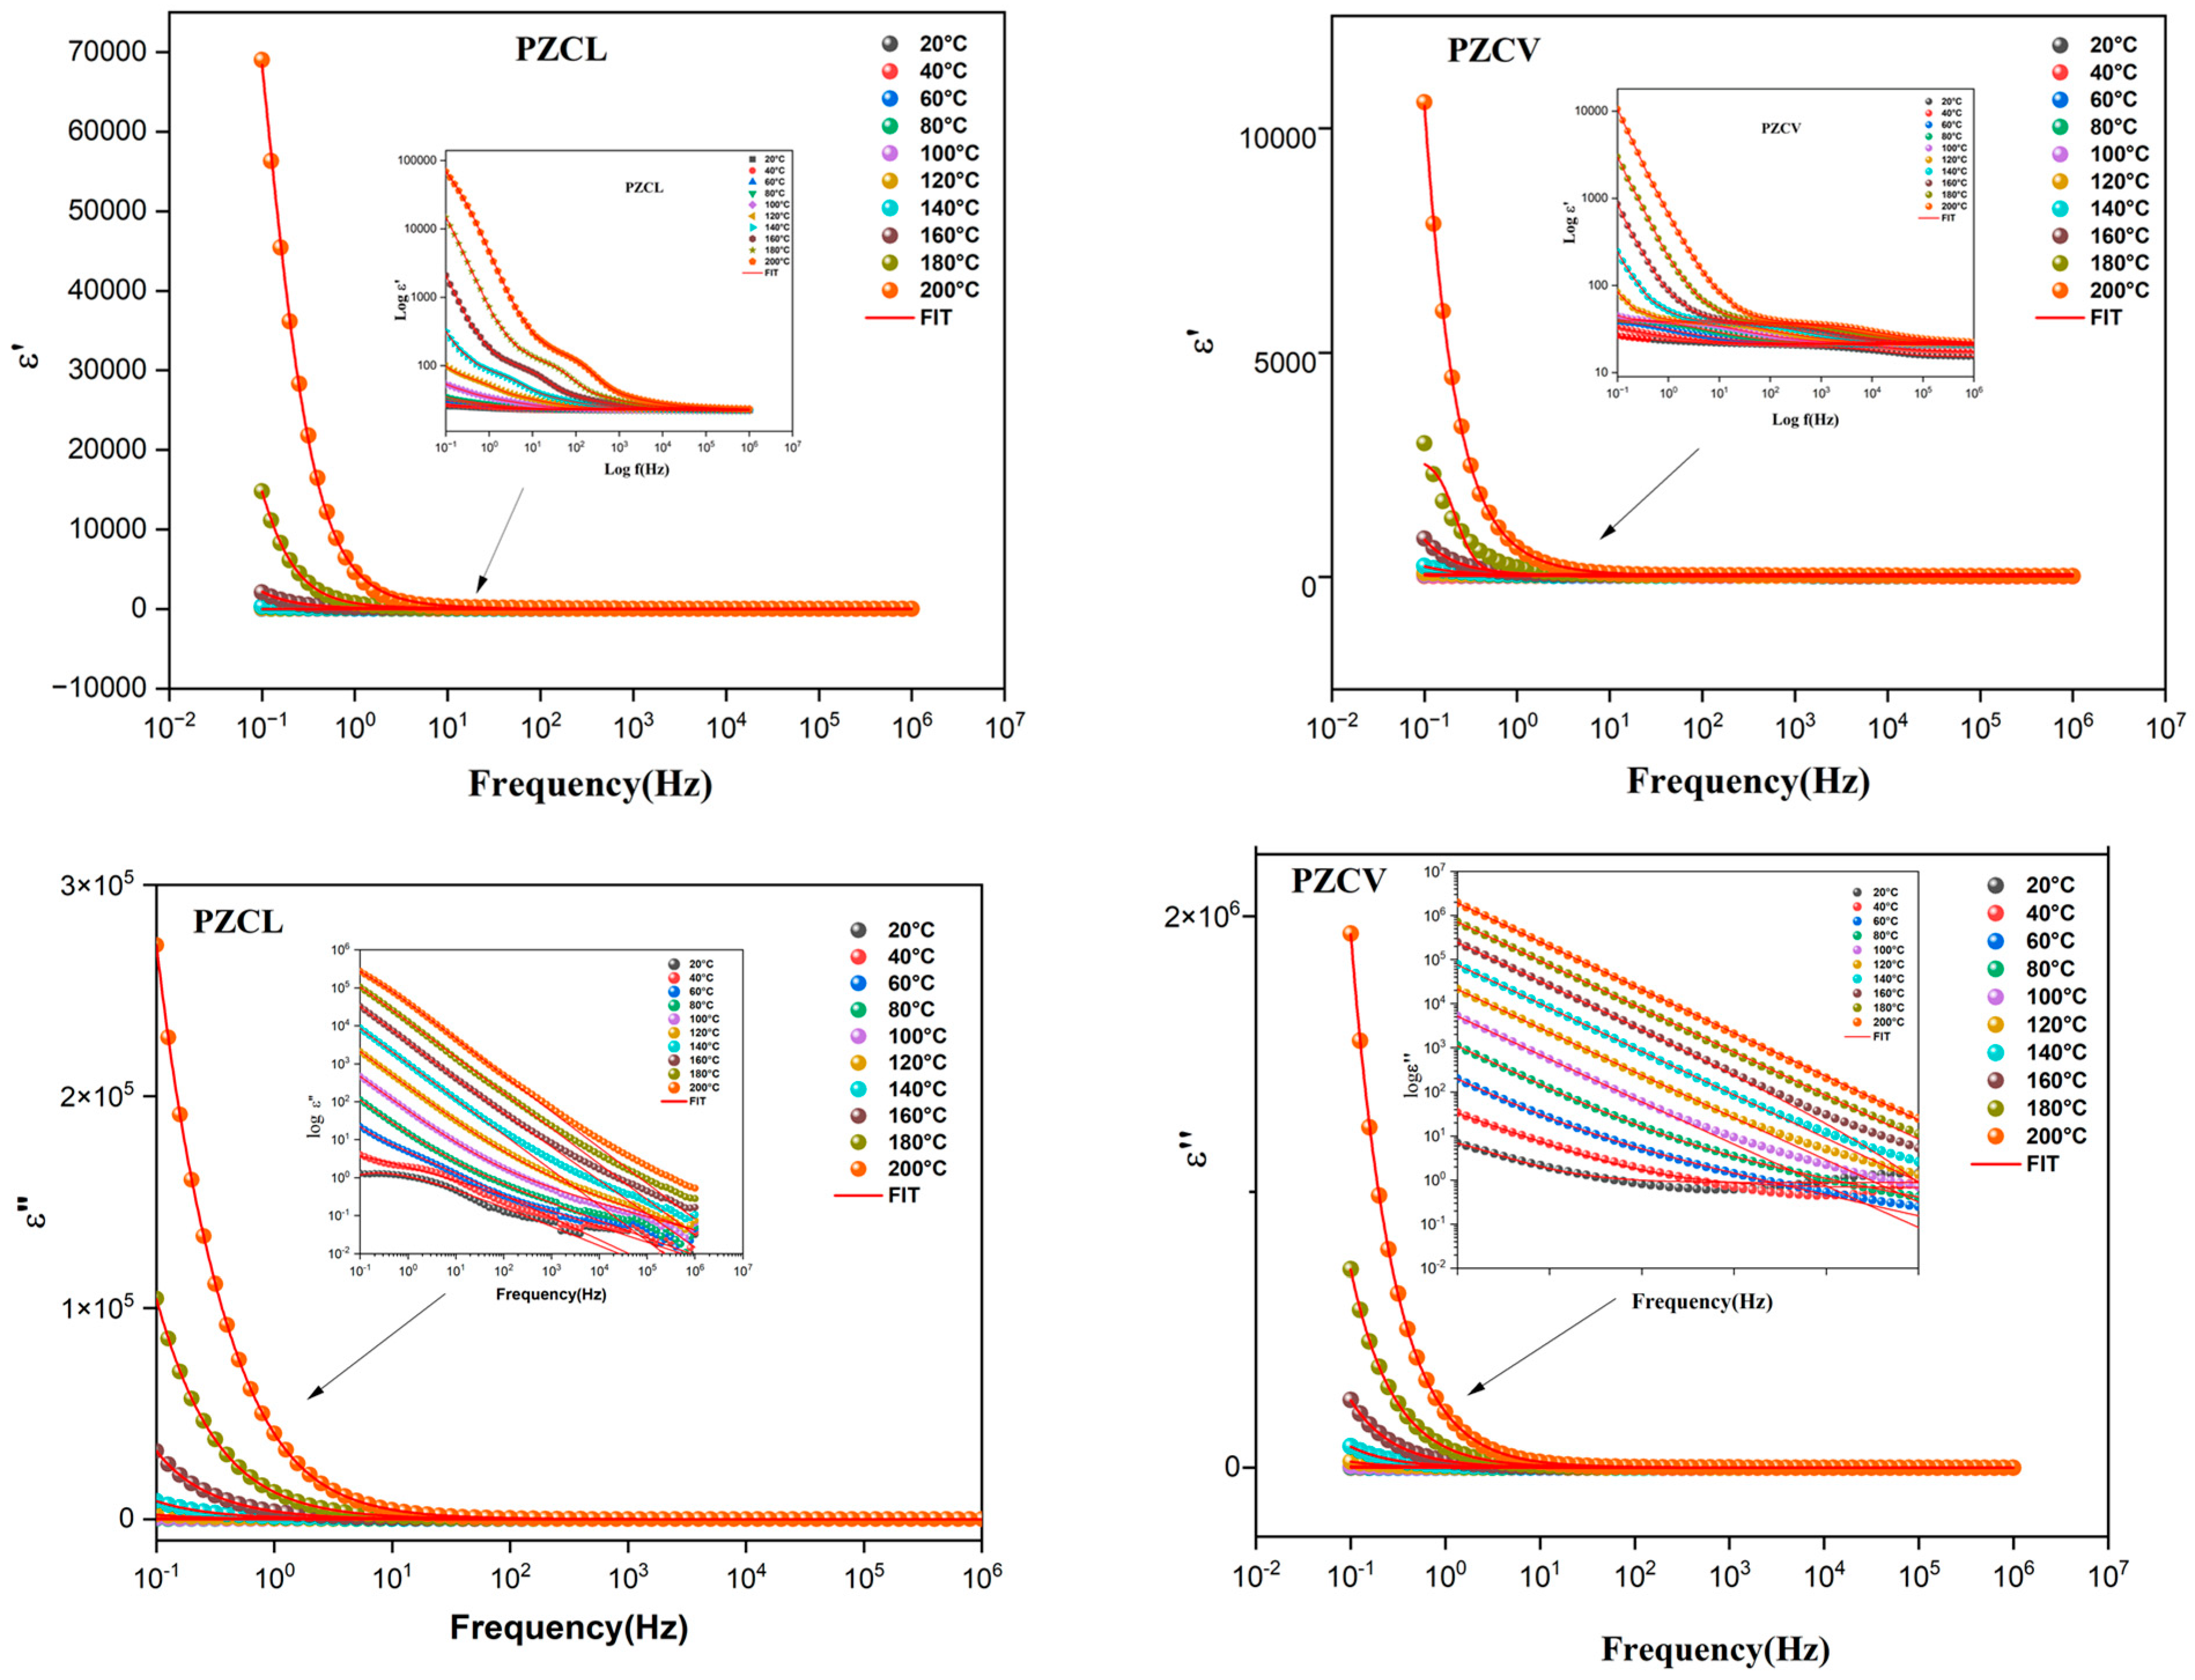
Figure 7 shows the variations in the real and imaginary parts of the dielectric permittivity, with frequency for the phosphates glasses studied for the full range of temperatures. It is observed that the real part of the permittivity decreases with increasing frequency, which is a general feature of polar dielectric materials, showing a frequency-independent value of this parameter in the high-frequency region. The strong increase in the real part of the dielectric constant at high temperatures toward the low-frequency range may be due to space charge polarization, conductivity relaxation, and interfacial effects [46].
Figure 7.
(Up): Variation in the relative real part of the permittivity as a function of frequency: (Left) sample PZCL and (Right) sample PZCV. (Bottom) Variation in the imaginary part of the relative permittivity as a function of frequency: (Left) sample PZCL and (Right) sample PZCV. The line represents the fit of experimental results using the Havriliak–Negami (HN) model. Both cross the entire temperature range studied.
A close inspection of Figure 7 shows that the real part of the permittivity decreases with increasing frequency, which is typical for polar dielectric materials, where a typical relaxation process was observed until the dielectric permittivity takes a constant value at high frequencies, ε∞, being this value dependent of temperature. On the other hand, at moderate frequencies we can observe that the permittivity would tend to take a constant value if there was no electrode polarization process and where conduction is important, with this process increasing as the temperature rises. According to the Havriliak–Negami (HN) model given by Equation (6), this permittivity is called static permittivity, εs. From εs and ε∞, we can obtain the width of the relaxation process, .
On the other hand, Figure 7 shows that at high temperatures the relative real part of the permittivity (ε′) exhibits high values where the relative imaginary permittivity (ε″) also exhibits high values. This is a clear example of electrode polarization, indicating that charge carriers of the opposite polarity to that of a nearby electrode are accumulated in front of the electrode. Observe the clear difference between the relative permittivity values of the PZCV and PZCL samples with temperature. While phosphate glass PZCV has a practically constant value with temperature at high frequencies, the PZCL sample shows a significant variation with temperature.
In this work, ε∞ was determined at a frequency of 1 MHz and εs using the HN model when the frequency tends to zero. When the dc conductivity originates from the motion of free-charge carriers at moderate and low frequencies, the real part of the permittivity increases with temperature until reaching a plateau, corresponding to the static permittivity εs. Beyond this plateau, the permittivity continues to increase at low frequencies, possibly due to conductivity from impurities or electrode polarization, which typically occurs in this range of frequencies. The observed values of the permittivity at high frequency and near-zero frequency for the samples are gathered in Table 2.
When the dielectric information is transformed to electric modulus according to Equation (5), the dipolar processes maintains its peak-like form and moves to higher frequencies, scaling according to [46,47,48,49,50]:
where the relaxation times τε and τM are relaxation-time averages evaluated with the corresponding relaxation-time distribution associated with the permittivity or the modulus [47,48].
Therefore, taking into account that is always lower than , will always be smaller than . The relative permittivity of the samples at the limits of high and low frequency, corresponding to and , respectively, was obtained from Figure 7. Using these values, the average ratio was calculated for the PZCV and PZCL samples, yielding 1.52 and 1.45, respectively. This indicates that the relaxation time is approximately 1.5 times the value of for both samples. Additionally, the average value of was found to be around 10 for PZCL and 10.8 for PZCV.
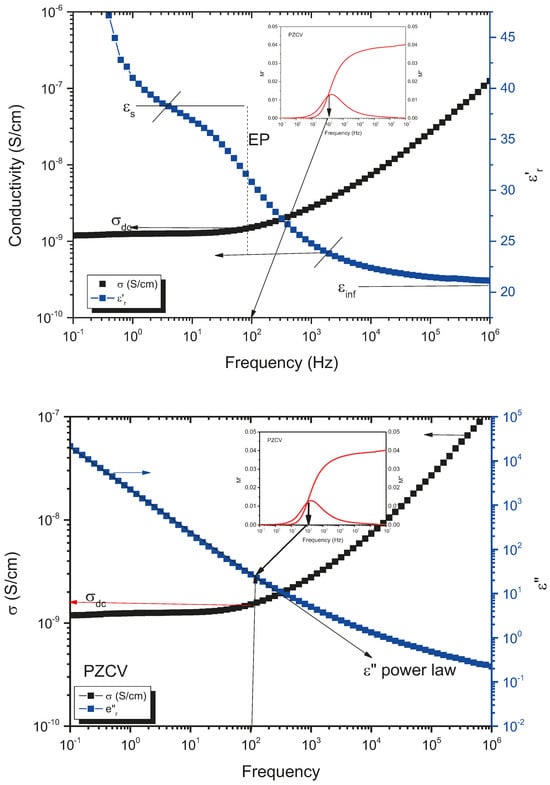
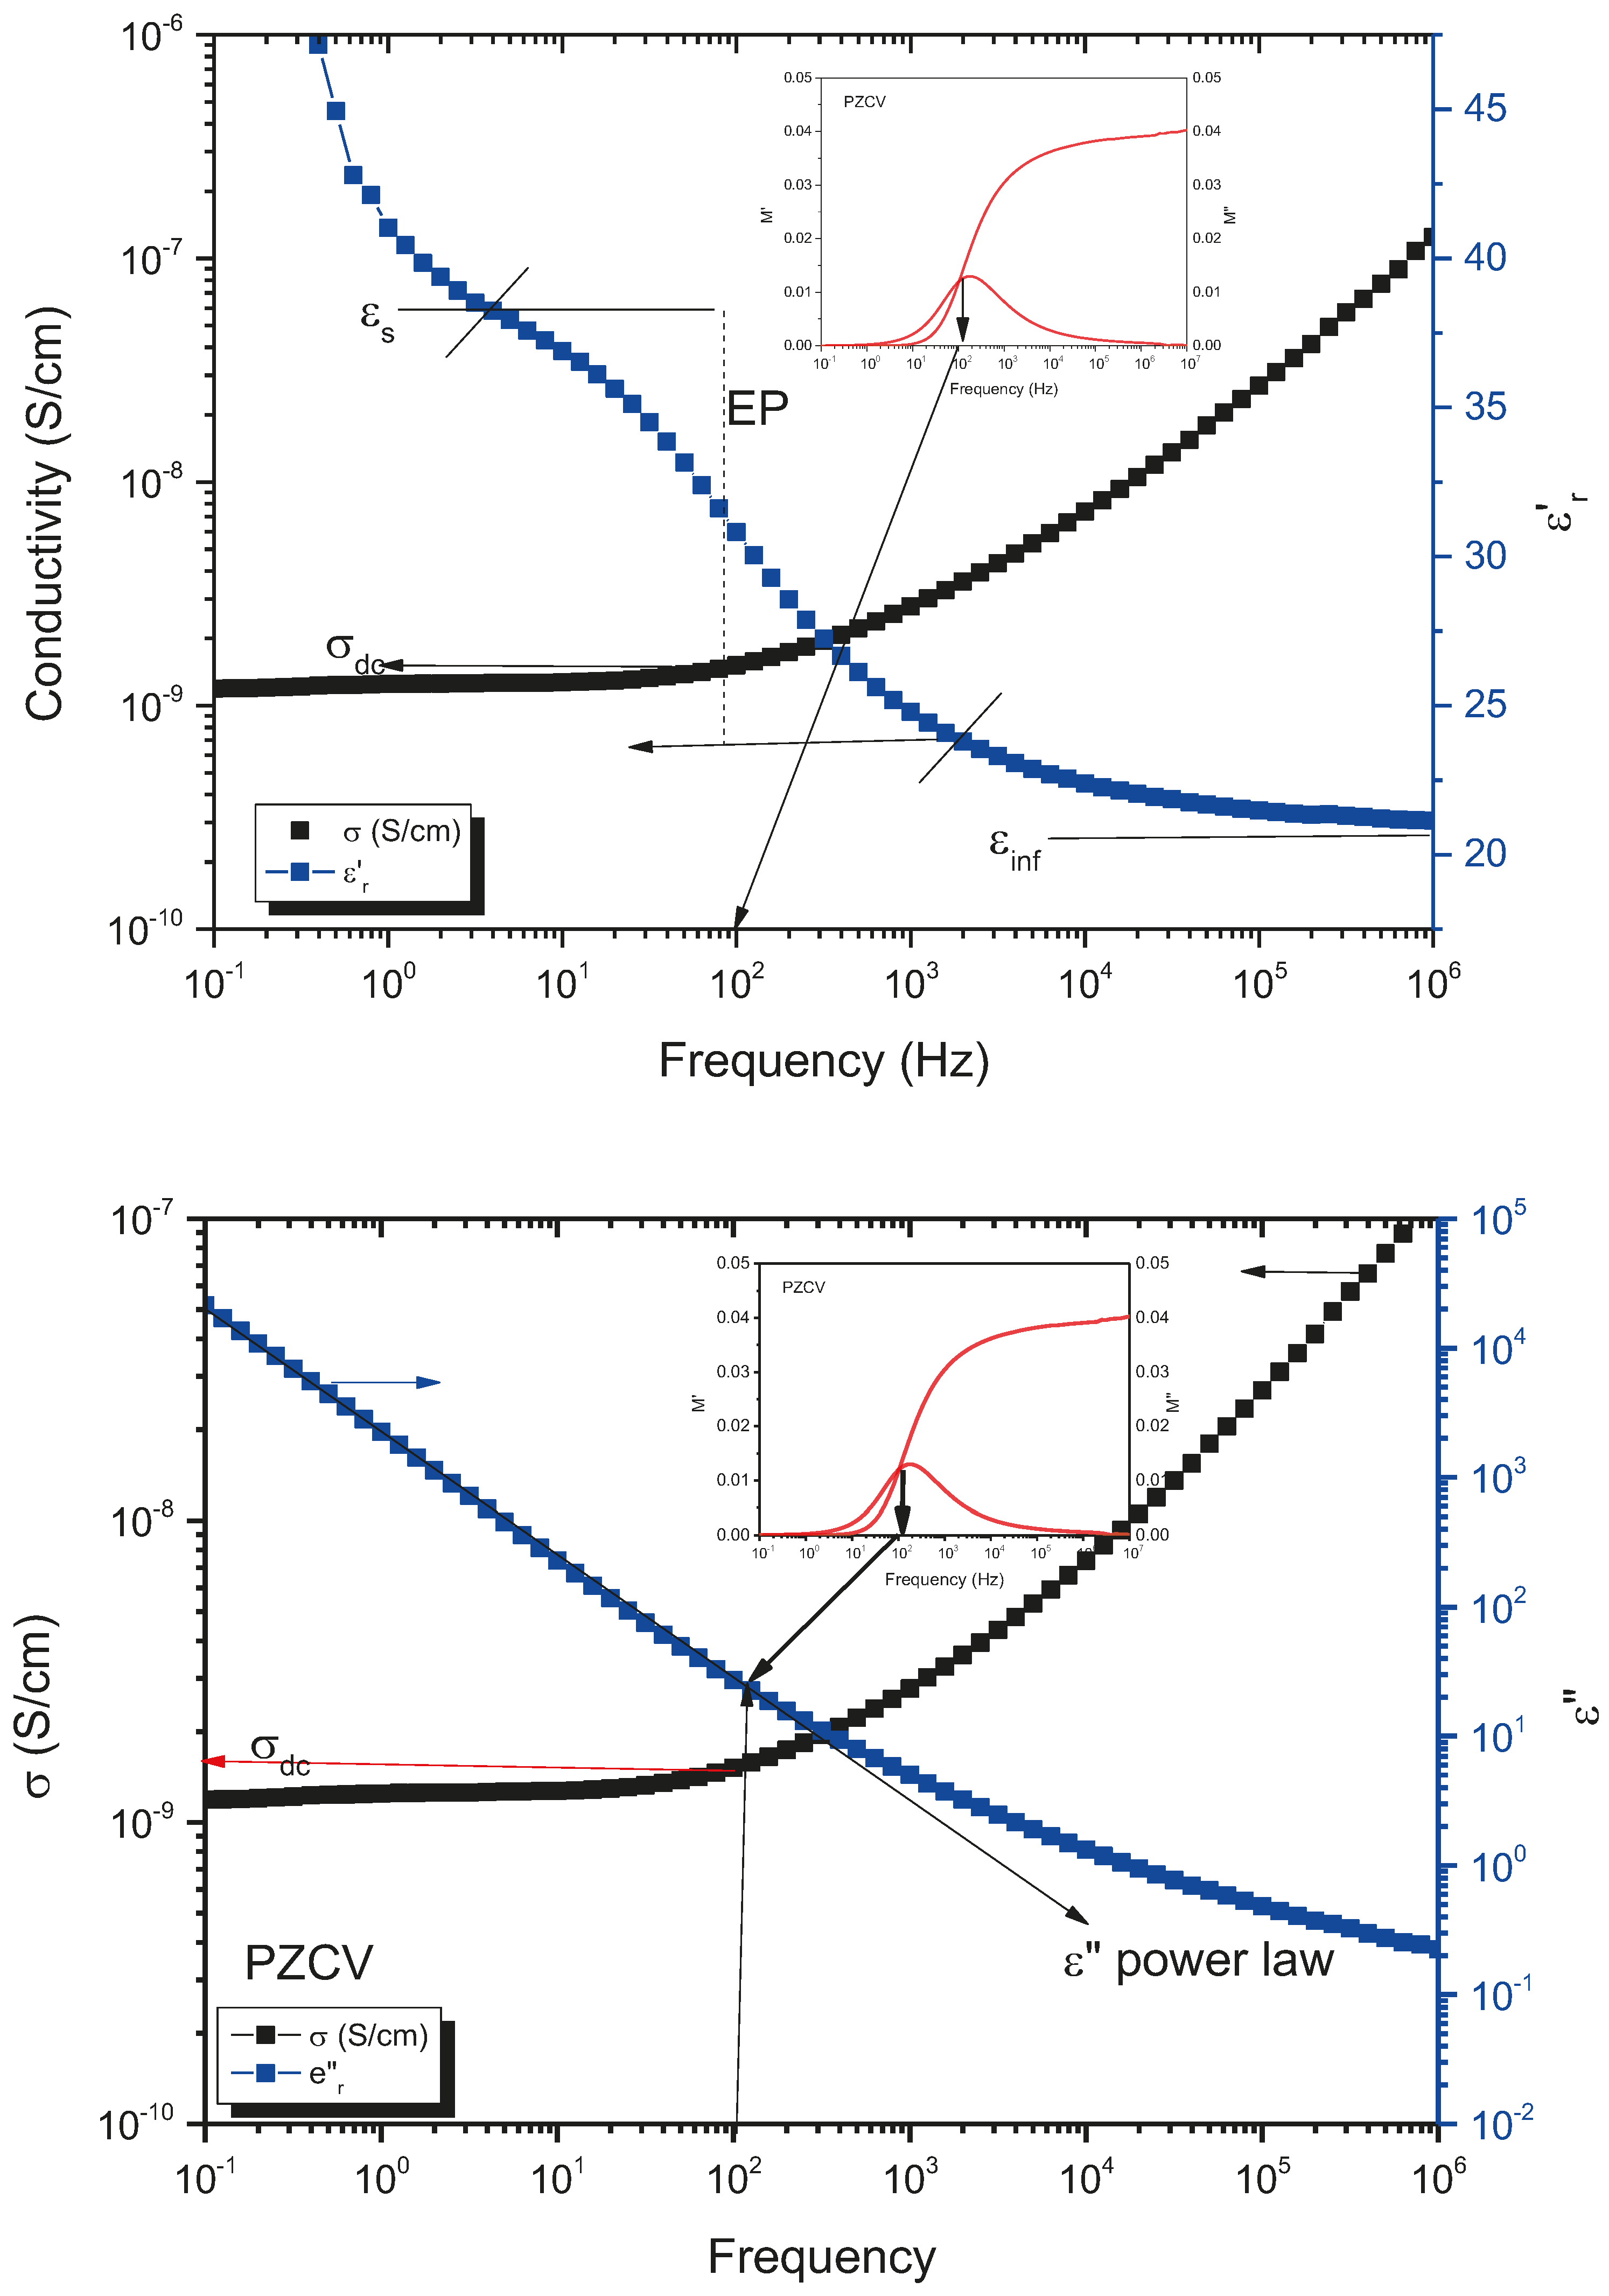
Figure 8, up presents the plot of the real part of the relative permittivity and conductivity versus frequency, and Figure 8, bottom the imaginary part and conductivity, both at 120 °C for the phosphate glass PZCV.
Figure 8.
(Up) Conductivity and relative permittivity spectra measured at 120 °C. (Bottom) Conductivity and relative imaginary part of the permittivity measured at 120 °C. In the insert, the loss modulus M″ vs. frequency is observed at the same temperature for the sample PZCV. Notice that the peak is observed at the same frequency in which the conductivity is obtained for both methods, using the Bode diagram or from the ε″ power law for PZCV. Similar behavior was observed at temperatures above of 80 °C for both PZCV and PZCL samples.
In cases where electrical conductivity contributes only to the imaginary part of the dielectric permittivity, conductivity relaxation can be studied under the assumption that the charge carriers responsible are free. Therefore, conductivity occurs without additional polarization contributions to the dielectric spectrum, as the charges are in motion, exhibiting a relaxation-attributed hopping of ions [51]. The fact that conductivity also affects the real part of the permittivity suggests that ion hopping induces a polarization response, as observed in Figure 7. In this study, at moderate and low frequencies only the electrical conductivity term contributing to the imaginary part of the permittivity follows a power law, which decreases with increasing frequency in the form , as can be seen in Figure 9.
Figure 9.
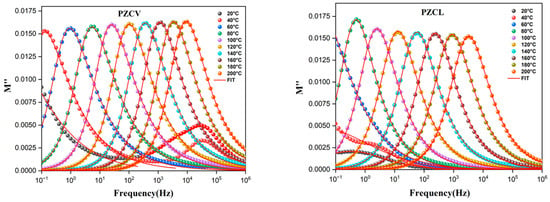
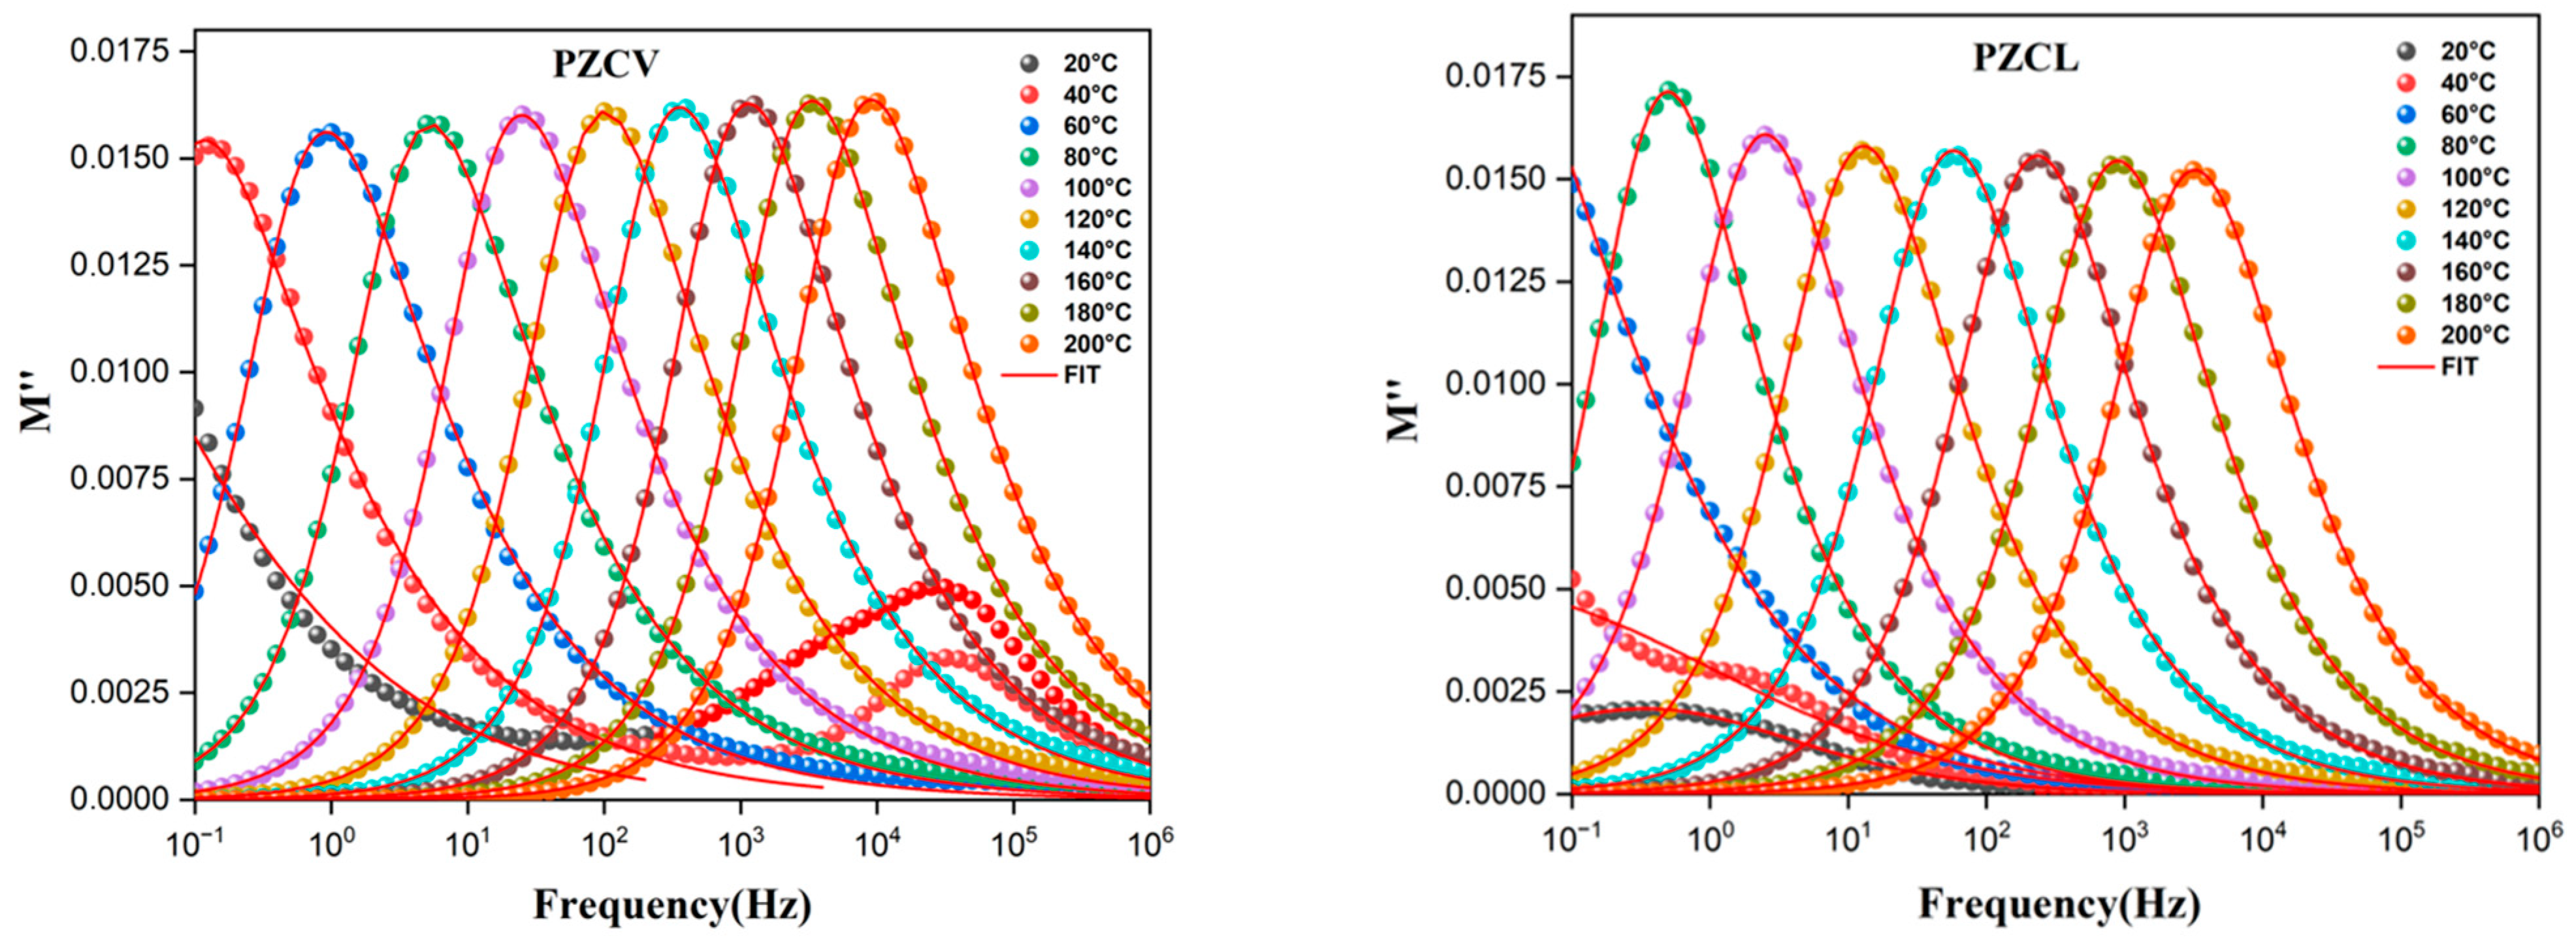
Frequency spectra of M″ of PZCV and PZCL phosphate glasses in the temperature range studied. The line represents the fit of experimental results using the Havriliak–Negami (HN) model for the full temperature range studied.
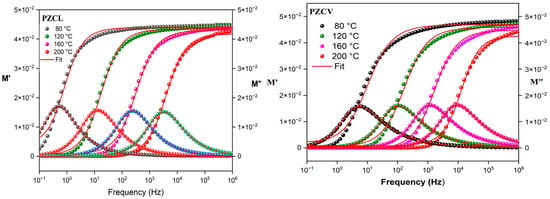
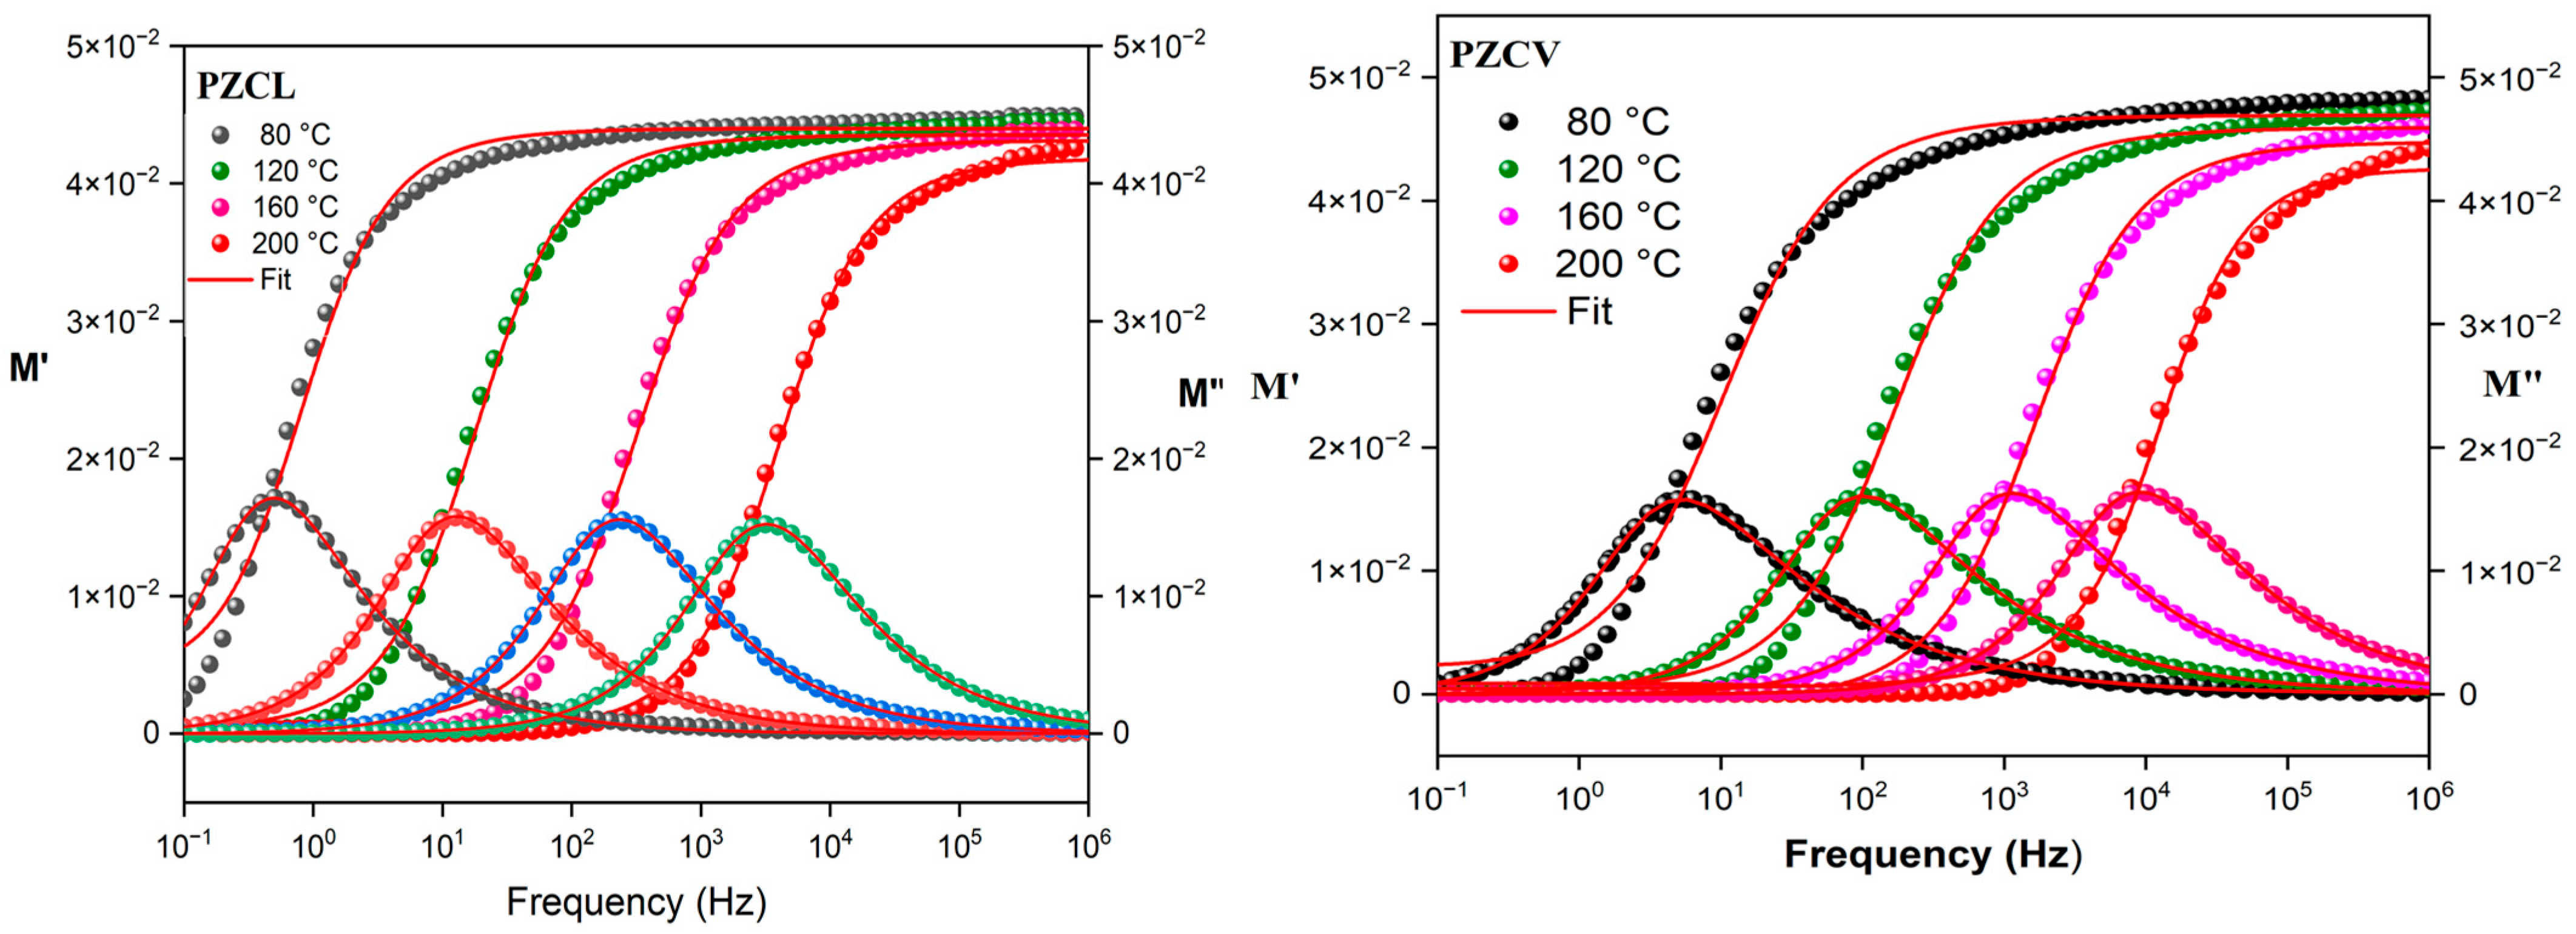
When the electric modulus formalism is applied, the conductivity term contributes to both the real and imaginary parts of the electric modulus, manifesting as conductivity relaxation, which can be difficult to distinguish from dipolar contributions. This is perfectly reflected here by means of a peak in the loss modulus (M″), highlighting that the contribution of dc conductivity shifts entirely from power-law behavior in to a peak in , where a power law in the complex dielectric permittivity at low and moderate frequencies, , can be observed, and where the parameter s takes values greater than 0.96 at temperatures higher than 100 °C for the phosphate glass PZCV. Similar results were observed in the temperature range from 40 °C to 200 °C for PZCV, while for the sample PZCL the relaxation peaks associated with dc conductivity in the range are compressed between 80 °C and 200 °C, as shown in Figure 10. Similar results have been observed in organic polymeric insulating materials, such as thermosets (e.g., epoxy resin) and thermoplastics (e.g., low-density polyethylene (LDPE)) [47], and in the dielectric spectra of bulk polyalcohols and similar materials [51,52].
Figure 10.
Real and imaginary parts of the complex modulus versus frequency at 80 °C, 120 °C, 160 °C, and 200 °C for the samples PZCV and PZCL, respectively. The line represents the fit of experimental results using the Havriliak–Negami (HN) model for the full temperature range studied.
The frequency dependence of the imaginary electric modulus, (M″) for PZCV and PZCL glasses was analyzed using the modified Havriliak–Negami (H–N) model. The corresponding fitting parameters, the symmetric broadening parameter (α)), the asymmetric broadening parameter ((β), and the total relaxation time ((τ)), obtained are listed in Table 3. For both glass compositions, the relaxation time decreases systematically with increasing temperature, indicating a thermally activated relaxation process, with the relaxation time longer in glass PZCl than in PZCV. For the PZCV glass, the fitting parameters exhibit a regular evolution with temperature, with (β) increasing slightly from 0.43 to 0.55 in the temperature range from 40 °C to 200 °C, and for PZCL from 0.63 to 0.69 when the temperature increases from 60 °C to 200 °C. While the parameter (α) for PZCL increases with a temperature increase from 80 °C to 200 °C, this variation was not observed at lower temperatures, from 40 °C to 60 °C, and may be due to absorption–relaxation processes. In the other hand, we observed the opposite behavior at PZCV glass where the parameter (α) is practically constant from 100 °C to 160 °C, and subsequently increasing that value with the increase in temperature. On the other hand, again, an increase in alpha behavior with temperature was observed, possibly due to different types of charge diffusion as a consequence of two different ion transport or vacancies that arise as a result of chemical deformations in the glasses. These results demonstrate that the replacement of Li2O by V2O5 markedly modifies the conductivity relaxation of these phosphate glasses.
Table 3.
Values of the modified Havriliak–Negami parameters (, , and ) extracted from fitting the imaginary electric modulus as a function of frequency.
Close inspection of Figure 9 shows that the conductivity relaxation peak shifts to higher frequencies with increasing values of . This indicates a relationship between the angular frequency of the loss peak () and the value of , which can be expressed as [52,53]
When the Debye model and the Cole–Cole model are used to describe conductivity relaxation, the frequency of the loss peak and () are related to via Equation (14). However, it has been shown that the interfacial polarization (IP) process can often deviate from ideal Debye behavior [54]. Moreover, charge transport expressed in the electric modulus may also exhibit non-Debye relaxation [55,56], especially due to the IP effect.
Equation (14) provides an alternative method to estimate the dc conductivity of the glasses. In the cases where the experimental results provide a maximum in at all temperatures, this method proves to be more efficient than obtaining the conductivity from the complex dielectric permittivity representations shown in Figure 7 and Figure 8. Therefore, by determining the value of , which is generally easily obtained from the plots of versus frequency, as shown in Figure 7, the dc conductivity can be calculated using Equation (14). The values obtained for the PZCV and PZCL samples are listed in Table 2. Close inspection of these values allows comparison of the differences in dc conductivity obtained using the two methods, namely from Bode plots and from the angular frequency of the loss peak () according to Equation (14). Small differences are observed between the two approaches, as seen in the values gathered in Table 2 obtained from the loss-modulus peak frequency and from the Bode plots at each temperature. In Figure 6 we can observe the differences found for the samples PZCV and PZCL following the two methodologies. As shown in Figure 6, the temperature dependence of the conductivity reflects a thermally activated process, with the conductivity varying with temperature according to the Arrhenius equation given by Equation (4). Accordingly, the activation energies of the phosphate glass samples, plotted in Figure 6, were obtained using the dc-conductivity values for the PZCV and PZCL samples, which were determined using the two procedures over the temperature range 20–200 °C.
The results clearly indicate a dependence on the type of modifier (Li2O or V2O5). The activation energy was derived from the slope of the linear fit. The values determined from the angular frequency of the loss peak () using Equation (14) follow the trend: (PZCV) = (87.2 ± 0.8) kJ/mol < (PZCL) = (103 ± 1) kJ/mol. In comparison, the values obtained from the Bode plots are (PZCV) = (85.9 ± 0.3) kJ/mol < (PZCL) = (100.6 ± 1.8) kJ/mol. As we can see, the activation energies, regardless of the procedure followed to obtain the conductivities, are very similar for each sample; however, these values are higher for the PZCL sample than for the PZCV sample. Close inspection of these results shows that the energy barrier for charge transport is about 15% lower in PZCV than in PZCL. These values suggest that conduction in such compounds mainly occurs through a thermally activated hopping mechanism. Therefore, the effect of V2O5 with respect to Li2O on the structure of the phosphate glass materials produce great differences between the isotherms of their electrical properties at several temperatures. This is shown in the double logarithmic plots of the real and imaginary components of the complex dielectric modulus of PZCL and PZCV in the frequency domain (Figure 10).
As we can see, the Arrhenius plots of the temperature dependence of the conductivity for PZCV and PZCL indicate that the real part of the electric modulus, , increases with increasing frequency until reaching a region where it becomes nearly constant. Moreover, exhibits, at low frequencies, the characteristic absorption associated with conductive processes, while the absorption related to the glass–rubber relaxation is masked by this conductive contribution. However, dispersions appear in the high-frequency region, also observed in the dielectric loss spectra, whose nature is discussed later.
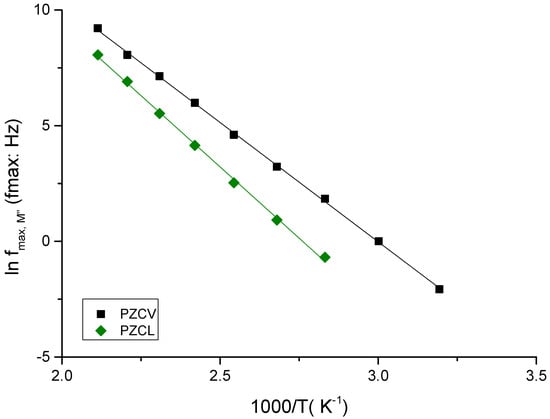
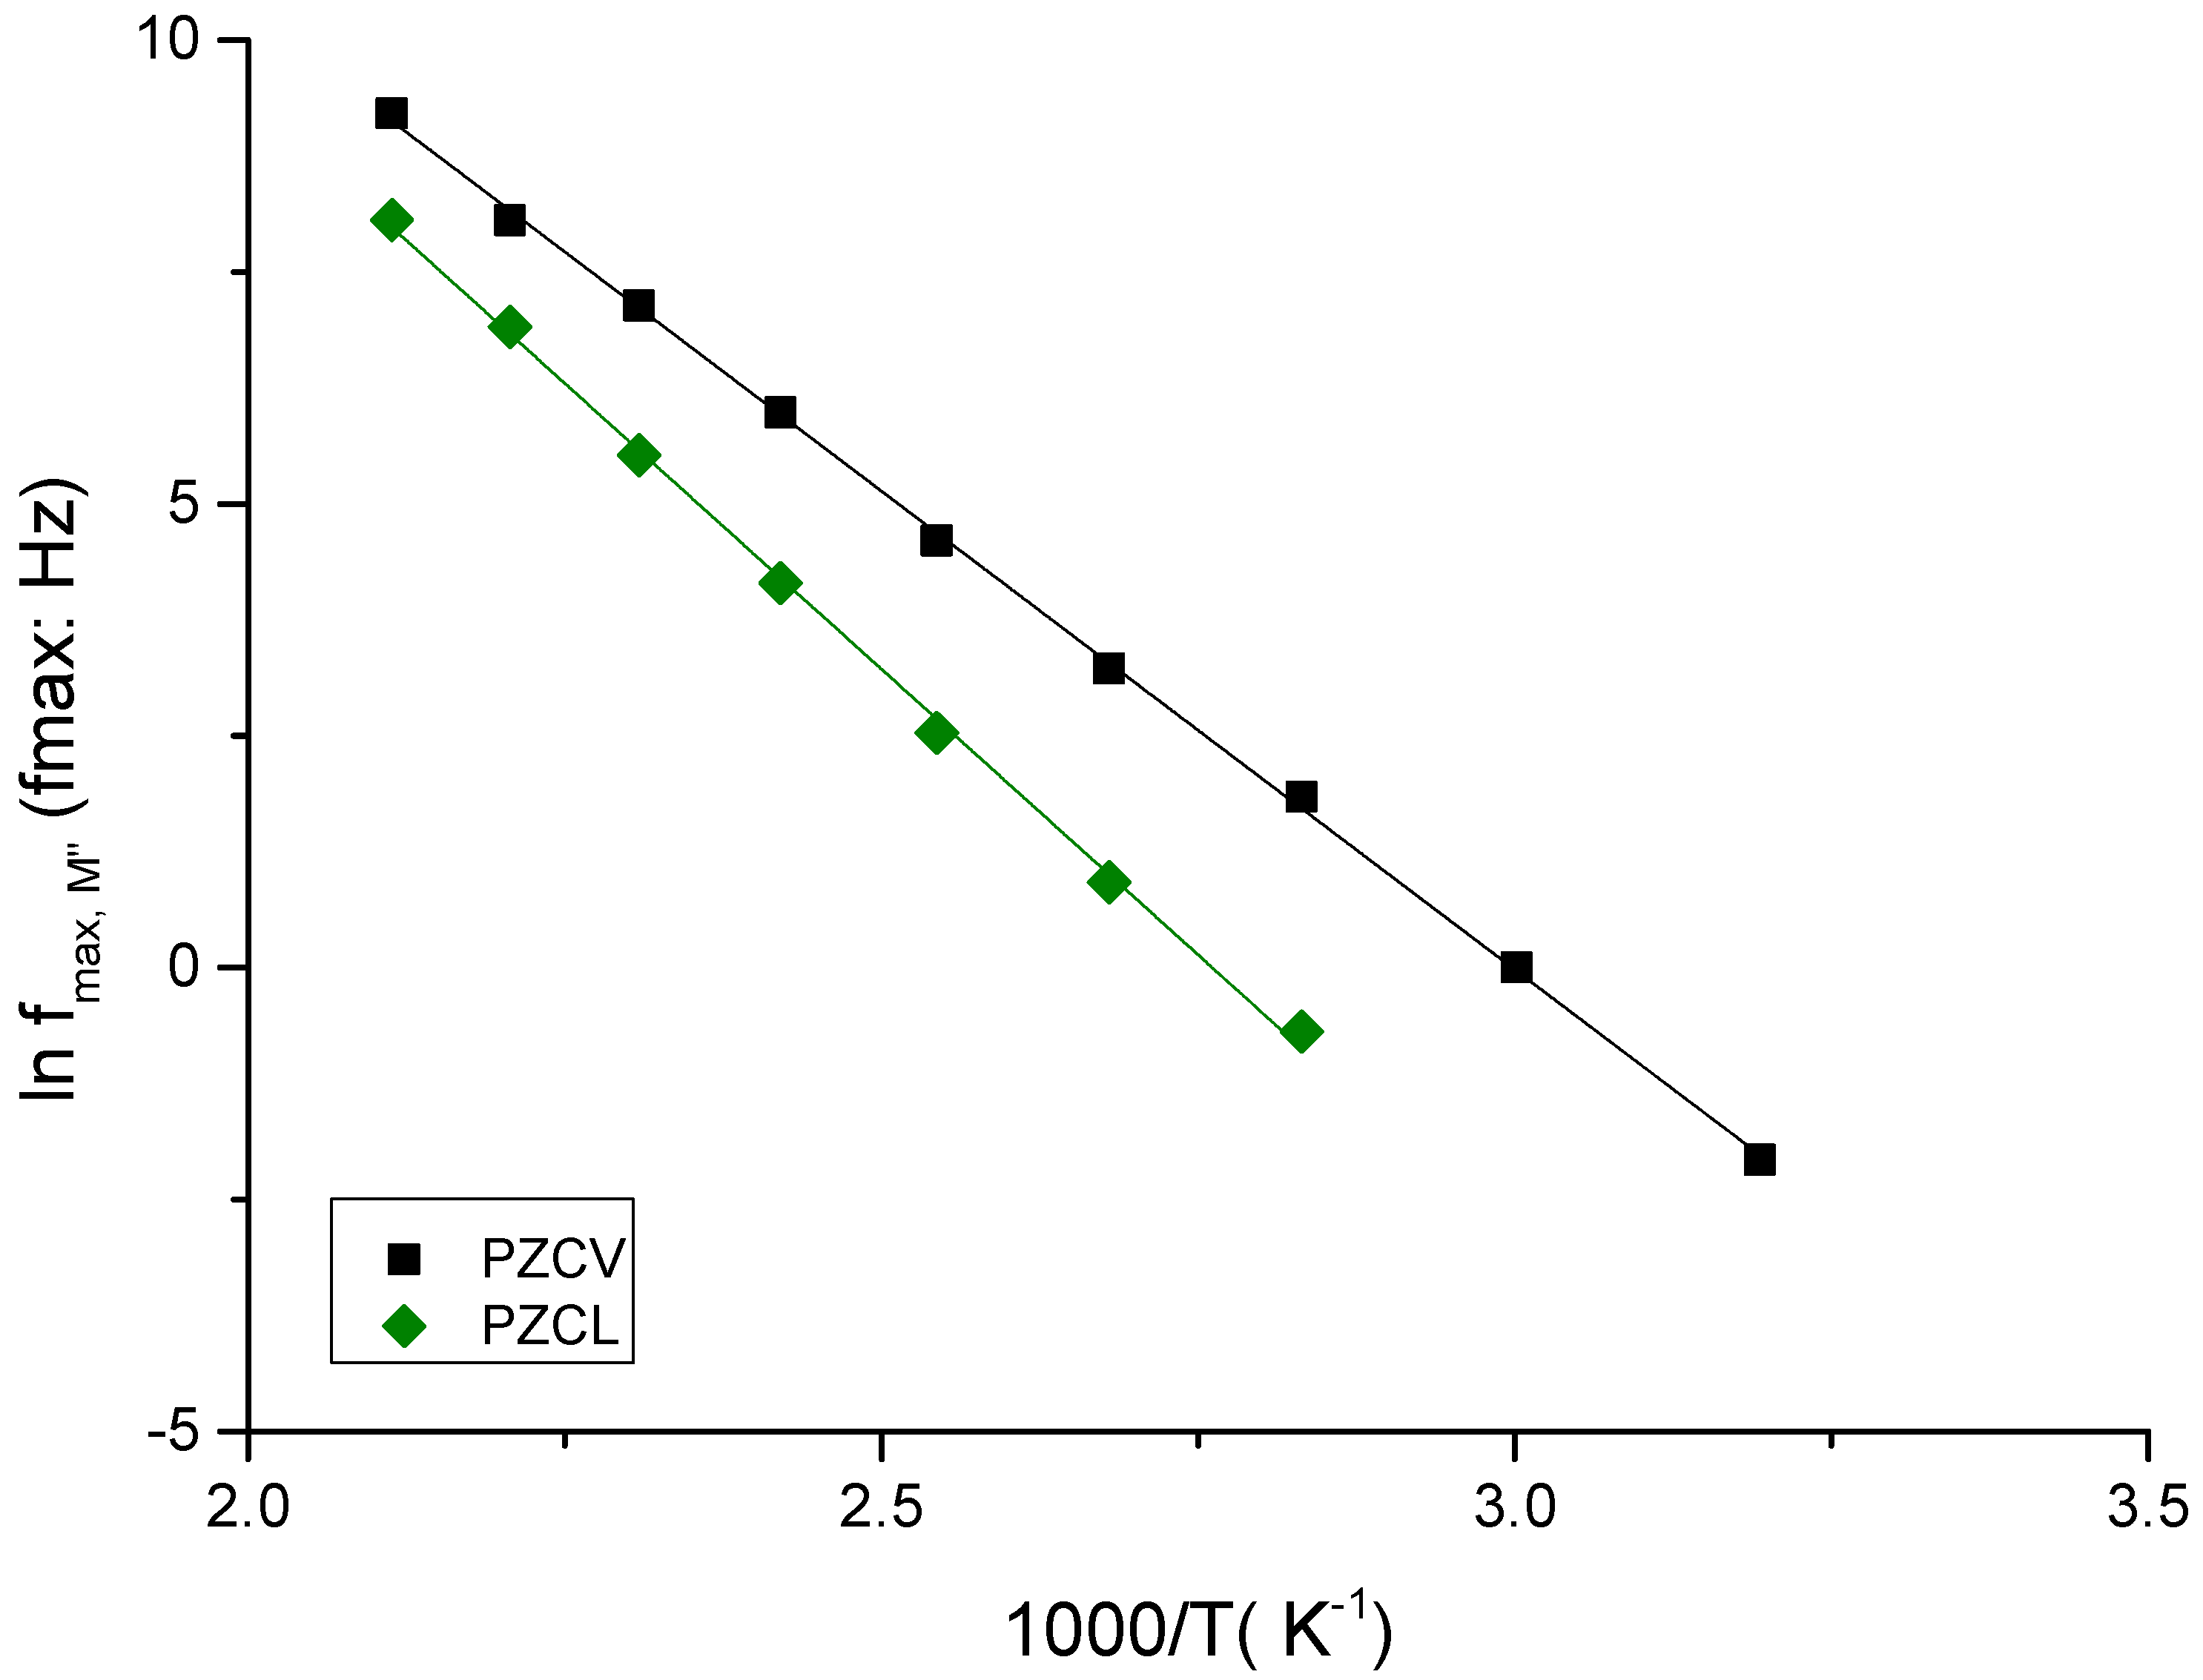
In the low-frequency region, M′ and M″ follow the predictions of the linear theory of the dielectric relaxations moduli in such a way that ,. For both samples, the variation in of the dielectric loss modulus with temperature over the entire frequency range follows Arrhenius behavior, as shown in Figure 11.
Figure 11.
Arrhenius behavior for PZCV and PZCL samples in the entire range of temperature.
The line represents the linear fit to the experimental data, showing clear Arrhenius behavior. From the slope of this fit, the activation energy associated with the conductivity relaxation was determined. The values obtained follow the trend (PZCV) = (85.8 ± 1.3) kJ/mol = (0.889 ± 0.013) eV < (PZCL) = (102.5 ± 1.7) kJ/mol = (1.062 ± 0.018) eV. These values are very similar to those associated with conductivity. This tells us that the electric modulus is a powerful tool for analyzing the dielectric behavior of the glasses. Such agreement indicates that the hopping mechanism responsible for the relaxation is the same as that governing the conductivity [51]. These relaxation processes are therefore attributed to the hopping of the charge carriers that govern dc transport, namely Li+ ions in PZCL and ionic species and/or V4+–V5+ polarons in PZCV (see below). As observed in the plots of the real and imaginary parts of the dielectric modulus as a function of frequency over the entire temperature range, the symmetric shape of the curves for both samples indicates the absence of ion–ion interactions. This behavior can be attributed to the combined effect of the relatively low concentration of ionic species and the rigid structure of this type of phosphate glass, which likely hinders ion–ion interactions. The absence of these interactions is also evidenced by the fact that the conductivity of both PZCL and PZCV is a thermally activated process. However, the activation behavior differs between the two samples, as observed by the variation in the real part of the permittivity (Figure 7) and the activation energy associated with the conductivity presented in Figure 6.
The two glasses differ not only in energy activation but also in the possible nature of their charge carriers. In PZCL, Li+ ions are the most mobile species and the conductivity is expected to be predominantly ionic, as generally observed in alkali phosphate glasses [55]. PZCV, in contrast, contains no alkali ions, and vanadium in melt-quenched phosphate glasses is usually present as a mixture of V5+ and V4+, which allows electronic transport by small-polaron hopping between vanadium sites [27,28]; in vanadate–phosphate glasses both mechanisms may coexist [26]. Raman spectroscopy confirms the incorporation of vanadate units into the network but cannot establish the vanadium valence state, so that the V4+/V5+ ratio is not quantified in the present work and the higher conductivity of PZCV cannot be attributed unambiguously to ionic transport. Two observations nevertheless indicate that an ionic contribution is significant in both glasses. First, the measurements were performed with gold electrodes, which block ionic carriers but freely exchange electrons with the sample. The strong increase in ε′ and ε″ at low frequencies and high temperatures (Figure 7), characteristic of electrode polarization, therefore requires mobile ions accumulating at the electrode interfaces, whereas a purely electronic conductor would not show such polarization. Second, the vanadium content of PZCV is low (10 mol% V2O5), so that the average distance between vanadium sites is large and polaron percolation paths are expected to be poorly connected. Accordingly, the measured activation energy (≈0.89 eV) is higher than the values of a few tenths of an eV, commonly reported for V2O5-rich phosphate glasses in which polaron hopping dominates [53]. Since PZCV contains no alkali ions, the ionic part of its conductivity is most likely carried by protons associated with residual P–OH groups inherited from the NH4H2PO4 precursor and, to a lesser extent, by the divalent modifier cations. PZCV is therefore best described as a potentially mixed ionic–polaronic conductor, and the term dc conductivity is used here for the total measured conductivity. A quantitative separation of both contributions would require dc-polarization (Hebb–Wagner) measurements combined with an independent determination of the vanadium valence state (EPR or XPS).
It should also be stressed that the dc conductivities measured here (about 10−12 to 10−7 S·cm−1 between 40 and 200 °C) are several orders of magnitude lower than the values usually required for practical solid electrolytes, typically above 10−4 S·cm−1 at the operating temperature [57]. The present glasses should therefore not be regarded as ready-to-use electrolytes. Their interest lies in the comparison of two compositions that differ only in the Li2O/V2O5 modifier, which isolates the effect of this substitution on charge transport and dielectric relaxation in a P2O5-rich Zn–Ca phosphate matrix and provides a basis for the design of more conductive compositions.
Finally, the capacitance of the phosphate glass samples was calculated from the complex permittivity considering that:
where is the electrode area and is the sample thickness. The modulus of the capacitance is given by
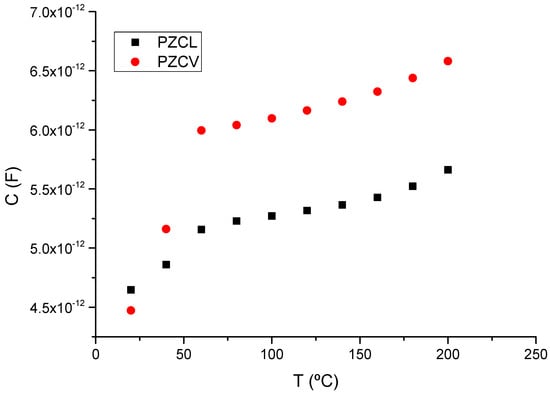
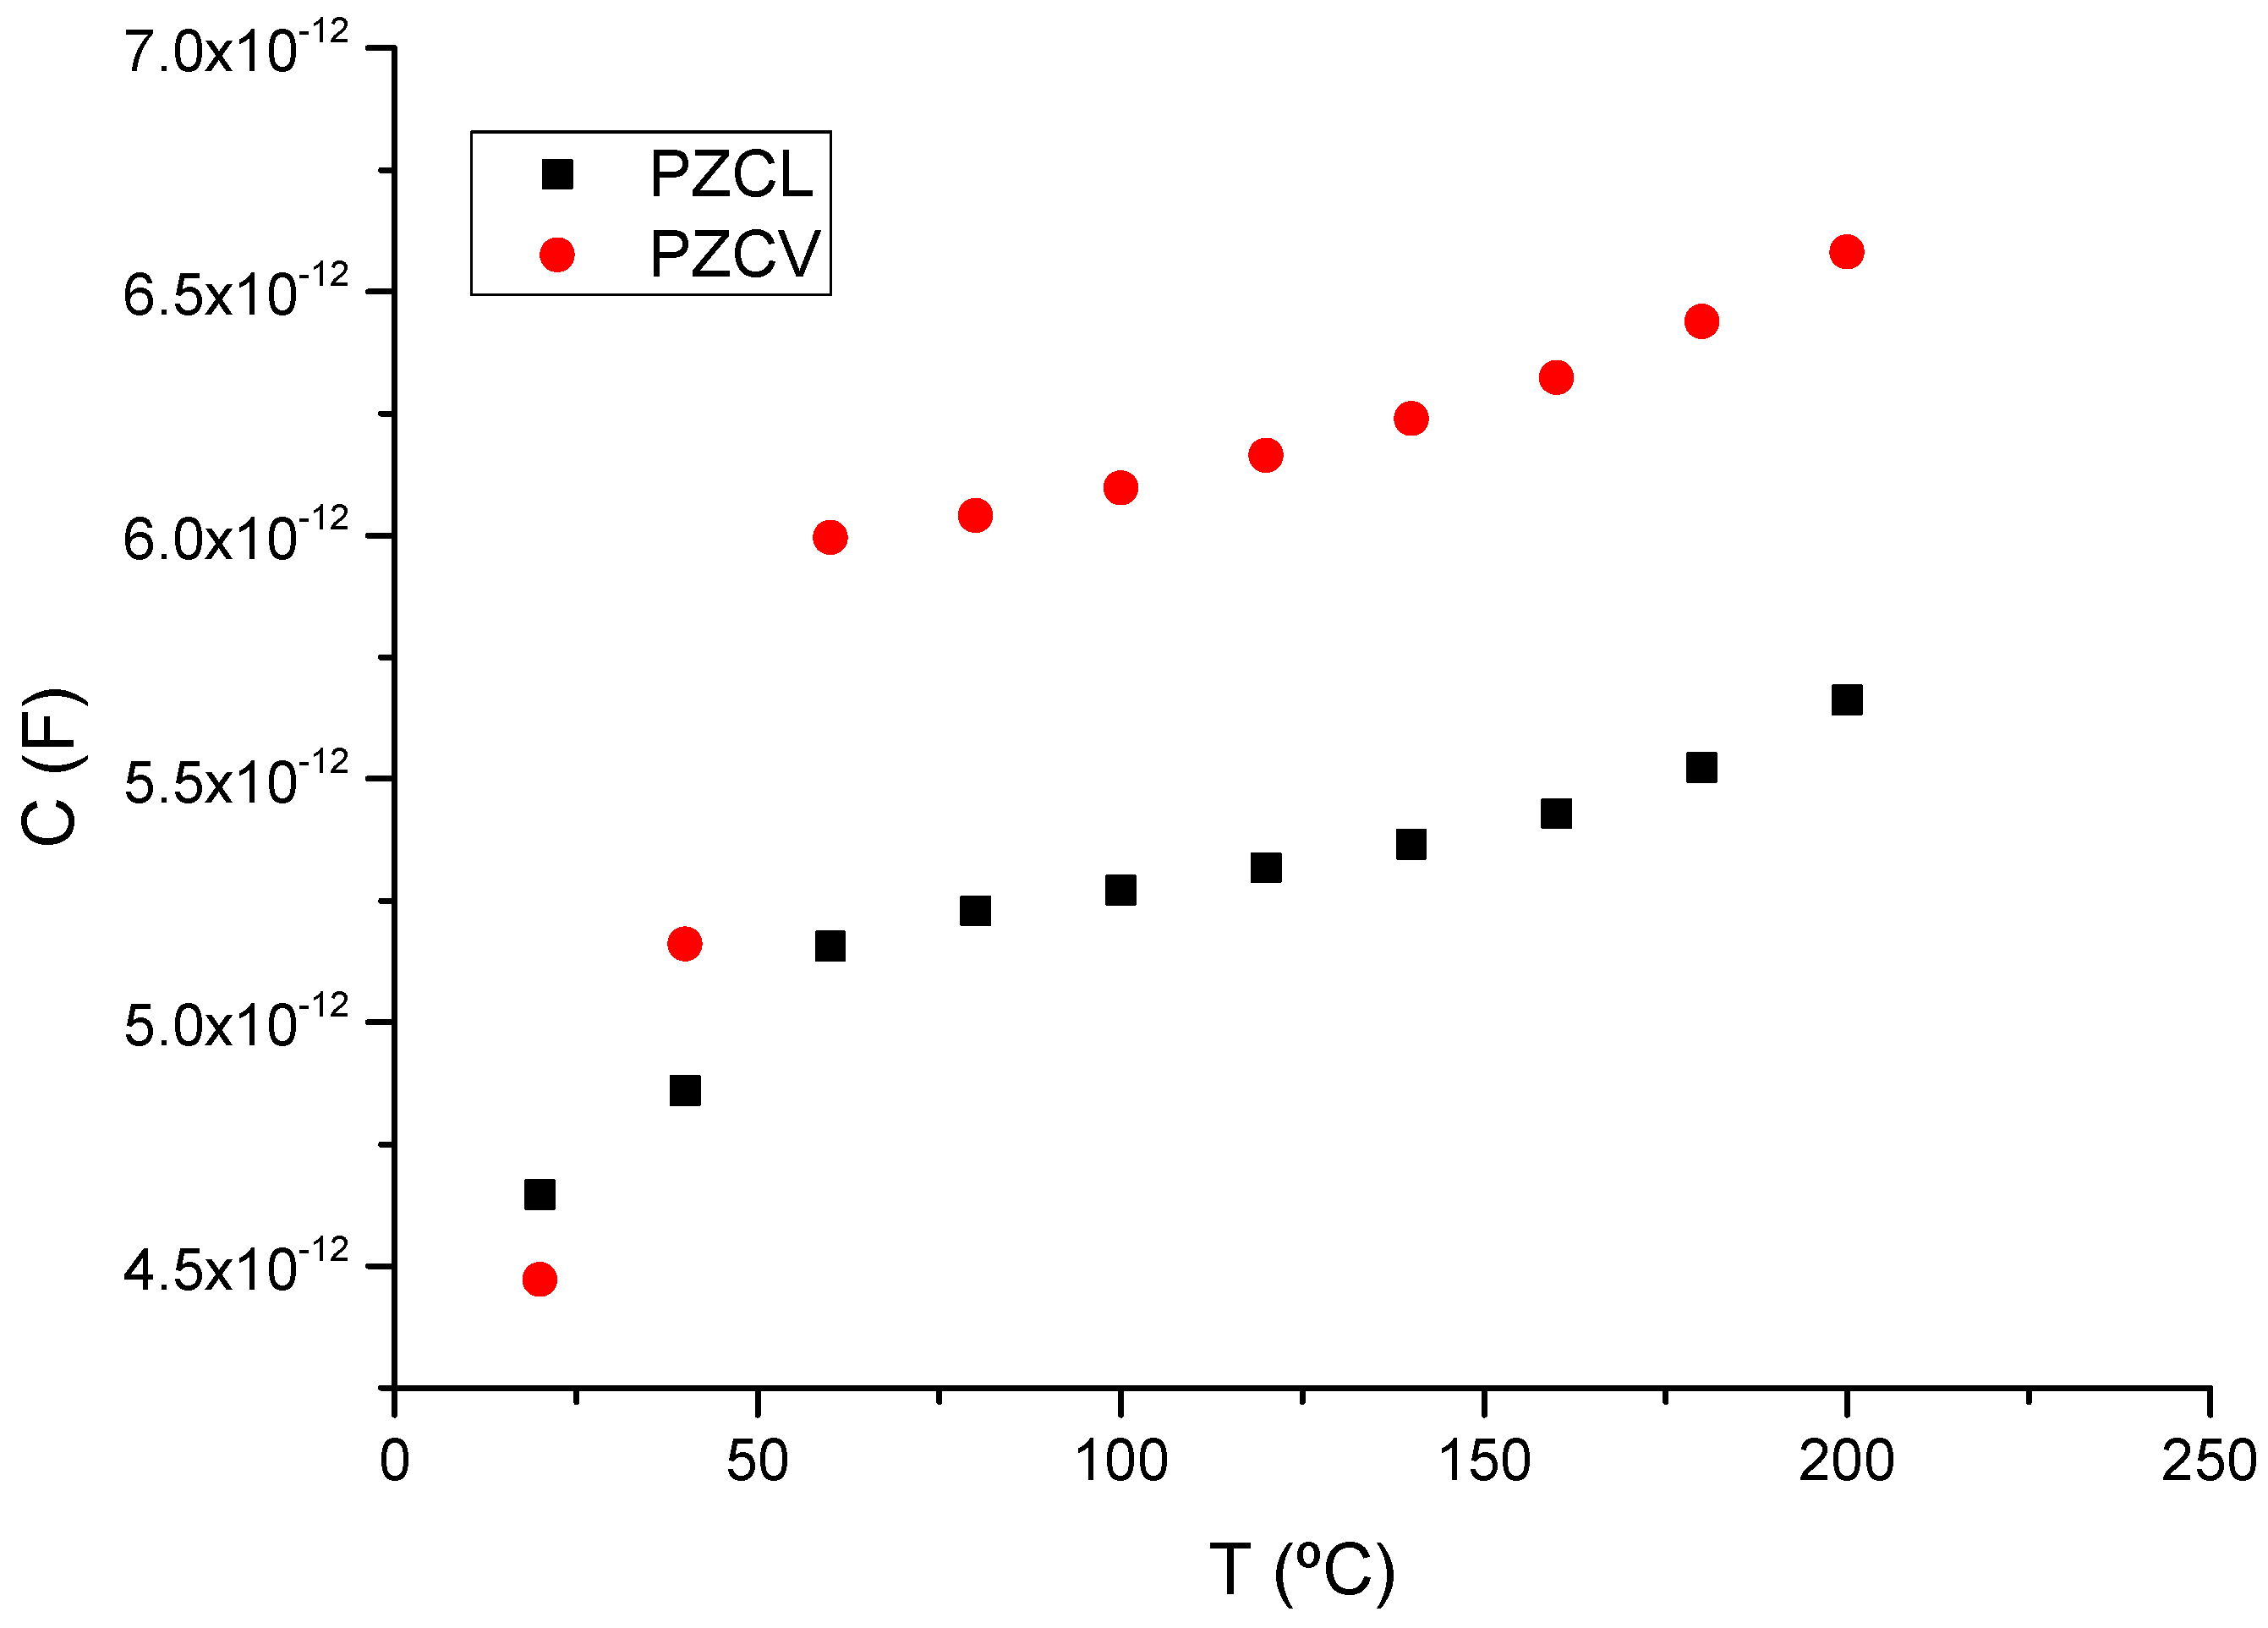
The values obtained for the capacitance modulus (in F/m) are plotted in Figure 12. These capacitance values were determined under the condition , where . A close inspection of this plot shows a slight increase in capacitance with temperature for both samples.
Figure 12.
Geometrical capacitance as a function of the temperature in phosphate glasses samples PZCV and PZCL.
Over the entire temperature range studied, the capacitance follows the trend (PZCV) > (PZCL), being the average value of the capacity of PZCL and PZCV around of 5 and 7 pF, respectively.
4. Conclusions
Two samples of phosphate glass compositions, PZCL (60P2O5–15ZnO–15CaO–10Li2O) and PZCV (60P2O5–15ZnO–15CaO–10V2O5), were successfully synthesized by the melt-quenching method. XRD showed that both glasses are X-ray amorphous. Raman analysis revealed that the PZCL network contains both Q3 and Q2 phosphate units, as expected for a P2O5-rich (ultraphosphate-type) glass, while PZCV displayed distinct V–O vibrational modes, evidencing successful vanadate incorporation into the glass structure. SEM observations showed that PZCV presents a more compact and homogeneous surface morphology compared to the more textured surface of PZCL, with these surface features being below the XRD detection limit.
Electrical characterization by electrochemical impedance spectroscopy (EIS) demonstrated that complex permittivity at low frequencies is dominated by charge transport and electrode polarization in both phosphate glasses. The complex electric modulus is a powerful tool to reveal the dielectric relaxation and charge carrier transport in glasses. PZCV exhibits a dc conductivity approximately one order of magnitude higher than PZCL, reaching about 1.5 × 10⁻⁹ S·cm−1 at 120 °C (Bode diagram) (1.2 × 10⁻⁹ S·cm−1 from the M″ loss peak), against 1.8 × 10⁻¹⁰ S·cm−1 for PZCL. The temperature dependence follows Arrhenius behavior, with an activation energy of ~87 kJ·mol−1 for PZCV, significantly lower than that of PZCL (~103 kJ·mol−1), a lower energy barrier for charge transport. These values are very similar to the activation energy associated with the frequency peaks of the imaginary part M″ of the electric modulus. This tells us that the electric modulus is a powerful tool for analyzing the dielectric behavior of the glasses. Such agreement indicates that the hopping mechanism responsible for the relaxation is the same as that governing the conductivity, shown by the τ values between 10s and 100s times higher in PZCL than PZCV, as we observed from the time relaxation determined from the fit of the electric modulus using the Havriliak–Negamy model. The electrode polarization observed with ion-blocking gold electrodes indicates a significant ionic contribution in both glasses, whereas a polaronic V4+–V5+ contribution to the conductivity of PZCV cannot be excluded on the basis of the present data.
Capacitance analysis showed a slight increase with temperature for both samples, with PZCV presenting higher values (~7 pF), confirming its enhanced dielectric response.
These results demonstrate that the replacement of Li2O by V2O5 increases the dc conductivity by about one order of magnitude and lowers its activation energy. However, the absolute conductivities remain several orders of magnitude below the values required for practical solid electrolytes, and these glasses should be regarded as model systems for understanding composition–transport relationships rather than as ready-to-use electrolytes. Future work will address the thermal characterization of the glasses (DTA/DSC), the vanadium valence state (XPS/EPR), and the separation of ionic and electronic contributions by dc-polarization measurements.
Author Contributions
A.A. (Amel Abdallah): conceptualization, investigation, methodology, writing—original draft. C.B.: investigation, methodology, writing—original draft. A.B.: original draft preparation, supervision, validation. B.M.S.: visualization, supervision, validation. A.A. (Andreu Andrio): investigation, methodology, original draft preparation, supervision. V.C.: conceptualization, investigation, methodology, visualization supervision, validation, writing—original draft, review, and editing. All authors have read and agreed to the published version of the manuscript.
Funding
This work was supported by the Conselleria d’Innovació, Universitats, Ciència i Societat Digital (Generalitat Valenciana) under the PROMETEUS 2023 Program (Grant No. CIPROM/2022/03).
Institutional Review Board Statement
Not applicable.
Informed Consent Statement
Not applicable.
Data Availability Statement
The original contributions presented in this study are included in the article. Further inquiries can be directed to the corresponding author.
Conflicts of Interest
The authors declare no conflicts of interest.
References
- Salkuti, S.R. Advanced Technologies for Energy Storage and Electric Vehicles. Energies 2023, 16, 2312. [Google Scholar]
- Ren, G.; Ma, G.; Cong, N. Review of electrical energy storage system for vehicular applications. Renew. Sustain. Energy Rev. 2015, 41, 225–236. [Google Scholar] [CrossRef] [Scilit]
- Biswas, D.; Mandal, A.; Mondal, R.; Kabi, S.; Modak, N. Influence of lithium-ion doping on electrical and dielectric properties of zinc-borate-phosphate glass for improved energy storage. J. Alloys Compd. 2024, 1005, 176170. [Google Scholar] [CrossRef] [Scilit]
- Abdallah, A.; Bouzidi, C. Optical characterization of Eu3+/Gd3+ co-doped Phosphate glasses for efficient energy transfer. Opt. Mater. 2025, 172, 117819. [Google Scholar] [CrossRef] [Scilit]
- Hsouna, N.; Mhadhbi, M.; Bouzidi, C. Thermal and Electrical Characterization of (1-x)Na2O-xAl2O3-P2O5 System Glasses. Iran. J. Mater. Sci. Eng. 2022, 19, 1–14. [Google Scholar]
- Mohamed, M.B.; Hsouna, N.; Bouzidi, C.; Hernández-Álvarez, C.; Martín, I.R. Temperature sensing and energy transfer processes in Pr3+-Yb3+ co-doped phosphate glasses. Opt. Mater. 2025, 162, 116811. [Google Scholar] [CrossRef] [Scilit]
- Langar, A.; Bouzidi, C.; Elhouichet, H.; Férid, M. Er–Yb codoped phosphate glasses with improved gain characteristics for an efficient 1.55 µm broadband optical amplifiers. J. Lumin. 2014, 148, 249–255. [Google Scholar] [CrossRef] [Scilit]
- Valvo, M.; Chien, Y.-C.; Liivat, A.; Tai, C.-W. Detecting voltage shifts and charge storage anomalies by iron nanoparticles in three-electrode cells based on converted iron oxide and lithium iron phosphate. Electrochim. Acta 2023, 440, 141747. [Google Scholar] [CrossRef] [Scilit]
- Camara, D.; Fridjine, S.; Bouzidi, C. Characterization and energy transfer of Sm3+/Tb3+ co-doped ZnO elaborated by auto-combustion method. J. Lumin. 2025, 286, 121391. [Google Scholar] [CrossRef] [Scilit]
- Hsouna, N.; Bouzidi, C. Spectroscopic properties of Eu-doped P2O5, Al2O3 and Na2O phosphate glasses. Inorg. Chem. Commun. 2024, 163, 112258. [Google Scholar] [CrossRef] [Scilit]
- Abdallah, A.; Bouzidi, C. Optical studies of Dy2O3 doped phosphate glasses for potential white luminescence applications. Solid State Sci. 2025, 165, 107958. [Google Scholar] [CrossRef] [Scilit]
- Amira, G.; Chaker, B.; Habib, E. Spectroscopic properties of Dy3+ doped ZnO for white luminescence applications. Spectrochim. Acta Part A Mol. Biomol. Spectrosc. 2017, 177, 164–169. [Google Scholar] [CrossRef] [Scilit]
- Chouiekh, A.; Bouftila, N.E.H.; Aqdim, S.; Bih, L.; Ababou, Y.; Tahiri, A.; Rjeb, A.; Faik, A.; Naji, M. Borophosphate glass based electrolyte composite for high lithium ionic conductivity. J. Alloys Compd. 2025, 1010, 177160. [Google Scholar] [CrossRef] [Scilit]
- Shalaby, M.; Alziyadi, M.O.; Gamal, H.; Hamdy, S. Solid-state lithium-ion battery: The key components enhance the performance and efficiency of anode, cathode, and solid electrolytes. J. Alloys Compd. 2023, 969, 172318. [Google Scholar] [CrossRef] [Scilit]
- Apandi, N.; Zaid, M.; Hisam, R. Investigation of the bioactivity, structural, optical and photoluminescence properties of ZnO-doped borate bioactive glass. J. Alloys Compd. 2026, 1061, 187396. [Google Scholar] [CrossRef] [Scilit]
- Voskresenskaya, N.; Sokolova, I.D. Condensed phosphates in the molten state. Russ. Chem. Rev. 1969, 38, 862–872. [Google Scholar] [CrossRef] [Scilit]
- Kherazi, Y.; El Boukili, A.; Boudad, L.; Chafi, M.; El Amraoui, M.; Taibi, M. Effect of Natural Phosphate Incorporation on the Structural, Thermal, and Optical Properties of a 50Na2O–50P2O5 Glass System. Mater. Chem. Phys. 2026, 354, 132197. [Google Scholar] [CrossRef] [Scilit]
- Bayoudhi, D.; Khalifa, M.; Bouzidi, C.; Ismail, M.; Ezzaouia, H. Innovative Technique for Purification of Phosphate Glass for Protective Solar Cell Energy Application. Chem. Afr. 2024, 7, 1667–1674. [Google Scholar] [CrossRef] [Scilit]
- Choudhary, B.P.; Singh, N. Phosphate glasses: Synthesis, properties and applications. In Advances in Glass Research; Springer: Berlin/Heidelberg, Germany, 2023; pp. 79–112. [Google Scholar]
- Ibrahim, A.; Alharbi, S.A.R.; Amin, H.Y.; Sadeq, M. Effect of Thermal Treatment on Structural Evolution and DC Conductivity of Lithium Phosphate Vanadium Iron Oxide Glass-Ceramics. J. Alloys Compd. 2026, 1062, 187068. [Google Scholar] [CrossRef] [Scilit]
- Du, T.; Chen, Z.; Liu, H.; Zhang, Q.; Bauchy, M.; Yue, Y.; Smedskjaer, M.M. Controlling factor for fracture resistance and ionic conduction in glassy lithium borophosphate electrolytes. Mater. Today Energy 2023, 37, 101390. [Google Scholar] [CrossRef] [Scilit]
- Nandy, S.; Hota, S.B.; Ghosh, B.K.; Kumar, M.; Patra, D.; Hazra, S.K.; Mondal, R.; Biswas, D. Comprehensive characterization of xV2O5-(0.3-x) Li2O-0.35 TeO2-0.35 P2O5 glasses: Influence of V2O5 concentration on thermal and dielectric properties. Phys. B Condens. Matter 2025, 714, 417436. [Google Scholar]
- Li, S.; Qiao, A.; Gao, C.; Zhang, Y.; Yue, Y.; Yue, Y. Mechanical and dynamic properties of V2O5-TeO2-P2O5 glasses. J. Alloys Compd. 2021, 863, 158074. [Google Scholar] [CrossRef] [Scilit]
- Ge, W.; Ren, H.; Zhang, Y.; He, F.; Jiang, S.; Zhao, X.; Lin, H. Investigation of the glass forming regularity and thermal behavior of lead-free V2O5-TeO2-RO (R = Ca, Sr, Ba) low temperature sealing glass for electronics packaging. J. Alloys Compd. 2024, 971, 172561. [Google Scholar] [CrossRef] [Scilit]
- Wally, N.; Sheha, E.; Morad, I.; El-Desoky, M. NaMoO2PO4 glass ceramic nanocomposite as a novel cathode material for magnesium-ion batteries. Ionics 2025, 31, 571–586. [Google Scholar] [CrossRef] [Scilit]
- Barczyński, R.J.; Murawski, L. Mixed electronic–ionic conductivity in vanadate oxide glasses containing alkaline ions. Mater. Sci.-Pol. 2006, 24, 221–227. [Google Scholar]
- Murawski, L.; Chung, C.H.; Mackenzie, J.D. Electrical properties of semiconducting oxide glasses. J. Non-Cryst. Solids 1979, 32, 91–104. [Google Scholar] [CrossRef] [Scilit]
- Austin, I.G.; Mott, N.F. Polarons in crystalline and non-crystalline materials. Adv. Phys. 1969, 18, 41–102. [Google Scholar] [CrossRef] [Scilit]
- Martin, S.W. Ionic conduction in phosphate glasses. J. Am. Ceram. Soc. 1991, 74, 1767–1784. [Google Scholar] [CrossRef] [Scilit]
- Olvera-Mancilla, J.; Escorihuela, J.; Alexandrova, L.; Andrio, A.; García-Bernabé, A.; Del Castillo, L.F.; Compañ, V. Effect of metallacarborane salt H [COSANE] doping on the performance properties of polybenzimidazole membranes for high temperature PEMFCs. Soft Matter 2020, 16, 7624–7635. [Google Scholar] [CrossRef] [Scilit]
- Compañ, V.; Escorihuela, J.; Olvera, J.; García-Bernabé, A.; Andrio, A. Influence of the anion on diffusivity and mobility of ionic liquids composite polybenzimidazol membranes. Electrochim. Acta 2020, 354, 136666. [Google Scholar] [CrossRef] [Scilit]
- Brow, R.K. Review: The structure of simple phosphate glasses. J. Non-Cryst. Solids 2000, 263–264, 1–28. [Google Scholar] [CrossRef] [Scilit]
- Hussin, R.; Husin, M.S.; Halim, D.N.F.A.; Hamdan, S. Vibrational studies of crystalline phase strontium magnesium phosphates doped with Eu2O3. Solid State Sci. Technol. 2010, 18, 288–301. [Google Scholar]
- Yung, S.; Hsu, S.; Chang, C.; Hsu, K.; Chin, T.; Hsiang, H.; Lai, Y. Thermal, chemical, optical properties and structure of Er3+-doped and Er3+/Yb3+-codoped P2O5–Al2O3–ZnO glasses. J. Non-Cryst. Solids 2011, 357, 1328–1334. [Google Scholar] [CrossRef] [Scilit]
- Jiménez, J.A.; Hedge, V.; Viswanath, C.D.; Amesimenu, R. Insights into the structural, thermal/dilatometric, and optical properties of Dy3+-doped phosphate glasses for lighting applications. ACS Phys. Chem. Au 2024, 4, 720–735. [Google Scholar] [CrossRef] [Scilit]
- Seshadri, M.; Batesttin, C.; Silva, I.L.; Bell, M.; Anjos, V. Effect of compositional changes on the structural properties of borophosphate glasses: ATR-FTIR and Raman spectroscopy. Vib. Spectrosc. 2020, 110, 103137. [Google Scholar] [CrossRef] [Scilit]
- Bayoudhi, D.; Bouzidi, C.; Matei, E.; Secu, M.; Galca, A.C. Optical characterization of Sm3+ doped phosphate glasses for potential orange laser applications. J. Lumin. 2024, 265, 120204. [Google Scholar] [CrossRef] [Scilit]
- Bih, L.; Azrour, M.; Manoun, B.; Graça, M.; Valente, M. Raman spectroscopy, X-Ray, SEM, and DTA analysis of alkali-phosphate glasses containing WO3 and Nb2O5. J. Spectrosc. 2013, 2013, 123519. [Google Scholar] [CrossRef] [Scilit]
- Kalampounias, A.G. Short-time vibrational dynamics of metaphosphate glasses. J. Phys. Chem. Solids 2012, 73, 148–153. [Google Scholar] [CrossRef] [Scilit]
- Cozar, O.; Bako, M.; Daraban, L.; Ardelean, I.; David, L. P2O5-CaO-Li2O glass system-a possible ESR dosimeter. J. Optoelectron. Adv. Mater.-Rapid Commun. 2008, 2, 249–252. [Google Scholar]
- Hussin, R.; Salim, M.A.; Alias, N.S.; Abdullah, M.S.; Abdullah, S.; Fuzi, S.A.A.; Hamdan, S.; Yusuf, M.N.M. Vibrational studies of calcium magnesium ultraphosphate glasses. Malays. J. Fundam. Appl. Sci. 2009, 5, 41–53. [Google Scholar]
- Jonscher, A.K. Dielectric relaxation in solids. J. Phys. D Appl. Phys. 1999, 32, R57–R70. [Google Scholar] [CrossRef] [Scilit]
- Wang, C.-Q.; Xu, B.-M.; Zou, J.; He, Z.; Yan, Y.; Li, J.-G.; Shao, B. Feed-forward control for quantum state protection against decoherence. Phys. Rev. A 2014, 89, 032303. [Google Scholar] [CrossRef] [Scilit]
- Kumar, M. Dielectric Relaxation and Electrical Modulus Formalism in Solids. Eng. Phys. 2026, 9, 1–9. [Google Scholar] [CrossRef] [Scilit]
- Ignaczak, W.; Skov, A.L.; El Fray, M. Interfacial Polarization in Thermoplastic Basalt Fiber-Reinforced Composites. Polymers 2020, 12, 1486. [Google Scholar] [CrossRef] [Scilit]
- Ben Ishai, P.; Talary, M.S.; Caduff, A.; Levy, E.; Feldman, Y. Electrode polarization in dielectric measurements: A review. Meas. Sci. Technol. 2013, 24, 102001. [Google Scholar] [CrossRef] [Scilit]
- Ohki, Y. Broadband Complex Permittivity and Electric Modulus Spectra for Dielectric Materials Research. IEEJ Trans. Electron. Eng. 2022, 17, 958–972. [Google Scholar] [CrossRef] [Scilit]
- Hakiki, F.; Lin, C.-P. Broadband Complex Permittivity Spectra: Cole–Cole vs Circuit Models. ACS Meas. Sci. Au 2025, 5, 716–728. [Google Scholar] [CrossRef] [Scilit]
- Jäckle, J.; Richert, R. Why retardation takes more time than relaxation in a linear medium. Phys. Rev. E—Stat. Nonlinear Soft Matter Phys. 2008, 77, 031201. [Google Scholar] [CrossRef] [Scilit]
- Fröhlich, H. Theory of Dielectrics: Dielectric Constant and Dielectric Loss; Oxford University Press: Oxford, UK, 1958. [Google Scholar]
- Einfeldt, J.; Meißner, D.; Kwasniewski, A. Polymerdynamics of cellulose and other polysaccharides in solid state-secondary dielectric relaxation processes. Prog. Polym. Sci. 2001, 26, 1419–1472. [Google Scholar] [CrossRef] [Scilit]
- Richert, R.; Agapov, A.; Sokolov, A.P. Appearance of a Debye process at the conductivity relaxation frequency of a viscous liquid. J. Chem. Phys. 2011, 134, 104508. [Google Scholar] [CrossRef] [Scilit]
- Macedo, P.; Ct, M.; Bose, R. The Role of Ionic Diffusion in Polarisation in Vitreous Ionic Conductors. Phys. Chem. Glasses 1972, 13, 171–179. [Google Scholar]
- Mickish, D.J. Effects of interfacial polarization and loading factor in dielectric-loss measurements of composites. J. Appl. Phys. 1979, 50, 5923–5929. [Google Scholar] [CrossRef] [Scilit]
- Balaya, P.; Goyal, P. Non-Debye conductivity relaxation in a mixed glassformer system. J. Non-Cryst. Solids 2005, 351, 1573–1576. [Google Scholar] [CrossRef] [Scilit]
- Chowdari, B.; Gopalakrishnan, R.; Goh, S.; Tan, K. Ionic transport studies of the glassy silver vanadomolybdate system. J. Mater. Sci. 1988, 23, 1248–1254. [Google Scholar] [CrossRef] [Scilit]
- Manthiram, A.; Yu, X.; Wang, S. Lithium battery chemistries enabled by solid-state electrolytes. Nat. Rev. Mater. 2017, 2, 16103. [Google Scholar] [CrossRef] [Scilit]

Disclaimer/Publisher’s Note: The statements, opinions and data contained in all publications are solely those of the individual author(s) and contributor(s) and not of MDPI and/or the editor(s). MDPI and/or the editor(s) disclaim responsibility for any injury to people or property resulting from any ideas, methods, instructions or products referred to in the content. |
© 2026 by the authors. Licensee MDPI, Basel, Switzerland. This article is an open access article distributed under the terms and conditions of the Creative Commons Attribution (CC BY) license.