


Abstract
High-pressure forming at 300 MPa and room temperature was applied before the sintering of a lithium fluoride (LiF) powder. The as-fired samples were tested as dielectrics and showed very interesting characteristics. The best sample, sintered at 750 °C for 8 h, had a relative permittivity of 12.1 and a loss tangent of 0.0006, both of them frequency-independent and temperature-independent up to at least 150 °C, and moreover, the volume DC resistivity was 27.4 × 10¹² Ωm at room temperature. These parameters are comparable with oxide ceramics, processed at temperatures over 1300 °C, as for example, aluminum dioxide (Al2O3) or Y3Al5O12 (YAG). LiF material is advantageous because of its very low sintering temperature, which is only about one-half of typical oxide ceramic dielectrics.
1. Introduction
In recent years, low temperature cofired ceramics (LTCC) have become an attractive technology for electronic components and substrates that should be compact, light, and offer high speeds and functionality for portable electronic devices. For LTCC applications, the densification temperature of the dielectric ceramics (a material having lower dielectric loss than organic materials) must, however, be lower than the melting temperatures of metallic electrodes such as Ag (~961 °C) [1]. The sintering temperature of most ceramics is over 1200 °C and markedly exceeds the melting temperature of the electrodes. This factor precludes the co-firing.
Microwave dielectric ceramics with low permittivity and low dielectric loss are usually oxides because of their low ionic polarizabilities [2]. In addition, the limited research on halides shows that they also exhibit low permittivity [2]. Within the family of halides, fluorides are typically the most lightweight. The low permittivity of fluorides is attributed [2] to the lower ionic polarizability of F− (1.62 Å3) than O2− (2.00 Å3). Lithium fluoride, LiF, has been widely applied as an effective sintering additive or flux in many ceramic substances but only recently has the interest in the synthesis of pure LiF materials via conventional sintering and their dielectric properties begun.
One serious problem with the sintering of pure lithium fluoride is the difficulty in its densification [2]. The sintering procedure is even more problematic for LiF than for alkaline earth fluorides. The highest relative density of LiF ceramics prepared by traditional sintering was only about 90% [2]. The reason for the low density of LiF compacts is the pore network that breaks up at the initial stage of sintering. Due to them, the air in the isolated pores balances the sintering pressure and prevents further densification.
LiF has a melting point of approximately 845 °C [3]. In connection with this, LiF is generally treated as an effective additive in achieving highly transparent ceramics, such as Y2O3-MgO, Y3Al5O12 (YAG), and MgAl2O4 [4], as well as dielectric materials such as MgO, CaWO4, or Li2TiO3. Its compatibility with silver electrodes suggests that sintered lithium fluoride has great potential as a component or an additive in LTCC formulations [1]. Liu et al. prepared a patch antenna based on LiF dielectric film and considered its performance as excellent [5]. The electronic structure of pure LiF shows an absence of localized defect states in the band gap that play as charge carrier trapping centers [5,6].
The final relative density of sintered ceramics depends on the initial relative density of green compacts (typically 50–70% of the final one). The green density can be improved, also without optimizing the particle shape and powder size distribution, by increasing the compacting pressure up to hundreds of MPa. Particles exhibiting low hardness can be easily rearranged and reshaped by the mechanical load. As a disadvantage, however, the high uniaxial pressure during the firing may result in large residual stresses. Such stresses are responsible for the subsequent cracking of the compacts [2]. LiF has a low Mohs hardness of about 3, so the high compacting pressure not only results in the rearrangement of LiF raw particles but also leads to the deformation of the particles. This enhances the removal of pores and increases the relative density. It means that the pressure-induced plastic deformation is important for the densification and particle refinement of the LiF compacts. An analogous mechanism [2] has also been reported in different crystals with a rather low hardness, such as NaCl. Materials like Li2MoO4 and NaCl have high solubilities of 36.0 g and 44.8 g in 100 g of water [2], whereas for LiF, it is only 0.13 g.
Residual pores are considered the most deleterious factor influencing the optical transmittance of fluoride ceramics [4]. Hence, the fabrication of fluoride-based transparent ceramics generally requires advanced techniques such as vacuum sintering, hot isostatic pressing (HIP), and spark plasma sintering (SPS) [4]. This knowledge calls for being transferred into the field of dielectrics as well.
Low surface free energy leads to a low driving force for the densification of LiF. Given the substantial surface diffusion, the breakup of pore channels into isolated voids begins early. The pressure of trapped air in the isolated pores, however, reduces the driving force for densification. The low driving force for densification and also gas entrapment are the main causes of low final density [3].
Concerning the dielectric parameters received in earlier works with a pure LiF material, conventionally sintered LiF exhibited [3] a relative permittivity of 9, a loss tangent of 0.078, and a temperature coefficient of capacitance of −118 ppm/K (measured between 12 and 15 GHz). Another team used a very innovative “cold sintering” approach to produce LiF [1] with a permittivity of 8.2, a loss tangent of 0.135, and a temperature coefficient of −135 ppm/K. Relative permittivity speaks about polarization and the ability of materials to store the energy of the AC field if is it charged as a capacitor. Loss tangent is a parameter characterizing the quantity of energy dissipated into heat. The temperature coefficient describes how the capacitance is stable with the temperature. In applications of such low-loss ceramics, as LiF in general is, we need low permittivity and low loss (the material serves as a perfect insulator without energy dissipation or parasitic phenomena at a signal transfer, and moreover, all these parameters should be as thermally stable as possible to ensure the constant behavior of the circuit equipped with the LiF-based components versus the unavoidable temperature fluctuations in the environment.
We will show in the presented research that the relative density can be improved to values over 90% T.D. with the aid of a high-pressure forming (HPF) approach. The low sintering temperature is beneficial for the possible practical applications of LiF. The combination of its low permittivity and low loss tangent, both of them very stable with frequency, and also with the high DC resistivity, makes LiF a very prospective material. The temperature evolution of the dielectric properties of pure LiF ceramics was, however, until now, outside the focus of researchers. In our actual work, these investigations are conducted in up to 300 °C.
2. Experimental Section
2.1. Sample Preparation
With a motivation to produce high-quality LiF dielectrics, we applied high-pressure forming (HPF) [7] before conventional sintering. This approach enabled us to avoid the addition of a plasticizer before the green body formation. A mechanical force corresponding to an uniaxial pressure of 300 MPa was applied for 1 min (ramps up and down 1 MPa per second) with the spark plasma sintering (SPS) apparatus without any heating. Stainless steel die and punches were used and the compressed LiF bodies were removed from the punch/die assembly with slow movements in a manual press. The compressed discs (20 mm diameter) were placed into a laboratory furnace and sintered in air. The procedure consisted of a heating rate of 7 °C/min, dwelling at maximum temperature, and a cooling rate of 7 °C/min down to room temperature. Because of the pronounced shrinkage, the produced samples were cylinders with 18.5 mm in diameter and 2–3 mm in height. The samples were classified according to the maximum temperature and dwell time, see Table 1. For several tests, only the sample 700-2 as the extremely “low-sintered” and the sample 750-8 as a representative of “high-sintered” products were selected.
Table 1.
Sample classification, thermal coefficient of dielectric capacitance, and resistivity.
2.2. Structure Characterization
The phase composition was evaluated by means of X-ray diffraction (XRD), carried out by the powder diffractometer D8 Discover (Bruker, Germany). The Bragg–Brentano geometry with a 1D detector and Cu-Kα radiation was used. The scanned region started from 20 to 130° 2θ with a 0.03° 2θ step size and a 192 s counting time per step. The obtained diffraction patterns were subjected to TOPAS 5 software treatment.
Apparent density and open porosity were measured by the Archimedean (i.e., water immersion) method. The precision of these measurements is ±0.002 g/cm3 for the apparent density and about ±0.1% for the open porosity.
The cross-sectional optical micrographs were taken with a digital camera and analyzed using Lucia G software (Laboratory Imaging, Prague, Czech Republic). The cross-sections were observed also via scanning electron microscopy (SEM) using a Phenom-Pro microscope (Thermo Fisher Sci., Eindhoven, The Netherlands) equipped with a CeB6 thermionic cathode and working in backscattered electron (BSE) mode. The images were collected at 5 kV electron beam tension.
The microhardness of the samples was measured using a Hanemann microhardness head (Zeiss, Germany) mounted on an optical microscope with a fixed load of 1 N and a Vickers indenter. Twenty indentations made on randomly selected areas on the cross-section of each sample were analyzed.
2.3. Dielectric Parameters
Before placing the electrodes, the samples were ground with SiC papers to eliminate surface unevenness. The opposite faces of the cylindrical LiF samples were covered with an Al film in an evaporating apparatus using a mask. An assembly of three electrodes was applied to diminish the stray current effect. The bottom side was entirely coated, while the top side was equipped with an internal circle electrode of 12 mm in diameter and an external ring electrode (earth-connected during the measurements). This one was separated from the internal ring with a 1 mm gap. The electric field was applied along the same direction as the pressure before sintering (i.e., perpendicular to the cylinder face). The capacitance was measured using a programmable impedance analyzer, model 4284A (Agilent, Santa Clara, CA, USA), and a high-precision sample fixture 16451B (Agilent, Santa Clara, CA, USA). The relative permittivity εr was calculated from the measured capacitance and LiF cylinder dimensions using the equation:
where C (F) stands for the electrical capacitance of the sample, d (m) is the sample thickness, A (m2) is the area of the measuring electrode, and ε0 is the permittivity of vacuum (8.854 × 10⁻¹² F/m). The same setup was also used for the simultaneous loss tangent (Tan δ) measurement. The applied voltage was set to 1 ± 0.02 V. Measurements at elevated temperatures were carried out using a Novotherm Heating Unit 2108 (Novocontrol, Montabaur, Germany).
εr = (C·d)/(A·ε0),
Electric resistance was examined at room temperature with a special adapter—Keithley model 6105. The DC electric field was applied from a regulated high-voltage source and the values were recorded with a multi-purpose electrometer (617C, Keithley Instruments, Solon, OH, USA). The magnitude of the applied voltage was 100 ± 0.05 V. Volume resistivity calculation was based on the measured resistance and specimen dimensions.
2.4. Reflectance and Band Gap
The optical diffuse reflectance spectra were collected using a UV-vis-NIR scanning spectrophotometer MPC 3100 (Shimadzu, Japan) with a multi-purpose large sample compartment. The reflectance curves were recorded between 250 nm and 1350 nm. The reflectance standard was applied, which is a barium sulfate (BaSO4) mirror with 100% reflection in the corresponding range.
The optical band gap energy was calculated using the Tauc relationship [8]:
with the absorption coefficient α, the photon energy hν, a constant A, and the optical band gap Eg. The exponent n value is equal to 2 for direct allowed transition and 1/2 for indirect allowed transition. Since LiF has a direct transition [9], the used n value is 2:
(α·hν)n = A·(hν − Eg)
(α·hν)2 = A·(hν − Eg)
Correspondingly, α is related to the Kubelka–Munk function F:
where R is the reflectance and S is the scattering factor. Eg [eV] is determined from the extrapolation of the linear part of the Tauc plot up to the intercept of the x-axis.
F(R) = (1 − R)2/2R = α/S
3. Results and Discussion
3.1. Dielectric Properties
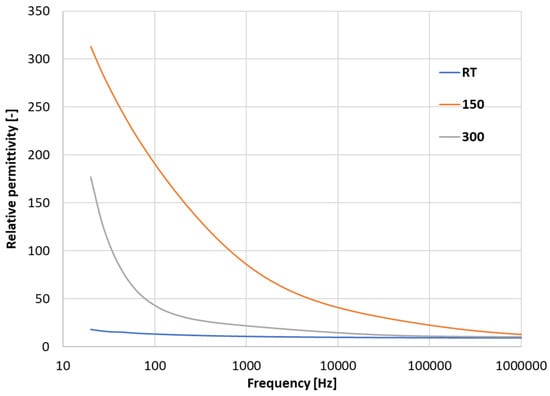
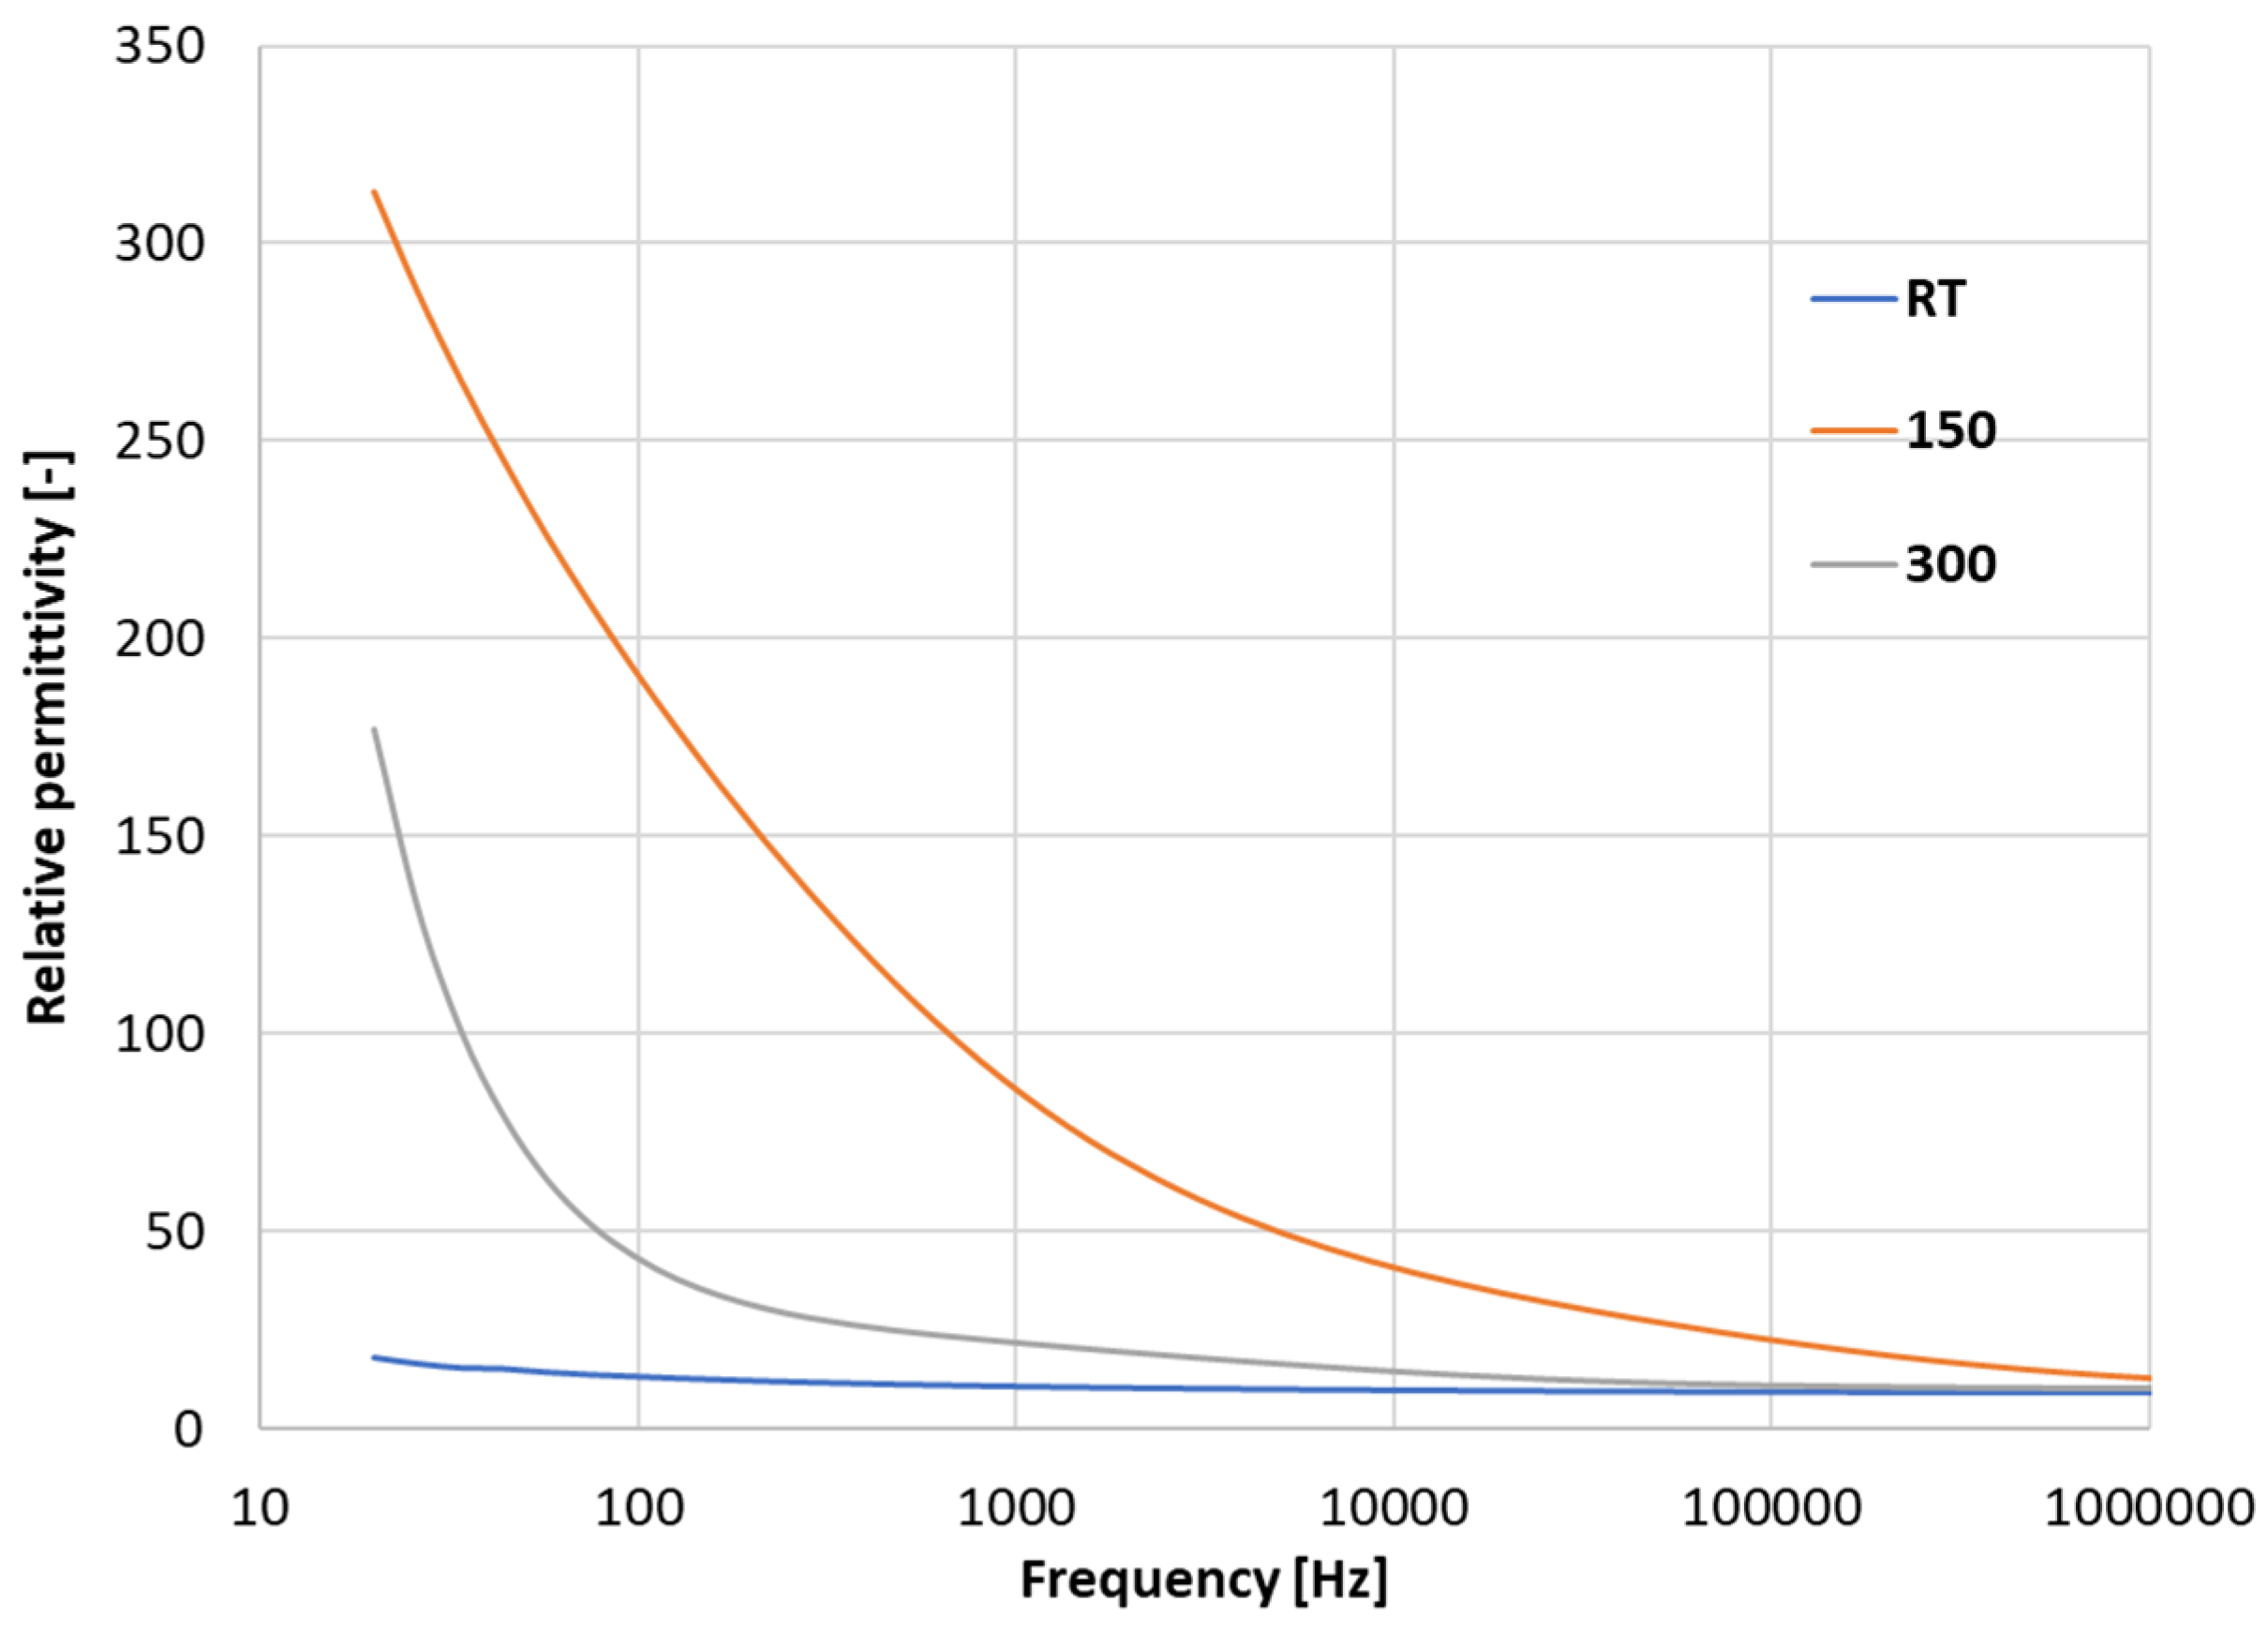
The sample 700-2, i.e., the “low-sintered” one, exhibited very temperature-dependent relative permittivity, as shown in Figure 1. The room temperature curve (RT) shows values between 10 and 20, rather stable in the whole frequency range—the value is exactly 18 at 20 Hz and 9.3 at 1 MHz. The loss tangent at 1 MHz was equal to 0.006. However, the temperature increase to 150 °C led to a permittivity of over 300 at 20 Hz. A further increase in the measurement temperature to 300 °C caused certain improvements from the stability standpoint, but the low-frequency permittivity was still elevated (to about 150). There were certain low-frequency polarization phenomena in the sample.
Figure 1.
Sample 700-2, relative permittivity versus changing frequency for three varying temperatures.
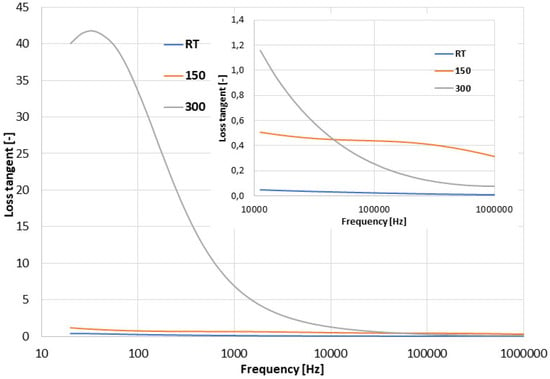
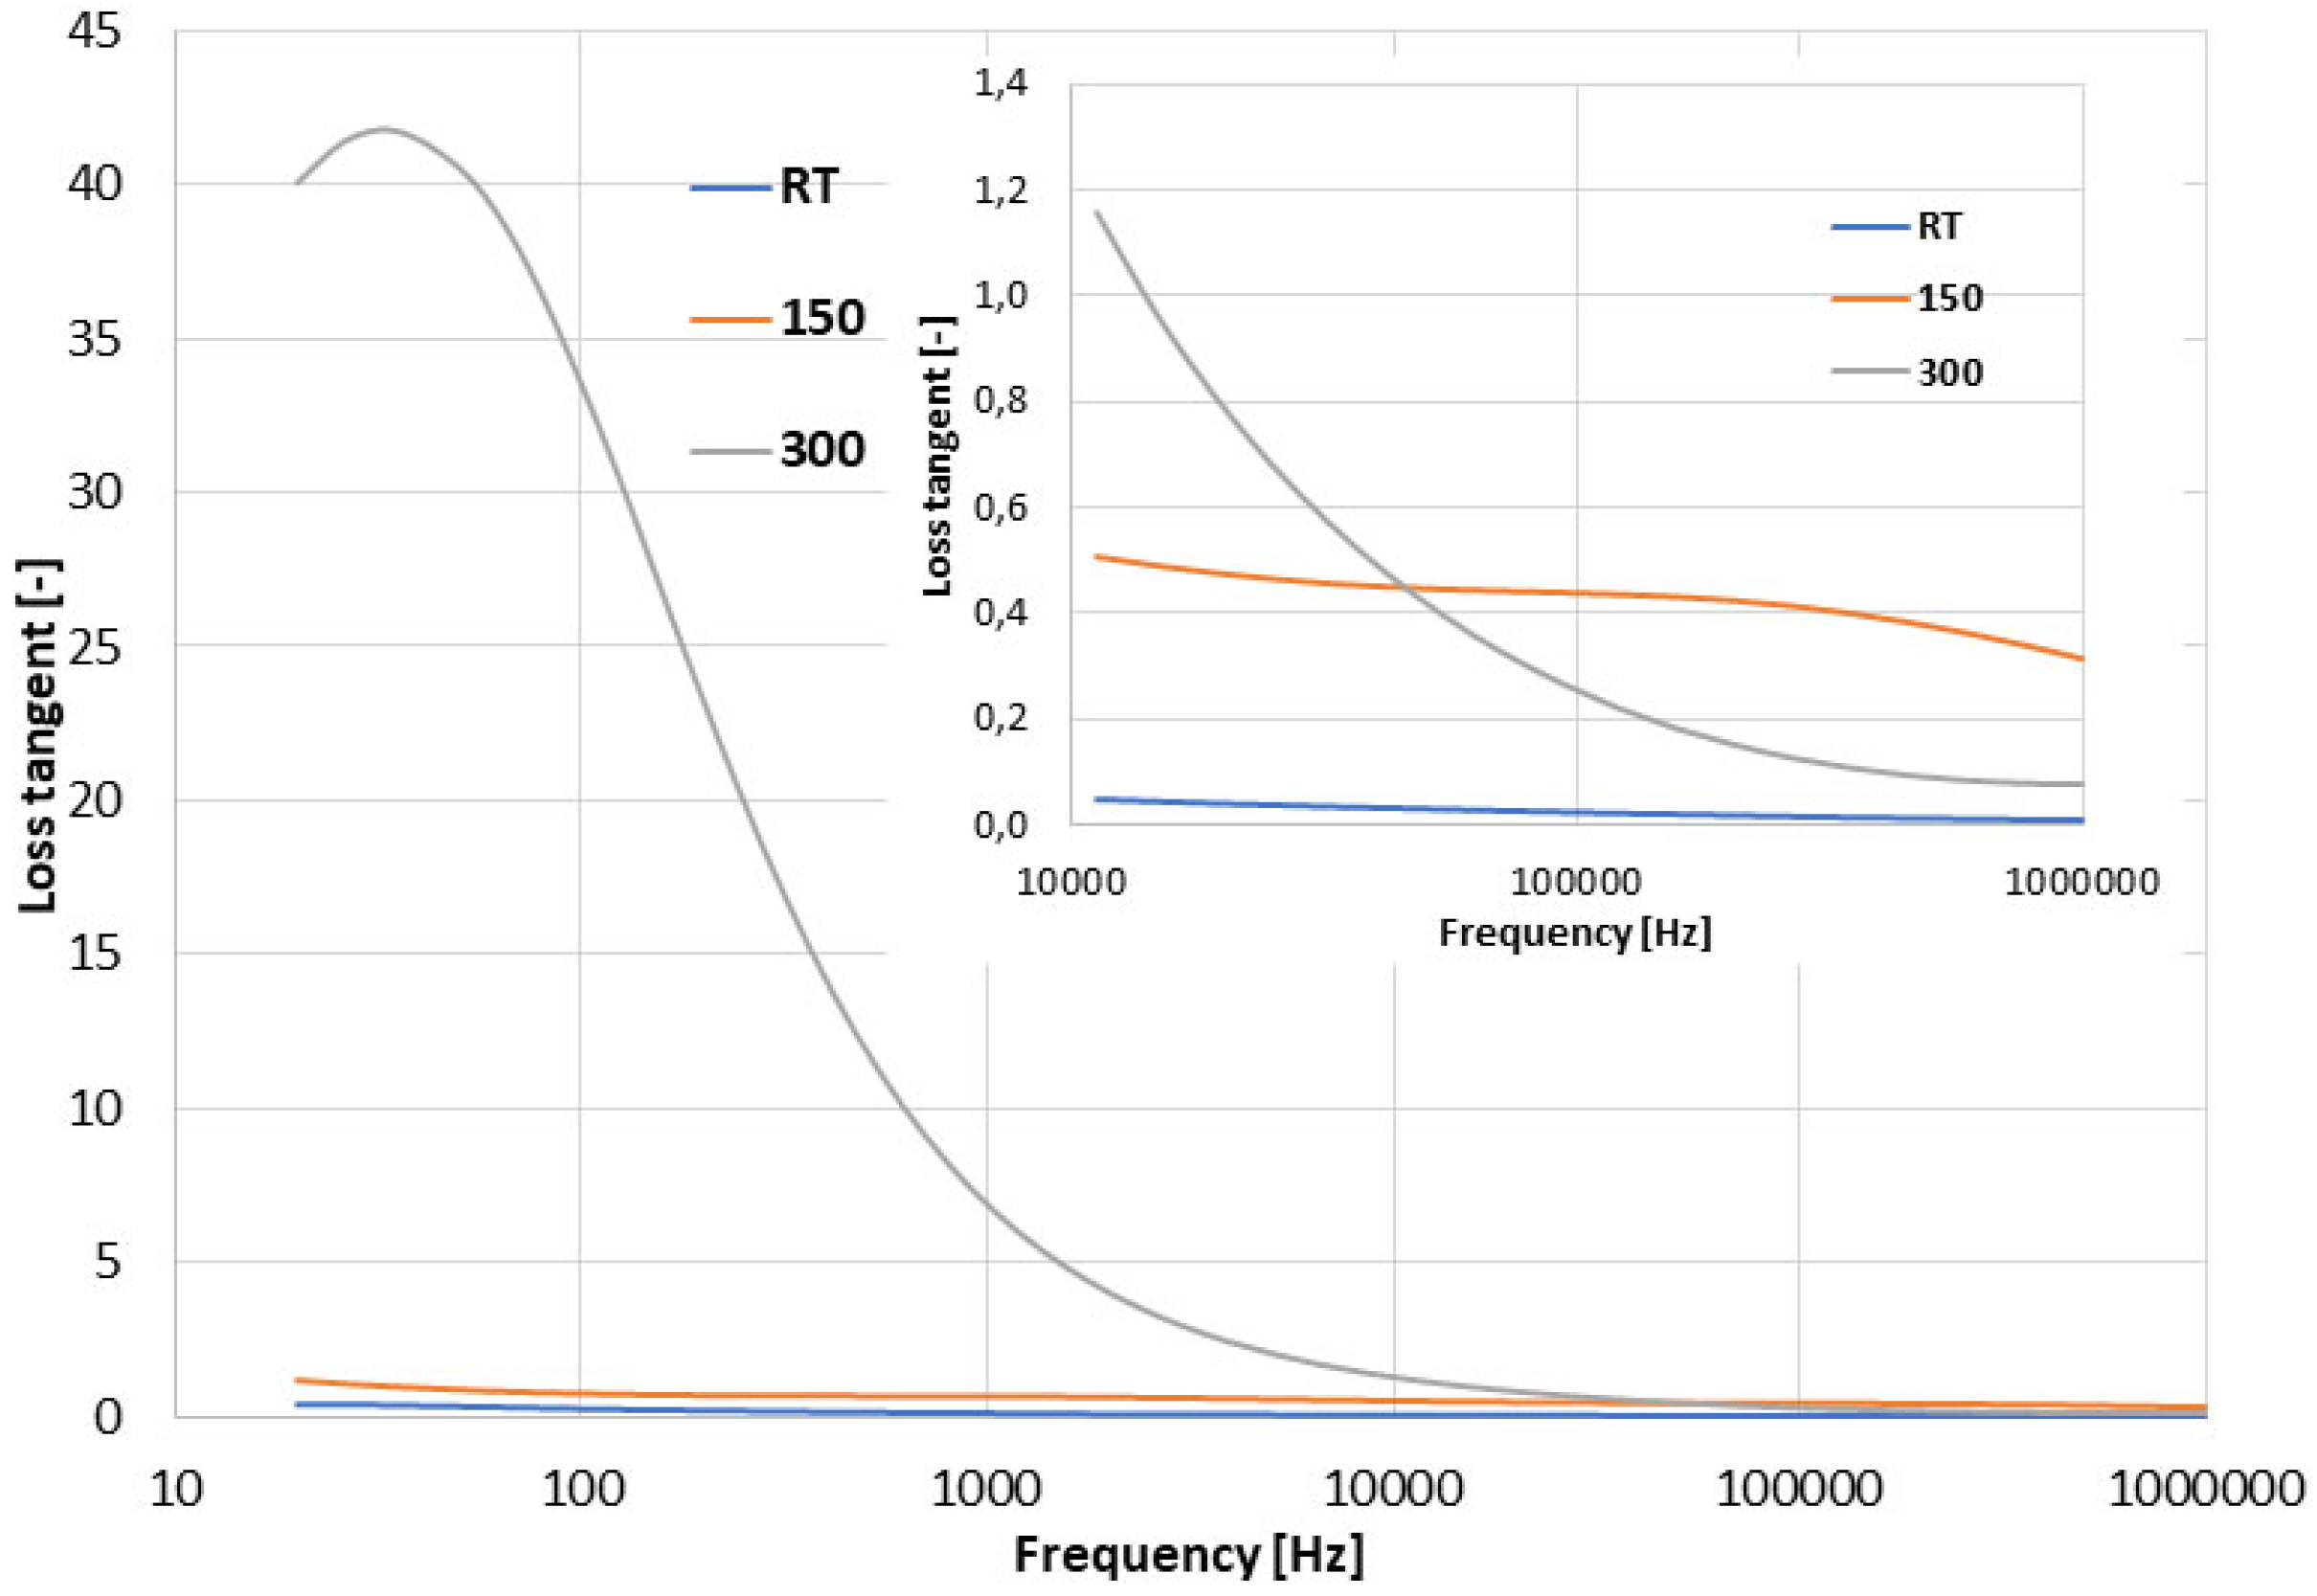
This sample 700-2 was extremely lossy at 300 °C, with values of about 40 at the lowest frequencies, as shown in Figure 2. The loss curve recorded at 150 °C is better from the viewpoint of thermal stability. However, the inset in Figure 2 shows that the loss tangent is still about 0.5 between 10 kHz and 100 kHz. Such a lossy material is very disadvantageous from the application standpoint. The room temperature values of this sample at 1 MHz, i.e., relative permittivity of 9.3 and loss tangent of 0.006, are similar to good-quality alumina or YAG dielectrics (which are materials that have a two times higher sintering temperature).
Figure 2.
Sample 700-2, loss tangent versus changing frequency for three varying temperatures.
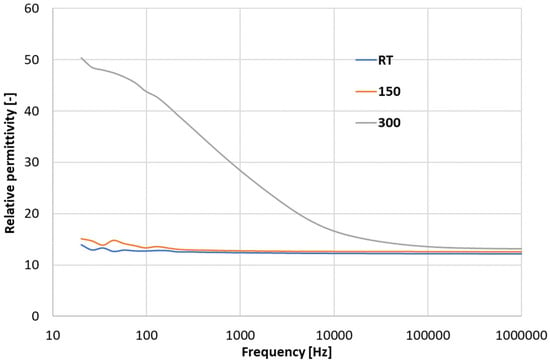
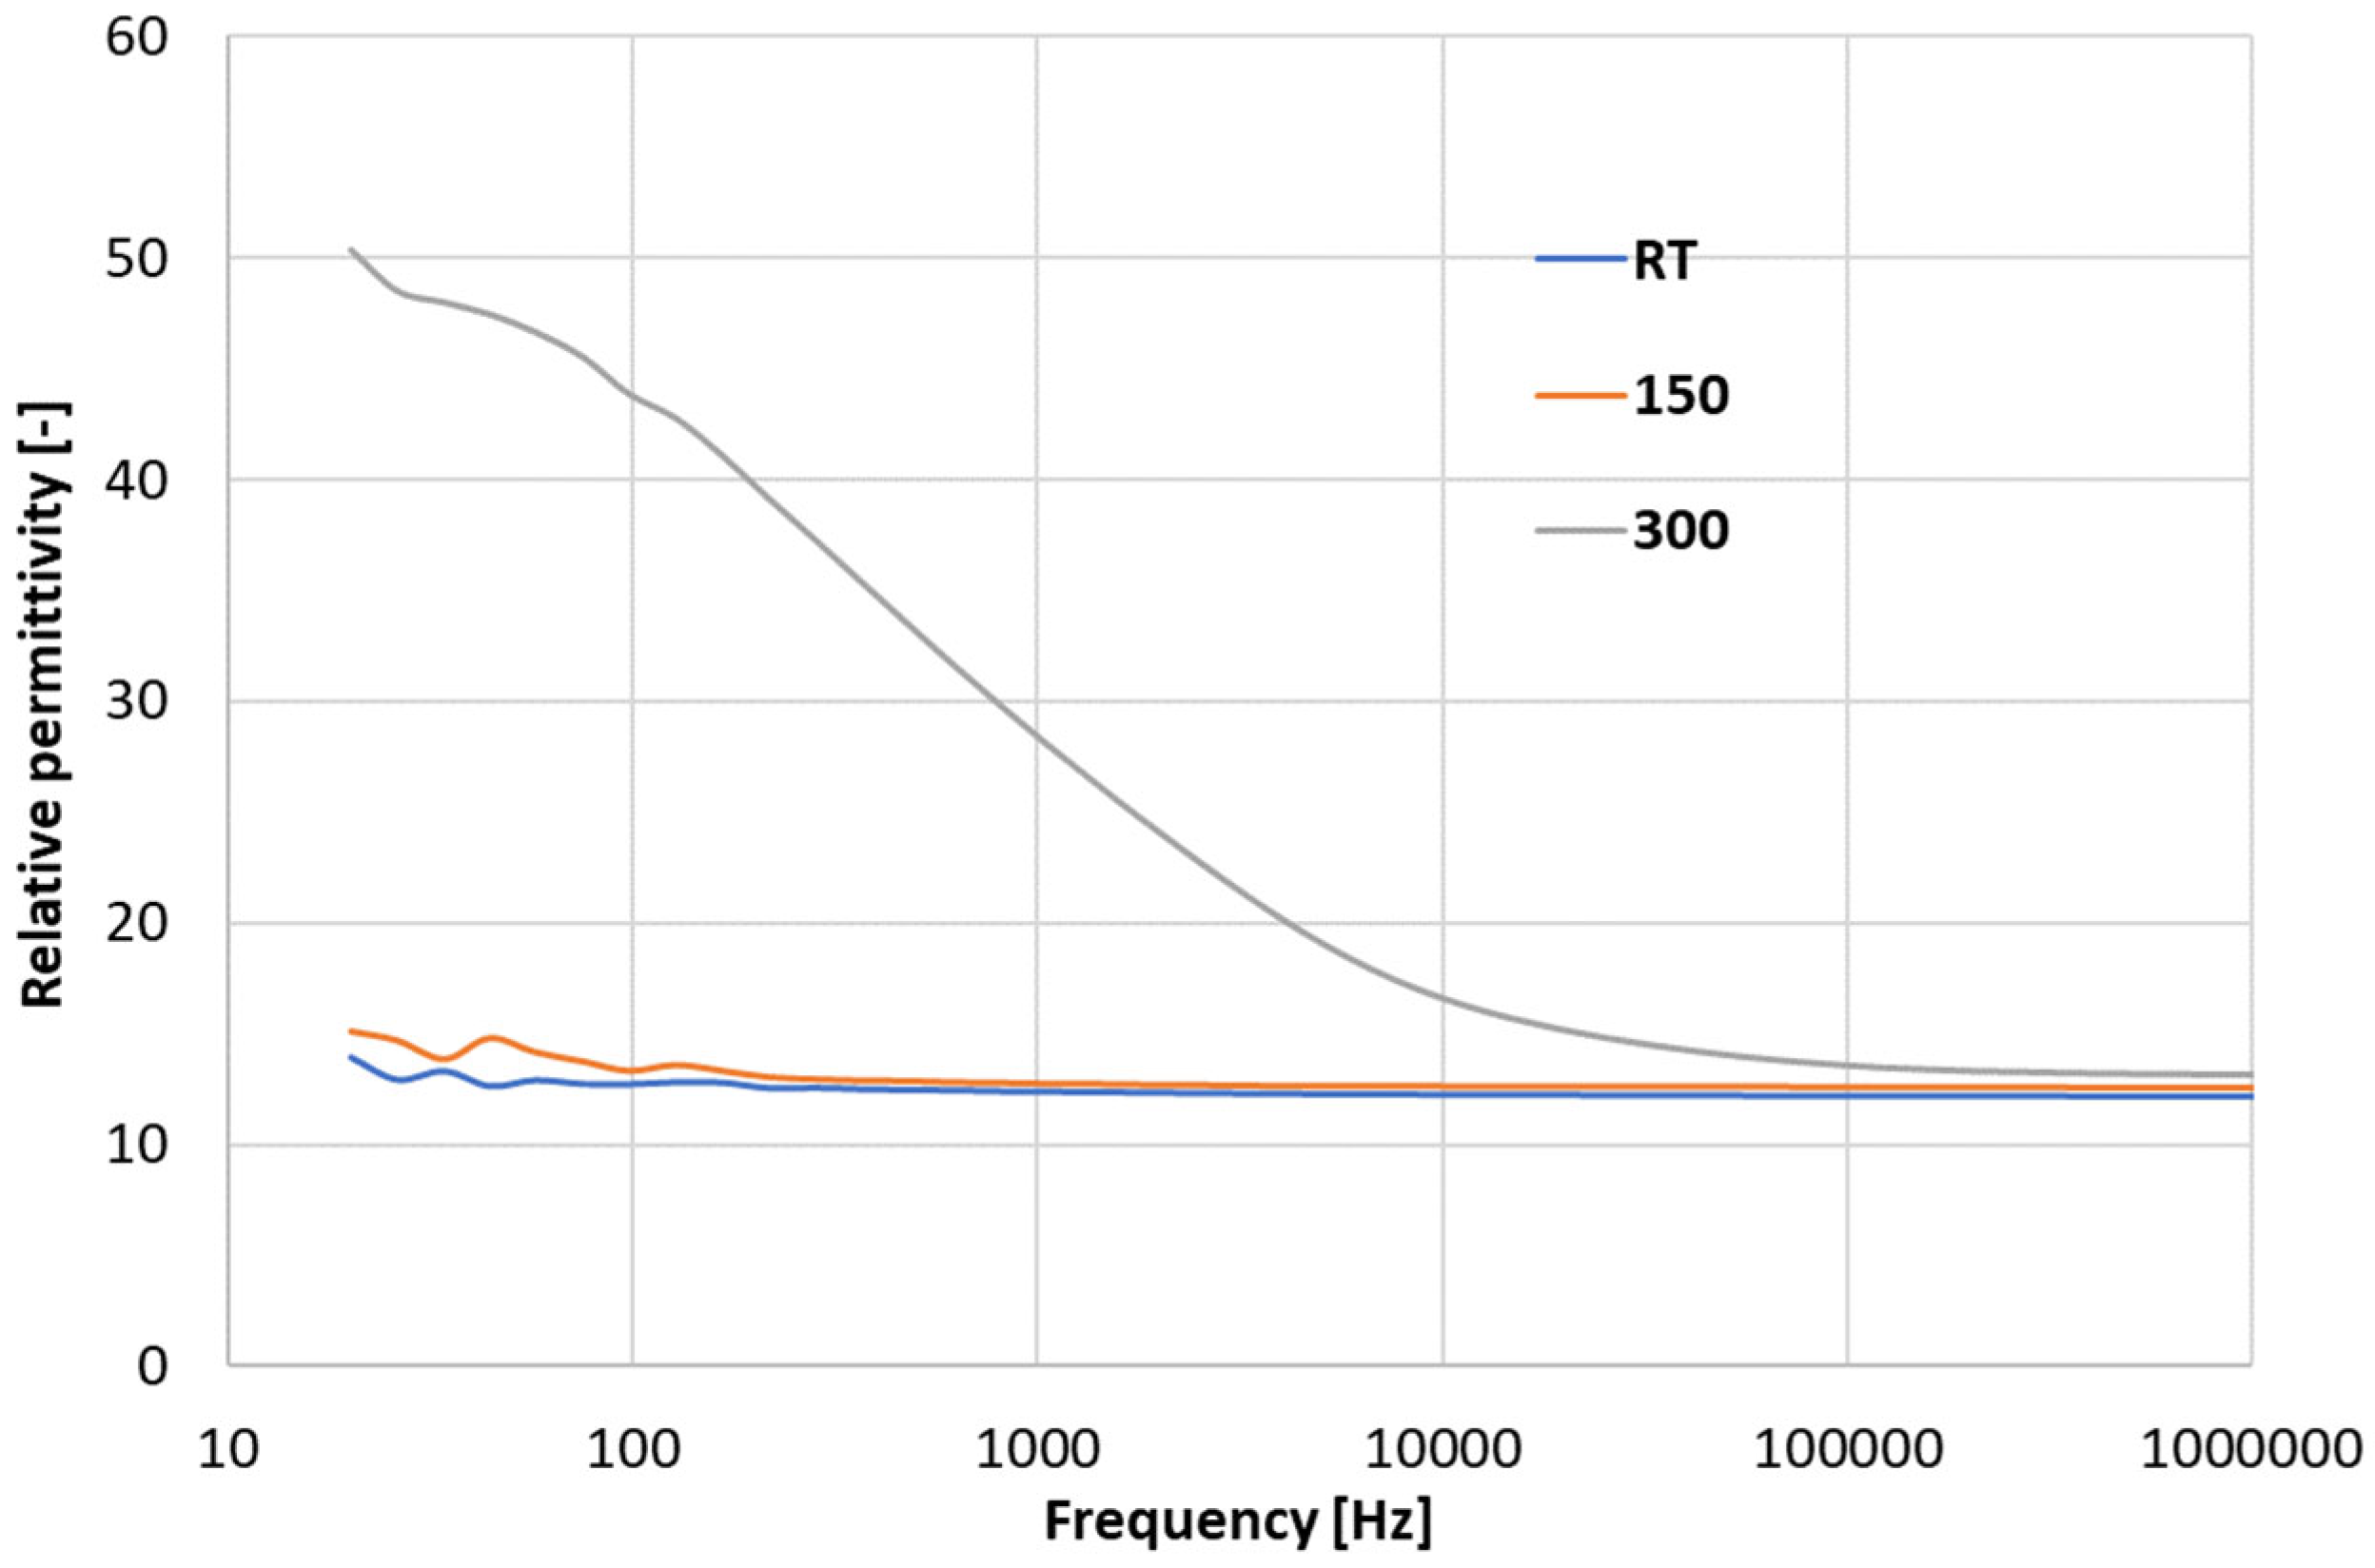
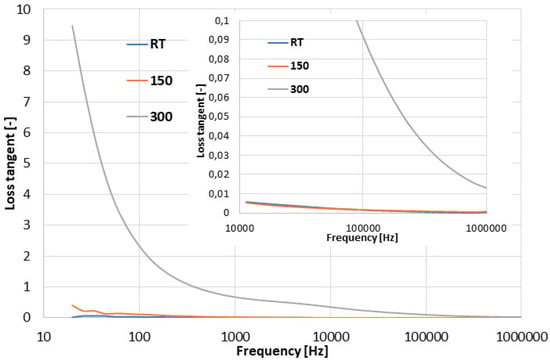
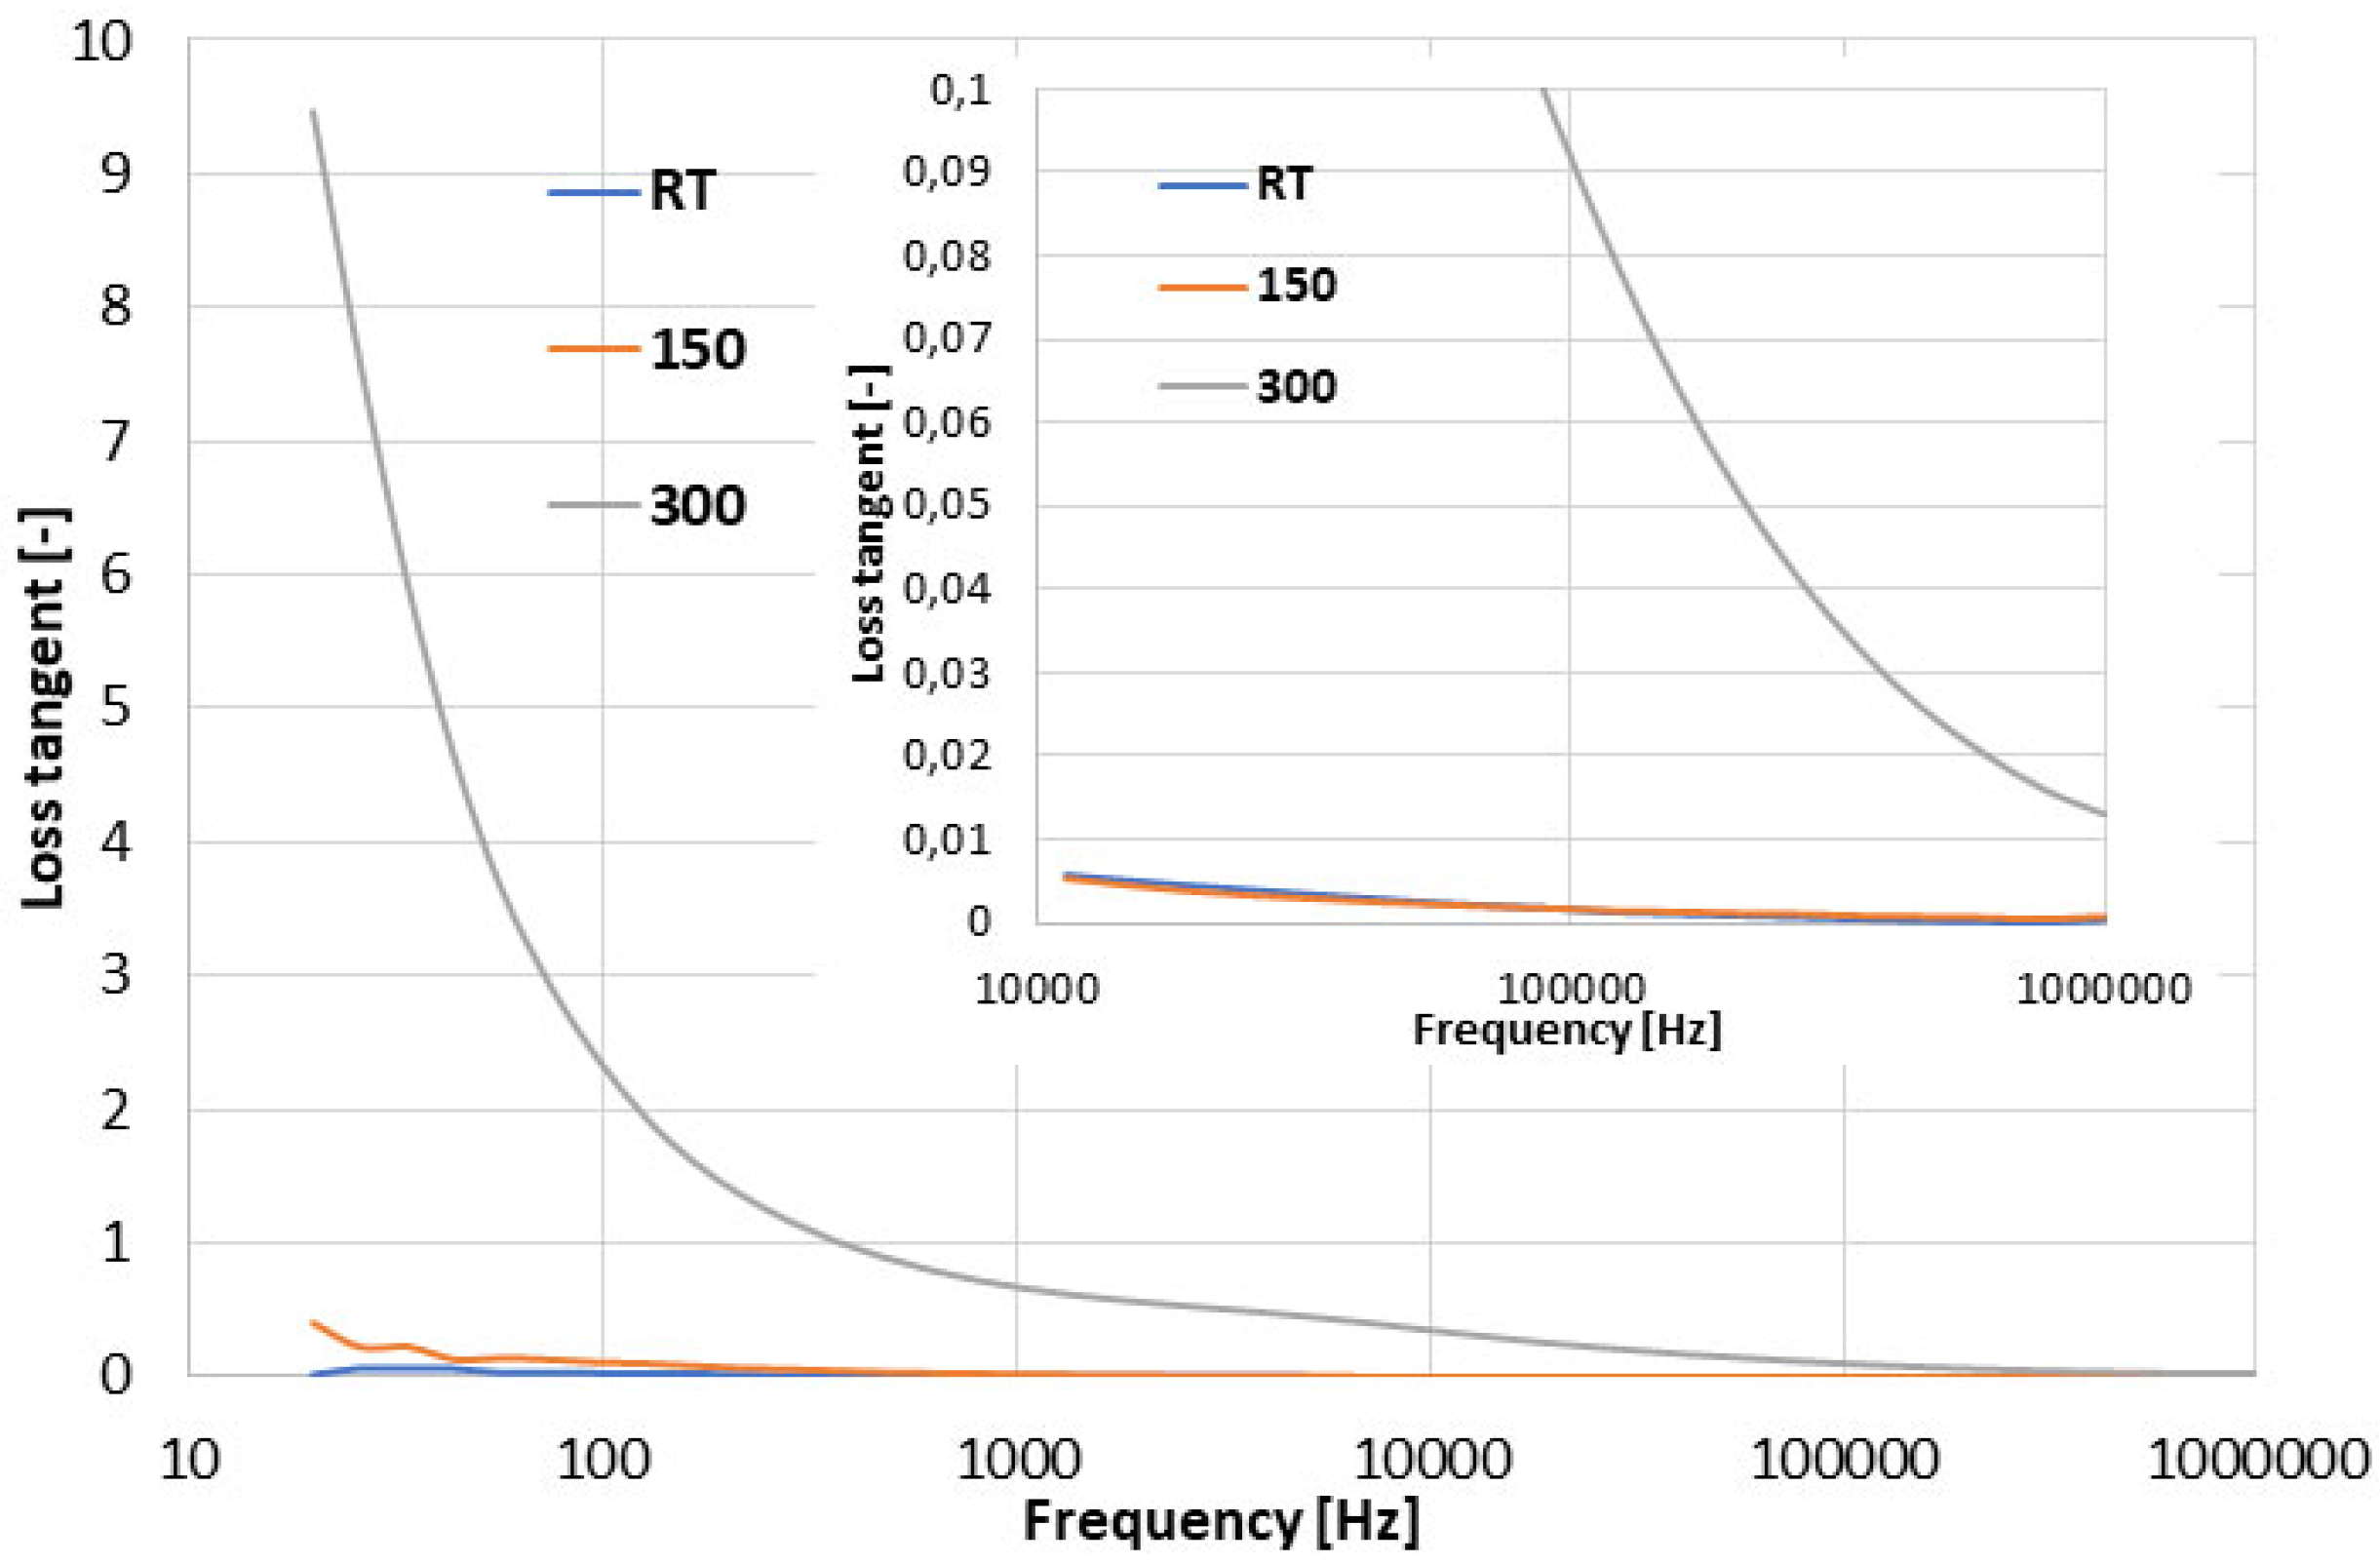
Will the dielectric behavior of the “high-sintered” sample, i.e., 750-8, be more promising? Its permittivity is displayed in Figure 3. The relative permittivity here was similarly stable at 150 °C as at room temperature. Only the heating to 300 °C caused the lossy behavior, with permittivity rising to values of about 50. The loss tangent confirmed this trend, as shown in Figure 4. At 150 °C, the behavior is still very similar to the room temperature. Only at 300 °C is the loss tangent already high—about 9. The room temperature values of this sample at 1 MHz, i.e., relative permittivity of 12.1 and loss tangent of 0.0005, are fully comparable with good-quality alumina or YAG dielectrics. Moreover, the dielectric stability of this sample fired for 8 h at 750 °C persists completely to at least 150 °C.
Figure 3.
Sample 750-8, relative permittivity versus changing frequency for three varying temperatures.
Figure 4.
Sample 750-8, loss tangent versus changing frequency for three varying temperatures.
The temperature coefficient of capacitance (TCC), listed in Table 1, was calculated between 30 °C and 150 °C. This measurement range is similar to the ranges recommended by the Electronic Industries Alliance (EIA) [10]. Based on TCC, EIA defines Class I dielectrics with the TCC tolerance ±30 ppm/K (i.e., 60 ppm/K). EIA also defines Class II with the TCC tolerance ±15% (i.e., 30% of the room temperature capacitance) [11]. The values are usually determined at a 1 MHz frequency. Our LiF samples exhibited TEC between the specified classes, much closer to Class I. When LiF crystals based on the physical nature of the material belonged to Class I, our samples failed to fit Class I exactly.
Because of the linear temperature characteristics of permittivity, the samples are “Class I–like”. Based on parameters calculated for the 1 MHz frequency and the dielectric labeling system of EIA, label Z8D/Class II could be considered (or L2K/Class I more specifically) as a relevant category for our LiF samples. Samples from the powder compressed before sintering to 800 MPa [2] had a TCC of −154 ppm/K. Our samples sintered with a thermal load adequate to 700-8 or higher had similar TCC, roughly −300 ppm/K. This indicates that the polarization phenomena, activated with temperature, were on the lattice level and not influenced by microstructural aspects such as porosity, grain size, shape, etc. The microstructural aspects should further change with sintering temperature, whereas the phenomena at the lattice level seem to be constant over roughly 730 °C in sintering. On the other hand, the DC resistance was strongly influenced by these microstructural and meso-structural aspects, and we see in Table 1 that maximum resistivity values (order of magnitude 1013 Ωm) were recorded for 750 °C and more.
The DC electric resistivity is summarized in Table 1. A dwell time of 2 h during the sintering brings lower resistivity values in all cases compared to a dwell time of 8 h. When the sintering temperature is over 750 °C, the resistivity is always in the order of 1013 Ωm. Such a material is a high-quality insulator.
3.2. Microstructure
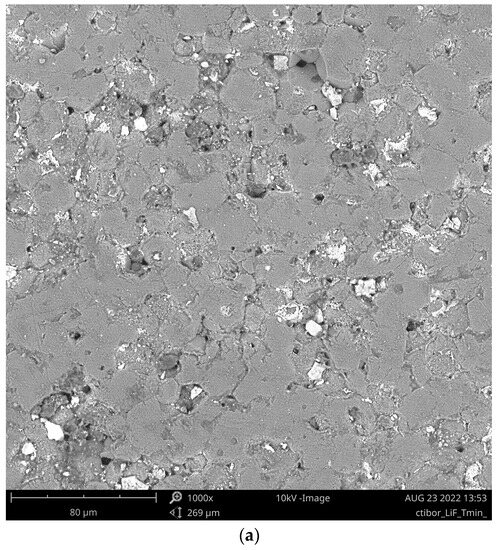
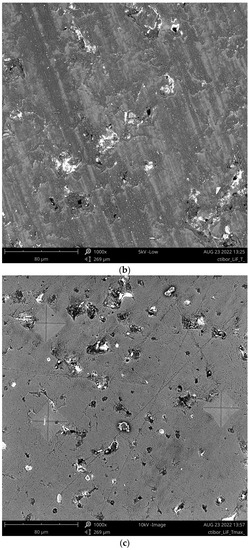
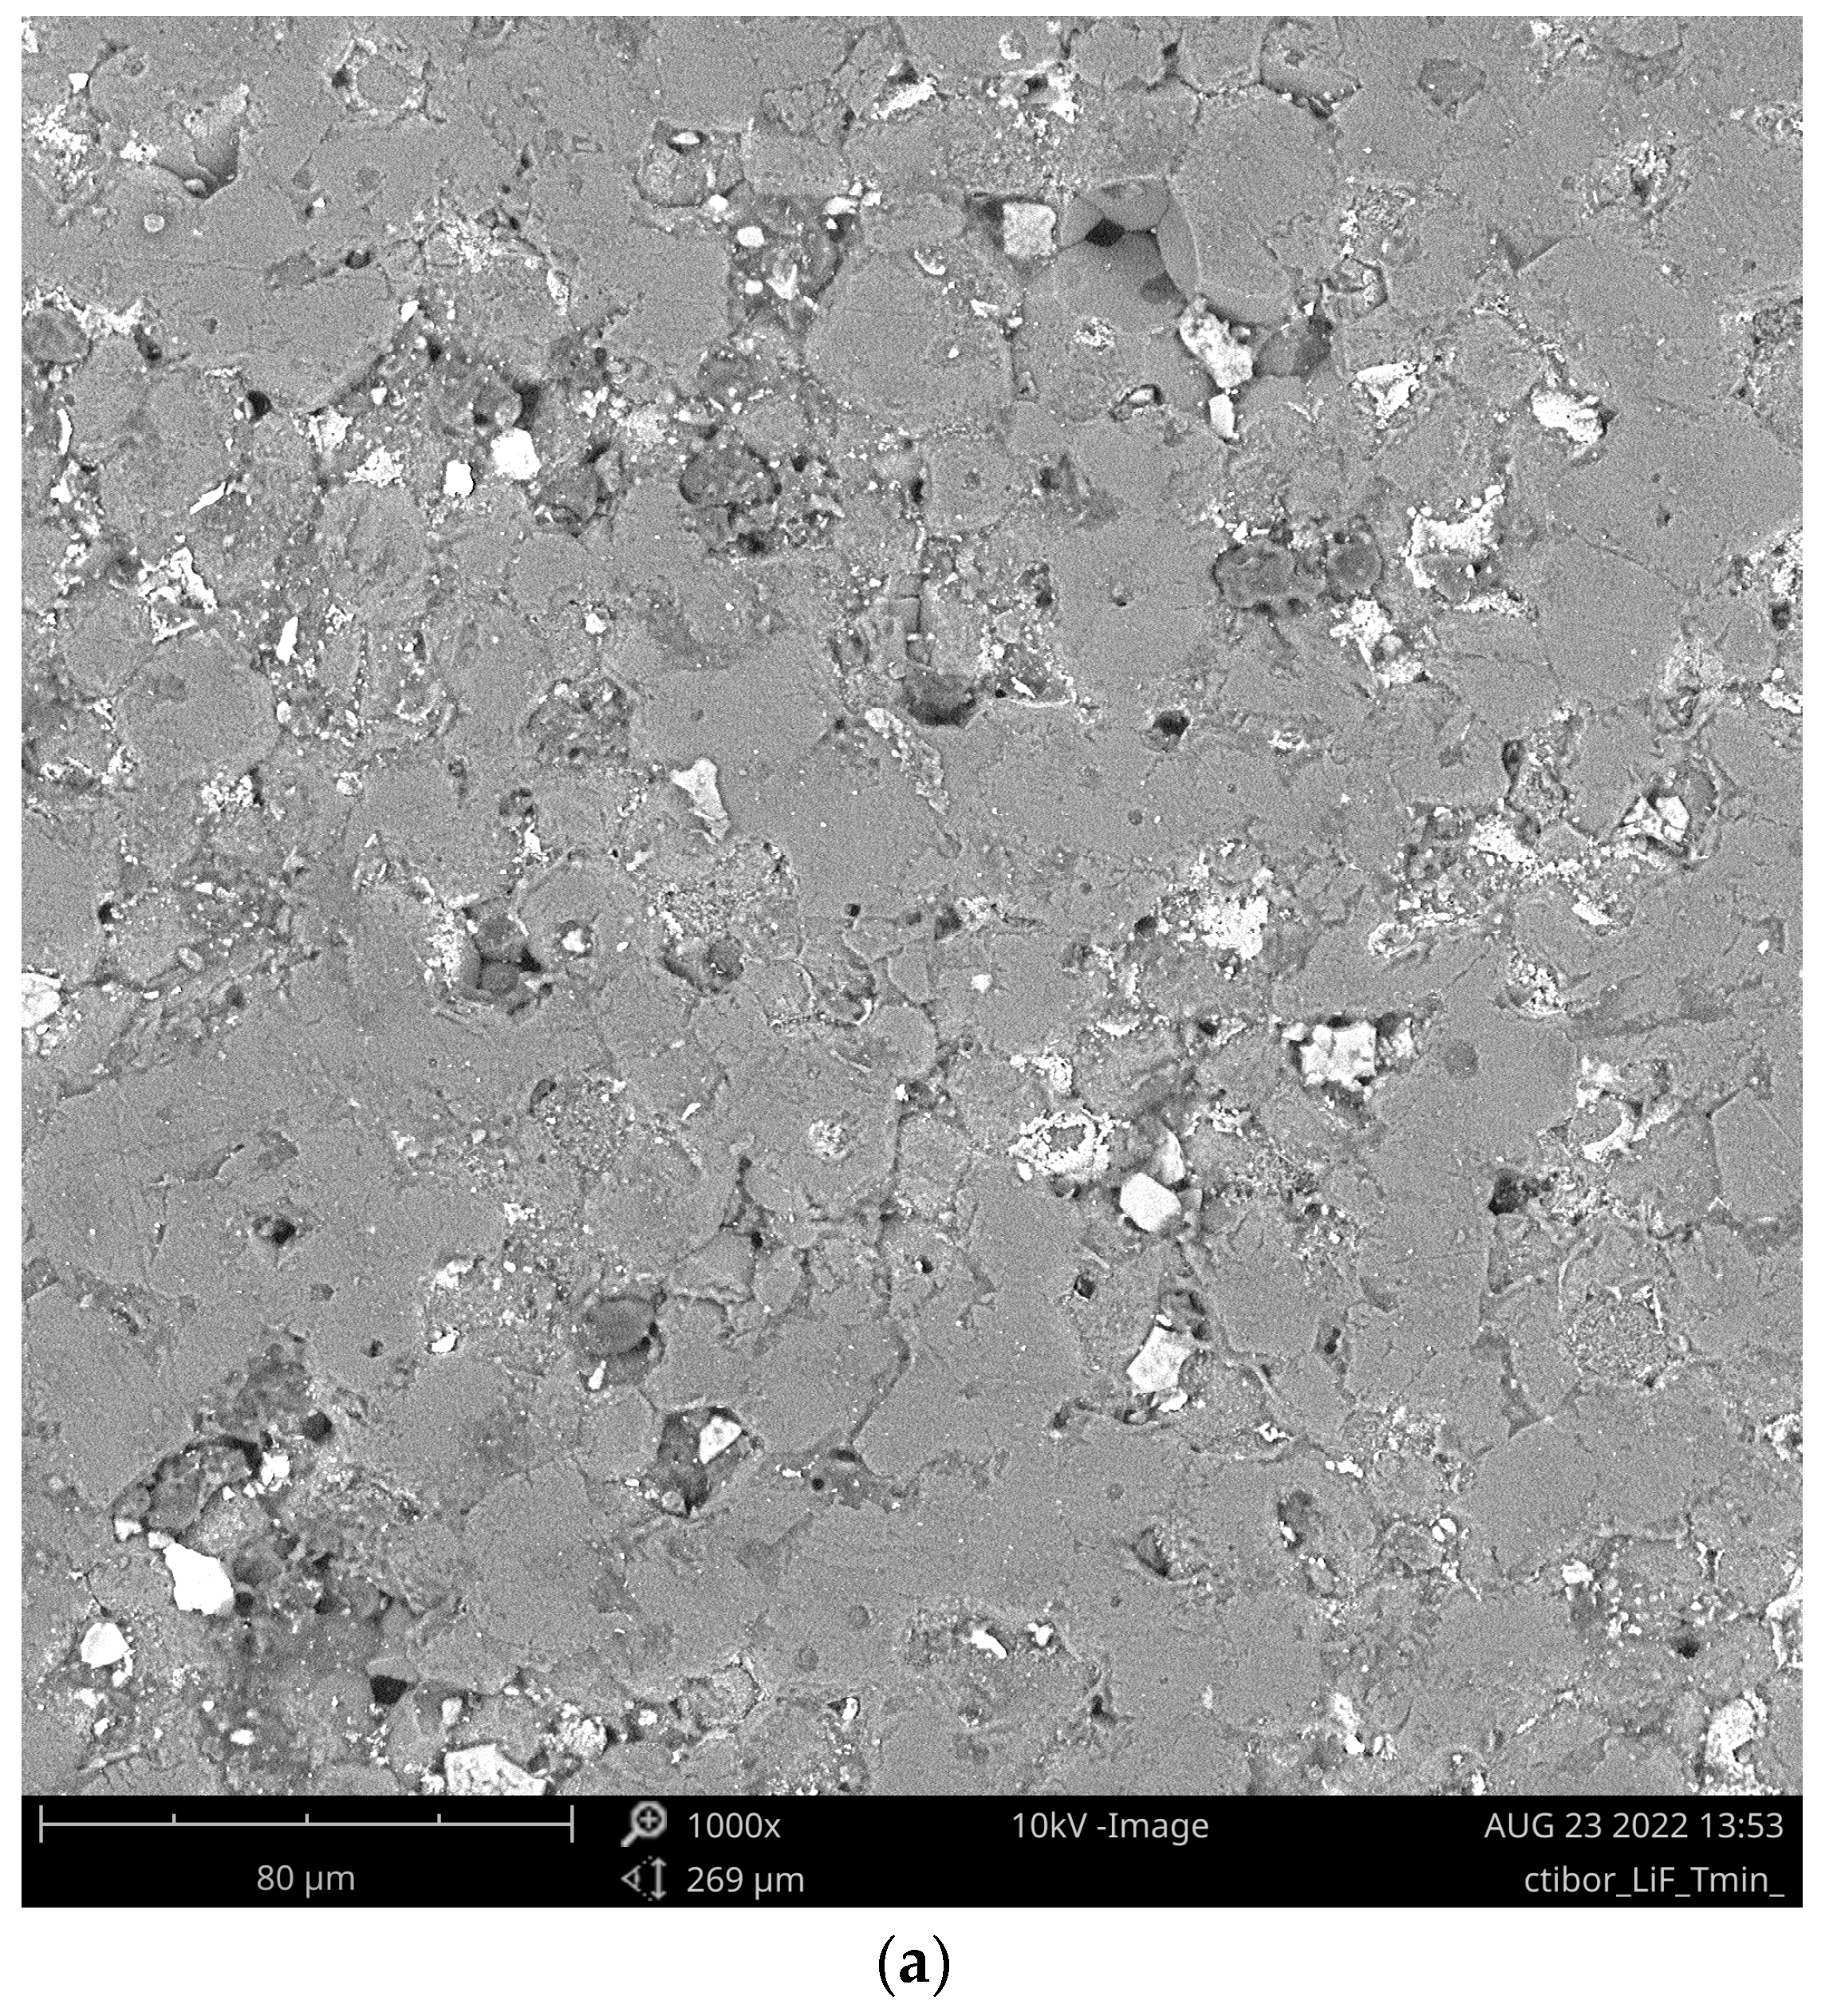
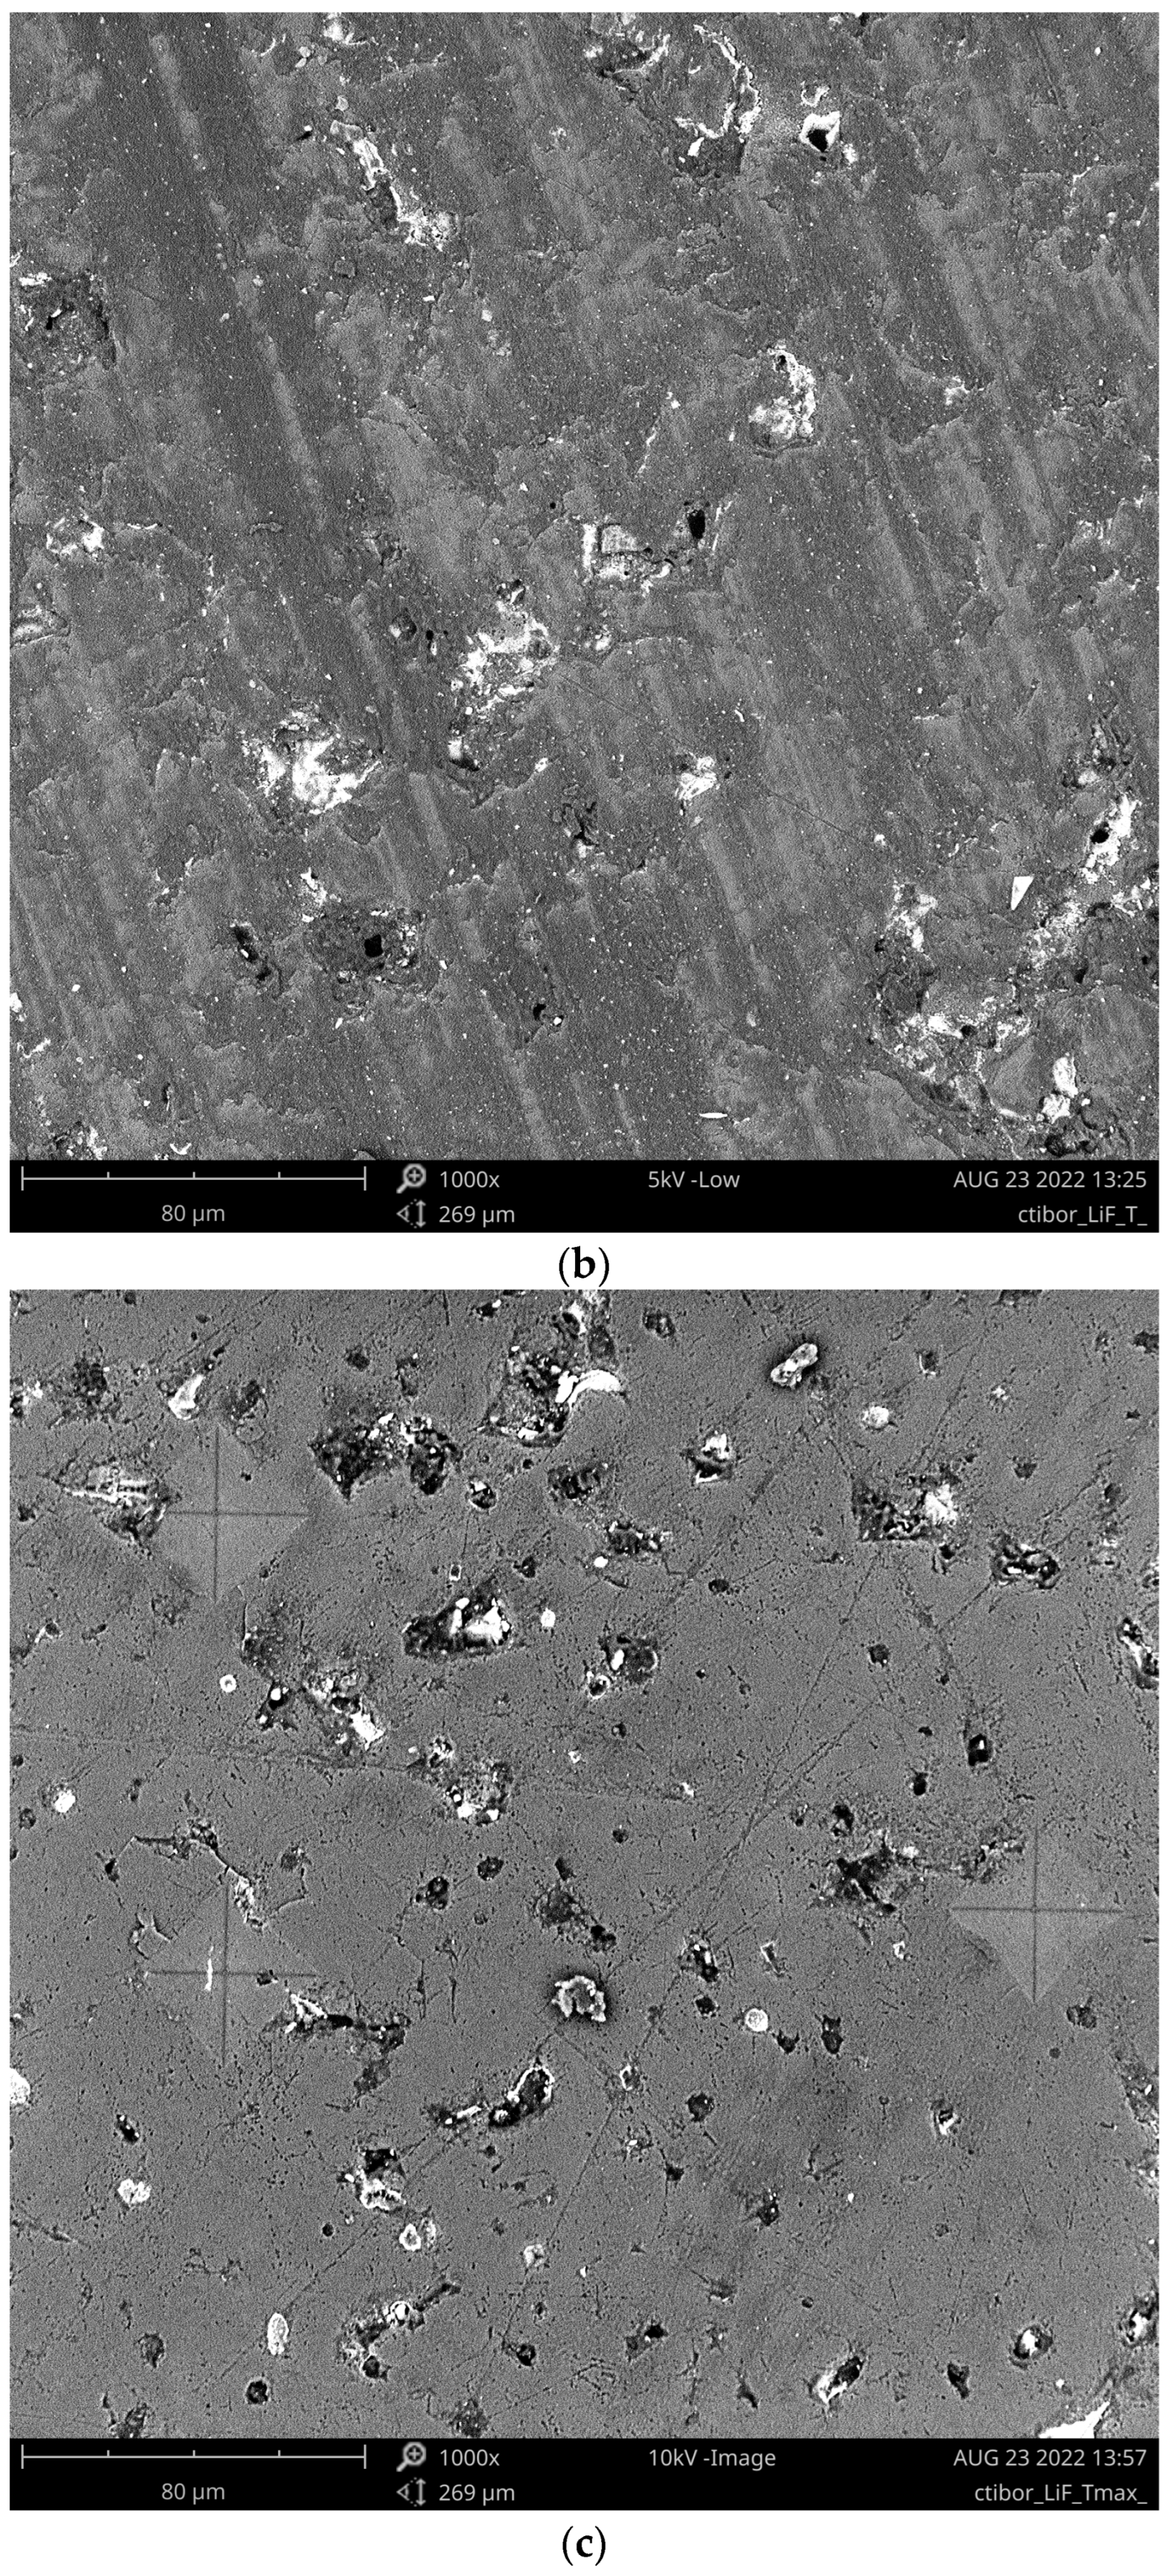
Partly separated grains with a size of about 20 µm are visible in Figure 5a for the sample 650-2. This sample was incompletely sintered, not well-cohesive mechanically, and was not subjected to dielectric and reflectance measurements. Porosity decreased with increasing temperature. The sample 750-8 is displayed with three indents from the measurement of microhardness. They are rather smooth with clearly visible diagonals and edges. Such character is typical for well-sintered ceramics. The SEM micrograph of 750-8 shown in Figure 5c displayed a grain size, however difficult to observe, of about 20–30 µm. As known from the research on Li-containing batteries [12], a narrow size distribution of grains could shorten the Li+ diffusion path during electrical measurements at elevated temperatures.
Figure 5.
Cross-sections of (a) sample 650-2; (b) sample 700-8; (c) sample 750-8 (with microindents); SEM-BSE.
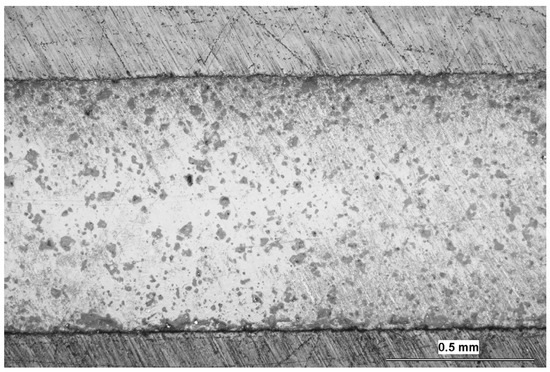
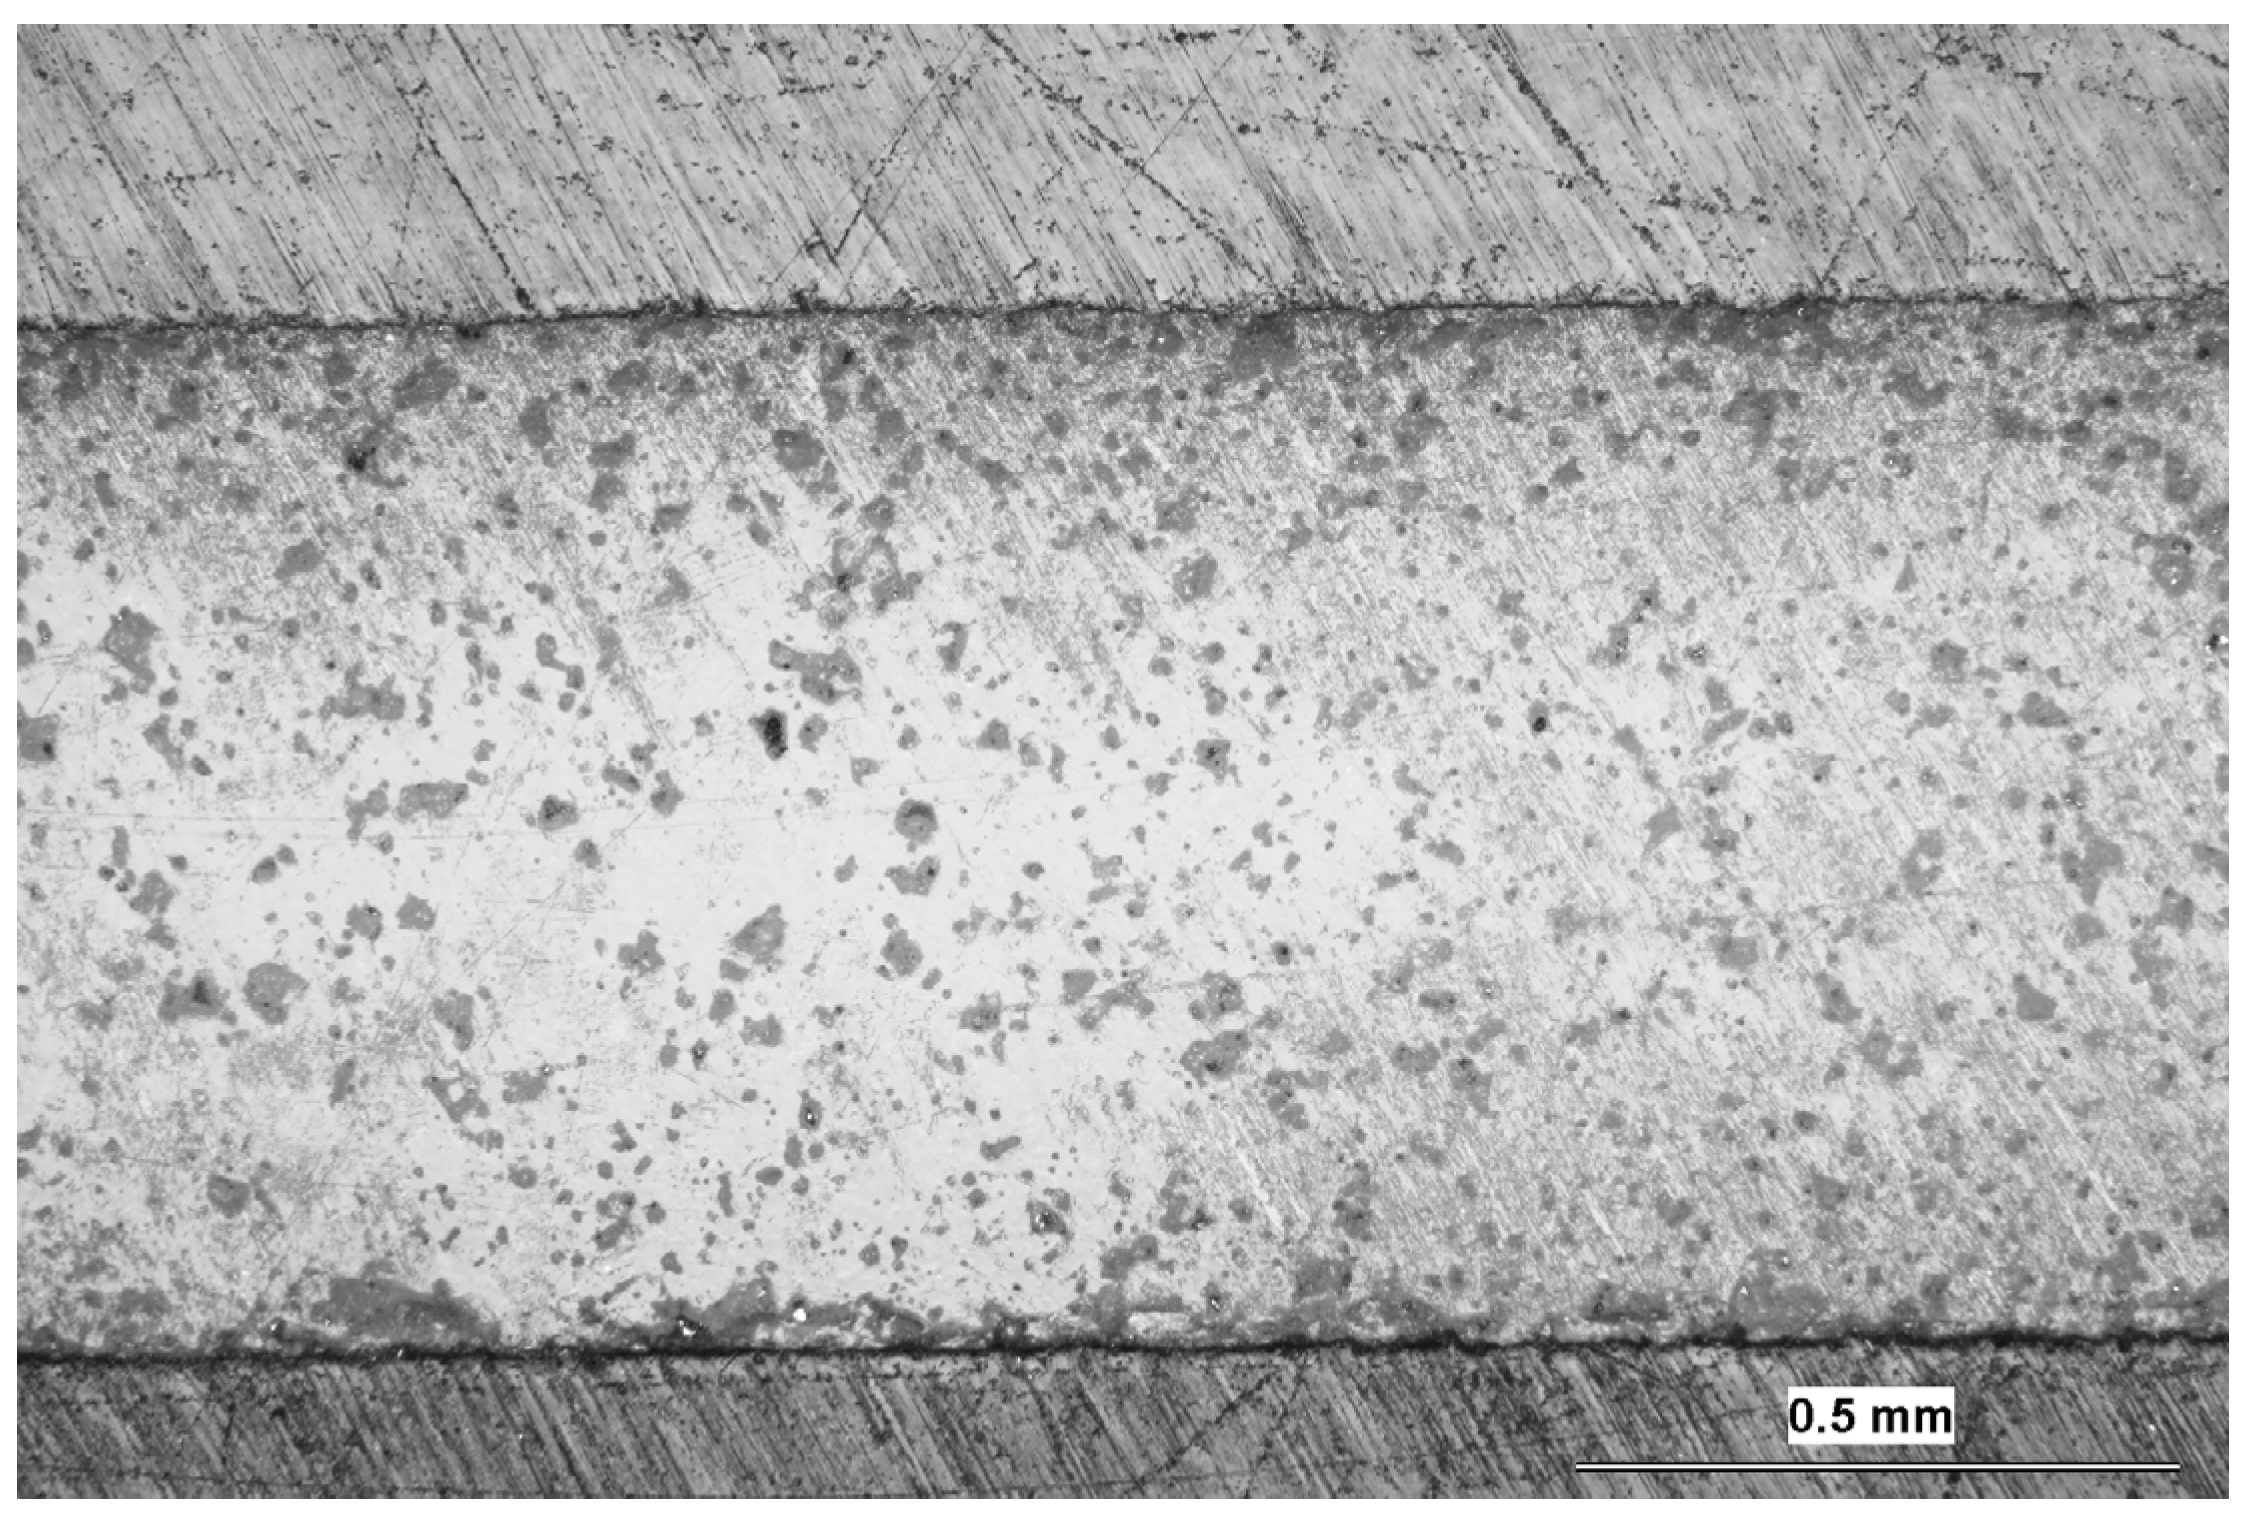
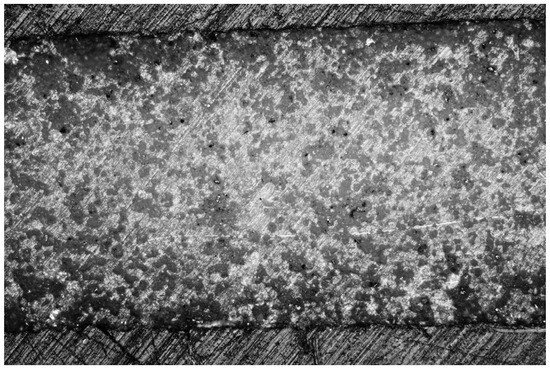
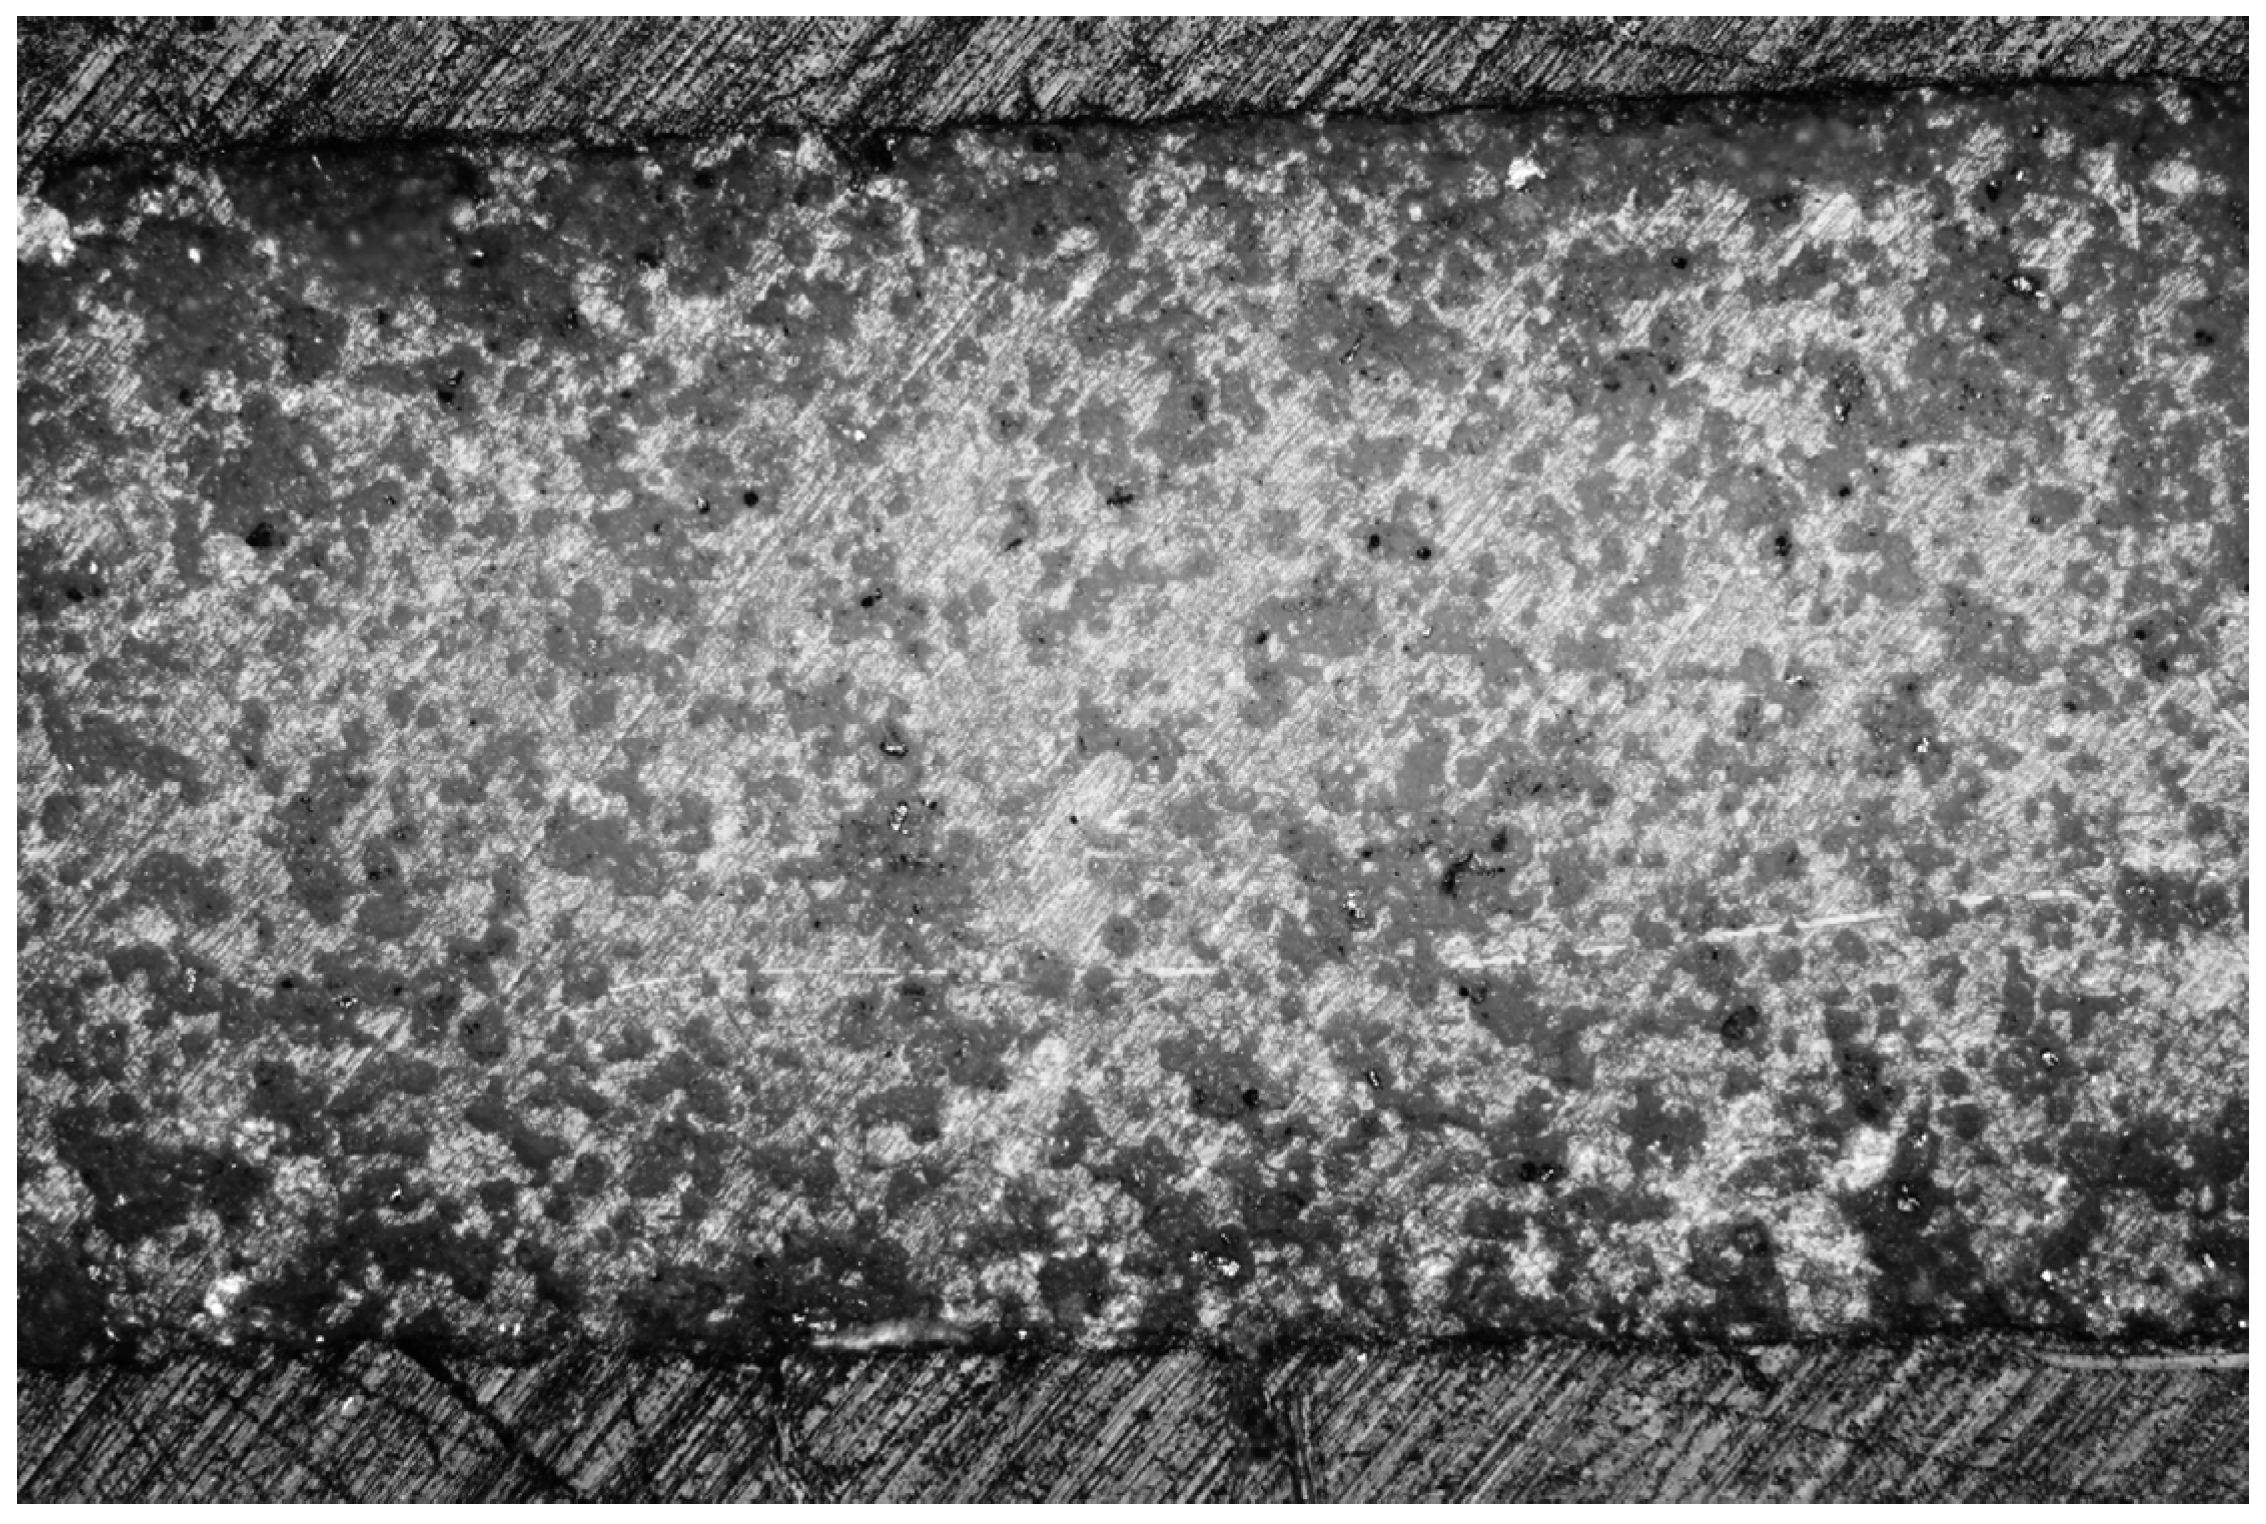
The optical micrograph in Figure 6 shows the cross-section of the sample 750-8 exhibiting a thickness of approximately 0.9 mm. The structure contains pores, but they are homogeneously dispersed and not interconnected. Figure 7 shows the cross-section of the sample 700-2, which is thicker, about 1.1 mm. Its porosity is more pronounced—larger pores, partly interconnected, and predominantly concentrated near both sample surfaces. Such a microstructure is predestined to have worse dielectric behavior.
Figure 6.
Sample 750-8, cross-section; OM.
Figure 7.
Sample 700-2, cross-section; OM; scale is the same as for Figure 6.
We applied a mechanical pressure of 300 MPa before sintering. The even higher value of 375 MPa was, however, mentioned in the literature as a significant threshold value concerning densification and microstructure evolution [5]. The pressure reached in each pore would be a function of the increase in density of the compact after the pore became isolated from the surrounding atmosphere. Densification from 0.38 of the theoretical density (TD) to 0.90 TD could increase the pressure of the gases trapped in the pores that became isolated first by as much as 80%, i.e., to a pressure differential as large as 0.08 MPa [13].
The water-immersion-based density of the “high-sintered” sample 750-8 was 2.423 g/cm3, i.e., 94% of the theoretical density. The LiF ceramics are weak. The microhardness of the sample 700-2 was 1.24 ± 0.33 GPa; for 750-8, it was 1.63 ± 0.18 GPa. The better the sintering, the higher the hardness and the lower its standard deviation because of the more homogeneous microstructure and the better-unified properties over the entire bulk.
3.3. Phase Composition
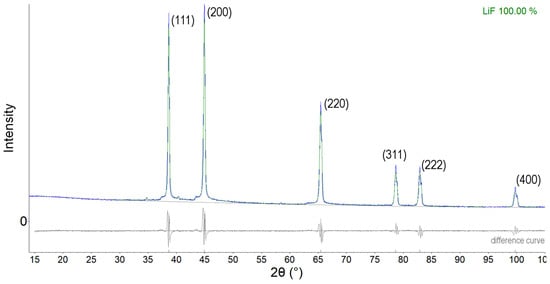
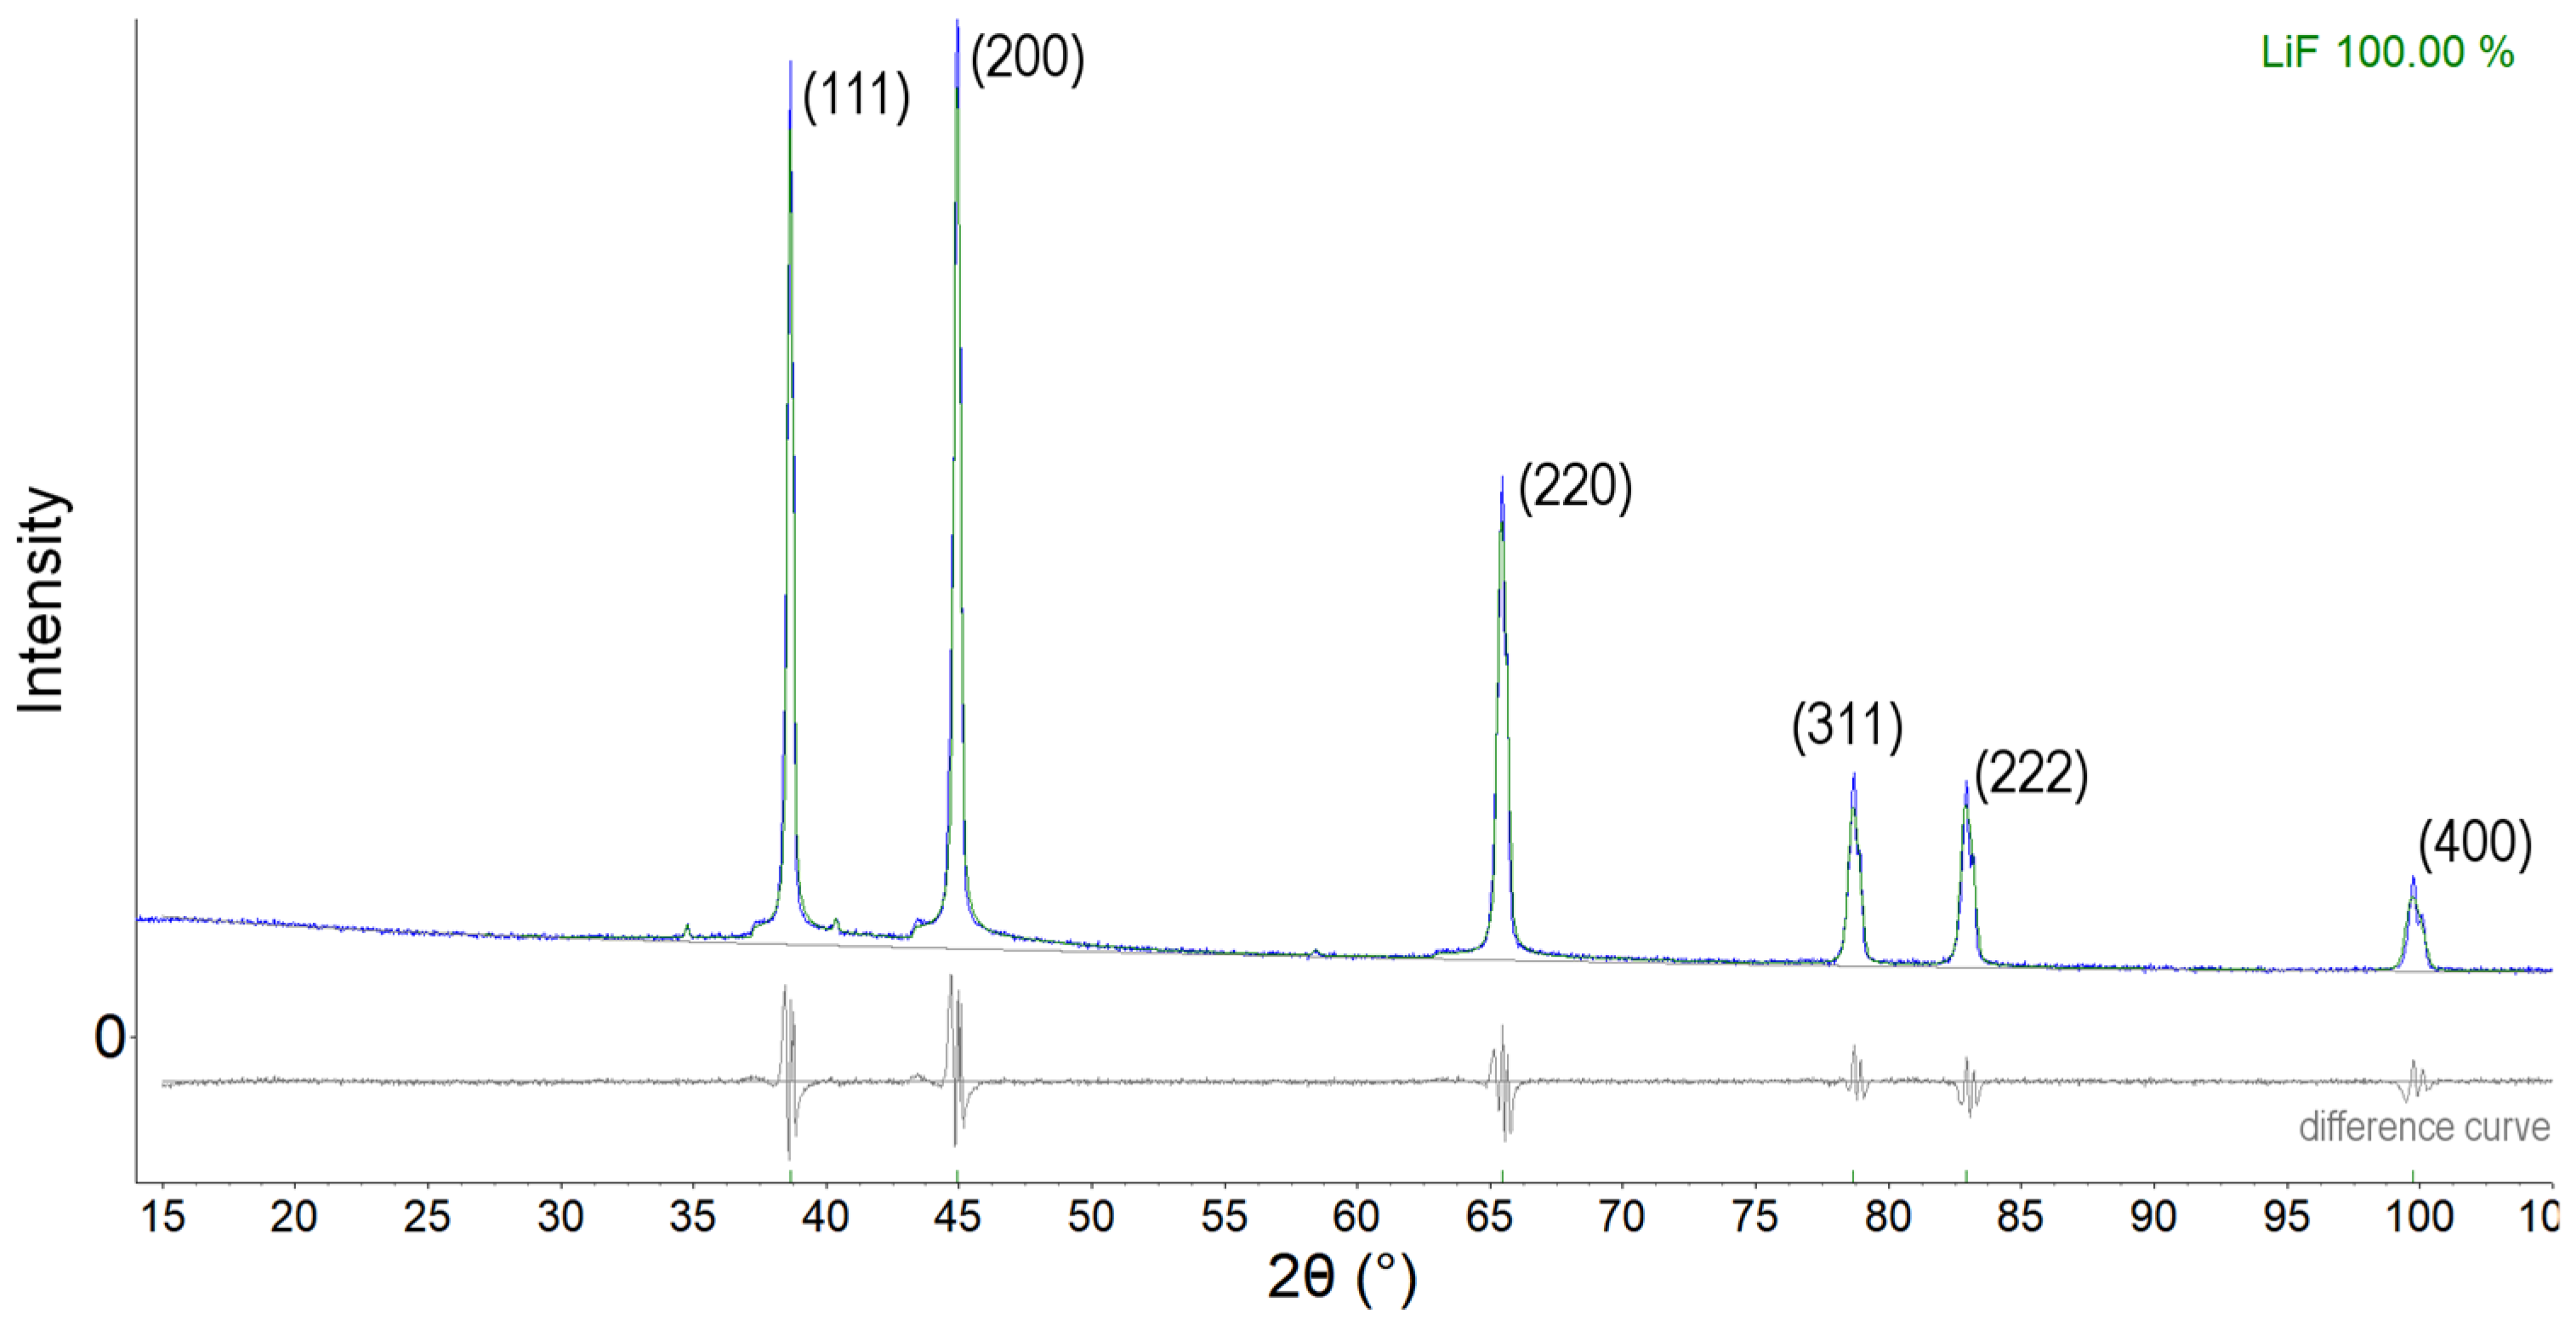
X-ray diffraction of the starting powder showed a purely LiF crystalline phase (PDF card #78–1217) (JCPDS #45–1460). The sample sintered at 675 °C strictly contained the LiF phase, as shown in Figure 8. The same holds for the samples sintered at higher temperatures.
Figure 8.
XRD pattern of LiF sintered at 675 °C.
3.4. Optical and Electronic Band Gaps
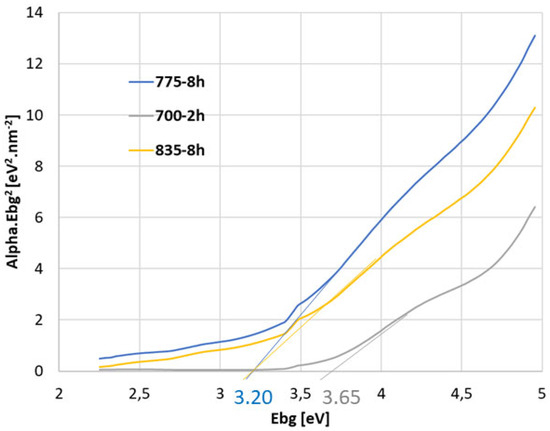
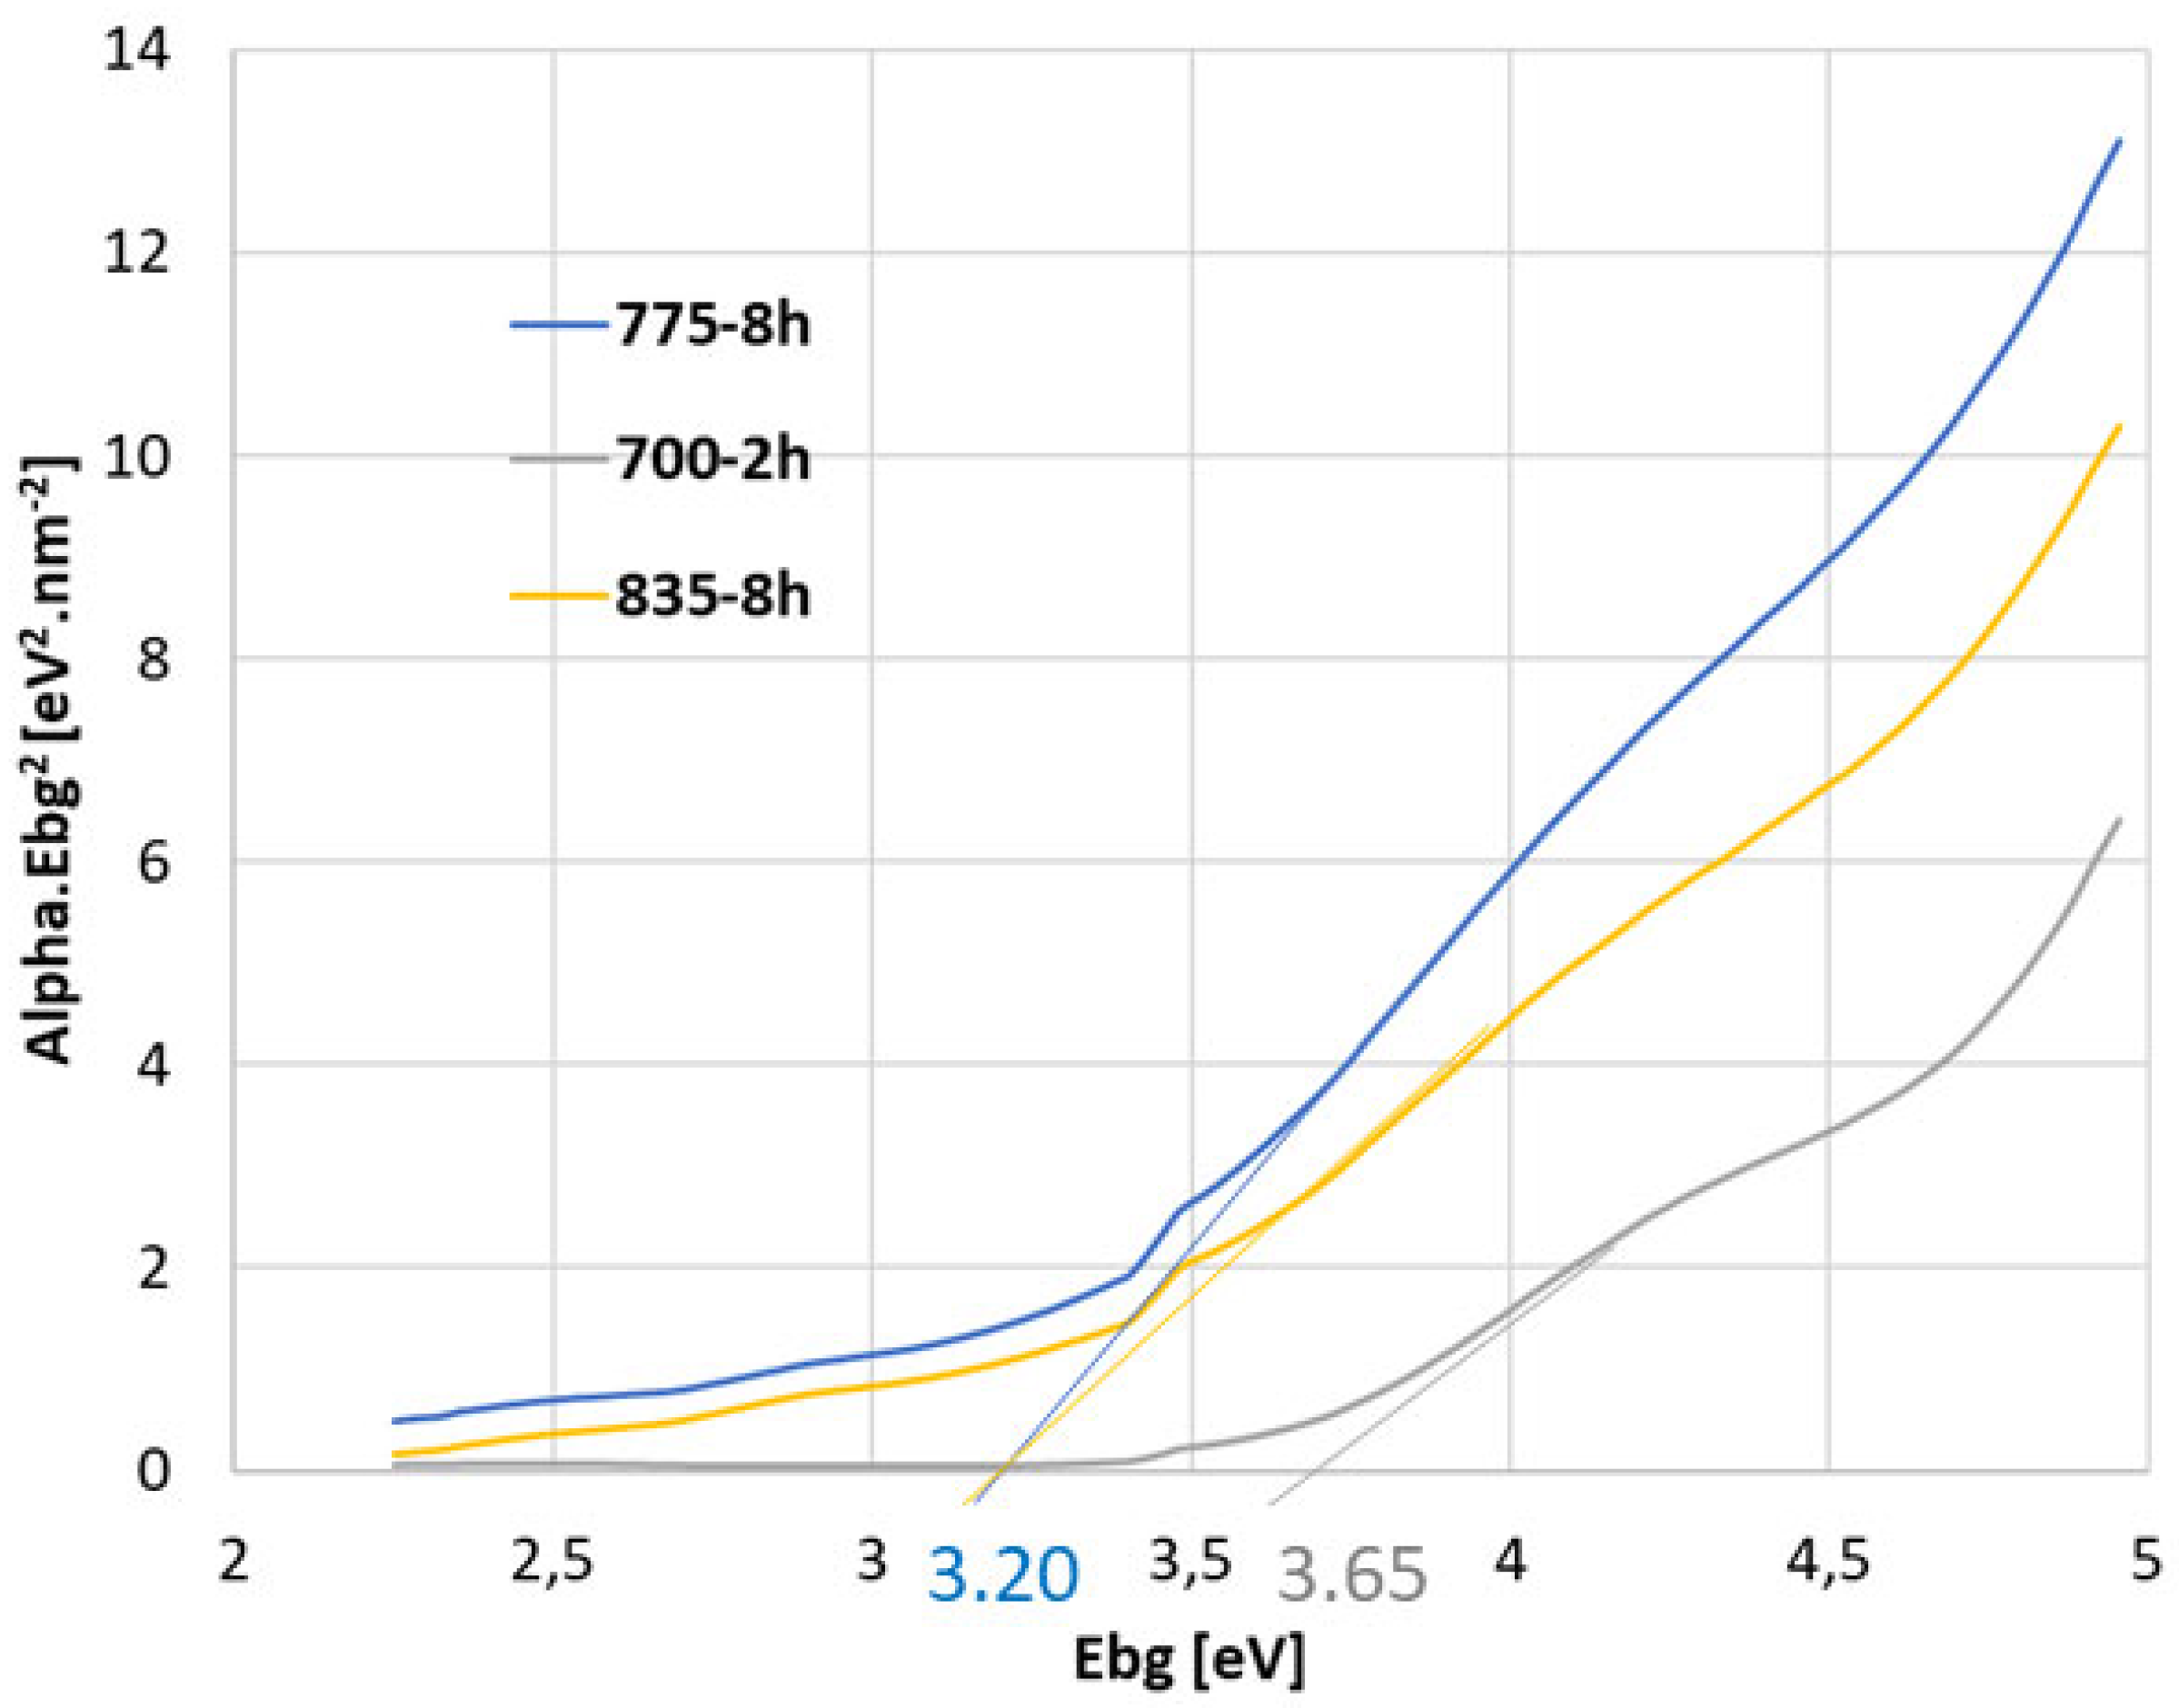
Based on the results shown in Figure 9, the samples sintered at 775 °C and 835 °C have the same band gap energy, Ebg, of 3.20 eV. The sample sintered at only 700 °C has a higher band gap value—3.65 eV. The decrease in the density of the localized electron energy states in the Ebg caused the energy gap to seem larger [14]. This decrease corresponds to the not-so-well sintered character of the sample 700-2.
Figure 9.
Band gap estimation for three LiF samples.
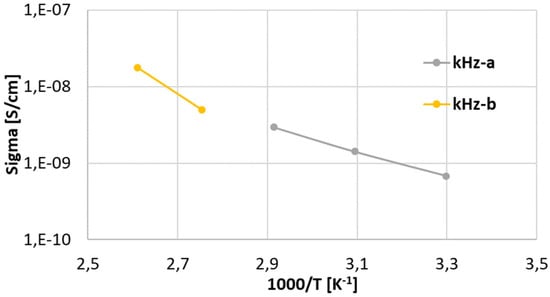
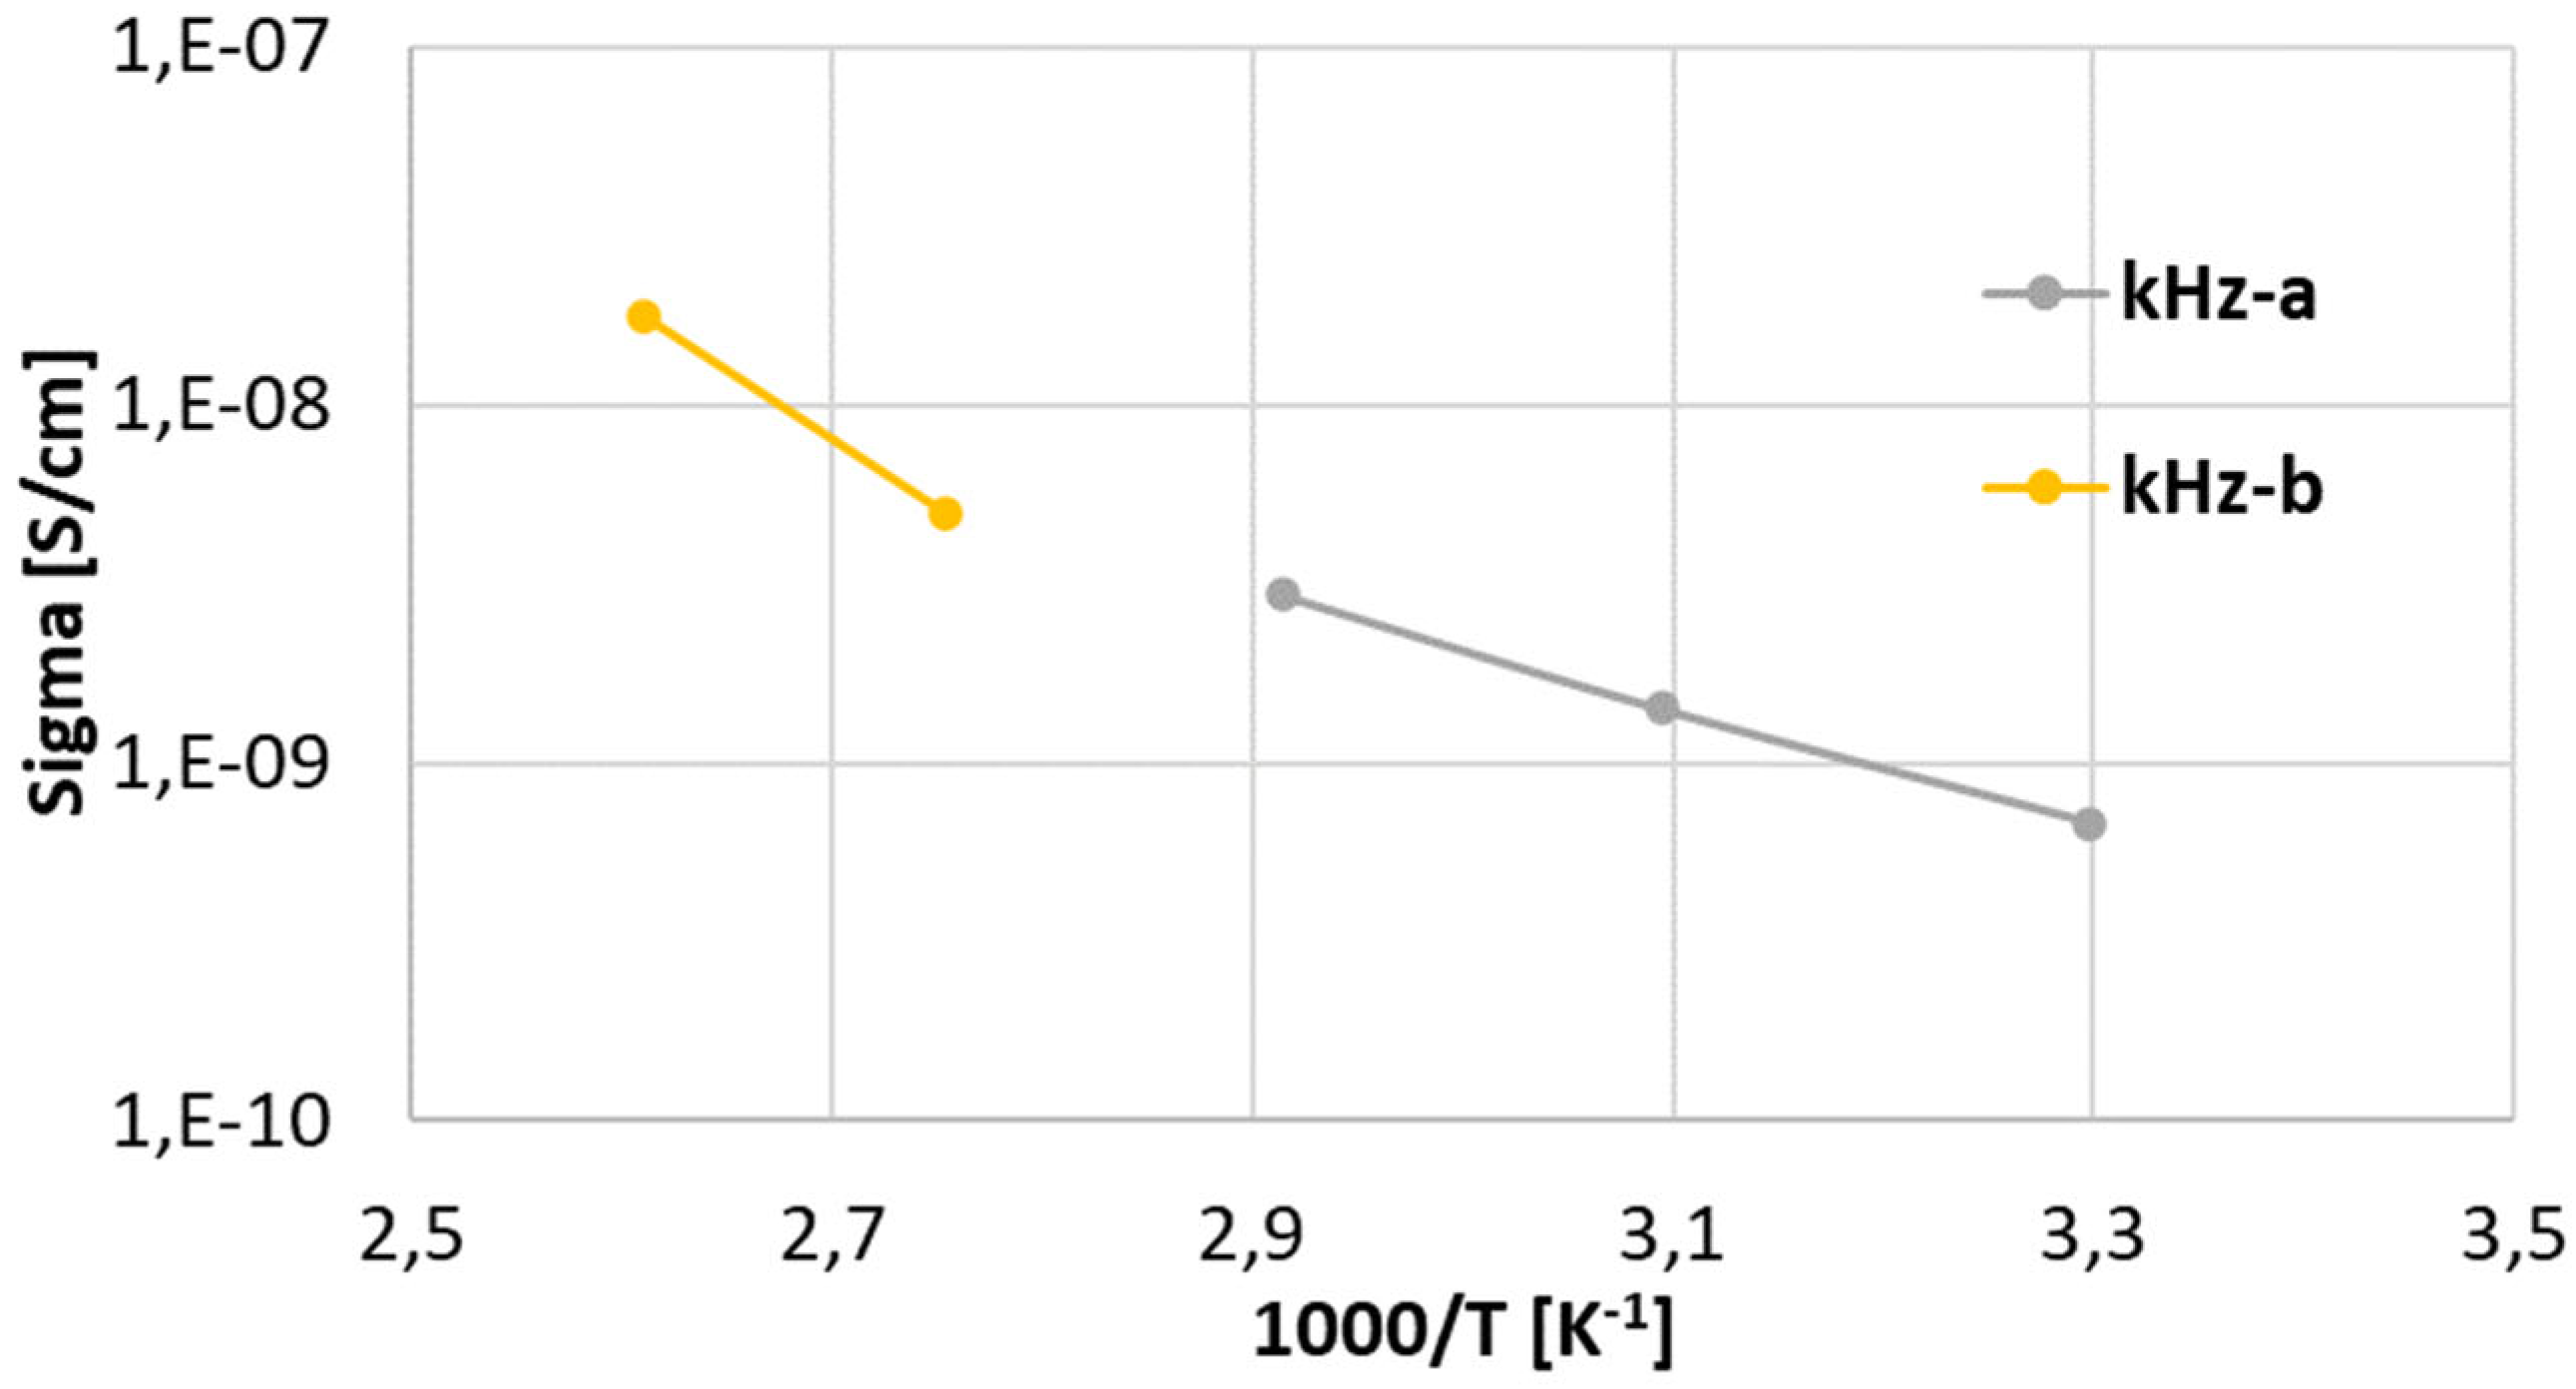
The electric AC conductivities (recorded at 1 kHz frequency) of sample 700-2 were slightly increased with the increase in the measurement temperature from 30 °C to 70 °C (i.e., 303 K to 343 K; Figure 10, region a), but when the temperature increased to above 90 °C (363 K; Figure 10, region b), a more enhanced increase in the conductivities was obtained. This behavior is explained by the increasing number of carriers that can overcome the Fermi level and participate in electrical conduction [15]. In the high temperature range, labeled b, the conduction was thermally activated from the deep levels to the conduction band, while it was activated from the shallow levels in the low temperature region, labeled a.
Figure 10.
Arrhenius plot of AC conductivity as a function of the absolute temperature, sample 700-2.
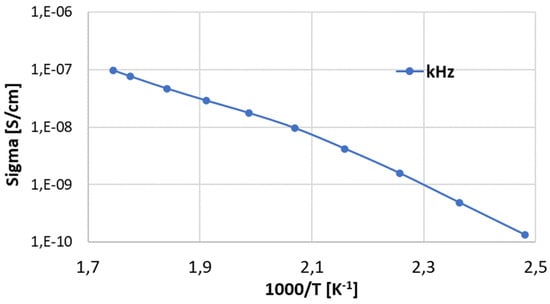
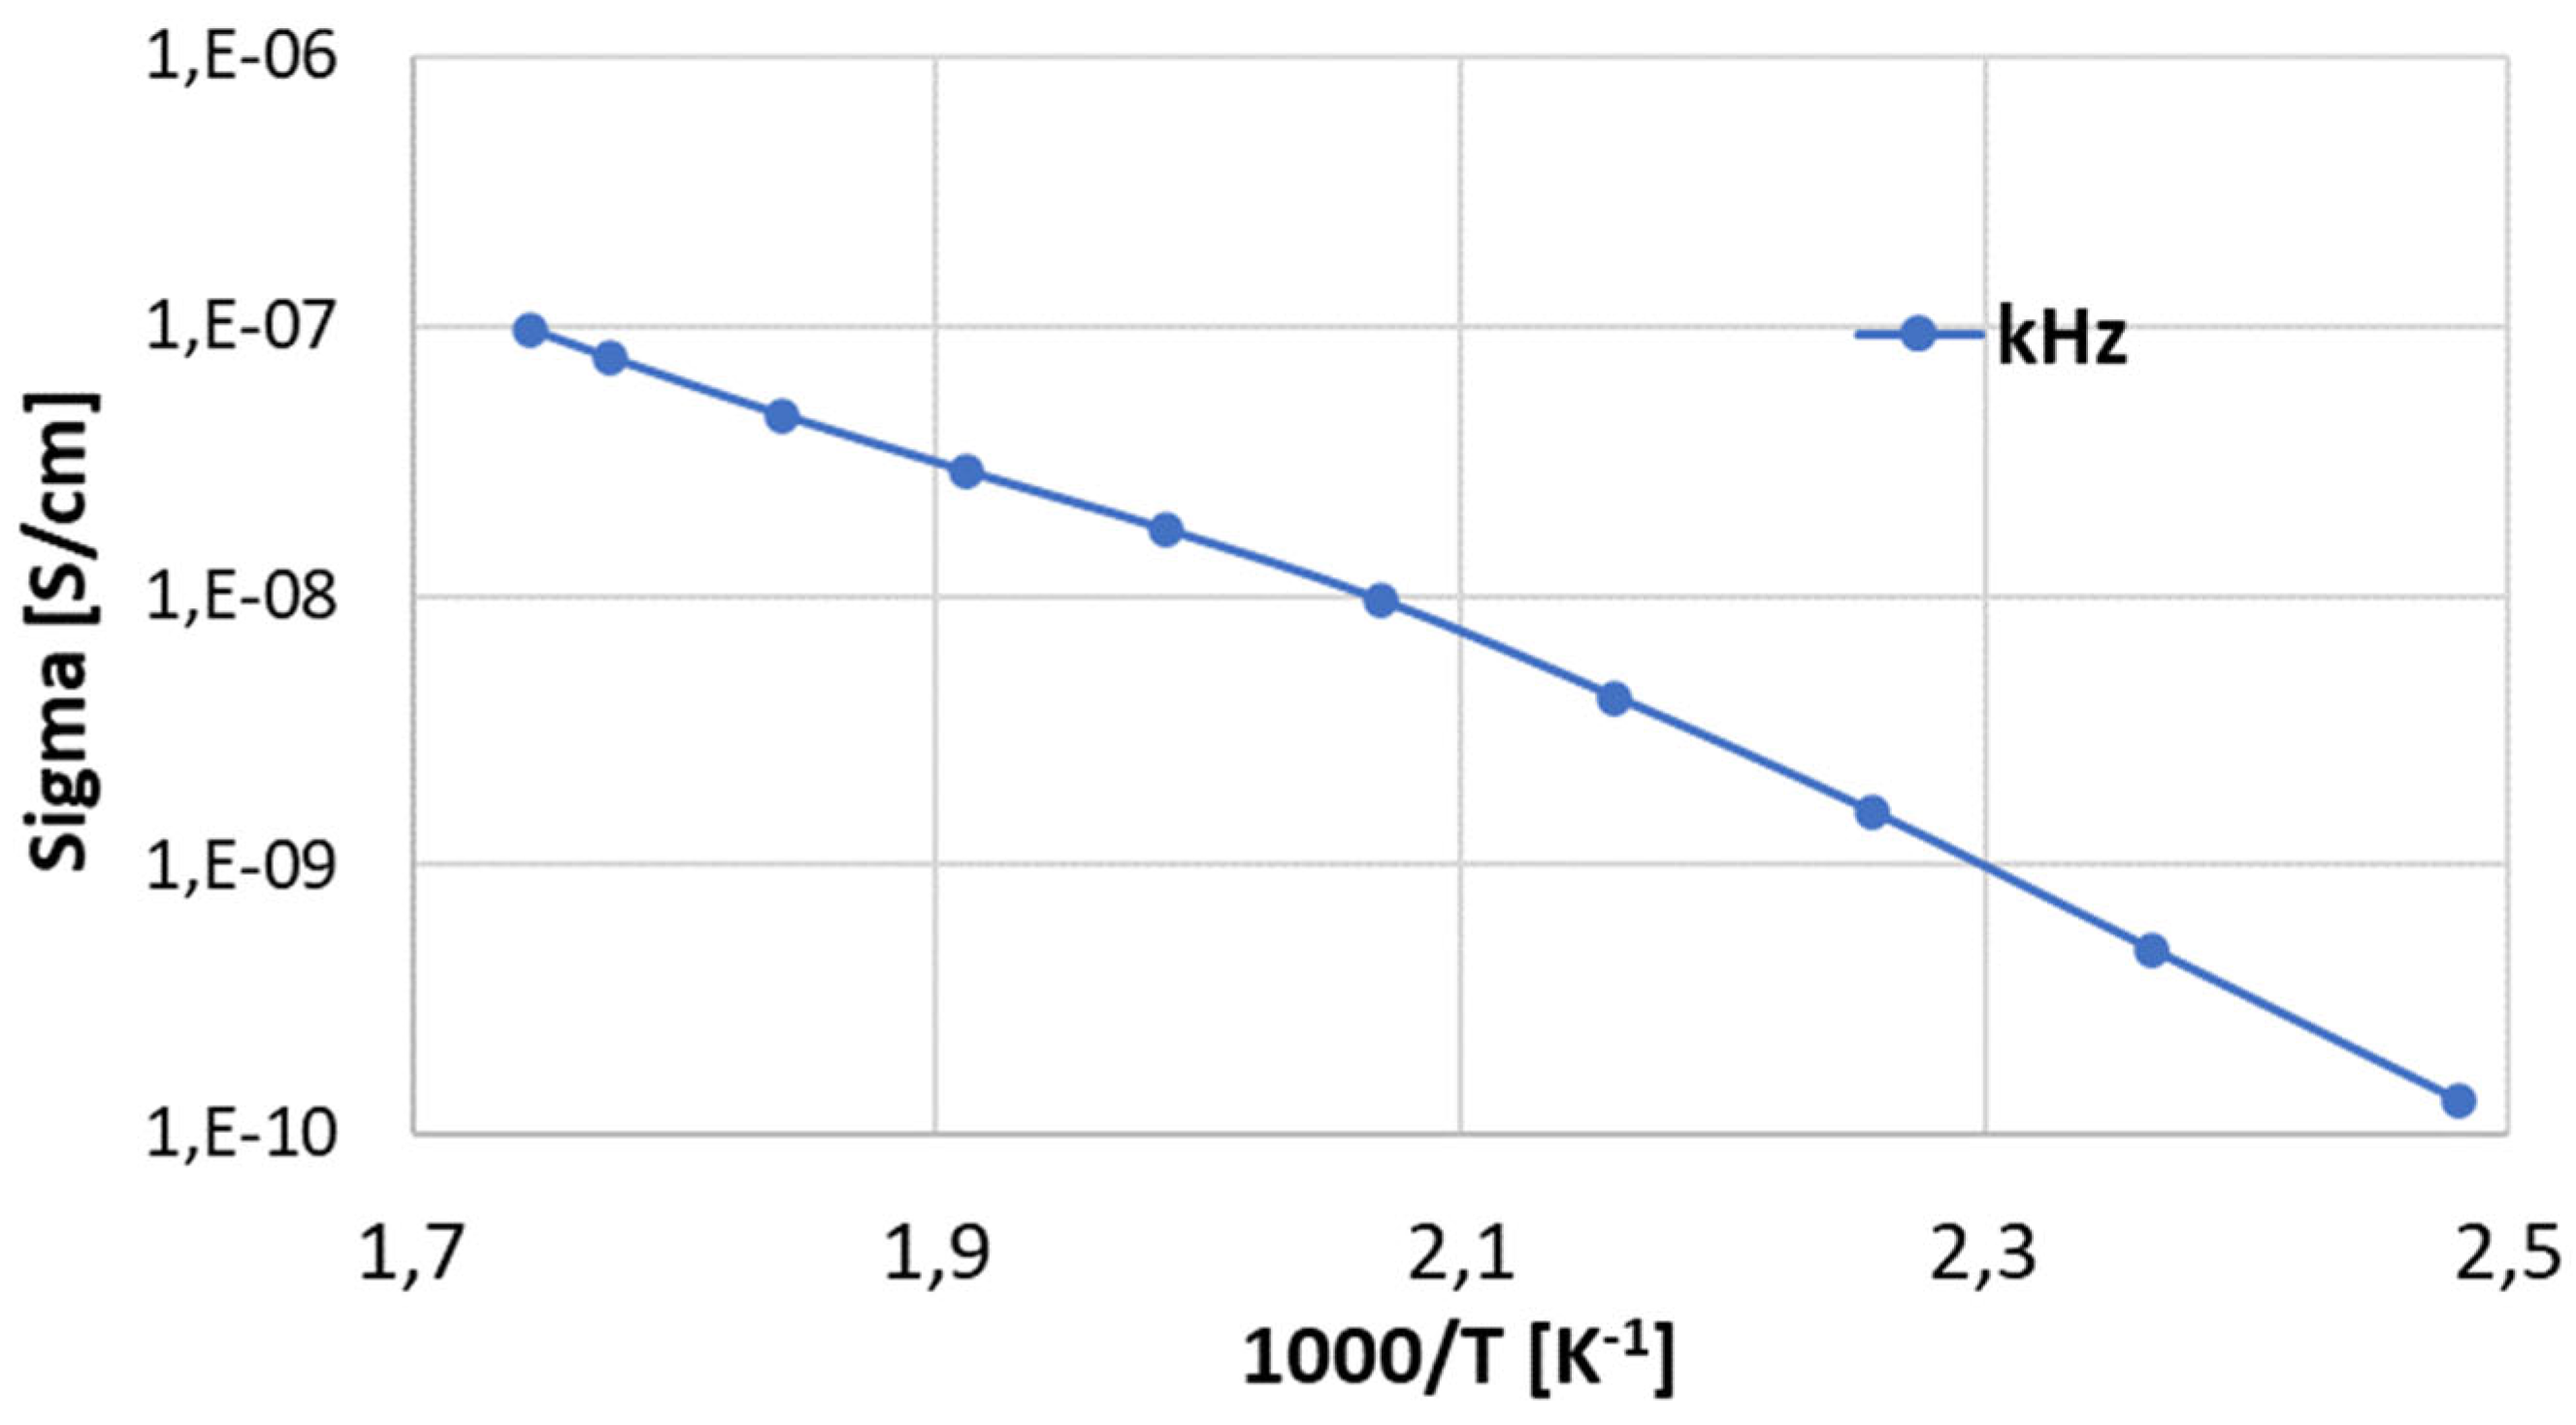
The AC conductivities (recorded again at 1 kHz) of sample 835-8 also increased with the increase in the temperature from 130 °C to 300 °C (i.e., 403 K to 573 K, Figure 11).
Figure 11.
Arrhenius plot of AC conductivity as a function of the absolute temperature, sample 835-8.
The average value of the carrier activation energy Ea over the studied temperature range is 0.277, 0.255, and 0.324 for sample 700-2 region a, sample 700-2 region b, and sample 835-8, respectively.
Usually, the optical band gap is higher than the electrical band gap [15], most typically four times higher [16]. Here, in case of LiF 700-2, the optical gap is 3.65 eV, and the electrical gap is 0.277 eV at room temperature.
The band gap estimations determined above support the dielectric-tests-derived statement that the charge phenomena at the lattice level of the studied LiF compacts seem to be constant over roughly 730 °C in sintering to the higher processing temperatures. The optimum window for the fabrication of LiF dielectrics based on the HPF approach lies roughly here.
4. Conclusions
Lithium fluoride (LiF) processed via so-called high-pressure forming (HPF) plus subsequent furnace sintering is a good quality dielectric material. Its optimum sintering temperature was found to be slightly over 730 °C, and from this standpoint, it could be processed in the future in a solid phase together with silver electrodes without destroying their arrangement. At room temperature, LiF was fully comparable with oxide ceramics fired at temperatures over 1300 °C, for example, aluminum oxide or YAG. When we would like to shift the stability limit of LiF electronic components to higher temperatures, such as over 150 °C, we need to develop LiF ceramics with an even more intensively sintered microstructure. For this purpose, firing at 750 °C for 8 h after the HPF of the initial powder was recognized as the most suitable. The final product had a relative permittivity of 12.1, a loss tangent of 0.0005, and a DC resistivity of 27.4 × 10¹² Ωm. Its permittivity and loss tangent were frequency-independent and temperature-independent up to at least 150 °C. The optical band gap was markedly larger than the electrical band gap. The optical band gap of the LiF samples was in the range 3.20–3.65 eV depending on the sintering conditions. With increasing sintering temperature and time, the microstructure improves (and could be improved even beyond the frames studied here) but the lattice-level polarization and charging phenomena seem to have a threshold at about 750 °C at the sintering step, above which the physical behavior of the samples is not markedly modified. Production programs based on a pure LiF material could dramatically shift the energy demand for the elaboration of low-loss dielectrics down in many application fields.
Author Contributions
Conceptualization, P.C.; methodology, P.C.; software, J.S.; investigation, L.S., F.L. and J.S.; data curation P.C. and L.S.; writing—original draft preparation, P.C.; writing—review and editing, P.C. All authors have read and agreed to the published version of the manuscript.
Funding
This research received no external funding.
Data Availability Statement
All data are stored by the corresponding author and can be shared with anyone upon reasonable request.
Acknowledgments
P. Veselý, Faculty of Electrical Engineering CTU, is acknowledged for his help with the SEM microscopy.
Conflicts of Interest
The authors declare no conflict of interest.
References
- Liu, B.; Li, L.; Song, K.X.; Mao, M.M.; Lu, Z.; Wang, G.; Li, L.; Wang, D.; Zhou, D.; Feteira, A.; et al. Enhancement of densification and microwave dielectric properties in LiF ceramics via a cold sintering and post-annealing process. J. Eur. Ceram. Soc. 2021, 41, 1726–1729. [Google Scholar] [CrossRef] [Scilit]
- Jia, Y.Q.; Hong, W.B.; Li, L.; Wu, S.Y.; Liu, B.; Chen, X.M. Dense LiF microwave dielectric ceramics with near-zero linear shrinkage during sintering. Ceram. Int. 2022, 48, 28463–28470. [Google Scholar] [CrossRef] [Scilit]
- Song, X.-Q.; Du, K.; Li, J.; Lan, X.-K.; Lu, W.-Z.; Wang, X.-H.; Lei, W. Low-fired fluoride microwave dielectric ceramics with low dielectric loss. Ceram. Int. 2019, 45, 279–286. [Google Scholar] [CrossRef] [Scilit]
- Liu, B.; Lin, F.L.; Hu, C.C.; Song, K.X.; Zhang, J.H.; Lu, C.; Huang, Y.H. Novel transparent LiF ceramics enabled by cold sintering at 150 °C. Scr. Mater. 2022, 220, 114917. [Google Scholar] [CrossRef] [Scilit]
- Liu, B.; Sha, K.; Jia, Y.Q.; Huang, Y.H.; Hu, C.C.; Li, L.; Wang, D.W.; Zhou, D.; Song, K.X. High quality factor cold sintered LiF ceramics for microstrip patch antenna applications. J. Eur. Ceram. Soc. 2021, 41, 4835–4840. [Google Scholar] [CrossRef] [Scilit]
- Modak, P.; Modak, B. Electronic structure investigation of intrinsic and extrinsic defects in LiF. Comput. Mater. Sci. 2022, 202, 110977. [Google Scholar] [CrossRef] [Scilit]
- Petrášek, J.; Ctibor, P.; Sedláček, J.; Lukáč, F. Synthesis and pressure-assisted sintering of CaCu3Ti4O12 dielectrics. Ceramics 2021, 4, 447–466. [Google Scholar] [CrossRef] [Scilit]
- Tauc, J.; Grigorovici, R.; Vancu, A. Optical properties and electronic structure of amorphous germanium. J. Phys. Stat. Soli. 1966, 15, 627–633. [Google Scholar] [CrossRef] [Scilit]
- Sajid, A.; Murtaza, G.; Reshak, A.H. Shift of band gap from direct to indirect and optical response of LiF under pressure. Mod. Phys. Lett. B 2013, 27, 1350061. [Google Scholar] [CrossRef] [Scilit]
- Application Guide for Multilayer Ceramic Capacitors—Electrical; Electronic Industries Alliance: Arlington County, VA, USA, 1993.
- EIA-198-1F; Ceramic Dielectric Capacitors, Classes I, II, III, IV—Part 1: Characterization and Requirements. Electronic Components Industry Association (EIA): Alpharetta, GA, USA, 2002.
- Liang, X.; Zhao, Y.; Han, D.; Mao, J.; Lan, L. Synthesis and Electrochemical Characteristics of LiNi0.5Mn1.5O4 Coatings Prepared by Atmospheric Plasma Spray as Cathode Material for Lithium-Ion Batteries. Int. J. Electrochem. Sci. 2019, 14, 717–725. [Google Scholar] [CrossRef] [Scilit] [PubMed]
- Bullard, J.W.; Searcy, A.W. Microstructural development during sintering of lithium fluoride. J. Am. Ceram. Soc. 1997, 80, 2395–2400. [Google Scholar] [CrossRef] [Scilit]
- Al-Maiyaly, B.K.H. The effect of thickness on electrical conductivity and optical constant of Fe2O3 thin films. Ibn AL-Haitham J. Pure Appl. Sci. 2014, 27, 237–246. [Google Scholar]
- Amin, S.A.; Sedky, A. On the correlation between electrical, optical and magnetic properties of Zn1−xPrxO nanoparticles. Mater. Res. Express 2019, 6, 065903. [Google Scholar] [CrossRef] [Scilit]
- Schrade, M.; Magras, A.; Galeckas, A.; Finstad, T.G.; Norby, T. The band gap of BaPrO3 studied by optical and electrical methods. J. Am. Ceram. Soc. 2016, 99, 492–498. [Google Scholar] [CrossRef] [Scilit]

Disclaimer/Publisher’s Note: The statements, opinions and data contained in all publications are solely those of the individual author(s) and contributor(s) and not of MDPI and/or the editor(s). MDPI and/or the editor(s) disclaim responsibility for any injury to people or property resulting from any ideas, methods, instructions or products referred to in the content. |
© 2023 by the authors. Licensee MDPI, Basel, Switzerland. This article is an open access article distributed under the terms and conditions of the Creative Commons Attribution (CC BY) license (https://creativecommons.org/licenses/by/4.0/).