


Abstract
Nitrogen deficiency is one of the key factors limiting the growth and raw-material quality of tea plants; however, cell-autonomous mechanisms underlying the response of Camellia sinensis (L.) Kuntze to reduced nitrogen availability remain insufficiently studied. This study characterized biochemical and transcriptomic changes in callus cultures of three tea cultivars (‘Kolkhida’, ‘Karatum’, and cultivar #582) after two months of cultivation on Murashige–Skoog medium lacking nitrogen-containing components. Nitrogen withdrawal caused visible stress symptoms, reduced total nitrogen in ‘Kolkhida’ and ‘Karatum’ (total nitrogen was not determined in cultivar #582), and altered the accumulation of L-theanine, caffeine, and catechins in a cultivar-dependent manner. ‘Kolkhida’ showed decreases in simple catechins, L-theanine, and caffeine; ‘Karatum’ showed increases in simple and gallated catechins together with a decrease in L-theanine; and cultivar #582 showed smaller changes in most measured biochemical traits. RNA-seq identified 1898 differentially expressed genes (DEGs) in ‘Kolkhida’, 4551 in ‘Karatum’, and 9869 in cultivar #582. The enriched Gene Ontology term “response to karrikin” (GO:0080167) was common to all three cultivars, whereas cultivar-specific profiles differed substantially. In the flavonoid biosynthesis pathway, key phenylpropanoid genes were predominantly downregulated in cultivar #582 but induced in ‘Kolkhida’ and ‘Karatum’. RT-qPCR confirmed the direction of change for selected genes. Under the tested in vitro conditions, ‘Kolkhida’ showed the strongest biochemical deterioration, whereas cultivar #582 combined the greatest biochemical stability with the most extensive transcriptomic remodeling. Because total nitrogen was not measured in cultivar #582, its apparent tolerance remains provisional. Tea callus cultures therefore provide a controlled discovery system for cell-autonomous candidate responses, but cultivar rankings and candidate markers require validation in independent callus lines and whole plants.
1. Introduction
The tea plant Camellia sinensis (L.) Kuntze is among the most important perennial crops whose raw-material quality is determined by the interaction between genotype, mineral nutrition conditions, and the activity of specialized metabolism. Tea quality is strongly associated with catechins, amino acids, purine alkaloids, and other specialized metabolites [1].
Nitrogen availability constrains allocation between growth, nitrogen-rich metabolites, and carbon-rich specialized products. Under nitrogen limitation, reduced amino-acid and purine biosynthesis can coincide with redirection of carbon skeletons toward phenylpropanoid and other nitrogen-free compounds, although the magnitude and direction of this trade-off depend on genotype, tissue, exposure duration, and source–sink transport [2,3,4,5]. Multi-omics studies of intact tea plants have documented coordinated, but not always proportional, changes in transcripts, amino acids, catechins, and central carbon metabolism [3,4,5]. A previous study by some of the present authors comparing in vitro and in vivo tea material identified shared nitrogen-deficiency pathways involving lignification, redox regulation, defense-related responses, amino-acid transport, and the “response to karrikin” term, while also demonstrating strong model-context dependence [6].
Callus cultures provide a complementary model because medium composition can be controlled precisely and the absence of roots and vascular tissues removes whole-plant nutrient redistribution, thereby enriching for cell-autonomous metabolic and signaling responses. Transcriptomic and metabolomic studies in tea and grape callus have shown that this system can resolve pathway-level changes in phenylpropanoid, flavonoid, photosynthetic, and sugar-responsive metabolism [7,8,9]. Nevertheless, callus is a dedifferentiated, heterotrophic tissue that depends strongly on exogenous sugar, lacks organ-specific source–sink relations, and may accumulate genetic or epigenetic changes during prolonged subculture [9,10]. Callus responses should therefore be interpreted as controlled cellular responses rather than direct surrogates for intact plants grown in soil.
The three cultivars were selected from the FRC SSC RAS tea germplasm collection to represent contrasting breeding histories and genetic backgrounds. ‘Kolkhida’ is a major industrial cultivar of Soviet breeding, ‘Karatum’ was developed at the FRC SSC RAS, and cultivar #582 is an induced-mutant accession originating from Georgian breeding programs of the 1970s–1980s [11]. This contrast was used to test whether chronic nitrogen withdrawal elicits conserved cellular responses or cultivar-specific metabolic and transcriptional strategies.
The aim of the present study was to determine how a two-month nitrogen deficiency in vitro affects major quality-related metabolites and gene-expression profiles in callus cultures of three Camellia sinensis cultivars: ‘Kolkhida’, ‘Karatum’, and cultivar #582. We hypothesized that chronic nitrogen withdrawal would reveal a cultivar-dependent trade-off between nitrogen-containing metabolites and carbon-rich catechin metabolism, while the callus transcriptome would identify cell-autonomous response modules decoupled from vascular transport. The two-month endpoint was selected to characterize chronic acclimatory remodeling and to obtain sufficient material for parallel biochemical and RNA-seq analyses; early signaling responses were outside the scope of the experiment.
2. Materials and Methods
2.1. Plant Material and Experimental Design
Callus cultures of three Camellia sinensis cultivars, ‘Kolkhida’, ‘Karatum’, and cultivar #582, were obtained from the basal parts of microshoots and maintained on Murashige–Skoog (MS) medium supplemented with 2,4-dichlorophenoxyacetic acid (2 mg L−1). Each treatment initially included 30–50 explants, and up to three callus samples per cultivar and treatment were selected for molecular and biochemical analyses. Each biological replicate was a callus derived from a separate explant and randomly selected to select the calluses for RNA-seq and biochemical analyses.
The experiment included two treatments: N+, the nitrogen-sufficient control MS medium; and N−, the nitrogen-deficient medium. Standard MS medium supplied 1900 mg L−1 KNO3 (18.79 mM nitrate) and 1650 mg L−1 NH4NO3 (20.61 mM ammonium and 20.61 mM nitrate), corresponding to 39.40 mM nitrate and 20.61 mM ammonium [12]. The N− medium omitted KNO3, NH4NO3, and casein hydrolysate 500 mg L−1. Sample codes are provided in Table 1.
Table 1.
Callus samples and nitrogen treatments used in the in vitro experiment.
Cultivation was continued for two months to assess a chronic nitrogen-withdrawal response under a 16 h/8 h light/dark photoperiod, 25 ± 1 °C, 70% relative humidity, and an illuminance of 69 umol/s/m2 with Philips MASTER TL-D Super 80 series (Signify N.V., Warszawa, Poland) in 6500 K “Daylight” lamps.
2.2. Biochemical Analysis
Total nitrogen content was determined spectrophotometrically after acid digestion of callus material [13]. Caffeine, L-theanine, and catechins were analyzed by high-performance liquid chromatography. Samples were steam-fixed at 100 °C, dried to an air-dry state, and extracted with 80% aqueous methanol. The analysis included L-theanine, caffeine, simple catechins (catechin, gallocatechin, epigallocatechin, and epicatechin), and gallated catechins (catechin-3-gallate, epicatechin-3-gallate, gallocatechin-3-gallate, and epigallocatechin-3-gallate). Detection was performed at 195 nm for L-theanine and at 273 nm for caffeine and catechins; compounds were identified by comparison with standard retention times according to the previously published protocol [14]. Metabolite concentrations were calculated per gram of dried callus and are reported as mg g−1 dry weight (DW).
2.3. RNA Extraction, RNA-Seq Library Preparation, and Sequencing
Callus samples were ground in liquid nitrogen. Total RNA was extracted using the SKYprep RNA Pure Plant Plus Kit (Skygen, Moscow, Russia) with DNase I (Skygen, Moscow, Russia) treatment, according to the manufacturer’s protocol with minor modifications. RNA was eluted in 30 μL of nuclease-free water (Thermo, Waltham, MA, USA) and stored at −80 °C until further use. RNA concentration and purity were assessed spectrophotometrically using a Nanophotometer N50 (Implen, Munich, Germany) and fluorometrically using a Qubit 4 Fluorometer with the Qubit RNA BR Assay Kit (Invitrogen, Waltham, MA, USA). RNA quality was assessed by electrophoresis in a 1.5% agarose gel (Amresco, Solon, OH, USA) and by the RNA integrity number (RIN) using a TapeStation 4150 instrument (Agilent Technologies, Santa Clara, CA, USA) with High Sensitivity RNA ScreenTape (Agilent Technologies, Santa Clara, CA, USA). Samples with RIN ≥ 6 were accepted for library preparation.
Directional mRNA libraries were prepared using the NEBNext Ultra II Directional RNA Library Prep Kit for Illumina (New England Biolabs, Ipswich, MA, USA) according to the manufacturer’s recommendations. For each sample, 1000 ng of total RNA was used as input. Polyadenylated mRNA was enriched using the NEBNext Poly(A) mRNA Magnetic Isolation Module (New England Biolabs, Ipswich, MA, USA). Purified mRNA was fragmented in the First Strand Synthesis Reaction Buffer with the Random Primer Mix at 94 °C for 7.5 min to obtain libraries with an insert size greater than 300 bp. First- and second-strand cDNA synthesis was then performed; dUTP-containing buffer was used during second-strand synthesis to preserve library strandedness. The resulting cDNA was subjected to end repair, 3′ adenylation, and ligation of NEBNext adaptors. Libraries were indexed using NEBNext Multiplex Oligos for Illumina Unique Dual Index Primers (New England Biolabs, Ipswich, MA, USA) and amplified for eight PCR cycles. Library quality was assessed using High Sensitivity D1000 ScreenTape (Agilent Technologies, Santa Clara, CA, USA) and reagents on a TapeStation 4150 system (Agilent Technologies, Santa Clara, CA, USA). Library molarity was determined by qPCR using the KAPA Library Quantification Kit (KAPA Biosystems, Wilmington, MA, USA) on a QuantStudio 3 Real-Time PCR System (Applied Biosystems, Santa Clara, CA, USA).
Sequencing was carried out at the Genomic Research Resource Centre of the Sirius University of Science and Technology on the Illumina NovaSeq 6000 platform (Illumina, San Diego, CA, USA) in paired-end mode with 151 + 151 bp reads.
2.4. Bioinformatic and Statistical Analysis
Raw sequencing data were demultiplexed according to the index sequences introduced during library preparation using bcl2fastq v2.20.0.422 with default parameters. Initial read quality was assessed using FastQC v0.11.2 [15]. Adapter sequences and low-quality bases were removed using AdapterRemoval v2 with the following parameters: --trimqualities, --minquality 20 and --minlength 100 [16].
Filtered reads were aligned to the reference genome of Camellia sinensis var. sinensis ‘Kolkhida’, available from CNGBdb under project CNP0005366, using HISAT2 v2.2.1 with strand-specific settings (--rna-strandness RF) [17]. Gene-level read counts were calculated using featureCounts with parameters: -s 2, -p, --countReadPairs, -B, -t CDS and -g gene [18]. The ‘Kolkhida’ genome annotation was used for read assignment and downstream functional interpretation. Overall alignment rates ranged from 90.47% to 94.01%, and 34.14–47.84% of alignments were successfully assigned to annotated features (Table A1). Because every N− versus N+ contrast was performed separately within a cultivar, the analyses did not place the three cultivars in a single differential expression model. Cross-cultivar differences in DEG counts are therefore descriptive and may also reflect sample number, reference-genome divergence, and feature-assignment efficiency.
Differential gene expression analysis was performed using edgeR v4.4.2 [19]. For each cultivar, N− samples were compared with the corresponding N+ controls. Genes were considered differentially expressed when they met all three criteria: |log2 fold change| ≥ 1, p-value ≤ 0.05, and false discovery rate (FDR) ≤ 0.1. The FDR threshold of 0.1 was used for exploratory candidate discovery in this small-replicate design and was interpreted together with the effect-size threshold, pathway enrichment, and RT-qPCR directionality. Functional enrichment analysis of DEGs was performed using clusterProfiler v4.14.6 [20]. GO terms and KEGG pathways were considered enriched at p-value ≤ 0.05 and q-value ≤ 0.1.
Statistical analyses were performed in R. Biochemical and RT-qPCR data were compared between N− and N+ within each cultivar using Student’s t-test; p-value ≤ 0.05 was considered statistically significant. RT-qPCR testing was performed using the rstatix package, and plots were generated using ggpubr. Data are presented as means across biological replicates; error bars represent standard deviations. Because cultivar #582 had only two N− RNA-seq libraries, its DEG totals and enrichment results were interpreted as exploratory.
2.5. RT-qPCR Validation
Selected DEGs were validated by reverse-transcription quantitative PCR (RT-qPCR). First-strand cDNA was synthesized from 200 ng of total RNA using the High-Capacity cDNA Reverse Transcription Kit (Applied Biosystems, Santa Clara, CA, USA) according to the manufacturer’s protocol. Gene-specific primers were designed using Primer-BLAST and Primer3 v0.4.0 (Table 2). RT-qPCR reactions were performed using 5× qPCRmix-HS SYBR (Evrogen, Moscow, Russia) in a final volume of 10 μL on QuantStudio 3 and QuantStudio 5 Real-Time PCR Systems (Applied Biosystems, Santa Clara, CA, USA). The program consisted of initial denaturation at 94 °C for 4 min, followed by 40 cycles of 94 °C for 30 s, primer-specific annealing for 30 s, and 72 °C for 30 s. Fluorescence was detected during elongation. Each reaction was performed in three technical replicates with negative controls. Primer specificity was checked by melt-curve analysis and 1.5% agarose gel electrophoresis.
Table 2.
Genes and primer sequences used for RT-qPCR validation.
Relative expression levels were calculated using the 2−ΔΔCt method [21]. CsActin was used as the internal reference gene for normalization.
3. Results
3.1. Biochemical Response of Calluses to Nitrogen Deficiency
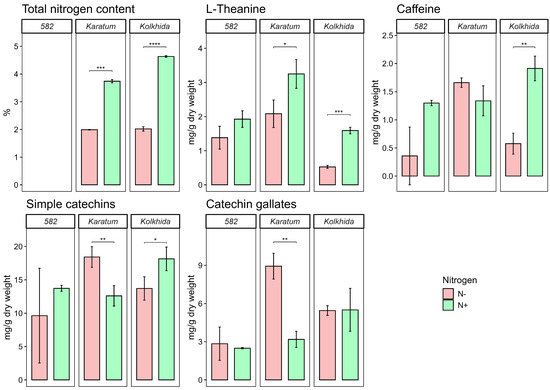
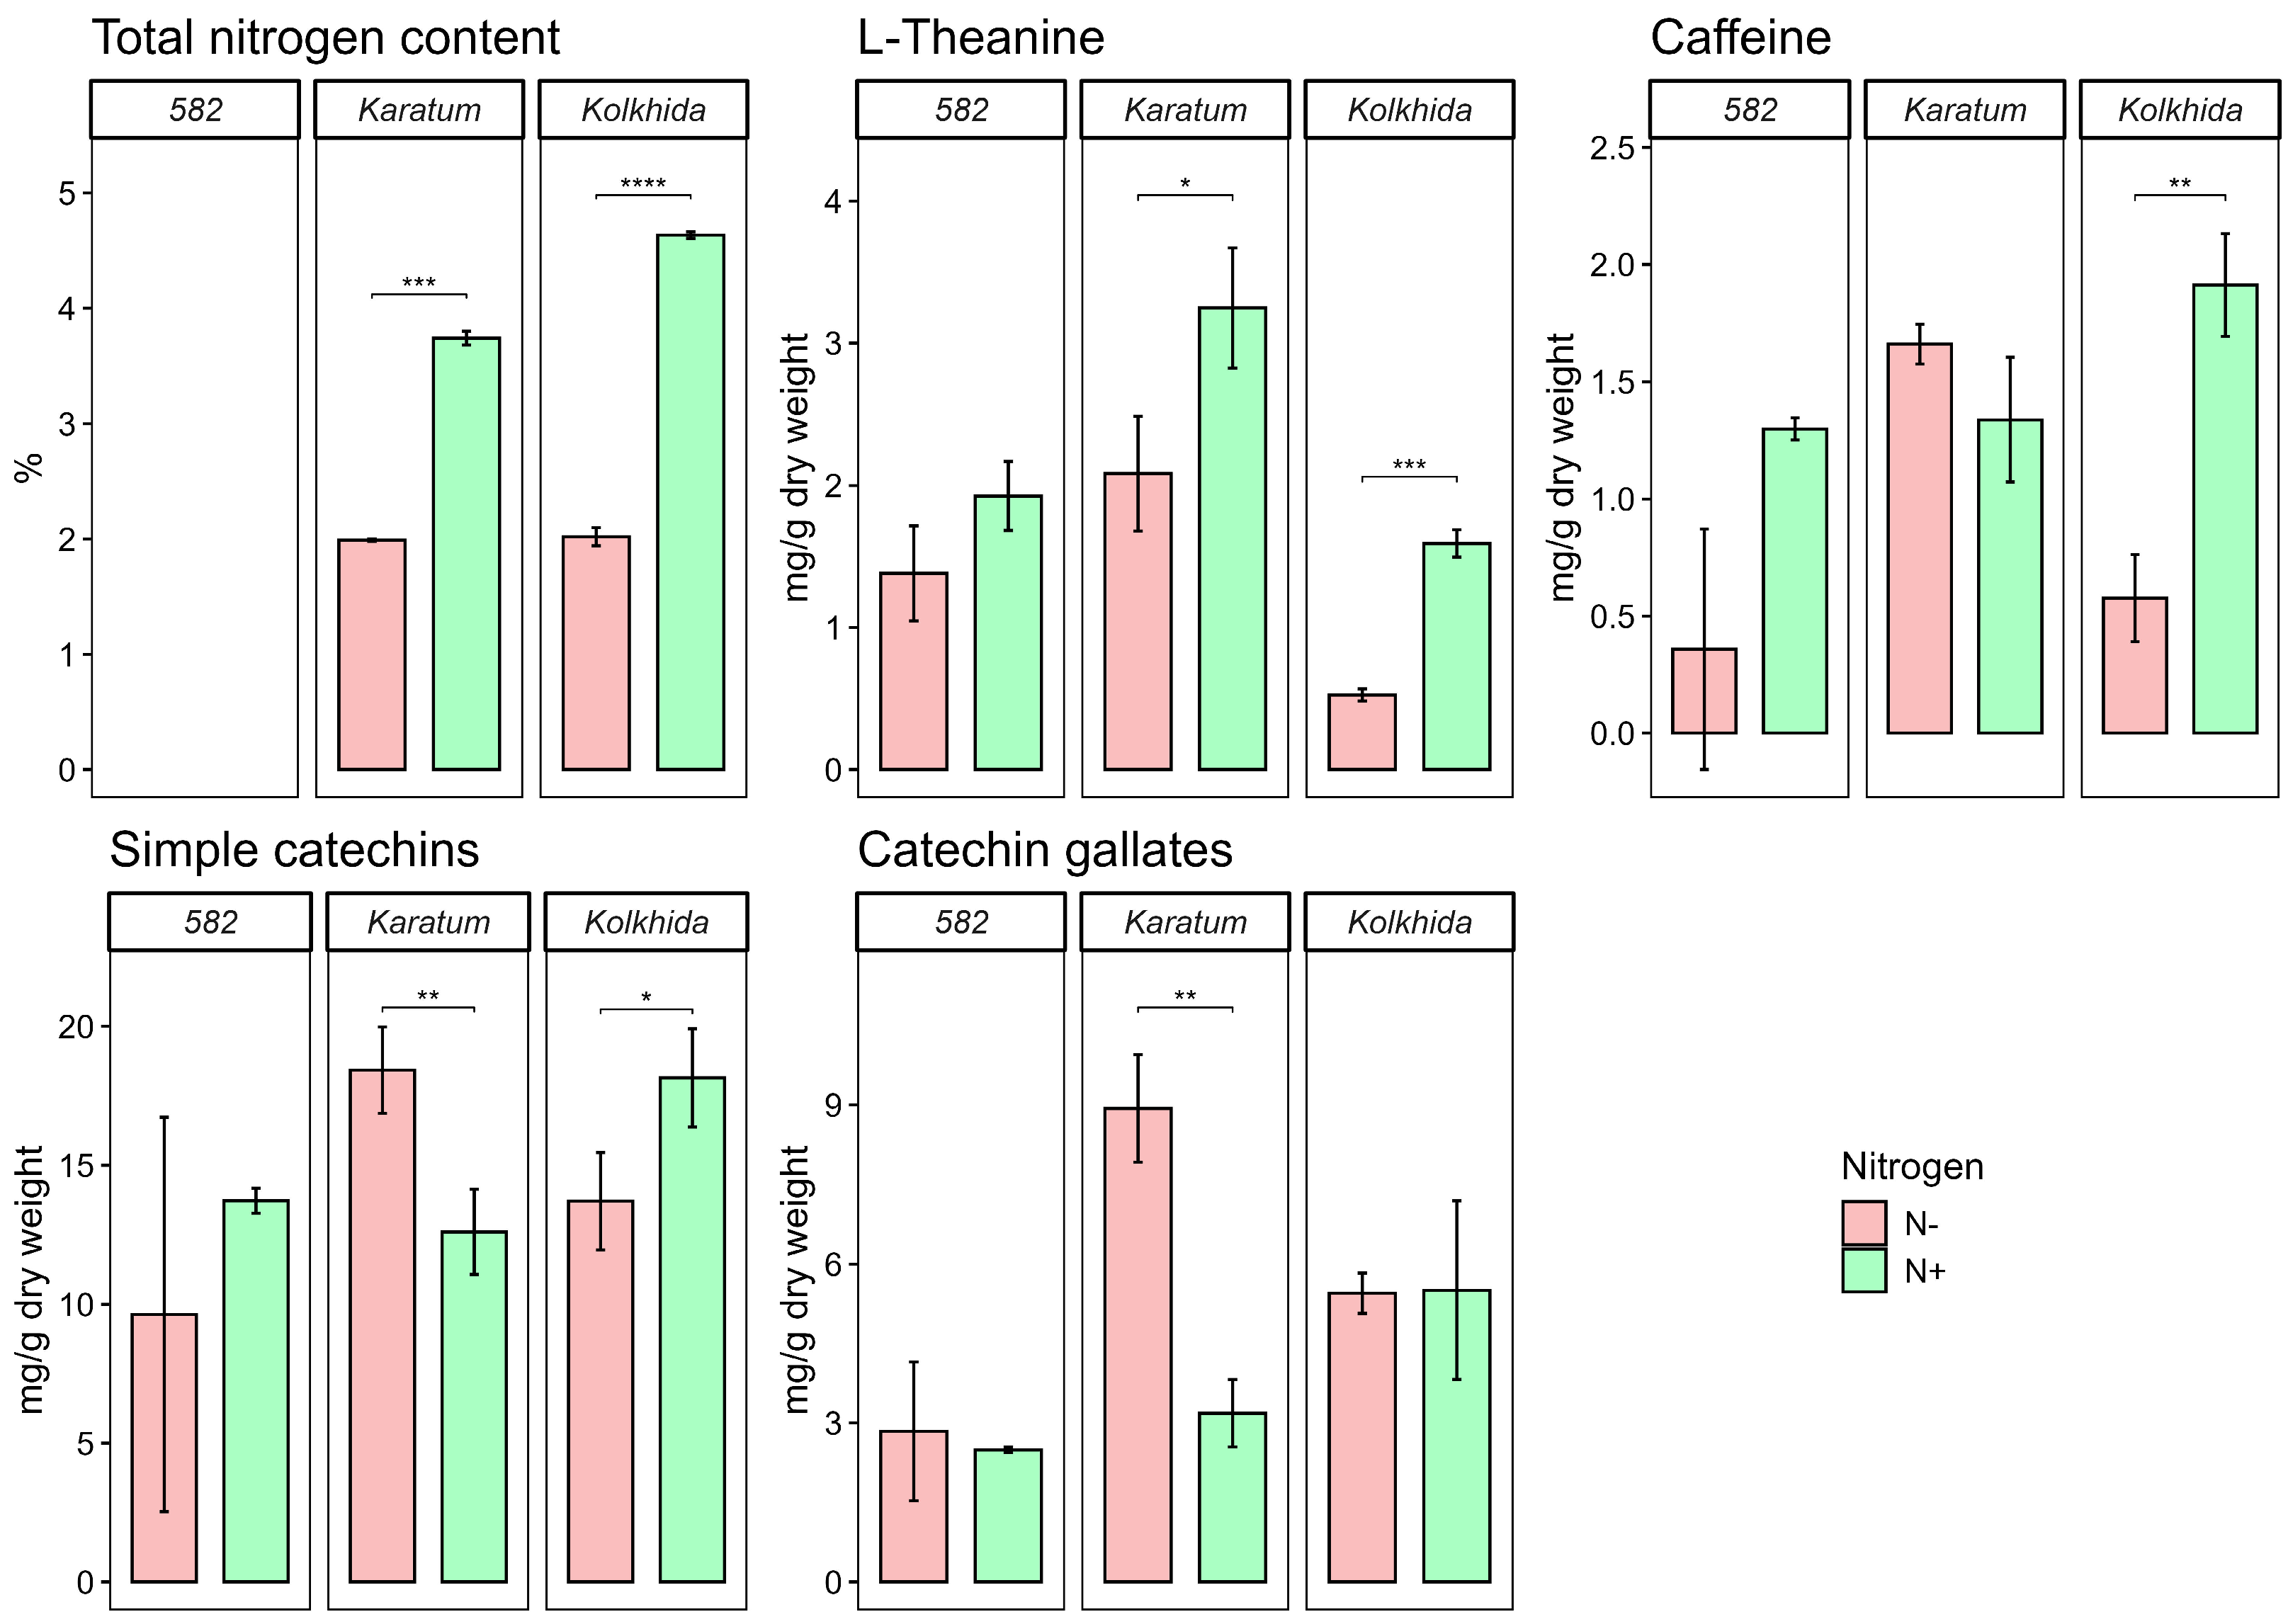
After two months on N− medium, calluses of all three cultivars showed stress symptoms, including tissue browning or reddening, local necrotic lesions, and gradual death of individual explants. Total nitrogen in control calluses was 4.60–4.63% in ‘Kolkhida’ and 3.68–3.74% in ‘Karatum’; under nitrogen deficiency, it decreased to 1.93–2.02% and 1.98–1.99%, respectively, corresponding to significant 2.29- and 1.87-fold reductions. Total nitrogen was not determined in cultivar #582 because the available material was insufficient.
The highest basal L-theanine content was observed in ‘Karatum’ calluses (3.24 mg g−1 DW). In response to nitrogen deficiency, L-theanine decreased 1.5-fold in ‘Karatum’ and 3-fold in ‘Kolkhida’, whereas no significant decrease was detected in cultivar #582. Caffeine in control calluses ranged from 1.03 to 1.91 mg g−1 DW. Nitrogen deficiency caused a 3–4-fold caffeine decrease in ‘Kolkhida’ and cultivar #582, with statistical significance confirmed for ‘Kolkhida’; caffeine remained comparatively stable in ‘Karatum’.
Changes in the catechin profile were cultivar-dependent. The sum of simple catechins in N+ calluses was 18.4 mg g−1 DW in ‘Kolkhida’, 12.6 mg g−1 DW in ‘Karatum’, and 13.7 mg g−1 DW in cultivar #582; the corresponding N− values were 13.7, 18.4, and 9.6 mg g−1 DW. ‘Kolkhida’ showed a significant decrease, whereas ‘Karatum’ showed a significant increase. Gallated catechins remained nearly unchanged in ‘Kolkhida’ (5.50 versus 5.45 mg g−1 DW), increased from 3.18 to 8.93 mg g−1 DW in ‘Karatum’, and increased from 2.49 to 2.84 mg g−1 DW in cultivar #582. Thus, ‘Kolkhida’ showed the strongest biochemical deterioration, whereas cultivar #582 showed the smallest overall change among the measured metabolites (Figure 1). This comparison does not establish equivalent nitrogen depletion in cultivar #582 because its total nitrogen was not measured.
Figure 1.
Effect of nitrogen deficiency on the biochemical composition of calluses from three Camellia sinensis cultivars. Total nitrogen is expressed as a percentage dry weight; L-theanine, caffeine, simple catechins, and gallated catechins are expressed as mg g−1 dry weight of callus. Bars show means and error bars show standard deviations. Asterisks indicate significant N− versus N+ differences in Student’s t-test (* p < 0.05, ** p < 0.01, *** p < 0.001, **** p < 0.0001). Total nitrogen was not determined in cultivar #582 because of limited material.
3.2. Structure of Transcriptomic Data and DEG Numbers
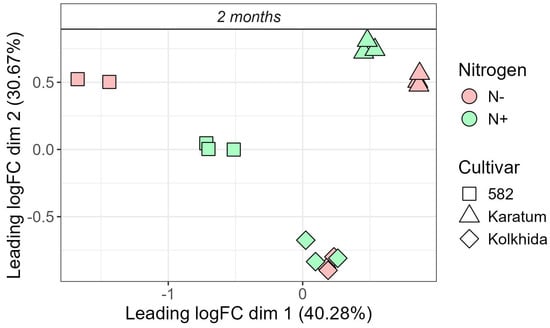
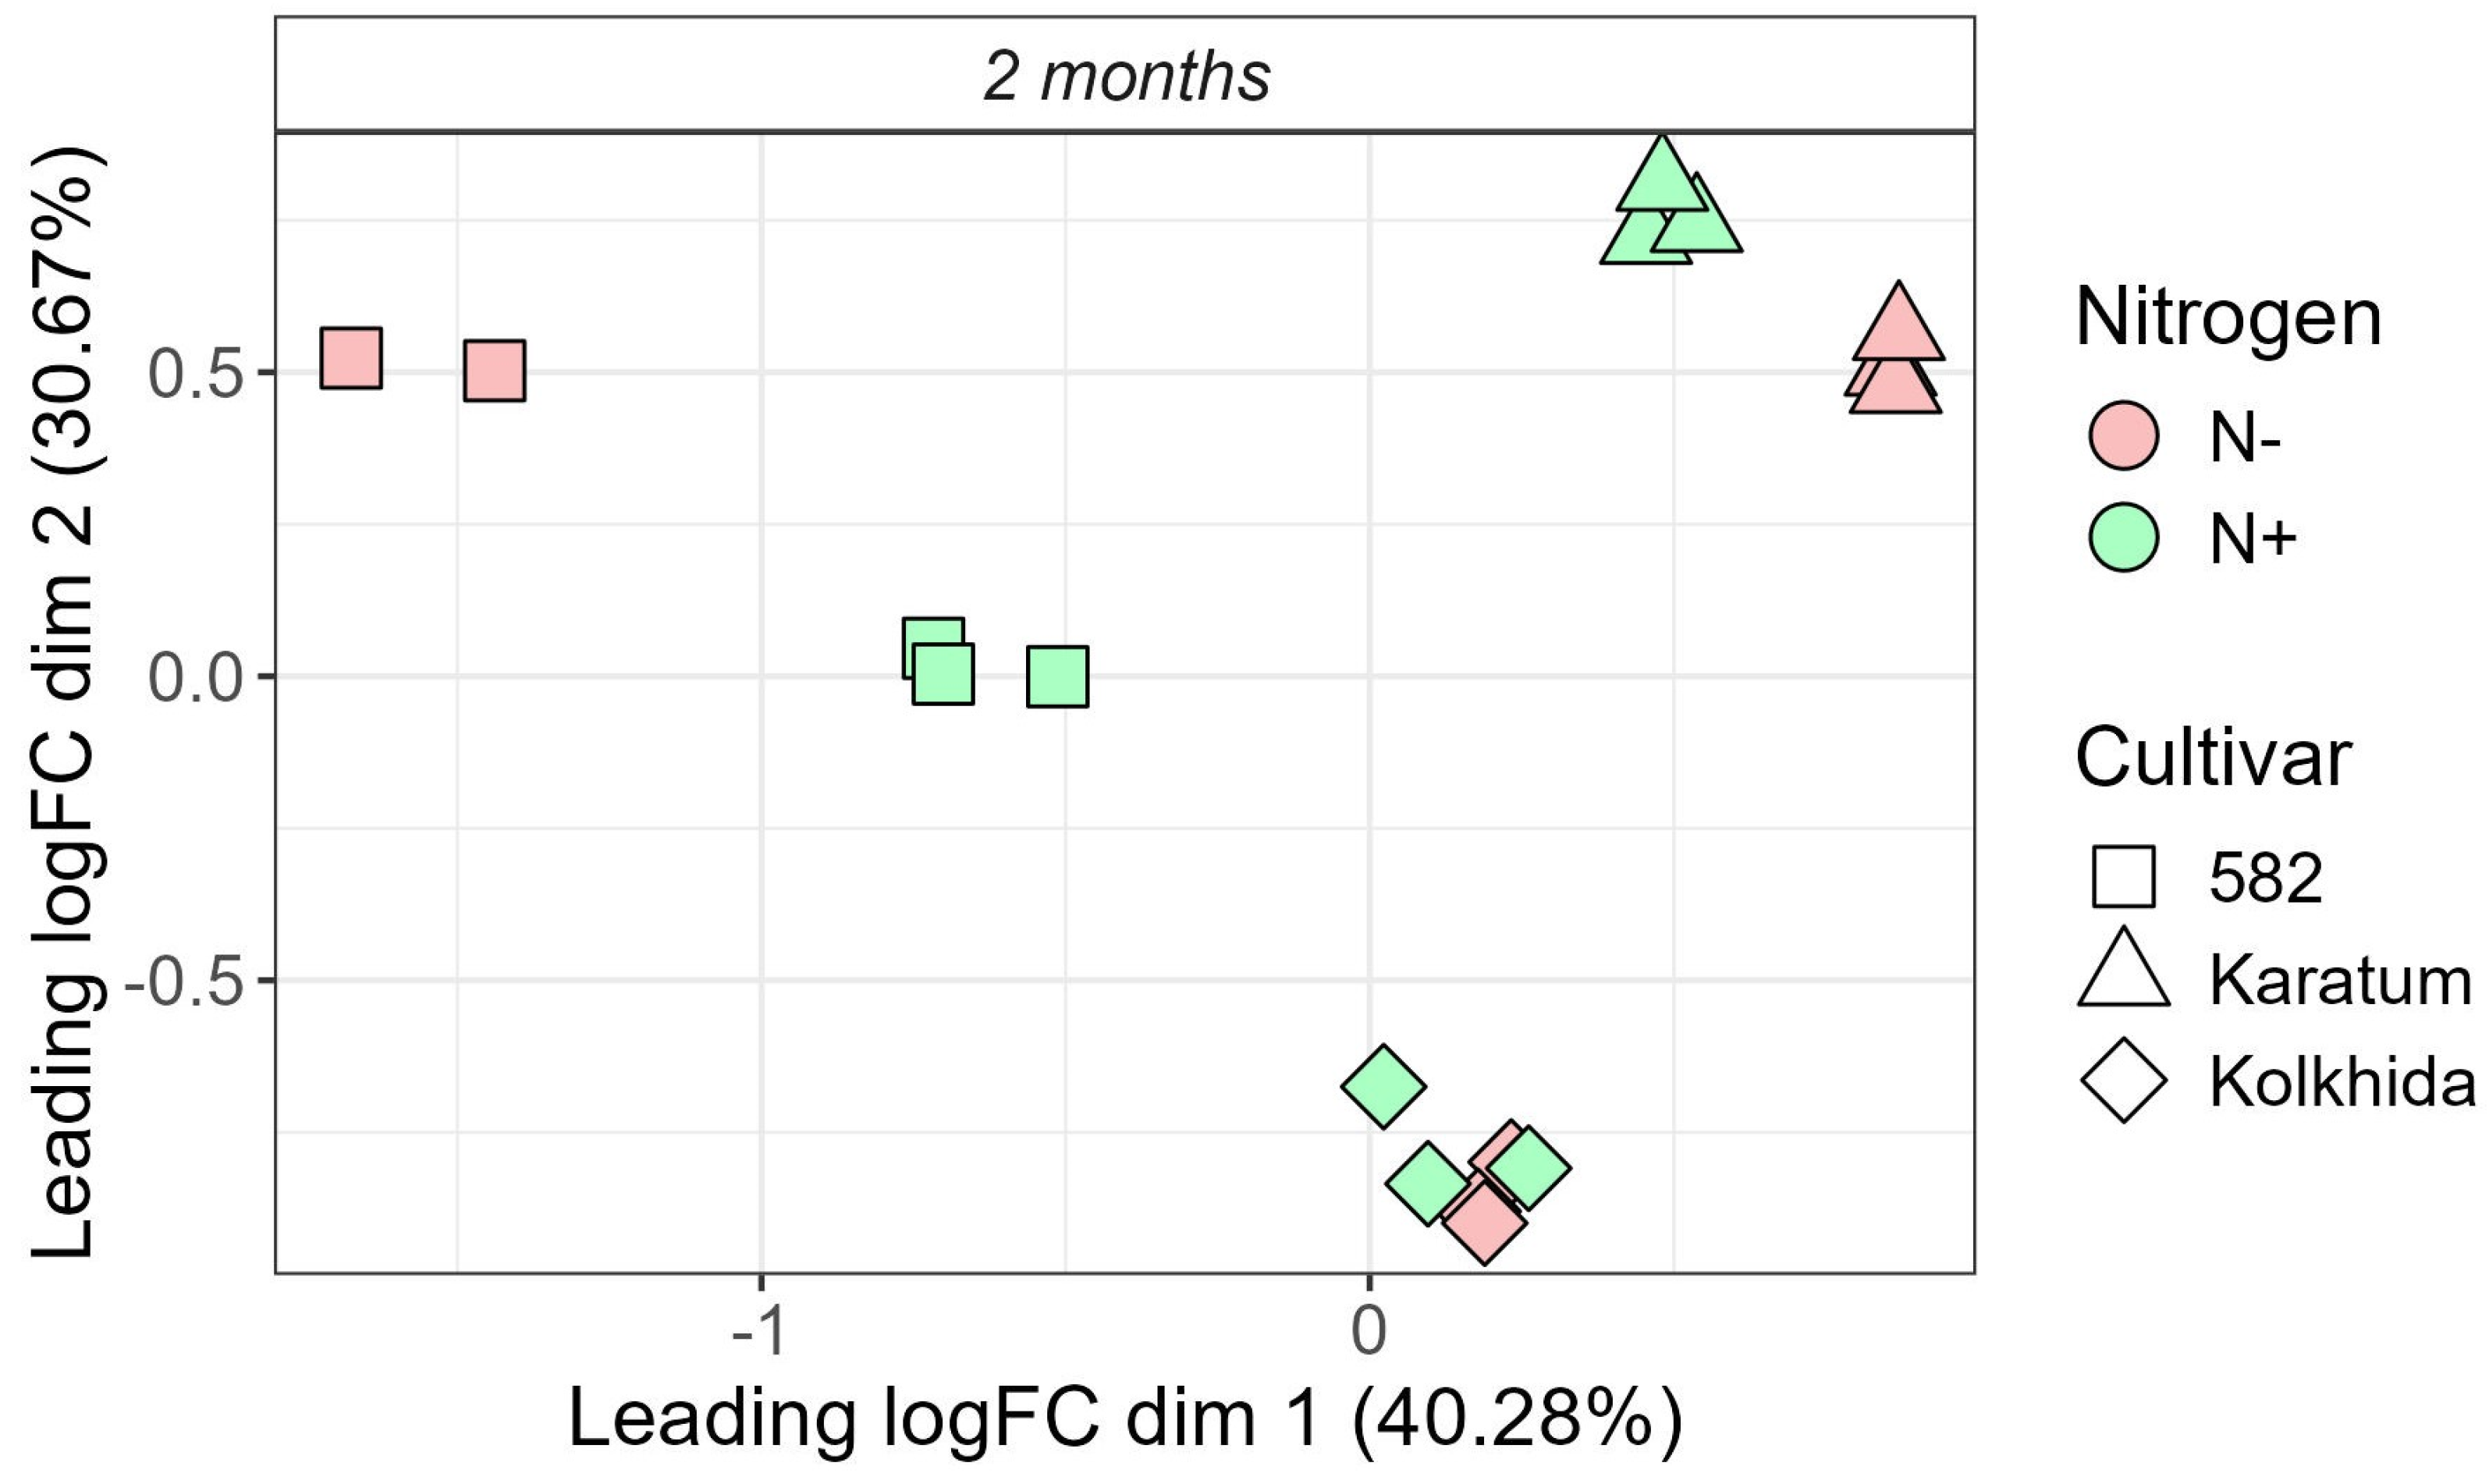
Multidimensional scaling (MDS) of transcriptomic profiles showed clear separation of callus samples by cultivar (Figure 2). N− and N+ samples were most widely separated in cultivar #582, less widely separated in ‘Karatum’, and only weakly separated in ‘Kolkhida’. The sample 46_2 (#582, N−) was excluded from the analysis based on MDS.
Figure 2.
Multidimensional scaling of Camellia sinensis callus transcriptomes after two months under nitrogen-sufficient (N+) and nitrogen-deficient (N−) conditions. Shapes identify cultivars and colors identify nitrogen treatments.
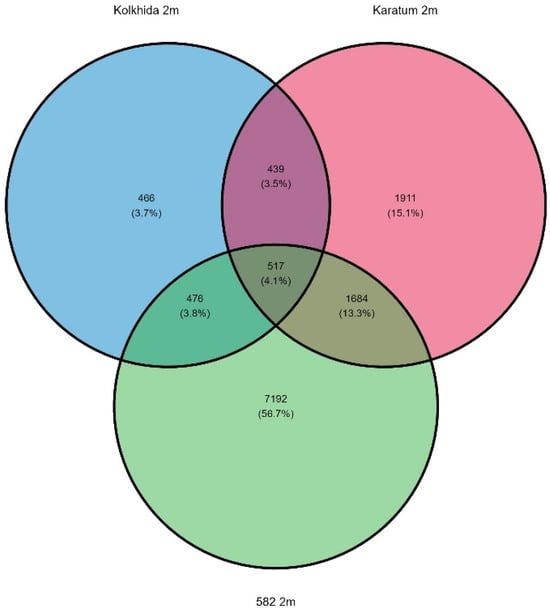
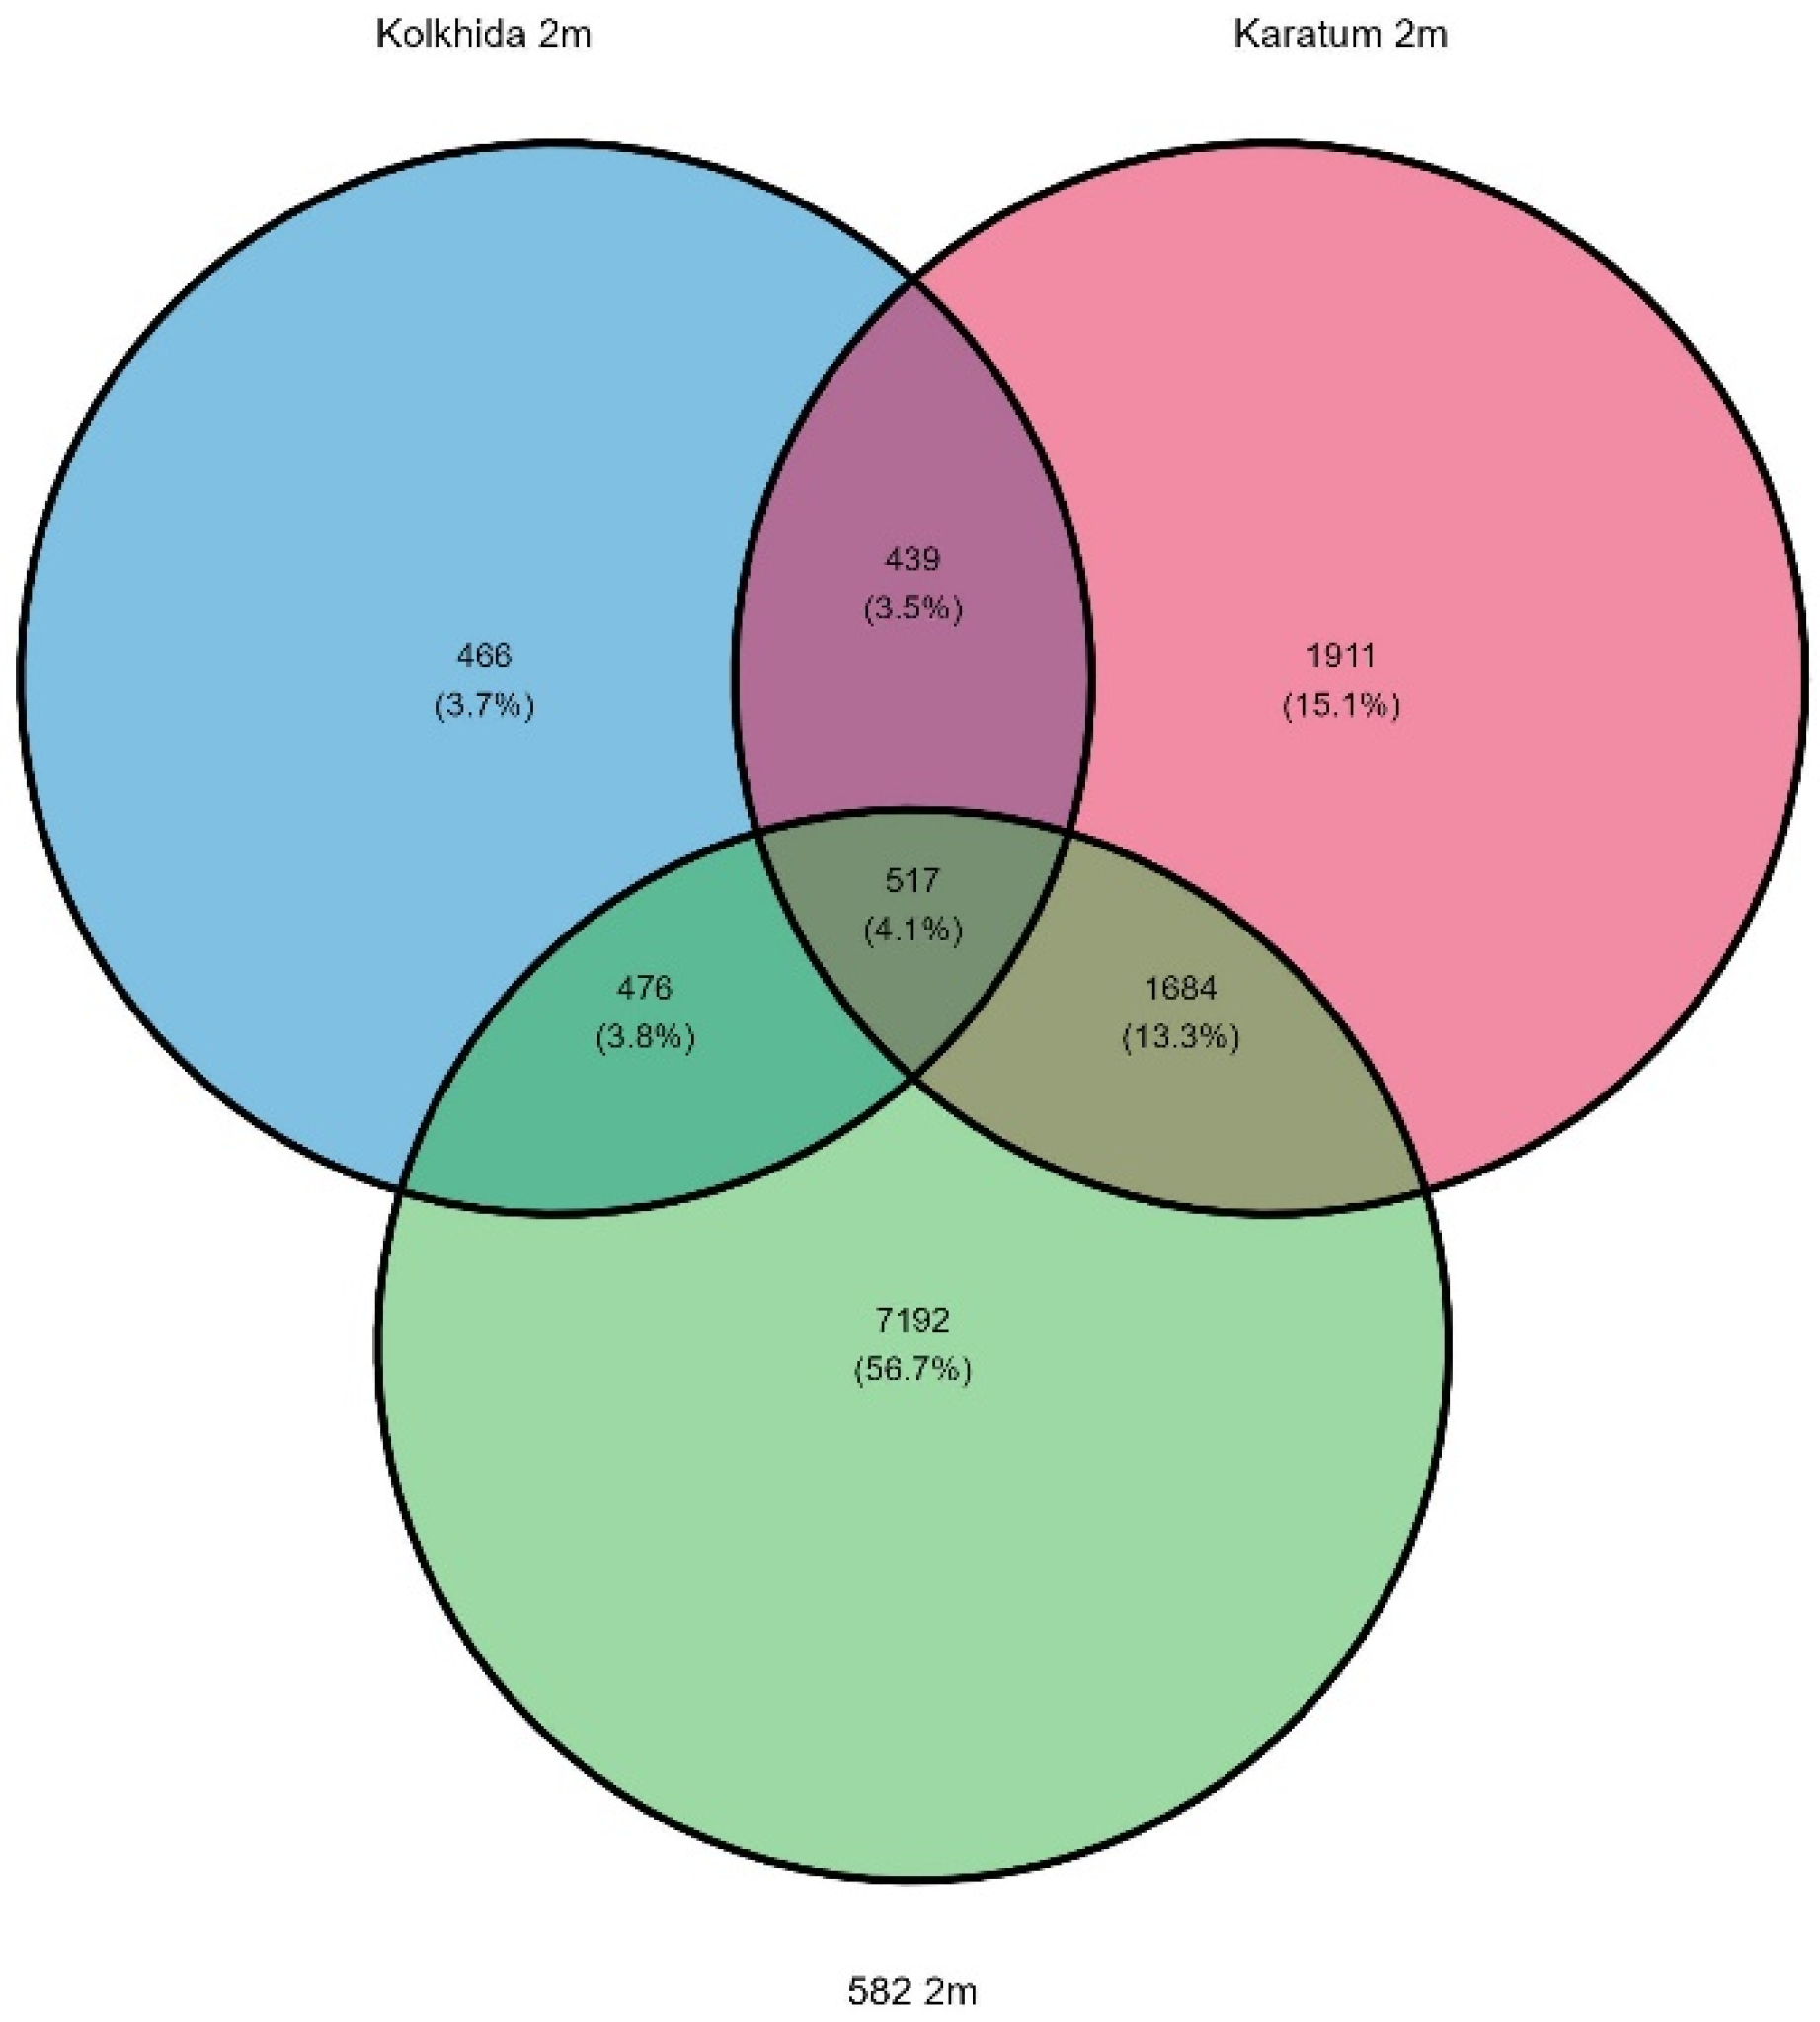
Bioinformatic analysis identified 1898 DEGs in ‘Kolkhida’ (883 downregulated and 1015 upregulated), 4551 in ‘Karatum’ (2922 downregulated and 1629 upregulated), and 9869 in cultivar #582 (4487 downregulated and 5382 upregulated). Venn analysis showed that 4.1% of DEGs were shared by all three cultivars. DEGs shared by ‘Karatum’ and cultivar #582 accounted for 13.3%, whereas cultivar #582 had the largest proportion of unique DEGs (56.7%; Figure 3).
Figure 3.
Unique and shared DEGs identified within each tea cultivar after two months of nitrogen deficiency in vitro.
3.3. Enriched Gene Ontology and KEGG Categories
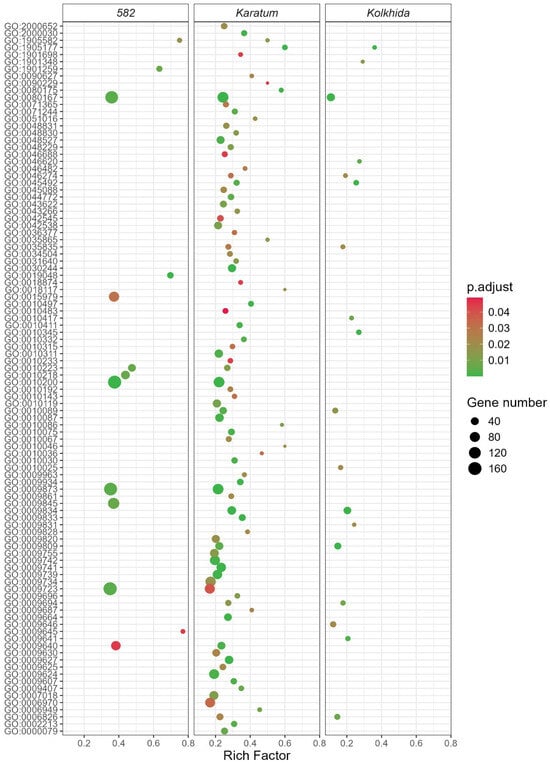
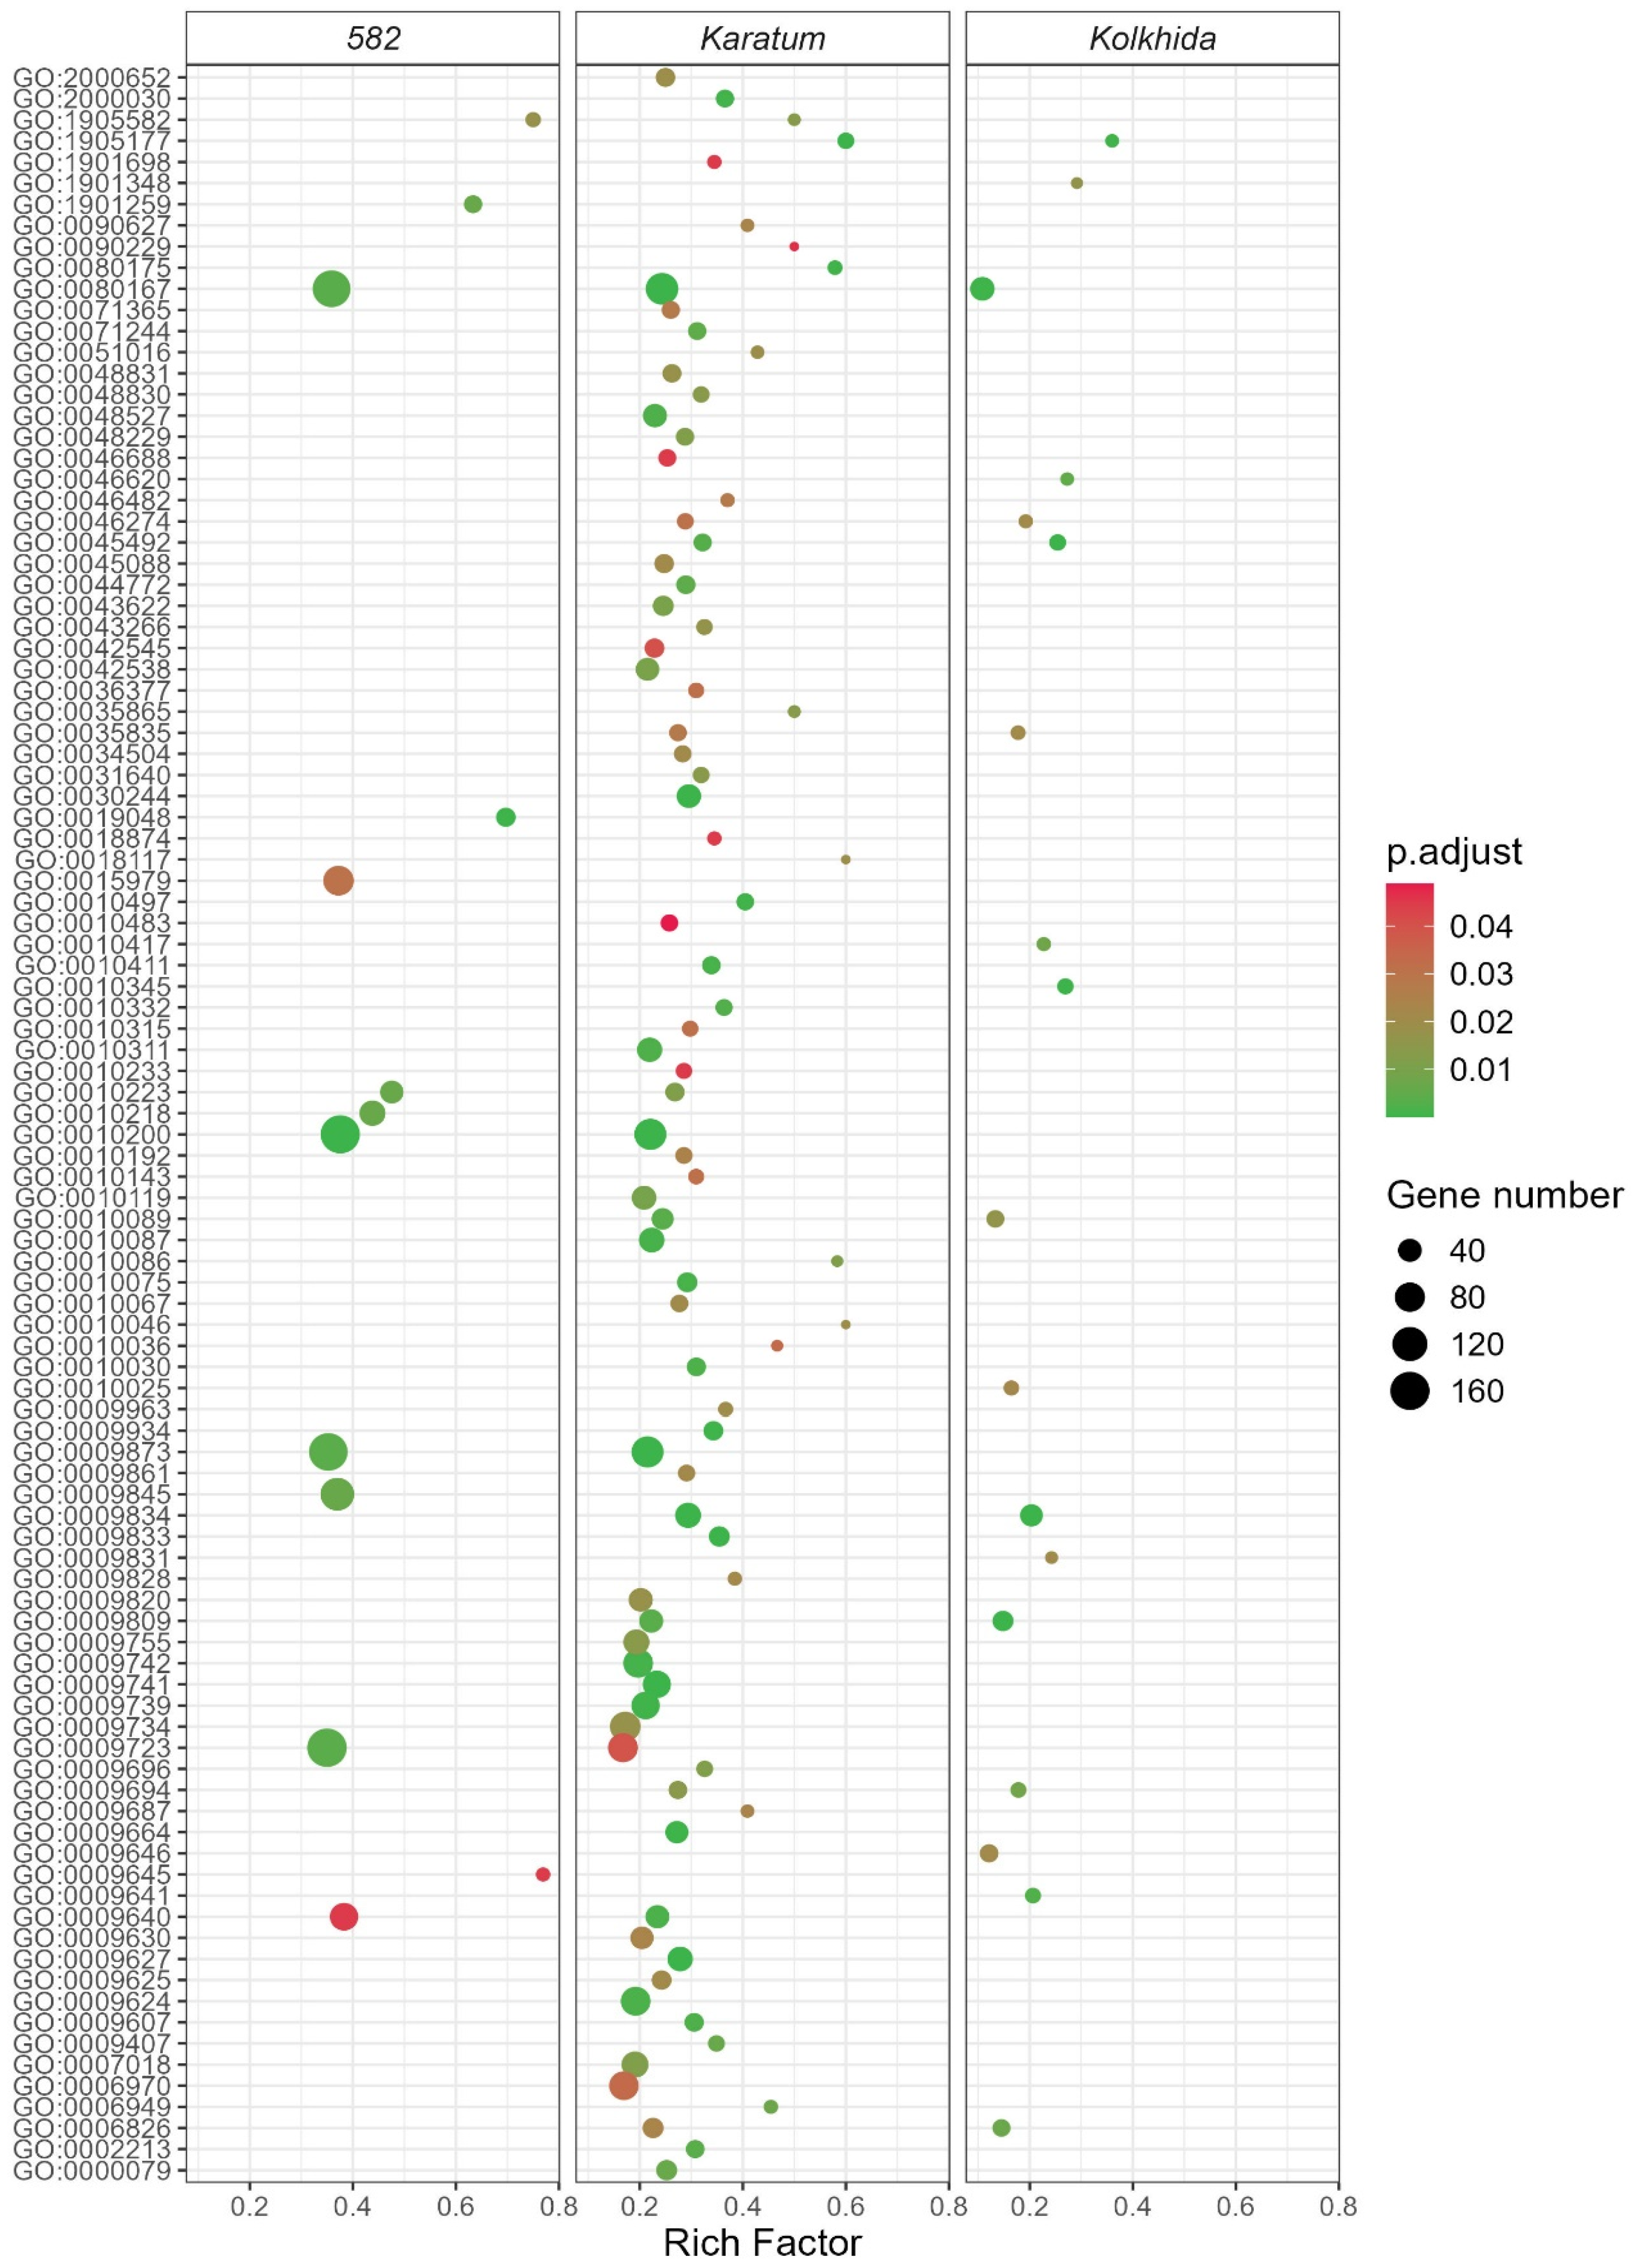
Thirty-seven significantly enriched GO categories were identified in ‘Kolkhida’. Oxidoreductase activity (GO:0016705 and GO:0016709) and copper-ion binding (GO:0005507) predominated among molecular functions, whereas response to karrikin (GO:0080167), plant-type secondary cell-wall biogenesis (GO:0009834), and lignin biosynthesis (GO:0009809) were prominent biological processes. In cultivar #582, 25 GO categories were detected; thylakoid (GO:0009579), chloroplast thylakoid (GO:0009534), and plant-type vacuole (GO:0000325) were leading cellular components, while responses to ethylene (GO:0009723), chitin (GO:0010200), and karrikin (GO:0080167) were leading biological processes. In ‘Karatum’, 134 GO categories were identified, including responses to karrikin, chitin, and ethylene, and ethylene- and auxin-activated signaling pathways (Figure 4).
Figure 4.
Biological-process GO terms significantly enriched among DEGs under nitrogen deficiency in calluses of three Camellia sinensis cultivars.
The only significantly enriched biological-process term common to all three cultivars was “response to karrikin” (GO:0080167). Galactose metabolism (ko00052) was the only KEGG pathway shared by all cultivars. Cyanoamino-acid metabolism (ko00460) was shared by ‘Kolkhida’ and ‘Karatum’; other glycan degradation (ko00511) and glycosphingolipid biosynthesis—ganglio series (ko00604) were shared by ‘Karatum’ and cultivar #582; and amino-sugar and nucleotide-sugar metabolism (ko00520), alanine, aspartate and glutamate metabolism (ko00250), and plant circadian rhythm (ko04712) were shared by ‘Kolkhida’ and cultivar #582.
3.4. Genes of the Flavonoid Pathway, Caffeine and L-Theanine Metabolism
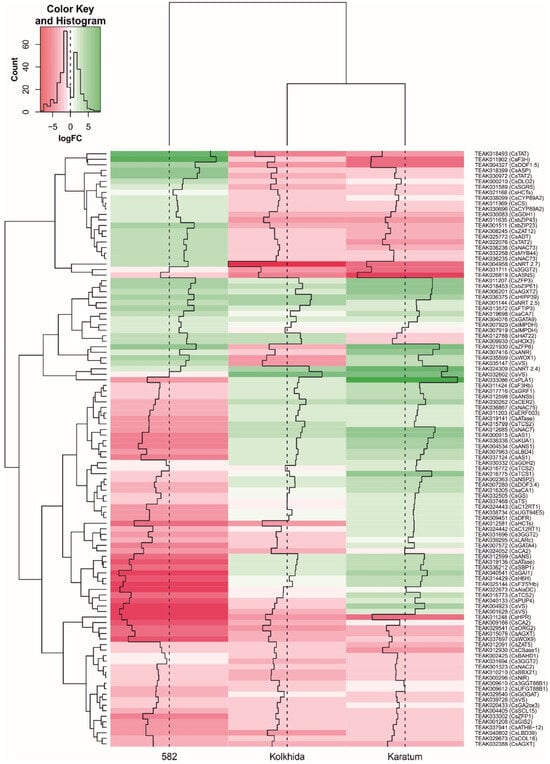
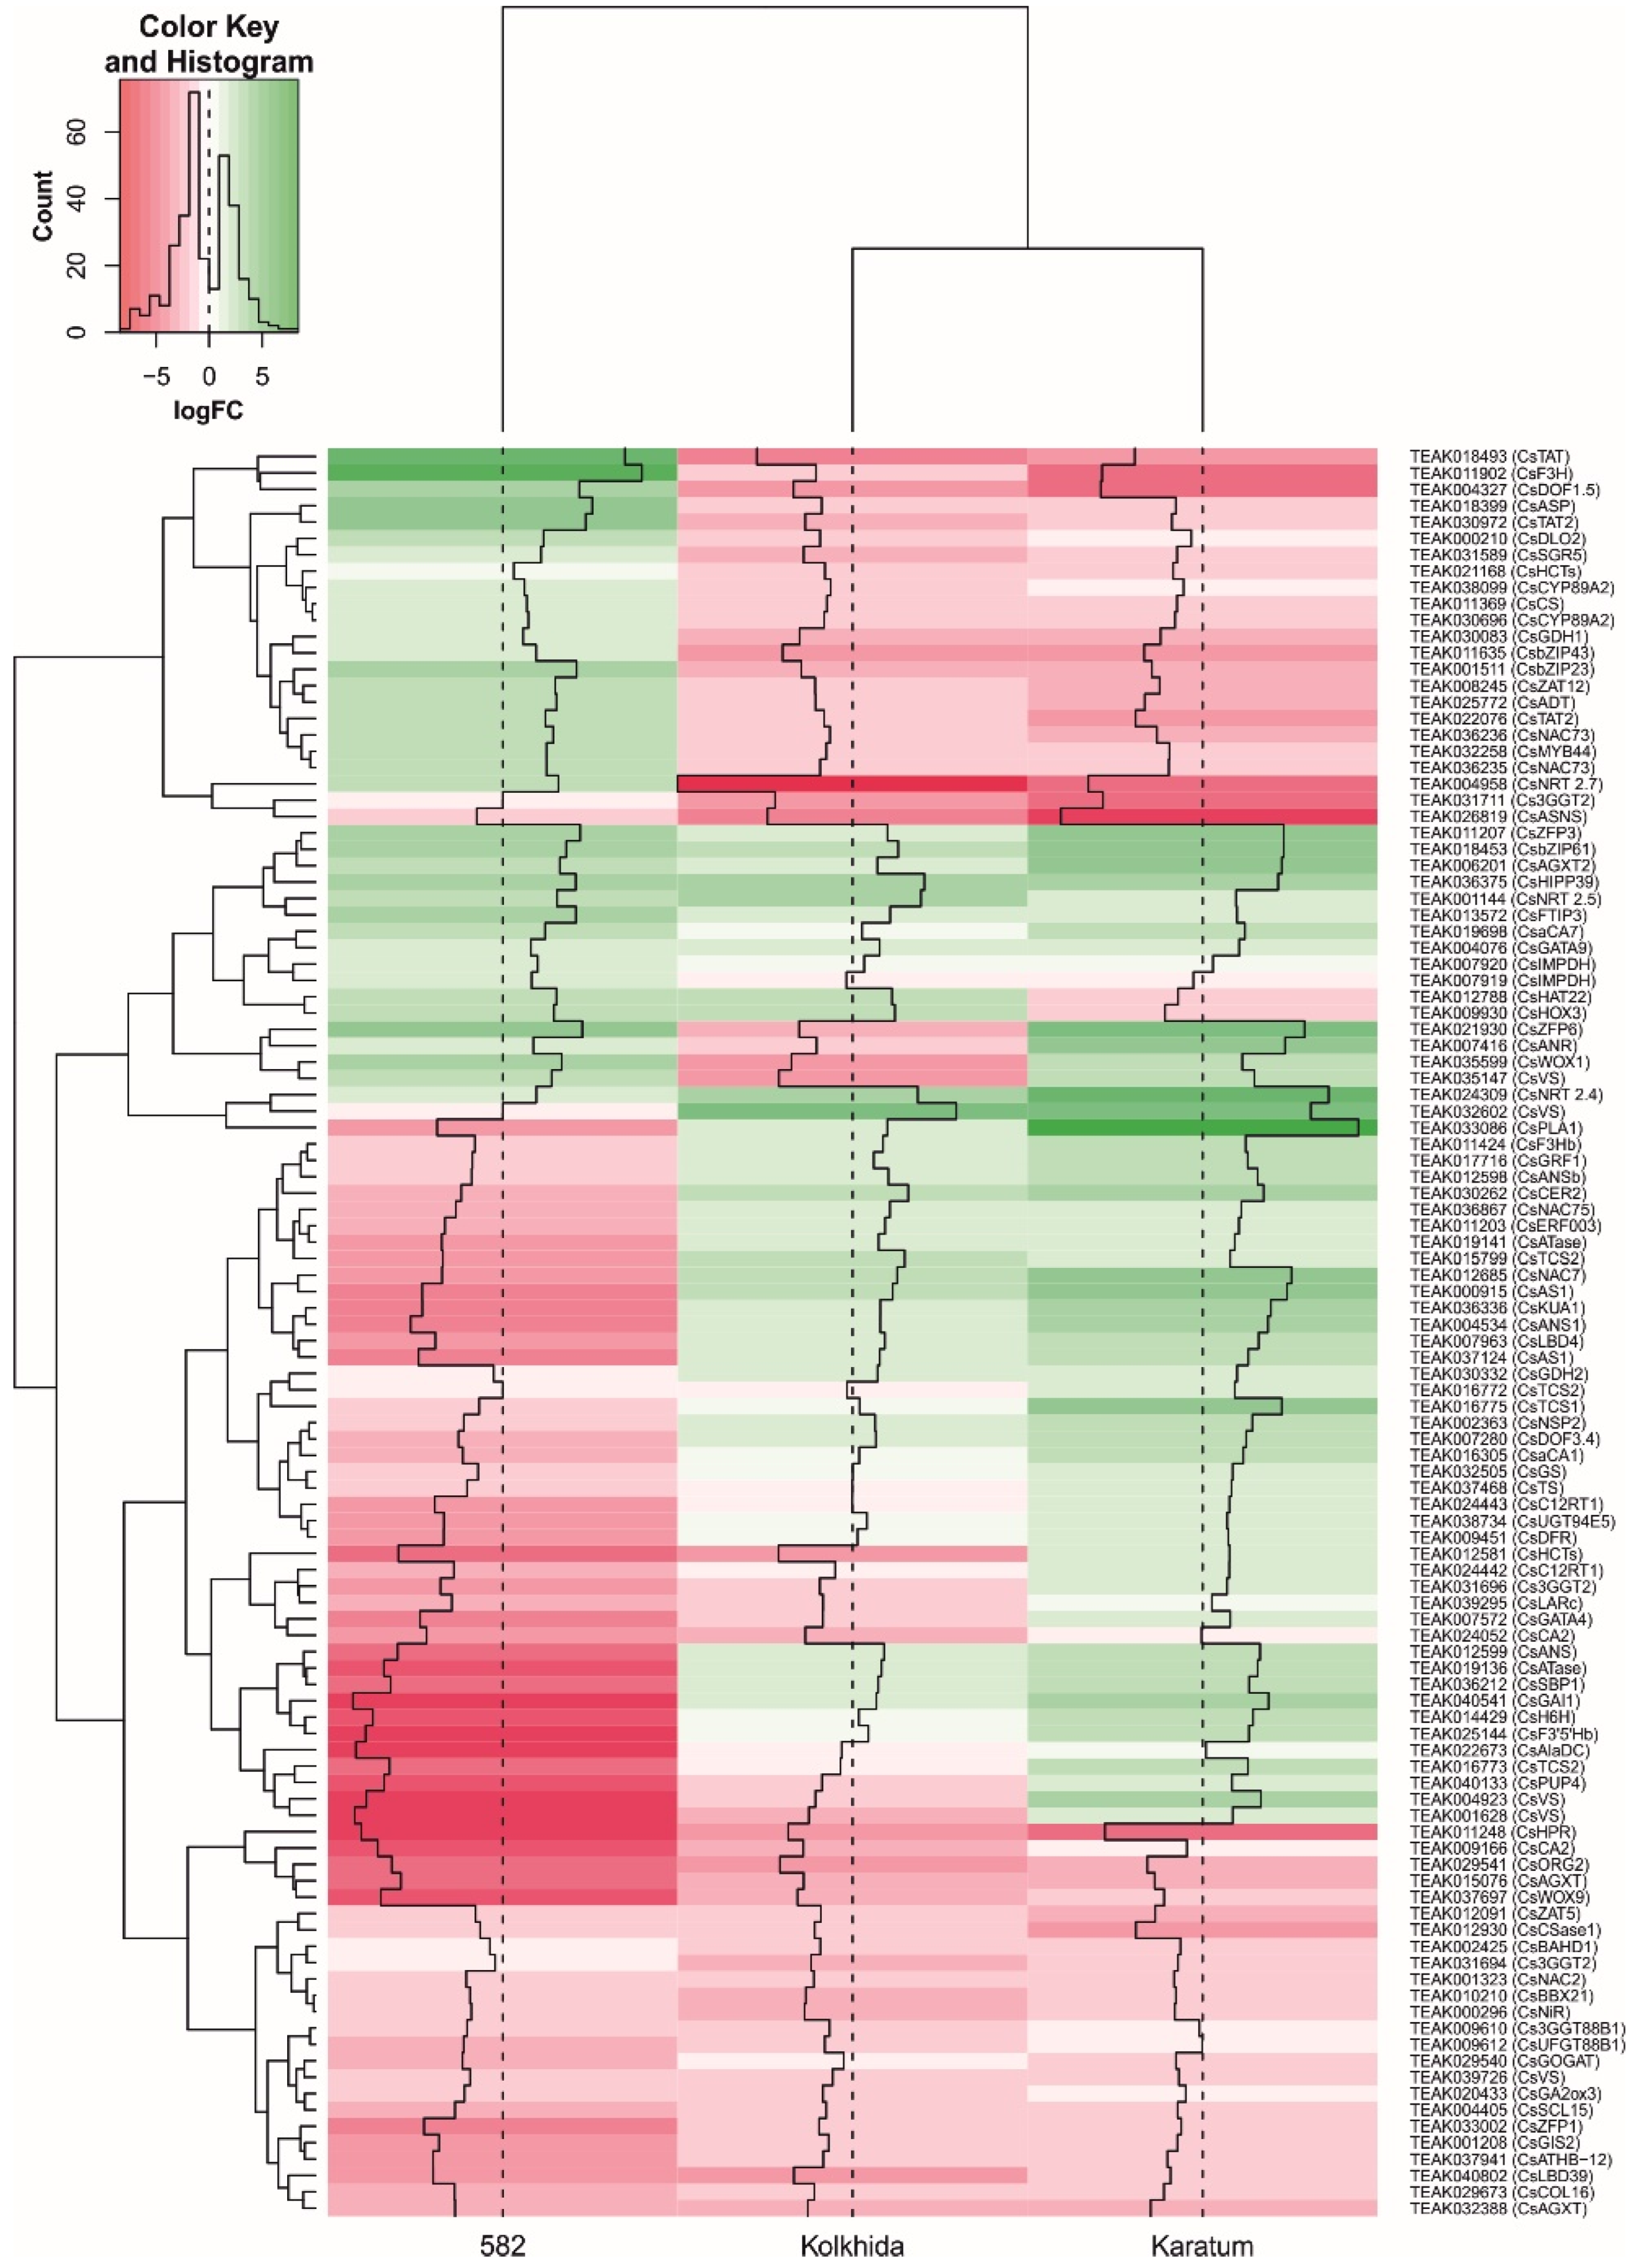
In the flavonoid-biosynthesis pathway (ko00941), differential expression was detected for CsF3′5′H, CsF3H, CsANS, CsLAR, CsANR, CsDFR, CsVS, CsBAHD1, Cs3GGTs, CsHCTs, CsH6H, CsGA2ox3, CsC12RT1, CsCER2, CsUGT94E5, CsDLO2, and CsUFGT88B1 (Figure 5). Functional names and annotation-based definitions of the gene symbols used in this section are provided in Table A2 (Appendix B). In all cultivars, expression of transferase genes CsBAHD1, Cs3GGTs, CsHCTs, and CsUFGT88B1, together with CsGA2ox3 and CsLAR, decreased. Key phenylpropanoid and flavonoid genes CsF3′5′H, CsF3H, and CsANS were induced 2.5–8.7-fold in ‘Kolkhida’ and ‘Karatum’ but downregulated in cultivar #582. CsANR and CsDFR also showed cultivar-specific directions: both were upregulated in ‘Karatum’, CsANR was downregulated in ‘Kolkhida’, and CsDFR was downregulated in cultivar #582. Transcript abundance of individual enzymes therefore did not map directly onto final catechin-group accumulation.
Figure 5.
Heat map of relative expression of selected DEGs in Camellia sinensis callus cultures under nitrogen deficiency in vitro. The color scale shows log2 fold change for N− versus N+; positive values indicate induction and negative values indicate repression. Dendrograms show hierarchical clustering.
In caffeine metabolism (ko00232), significant changes were detected for CsCYP89A2s, CsIMPDH, CsTCS1, and CsTCS2. ‘Kolkhida’ calluses showed reduced CsCYP89A2s expression and increased expression of a caffeine-synthase-like gene, CsTCS2. Cultivar #582 showed the opposite profile: CsTCS2 expression decreased, whereas CsCYP89A2s and CsIMPDH expression increased. Caffeine content changed little in ‘Karatum’, consistent with its more balanced transcript profile in this pathway.
Because KEGG lacks a dedicated L-theanine-biosynthesis pathway, related genes were examined through alanine, aspartate and glutamate metabolism, amino-acid biosynthesis, and nitrogen metabolism. All cultivars showed increased expression of CsAGT2, CsHIPP39, and CsFTIP3 and decreased expression of CsSGT, CsHPR, CsCys1, and CsASNs. In ‘Kolkhida’ and ‘Karatum’, CsASP, CsCS, CsTAT, CsTAT2, and CsADT were downregulated, whereas in cultivar #582 these genes were upregulated 4.1–58.0-fold. This opposite direction is consistent with the significant L-theanine decrease in ‘Kolkhida’ and ‘Karatum’ and the absence of a significant decrease in cultivar #582. It suggests preservation of amino-acid metabolic transcription in cultivar #582, but does not establish equivalent nitrogen depletion because total nitrogen was not measured in this cultivar.
In response to nitrogen deficiency, transcription factors from 53 families changed their expression, including bHLH, bZIP, C2H2, G2-like, MYB, NAC, and WRKY. In all cultivars, expression of CsGIS2, CsZFP1, CsZAT5, CsNAC2, CsSCL15, CsLBD39, CsATHB-12, CsBBX21, CsORG2, CsCOL16, and CsWOX9 decreased. Increased expression was characteristic of CsZFP3, CsbZIP61, and CsGATA9, especially in ‘Karatum’. Several factors showed opposite profiles between cultivar #582 and the two cultivars: CsAS1, CsKUA1, CsNAC7, CsNAC75, CsNSP2, CsGAI1, CsDOF3.4, CsLBD4, CsERF003, CsGRF1, and CsSBP1 were upregulated in ‘Kolkhida’ and ‘Karatum’ but downregulated in #582; the opposite pattern was observed for CsMYB44, CsSGR5, CsZAT12, CsNAC73, CsbZIP23, CsbZIP43, and CsDOF1.5.
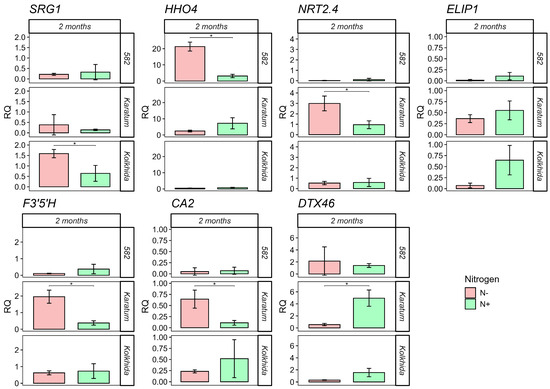
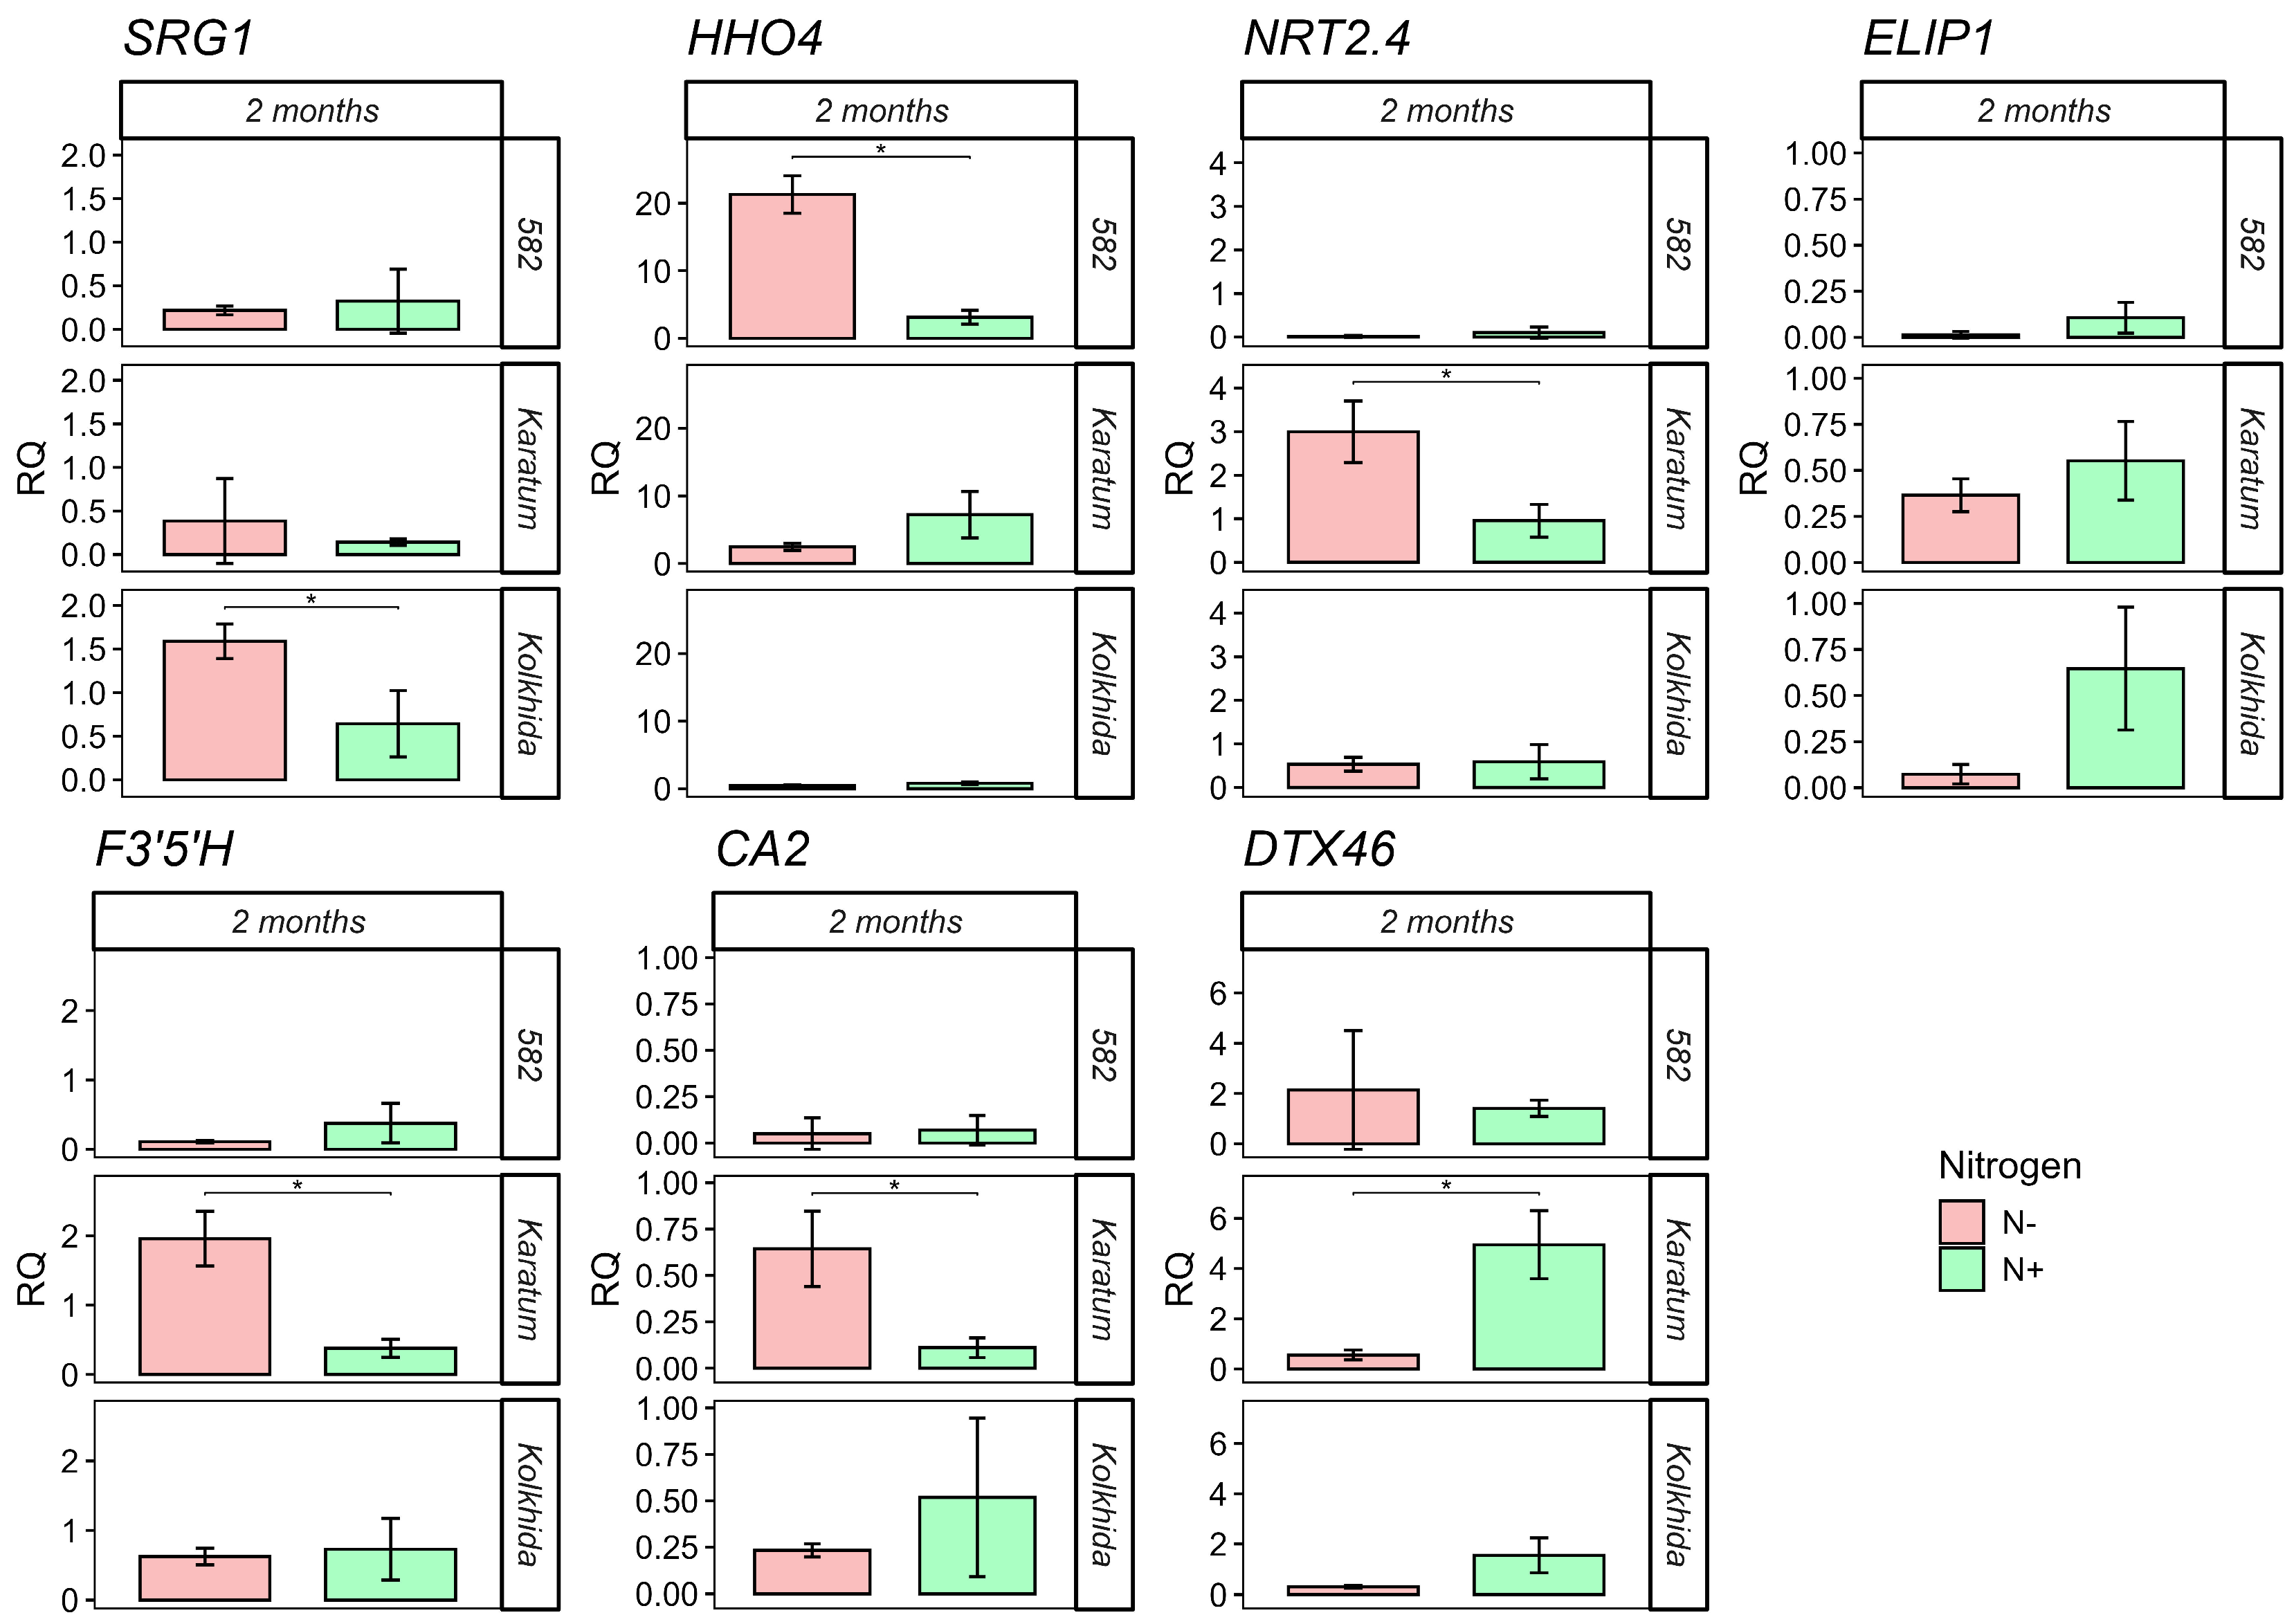
RT-qPCR was used to validate seven RNA-seq-identified genes representing photosynthesis and chloroplast stress (CsELIP1, CsCA2), flavonoid and stress regulation (CsF3′5′H, CsbZIP61), membrane transport and detoxification (CsDTX46), caffeine synthesis (CsTCS2), and amino acid metabolism (CsTAT2) (Figure 6). RT-qPCR confirmed the direction of expression change identified by RNA-seq.
Figure 6.
Relative expression of selected RNA-seq-identified genes in Camellia sinensis callus cultures. For each cultivar, a higher relative quantity (RQ) under N− than under N+ indicates induction by nitrogen deficiency, whereas a lower RQ indicates repression. Error bars show standard deviations. Asterisks indicate significant N− versus N+ differences in Student’s t-test at * p < 0.05.
4. Discussion
The present callus experiment complements the earlier in vitro versus in vivo study of tea nitrogen deficiency by focusing on undifferentiated cell masses from three cultivars [6]. Removing roots, vascular transport, and organ-specific source–sink relations helps expose cell-autonomous transcriptional and metabolic responses, but also limits biological extrapolation. L-theanine is synthesized predominantly in roots and transported to shoots, whereas caffeine biosynthesis is strongest in young leaves [22,23,24,25]. Callus is additionally dependent on exogenous sucrose and may acquire somaclonal genetic or epigenetic variation during prolonged culture [9,10]. The metabolite levels and cultivar rankings observed here therefore describe the tested callus system and should not be assumed to predict whole-plant performance in soil.
The shared GO term “response to karrikin” should not be interpreted as evidence that calluses encountered smoke-derived karrikins. In canonical signaling, ligand perception by KARRIKIN INSENSITIVE 2 (KAI2) recruits the F-box protein MORE AXILLARY GROWTH 2 (MAX2) and promotes proteasomal removal of SMAX1/SMXL repressors, thereby altering transcription and developmental programs relevant to root and root-hair traits [26]. KAI2 signaling also contributes to drought resistance through effects on cuticle formation, stomatal closure, membrane integrity, and anthocyanin biosynthesis [27]. Thus, enrichment of GO:0080167 in all three callus cultivars is more plausibly a general butenolide/stress-regulatory module overlapping detoxification, photoprotection, hormone signaling, and specialized metabolism than a nitrogen-deficiency-specific signature. The shared genes CsDTX40, CsELIP1, CsDAD2, CsBBX21, and CsGSTU17 remain candidates for functional testing, but the GO term alone does not establish causality.
The cultivars differed sharply in the balance between biochemical change and transcriptomic remodeling. ‘Kolkhida’ had the fewest DEGs but the strongest losses of L-theanine, caffeine, and simple catechins, suggesting that cell-wall and lignification responses did not compensate for deterioration of specialized metabolism. ‘Karatum’ showed an intermediate pattern, with reduced L-theanine but increased simple and gallated catechins and induction of several flavonoid-pathway genes. Cultivar #582 showed the largest DEG set and comparatively stable measured metabolites, consistent with extensive transcriptional remodeling. However, total nitrogen was not determined in cultivar #582, so a lower effective degree of nitrogen depletion cannot be excluded. Its response should therefore be described as the greatest biochemical stability and most extensive transcriptomic remodeling under the tested in vitro conditions, not as definitive whole-plant nitrogen-deficiency tolerance. The unequal number of N− libraries and the use of the ‘Kolkhida’ reference genome further require caution when comparing DEG totals across cultivars.
Cultivar differences in CsTAT2, CsADT, CsTCS2, CsF3′5′H, CsDFR, and CsANR indicate that candidate selection should use integrated transcript, metabolite, and total-nitrogen profiles rather than a single marker. A statistically defensible screening workflow would use independently initiated callus lines, at least three independent biological replicates per condition as a minimum, repeated experiments, and a sample size justified by prospective power analysis. Candidate responses should be required to pass FDR-controlled RNA-seq analysis, RT-qPCR validation, biochemical and total-nitrogen confirmation, and finally testing in rooted plantlets and whole plants.
The two-month treatment intentionally captures chronic acclimation and cumulative metabolic consequences, not early nitrogen sensing. Earlier time points could reveal transient signaling and regulatory events that are no longer detectable after prolonged deprivation. Future studies should therefore combine an early-to-late time course with independent callus lines and matched whole-plant material. Within these limits, callus remains useful for controlled candidate-gene discovery and preliminary comparison before longer and more resource-intensive plant experiments.
5. Conclusions
Two months of nitrogen withdrawal in vitro caused visible stress symptoms, reduced total nitrogen in ‘Kolkhida’ and ‘Karatum’, and altered quality-related metabolites and gene expression in a cultivar-dependent manner. ‘Kolkhida’ showed the strongest decreases in L-theanine, caffeine, and simple catechins and was the most sensitive cultivar under the tested callus conditions. ‘Karatum’ combined reduced L-theanine with increased simple and gallated catechins. Cultivar #582 showed the greatest biochemical stability and the most extensive transcriptomic remodeling under the tested in vitro conditions; however, its apparent tolerance remains provisional because total nitrogen was not measured and only two N− RNA-seq libraries were available. Shared responses included enrichment of the “response to karrikin” category and remodeling of detoxification, photoprotection, flavonoid, caffeine, and amino-acid pathways. Tea callus is therefore a controlled discovery model for cell-autonomous candidate responses, but cultivar ranking and marker-based selection require independent callus replication, stricter sensitivity analyses, and confirmation in rooted and whole-plant systems.
Author Contributions
Conceptualization, K.A.M.; methodology, K.A.M. and L.S.M.; software, K.A.M.; validation, K.A.M.; investigation, K.A.M. and L.S.M.; resources, M.V.G., E.I.R. and A.V.R.; data curation, K.A.M.; writing—original draft preparation, K.A.M.; writing—review and editing, K.A.M., and L.V.Z.; visualization, K.A.M.; supervision, E.I.R.; funding acquisition, E.I.R. and A.V.R. All authors have read and agreed to the published version of the manuscript.
Funding
This work was supported by the Ministry of Science and Higher Education of the Russian Federation agreement nos. 075-10-2025-017 (K.A.M., L.V.Z. and E.I.R., molecular genetic studies, sequencing, and data analysis), and Russian Science Foundation (project #22-16-00058) (M.V.G. and L.S.M., bio-chemical studies). Callus cultures from an in vitro tea germplasm collection were supplied by FRC SSC RAS under program #FGRW-2024-0003, nos. 124022000093-1 (A.V.R.).
Data Availability Statement
The datasets generated during the current study were deposited into the NCBI SRA database and can be accessed with the BioProject accession number PRJNA1504564 (https://www.ncbi.nlm.nih.gov/bioproject/PRJNA1504564 (accessed on 1 September 2026).
Conflicts of Interest
The authors declare no conflicts of interest.
Abbreviations
The following abbreviations are used in this manuscript:
| BP | Biological Process |
| DEGs | Differentially Expressed Genes |
| DW | Dry Weight |
| FDR | False Discovery Rate |
| GO | Gene Ontology |
| KEGG | Kyoto Encyclopedia of Genes and Genomes |
| N | Nitrogen |
| N+ | Nitrogen-sufficient control |
| N− | Nitrogen-deficient treatment |
| RT-qPCR | Reverse-Transcription quantitative PCR |
Appendix A
Sequencing and read-assignment statistics for all RNA-seq libraries.
Table A1.
RNA-seq sequencing, alignment, and feature-assignment statistics.
Appendix B
Functional names are based on homology-based annotation of the Camellia sinensis reference genome and gene-family nomenclature. These assignments facilitate interpretation but do not constitute experimental biochemical validation of enzyme activity in callus.
Table A2.
Functional definitions of gene symbols used in Section 3.4 and the Discussion.
References
- Zeng, L.; Zhou, X.; Liao, Y.; Yang, Z. Roles of specialized metabolites in biological function and environmental adaptability of tea plant (Camellia sinensis) as a metabolite studying model. J. Adv. Res. 2021, 34, 159–171. [Google Scholar] [CrossRef] [Scilit] [PubMed]
- Ruan, J.; Haerdter, R.; Gerendás, J. Impact of nitrogen supply on carbon/nitrogen allocation: A case study on amino acids and catechins in green tea [Camellia sinensis (L.) O. Kuntze] plants. Plant Biol. 2010, 12, 724–734. [Google Scholar] [CrossRef] [Scilit] [PubMed]
- Huang, H.; Yao, Q.; Xia, E.; Gao, L. Metabolomics and transcriptomics analyses reveal nitrogen influences on the accumulation of flavonoids and amino acids in young shoots of tea plant (Camellia sinensis L.) associated with tea flavor. J. Agric. Food Chem. 2018, 66, 9828–9838. [Google Scholar] [CrossRef] [Scilit] [PubMed]
- Zhang, X.; Liu, H.; Pilon-Smits, E.; Huang, W.; Wang, P.; Wang, M.; Guo, F.; Wang, Y.; Li, R.; Zhao, H.; et al. Transcriptome-wide analysis of nitrogen-regulated genes in tea plant (Camellia sinensis L. O. Kuntze) and characterization of amino acid transporter CsCAT9.1. Plants 2020, 9, 1218. [Google Scholar] [CrossRef] [Scilit] [PubMed]
- Lin, Z.-H.; Chen, C.-S.; Zhong, Q.-S.; Ruan, Q.-C.; Chen, Z.-H.; You, X.-M.; Shan, R.-Y.; Li, X.-L. GC-TOF/MS-based metabolomic analysis reveals altered metabolic profiles in nitrogen-deficient leaves and roots of tea plants (Camellia sinensis). BMC Plant Biol. 2021, 21, 506. [Google Scholar] [CrossRef] [Scilit] [PubMed]
- Samarina, L.; Malyukova, L.; Wang, S.; Bobrovskikh, A.; Doroshkov, A.; Shkhalakhova, R.; Manakhova, K.; Koninskaya, N.; Matskiv, A.; Ryndin, A.; et al. In vitro vs. in vivo transcriptomic approach revealed core pathways of nitrogen-deficiency response in tea plant (Camellia sinensis (L.) Kuntze). Int. J. Mol. Sci. 2024, 25, 11726. [Google Scholar] [CrossRef] [Scilit] [PubMed]
- Wang, Y.; Gao, L.; Wang, Z.; Liu, Y.; Sun, M.; Yang, D.; Wei, C.; Shan, Y.; Xia, T. Light-induced expression of genes involved in phenylpropanoid biosynthetic pathways in callus of tea (Camellia sinensis (L.) O. Kuntze). Sci. Hortic. 2012, 133, 72–83. [Google Scholar] [CrossRef] [Scilit]
- Xiao, M.; Tian, Y.; Wang, Y.; Guan, Y.; Zhang, Y.; Zhang, Y.; Tao, Y.; Lan, Z.; Wang, D. Integrative analysis of transcriptomic and metabolomic profiles uncovers the mechanism of color variation in tea-plant callus. Plants 2025, 14, 1454. [Google Scholar] [CrossRef] [Scilit] [PubMed]
- Gu, X.; Fan, Z.; Wang, Y.; He, J.; Zheng, C.; Ma, H. Metabolome and transcriptome joint analysis reveals that different sucrose levels regulate the production of flavonoids and stilbenes in grape callus culture. Int. J. Mol. Sci. 2024, 25, 10398. [Google Scholar] [CrossRef] [Scilit] [PubMed]
- Stelpflug, S.C.; Eichten, S.R.; Hermanson, P.J.; Springer, N.M.; Kaeppler, S.M. Consistent and heritable alterations of DNA methylation are induced by tissue culture in maize. Genetics 2014, 198, 209–218. [Google Scholar] [CrossRef] [Scilit] [PubMed]
- Samarina, L.S.; Matskiv, A.O.; Shkhalakhova, R.M.; Koninskaya, N.G.; Hanke, M.-V.; Flachowsky, H.; Shumeev, A.N.; Manakhova, K.A.; Malyukova, L.S.; Liu, S.; et al. Genetic diversity and genome-size variability in the Russian genebank collection of tea plant [Camellia sinensis (L.) O. Kuntze]. Front. Plant Sci. 2022, 12, 800141. [Google Scholar] [CrossRef] [Scilit] [PubMed]
- Murashige, T.; Skoog, F. A revised medium for rapid growth and bio assays with tobacco tissue cultures. Physiol. Plant. 1962, 15, 473–497. [Google Scholar] [CrossRef] [Scilit]
- Ginzburg, K.; Shcheglova, G.; Vulfius, E. Accelerated method of burning soils and plants. Soil Sci. 1963, 5, 89–96. [Google Scholar]
- Samarina, L.; Wang, S.; Malyukova, L.; Bobrovskikh, A.; Doroshkov, A.; Koninskaya, N.; Shkhalakhova, R.; Matskiv, A.; Fedorina, J.; Fizikova, A.; et al. Long-term cold, freezing and drought: Overlapping and specific regulatory mechanisms and signal transduction in tea plant (Camellia sinensis (L.) Kuntze). Front. Plant Sci. 2023, 14, 1145793. [Google Scholar] [CrossRef] [Scilit] [PubMed]
- Andrews, S. FastQC: A Quality Control Tool for High Throughput Sequence Data; Version 0.11.9; Babraham Bioinformatics: Cambridge, UK, 2010; Available online: https://www.bioinformatics.babraham.ac.uk/projects/fastqc/ (accessed on 8 July 2026).
- Schubert, M.; Lindgreen, S.; Orlando, L. AdapterRemoval v2: Rapid adapter trimming, identification, and read merging. BMC Res. Notes 2016, 9, 88. [Google Scholar] [CrossRef] [Scilit] [PubMed]
- Kim, D.; Paggi, J.M.; Park, C.; Bennett, C.; Salzberg, S.L. Graph-based genome alignment and genotyping with HISAT2 and HISAT-genotype. Nat. Biotechnol. 2019, 37, 907–915. [Google Scholar] [CrossRef] [Scilit] [PubMed]
- Liao, Y.; Smyth, G.K.; Shi, W. featureCounts: An efficient general-purpose program for assigning sequence reads to genomic features. Bioinformatics 2014, 30, 923–930. [Google Scholar] [CrossRef] [Scilit] [PubMed]
- Chen, Y.; Chen, L.; Lun, A.T.L.; Baldoni, P.L.; Smyth, G.K. edgeR v4: Powerful differential analysis of sequencing data with expanded functionality and improved support for small counts and larger datasets. Nucleic Acids Res. 2025, 53, gkaf018. [Google Scholar] [CrossRef] [Scilit] [PubMed]
- Yu, G.; Wang, L.-G.; Han, Y.; He, Q.-Y. clusterProfiler: An R package for comparing biological themes among gene clusters. Omics 2012, 16, 284–287. [Google Scholar] [CrossRef] [Scilit] [PubMed]
- Livak, K.J.; Schmittgen, T.D. Analysis of relative gene-expression data using real-time quantitative PCR and the 2−ΔΔCt method. Methods 2001, 25, 402–408. [Google Scholar] [CrossRef] [Scilit] [PubMed]
- Zhang, Y.; Li, P.; She, G.; Xu, Y.; Peng, A.; Wan, X.; Zhao, J. Molecular basis of the distinct metabolic features in shoot tips and roots of tea plants (Camellia sinensis): Characterization of a MYB regulator for root theanine synthesis. J. Agric. Food Chem. 2021, 69, 3415–3429. [Google Scholar] [CrossRef] [Scilit] [PubMed]
- Li, Y.; Ogita, S.; Keya, C.A.; Ashihara, H. Expression of caffeine-biosynthesis genes in tea (Camellia sinensis). Z. Naturforsch. C 2008, 63, 267–270. [Google Scholar] [CrossRef] [Scilit] [PubMed]
- Bai, P.; Wei, K.; Wang, L.; Zhang, F.; Ruan, L.; Li, H.; Wu, L.; Cheng, H. Identification of a novel gene encoding the specialized alanine decarboxylase in tea (Camellia sinensis) plants. Molecules 2019, 24, 540. [Google Scholar] [CrossRef] [Scilit] [PubMed]
- Fujimori, N.; Suzuki, T.; Ashihara, H. Seasonal variations in biosynthetic capacity for caffeine synthesis in tea leaves. Phytochemistry 1991, 30, 2245–2248. [Google Scholar] [CrossRef] [Scilit]
- Villaécija-Aguilar, J.A.; Hamon-Josse, M.; Carbonnel, S.; Kretschmar, A.; Schmidt, C.; Dawid, C.; Bennett, T.; Gutjahr, C. SMAX1/SMXL2 regulate root and root-hair development downstream of KAI2-mediated signaling in Arabidopsis. PLoS Genet. 2019, 15, e1008327. [Google Scholar] [CrossRef] [Scilit] [PubMed]
- Li, W.; Nguyen, K.H.; Chu, H.D.; Ha, C.V.; Watanabe, Y.; Osakabe, Y.; Leyva-González, M.A.; Sato, M.; Toyooka, K.; Voges, L.; et al. The karrikin receptor KAI2 promotes drought resistance in Arabidopsis thaliana. PLoS Genet. 2017, 13, e1007076. [Google Scholar] [CrossRef] [Scilit] [PubMed]

Disclaimer/Publisher’s Note: The statements, opinions and data contained in all publications are solely those of the individual author(s) and contributor(s) and not of MDPI and/or the editor(s). MDPI and/or the editor(s) disclaim responsibility for any injury to people or property resulting from any ideas, methods, instructions or products referred to in the content. |
© 2026 by the authors. Licensee MDPI, Basel, Switzerland. This article is an open access article distributed under the terms and conditions of the Creative Commons Attribution (CC BY) license.