


Abstract
The fruit sector in Romania and, particularly, the apple production sector, is considered to have been in decline in recent decades. Changes in the behavior and consumption habits of the population, together with climate change and the increase in fruit imports, have caused shortages in this sector. Apples are regarded as a national fruit in Romania, but recently, there have been significant transformations in apple production and consumption. In order to practically observe the recorded information published in a database for this sector, we developed a questionnaire, which was completed by people in Romania. The aim of this paper was to identify the types of apple consumer profiles in Romania. The reason for choosing this specific fruit was linked to the investigated objective of the projects to which this article is related. Regarding the approached methodology, the paper focused on analyzing descriptive statistics, frequencies and clustering, by which means we designed a pattern of the apple consumer profiles in Romania. Furthermore, the profiles of respondents from two regions of Romania (South-Muntenia and South-East Regions) were explored in more detail. The findings of this research indicate a young, educated consumer profile and a distinct pattern revealed by the three clusters from the specific regions.
1. Introduction
The sustainability of agrifood systems has become increasingly challenging, especially from the perspectives of global population growth and climate change. To meet the growing demand for affordable and nutritionally safe food, policymakers need to devise strategies that promote economically, socially and ecologically sustainable agrifood systems. As it has been pointed out, “measured against the requirement that they contribute to the apprehension of the right to food, the food systems we inherited from the 20th century have failed economically, socially and environmentally” [1]. Moreover, agro-food companies use product differentiation to better reflect the goals of the targeted consumers [2]. With regard to fruit sector research, it has been found that using surveys to describe behaviors in the food sector is common. In the literature investigated for this paper, we noted interesting studies, some of which are mentioned below, conducted by authors who aimed to assess consumers’ responses based on a questionnaire and who presented their results in clusters by splitting the answers according to a common feature to better understand the specified characteristics [3]. Other researchers studied consumer behavior with regard to healthy food: their results were presented in clusters and investigated with a correlation analysis to identify the factors’ influence on consumer choices, and they also offered suggestions for future research on local sustainable development [4]. Another approach was found in a survey of 370 housewives, which measured sensory acceptability, consumption frequency and free listing by using the check-all-that-apply method (CATA) on fruits and vegetables [5]. The results of this study indicated that, “the acceptability patterns in both foods do not always correspond to their frequency of consumption. CATA question showed that factors related to habits, practicality and availability, in addition to sensory acceptability, influenced the consumption of these foods...”. Another study, based on data collected from 300 consumers via a face-to-face survey, performed a principal component analysis (PCA) in order to investigate fruit-related life habits and performed a cluster analysis regarding market segments by using the identified factors obtained from the PCA [6]. Another paper addressed the acceptance of the novelty of red-fleshed apples among those who demanded organic and high-quality foods [7]: the results indicated three types of groups and pointed out that most consumers of the sampled population were not biased against research activities producing innovative food products, whereas it was found that women were willing to pay a higher price for the increased nutritional value of red-fleshed apple fruits. The behavior of young people with regard to food was investigated in a paper which underlined that “young consumers value healthy foods and are willing to pay for them” [8]. Four consumer segments were identified among a sample of university students, with regard to their values on explicit (i.e., organic and local) and implicit (i.e., small family farms and sustainable) attributes: committed, farm-to-fork, unattached and skeptic. Another research study focused on purchase behavior and preferences for fresh apple consumption: the 169 respondents to the survey, which was conducted at an apple market special event, were asked to list apple cultivars they had purchased at the retail market and the special event, where many uncommon cultivars [9] were offered. The reasons indicated for the purchasing choices of apples were visual appearance, previous experience, taste/aroma and texture. A different approach was developed in another study where a preference map was framed, starting with the testing of new apple varieties [10]. The consumers were divided into six clusters, which were then grouped into two megaclusters. The results indicated that “in spite of the difficulties in translating preference dimensions into standard practical values for fruit quality and the fact of being a punctual measurement of consumer behavior, this preference map could have a practical use for different actors on the fruit value chain, like marketers and breeders”. Among other studies on fruit consumption literature evaluating perceptions of fruit characteristics, we noted a paper discussing awareness of quality in the apple fruit chain [11]. The findings of the research revealed that “retailers focused on packaging and correlation between quality and price, while consumers beside fruit price, focused on assortment and product placement at point of sale. This means that there are different views on quality by the different actors in the apple fruit chain”. In conclusion, we realized that surveys expressed an interesting way of identifying consumer choices. In another paper [12], young people were asked about their attitudes, preferences and behavior in regard to buying and consuming apples, resulting in the design of consumer profiles based on sociodemographic characteristics, such as gender, age and respondents’ preferences for color, taste, size, place of purchase and price. This indicates a way to link two of the consumer’s actions: consumption and purchase.
We noted a research study that considered a wider remit than only an analysis of fruit consumption [13]. The study examined consumer preferences based on the sensory analysis of the use of taste, smell, hearing, sight and tactile feeling; thus, the paper “managed not only to measure the level of consumer satisfaction, but also to classify the apple juice assortments, in relation to the intensity of the sensory characteristics that were the basis of the case study”. Clustering based on a survey is also a convenient manner of obtaining more precise results. This was the case in an interesting study where the authors used this methodology in the tourism sector [14]. Using the multidimensional scaling method and hierarchical cluster method enabled the identification of the best route for a potential touristic circuit in order to support local rural tourism. Another paper was found, dealing with the cluster methodology, which stated that “the stakeholders can intervene in an area with touristic potential to support the development of rural tourism and implement measures”, the main result of the research mentioned therefore being that clustering is useful for the development of tourism destination management plans, as it could provide better promotion and valorization of rural tourism [15]. In another article using clustering methodology, the authors presented relevant results that identified solutions for establishing organic producers’ groups and supply chains at county levels, and for “evaluating which is the best networking solution for 40 organic farmers” [16]. This statistical approach was based on multidimensional scaling and hierarchical clustering methods that allowed for the identification of three possible clusters when grouping the organic producers. Knowing that cluster analysis lends itself to several sectors and approaches, we found in the literature an article in which the authors dealt with the consumption “behavior for products obtained from Medicinal and Aromatic Plants (MAPs) and studied the segmentation of the consumers of MAPs products, according to their frequency, purpose of use and sociodemographic features” [17].
The analyses based on surveys and used as methodologies for scientific papers have been used in the agriculture field for many other products and services. Thus, there are investigations on dairy products [18], where a high percentage of the respondents admitted to being interested in buying and consuming local dairy products, even though some of them faced restrictions on accessing these products, which indicated the need to improve the flow of distribution channels. Investigation taking place during a long period of time (i.e., 3 years) in a vineyard [19] were also noticed in the appropriated literature. The aim of that study was to examine insects (i.e., the leafhopper S. titanus), with the results being an important step forward in assessing the phytosanitary risk in Romanian vineyards. A paper that highlighted the issues of small-scale farming in Ukraine was based on a questionnaire and personal interviews, which helped the authors identify the challenges in the production process and marketing that small farmers face [20]. Another paper was focused on how several vegetables are marketed in various places in the Bucharest-Ilfov Region. The analysis showed how their quality is influenced by the way they are displayed and marketed, thus underlining the interesting findings [21].
2. Materials and Methods
In the summer period of 2022, for a duration of two weeks, we conducted an online survey to explore preferences regarding apple consumption among the Romanian population. The responses were received online as part of a more extensive study on the apple production systems in Romania, which was developed in a scientific frame at the USAMV (University of Agronomic Sciences and Veterinary Medicine) of Bucharest. The methodology used in this paper consisted of a statistical approach based on the parameters obtained from the survey; this was designed to examine the patterns of apple consumption among the Romanian population. The raw results were automatically collected in a Google Sheets file, after which they were checked and cleaned in order to be processed with the SPSS software. The goal was to analyze the results through the structure of consumer classes, as identified by gender, place of residence and age. The cluster analysis was also performed, thereby connecting the frequencies from the previous part with the mapping solution to obtain cluster results.
2.1. Data Collection from Questionnaires
The online questionnaires were submitted through several online platforms and were filled out voluntarily by individuals who were mostly young people, as we mainly targeted students. Answers were received from the eight Romanian development regions: Bucharest-Ilfov, South-Muntenia, South-West, North-West, North-East, South-East, West and Center, with the highest rate of the respondents being from the Bucharest-Ilfov, South and South-West Regions. The total number of respondents was 663; however, during the database cleaning process, part of the responses were discarded as they were partly filled out or they consisted of non-apple consumer responses (52 questionnaires) resulting in 611 responses that were considered in the main analysis. Because of the imbalance between the number of respondents at the regional level and the objective of having a more diversified coverage, we chose to focus on the results from two regions: one from which we received more answers (the South-Muntenia Region in the Bucharest-Ilfov area) and another one, the South-East Region (Buzău area), from which we received fewer responses. From many points of view, the consumption profiles relatively differed between the two selected areas.
2.2. Questionnaire Structure
The questionnaire included two sections. Section 1 covered the individual respondent profile and Section 2 was on apple consumption behavior. The first section aimed to profile the respondents based on their age, gender, residence, professional status, education level and region. In the second section, the respondents were asked about their apple consumption choices (quantity, provenance, variety, type of product, preference for other fruits and advertising influence) in order to analyze individual options.
2.3. Statistical Analysis
All data were collected using Google Form functionalities, and the statistical analyses were performed using SPSS 20.0 and Microsoft Excel. The database was encoded as presented in Table 1.
Table 1.
Questionnaire framework: the codification of the variables.
The questions from Section 2 in the table above, which emphasized the consumer preference patterns, were used as variables in a cluster analysis (K-means) after visual identification of the cluster number (hierarchical bundle). The ASCAL technique was used “to visualize the clusters through multidimensional scaling (MDS)” and the hierarchical cluster technique was used “to establish the proper number of clusters”, which included the centroid linkage option [16]. The multidimensional scaling (MDS) method and, especially, the ALSCAL method are widely used for the prediction of consumer preferences [22]. For this purpose, we considered that hierarchical clustering and MDS can also be used to frame patterns and similarities in datasets and to identify homogenous groups inside datasets [23]. These methods allow us to analyze the relationship between variables and explain the similarities and differences between them [24]. Further, the ALSCAL method was applied in the cluster analysis to obtain homogeneous groups of variables by considering a combined method of hierarchical and K-means clustering [25]. The K-means cluster analysis allows grouping individuals with high similarity in a single variable, and those with high dissimilarity being assigned to the rest of the variables [26]. This cluster analysis was performed by using the K-means algorithm. The hierarchical clustering method supports a respondent’s classification into groups based on Euclidean distance [27]. After the identification of clusters, the specific responses to each cluster were computed and their main characteristics were determined in order to establish the typology of apple consumers.
3. Results and Discussion
Besides carrying out an overview of the fruit sector, the findings of this paper also shaped the consumption model at the regional level and the consumer profile. A special attention was directed on the two regions that were separately analyzed.
3.1. Findings for the Fruit Sector with a Focus on the Regional Level
According to the 2020 data from Eurostat [28], Romania ranks third (15.38%) in terms of area among the top five apple-producing European states and covers 10.81% from the total area of the 27 European states. Furthermore, Romania produced around 11.75% of the total apple production, within the first five apple-producing European countries (fourth place) and 4.54% of the total apple production over the 27 European countries. At the national level, in 2020, the number of fruit trees within the eight Romanian development regions was emphasized. This revealed a ranking where the South-Muntenia Region is in the top three, whereas the South-East Region is in sixth place, which is below the average of the eight regions; this ranking is also valid for the private sector, which has special characteristics in Romania. Next, we focused on the average quarterly quantities of fruit bought in a month by a household, expressed in kg/person, during 2021. Here, the situation is different from what was exposed above for the two considered areas. Thus, in the South-East Region, the quantities of fruit purchased are above the national average, while in the South-Muntenia Region it is below average. A special situation is recorded in the Bucharest area, where the analyzed indicator has the highest value. At the same time, a more detailed analyse revealed a tendency to buy more fruits during the second half of the year. Regarding the consumption of fruits (especially apples) at the national level over the last 10 years, an increasing trend has been registered. By comparing the data from 2010 to the ones from 2021, we found an increase by 61% in total fruit consumption and by 30% in apple consumption, in particular [29].
Referring to the yield per fruit tree at the national level, there are three regions out of the eight that are above average, namely, the South-Muntenia, South-West Oltenia and North-East Regions [29], whereas the South-East Region is below this level.
Regarding consumption, the annual average apple consumption per capita was 29 kg in 2020, which would be around 1.2 kg per person every month. In the North-East and South-East Regions, people purchased around 65% of their apples from different commercial sources, whereas the percentage increased to 85% in the South and West Regions of Romania. Since Romania imports apples (over 86 thousand tons in 2020), a large part of Romanian apple production is usually transformed into juices, alcoholic drinks or cider. At the same time, fruit prices do not necessarily follow the dynamics of production and harvest periods. That is, during the harvest periods, the price of apples decreases without necessarily increasing afterwards. The prices also follow a certain pattern of consumption or food habits of the local population. However, the winter period is peculiar, as the quantities of imported fruits is higher, which is reflected by a decrease in the price of apples; these are perceived as fruits produced mainly in our country, and thus, being easier to find on the local market. Meanwhile, it should be noticed that, regardless the dynamics on the market, the producers’ apple prices have not varied substantially in the last period, which is also a reason for a certain decrease in domestic apple production.
3.2. Results and Discussion on Apple Consumer Patterns Derived from the Survey
The survey respondents were mainly located in the southern regions of Romania, with 39.6% from the South-West Region, 25.4% from the South Region, 21.9% from the Bucharest-Ilfov Region and 7% from the South-East Region. The total sample (n = 611) included 58.9% male, 65.6% persons from urban areas, 61.7% persons who work in the private sector and 54.5% persons with a university level of education (Table 2).
Table 2.
Frequencies within the individual characteristics among the eight regions in Romania (%).
The samples from the four previously mentioned Romanian regions (which comprise almost 94% of the respondents) present structural differences. In the South-West Region (242 respondents), there were mainly young respondents between 20–39 years old (around 70%) and a higher percentage of males (almost 53%), in addition to persons who work in the private sector (almost 68%) and have a high school degree (62.2%). Meanwhile, there was a high percentage of young people who have the status of student and employee (33%), whereas 28.9% have a status of only being an employee and 22.7% a status of only being a student. The respondents from the South Region had a similar structure, but with a higher percentage of people between 20 and 29 years old (45.8%), and a higher percentage of persons with the status of employees (34.2%) and students (31.0%). In the South-East Region there were only 43 respondents, with 60.5% of them aged between 20 and 29 years old. The main characteristics of the respondents were: 60.5% female, 67.5% live in urban areas, 72.1% work in the private sector and 79.1% have a university degree. They are employees (32.6%), students (25.6%) or have both statuses (20.9%). The sample from the Bucharest-Ilfov Region is similar to the South-East Region, but with higher percentages of females (75.4%), urban residents (82.1%), university graduates (82.8%) and employees (56.7%).
Next, the focus was on the evaluation of the association and correlation between the answers in the questionnaire. The degree of association was evaluated using the bivariate correlation method, which allows us to generate the Pearson correlation indicator (r; Bravais–Pearson correlation coefficient). For the analyzed variables, we stated the null hypothesis H0, by which we accept that there is no association between them when applying the chi-square test; after which, the Pearson coefficient (r) was calculated to determine the direction and intensity of the correlation between the variables. Thus, in table below (Table 3) the values of the chi-square test and the significance value (Asymp. Sig, two-sided) are listed.
Table 3.
The χ2 contingency coefficient (chi-square tests) and the Pearson correlation coefficient between the main variables.
In the table above, five significative correlations and ten highly significative correlations were highlighted. For instance, the correlation coefficient between “Region and Purpose” (0.086) reflects a direct, very weak link, and the sig. value, corresponding to the t-test (equal to 0.03), reflects a statistically significant correlation (means is below 0.05). Meanwhile, the respective frequencies reveal that in the southern regions of Romania, apples are consumed mostly as a dessert at a rate of almost 40% in the South, South-East and South-West Regions, and at a rate of 52.3% in the Bucharest-Ilfov Region. In other regions, apples are also consumed for diet purposes (for example, 23.1% in the North-West Region) or to obtain juices or alcoholic beverages (for example, 58.3% in North-East Region). There are also several other points to be emphasized:
- The variable “Age” has a weak, but positive, correlation with “Quantity” and “Preference (other fruits)”and a negative correlation with “Preference (health)” (significance threshold below 0.01). The importance of apples for health increases with age, as it increases from 76.9% for people under 19 years old to 100% for people over 50 years old. Additionally, an opposite situation was observed in frequencies regarding the consumption of apples, with 69% of young people preferring other fruits compared with only 25% of people over 50 years old preferring other fruits. By analyzing the number of consumed apples, it was noticed that most young people under 29 years old (60–70%) eat between 1–3 apples per week, compared to people over 50 years old, who consume over 7 apples per week, which is a proportion of over 45%.
- The investigation based on gender reveals that women are much more aware of the benefits of apples for human health and also have a higher tendency to consume apples in their diets or as part of the main meal. The correlation coefficients with the variable “Preference (health)” are positive and weak (0.158) and with the variable “Purpose” are negative, weak (−0.113) and very significant (p < 0.01).
- The place of residence has a weak correlation (at a 0.01 level of significance) with “Preference (health)” and “Advertising influence on consumption”. In total, 65% of rural people compared with only 45% of urban inhabitants are influenced by advertising, but they are slightly less informed about the importance of eating apples for their health.
- The variable “Sector” has a positive and weak correlation with “Quantity” and “Advertising influence on consumption” at a level of significance of 0.01 and 0.05, respectively. The analysis of frequencies reveals that the percentage of people from the private sector who consume over four apples per week is lower (47.8% compared with 55.6%). However, the people from our sample who work in the public sector are older and more influenced by advertising; therefore, the answers can be distorted by these aspects.
- The variable “Education” has a positive and weak correlation with “Quantity” and “Product type”, with a level of significance of 0.01. The results reveal that the consumption of apples increases as the level of education increases, which is possibly due to a higher understanding of their benefits; however, we also observed a higher percent of people with a university level of education who consume processed products, which is possibly due to a lack of time.
3.3. Results and Discussion on the Cluster Analysis
Apple consumption in Romania is mainly differentiated based on age and usually depends on the origin of the fruits, the variety, the form and the reason for consumption. The results indicate three clusters of types of consumers:
- -
- The first cluster, cluster 1 (which represents 48.1% of the total sample), comprises people which consume only 1–3 apples per week that are bought mainly from farmer’s markets (33%) and supermarkets. They prefer Romanian varieties (almost 60% from the sample) and fresh products (87%). The respondents come from the South and South-West Regions (around 65%) and partially from the Bucharest-Ilfov Region (23%). Here, the respondents are rather older than in the other clusters, and half of them have only a high school degree; most of them are women from urban areas, with a status of employee or student.
- -
- The second cluster, cluster 2 (which represents 37.5% of the total sample), comprises people under 40 years old (about 68%), especially women from urban areas who eat over 4 apples per week. These respondents come mostly from the South-West Region (53.7%). They buy apples from farmer’s markets and supermarkets, usually Golden Delicious and Jonathan. Most of them eat fresh fruits, which are mainly apples, and around 57% are influenced by advertising.
- -
- The last cluster, cluster 3, covers only 14.4% of respondents from the sample and includes respondents aged over 30 years old, who are mainly women (around 66%) from urban areas and who are employees and/or students (around 85%). These data reflect the consumption om the Bucharest-Ilfov Region (32%) and the other three southern regions (57%), but a specific consumption pattern was not identified. People in this cluster buy from different sources and are not concerned about the source of the products (32% buy from any place, 9% do not pay attention to the producer’s country, 40% do not look at the variety of apple and almost 30% eat apples in any form); however, they declare that apples are their favorite fruit (61.4%).
This study confirms and integrates other research carried out in Romania. For instance, a study regarding apple markets indicated that the most consumed fruits in Romania are apples and that the majority of consumers buy them from supermarkets [30]. In our research, a difference in age was pointed out in regard to the preference for apples and the preference to buy from supermarkets and from farmer’s markets. Other papers indicate that Romania has the capacity to produce over 90% of the domestic apple consumption, but it also imports large quantities of varieties not specific to our country, [31] especially considering that Golden Delicious, Jonathan and Florina are the most consumed types in Romania [32,33]. Usually, the respondents preferred Romanian apples and, as cultivars, Golden Delicious and Jonathan.
The hierarchical cluster analysis allowed us to group the respondents in clusters based on the categories of questions specified in Table 1. The clustering solution was tested based on multidimensional scaling (the ALSCAL method), and the two-dimensional configuration revealed the possibility to group the responses into three clusters. By applying the K-means option, the following clusters were generated: cluster 1 (294 respondents), cluster 2 (229 respondents) and cluster 3 (88 respondents) (Table 4).
Table 4.
Cluster characteristics (frequencies, %).
The first cluster (representing 48.1% of the total sample) can be defined by a consumption model with the following characteristics: almost 55% of respondents have a lower consumption of apples (of 1–3 per week), which they buy mainly from farmer’s markets (33%), supermarkets (25%) or their own household (18%) with specific preferences for domestic products, Romanian varieties (almost 60% from the sample) and fresh products (87%). They consume apples mainly as desserts and as a part of diets (over 60%), but prefer other fruits, too. When examining the demographic characteristics of the cluster, it might be said that these are the consumer patterns of the people from the South and South-West Regions (around 65%), and partially, from the Bucharest-Ilfov Region (23%). The respondents are older than in other clusters (37% over 40 years old), 58.5% are women, 62% are persons from urban areas, 41.8% are employees, 24.8% are students and almost 47% are persons with only a high school degree.
The second cluster (representing 37.5% of the total sample) is formed by younger respondents (almost 68% under 40 years old) who work mainly in the private sector and are from urban areas. Inside this cluster, 56.8% are women, 54.6% have a university degree, 33% are students who are working and around 30% are employees. The cluster reflects the consumption patterns of the South-West Region especially (53.7%), but also those of the South and Bucharest-Ilfov Regions (around 17% each). The consumption model of this cluster can be summarized as follows: a higher consumption of apples per week (56% consumer over 4 apples per week); apples that are bought from farmer’s markets and supermarkets (over 52% buy from these sources); 46% of the respondents prefer Golden Delicious and Jonathan apples; 78% of them eat only fresh products due to their well-known health benefits; only 42% prefer other fruits; and around 57% are influenced by advertising.
The third cluster includes 88 persons (14.4% from the total sample). It is characterized by more respondents over 30 years old, more women (around 66%) and people mostly from urban areas (67%) and who work in the public sector (45.5%). The sample consists mostly of employees and students (almost 85%) and reflects the consumption patterns of the Bucharest-Ilfov Region (32%), as well as the one from the other three southern regions (57%). They usually buy from different sources and a lower proportion are dedicated to domestic products. For instance, 32% buy from any place, 9% do not look at the production country, 40% are not concerned about the variety of apple and almost 30% eat apples in any form (fresh or processed). However, most of them declared that they are not influenced by advertising (46.6%) and more of them state that apples are their favorite fruit (61.4%).
3.4. Distances within Clusters
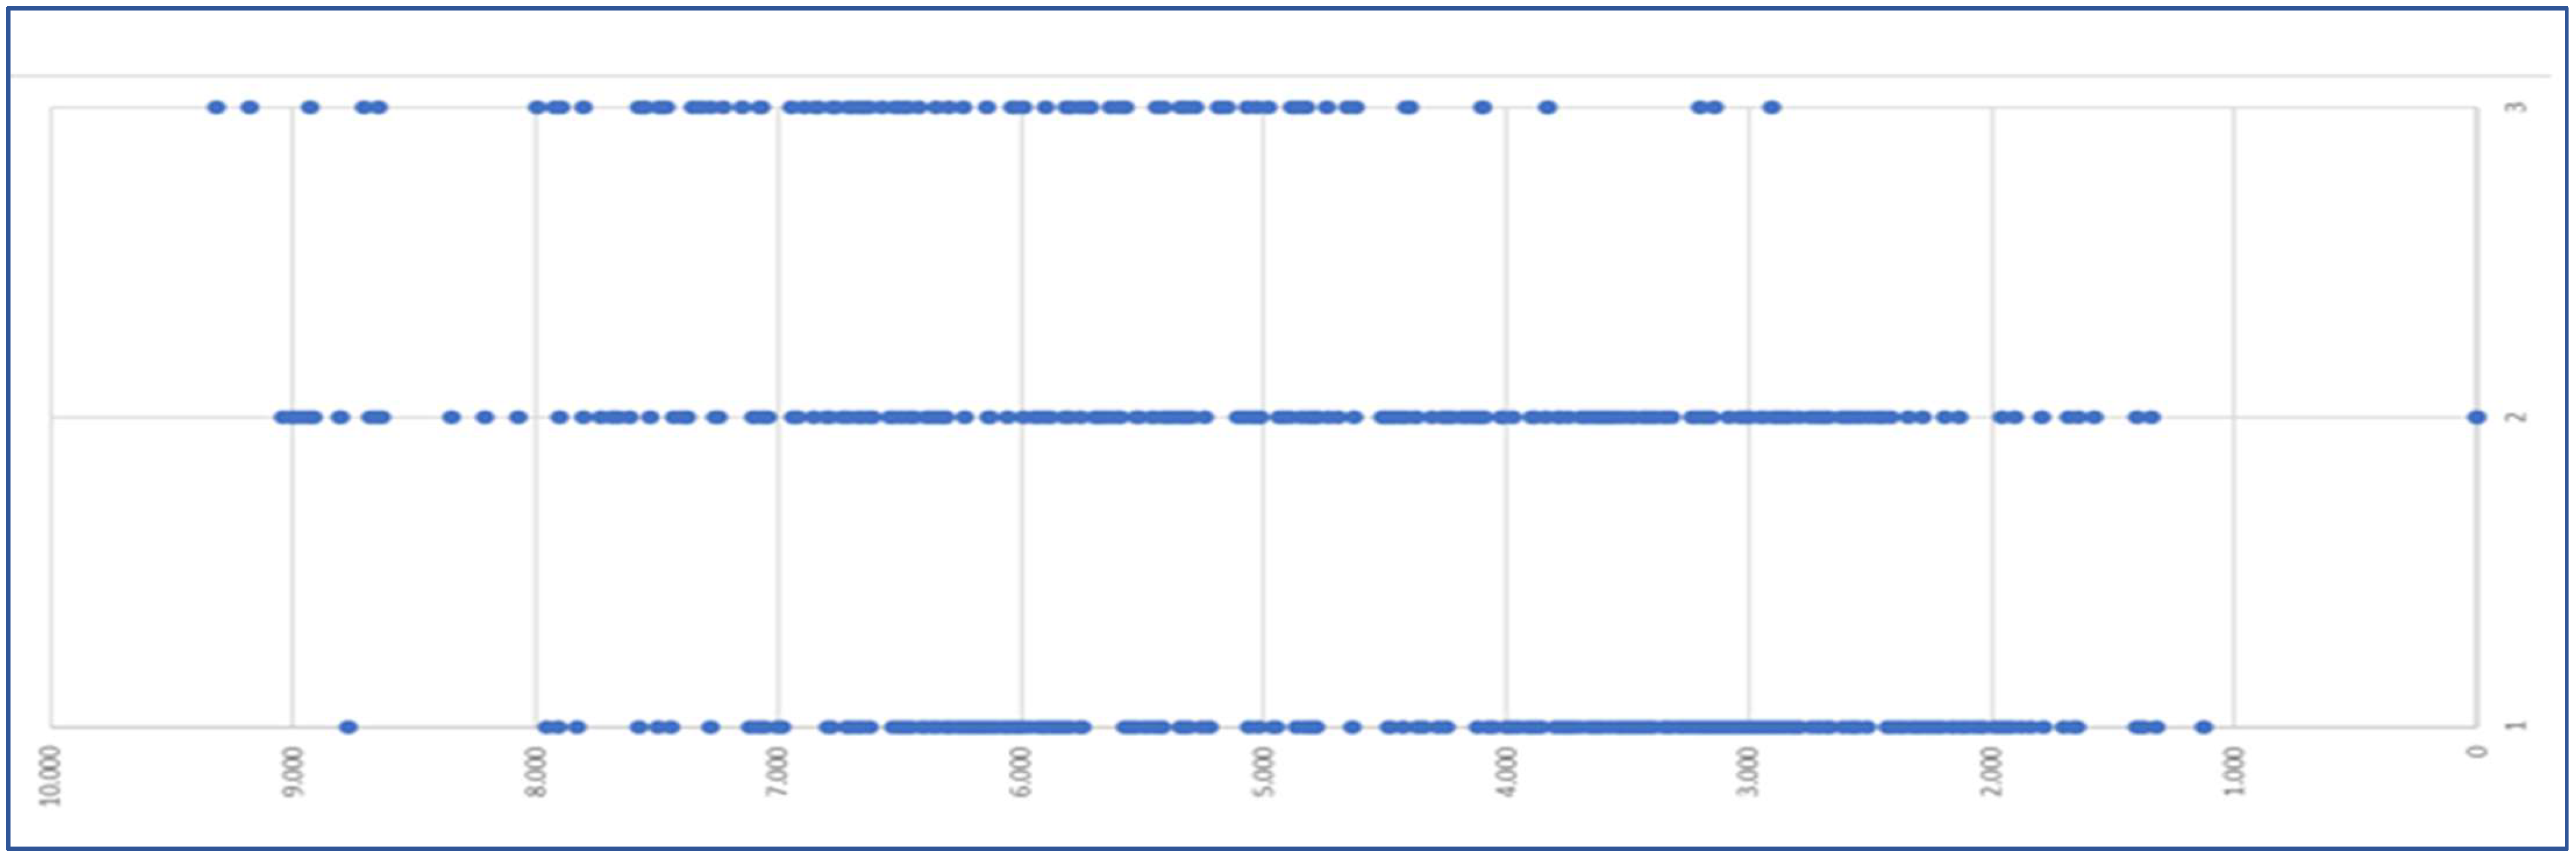
As was previously presented, the number of persons in each cluster is: 294 cases in cluster 1, 229 cases in cluster 2 and 88 cases in cluster 3. The total number of valid cases is 611. In Figure 1, the distances within clusters are presented.
Figure 1.
Distances within each of the three clusters.
Figure 1 allows us to state that cluster 2 is more compact, whereas within cluster 3, the cases are more distant from each other. Furthermore, the cluster membership (the distance between each observation and the cluster center) shows how scattered the observations are around the center of the cluster. Table 5 reveals the distances between the cases and the center of the nine categories, split into the three clusters. The data suggest that the cultivar is the furthest category from the cluster centers, followed by the country of origin.
Table 5.
Cluster membership within observations of the categories.
The next analysis of the results found the distances between each of the clusters. The largest observed distance is between cluster 3 and 2 and the smallest is between cluster 1 and 3. This means that cases from cluster 2 and 3 differ the most one from each other (Table 6).
Table 6.
Distances between clusters.
Other results of the study come from the ANOVA analysis, where the F statistic was used to emphasize that the variables of origin, varieties, form and reason are the ones with the highest values. This means that they ensure a more pronounced differentiation in the clusters, and thus, they are more clearly distributed within them. Table 7 presents the ANOVA results.
Table 7.
ANOVA results from the nine categories.
The F test should be used only for descriptive purposes because the clusters were chosen to maximize the differences among cases in different clusters. The observed significance levels are not corrected for this and, thus, cannot be interpreted as tests for the hypothesis where the cluster means are equal.
3.5. Results and Discussion on the Regional Level
Focusing on the region level, the frequency table by cluster is presented (Table 8). The importance of the results within each cluster and the share that this represents were considered. In cluster 1 and 2, the highest share belongs to the South-West Region. Meanwhile, in cluster 3, the Bucharest-Ilfov and South-Muntenia Regions were found to have the highest frequencies; thus, these are the most represented regions in the respective clusters.
Table 8.
Frequency table by clusters and by regions.
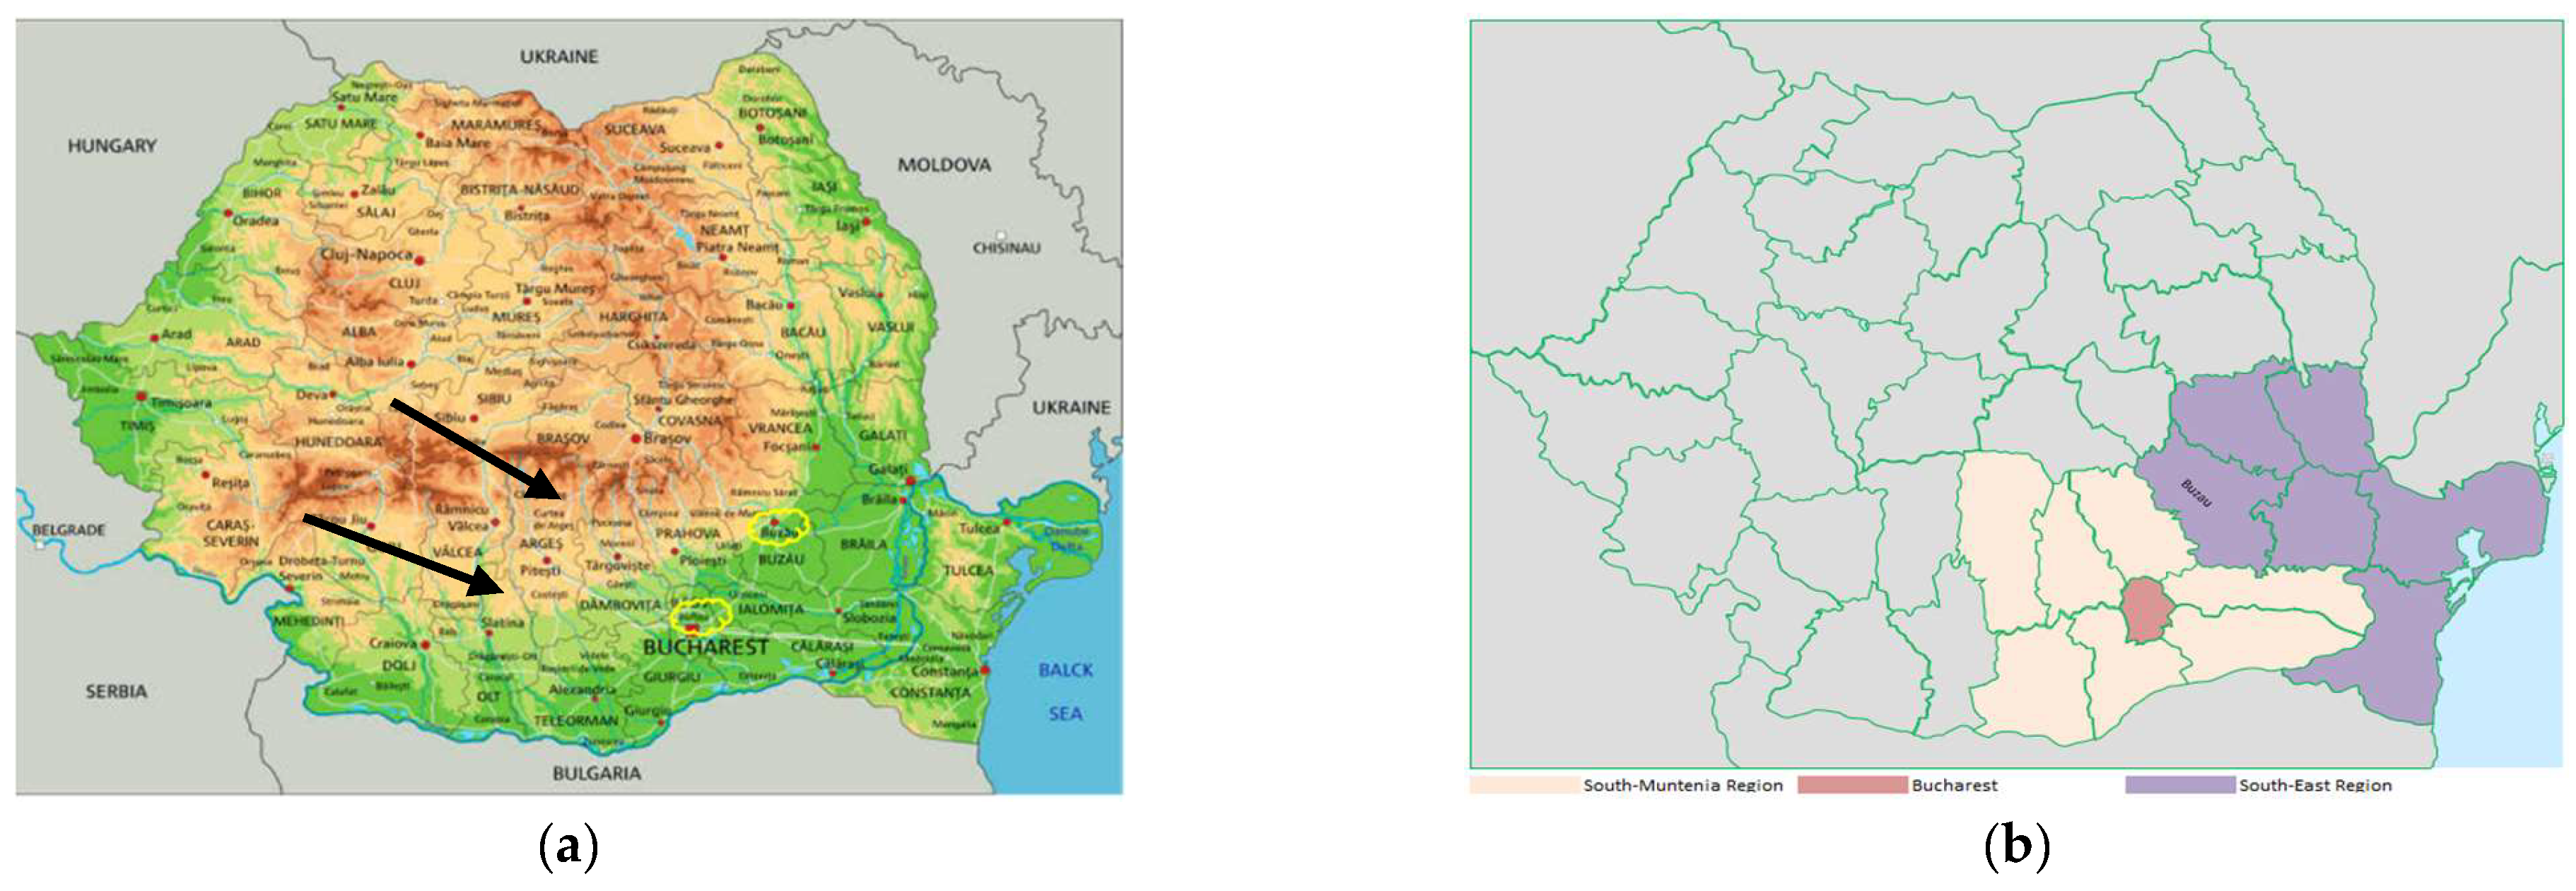
In Figure 2, the two locations that the research look at in detail are represented. Both regions are representative for the clusters they belong to.
Figure 2.
Research area: (a) location on the Romanian map of the two areas focused on (South-Muntenia and South-East Regions); (b) the administrative map of the South-Muntenia and South-East Regions. Source: adapted representation based on https://harta-romaniei.org/harta-geografica-a-romaniei.html, accessed on 2 August 2022 [34].
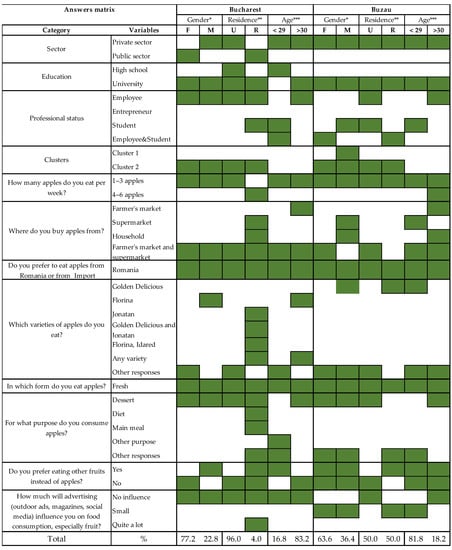
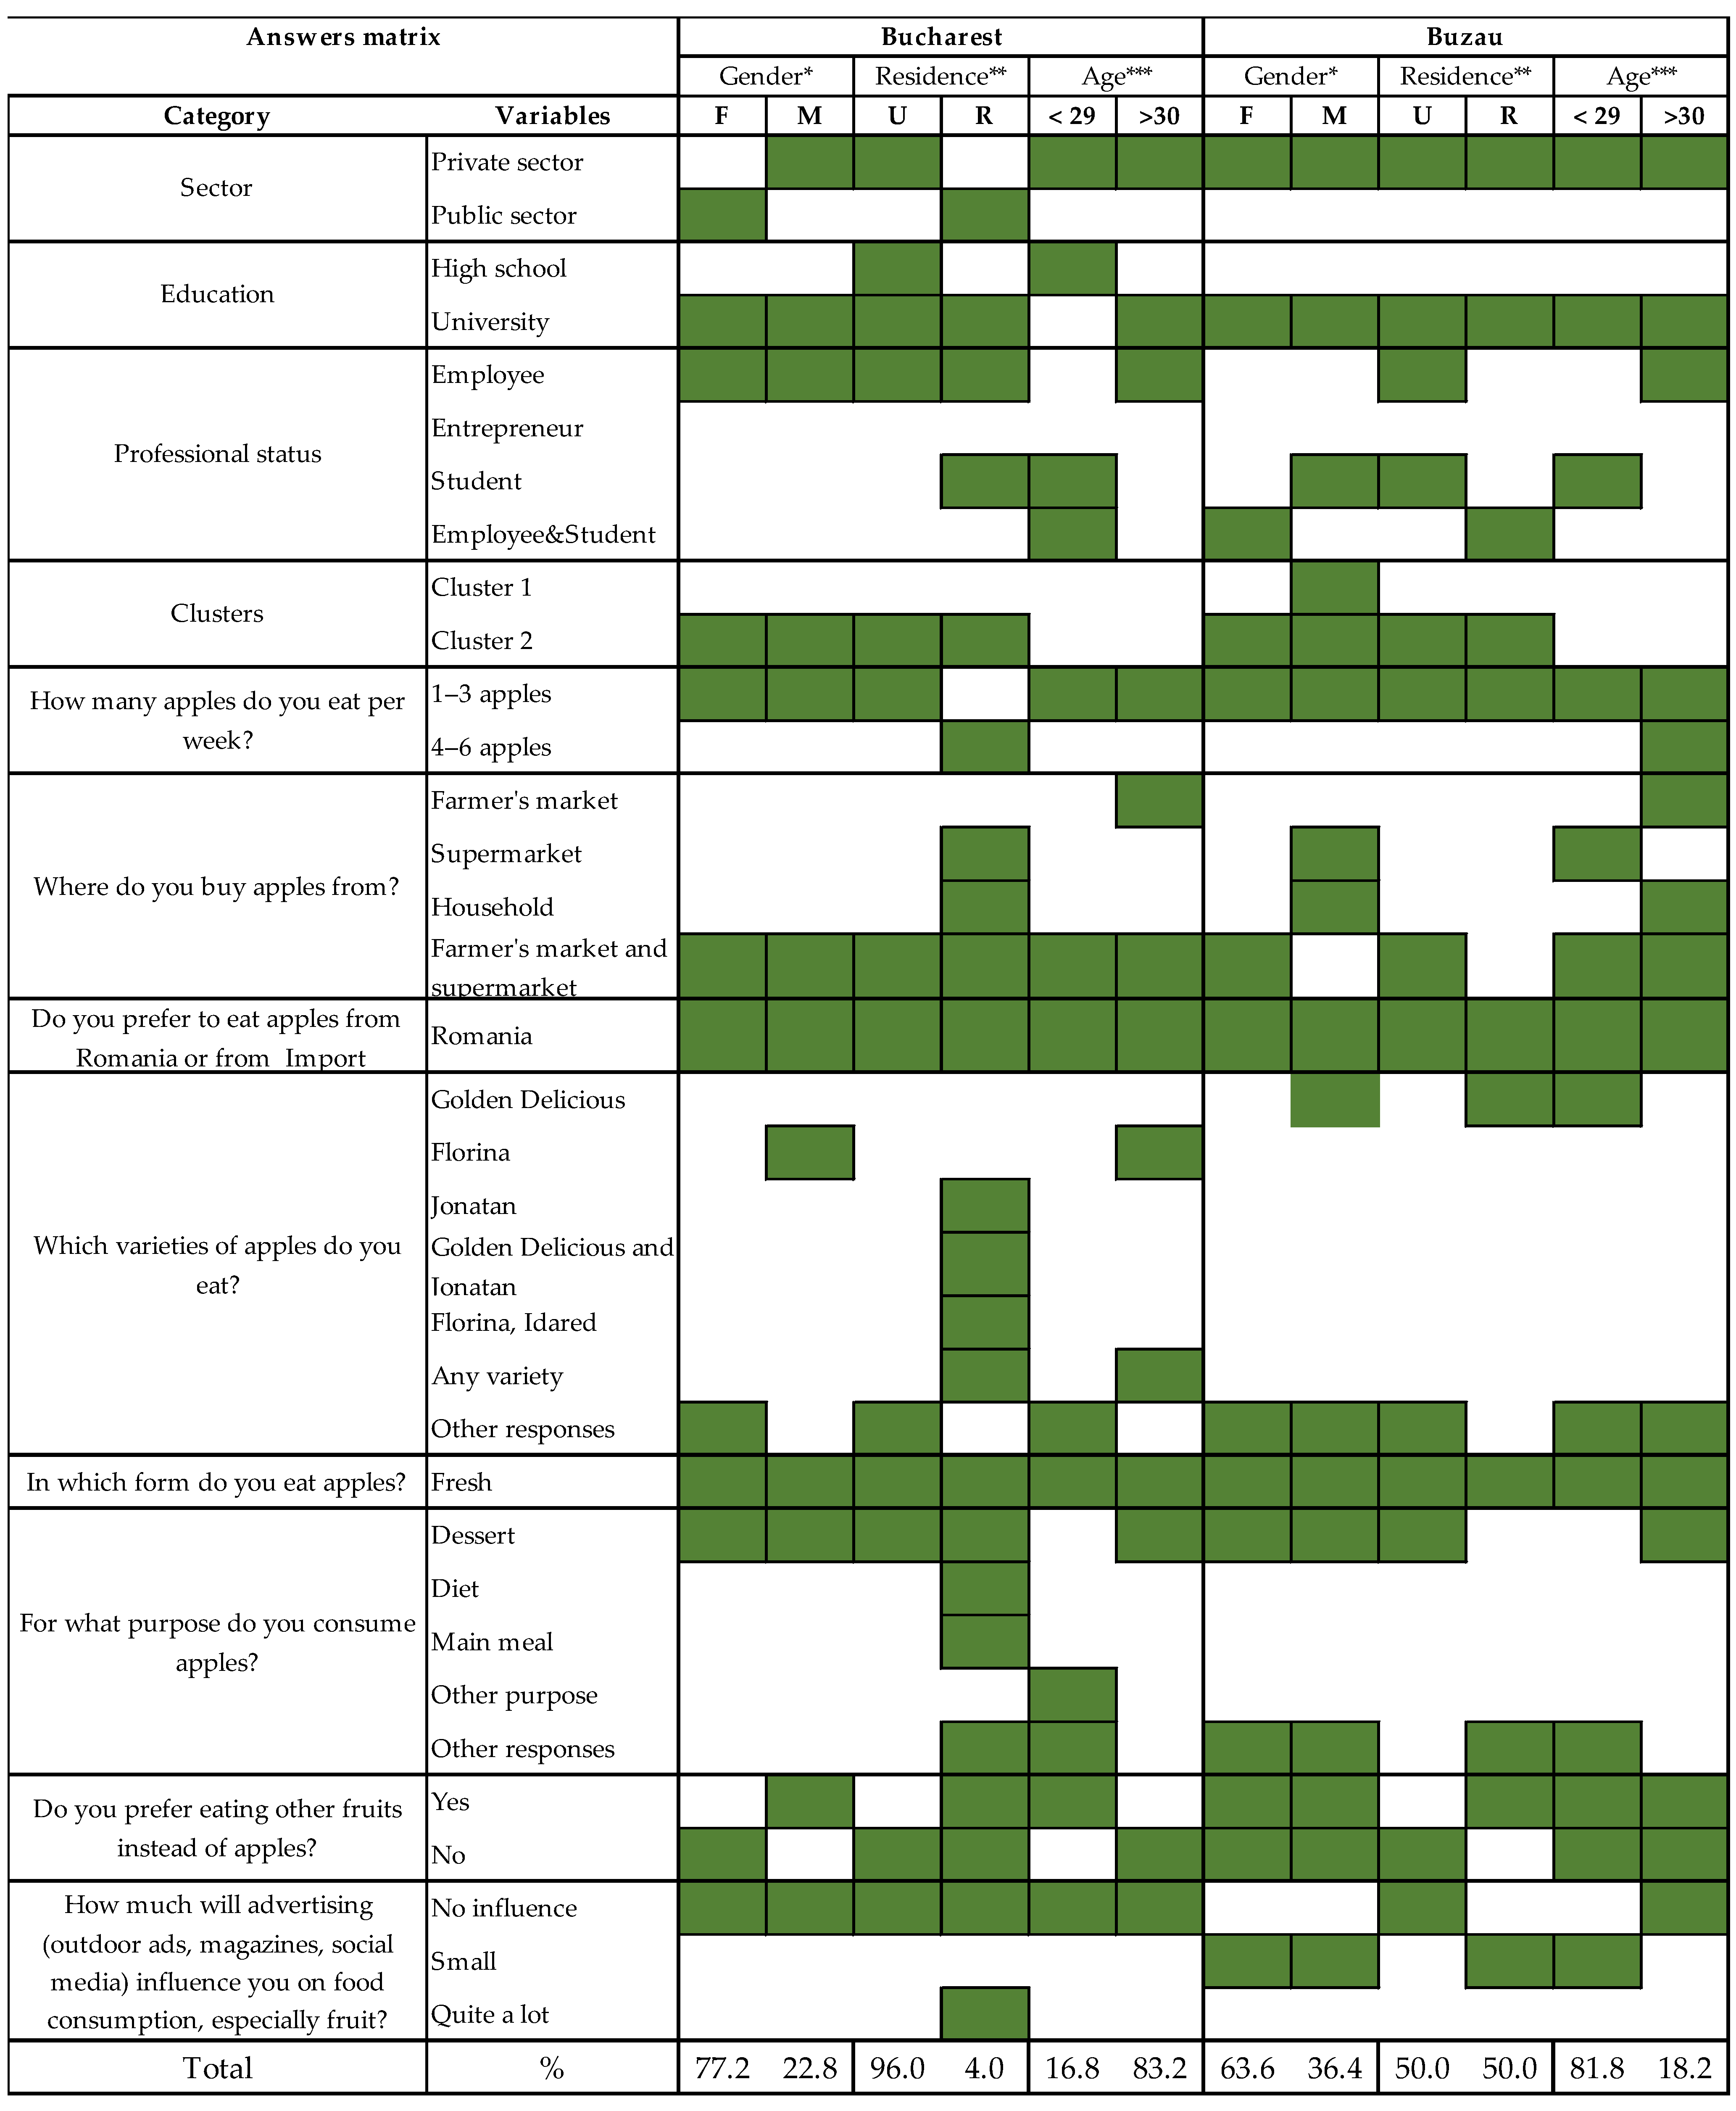
As it was indicated above, we focused more on the results from these two regions. One area being a large city and the other a smaller area, consumers have different profiles. Therefore, a matrix of results was designed for the two counties, Bucharest (South-Muntenia Region) and Buzău (South-East Region), which was reported by gender, by residence and by two age classes (under 29 years old and over 30 years old). Figure 3 shows the results, which are displayed for 12 categories.
Figure 3.
The matrix of the frequencies for the two areas (Bucharest and Buzău). * F–females, M–males; ** U–urban, R–rural; *** <29–under 29 years old, >30–over 30 years old. Source: own representation based on the survey responses.
From the figure above, it is possible to identify in more detail the profiles of apple consumers from the two specific areas. Thus, based on the first section of the results, it can be noticed that the dominant sector in which the respondents work is the private sector, whereas a majority have, in both considered counties, a university education. Referring to the professional status, employees are more present in Bucharest, whereas in Buzău, the professional status has a different pattern.
Regarding the distribution in the clusters, it was noticed that the two particularly studied areas are not present in cluster 3. By considering the analysis of the frequency of responses on apple consumption, we can underline the following: usually respondents consume between 1–3 apples per week, bought them from farmers’ markets and from supermarkets, preferring to choose local apples; however, there is a vaguely defined profile on the type of apple consumption. Next, fresh apples are definitely preferred as a dessert and are often supplemented with other fruits, and sometimes, respondents are influenced by advertising (especially in the Buzău area), whereas in the Bucharest area, the majority of respondents declared that they are not influenced by advertising in regard to the consumption of apples. The large majority of the categories considered in the two areas (Bucharest and Buzău) are profiled as follows: The respondents are identified as a majority female representation in both areas. In Bucharest, the respondents live in mostly urban areas with a dominant age category over 30 years old, whereas in the Buzău area, the respondents are equally divided between rural and urban areas, and the dominant age of the respondents is under 29 years old. These last statements can explain, to some extent, the frequencies obtained in the two sections of the questionnaire, as well as our choice to focus on these two regions.
4. Conclusions
The paper’s results derived from the questionnaire confirm that Romanian people prefer to consume fresh apples produced in Romania that are bought from the market (i.e., Romanian apples, not imported apples), but not necessarily from supermarkets. We noted that these results were recorded because most of the respondents were young people who may have different consumption behaviors and professional backgrounds as compared to their elders. Additionally, the gender and residence distinction produced other interesting conclusions. Since the patterns were described on the basis of the statistical data representing the apple sector, it was revealed that the zoning at the national level is different from the regional level; thus, an in-depth analysis on two specific areas was carried out, namely, the South-East Region (generally ranked in statistics below the national average) and the South-Muntenia Region, which included the Bucharest area (ranked above the national average).
Therefore, it is concluded that the apple consumption in Romania is differentiated mainly based on age and usually depends on the origin of the fruits, the variety, the form and the reason of consumption. The paper’s investigations also highlighted several strong and weak points. Thus, even if most people declare that they prefer Romanian apples, in reality, they buy apples without proof of origin. According to the official data, Romania imports many apples from Poland and Turkey, which can also be found in the local permanent markets. In many cases, Romanian producers, due to the lower quality of their products, cannot comply with the requirements of the supermarkets, and thus, they prefer to sell the apples they produce immediately after harvesting or to transform the apples into juice or other drinks.
However, we acknowledge the limitations of our research design, especially as related to the sample of respondents. For instance, we do not have an equal distribution between regions for the age groups; therefore, in the future we will have to expand the database, so that a better picture of Romanian apple consumption patterns will eventually be obtained. Additionally, further research should cover a special methodology that can explore an economic approach to the production costs in the fruit sector. One of these approaches could be the LCCA (life-cycle cost analysis), which is a method with high applicability and consists of describing a frame of reference for selecting the best parameters. This kind of investigation in fruit production systems can identify the particularities of fruit production technologies, evaluate them and provide practical recommendations on how they can be improved. Life-cycle cost analysis (LCCA) is a useful tool for evaluating relevant costs for a product (capital investment costs, installation costs, operating costs, etc.) over a period of time. In the largest framework, it is also known as a “cradle-to-grave” analysis, since it can consider all stages of the life span of a process or a product.
Author Contributions
Conceptualization, I.M.V., A.C.B., L.B., F.S. and E.T.; data curation, G.F. and E.T.; formal analysis, I.M.V., G.F. and E.T.; funding acquisition, G.F., L.B. and F.S.; investigation, A.C.B. and F.S.; methodology, F.S. and E.T.; project administration, F.S.; resources, A.C.B. and L.B.; supervision, I.M.V., A.C.B., G.F., L.B. and E.T.; validation, I.M.V., A.C.B., G.F., L.B., F.S. and E.T.; visualization, I.M.V., A.C.B., G.F., L.B. and F.S.; writing—original draft, E.T.; writing—review and editing, I.M.V., A.C.B., G.F. and E.T. All authors have read and agreed to the published version of the manuscript.
Funding
This research was funded by the CNFIS (National Council for the Financing of the Higher Education) project, grant number FDI-2022-0634, with a project title of “Developing the institutional capacity for research of USAMV Bucharest by implementing open science practices and promoting competitiveness in the economic environment (DECIDE)”, and by the internal research project of the USAMV of Bucharest (University of Agronomic Sciences and Veterinary Medicine of Bucharest), Romania, grant number 1260/2021, with a project title of “Decision tool based on LCA and LCCA methods for fruit farms (ECO-LCA)”. The APC was funded by the project CNFIS-FDI-2022-0634, “Developing the institutional capacity for research of USAMV Bucharest by implementing open science practices and promoting competitiveness in the economic environment (DECIDE)”.
Institutional Review Board Statement
Not applicable.
Data Availability Statement
The main databases used in this paper are public open databases: https://ec.europa.eu/eurostat/data/database (accessed on 2 August 2022) and Tempo Online Database https://insse.ro/cms/ (accessed on 2 August 2022). More specific details are indicated in the References section.
Conflicts of Interest
The authors declare no conflict of interest.
References
- De Schutter, O. Final Report: The Transformative Potential of the Right to Food, Report of the Special Rapporteur on the Right to Food; A/HRC/25/57; United Nations General Assembly, Human Rights Council: Geneva, Switzerland, 2014; Available online: shorturl.at/nKYZ6 (accessed on 20 October 2021).
- Porter, M.; Kramer, M. Creating shared value: Redefining capitalism and the role of the corporation in society. Harv. Bus. Rev. 2011, 89, 62–77. Available online: shorturl.at/tV257 (accessed on 22 October 2021).
- Curutchet, A.; Trias, J.; Tárrega, A.; Arcia, P. Consumer Response to Cake with Apple Pomace as a Sustainable Source of Fibre. Foods 2021, 10, 499. [Google Scholar] [CrossRef] [Scilit] [PubMed]
- Boca, G.D. Factors influencing consumer behavior in sustainable fruit and vegetable consumption in Maramures county, Romania. Sustainability 2021, 13, 1812. [Google Scholar] [CrossRef] [Scilit]
- Arce, S.; Gugole Ottaviano, F.; Sosa, M. Sensory acceptability, consumption frequency, and factors associated with consumption of fruits and vegetables among low and medium income consumers in Argentina. J. Sens. Stud. 2021, 36, e12632. [Google Scholar] [CrossRef] [Scilit]
- Kaliji, S.A.; Imami, D.; Canavari, M.; Gjonbalaj, M.; Gjokaj, E. Fruit-related lifestyles as a segmentation tool for fruit consumers. Br. Food J. 2022, 124, 124–142. [Google Scholar]
- Silvestri, C.; Cirilli, M.; Zecchini, M.; Muleo, R.; Ruggieri, A. Consumer acceptance of the new red-fleshed apple variety. J. Food Prod. Mark. 2018, 24, 1–21. [Google Scholar] [CrossRef] [Scilit]
- Torres, A. For young consumers farm-to-fork is not organic: A cluster analysis of university students. HortScience 2020, 55, 1475–1481. [Google Scholar] [CrossRef] [Scilit]
- Bejaei, M.; Cliff, M.A.; Singh, A. Multiple correspondence and hierarchical cluster analyses for the profiling of fresh apple customers using data from two marketplaces. Foods 2020, 9, 873. [Google Scholar] [CrossRef] [Scilit]
- Bonany, J.; Brugger, C.; Buehler, A.; Carbó, J.; Codarin, S.; Donati, F.; Echeverria, G.; Egger, S.; Guerra, W.; Hilaire, C.; et al. Preference mapping of apple varieties in Europe. Food Qual. Prefer. 2014, 32, 317–329. [Google Scholar] [CrossRef] [Scilit]
- Djekic, I.; Radivojevic, D.; Milivojevic, J. Quality perception throughout the apple fruit chain. J. Food Meas. Charact. 2019, 13, 3106–3118. [Google Scholar] [CrossRef] [Scilit]
- Benković-Lačić, T.; ČulMak, B.; Benković, R.; Antunović, S.; Mirosavl Mević, K. Analysis of consumer opinions and habits related to apple consumption. In Proceedings of the Technique Education Agriculture Management Conference (10th International Scientific and Expert Conference TEAM2022), Slavonski Brod, Croatia, September 21–22, 2022; pp. 455–459. Available online: Shorturl.at/defJM (accessed on 28 October 2022).
- Marcuta, L.; Purdoiu, L.; Purdoiu, S.; Tudor, V.; Marcuta, A. Use of sensory analysis to appreciate the quality of apple juice. Sci. Papers. Ser. Manag. Econ. Eng. Agric. Rural Dev. 2020, 20, 327–332. [Google Scholar]
- Toma, E.; Lincă, A.C. Western Charpathian Rural Mountain Tourism Mapping Through Cluster Methodology. Sci. Papers. Ser. Manag. Econ. Eng. Agric. Rural Dev. 2013, 13, 309–312. [Google Scholar]
- Dona, I.; Popa, D. Tourism destination mapping through cluster analysis. Sci. Papers. Ser. Manag. Econ. Eng. Agric. Rural Dev. 2013, 13, 133–138. Available online: http://www.managementjournal.usamv.ro/pdf/vol.XIII_2/Art20.pdf (accessed on 28 August 2022).
- Bălan, A.V.; Toma, E.; Dobre, C.; Soare, E. Organic farming patterns analysis based on clustering methods. Agric. Agric. Sci. Procedia 2015, 6, 639–646. Available online: https://www.sciencedirect.com/science/article/pii/S2210784315002430 (accessed on 22 October 2021). [CrossRef] [Scilit]
- Cadar, R.L.; Amuza, A.; Dumitras, D.E.; Pocol, C.B. Consumer behaviour of products obtained from medicinal and aromatic plants: A segmentation based on frequency and purpose of their use. Sci. Papers. Ser. Manag. Econ. Eng. Agric. Rural Dev. 2021, 21, 127–136. Available online: https://managementjournal.usamv.ro/pdf/vol.21_2/Art15.pdf (accessed on 24 February 2022).
- Kusz, B.; Kilar, J. Consumers’ preferences for places to purchase local dairy products. AgroLife Sci. J. 2020, 9, 198–204. Available online: https://agrolifejournal.usamv.ro/pdf/vol.IX_1/Art26.pdf (accessed on 20 October 2021).
- Chireceanu, C.; Podrumar, T.; Teodoru, A.; Dobromir, D.; Cardei, P. Distribution and population density of the North American leafhopper Scaphoideus titanus in vineyards from the western Romania. AgroLife Sci. J. 2019, 8, 24–33. Available online: https://agrolifejournal.usamv.ro/pdf/vol.VIII_2/Art3.pdf (accessed on 20 October 2021).
- Bezus, R.; Samofal, O. Challenges of small-scale farming in ukraine. AgroLife Sci. J. 2019, 8, 35–42. Available online: https://agrolifejournal.usamv.ro/pdf/vol.VIII_1/Art3.pdf (accessed on 20 October 2021).
- Ionescu, A.M.; Roman, G.V. Study regarding the vegetables sales in various distribution channels from Bucharest. AgroLife Sci. J. 2015, 4, 33–36. Available online: https://agrolifejournal.usamv.ro/pdf/vol.IV_2/Art5.pdf (accessed on 20 October 2021).
- Suresh, C.; Kothakonda, R. Consumer Preferences Prediction Using Alscal Framework. 19 June 2022. Available online: https://ssrn.com/abstract=4140647 (accessed on 14 December 2022). [CrossRef] [Scilit]
- Kordrostami, M.; Laczniak, R. Female power portrayals in advertising. Int. J. Advert. 2022, 41, 1181–1208. [Google Scholar] [CrossRef] [Scilit]
- Ferreira, J.J.; Fernandes, C.I.; Schiavone, F.; Mahto, R.V. Sustainability in family business—A bibliometric study and a research agenda. Technol. Forecast. Soc. Change 2021, 173, 121077. [Google Scholar] [CrossRef] [Scilit]
- Chen, T.S.; Tsai, T.H.; Chen, Y.T.; Lin, C.C.; Chen, R.C.; Li, S.Y.; Chen, H.Y. A combined K-means and hierarchical clustering method for improving the clustering efficiency of microarray. In Proceedings of the 2005 International Symposium on Intelligent Signal Processing and Communication Systems, Hong Kong, China, 13–16 December 2005; pp. 405–408. [Google Scholar] [CrossRef] [Scilit]
- Castro, M.A.d.; Fontanelli, M.d.M.; Nogueira-de-Almeida, C.A.; Fisberg, M. Food Insecurity Reduces the Chance of Following a Nutrient-Dense Dietary Pattern by Brazilian Adults: Insights from a Nationwide Cross-Sectional Survey. Nutrients 2022, 14, 2126. [Google Scholar] [CrossRef] [Scilit]
- Tallman, D.A.; Latifi, E.; Kaur, D.; Sulaheen, A.; Ikizler, T.A.; Chinna, K.; Mat Daud, Z.A.; Karupaiah, T.; Khosla, P. Dietary Patterns and Health Outcomes among African American Maintenance Hemodialysis Patients. Nutrients 2020, 12, 797. [Google Scholar] [CrossRef] [Scilit]
- Eurostat Database. Available online: https://ec.europa.eu/eurostat/data/database (accessed on 2 August 2022).
- Tempo Online Database. Romanian National Institute of Statistics. Available online: http://statistici.insse.ro:8077/tempo-online/ (accessed on 2 August 2022).
- Popescu, A. Some considerations on the dynamics of fruit and apple production and consumption in Romania in the period 2007–2014. Sci. Pap. Manag. Econ. Eng. Agric. Rural Dev. 2016, 16, 267–276. [Google Scholar]
- Munteanu, C.C. Food Insecurity and Pandemics: Addressing the Food Shock of COVID-19 in Romania. Agric. Econ. Rural Dev. 2020, 17, 265–273. [Google Scholar]
- Popescu, A. Research regarding the trends in Romania’s apple market. Ann. Univ. Craiova-Agric. Mont. Cadastre Ser. 2012, 42, 408–413. [Google Scholar]
- Dan, C.; Serban, C.; Sestras, A.F.; Militaru, M.; Morariu, P.; Sestras, R.E. Consumer Perception Concerning Apple Fruit Quality, Depending on Cultivars and Hedonic Scale of Evaluation—A Case Study. Not. Sci. Biol. 2015, 7, 140–149. [Google Scholar] [CrossRef] [Scilit]
- Harta Geografica a Romaniei. Available online: https://harta-romaniei.org/harta-geografica-a-romaniei.html (accessed on 2 August 2022).

Disclaimer/Publisher’s Note: The statements, opinions and data contained in all publications are solely those of the individual author(s) and contributor(s) and not of MDPI and/or the editor(s). MDPI and/or the editor(s) disclaim responsibility for any injury to people or property resulting from any ideas, methods, instructions or products referred to in the content. |
© 2022 by the authors. Licensee MDPI, Basel, Switzerland. This article is an open access article distributed under the terms and conditions of the Creative Commons Attribution (CC BY) license (https://creativecommons.org/licenses/by/4.0/).