


Abstract
Industrial production of single-cell oils (SCOs) by oleaginous yeasts relies predominantly on nitrogen limitation, which constrains process flexibility when nitrogen-rich substrates are used. Although phosphate limitation has been reported as an alternative lipid induction strategy, its process-level performance relative to nitrogen limitation remains insufficiently resolved under controlled reactor-scale conditions. In this study, phosphate-limited, nitrogen-limited and nutrient-replete cultivations of Cutaneotrichosporon oleaginosum ATCC 20509, Saitozyma podzolica DSM 27192, Scheffersomyces segobiensis DSM 27193 and Apiotrichum porosum DSM 27194 were benchmarked in 2.5 L stirred-tank reactors operated under identical media compositions and process parameters. Biomass formation, lipid titres, specific lipid production rates, biomass composition and fatty acid profiles were systematically compared. Nitrogen limitation resulted in the highest lipid titres, reaching up to 9.2 g L−1 (A. porosum), while maximum lipid titres under phosphate-limited conditions reached 5.0 g L−1 (C. oleaginosum) and nutrient-replete conditions 3.9 g L−1 (A. porosum), respectively. The highest specific lipid production rate under nitrogen limitation was 0.0028 g gCDW−1 h−1 (S. podzolica), while phosphate limitation yielded a maximum of 0.0037 g gCDW−1 h−1 (S. podzolica). These results demonstrate that phosphate limitation can decouple cellular lipid productivity from biomass formation and represents a process-relevant alternative for SCO production from nitrogen-rich feedstocks.
1. Introduction
Single-cell oils (SCOs), also referred to as microbial oils, are intracellular storage lipids mainly composed of triacylglycerols that are produced by oleaginous microorganisms. A microorganism is generally classified as oleaginous when it is capable of accumulating more than 20% lipid on a cell dry weight basis, with some species reaching lipid contents of up to 70–80% depending on cultivation conditions such as nutrient limitation and excess carbon availability [1,2]. Oleaginous microorganisms occur across several phylogenetic groups, including microalgae, fungi (filamentous fungi and yeasts), and bacteria. Microalgae such as Chlorella, Nannochloropsis, or Botryococcus braunii are widely studied for lipid production and typically accumulate between approximately 20 and 75% lipids of their cell dry weight depending on species and cultivation conditions [3]. Filamentous fungi and oleaginous yeasts, including Mortierella, Yarrowia, Rhodosporidium, and Cutaneotrichosporon species, can reach lipid contents of about 70–75% of cell dry weight under optimized cultivation conditions [4,5]. In addition, several bacterial species such as Rhodococcus opacus and Acinetobacter calcoaceticus are known to accumulate storage lipids, with reported lipid contents typically ranging from approximately 20 to 50% of cell dry weight [6]. Due to their high lipid accumulation capacity and metabolic versatility, these microorganisms represent promising platforms for sustainable lipid production using renewable carbon sources.
SCOs have attracted increasing interest as a sustainable alternative to plant- and fossil-derived oils, as their production is independent of climate, arable land availability and seasonal fluctuations [7,8,9,10,11,12]. In contrast to conventional plant oils such as soybean, palm or sunflower oil, microbial lipid production does not compete directly with food or feed supply chains and can achieve higher water-use efficiency [10,13]. Consequently, SCOs are considered promising feedstocks for a broad range of applications, including oleochemicals, cosmetics, nutraceuticals, pharmaceuticals and renewable fuels [14,15,16,17,18]. Among oleaginous microorganisms, yeasts are particularly attractive due to their high lipid contents, reported up to 75% of cell dry weight, fast growth, simple cultivation requirements and fatty acid profiles comparable to plant oils [1,19].
In yeasts, lipids fulfil multiple cellular functions, ranging from membrane formation to energy storage and signal transduction [20]. De novo lipid accumulation is typically induced as a secondary metabolic response to nutrient limitation, most commonly nitrogen limitation [4,21,22]. Industrially, this is often implemented as a two-stage process, where biomass formation occurs during an initial growth phase followed by lipid accumulation once nitrogen is depleted and carbon is supplied in excess [4,22,23]. At the metabolic level, nitrogen limitation leads to a decrease in intracellular adenosine monophosphate (AMP) concentrations due to the activity of AMP deaminase, which converts AMP to inosine monophosphate. The resulting reduction in AMP levels decreases the activity of the AMP-dependent isocitrate dehydrogenase in the tricarboxylic acid cycle, leading to citrate accumulation in the mitochondria. Citrate is subsequently transported to the cytosol, where it is cleaved to acetyl-CoA, providing the precursor for fatty acid and triacylglycerol synthesis in oleaginous yeasts [4]. Lipid accumulation can be further enhanced by increasing the carbon-to-nitrogen ratio in the cultivation medium [1].
Despite its effectiveness, nitrogen-limited SCO production poses limitations with respect to economic feasibility and feedstock flexibility. Industrial side streams such as molasses or other agro-industrial residues often contain high nitrogen concentrations, rendering strict nitrogen limitation difficult or impractical [24,25]. In this context, alternative nutrient limitation strategies have been proposed, including phosphate or sulfur limitation, yet these approaches remain comparatively understudied, particularly under process-relevant cultivation conditions [22]. Phosphorus is a key cellular element, being an integral component of nucleic acids, ATP and phospholipids, and its limitation strongly affects microbial metabolism and growth [26,27]. Moreover, phosphorus is a finite and increasingly critical resource, which may become a limiting factor for future large-scale bioprocesses [28,29].
Several studies have demonstrated that phosphate limitation can promote lipid accumulation in oleaginous microorganisms. For example, Rhodosporidium toruloides reached a cellular lipid content of 62.2% and a lipid yield of 0.205 g g−1 glucose under phosphate-limited conditions, even in the presence of excess nitrogen. In that study, lipid accumulation was observed at a C/N ratio of 6.1 and a C/P ratio of 9552, highlighting that phosphate limitation alone can trigger substantial lipid storage [30]. In Yarrowia lipolytica, phosphate limitation likewise enhanced lipid accumulation. In synthetic medium, reducing phosphate from 10.1 g L−1 to 0 g L−1 increased lipid content from 23.1 ± 0.5% to 44.4 ± 0.9% of cell dry weight and lipid yield from 0.14 ± 0.01 to 0.30 ± 0.01 g g−1. In real digestate, lowering phosphate from 5.1 g L−1 to 1 g L−1 increased lipid content from 18.7 ± 1.1% to 37.7 ± 0.7% [31]. Similar effects have also been reported in microalgae, although the response is strongly species- and condition-dependent. For example, in Isochrysis sp. IOAC724S, cultivation without phosphorus for two days increased total lipid content from 21.0% to 55.6% of dry weight. In this context, phosphorus stress in microalgae is commonly described as moderate at 0.019–0.01 g L−1 P, strong at <0.01 g L−1 P, and complete phosphorus starvation at 0 g L−1 P [32]. However, existing work predominantly focuses on individual strains, strain-specific process optimization or small-scale cultivation systems, and typically emphasizes lipid content or final titres as primary performance metrics. Systematic, reactor-scale comparisons of phosphate- and nitrogen-limited SCO production across multiple oleaginous yeast species under identical process conditions, particularly including rate-based performance indicators, remain largely lacking. As a result, the process-level implications of phosphate limitation relative to conventional nitrogen-limited strategies are still insufficiently understood.
In the present study, we address this gap by conducting a reactor-scale, cross-strain benchmark of phosphate-limited, nitrogen-limited and nutrient-replete cultivations using four oleaginous yeasts, Cutaneotrichosporon oleaginosum ATCC 20509, Saitozyma podzolica DSM 27192, Scheffersomyces segobiensis DSM 27193 and Apiotrichum porosum DSM 27194, in 2.5 L stirred-tank reactors. Using standardized media and cultivation conditions based on established protocols [33], we systematically compare biomass formation, lipid accumulation, specific lipid production rates, biomass composition and fatty acid profiles. By combining controlled reactor-scale cultivation with comprehensive analytical characterization, this study evaluates phosphate limitation as an alternative lipid induction strategy and provides process-relevant insights for feedstock-flexible and scalable SCO production.
2. Materials and Methods
2.1. Chemicals
Unless stated otherwise, all chemicals were obtained from Carl Roth GmbH & Co. KG (Karlsruhe, Germany).
2.2. Yeast Strains
The oleaginous yeast strains used in this study were C. oleaginosum ATCC 20509, S. podzolica DSM 27192, A. porosum DSM 27194 and S. segobiensis DSM 27193. C. oleaginosum ATCC 20509 has previously been described under the synonyms Trichosporon oleaginosum, Candida curvata, Apiotrichum curvatum, Cryptococcus curvatus and Trichosporon cutaneum [34,35,36,37,38]. S. podzolica DSM 27192 was formerly classified as Cryptococcus podzolicus, A. porosum as Trichosporon porosum and S. segobiensis as Pichia segobiensis [39].
2.3. Media Compositions for Bioreactor Cultivations
Bioreactor cultivations were conducted under nitrogen-limited, phosphate-limited and nutrient-replete (“unlimited”) conditions, with unlimited conditions defined as those in which neither nitrogen nor phosphate became growth-limiting during the cultivation, as confirmed by residual nutrient measurements throughout the cultivation (Section 3.1). All cultivation and preculture media were based on a previously described nitrogen-limited medium [33] and prepared from four separately sterilized solutions: (i) a mineral salt solution, (ii) a trace element solution, (iii) a salt solution and (iv) a glucose solution. The composition of the mineral salt solutions differed primarily in nitrogen and phosphorus content (Table S1). Based on the initial glucose concentration of 90 g L−1, corresponding to approximately 3000 mmol C L−1, the resulting elemental ratios differed substantially between the applied nutrient regimes. The nitrogen-limited medium exhibited an initial C/N ratio of approximately 396 and a C/P ratio of approximately 197, reflecting strong nitrogen limitation conditions. In contrast, the phosphate-limited medium showed an initial C/N ratio of approximately 18.7 and a C/P ratio of approximately 1724, indicating a pronounced excess of nitrogen while phosphate availability was strongly restricted. The nutrient-replete medium resulted in initial ratios of C/N ≈ 18.7 and C/P ≈ 197, ensuring that neither nitrogen nor phosphate became growth-limiting. These ratios were calculated based on the elemental nitrogen and phosphorus concentrations of the mineral salt solutions and are summarized in Table S1. The medium formulation was adopted from the nitrogen-limited cultivation medium described by Gorte et al. [33]. The elemental ratios were therefore not individually optimized for the investigated strains but were chosen to maintain comparability with previously reported cultivation conditions while ensuring clearly defined nutrient limitation regimes.
The nitrogen-limited mineral salt solution contained 8.99 g L−1 potassium dihydrogen phosphate, 0.12 g L−1 disodium hydrogen phosphate, 0.1 g L−1 sodium citrate dihydrate, 0.1 g L−1 yeast extract, 0.2 g L−1 magnesium sulfate heptahydrate and 4.72 g L−1 ammonium sulfate. For phosphate-limited cultivations, the mineral salt solution contained 4.922 g L−1 potassium chloride, 0.0788 g L−1 sodium chloride, 0.1 g L−1 sodium citrate dihydrate, 0.1 g L−1 yeast extract, 0.2 g L−1 magnesium sulfate heptahydrate, 288 µL L−1 of 86% phosphoric acid to provide defined phosphate limitation while minimizing buffering capacity and 100 g L−1 ammonium sulfate to ensure non-limiting nitrogen availability throughout the cultivation and did not result in any observable growth inhibition under the applied conditions. Preliminary cultivations performed prior to the reactor experiments indicated that sulfur limitation could occur during the fermentation when no additional ammonium sulfate was supplied. No direct sulfate quantification was performed in the preliminary cultivations. Instead, ammonium concentrations were monitored using the ammonium assay described in Section 2.7. With reduced ammonium sulfate concentrations, growth cessation was observed although ammonium remained in excess in the culture supernatant, indicating that nitrogen was not depleted under these conditions. Because ammonium sulfate represented the dominant sulfur-containing macronutrient source in the medium, this pattern was interpreted as indirect evidence that sulfur availability, rather than nitrogen availability, had become limiting. The elevated ammonium sulfate concentration was therefore selected to provide both nitrogen and sulfate in excess and thereby ensure that phosphate remained the sole limiting macronutrient during cultivation. Ammonium sulfate was intentionally used as the nitrogen source rather than increasing the yeast extract concentration. Yeast extract represents a complex and chemically undefined nutrient source that contains not only nitrogen but also additional phosphorus, trace elements and organic growth factors. Increasing its concentration would therefore introduce uncontrolled phosphorus into the medium and potentially interfere with the intended phosphate limitation. The use of ammonium sulfate as a defined nitrogen source allowed precise control of the nutrient limitation regime while avoiding unintended phosphate supplementation. The applied phosphate concentration was based on preliminary shake-flask experiments in which the phosphate consumption of the investigated yeast strains was determined using photometric phosphate measurements. The selected concentration ensured that phosphate became limiting during the cultivation while still allowing sufficient initial biomass formation across all strains. The nutrient-replete mineral salt solution consisted of 8.99 g L−1 potassium dihydrogen phosphate, 0.12 g L−1 disodium hydrogen phosphate, 0.1 g L−1 sodium citrate dihydrate, 0.1 g L−1 yeast extract, 0.2 g L−1 magnesium sulfate heptahydrate and 100 g L−1 ammonium sulfate.
A trace element solution was added at 2% (v/v) after sterile filtration and contained 4 g L−1 calcium chloride dihydrate, 0.55 g L−1 iron(II) sulfate dihydrate, 0.475 g L−1 citric acid, 0.1 g L−1 zinc sulfate heptahydrate and 0.075 g L−1 manganese(II) sulfate monohydrate, supplemented with 100 µL L−1 concentrated sulfuric acid (96%). A salt solution, added at 2% (v/v) after autoclaving, consisted of 10 g L−1 yeast extract and 20 g L−1 magnesium sulfate heptahydrate. Glucose was supplied as a separately autoclaved solution at a concentration of 90 g L−1.
2.4. Reactivation of Cryostocks and Precultures
Yeast strains were stored as cryostocks containing 150 µL glycerol and 850 µL yeast suspension at a biomass concentration of 20 g L−1 and kept at −80 °C until use. For reactivation, cryostocks were streaked onto YM agar plates composed of 10 g L−1 glucose, 3 g L−1 yeast extract, 3 g L−1 malt extract, 5 g L−1 peptone and 15 g L−1 agar, adjusted to pH 7.0, and incubated at 20 °C for 7 days. Single colonies were transferred aseptically into preculture flasks containing liquid cultivation medium corresponding to the nitrogen-limited bioreactor medium. This medium consisted of autoclaved nitrogen-limited mineral salt solution supplemented with 7.7% (v/v) sterile-filtered trace element solution, 7.7% (v/v) autoclaved salt solution and 7.7% (v/v) autoclaved glucose solution. Precultures were incubated for 4 days at 20 °C and 130 rpm. Nitrogen-limited conditions were chosen to ensure a uniform physiological state across all experiments and to reflect the standard cultivation conditions applied in this study. Although nitrogen limitation may induce physiological adaptations such as the onset of lipid accumulation, changes in nitrogen metabolism, and a redistribution of carbon flux, all experimental setups, including phosphate-limited and non-limited cultivations, were inoculated with cells originating from the same nitrogen-limited cultivation condition. Thus, any effects associated with nitrogen limitation were common to all conditions and did not bias the comparison between the different nutrient regimes. Subsequently, 1 mL of each preculture was transferred into fresh medium of identical composition and incubated for an additional 4 days under the same conditions to ensure physiological stabilization prior to bioreactor inoculation.
2.5. Bioreactor Cultivation
Main cultivations were performed in 2.5 L stirred-tank bioreactors (Minifors, Infors HT (Bottmingen, Switzerland)) with a working volume of 1.2 L and a total cultivation time of 144 h. Cultivation parameters were selected based on previously optimized conditions for S. podzolica DSM 27192 and applied uniformly to all strains to prioritize cross-strain comparability over strain-specific optimization [33]. Temperature was maintained at 22.5 °C, agitation at 600 rpm, and aeration at 1 vvm. The pH was controlled at 4.0 using automated addition of 4 M sodium hydroxide in combination with either 4 M phosphoric acid for nitrogen-limited and nutrient-replete cultivations or 4 M sulfuric acid for phosphate-limited cultivations to avoid phosphate supplementation.
pH was monitored using an EasyFerm Plus PHI K8 225 probe (Hamilton Company, Bonaduz, Switzerland), while dissolved oxygen tension (pO2) was measured using a VisiFerm DO Arc 225 H0 probe (Hamilton Company, Bonaduz, Switzerland). Off-gas analysis was conducted with BlueVary analyzers (BlueSens (Herten, Germany)), and all process data were recorded using BlueVis software (version 4.64.96). Bioreactors were inoculated to an initial optical density at 600 nm (OD600) of 1.0, as determined spectrophotometrically. Foaming was controlled by daily addition of Contraspum A 4050 (Zschimmer & Schwarz, Lahnstein, Germany) during the first 72 h of cultivation, with 100 µL added for C. oleaginosum, S. podzolica and S. segobiensis, and 1 mL added for A. porosum. The potential influence of antifoam addition on oxygen transfer and analytical readouts was systematically evaluated as described in Section 2.16. Different antifoam volumes were required to achieve comparable foam control due to strain-specific foaming behavior.
During the first 72 h of cultivation, 24 mL d−1 of trace element solution and 24 mL d−1 of salt solution were supplied to prevent micronutrient limitation. Glucose feeding was adjusted to maintain a concentration of 90 g L−1, as determined by an enzymatic D-glucose assay. To prevent sulfate limitation without affecting nitrogen limitation kinetics, ammonium sulfate was added to a final concentration of 50 g L−1 after 72 h in phosphate-limited and nutrient-replete cultivations. Samples were taken every 24 h, comprising 5 mL for optical density and cell dry weight determination and 20 mL for biomass and supernatant analyses. Biomass pellets were recovered by centrifugation, freeze-dried, and stored at −20 °C until further analysis. All cultivations were performed in biological duplicates, and nitrogen-limited and nutrient-replete cultivations additionally included technical duplicates.
2.6. Determination of Cell Dry Weight
Cell dry weight (CDW) was determined gravimetrically in triplicate for each sampling point. For this purpose, 1 mL of cultivation broth was transferred into pre-dried and pre-weighed 1.5 mL reaction tubes and centrifuged at 13,000 rpm for 10 min. The supernatant was removed and retained for subsequent analyses. The biomass pellet was washed once with deionized water and centrifuged again under identical conditions. After removal of the wash solution, the pellets were dried at 60 °C for 24 h and weighed using a precision balance (ADB220, Kern (Balingen, Germany)). Cell dry weight was calculated from the mass difference before and after drying.
2.7. Ammonium Quantification
Ammonium concentrations in the culture supernatant were quantified using the NH4-N Spectroquant® assay (Merck KGaA (Darmstadt, Germany)), adapted to microplate format. Calibration standards ranging from 0 to 4 mg L−1 NH4-N were prepared from ammonium sulfate dissolved in deionized water. For analysis, 250 µL of each sample or standard were transferred into 1.5 mL reaction tubes. Reagent 2 from the assay kit was dissolved in 600 µL of Reagent 1 to prepare the working reagent (Reagent 1 + 2), of which 30 µL were added to each tube. After thorough mixing and incubation for 5 min, 5 µL of Reagent 3 were added, followed by an additional 5 min incubation. Subsequently, 200 µL of each reaction mixture were transferred to a 96-well microplate, and absorbance was measured at 690 nm using a Tecan Infinite® 200 PRO plate reader (Tecan Trading AG (Männedorf, Switzerland)). Ammonium concentrations were calculated based on the calibration curve.
2.8. Phosphate Quantification
Orthophosphate concentrations in the supernatant were determined using the o-Phosphate Spectroquant® assay (Merck KGaA). Calibration standards ranging from 0 to 14.5 mg L−1 phosphate were prepared from phosphoric acid (85%) diluted in deionized water. For each measurement, 2 mL of sample or standard were transferred into 2 mL Safe-Lock reaction tubes. Two drops of Reagent 1 were added, followed by a small spatula of Reagent 2, approximately half the size of the provided micro-scoop. After thorough mixing and incubation for 5 min, 200 µL of each sample were transferred to a 96-well plate. Absorbance was measured at 710 nm at room temperature using a Tecan Infinite® 200 PRO (Tecan Trading AG), and phosphate concentrations were calculated using the corresponding calibration curve.
2.9. Fatty Acid Methyl Ester Analysis
Lipid-derived fatty acids were analyzed via direct transesterification of freeze-dried biomass to fatty acid methyl esters (FAMEs). For each sample, 30 mg of biomass were combined with 1.5 mL n-hexane, 0.5 mL of heptadecanoic acid solution (2 mg mL−1 in hexane) as an internal standard, and 2 mL of methanolic sulfuric acid (15%, v/v) in glass reaction tubes. Samples were incubated at 100 °C and 1000 rpm for 2 h in a thermoshaker, with additional vortexing every 30 min to ensure homogeneous mixing. The reaction was terminated by cooling on ice, followed by the addition of 1 mL deionized water to promote phase separation. The upper hexane phase containing the FAMEs was collected and transferred into chromatography vials.
FAMEs were analyzed using a gas chromatograph (Agilent 6890N, Agilent, Santa Clara, CA, USA) equipped with a flame ionization detector and a DB-Wax capillary column (30 m × 0.25 mm). A volume of 2 µL was injected, and separation was achieved using a temperature program starting at 160 °C and increasing to 240 °C at a rate of 2 °C min−1, followed by a final hold of 15 min. Fatty acids were identified and quantified using a marine oil FAME mix standard (Restek, Bellefonte, PA, USA), covering all fatty acids detected in yeast lipid samples.
2.10. Total Lipid Determination by Soxhlet Extraction
Total lipid content was determined gravimetrically by Soxhlet extraction according to Gorte et al. [40]. Briefly, 0.5 g of washed and freeze-dried biomass were bead-milled for 5 min at 30 Hz using 12 mm stainless-steel beads. The disrupted biomass was transferred into extraction thimbles and extracted with 50 mL n-hexane under reflux conditions for 3–4 h. After extraction, the solvent was removed, and lipid content was determined gravimetrically.
2.11. Protein Quantification
Protein content was determined using the DC™ Protein Assay (Bio-Rad, Hercules, CA, USA), based on the Lowry method, with bovine γ-globulin as calibration standard. Biomass samples (10 mg) were hydrolyzed in 1 mL of 1 M sodium hydroxide at 95 °C for 1 h. Aliquots of 5 µL were transferred into 96-well plates, followed by addition of Reagent A′ and Reagent B according to the manufacturer’s instructions. Absorbance was measured at 750 nm after 15 min incubation, and protein concentrations were calculated from the standard curve.
2.12. Carbohydrate Quantification
Total carbohydrate content was quantified using the anthrone–sulfuric acid assay. Freeze-dried biomass (20 mg) was suspended in deionized water, diluted appropriately, and reacted with freshly prepared anthrone reagent (0.75 (w/v) anthrone in 88% (v/v) sulphuric acid). Samples were incubated at 95 °C for 10 min, cooled on ice, and absorbance was measured at 510 nm. Carbohydrate concentrations were calculated using glucose calibration standards.
2.13. Gluconic Acid Determination
Gluconic acid concentrations were quantified by HPLC using an Agilent 1100 system equipped with a Synergi™ Fusion-RP column (Phenomenex, Torrance, CA, USA) operated at 30 °C. Separation was achieved using 20 mM KH2PO4 (pH 2.5) as mobile phase, and detection was performed by UV absorbance at 220 nm. Quantification was based on external calibration with D-gluconic acid standards.
2.14. Ethanol Determination
Ethanol concentrations were determined by HPLC using an Agilent 1100 system equipped with a Rezex ROA organic acid H+ column (Phenomenex, Torrance, CA, USA). Samples were separated at 50 °C using 5 mM sulfuric acid as mobile phase at a flow rate of 0.5 mL min−1 and detected with a refractive index detector. Ethanol concentrations were calculated from external calibration standards.
2.15. Fatty Acid Profile-Derived Parameters
Average unsaturation (AU), cetane number (CN), iodine value (IV), kinematic viscosity (KV), specific gravity (SG) and heating value (HV) were calculated from fatty acid profiles according to established equations reported by Qian et al. [41].
Mathematical equations after Qian et al.:
AU = ΣM × Yi
M: number of double bonds, Yi: ratio of fatty acids
CN = −6.6684AU + 62.876
IV = 74.373AU + 12.71
KV = −0.6316AU + 5.2065
SG = −0.0055AU + 0.8726
HV = 1.7601AU + 38.534
2.16. Influence of Antifoam on Analytical Measurements
The influence of the antifoam agent Contraspum A 4050 on oxygen transfer, optical density measurements and FAME analysis was systematically evaluated. Detailed experimental procedures and results are provided in the Supplementary Materials. The experiments described in this section were performed to assess the potential influence of antifoam addition on analytical measurements. The obtained data were not used to correct or adjust the lipid titres, fatty acid profiles or other reported values presented in this study. Instead, these results were used solely to evaluate the potential magnitude of antifoam-related analytical artifacts and to support the interpretation of the results in the discussion.
2.17. Statistical Analysis
Statistical comparisons between cultivation conditions were performed for the datasets presented in Figures 2 and 4. Differences between groups were evaluated using Tukey test for multiple comparisons. The analysis was applied to compare the mean values obtained for the different nutrient regimes within each strain. All results are presented as mean values ± standard deviation based on biological replicates unless stated otherwise. Statistical significance was evaluated at p < 0.05. Statistical analyses were performed using OriginPro (VER. 10.0.0.154, OriginLab Corporation, Northampton, MA, USA).
3. Results
Economically viable SCO processes require not only high lipid contents but also sufficient biomass formation, favorable production rates, and process robustness, which were systematically evaluated in the following sections.
The four oleaginous yeasts investigated in this study exhibit distinct physiological traits that may affect their response to different nutrient limitation strategies. These differences motivated a systematic, reactor-scale comparison of phosphate-limited, nitrogen-limited and nutrient-replete (unlimited) cultivations across multiple strains under identical process conditions. For clarity, mean values across all four strains are presented in the main figures, while strain-specific results are provided in the Supplementary Materials.
3.1. Verification of Nutrient Limitation
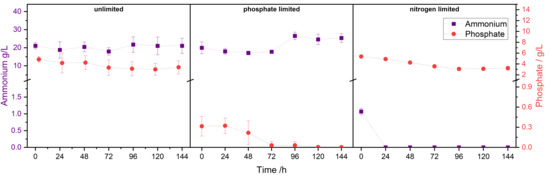
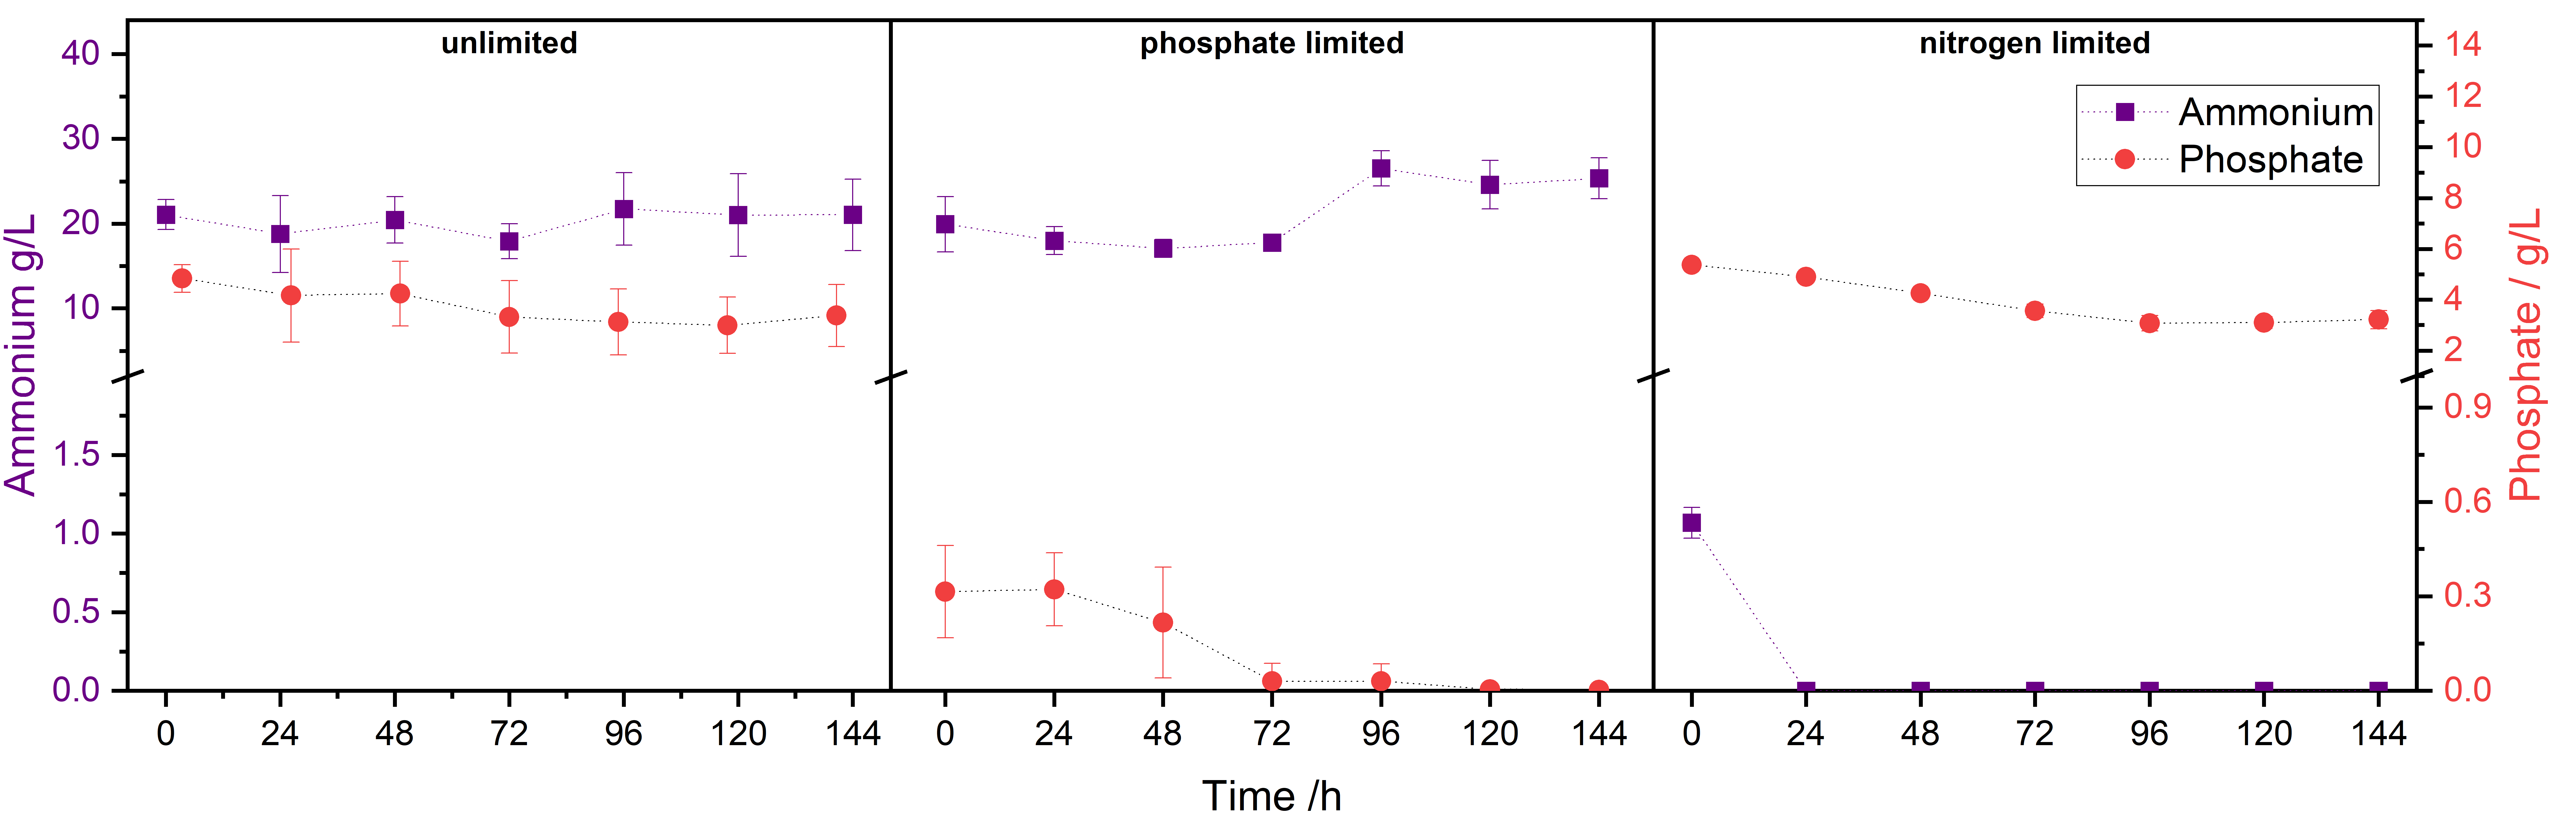
While nitrogen limitation represents the established strategy for lipid induction in oleaginous yeasts, phosphate limitation remains comparatively understudied, particularly at bioreactor scale. Ensuring well-defined and reproducible nutrient limitation was therefore a prerequisite for this study. Figure 1 shows the temporal evolution of ammonium and phosphate concentrations averaged across all strains under the three cultivation regimes. Averaged profiles are shown to illustrate the general limitation patterns, while strain-specific nutrient dynamics are provided in the Supplementary Materials (Figures S1–S4).
Figure 1.
Temporal profiles of ammonium and phosphate concentrations during nitrogen-limited, phosphate-limited and nutrient-replete (“unlimited”) bioreactor cultivations, shown as mean values across all duplicates of the four strains (n = 8). Dotted lines indicate trends for visual guidance only.
Under nutrient-replete conditions, neither ammonium nor phosphate concentrations decreased below 5 g L−1 throughout the cultivation, confirming the absence of macronutrient limitation. In phosphate-limited cultivations, phosphate concentrations decreased to undetectable levels (below the assay detection limit of 0.5 mg/L ortho-phosphate) after approximately 72 h, while ammonium concentrations remained above 15 g L−1, confirming selective phosphate limitation. In contrast, nitrogen-limited cultivations reached undetectable ammonium concentrations (below the assay detection limit of 0.1 mg/L ammonium) after approximately 24 h, whereas phosphate concentrations remained above 2 g L−1. The prolonged pH control phase observed in Figure S5 during nitrogen-limited cultivations until approximately 56 h coincided with the depletion of extracellular ammonium, whereas no comparable pH response was observed under phosphate-limited conditions. This difference reflects the distinct depletion kinetics of nitrogen and phosphate under the applied cultivation regimes and should be considered when interpreting lipid accumulation kinetics, particularly in short-term fermentations.
3.2. Biomass Formation Under Different Nutrient Regimes
Final cell dry weight (CDW) concentrations after 144 h are shown in Figure 2. The cultivation time of 144 h was selected to capture both the biomass formation phase and the subsequent production phase typically observed in oleaginous yeast cultivations. This duration corresponds to cultivation times commonly reported in the literature for oleaginous yeasts [33] and ensures that both growth and product formation beyond the exponential phase are adequately represented. Across all strains, phosphate-limited cultivations resulted in the lowest biomass concentrations, highlighting the pronounced influence of phosphate availability on growth. A. porosum achieved the highest CDW under nitrogen-limited conditions (35.74 ± 2.02 g L−1), exceeding biomass concentrations obtained under nutrient-replete conditions (32.45 ± 3.63 g L−1), while exhibiting the lowest CDW under phosphate-limited conditions (11.04 ± 3.22 g L−1). For this strain, CDW under nitrogen-limited conditions was significantly higher than under phosphate-limited conditions (p ≤ 0.001; Figure 2). Observed trends were consistent across biological replicates and are interpreted in the context of a controlled cross-strain benchmark rather than strain-specific optimization.
Figure 2.
Final cell dry weight (CDW) concentrations after 144 h of bioreactor cultivation under nitrogen-limited, phosphate-limited and nutrient-replete (“unlimited”) conditions for C. oleaginosum, S. podzolica, S. segobiensis and A. porosum. Bars represent mean values ± standard deviation of biological duplicates (n = 2). Statistical differences between nutrient regimes within each strain were evaluated using Tukey test. Statistical significance was tested at three predefined levels (* p ≤ 0.05, ** p ≤ 0.01, and *** p ≤ 0.001). However, only one comparison reached statistical significance and is therefore indicated in the graph as ***. The absence of additional * or ** annotations is intentional and indicates that all remaining comparisons did not meet any of the tested significance thresholds (p > 0.05).

In contrast, for C. oleaginosum only minor differences in final CDW between nutrient regimes were observed, suggesting a limited impact of phosphate availability on biomass formation under the applied conditions. Slightly higher CDW values observed under nitrogen-limited compared to nutrient-replete conditions may reflect changes in biomass composition rather than differences in growth. Previous genomic and transcriptomic studies have highlighted pronounced strain-specific physiological diversity and regulatory adaptations in oleaginous yeasts, including C. oleaginosum and S. podzolica [42,43]. For S. segobiensis, lower biomass concentrations compared to previously reported values were achieved [44], which is consistent with the intentionally unified cultivation conditions (22.5 °C, pH 4.0) applied here to ensure cross-strain comparability rather than strain-specific optimization.
3.3. Biomass Composition and Lipid Titres
Because biomass concentration alone does not reflect lipid productivity, biomass composition and absolute lipid titres were analyzed in detail. Protein, carbohydrate and lipid fractions were quantified using complementary analytical methods and combined to assess relative biomass composition (Figure 3).
Figure 3.
Average relative biomass composition of all oleaginous yeasts at the end of cultivation (144 h) under nutrient-replete (“unlimited”), phosphate-limited, and nitrogen-limited conditions measured in duplicate (n = 8). Strain-specific endpoint compositions are shown below (n = 2).
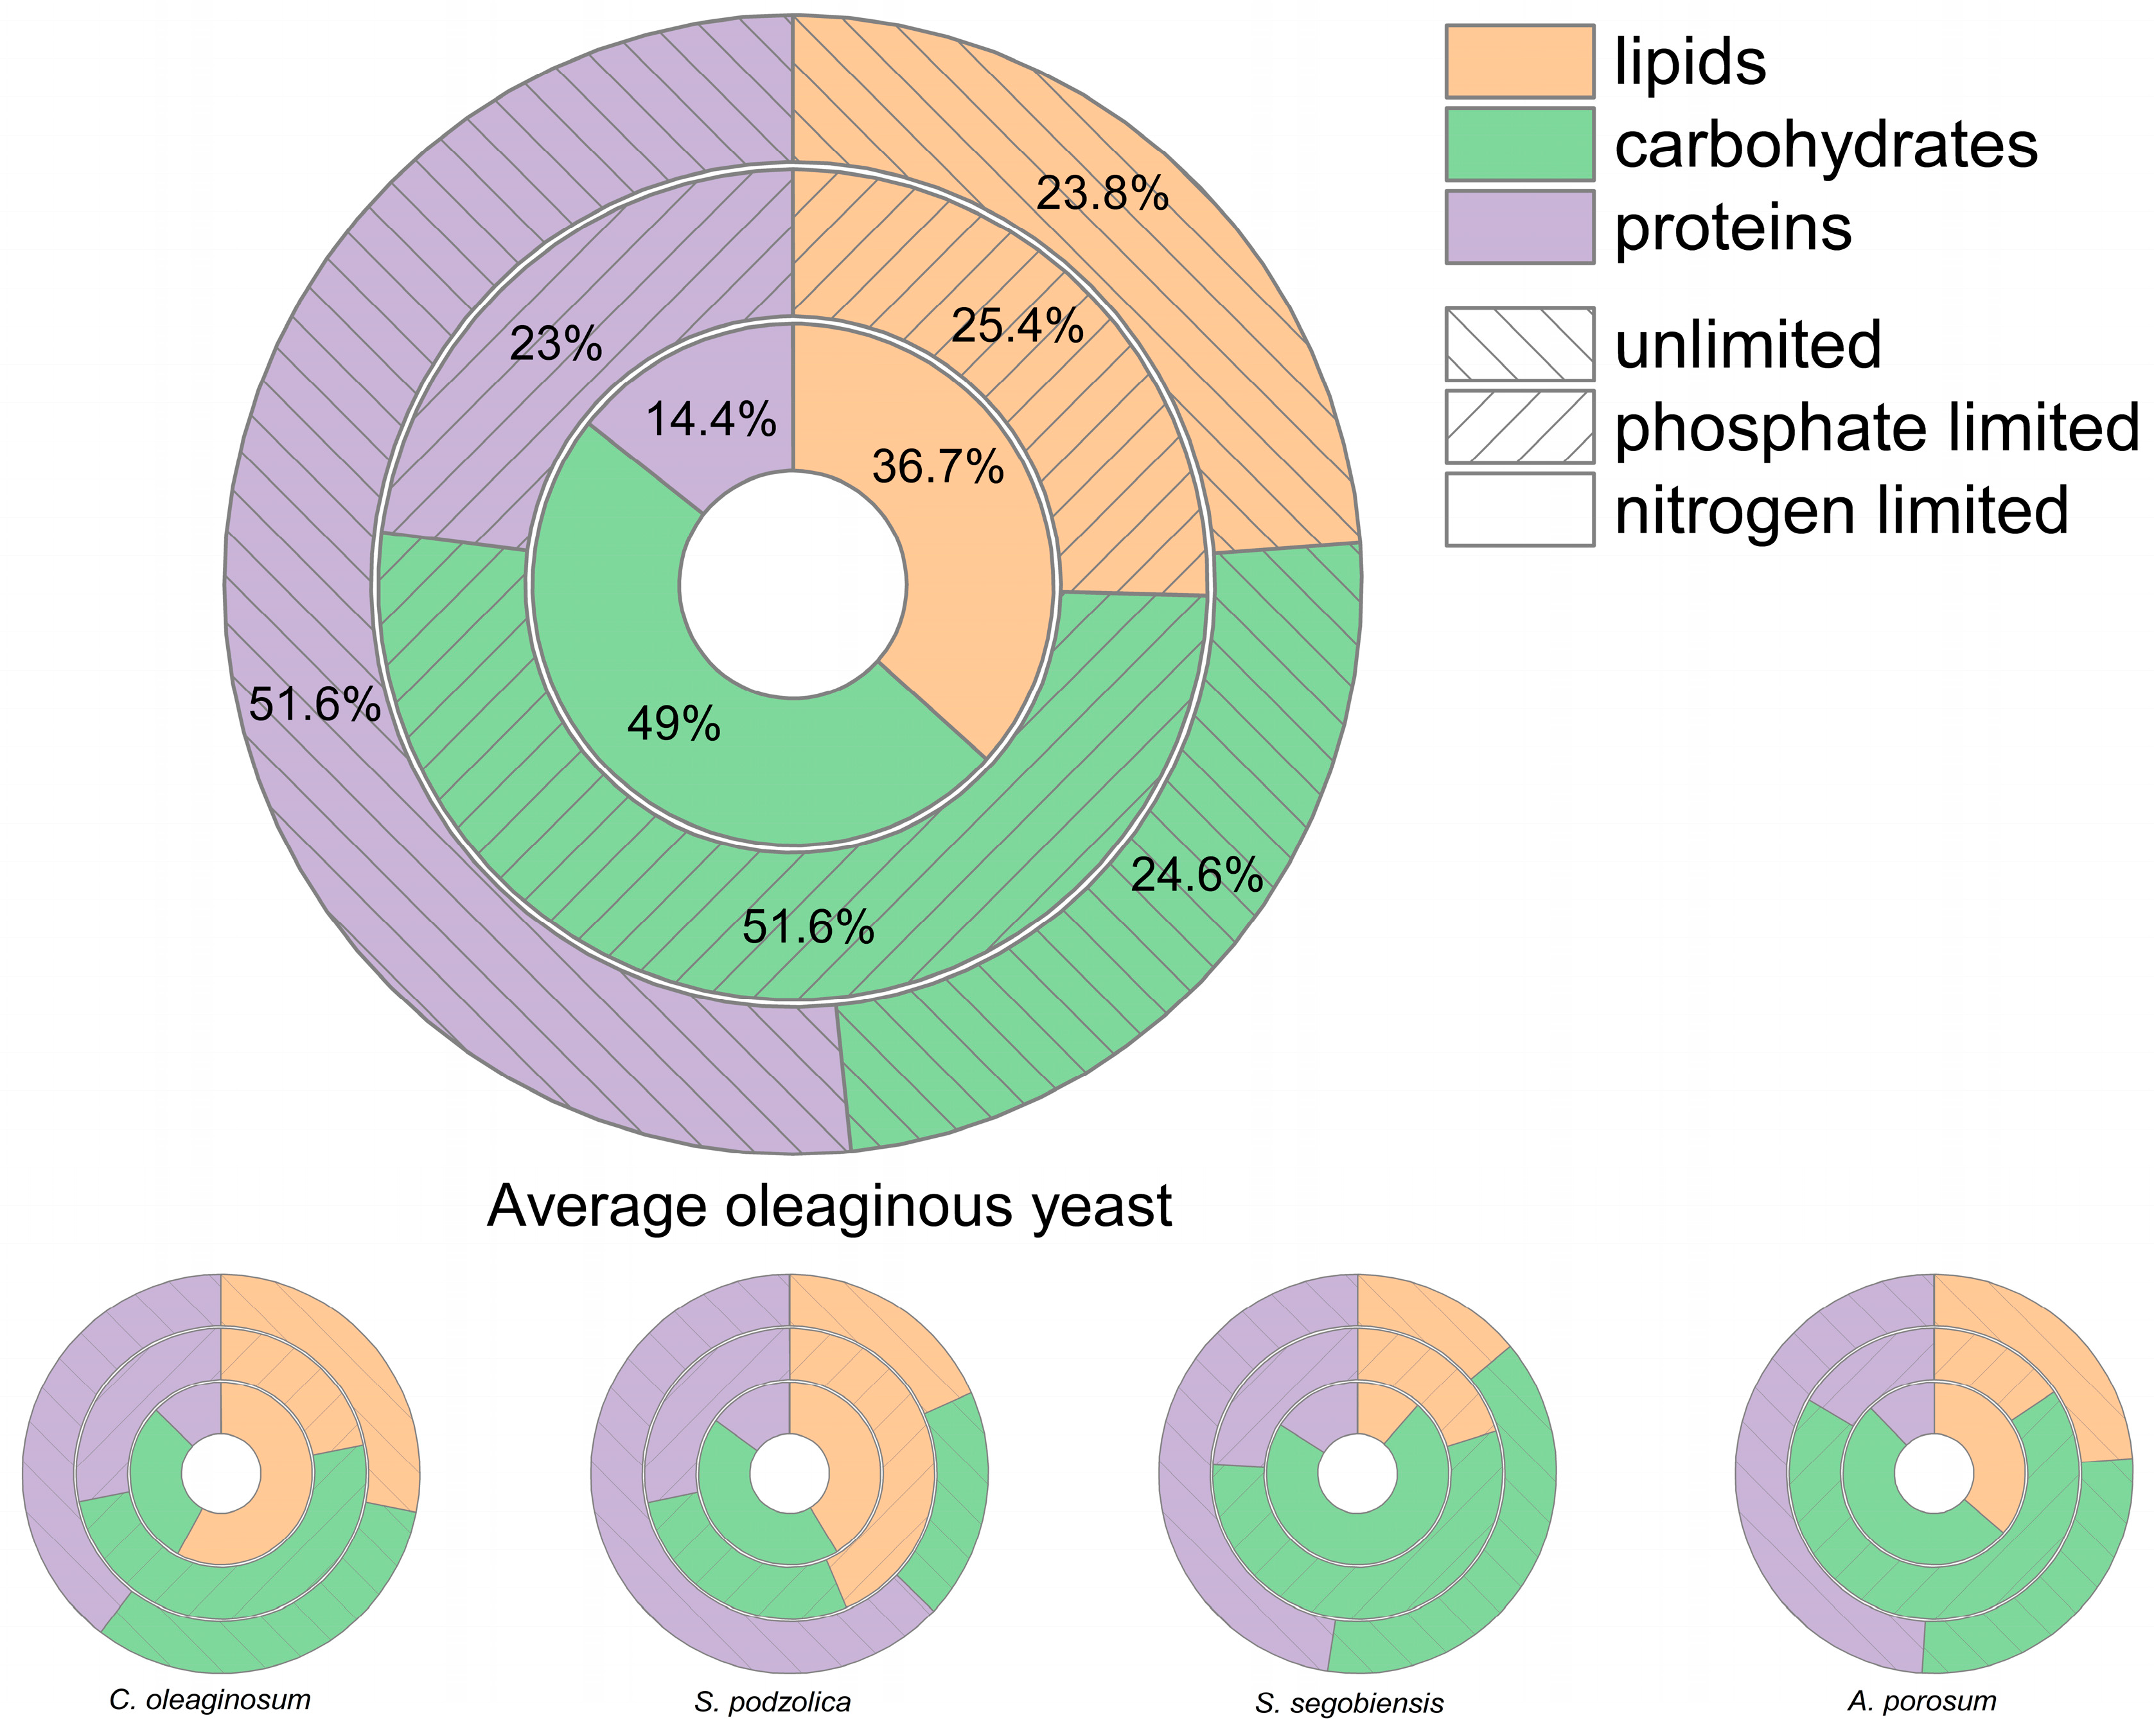
Clear trends emerged across nutrient regimes. On average, nitrogen limitation resulted in the highest relative lipid content (36.7%), whereas phosphate-limited biomass was characterized by the highest carbohydrate fractions (51.6%), and nutrient-replete biomass consisted predominantly of protein (51.6%). These differences highlight distinct carbon partitioning patterns under the applied nutrient regimes. Elevated carbohydrate fractions under phosphate- and nitrogen-limited conditions indicate sustained carbon incorporation into non-lipid biomass components under nutrient stress. The particularly high carbohydrate fractions observed under phosphate limitation suggest that carbon was preferentially redirected toward carbohydrate storage rather than lipid biosynthesis. In contrast to nitrogen limitation, phosphate limitation does not trigger the classical metabolic cascade associated with lipid accumulation in oleaginous yeasts, in which excess carbon is redirected toward acetyl-CoA and fatty acid synthesis following inhibition of isocitrate dehydrogenase [4]. Instead, phosphate scarcity primarily restricts growth-related processes while carbon assimilation continues, which may promote the accumulation of carbohydrate storage compounds. In addition, phosphate limitation occurred considerably later during the cultivation (~72 h) compared to nitrogen limitation (~24 h), thereby shortening the effective lipid accumulation phase. Consequently, cells had substantially less time to convert excess carbon into storage lipids, which likely contributed to the higher carbohydrate fractions observed under phosphate-limited conditions. This metabolic and temporal difference may explain why phosphate limitation resulted in higher carbohydrate fractions, whereas nitrogen limitation more strongly promoted lipid biosynthesis in the investigated strains.
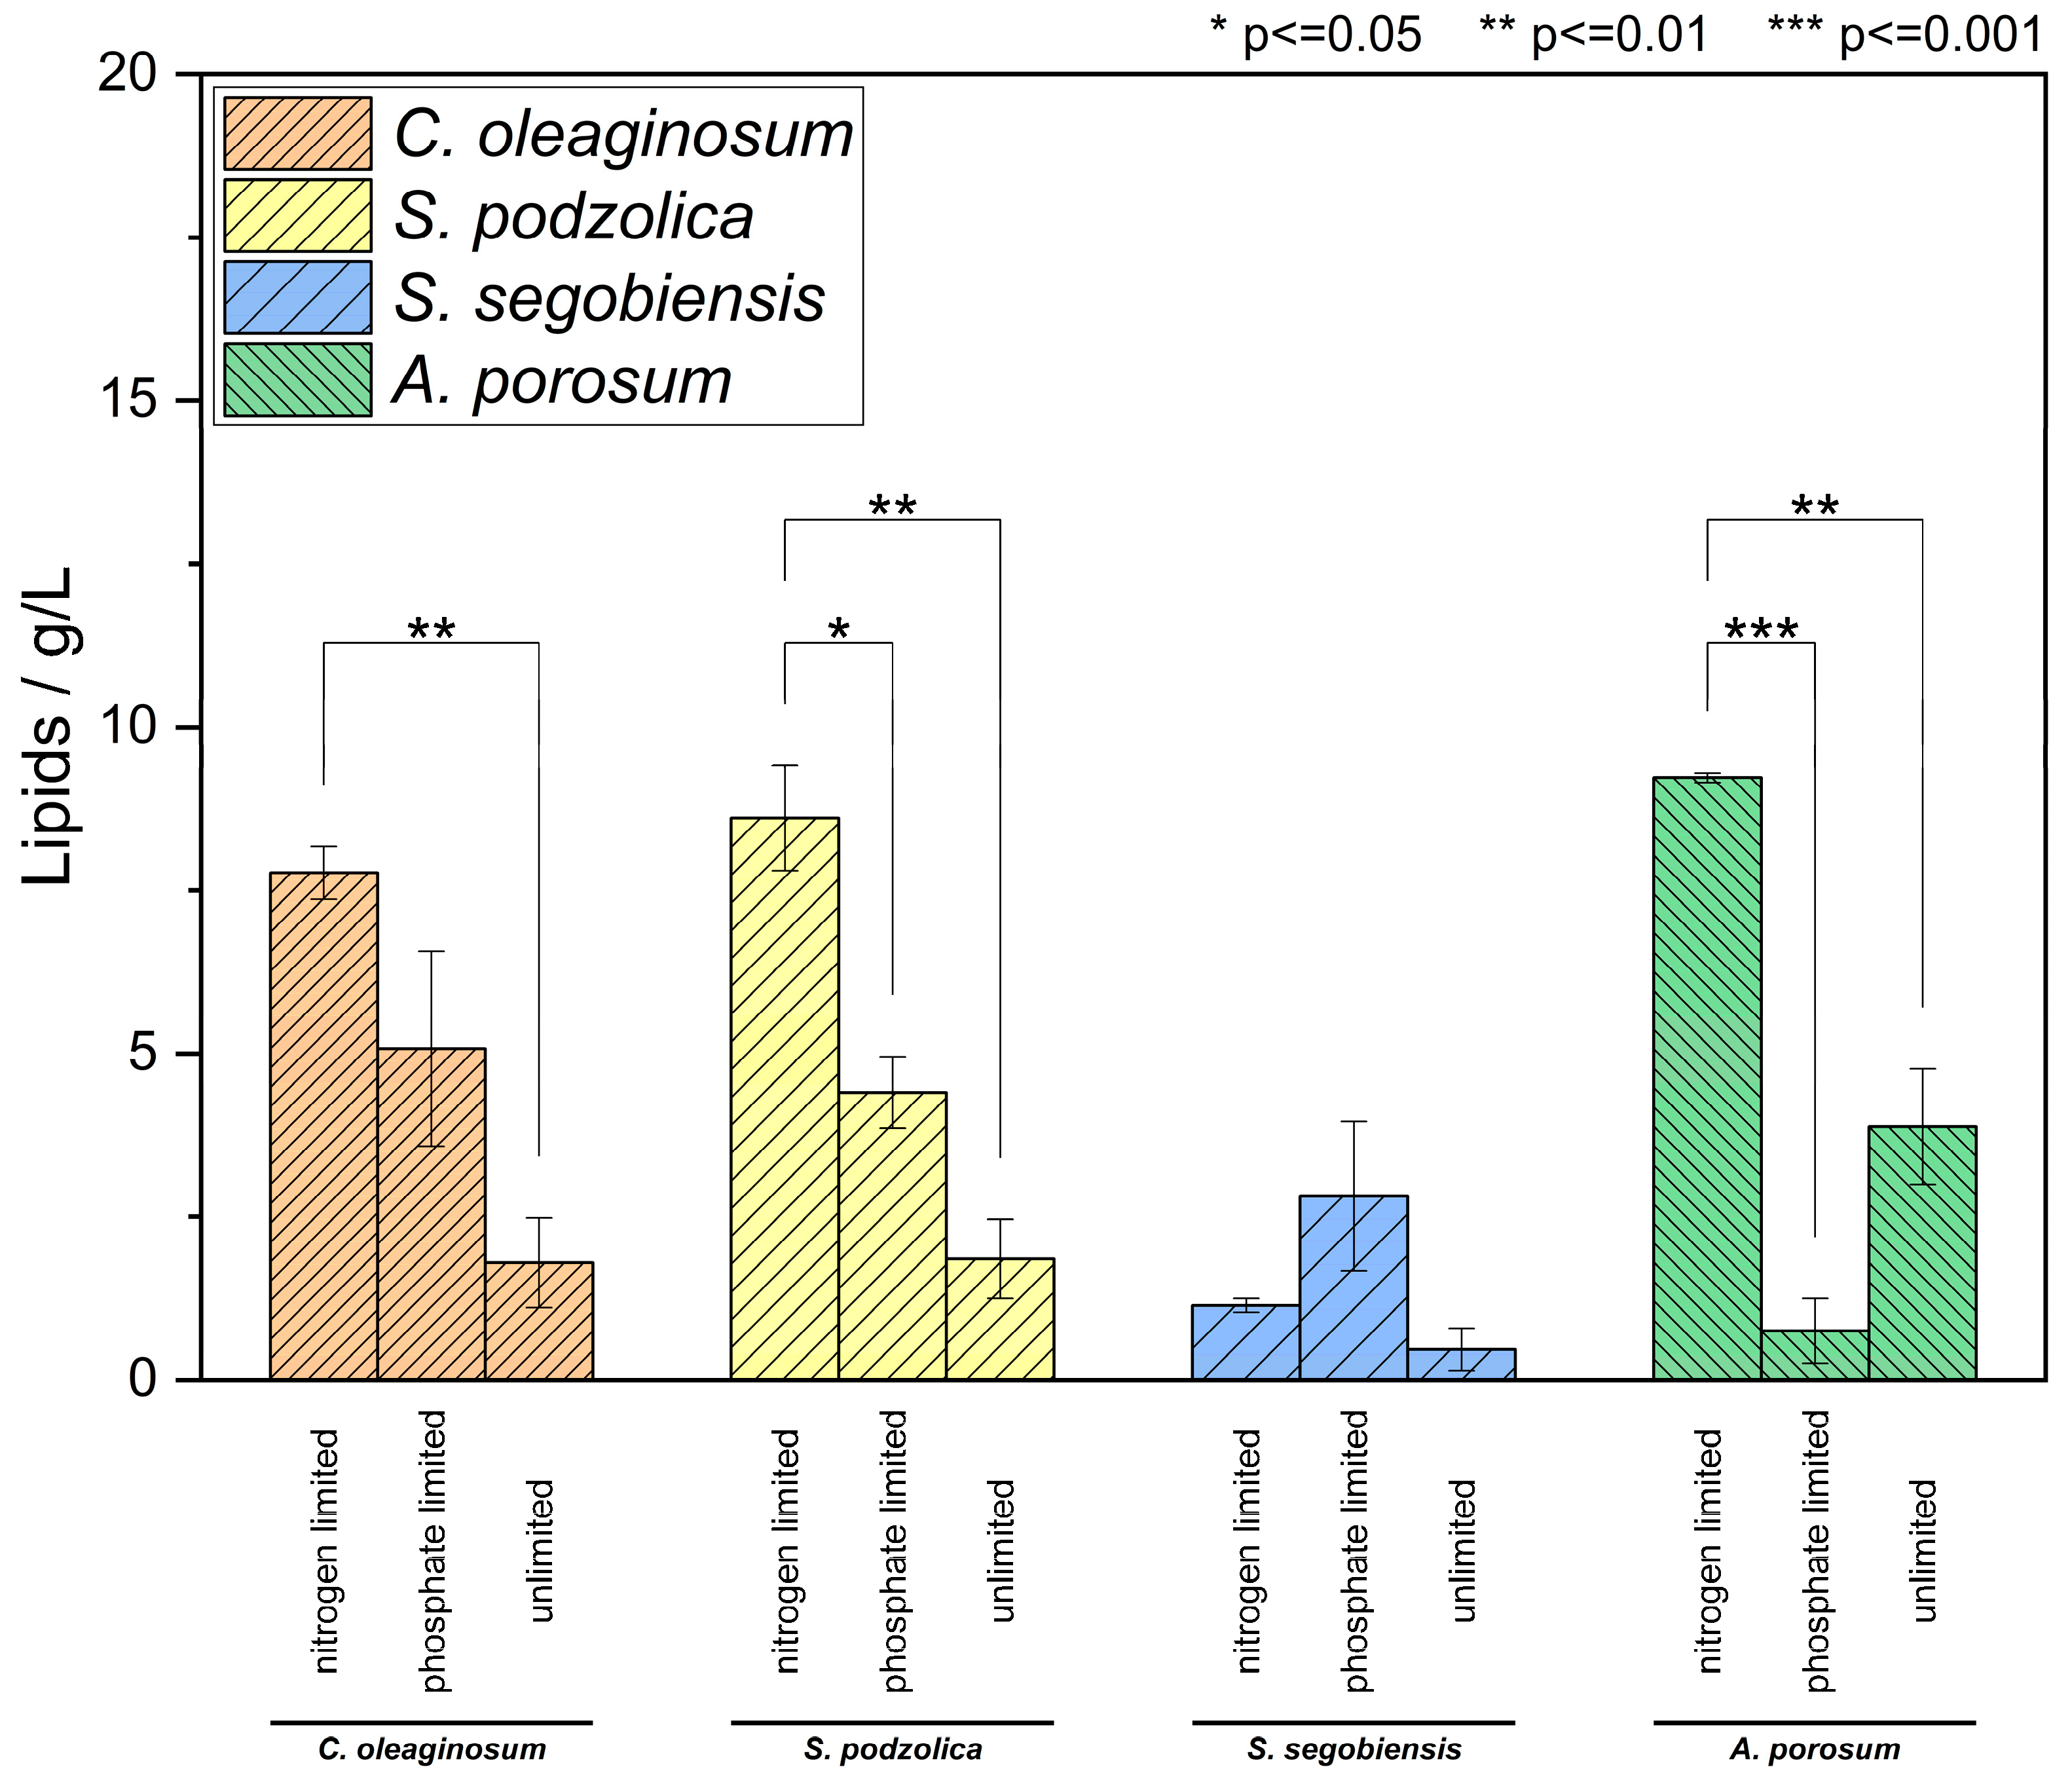
Strain-specific analysis revealed that while C. oleaginosum and A. porosum achieved their highest relative lipid contents under nitrogen-limited conditions, S. podzolica and S. segobiensis accumulated relatively higher lipid fractions under phosphate limitation. Absolute lipid titres (Figure 4) followed a similar trend: nitrogen limitation generally yielded the highest lipid titres, except for S. segobiensis, which reached its highest lipid titre under phosphate-limited conditions despite overall low lipid accumulation. For C. oleaginosum, nitrogen-limited cultivations resulted in significantly higher lipid titres compared to nutrient-replete conditions (p ≤ 0.01). Similarly, S. podzolica showed significantly higher lipid titres under nitrogen limitation compared to phosphate-limited (p ≤ 0.05) and nutrient-replete conditions (p ≤ 0.01). Although S. segobiensis showed its highest lipid titre under phosphate-limited conditions, this difference was not statistically significant. This observation nevertheless suggests that lipid accumulation in S. segobiensis may respond differently to nutrient limitation compared to the other strains investigated. Similar strain-specific responses have been reported previously and may reflect regulatory differences in carbon partitioning and fatty acid biosynthesis pathways in this organism [44]. In contrast, A. porosum did not accumulate substantial lipid amounts under phosphate-limited conditions, underscoring the strain-specific nature of lipid induction under phosphate limitation within the tested organism set. For this strain, nitrogen-limited cultivations resulted in significantly higher lipid titres than both phosphate-limited (p ≤ 0.001) and nutrient-replete conditions (p ≤ 0.01). This strain also exhibited markedly reduced biomass formation under phosphate limitation compared to nitrogen-limited and nutrient-replete conditions, suggesting a stronger growth dependency on phosphate availability. One possible explanation is that phosphate scarcity directly constrains cellular processes such as nucleic acid synthesis, ATP metabolism, and phospholipid biosynthesis, which are essential for cell proliferation [45]. Organisms with a stronger coupling between growth and membrane lipid turnover may therefore be more sensitive to phosphate limitation. In contrast, previous studies have shown that C. oleaginosum can exhibit considerable metabolic flexibility under nutrient stress, allowing continued lipid accumulation despite growth limitations. These differences highlight the strain-specific physiological responses to phosphate availability and further emphasize that phosphate-induced lipid accumulation is not universally conserved across oleaginous yeasts [4].
Figure 4.
Final lipid titres (g L−1) obtained after 144 h of bioreactor cultivation under nitrogen-limited, phosphate-limited and nutrient-replete (“unlimited”) conditions for all tested oleaginous yeast strains. Bars represent mean values ± standard deviation of biological duplicates (n = 2). Statistical differences between nutrient regimes within each strain were evaluated using Tukey test. Significance levels are indicated as * p ≤ 0.05, ** p ≤ 0.01, and *** p ≤ 0.001.
3.4. Oxygen Consumption, Carbon Utilization and By-Product Formation
Lipid biosynthesis is energetically demanding and requires substantial reducing power, which is predominantly generated under aerobic conditions through respiratory metabolism. Accordingly, nitrogen-limited cultivations exhibited higher oxygen consumption than phosphate-limited cultivations, while under both limitation regimes oxygen uptake exceeded that observed under nutrient-replete conditions (Figures S7–S16). This trend reflects the increased metabolic activity associated with lipid accumulation under nutrient limitation.
Carbon source utilization differed markedly between nutrient regimes. Nitrogen-limited cultivations (with exception of S. segobiensis) consumed more glucose than phosphate-limited and nutrient-replete cultivations (Figure S17), resulting in higher lipid yields on glucose (Table S2). In contrast, nutrient-replete cultivations generally resulted in the lowest lipid yields, indicating preferential carbon allocation toward biomass formation rather than storage lipid synthesis. An exception was observed for A. porosum, which exhibited its lowest lipid yield under phosphate-limited conditions.
The formation of metabolic by-products such as gluconic acid and ethanol had further influence on process efficiency (Table S3). Under nitrogen limitation, highest gluconic acid yields were observed using S. podzolica, while highest ethanol yields were achieved by S. segobiensis. C. oleaginosum produced increased amounts of gluconic acid under phosphate limitation. Overall, by-product formation did not follow a consistent pattern across nutrient regimes and appeared to be predominantly strain dependent, suggesting that carbon flux to by-product formation is governed by organism-specific metabolic traits rather than by the applied limitation strategy.
3.5. Lipid Production Rates and Process Implications
To enable comparison independent of cultivation time and organism, volumetric and specific lipid production rates were evaluated and benchmarked against literature data (Table 1 and Table S4). When considering overall volumetric lipid production rates, nitrogen limitation generally resulted in higher values than phosphate limitation due to enhanced biomass formation, except for S. segobiensis. Production rates obtained for C. oleaginosum, S. podzolica and A. porosum were within the range of previously reported values under comparable reactor-scale conditions [33,41,46], while lower rates observed for S. segobiensis under nitrogen limitation are consistent with earlier reports [44].
Table 1.
Volumetric lipid production rates (g L−1 h−1) and specific lipid production rates (g gCDW−1 h−1) calculated during the nutrient-limitation phase (N or P below detection limit in media until 144 h) for all tested oleaginous yeast strains under nitrogen- and phosphate-limited conditions (n = 3).
Importantly, when evaluating lipid production rates specifically during the nutrient-limitation phase, differences between nitrogen- and phosphate-limited cultivations were substantially reduced. A particularly notable observation was obtained for S. podzolica, which exhibited a higher specific lipid production rate under phosphate limitation (0.0037 ± 0.0005 g gCDW−1 h−1) than under nitrogen limitation (0.0028 ± 0.0004 g gCDW−1 h−1). This finding directly supports the concept that phosphate limitation can enhance lipid productivity at the cellular level independently of biomass formation. Similar trends were also observed for C. oleaginosum, where specific lipid production rates under phosphate limitation were comparable or slightly higher than under nitrogen limitation despite lower biomass concentrations. These observations indicate that under phosphate-limited conditions biomass formation, rather than lipid synthesis capacity, represents the primary bottleneck. From a process perspective, these findings suggest that phosphate limitation is particularly suited for long-term or two-stage processes with controlled biomass formation, as well as for the utilization of nitrogen-rich side streams such as molasses, grass juice, wastewater-derived substrates, hydrolysates or protein-rich residues [47,48,49,50,51,52,53]. In contrast, nitrogen limitation remains advantageous for short-term fermentations targeting rapid biomass accumulation and high final lipid titres.
3.6. Fatty Acid Profiles and Derived Properties
While lipid titres and production rates represent the primary performance indicators for SCO processes, fatty acid composition may influence the suitability of the produced lipids for specific applications. Changes in fatty acid composition under nutrient limitation are primarily driven by alterations in central carbon metabolism and lipid biosynthetic regulation. Under nitrogen-limited conditions, excess carbon that cannot be utilized for biomass formation is redirected toward de novo lipid synthesis. This metabolic shift increases the availability of cytosolic acetyl-CoA and NADPH, thereby promoting fatty acid elongation and desaturation reactions that typically lead to higher proportions of C18 fatty acids such as oleic acid [4,20]. In contrast, phosphate limitation affects lipid metabolism mainly through changes in membrane lipid homeostasis. As phosphate is an essential component of phospholipids, phosphate scarcity can trigger adaptive remodeling of cellular lipid composition, including adjustments in fatty acid chain length and degree of unsaturation to maintain membrane functionality and cellular homeostasis under nutrient stress [27,29,45].
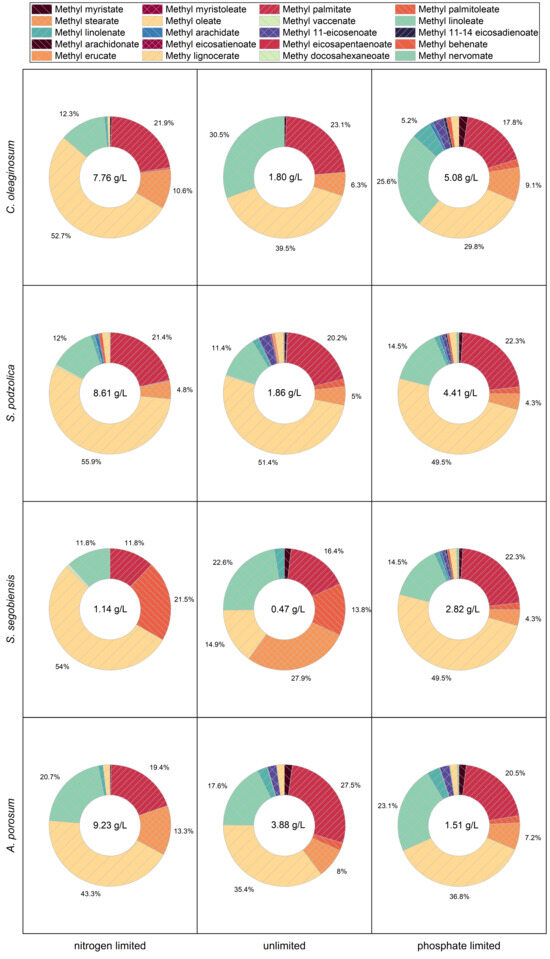
Fatty acid profiles determined after 144 h of cultivation are shown in Figure 5. In general, prolonged oleogenic phases were associated with increased proportions of longer-chain and more unsaturated fatty acids, with nitrogen limitation exhibiting the most pronounced effect, followed by phosphate limitation. Nitrogen-limited cultivations resulted in the highest relative oleic acid contents, whereas phosphate-limited and nutrient-replete conditions led to increased proportions of shorter-chain fatty acids such as myristic acid. The lipid profile of S. segobiensis displayed elevated palmitoleic acid fractions under nutrient-replete conditions.
Figure 5.
Fatty acid profiles after 144 h of cultivation under nitrogen-limited, phosphate-limited and nutrient-replete (unlimited) conditions. Fatty acids were quantified as fatty acid methyl esters by gas chromatography. The total lipid titre (g L−1) is indicated in the center of each diagram (n = 3).
Within the applied cultivation timeframe, phosphate limitation was associated with an increased overall degree of unsaturation. While a higher degree of unsaturation is advantageous for nutritional and medical applications, it can negatively affect combustion-related fuel properties [41,54]. Fuel-relevant parameters calculated from fatty acid profiles (Table S5) fell within ranges characteristic of biodiesel-like fuels, indicating that nutrient limitation influences lipid quality, although further optimization would be required for fuel-oriented applications.
3.7. Influence of Antifoam on Analytical Readouts
Finally, the influence of the antifoam agent Contraspum A 4050 on optical density measurements, oxygen transfer rates and FAME analysis was evaluated (Figures S19–S21). Minor but measurable effects were observed across all analytical methods, highlighting the importance of considering antifoam-induced artifacts in quantitative bioprocess analyses. Increased antifoam addition was required for A. porosum cultivations due to pronounced foaming behavior observed under the applied cultivation conditions. Although higher antifoam concentrations were therefore applied for this strain, the performed control experiments demonstrated that the resulting analytical deviations remained small and within the overall experimental variability. Consequently, the increased antifoam usage was considered necessary for stable process operation but did not affect the comparability of the obtained results between strains.
4. Conclusions
This study provides a systematic, reactor-scale benchmark of phosphate- and nitrogen-limited SCO production across four oleaginous yeasts, with a specific focus on rate-based performance metrics. While nitrogen limitation yielded the highest lipid titres due to enhanced biomass formation, phosphate limitation resulted in comparable or higher specific lipid production rates in selected strains. These findings indicate that phosphate limitation can decouple cellular lipid productivity from biomass formation. However, the overall lipid titres remained lower under phosphate limitation due to reduced biomass formation, highlighting biomass generation as the primary limiting factor under these conditions.
From a process perspective, phosphate limitation may therefore be particularly advantageous in process configurations where biomass formation is controlled separately from the lipid production phase, such as two-stage fermentations or long-term processes using nitrogen-rich side streams. In contrast, nitrogen limitation remains advantageous for short-term fermentations targeting rapid biomass accumulation and high final lipid titres. By explicitly distinguishing between biomass-driven and rate-driven process regimes, this study provides a framework for selecting nutrient limitation strategies based on process objectives rather than final lipid titres alone. As a practical guideline, phosphate limitation becomes particularly attractive when nitrogen-rich substrates exhibit low initial C/N ratios (<20–30). Under such conditions, achieving the high C/N ratios typically required for nitrogen-limited lipid induction (commonly C/N ≈ 60–120) would require substantial carbon supplementation or nitrogen removal. In these cases, phosphate limitation allows lipid accumulation to be induced without extensive adjustment of the feedstock composition, making it a more practical strategy for nitrogen-rich side streams [1,4].
Future work may also explore whether targeted metabolic engineering strategies, guided by transcriptomic insights into nutrient-limitation responses, could mitigate the biomass bottleneck observed under phosphate-limited conditions. However, overcoming phosphate limitation through genetic engineering remains inherently challenging, as phosphorus is an essential component of central cellular processes including ATP synthesis, nucleic acid metabolism and membrane phospholipid formation [27,29]. Consequently, cellular growth under phosphate scarcity is fundamentally constrained by biochemical requirements. Future strain engineering approaches may therefore focus on improving phosphorus use efficiency or regulatory adaptation to phosphate stress rather than eliminating phosphorus dependency altogether [22,45].
Supplementary Materials
The following supporting information can be downloaded at: https://www.mdpi.com/article/10.3390/fermentation12040172/s1, Figure S1: Temporal profiles of ammonium and phosphate concentrations during nitrogen-limited, phosphate-limited and nutrient-replete cultivations of Cutaneotrichosporon oleaginosum, shown as mean values (n = 2). Dotted lines indicate trends for visual guidance only; Figure S2: Temporal profiles of ammonium and phosphate concentrations during nitrogen-limited, phosphate-limited and nutrient-replete cultivations of Saitozyma podzolica, shown as mean values (n = 2). Dotted lines indicate trends for visual guidance only; Figure S3: Temporal profiles of ammonium and phosphate concentrations during nitrogen-limited, phosphate-limited and nutrient-replete cultivations of Scheffersomyces segobiensis, shown as mean values (n = 2). Dotted lines indicate trends for visual guidance only; Figure S4: Temporal profiles of ammonium and phosphate concentrations during nitrogen-limited, phosphate-limited and nutrient-replete cultivations of Apiotrichum porosum, shown as mean values (n = 2). Dotted lines indicate trends for visual guidance only; Figure S5: Correlation between cumulative base addition and ammonium depletion during nitrogen-limited cultivation of Cutaneotrichosporon oleaginosum (n = 2). Dotted lines indicate trends for visual guidance only; Figure S6: Representative cultivation profiles of Cutaneotrichosporon oleaginosum under nitrogen-limited, phosphate-limited and nutrient-replete conditions. Dotted lines indicate trends for visual guidance only; Figure S7: Time to minimum dissolved oxygen concentration and minimum dissolved oxygen levels during bioreactor cultivations, shown as mean values across all tested oleaginous yeast strains (n = 5); Figure S8: Average dissolved oxygen profiles and cumulative oxygen consumption during bioreactor cultivations under nitrogen-limited, phosphate-limited and nutrient-replete conditions (n = 6–8); Figure S9: Time to minimum dissolved oxygen concentration and minimum dissolved oxygen levels during cultivation of Cutaneotrichosporon oleaginosum (n = 2). Phosphate-limited cultivation is shown as a single replicate; Figure S10: Time to minimum dissolved oxygen concentration and minimum dissolved oxygen levels during cultivation of Saitozyma podzolica (n = 2). Phosphate-limited cultivation is shown as a single replicate; Figure S11: Time to minimum dissolved oxygen concentration and minimum dissolved oxygen levels during cultivation of Scheffersomyces segobiensis (n = 2). Phosphate-limited cultivation is shown as a single replicate; Figure S12: Time to minimum dissolved oxygen concentration and minimum dissolved oxygen levels during cultivation of Apiotrichum porosum (n = 2); Figure S13: Integrated dissolved oxygen profiles and cumulative oxygen transfer rates during cultivation of Cutaneotrichosporon oleaginosum (n = 2); Figure S14: Integrated dissolved oxygen profiles and cumulative oxygen transfer rates during cultivation of Saitozyma podzolica (n = 2). Phosphate-limited cultivation is shown as a single replicate; Figure S15: Integrated dissolved oxygen profiles and cumulative oxygen transfer rates during cultivation of Scheffersomyces segobiensis (n = 2); Figure S16: Integrated dissolved oxygen profiles and cumulative oxygen transfer rates during cultivation of Apiotrichum porosum (n = 2); Figure S17: Total glucose consumption during bioreactor cultivations under nitrogen-limited, phosphate-limited and nutrient-replete conditions (1.2 L working volume; n = 6); Figure S18: Strain-specific glucose consumption during bioreactor cultivations under nitrogen-limited, phosphate-limited and nutrient-replete conditions; Figure S19: Effect of increasing Contraspum A 4050 concentrations on optical density measurements. Dotted lines indicate trends for visual guidance only; Figure S20: Fatty acid methyl ester signal obtained from pure Contraspum A 4050 subjected to the transesterification and gas chromatographic analysis protocol; Figure S21: Effect of increasing Contraspum A 4050 concentrations on oxygen transfer rate measurements. Dotted lines indicate trends for visual guidance only; Tabel S1: Initial nitrogen and phosphorus concentrations in the mineral salt solutions used for nitrogen-limited, phosphate-limited and nutrient-replete cultivations (unlimited), excluding yeast extract; Tabel S2: Lipid yield on glucose for all tested oleaginous yeast strains under nitrogen-limited, phosphate-limited and nutrient-replete conditions; Tabel S3: Yields of gluconic acid and ethanol per gram of consumed glucose for all tested oleaginous yeast strains under nitrogen-limited, phosphate-limited and nutrient-replete conditions. Gluconic acid formation in C. oleaginosum was additionally confirmed qualitatively using a commercial assay kit; Tabel S4: Comparison of lipid production rates obtained in this study with literature-reported values for selected oleaginous yeasts under nitrogen-limited conditions; Tabel S5: Chemical properties (average unsaturation (AU), Cetane number (CN), Iodine value (IV), kinematic viscosity (KV), specific gravity (SG) and heating value (HV)) of determined fatty acid profiles calculated after Qian et al. [41].
Author Contributions
Conceptualization, K.E.S.; methodology, K.E.S.; validation, K.E.S., B.D., P.H. and L.R.; formal analysis, K.E.S.; investigation, K.E.S., B.D., P.H. and L.R.; resources, A.N.; data curation, K.E.S.; writing—original draft preparation, K.E.S.; writing—review and editing, K.E.S., A.N., C.D.M., W.F. and K.O.; visualization, K.E.S.; supervision, K.E.S., A.N. and K.O.; project administration, A.N. and W.F.; funding acquisition, A.N., W.F. and K.O. All authors have read and agreed to the published version of the manuscript.
Funding
K.E.S. and this work were funded by the project, FKZ 2220NR099B ELEGANT (Elektroimpulsbehandlung von Hefen zum Upcycling agroindustrieller Reststoffe zu Bioschmierstoffen und Einzellerproteinen.) from the German Bundesministerium für Ernährung und Landwirtschaft.
Institutional Review Board Statement
Not applicable.
Informed Consent Statement
Not applicable.
Data Availability Statement
The original contributions presented in this study are included in the article and Supplementary Materials. Further inquiries can be directed to the corresponding author.
Acknowledgments
The authors would like to thank Michaela Kugel for her valuable support and practical training in the operation of stirred-tank reactors, which was essential for the successful execution of the bioreactor experiments.
Conflicts of Interest
The authors declare no conflicts of interest.
Abbreviations
The following abbreviations are used in this manuscript:
| AMP | Adenosine monophosphate |
| ATCC | American Type Culture Collection |
| AU | Average unsaturation |
| CDW | Cell dry weight |
| CN | Cetane number |
| DSM | Deutsche Sammlung von Mikroorganismen und Zellkulturen |
| FAMEs | Fatty acid methyl esters |
| FID | Flame ionization detector |
| GC | Gas chromatography |
| HPLC | High-performance liquid chromatography |
| HV | Heating value |
| IV | Iodine value |
| KV | Kinematic viscosity |
| OD600 | Optical density at 600 nm |
| pO2 | Partial pressure of oxygen |
| rpm | Revolutions per minute |
| SCOs | Single-cell oils |
| SG | Specific gravity |
| vvm | Volume of gas per volume of liquid per minute |
References
- Ratledge, C. Fatty acid biosynthesis in microorganisms being used for Single Cell Oil production. Biochimie 2004, 86, 807–815. [Google Scholar] [CrossRef] [Scilit]
- Ochsenreither, K.; Gluck, C.; Stressler, T.; Fischer, L.; Syldatk, C. Production Strategies and Applications of Microbial Single Cell Oils. Front. Microbiol. 2016, 7, 1539. [Google Scholar] [CrossRef] [Scilit]
- Mata, T.M.; Martins, A.A.; Caetano, N.S. Microalgae for biodiesel production and other applications: A review. Renew. Sustain. Energy Rev. 2010, 14, 217–232. [Google Scholar] [CrossRef] [Scilit]
- Papanikolaou, S.; Aggelis, G. Lipids of oleaginous yeasts. Part I: Biochemistry of single cell oil production. Eur. J. Lipid Sci. Technol. 2011, 113, 1031–1051. [Google Scholar] [CrossRef] [Scilit]
- Athenaki, M.; Gardeli, C.; Diamantopoulou, P.; Tchakouteu, S.S.; Sarris, D.; Philippoussis, A.; Papanikolaou, S. Lipids from yeasts and fungi: Physiology, production and analytical considerations. J. Appl. Microbiol. 2018, 124, 336–367. [Google Scholar] [CrossRef] [Scilit]
- Koreti, D.; Kosre, A.; Jadhav, S.K.; Chandrawanshi, N.K. A comprehensive review on oleaginous bacteria: An alternative source for biodiesel production. Bioresour. Bioprocess 2022, 9, 47. [Google Scholar] [CrossRef] [Scilit] [PubMed]
- Gu, D.; Andreev, K.; Dupre, M.E. Major Trends in Population Growth Around the World. China CDC Wkly. 2021, 3, 604–613. [Google Scholar] [CrossRef] [Scilit]
- Abbass, K.; Qasim, M.Z.; Song, H.; Murshed, M.; Mahmood, H.; Younis, I. A review of the global climate change impacts, adaptation, and sustainable mitigation measures. Environ. Sci. Pollut. Res. Int. 2022, 29, 42539–42559. [Google Scholar] [CrossRef] [Scilit] [PubMed]
- Vasudevan, P.T.; Briggs, M. Biodiesel production--current state of the art and challenges. J. Ind. Microbiol. Biotechnol. 2008, 35, 421. [Google Scholar] [CrossRef] [Scilit]
- Ageitos, J.M.; Vallejo, J.A.; Veiga-Crespo, P.; Villa, T.G. Oily yeasts as oleaginous cell factories. Appl. Microbiol. Biotechnol. 2011, 90, 1219–1227. [Google Scholar] [CrossRef] [Scilit]
- Ward, O.P.; Singh, A. Omega-3/6 fatty acids: Alternative sources of production. Process Biochem. 2005, 40, 3627–3652. [Google Scholar] [CrossRef] [Scilit]
- Xu, J.; Du, W.; Zhao, X.; Liu, D. Renewable microbial lipid production from Oleaginous Yeast: Some surfactants greatly improved lipid production of Rhodosporidium toruloides. World J. Microbiol. Biotechnol. 2016, 32, 107. [Google Scholar] [CrossRef] [Scilit] [PubMed]
- Liang, M.H.; Jiang, J.G. Advancing oleaginous microorganisms to produce lipid via metabolic engineering technology. Prog. Lipid Res. 2013, 52, 395–408. [Google Scholar] [CrossRef] [Scilit] [PubMed]
- Pérez-Rivero, C.; López-Gómez, J.P. Unlocking the Potential of Fermentation in Cosmetics: A Review. Fermentation 2023, 9, 463. [Google Scholar] [CrossRef] [Scilit]
- Wierzchowska, K.; Roszko, M.; Derewiaka, D.; Szulc, K.; Zieniuk, B.; Nowak, D.; Fabiszewska, A. Yeast lipids as a sustainable source of nutrients in dairy products analogs. Food Biosci. 2024, 62, 105321. [Google Scholar] [CrossRef] [Scilit]
- Kyle, D.J.; Ratledge, C. Industrial Applications of Single Cell Oils; American Oil Chemists’ Society: Champaign, IL, USA, 1992. [Google Scholar]
- Leesing, R.; Siwina, S.; Ngernyen, Y.; Fiala, K. Innovative approach for co-production of single cell oil (SCO), novel carbon-based solid acid catalyst and SCO-based biodiesel from fallen Dipterocarpus alatus leaves. Renew. Energy 2022, 185, 47–60. [Google Scholar] [CrossRef] [Scilit]
- Khan, N.; Sudhakar, K.; Mamat, R. Role of Biofuels in Energy Transition, Green Economy and Carbon Neutrality. Sustainability 2021, 13, 12374. [Google Scholar] [CrossRef] [Scilit]
- Chi, Z.; Zheng, Y.; Ma, J.; Chen, S. Oleaginous yeast Cryptococcus curvatus culture with dark fermentation hydrogen production effluent as feedstock for microbial lipid production. Int. J. Hydrogen Energy 2011, 36, 9542–9550. [Google Scholar] [CrossRef] [Scilit]
- Klug, L.; Daum, G. Yeast lipid metabolism at a glance. FEMS Yeast Res. 2014, 14, 369–388. [Google Scholar] [CrossRef] [Scilit]
- Bao, R.; Wu, X.; Liu, S.; Xie, T.; Yu, C.; Lin, X. Efficient Conversion of Fructose-Based Biomass into Lipids with Trichosporon fermentans Under Phosphate-Limited Conditions. Appl. Biochem. Biotechnol. 2018, 184, 113–123. [Google Scholar] [CrossRef] [Scilit]
- Abeln, F.; Chuck, C.J. The history, state of the art and future prospects for oleaginous yeast research. Microb. Cell Fact. 2021, 20, 221. [Google Scholar] [CrossRef] [Scilit]
- Aziz, M.M.A.; Kassim, K.A.; Shokravi, Z.; Jakarni, F.M.; Liu, H.Y.; Zaini, N.; Tan, L.S.; Islam, A.B.M.S.; Shokravi, H. Two-stage cultivation strategy for simultaneous increases in growth rate and lipid content of microalgae: A review. Renew. Sustain. Energy Rev. 2020, 119, 109621. [Google Scholar] [CrossRef] [Scilit]
- Nasseri, A.T.; Rasoul-Ami, S.; Morowvat, M.H.; Ghasemi, Y. Single Cell Protein: Production and Process. Am. J. Food Technol. 2011, 6, 103–116. [Google Scholar] [CrossRef] [Scilit]
- Mordenti, A.L.; Giaretta, E.; Campidonico, L.; Parazza, P.; Formigoni, A. A Review Regarding the Use of Molasses in Animal Nutrition. Animals 2021, 11, 115. [Google Scholar] [CrossRef] [Scilit] [PubMed]
- Tiessen, H. Phosphorus in the global environment. In The Ecophysiology of Plant-Phosphorus Interactions; Plant Ecophysiology; Springer: Berlin/Heidelberg, Germany, 2008; pp. 1–7. [Google Scholar]
- Vitousek, P.M.; Porder, S.; Houlton, B.Z.; Chadwick, O.A. Terrestrial phosphorus limitation: Mechanisms, implications, and nitrogen-phosphorus interactions. Ecol. Appl. 2010, 20, 5–15. [Google Scholar] [CrossRef] [Scilit]
- Larsen, S. Phosphorus—A limiting factor in future food production. Neth. J. Agric. Sci. 1974, 22, 270–274. [Google Scholar] [CrossRef] [Scilit]
- Elser, J.J. Phosphorus: A limiting nutrient for humanity? Curr. Opin. Biotechnol. 2012, 23, 833–838. [Google Scholar] [CrossRef] [Scilit]
- Wu, S.; Hu, C.; Jin, G.; Zhao, X.; Zhao, Z.K. Phosphate-limitation mediated lipid production by Rhodosporidium toruloides. Bioresour. Technol. 2010, 101, 6124–6129. [Google Scholar] [CrossRef] [Scilit]
- Morales-Palomo, S.; Tomas-Pejo, E.; Gonzalez-Fernandez, C. Phosphate limitation as crucial factor to enhance yeast lipid production from short-chain fatty acids. Microb. Biotechnol. 2023, 16, 372–380. [Google Scholar] [CrossRef] [Scilit]
- Maltsev, Y.; Kulikovskiy, M.; Maltseva, S. Nitrogen and phosphorus stress as a tool to induce lipid production in microalgae. Microb. Cell Fact. 2023, 22, 239. [Google Scholar] [CrossRef] [Scilit] [PubMed]
- Gorte, O.; Kugel, M.; Ochsenreither, K. Optimization of carbon source efficiency for lipid production with the oleaginous yeast Saitozyma podzolica DSM 27192 applying automated continuous feeding. Biotechnol. Biofuels 2020, 13, 181. [Google Scholar] [CrossRef] [Scilit]
- Gujjari, P.; Suh, S.O.; Coumes, K.; Zhou, J.J. Characterization of oleaginous yeasts revealed two novel species: Trichosporon cacaoliposimilis sp. nov. and Trichosporon oleaginosus sp. nov. Mycologia 2011, 103, 1110–1118. [Google Scholar] [CrossRef] [Scilit] [PubMed]
- Moon, N.J.; Hammond, E.G.; Glatz, B.A. Conversion of Cheese Whey and Whey Permeate to Oil and Single-Cell Protein. J. Dairy Sci. 1978, 61, 1537–1547. [Google Scholar] [CrossRef] [Scilit]
- Ratledge, C. Biotechnology as Applied to the Oils and Fats Industry. Fette Seifen Anstrichm. 2006, 86, 379–389. [Google Scholar] [CrossRef] [Scilit]
- Hassan, M.; Blanc, P.J.; Pareilleux, A.; Goma, G. Selection of fatty acid auxotrophs from the oleaginous yeast Cryptococcus curvatus and production of cocoa butter equivalents in batch culture. Biotechnol. Lett. 1994, 16, 819–824. [Google Scholar] [CrossRef] [Scilit]
- Moreton, R.S. Yeast lipid estimation by enzymatic and nuclear magnetic resonance methods. Appl. Environ. Microbiol. 1989, 55, 3009–3011. [Google Scholar] [CrossRef] [Scilit]
- Schulze, I.; Hansen, S.; Grosshans, S.; Rudszuck, T.; Ochsenreither, K.; Syldatk, C.; Neumann, A. Characterization of newly isolated oleaginous yeasts—Cryptococcus podzolicus, Trichosporon porosum and Pichia segobiensis. AMB Express 2014, 4, 24. [Google Scholar] [CrossRef] [Scilit]
- Gorte, O.; Nazarova, N.; Papachristou, I.; Wustner, R.; Leber, K.; Syldatk, C.; Ochsenreither, K.; Frey, W.; Silve, A. Pulsed Electric Field Treatment Promotes Lipid Extraction on Fresh Oleaginous Yeast Saitozyma podzolica DSM 27192. Front. Bioeng. Biotechnol. 2020, 8, 575379. [Google Scholar] [CrossRef] [Scilit]
- Qian, X.; Zhou, X.; Chen, L.; Zhang, X.; Xin, F.; Dong, W.; Zhang, W.; Ochsenreither, K.; Jiang, M. Bioconversion of volatile fatty acids into lipids by the oleaginous yeast Apiotrichum porosum DSM27194. Fuel 2021, 290, 119811. [Google Scholar] [CrossRef] [Scilit]
- Kourist, R.; Bracharz, F.; Lorenzen, J.; Kracht, O.N.; Chovatia, M.; Daum, C.; Deshpande, S.; Lipzen, A.; Nolan, M.; Ohm, R.A.; et al. Genomics and Transcriptomics Analyses of the Oil-Accumulating Basidiomycete Yeast Trichosporon oleaginosus: Insights into Substrate Utilization and Alternative Evolutionary Trajectories of Fungal Mating Systems. mBio 2015, 6, e00918. [Google Scholar] [CrossRef] [Scilit]
- Aliyu, H.; Gorte, O.; Neumann, A.; Ochsenreither, K. Global Transcriptome Profile of the Oleaginous Yeast Saitozyma podzolica DSM 27192 Cultivated in Glucose and Xylose. J. Fungi 2021, 7, 758. [Google Scholar] [CrossRef] [Scilit]
- Qian, X.; Lei, H.; Zhou, X.; Zhang, L.; Cui, W.; Zhou, J.; Xin, F.; Dong, W.; Jiang, M.; Ochsenreither, K. Engineering Scheffersomyces segobiensis for palmitoleic acid-rich lipid production. Microb. Biotechnol. 2024, 17, e14301. [Google Scholar] [CrossRef] [Scilit]
- Beopoulos, A.; Nicaud, J.M.; Gaillardin, C. An overview of lipid metabolism in yeasts and its impact on biotechnological processes. Appl. Microbiol. Biotechnol. 2011, 90, 1193–1206. [Google Scholar] [CrossRef] [Scilit]
- Huang, X.F.; Shen, Y.; Luo, H.J.; Liu, J.N.; Liu, J. Enhancement of extracellular lipid production by oleaginous yeast through preculture and sequencing batch culture strategy with acetic acid. Bioresour. Technol. 2018, 247, 395–401. [Google Scholar] [CrossRef] [Scilit]
- Palmonari, A.; Cavallini, D.; Sniffen, C.J.; Fernandes, L.; Holder, P.; Fagioli, L.; Fusaro, I.; Biagi, G.; Formigoni, A.; Mammi, L. Short communication: Characterization of molasses chemical composition. J. Dairy Sci. 2020, 103, 6244–6249. [Google Scholar] [CrossRef] [Scilit]
- Schoeters, F.; Thoré, E.S.J.; De Cuyper, A.; Noyens, I.; Goossens, S.; Lybaert, S.; Meers, E.; Van Miert, S.; de Souza, M.F. Microalgal cultivation on grass juice as a novel process for a green biorefinery. Algal Res. 2023, 69, 102941. [Google Scholar] [CrossRef] [Scilit]
- Li, Y.-h.; Li, H.-b.; Xu, X.-y.; Xiao, S.-y.; Wang, S.-q.; Xu, S.-c. Fate of nitrogen in subsurface infiltration system for treating secondary effluent. Water Sci. Eng. 2017, 10, 217–224. [Google Scholar] [CrossRef] [Scilit]
- Khan, S.; Das, P.; Thaher, M.I.; AbdulQuadir, M.; Mahata, C.; Al Jabri, H. Utilization of nitrogen-rich agricultural waste streams by microalgae for the production of protein and value-added compounds. Curr. Opin. Green Sustain. Chem. 2023, 41, 100797. [Google Scholar] [CrossRef] [Scilit]
- Calin, M.; Raut, I.; Arsene, M.L.; Capra, L.; Gurban, A.M.; Doni, M.; Jecu, L. Applications of Fungal Strains with Keratin-Degrading and Plant Growth Promoting Characteristics. Agronomy 2019, 9, 543. [Google Scholar] [CrossRef] [Scilit]
- Panasiuk, R.; Amarowicz, R.; Kostyra, H.; Sijtsma, L. Determination of α-amino nitrogen in pea protein hydrolysates: A comparison of three analytical methods. Food Chem. 1998, 62, 363–367. [Google Scholar] [CrossRef] [Scilit]
- Wasserman, A.E. Whey Utilization. IV. Availability of Whey Nitrogen for the Growth of Saccharomyces Fragilis. J. Dairy Sci. 1960, 43, 1231–1234. [Google Scholar] [CrossRef] [Scilit]
- Petersen, K.S.; Maki, K.C.; Calder, P.C.; Belury, M.A.; Messina, M.; Kirkpatrick, C.F.; Harris, W.S. Perspective on the health effects of unsaturated fatty acids and commonly consumed plant oils high in unsaturated fat. Br. J. Nutr. 2024, 132, 1039–1050. [Google Scholar] [CrossRef] [Scilit] [PubMed]

Disclaimer/Publisher’s Note: The statements, opinions and data contained in all publications are solely those of the individual author(s) and contributor(s) and not of MDPI and/or the editor(s). MDPI and/or the editor(s) disclaim responsibility for any injury to people or property resulting from any ideas, methods, instructions or products referred to in the content. |
© 2026 by the authors. Licensee MDPI, Basel, Switzerland. This article is an open access article distributed under the terms and conditions of the Creative Commons Attribution (CC BY) license.