


Abstract
Real-Time In-Line Monitoring (RTIM) of rheological properties such as slurry yield stress is important in different industries for its various benefits such as significant time savings and increased safety/efficiency of processes while reducing secondary waste due to sampling or inaccurate procedures. This paper discusses two methods for characterizing yield stress in real time: the Pressure Loss method and the Liquid Rise method. The Liquid Rise method uses the height of the slurry in a vertical column and the pressure difference to quantify the yield stress. The Pressure Loss method uses the drop of pressure in a laminar flow of slurry to determine the yield stress. Kaolin–water slurry is used as a simulant of the non-Newtonian fluid. An experimental setup is built to demonstrate the methods, and data obtained from the experimental setup is compared with the yield stress obtained from a conventional table-top rheometer (baseline rheology). The results show a good agreement between the experimental yield stress and baseline rheology.
1. Introduction
The yield stress is a property associated with numerous types of non-Newtonian fluids. It is defined as the threshold value of stress that needs to be applied in order to make the material flow. This is apparent in everyday tasks, such as spreading mayonnaise on bread or pouring honey, to more complex processes, like those in nuclear waste treatment plants. Understanding and measuring the yield stress is important across a wide range of industries and applications [1]. The determination of a yield stress as a material property can be difficult due to its dependency on the measurement technique and the conditions and environment of the test. Although there are a number of approaches that exist to measure yield stress for different industries and processes, no universal method is suitable for all the applications [1]. Sampling or monitoring of properties such as the yield stress of the non-Newtonian nuclear waste materials in various locations within Hanford and Savannah River sites is essential for the effective operation of processes [2]. Conventional laboratory rheometers only allow for offline determination of yield stress for samples. However, state-of-the-art commercial instruments [3] have severe drawbacks such as increased risk of personal exposure, delayed results, a change in rheological properties during transfer from the process to the laboratory and increased secondary waste, to name a few. The fluid structure [4] may be distorted or damaged; therefore, the desired parameter, e.g., the yield stress, of the measured sample is not representative of the actual yield stress.
Although yield stress is frequently treated as a material property, its interpretation is not straightforward. Barnes and Walters [5] questioned the existence of a unique “true” yield stress and argued that many materials considered to have a yield stress may flow at sufficiently low stress if observed over long enough time scales. Barnes [6,7] later emphasized that yield stress remains a useful engineering concept, but its measured value should be understood as an apparent or operationally defined quantity rather than a universal material constant. Coussot [8] similarly showed that yield-stress-fluid behavior depends strongly on the experimental configuration, observation time, material structure, and flow history. Therefore, in practical applications, the measured yield stress depends on the measurement method, sample preparation, rest time, shear history, sensor geometry, wall boundary condition, and the criterion used to define yielding. This distinction is important for radioactive waste and waste simulant slurries because these materials are often structured, heterogeneous, and time-dependent. Many clay-based and waste-like suspensions exhibit thixotropy, meaning that their internal structure breaks down under shear and rebuilds during rest. Møller et al. [9] showed that thixotropy can make yield stress difficult to measure reproducibly unless pre-shear, rest time, and measurement protocol are carefully controlled. As a result, a distinction is often made between static yield stress and dynamic yield stress. Static yield stress is associated with the stress required to initiate flow from a rested or structured state, while dynamic yield stress is commonly obtained by extrapolating steady-shear flow data after the material has already yielded. The static yield stress is more sensitive to rest time and structural rebuilding, whereas the dynamic yield stress is more closely related to the post-yield flow curve.
Real-Time In-Line Monitoring (RTIM) of properties such as slurry yield stress is gaining attention for its various benefits such as significant time savings and increased safety/efficiency of processes while reducing secondary waste due to sampling or inaccurate procedures. In addition, it can be used to potentially identify undetected process upsets and assist in running closer to the maximum solid concentration of waste being processed at the sites [3]. A specific need for the development and deployment of RTIM technology at Hanford involves obtaining the yield stress of the slurry in the Direct-Feed Low Activity Waste System feeding the Melter Feed Preparation Vessel and EMF evaporator [3]. Yield stress as a limiting property is also crucial to optimizing water addition to the Melter Feed Vessel.
While in-line monitoring and measurement of other rheological properties such as viscosity have been studied and methods have been developed [10,11], there has not been a significant number of studies to develop methods for in-line real-time measurement of yield stress. Inoue et al. investigated the shear strength of slurry clay by using the vertical penetration of a thin plate or hollow cylinder under incremental load and compared it with data from a series of viscometer tests [12]. Padmanabhan and Bhattacharya investigated in-line measurement of rheological properties of polymer melts [13]. Present ultrasonic techniques have been sufficiently developed to directly measure quantities such as particle velocity, particle concentration, sound velocity, acoustic impedance, and sound attenuation, leading to indirect measurement of bulk density, viscosity, and particle size and concentration in slurries [14,15,16,17]. Ultrasonic techniques have been used to characterize the slurry systems based on variations in velocity, attenuation and mean frequency of the acoustic pulse [15]. One application of a non-invasive ultrasonic technique utilizes a velocity profile of the flow using a transducer based on delay and Doppler shift measurements [11,17,18]. Further, existing correlations for the longitudinal wave velocity incorporate both shear and longitudinal modulus in solids and only longitudinal modulus in liquids, since shear modulus in liquids is approximately zero [19,20]. For the same reason, liquids cannot sustain shear forces (except for liquids in supercooled equilibrium states or liquids excited with gigahertz frequencies [21,22]) and shear waves cannot propagate in liquids. In viscoplastic slurries, the presence of shear strength (yield stress in shear) can contribute to the coefficient of stiffness and thereby to the speed of sound. This relationship has not sufficiently been explored in the literature and investigations can assist in quantifying these effects. It is expected that the presence of yield stress can contribute to larger wave velocities in yield slurries. Shear waves can also propagate in yield stress slurries due to the presence of shear strength, but at a lower propagation velocity compared to the longitudinal sound waves.
Yield stress of the non-Newtonian fluids can be measured via several direct and indirect methods [23,24]. Although there are several instruments available for in-line measurement of viscosity, there are no suitable measuring techniques available for yield stress in real time. Examples of options to consider can be a product like the Ametek TT100 in-line viscometer, which, according to experts from BrookField Ametek, can possibly be designed to work at speeds as low as 0.1 rpm, or a product similar to the OLR series 1000 Squeeze-flow equipment developed by Rheology Solution [25]. A recently developed auger-extraction-based technique developed by Samaniuk et al. [24] can be considered with minor modifications needed to limit material displacement during stress measurement. The complexity with the measurement of yield stress is that several measurement techniques work in operating conditions far from the yield point and many are not designed for high flow speeds or low viscosity and yield stress ranges. Examples of these technologies include vibrational (sweep and squeeze) and rotational rheometers, where measurements take place away from the zero-shear rate region.
Pressure-drop-based rheological characterization is one potential route for in-line yield stress estimation because pressure drop and flow rate are already common process measurements in pipeline systems. Classical analyses for pipe flow of Bingham fluids, including the Buckingham–Reiner formulation [26,27], relate pressure gradient, volumetric flow rate, pipe diameter, wall shear stress, plastic viscosity, and yield stress under steady, laminar, fully developed, homogeneous, no-slip conditions. Later explicit correlations, such as those developed by Swamee and Aggarwal [28], provide practical engineering equations for laminar Bingham plastic flow and friction factor estimation. These models provide a theoretical basis for estimating rheological parameters from Pressure Loss data.
However, the method is indirect and strongly dependent on the validity of the underlying assumptions.
A major challenge in pressure-drop-based rheometry of suspensions is wall slip. In concentrated suspensions, emulsions, gels, and clay-based slurries, the material adjacent to the pipe wall may have a lower particle concentration or a different structure than the bulk material. This creates an apparent slip velocity at the wall. Barnes [29] reviewed wall slip and wall depletion in polymer solutions, emulsions, and particle suspensions and showed that slip can significantly affect rheological measurements. Jastrzebski [30] also identified entrance and wall effects in extrusion rheometry of concentrated suspensions, while Yoshimura and Prud’homme [31] developed wall-slip correction methods for Couette and parallel-disk geometries. In pipe flow, wall slip can reduce the measured pressure gradient for a given flow rate, leading to underestimation of the bulk resistance to flow and therefore underestimation of apparent viscosity or yield stress.
Particle sedimentation is another important limitation for slurry flow. In non-density-matched suspensions, gravitational settling can create axial or radial concentration gradients. In horizontal pipe flow, this can lead to a particle-rich lower region and a particle-lean upper region, particularly at low velocities or near transitional flow conditions. Since yield stress and plastic viscosity are strongly dependent on solid concentration, even modest local concentration changes can alter the measured pressure drop. In radioactive waste applications, sedimentation is especially important because real waste slurries may contain broad particle-size distributions, dense particles, agglomerates, and chemically evolving structures. Sedimentation can therefore cause pressure-drop-based estimates to deviate from values expected for a homogeneous viscoplastic fluid.
In addition to sedimentation, shear-induced particle migration can influence the apparent rheology of slurry pipe flow. Leighton and Acrivos [32] demonstrated that particles in concentrated suspensions can migrate under shear, producing spatial variations in particle concentration. Phillips et al. [33] developed a constitutive framework for concentrated suspensions that accounts for shear-induced particle migration. Nott and Brady [34] and Morris and Boulay [35] further showed that normal stresses and particle interactions can produce concentration gradients in pressure-driven and curvilinear suspension flows. These studies indicate that a slurry that is initially well mixed may not remain radially homogeneous during pipe flow.
Kaolin–water mixtures are commonly used as model yield stress or viscoplastic suspensions because clay-based slurries can be prepared safely, reproducibly, and over a controllable range of solid concentrations and rheological properties [36,37]. Kaolin and kaolin–bentonite mixtures have also been used in Hanford and Savannah River-related simulant studies because their density, solid concentration, and Bingham-type rheological properties can be adjusted to approximate selected waste-processing conditions [36,37,38]. However, kaolin–water slurry is only a simplified surrogate for radioactive waste and does not reproduce all features of actual nuclear waste slurries. Real radioactive waste may exhibit more complex particle-size distributions, chemical aging, mineralogical heterogeneity, density variation, gas retention or release behavior, thixotropy, and shear sensitivity [37,38,39,40]. Hanford simulant-selection studies have emphasized that representative simulants should consider liquid density, viscosity, pH, undissolved-solid concentration, particle-size distribution, particle density, and slurry rheology [36]. In addition, studies of Hanford sludge and nuclear-waste simulant slurries have shown that yield stress and viscosity can be strongly influenced by shear history, solid concentration, particle-size distribution, and aging effects [39,40,41]. Therefore, kaolin–water data should be interpreted as proof-of-concept validation rather than a full demonstration of field applicability. The surrogate is useful for developing and comparing measurement methods under controlled laboratory conditions, but further testing using more representative waste simulants would be necessary before broad deployment.
In the present study, two different in-line methods for estimating yield stress in real time are proposed: the Liquid Rise method and the Pressure Loss method. Kaolin–water mixtures are used to produce a yield stress fluid for the experiments, and data obtained from the proposed methods was compared with baseline data obtained from a table-top rheometer. Based on the literature, the present work is positioned as an experimental proof of concept for two in-line methods for estimating apparent yield stress of non-Newtonian slurry during transfer. Therefore, the objective of the present study is not to establish a universal yield stress measurement technique, but to develop and evaluate two simple in-line approaches for estimating apparent yield stress under controlled experimental conditions. This study provides an initial assessment of whether pressure-drop and liquid-rise measurements can be used to infer yield stress behavior during slurry transfer. This paper is organized in the following manner: first, the theory behind the Liquid Rise and Pressure Loss methods is discussed. Then, baseline rheology is established to compare the experimental data. The experimental design and setup are then provided, followed by results and discussion.
2. Liquid Rise Method
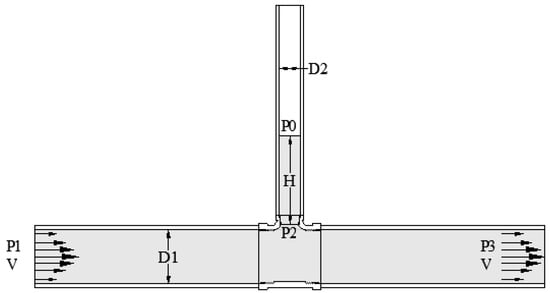
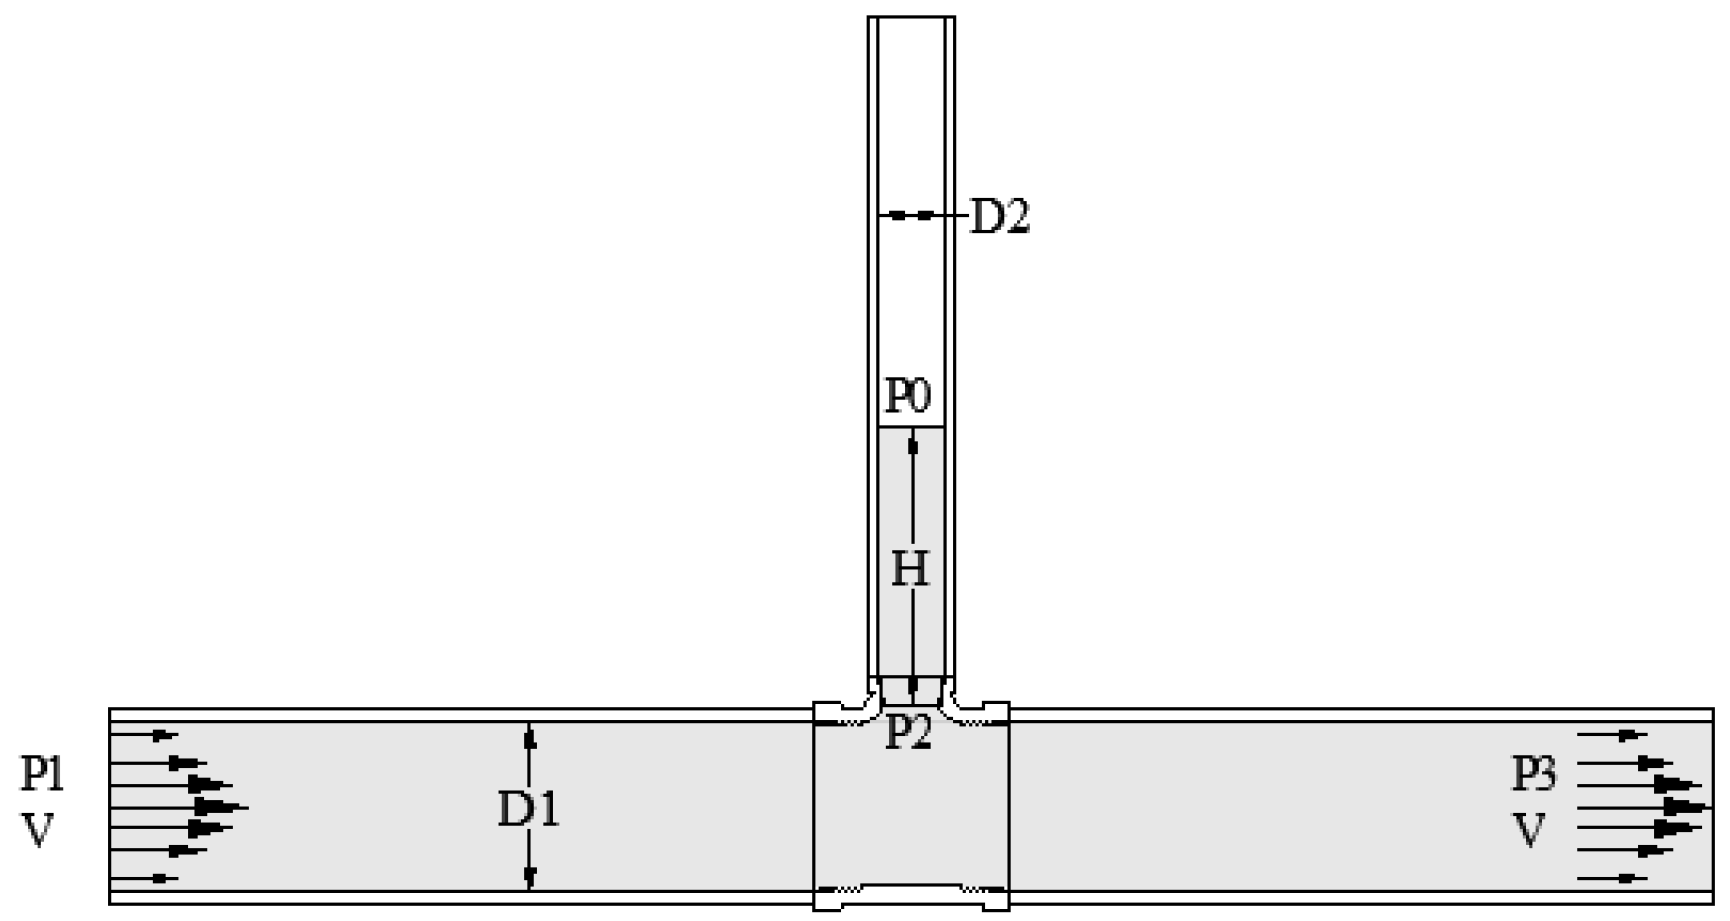
This method is based on the balance of forces that act across a column of liquid slurry in both static (no-flow) and dynamic (flowing) conditions. Let us consider a horizontal and vertical pipe setup connected as a Tee (Figure 1). The horizontal pipe section has a diameter of D1, where liquid is flowing with a velocity of v, and the vertical section has a diameter of D2. Neglecting the friction forces in the system, when there is a flow in the horizontal section of the pipe, a pressure difference is created in the vertical section. Due to this pressure difference, the slurry rises in the vertical pipe, and it continues to rise until a balance of forces is obtained. In a static condition inside the vertical section, three forces act on the slurry: pressure force acting upward due to the difference in pressure, mass of the slurry inside the vertical section acting downward due to the gravitational force and the yield stress resisting the movement of the slurry liquid.
Figure 1.
Schematic of the Liquid Rise method, dynamic condition.
For the force balance, the upward direction is defined as positive. The pressure force acts upward on the slurry column, while the weight of the slurry column acts downward. The yield stress resistance acts opposite to the direction of motion. During the rising stage, this resistance acts downward because the slurry column moves upward. At equilibrium, when the slurry column stops moving, the pressure force is balanced by the combined effect of gravity and the apparent yield stress resistance along the wall of the vertical pipe.
Pressure force (Fp) is dictated by the difference in pressure between the top and bottom of the slurry column and is derived as
where is the difference in pressure and D2 is the diameter of the vertical section.
The force acting on the slurry due to gravity can be derived as
where is the density of the slurry and H is height of the slurry column.
Finally, the force acting due to yield stress is defined as
where is the apparent yield stress of the slurry.
By considering a static equilibrium condition, as shown in Figure 1, a balance between forces is created by the pressure differential, ΔP (P2 − P0), yield stress, and gravity, which keeps the slurry at height H inside the vertical branch.
Therefore, the apparent yield stress can be equated as
By measuring the slurry density, vertical column height, vertical pipe diameter, and the pressure difference inside the vertical branch, the apparent yield stress of the slurry can be estimated.
The representation of the resisting force as is a simplified lumped-force approximation. It does not imply that the local shear stress is uniform throughout the slurry column or that the internal structure of the slurry remains perfectly homogeneous. Instead, the value obtained from this force balance should be interpreted as an apparent yield stress parameter representing the net resistance of the slurry column under the specific measurement conditions. Effects such as wall slip, non-uniform particle concentration, axial variation in the structure, and time-dependent rebuilding may alter the actual stress distribution and therefore contribute to uncertainty in the inferred value.
Because the Liquid Rise calculation depends directly on slurry density, density measurement is an important source of uncertainty. The density used in the Liquid Rise calculation was assumed to represent the bulk density of the slurry entering the vertical column. However, if sedimentation or axial concentration gradients occur inside the vertical section, the local density of the slurry column may differ from the measured bulk density. This would introduce an error into the estimated yield stress. Therefore, the Liquid Rise method is most reliable for well-mixed slurries and for measurements conducted over time scales short enough to limit particle settling and structural rebuilding. Accordingly, the Liquid Rise method should be interpreted as a proof-of-concept method for estimating apparent static or equilibrium yield stress under controlled slurry conditions, rather than as a complete constitutive characterization method.
3. Pressure Loss Method
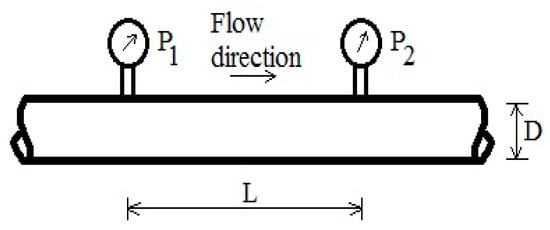
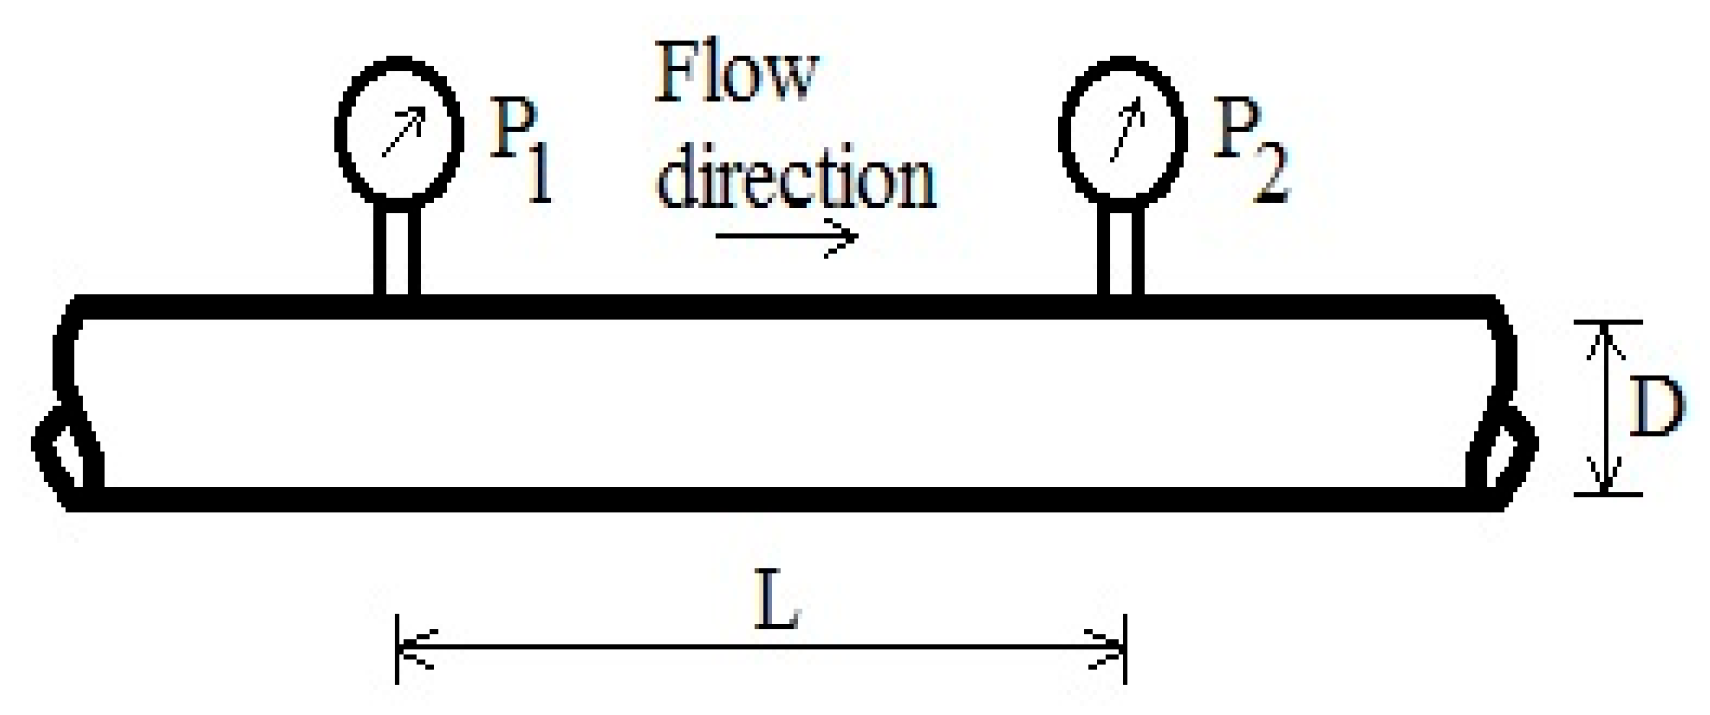
The Pressure Loss method is based on the pressure drop in a horizontal pipe section in laminar flow as shown in Figure 2. In the Pressure Loss method, the Pressure Loss () between two points in a fully developed laminar flow of slurry is measured using a differential-type pressure transmitter. This pressure drop is related to the apparent yield stress and plastic viscosity of the slurry through pipe-flow correlations for viscoplastic fluids.
Figure 2.
Schematic of the Pressure Loss method.
For a horizontal test section of length and inner diameter , the pressure drop can be expressed in terms of the Darcy friction factor as
where is the slurry density, V is the average velocity of the slurry flowing through the pipe, and is the friction factor or coefficient.
For a Bingham-type fluid, the friction factor depends on both the Reynolds number and the Hedstrom number. These dimensionless groups are defined as
where and µ are the apparent yield stress and plastic viscosity of the slurry respectively.
In the present method, is inferred from the measured pressure drop and flow rate by using pipe-flow correlations for laminar Bingham plastic flow. Several equations have been proposed to relate the friction factor to and for laminar flow of Bingham-type fluids.
The friction coefficient can be derived using different equations such as Buckingham–Reiner equation [42,43]
The Swamee–Agarwal equation [26] is the simplified version of the friction factor equation and can be used to get the yield stress from the pressure drop in a laminar flow.
Other equations have been suggested to calculate the pressure drop in laminar flow [28,44,45]. The polynomial equation provides pressure drop using the following expression:
where .
These correlations assume that the slurry can be reasonably represented as a Bingham-type material over the shear-rate range of the pipe-flow experiment. Therefore, the Pressure Loss result should be interpreted as an apparent Bingham yield stress, not as a universal material property. The suitability of this assumption is evaluated using baseline rheometer flow curves. Additionally, since both and µ appear in the friction-factor equations, measurements at two different flow rates are required for each slurry concentration. The two corresponding pressure-drop measurements provide two equations that are solved simultaneously to estimate . This approach can be sensitive to experimental uncertainty, especially in pressure drop, flow rate, density, pipe diameter, and pressure-tap spacing.
The Pressure Loss method is valid only when the flow is laminar and fully developed, the pressure taps are sufficiently far from disturbances such as pumps, elbows, valves, contractions, or expansions, and the slurry remains reasonably homogeneous during the measurement. Particle sedimentation, particle migration, wall slip, or concentration gradients may alter the measured pressure drop and lead to errors in the inferred yield stress. Thus, the Pressure Loss method is treated as a proof-of-concept approach for estimating apparent yield stress under controlled laminar slurry-flow conditions.
4. Baseline Rheology
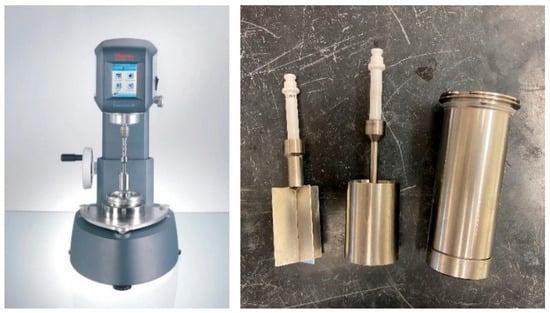
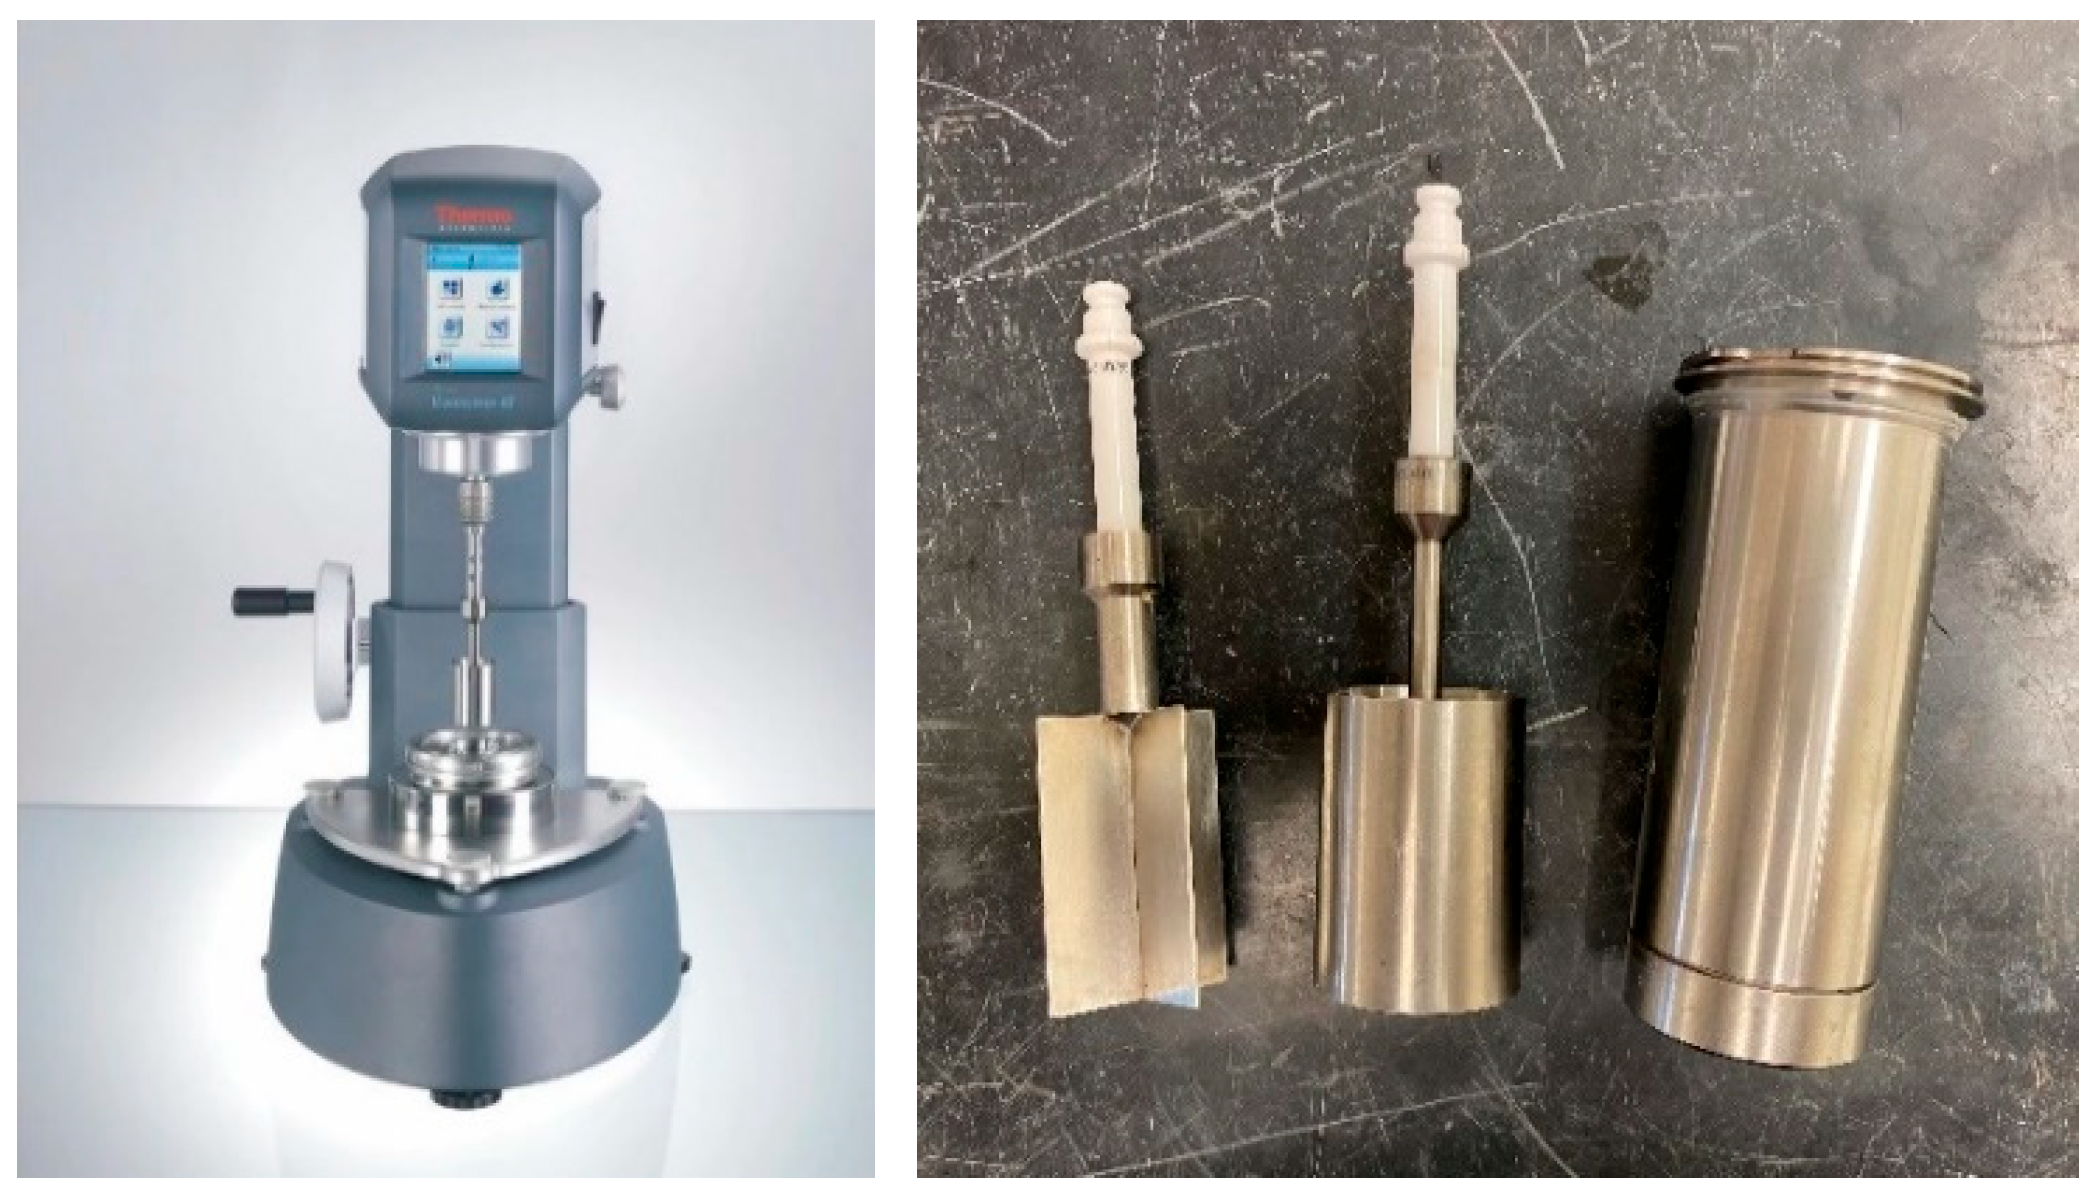
The baseline rheology of the Kaolin–water slurries was measured using a HAAKE Viscotester iQ Air rheometer equipped with an FL40 vane and CC41/Ti recessed cylinder spindle (Figure 3). Before testing the Kaolin–water slurries, the rheometer was checked using standard viscosity fluids to verify instrument response over the relevant measurement range.
Figure 3.
HAAKE Viscotester iQ Air rheometer with an FL40 vane and CC41/Ti recessed cylinder spindle.
Kaolin–water slurries were prepared at selected mass concentrations by gradually adding dry kaolin powder to water under continuous mechanical mixing. Each slurry batch was mixed for 10 min to promote particle dispersion and reduce agglomeration. During loop testing, the slurry was continuously mixed in the tank to reduce particle settling and concentration gradients. Samples for baseline rheology were collected from the slurry tank after each loop experiment. The time between sample collection and rheometer testing was kept as short as possible to minimize changes caused by sedimentation, evaporation, or structural rebuilding. Before loading into the rheometer, the sample was gently remixed to improve homogeneity while avoiding excessive air entrainment and particle settling. The details of the rheometer configuration and test conditions are summarized in Table 1.
Table 1.
Rheometer protocol.
The apparent yield stress was determined from the rheometer data using a shear-rate sweep. The flowing portion of the shear stress–shear rate curve was fitted using the Bingham model:
where is the apparent dynamic yield stress, µ is the plastic viscosity, and is the shear rate. The intercept of the fitted line gives the apparent yield stress, while the slope gives the plastic viscosity. Because the Pressure Loss method uses Bingham-type pipe-flow correlations, representative rheometer flow curves were used to assess whether the kaolin–water slurry could reasonably be approximated as a Bingham-type material over the tested range. Figure 4 illustrates a representative rheogram of kaolin-water slurry at 20%wt kaolin concentration.
Figure 4.
Representative rheogram of kaolin–water slurry at 20%wt kaolin concentrations.
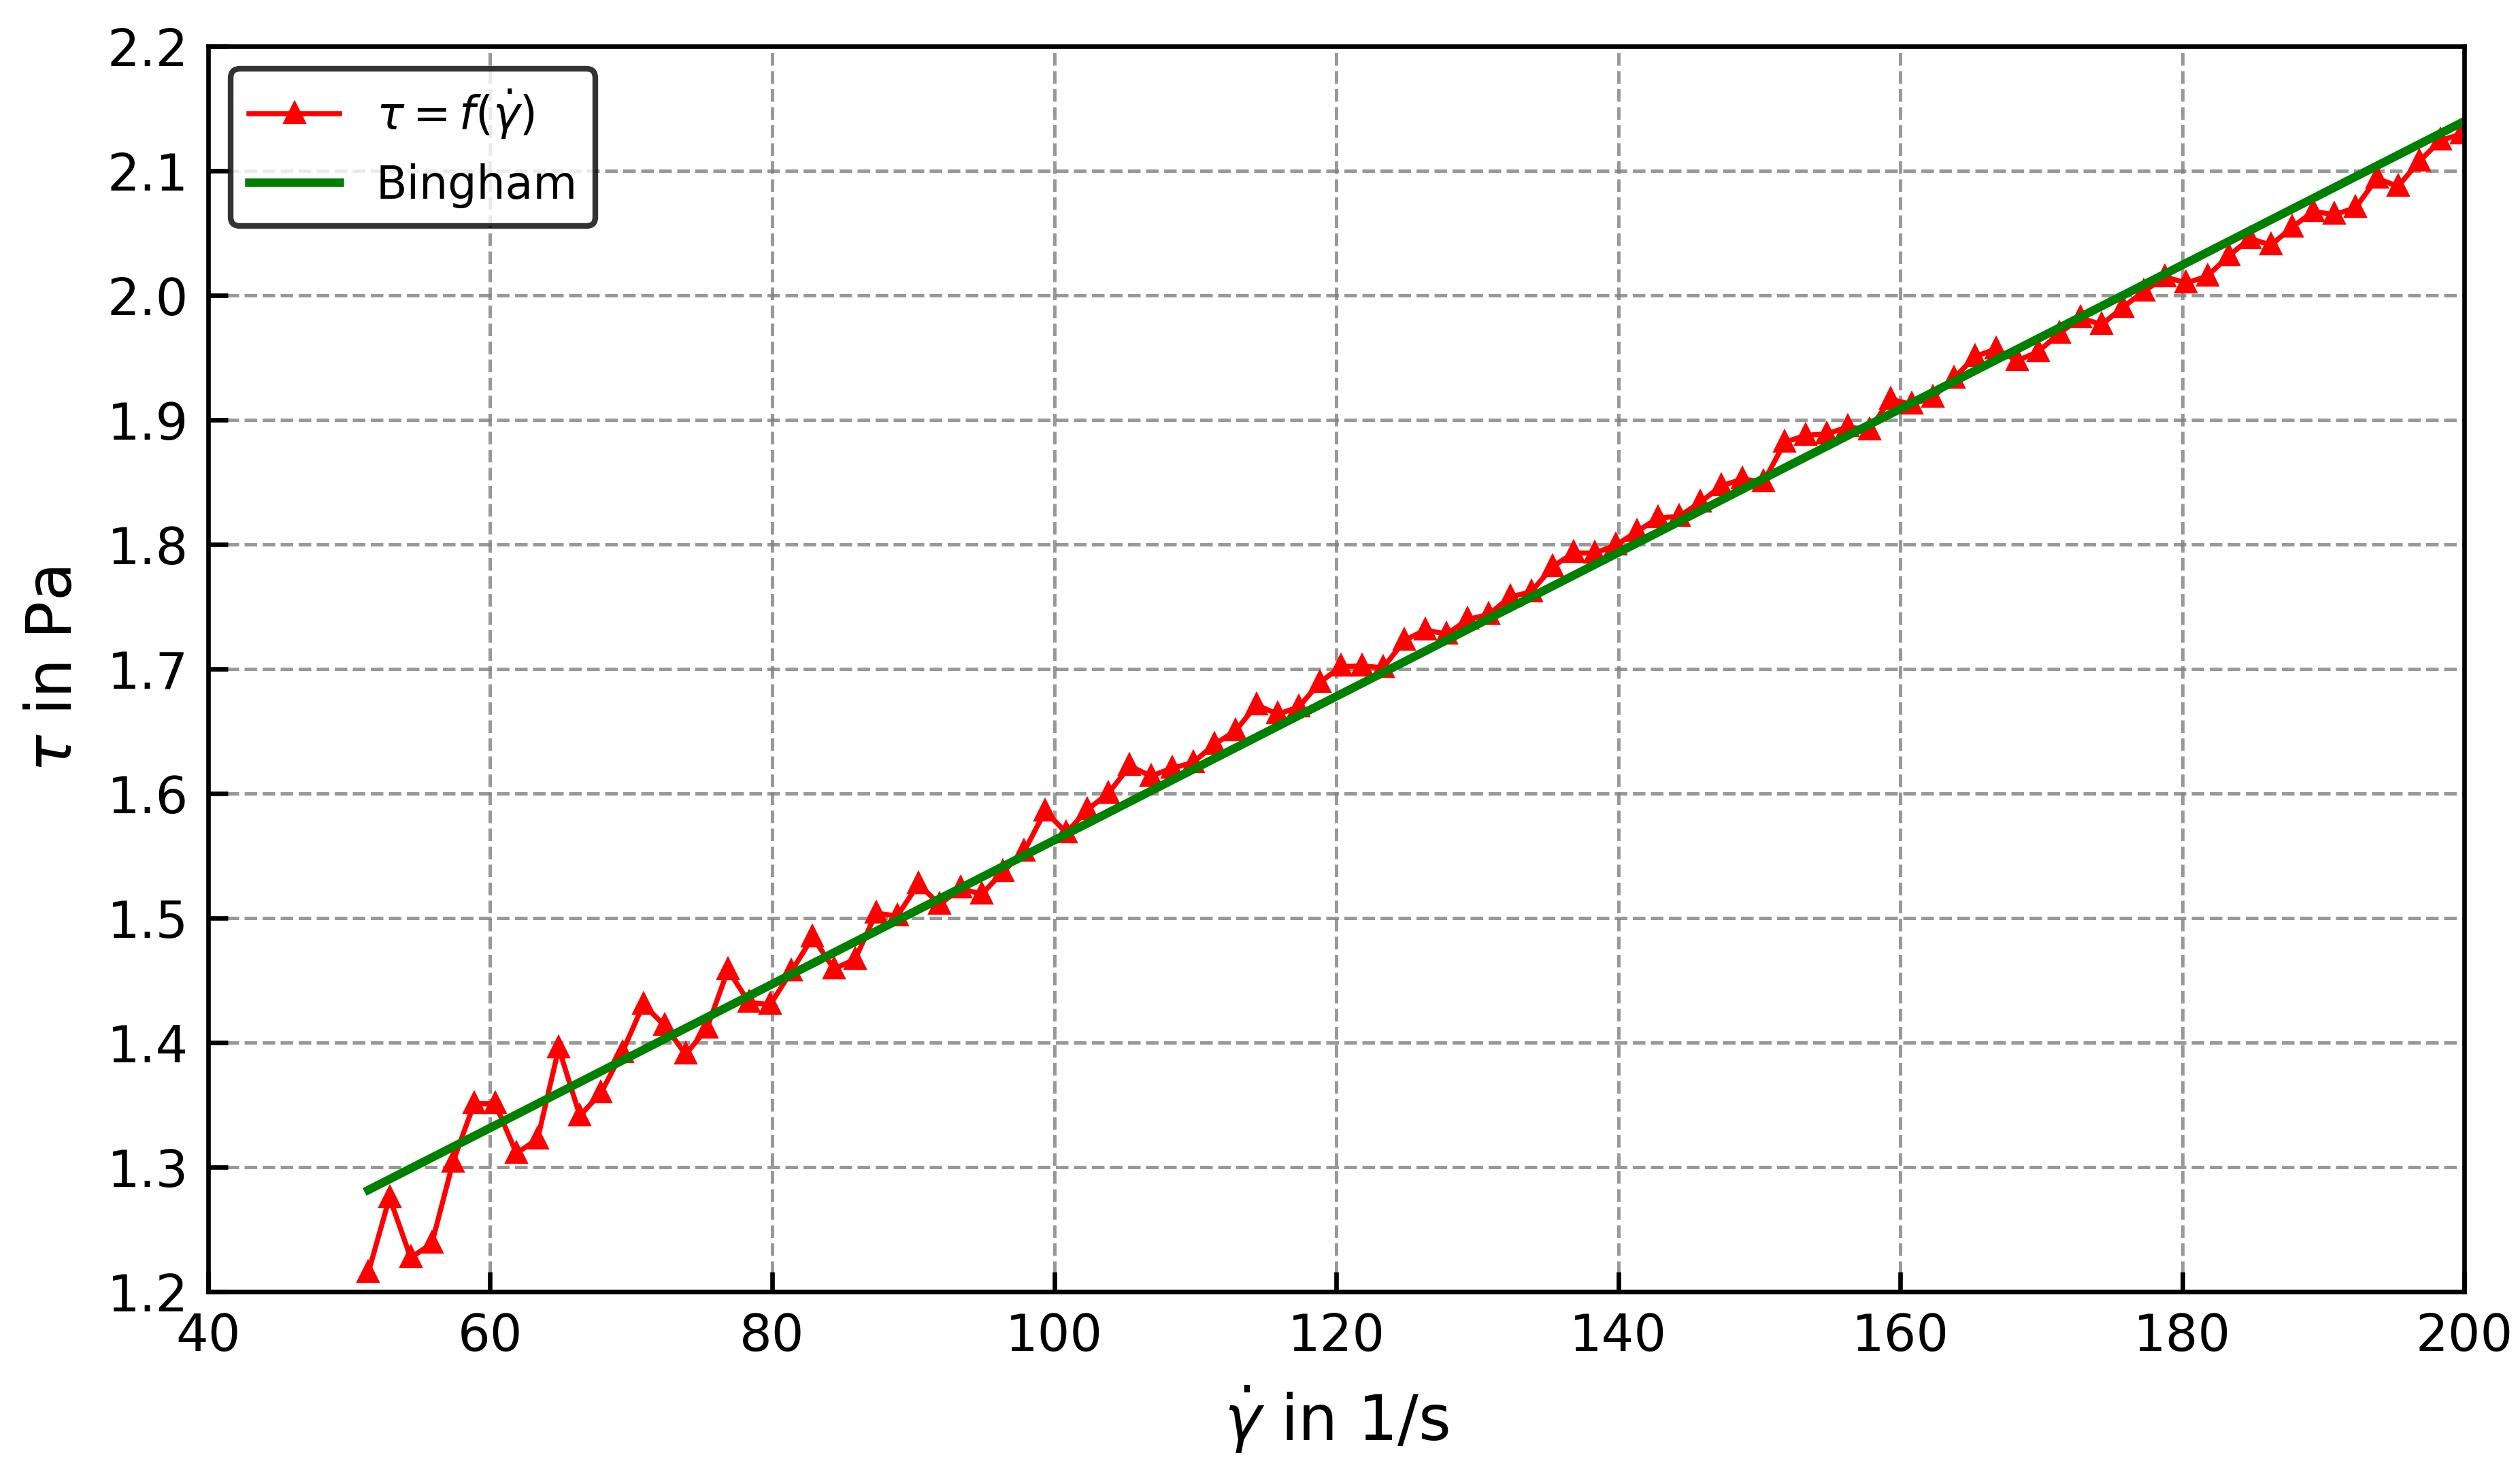
The baseline rheology showed that the apparent yield stress increased with increasing kaolin concentration, consistent with the expected behavior of concentrated particle suspensions. The measured yield stress values were used as reference data for comparison with the proposed in-line methods. The variation in apparent Bingham yield stress with kaolin mass percentage is presented in Figure 5.
Figure 5.
Change in Bingham yield stress with mass percentage of kaolin–water slurry using the HAAKE Viscotester iQ Air rheometer.
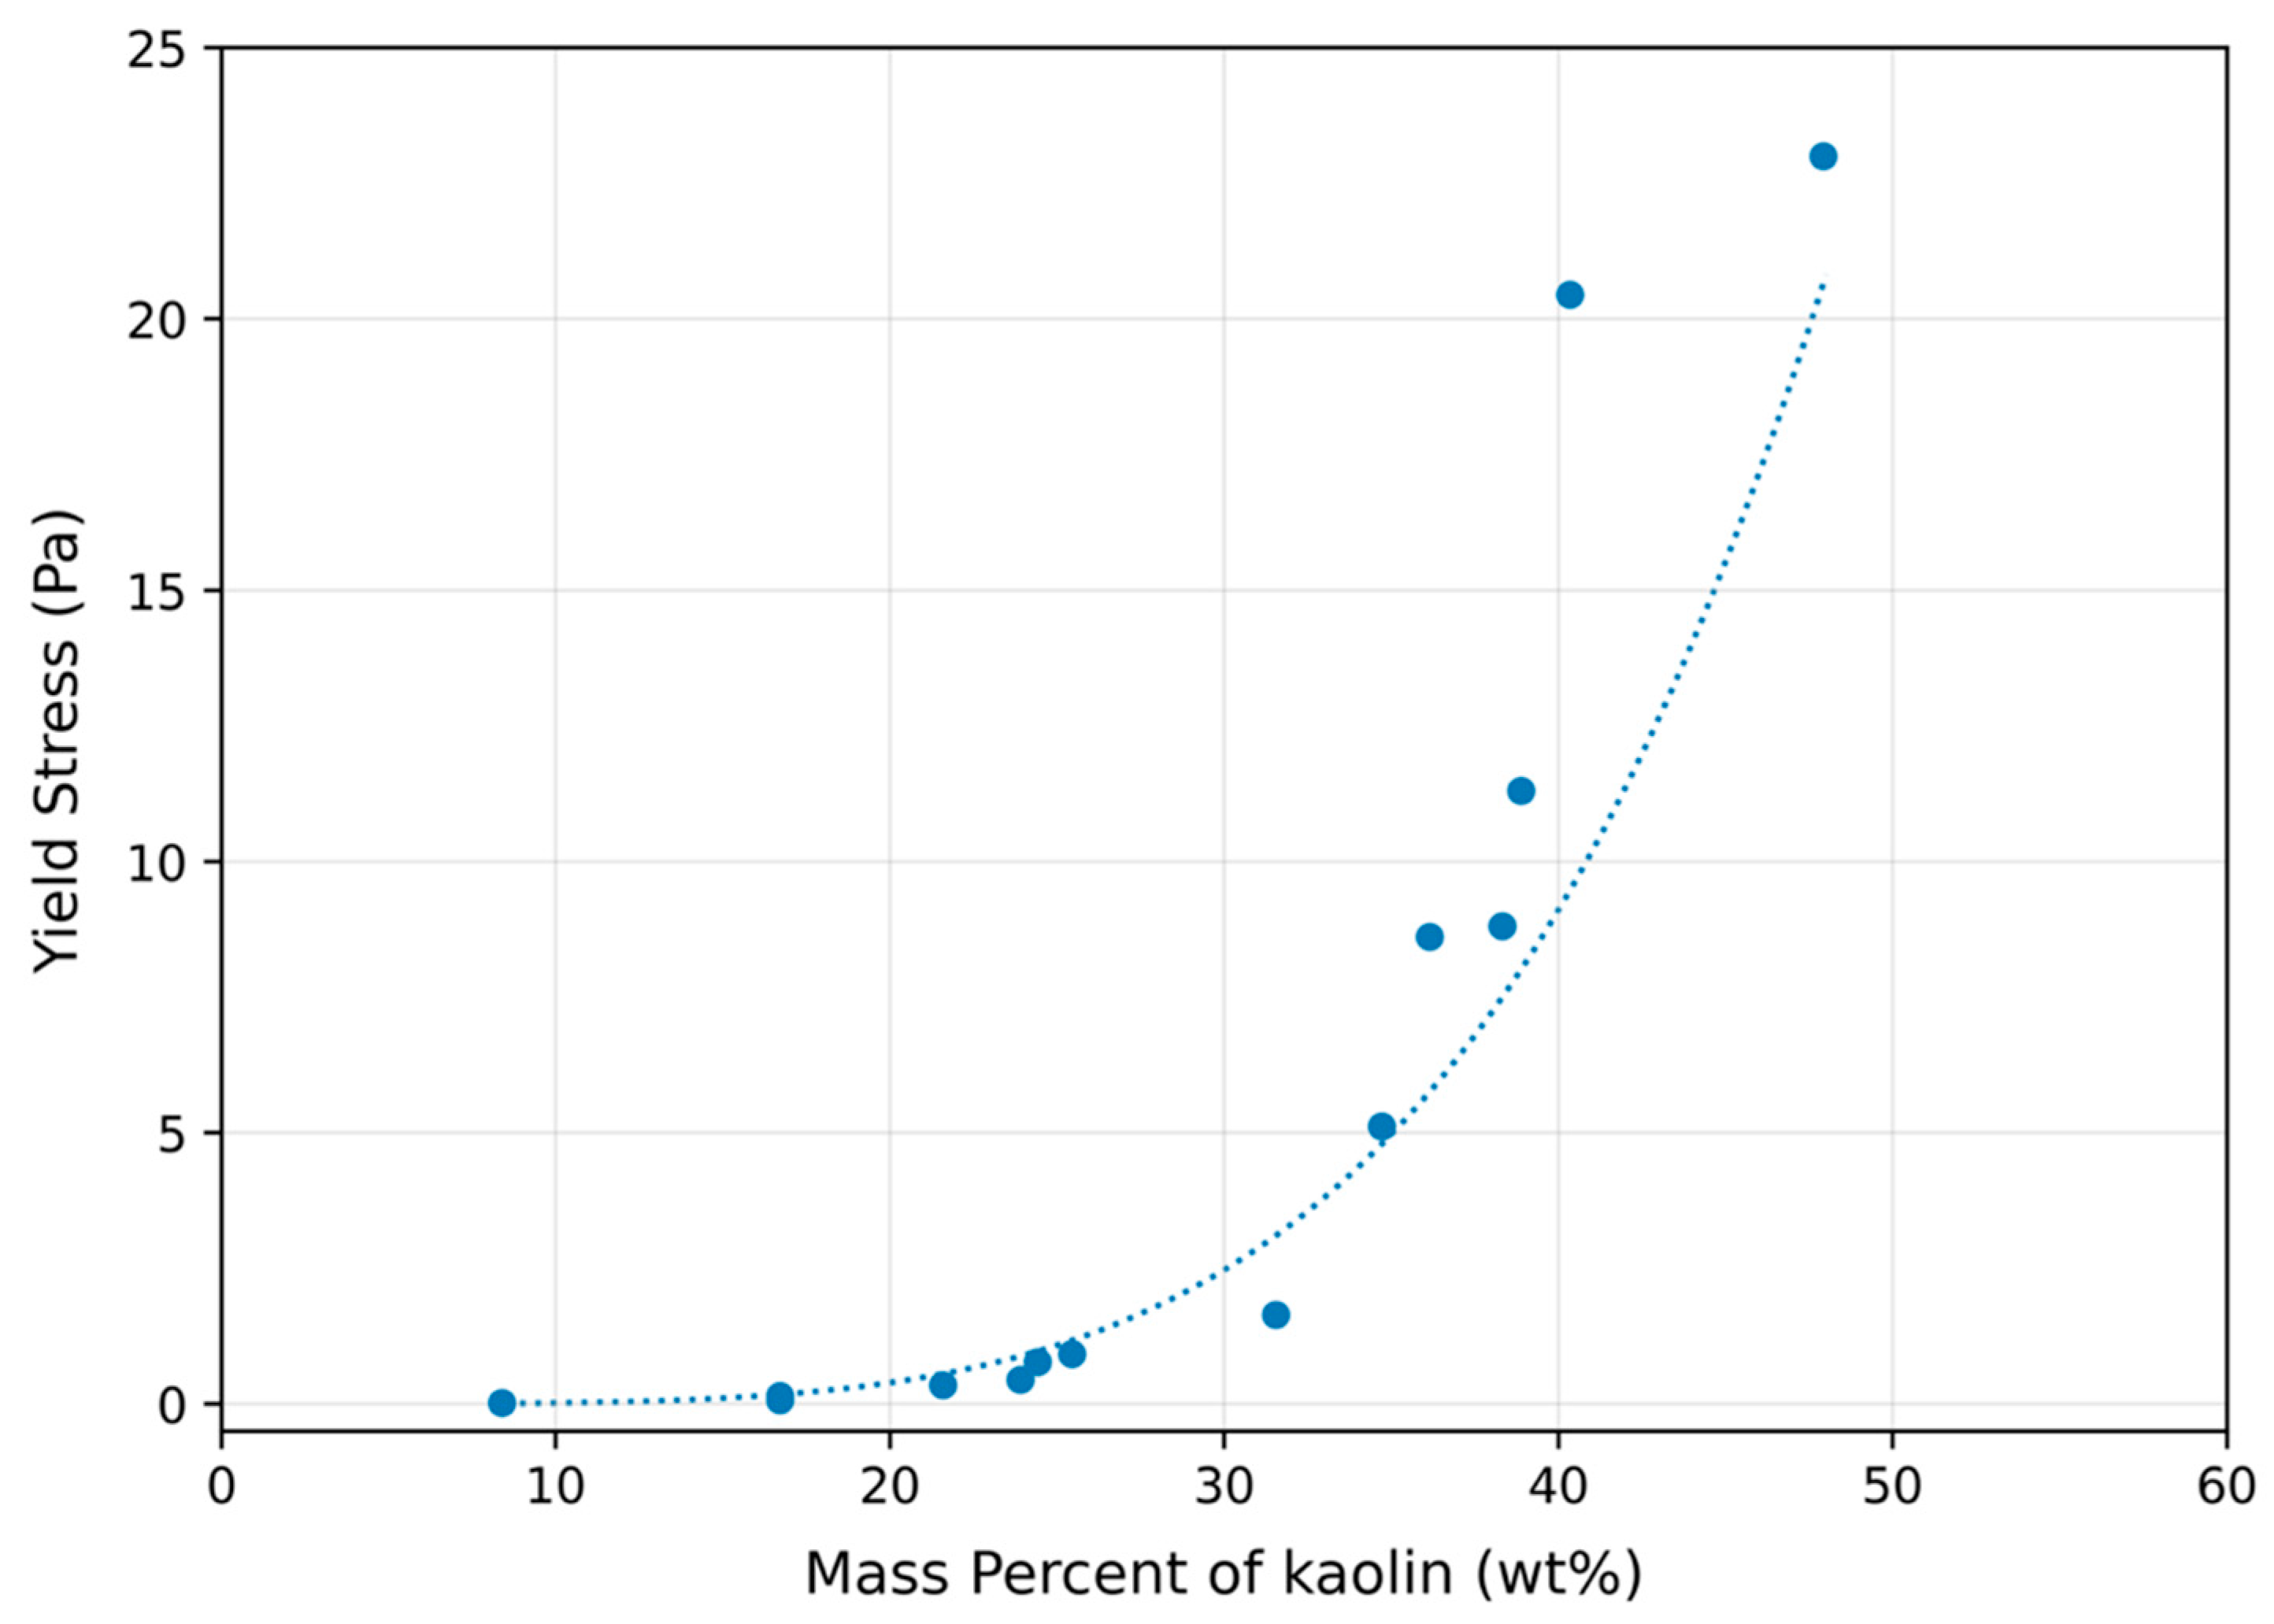
The rheometer result is interpreted as an apparent dynamic yield stress, as it was obtained from the flowing region of the rheogram. Repeated rheometer measurements were not available for every kaolin concentration tested in the flow loop. Therefore, the dispersion and repeatability of the baseline rheology could not be fully quantified for all samples. As a result, the comparison between the in-line methods and rheometer baseline should be interpreted as proof-of-concept agreement rather than complete statistical validation. Therefore, this baseline rheology provides a controlled reference for evaluating the Liquid Rise and Pressure Loss methods while recognizing that yield stress is protocol-dependent and should be interpreted as an apparent value under the specified measurement conditions.
5. Preliminary Testing
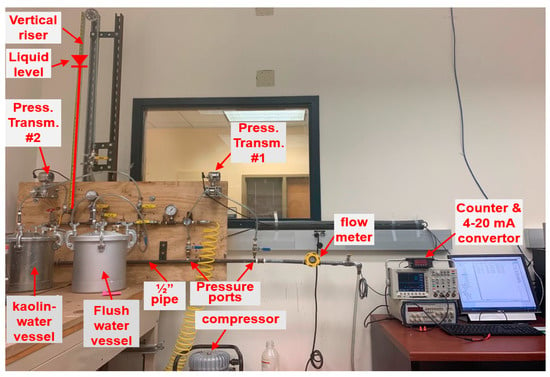
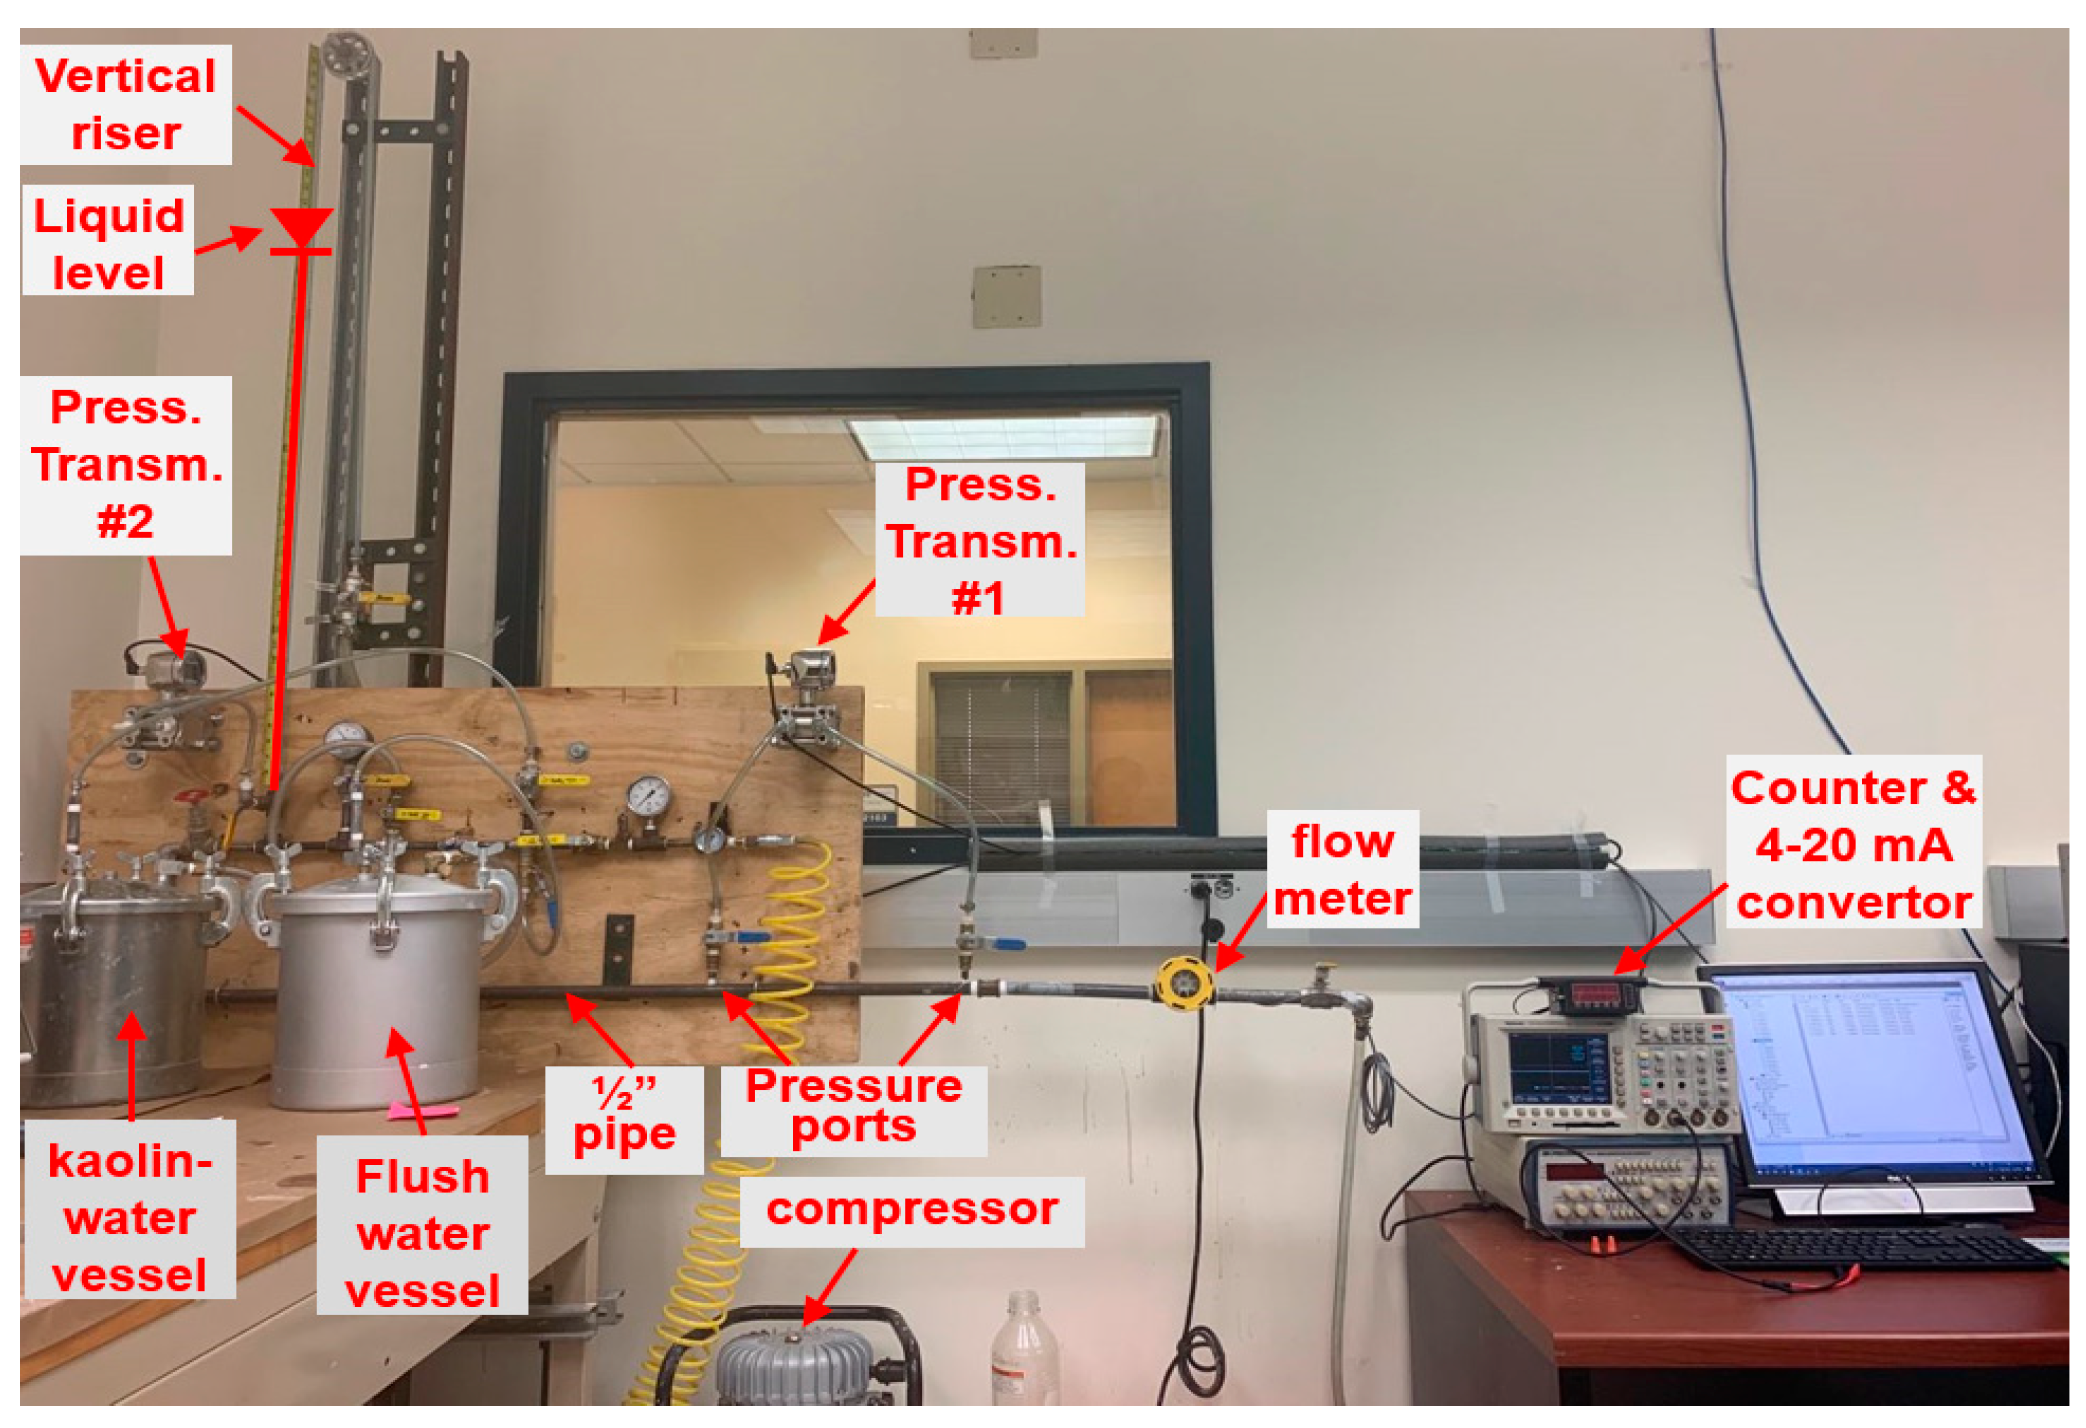
To verify the proof of concept, a simple setup was constructed with ½ inch NPT Standard-Wall pipe with 1.58 cm (0.622 inch) inside diameter (Figure 6). Kaolin–water mixture slurry was used as the working fluid. Pressure drop between two points of the pipe separated by 45 cm (~1.5 ft) was obtained using a PX-3005 (Omega, Norwalk, CT, USA) pressure transmitter. A turbine-type Lake Monitors FlowStat ES paddle wheel (AW Lake Company, Oak Creek, WI, USA) flow meter with a maximum 2% uncertainty was used to measure the flow rate. To analyze the accuracy of this method, error levels induced by the pressure transmitter and the flow meter were considered. To enable real-time monitoring during experiments, an equation solver program in MATLAB (R2020a) (version 9.8) was coupled with a VI (version 8.1) program in LabVIEW (version 2006).
Figure 6.
Experimental setup for initial testing of the pressure methods.
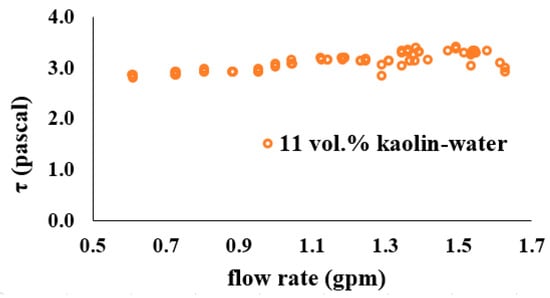
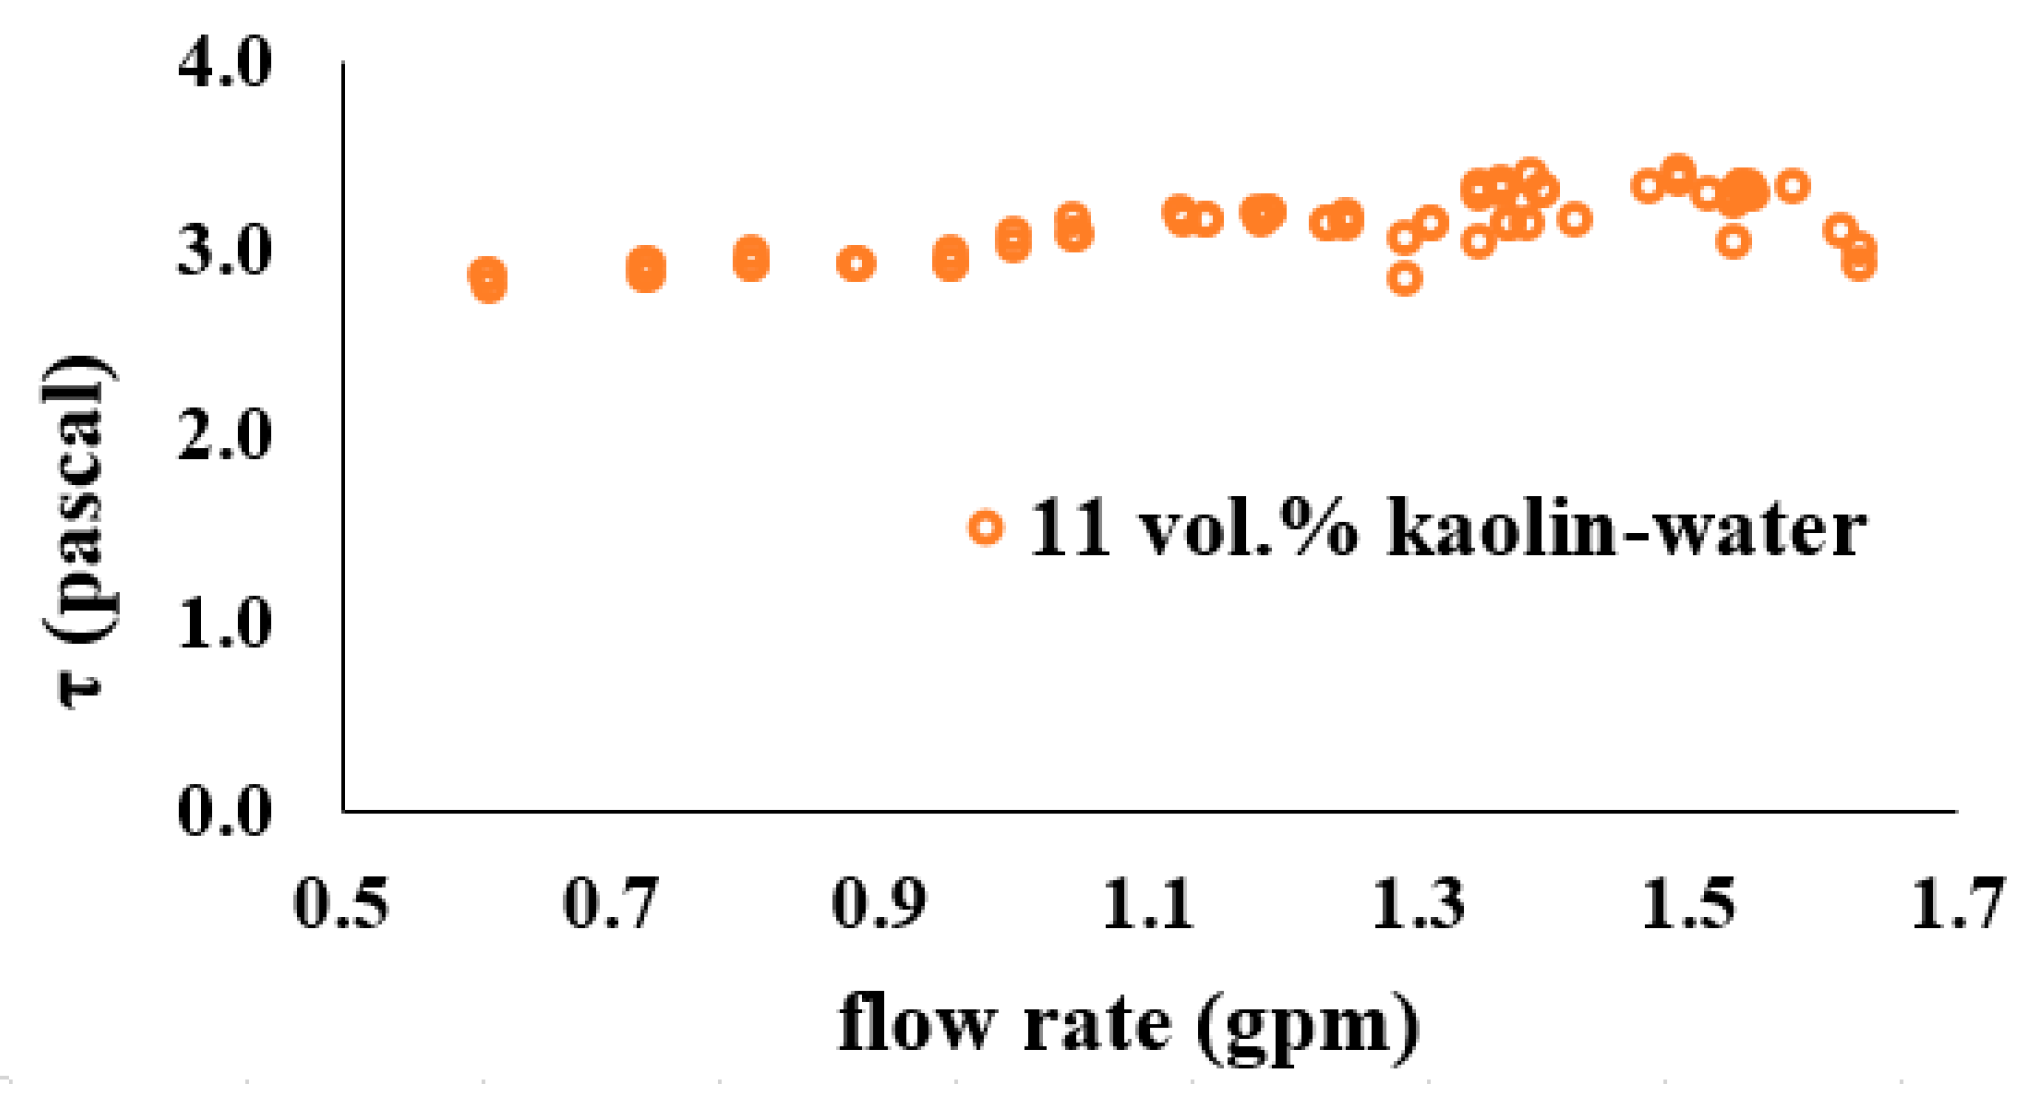
Testing was performed using an 11% volume kaolin–water mixture over a wide range of flow rate values (0.5 to 1.7 gallons per minute). Figure 7 shows that consistent values for yield stress were obtained using the Pressure Loss method around an average of 3.1 Pa, which is within 15% of the 2.7 Pa measurement obtained from the rheometer.
Figure 7.
Yield stress for 11% volume kaolin–water slurry at different flow rates using the Pressure Loss method.
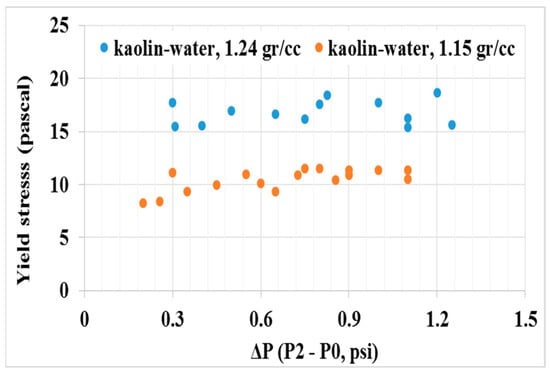
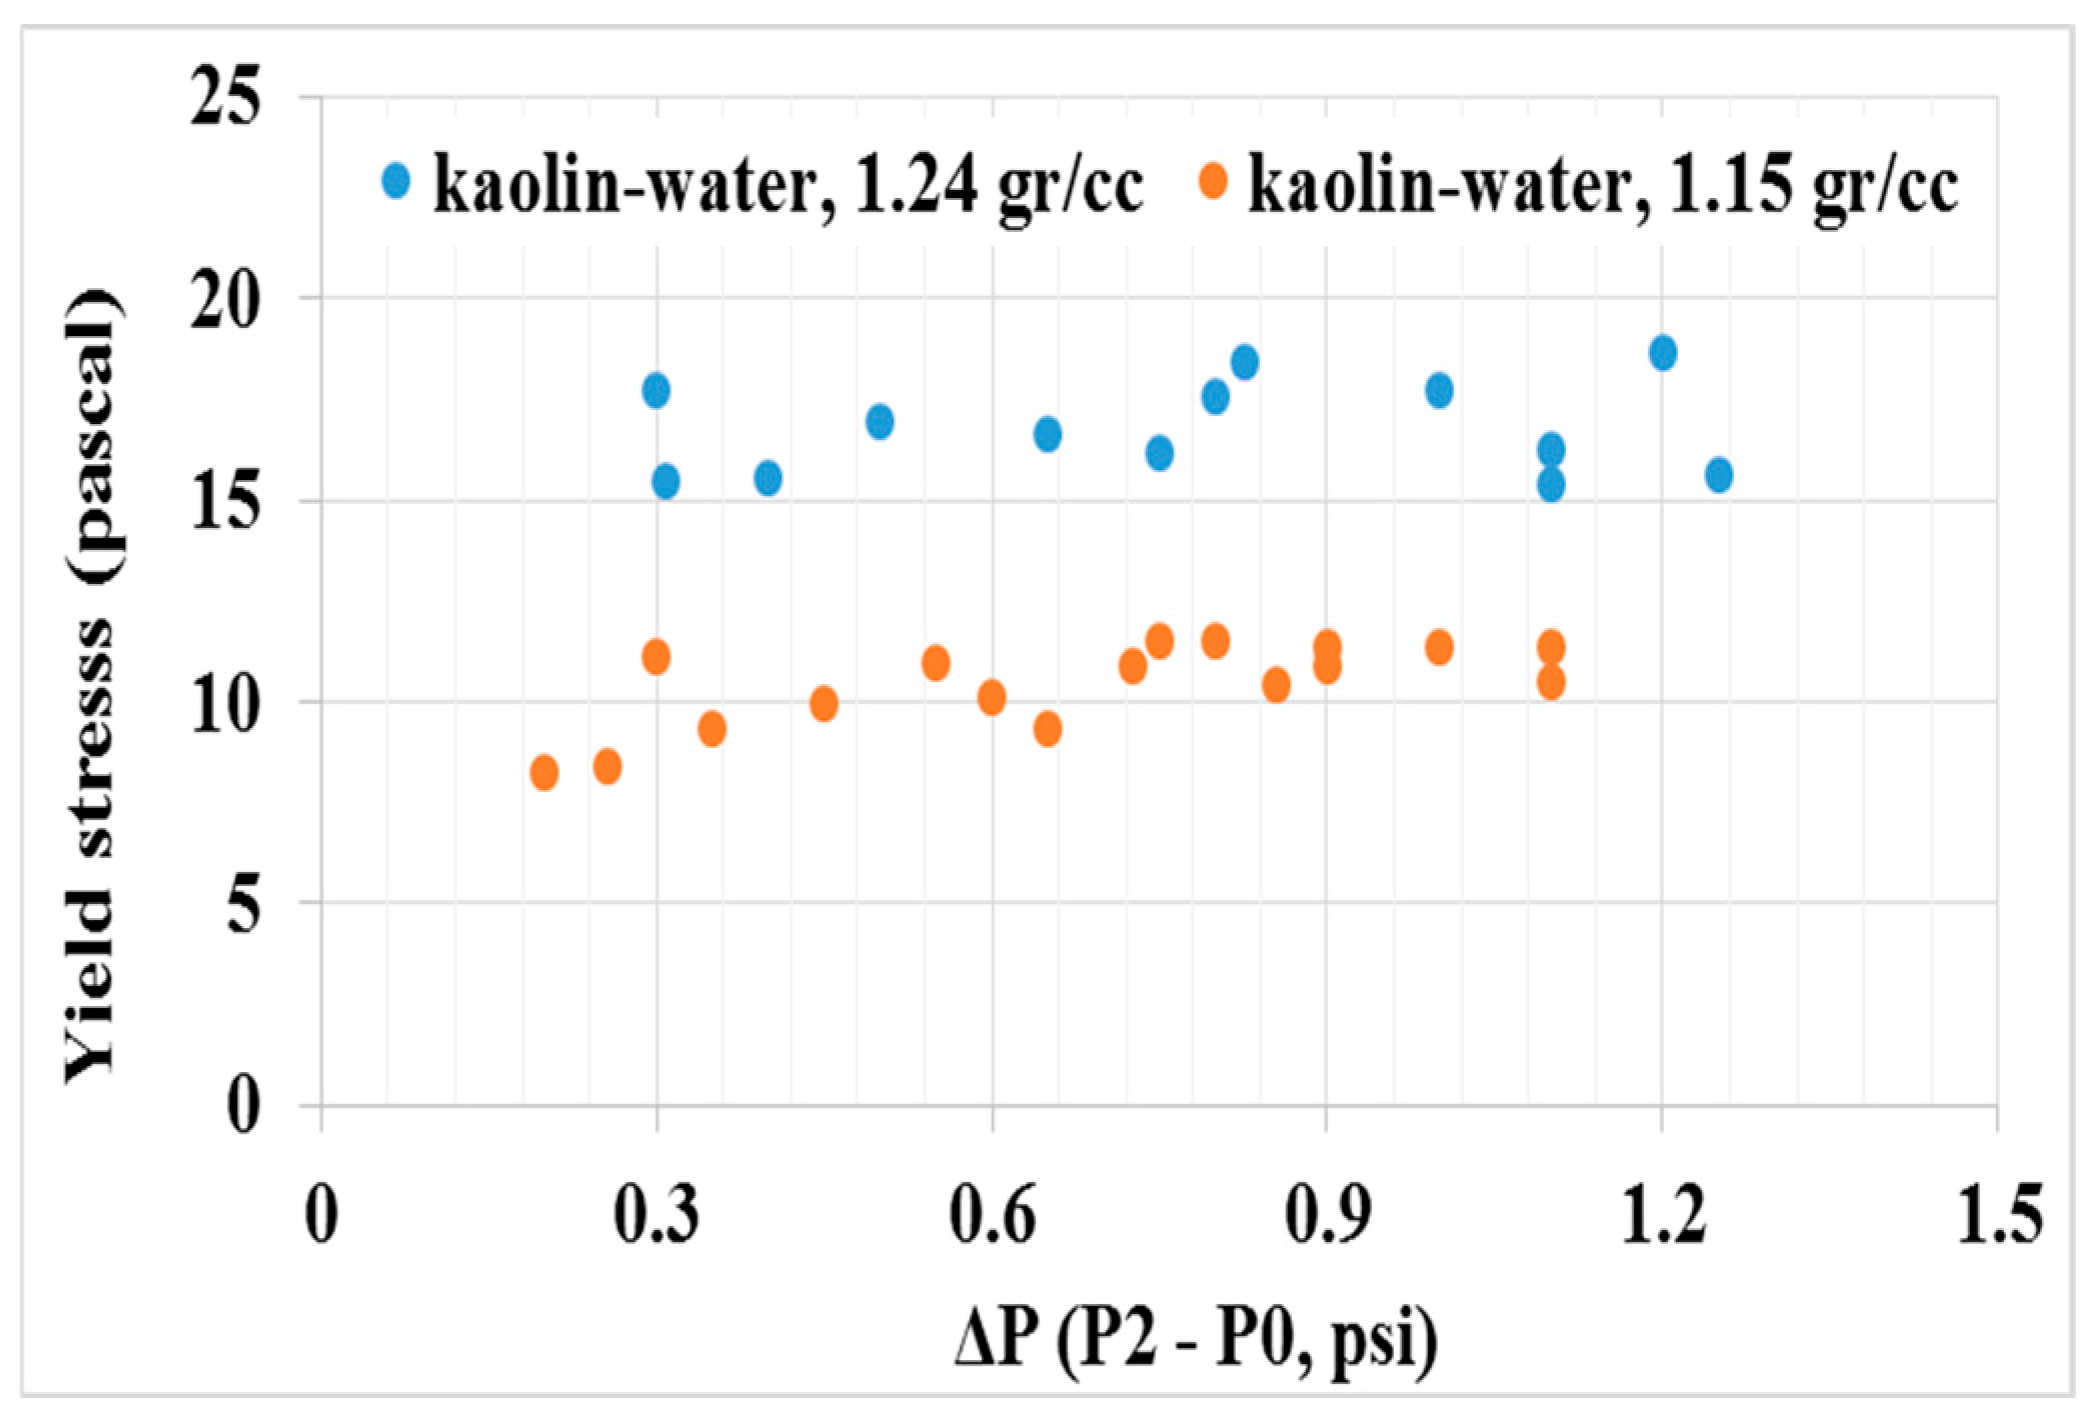
The bench-scale test setup shown was also used to measure the liquid column height that was produced by static pressure inside a vertical tube. This method was found capable of differentiating between two kaolin–water mixtures with densities of 1.15 g/cc and 1.24 g/cc, with consistent yield stress values in a wide range of ΔP (0.3 to 1.5 psi). Yield stress was obtained using the Liquid Rise method and results are shown in Figure 8. A theoretical error analysis was performed by assuming a 1 mm uncertainty in the height measurement of the liquid column and its effect on calculating the yield stress. The 1 mm inaccuracy in the height measurement translates to a maximum of 1.3 and 7.7 percent error for yield stress for the 1.24 g/cc and 1.15 g/cc mixtures, respectively.
Figure 8.
Yield stress of kaolin–water slurry (1.24g/cc and 1.15g/cc) using the Liquid Rise method at different pressure differences.
6. Experimental Setup
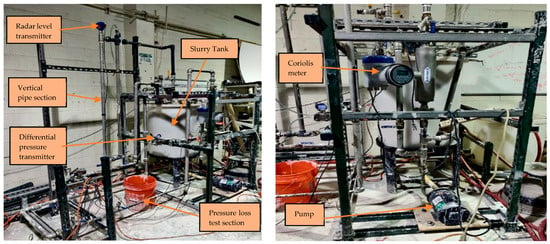
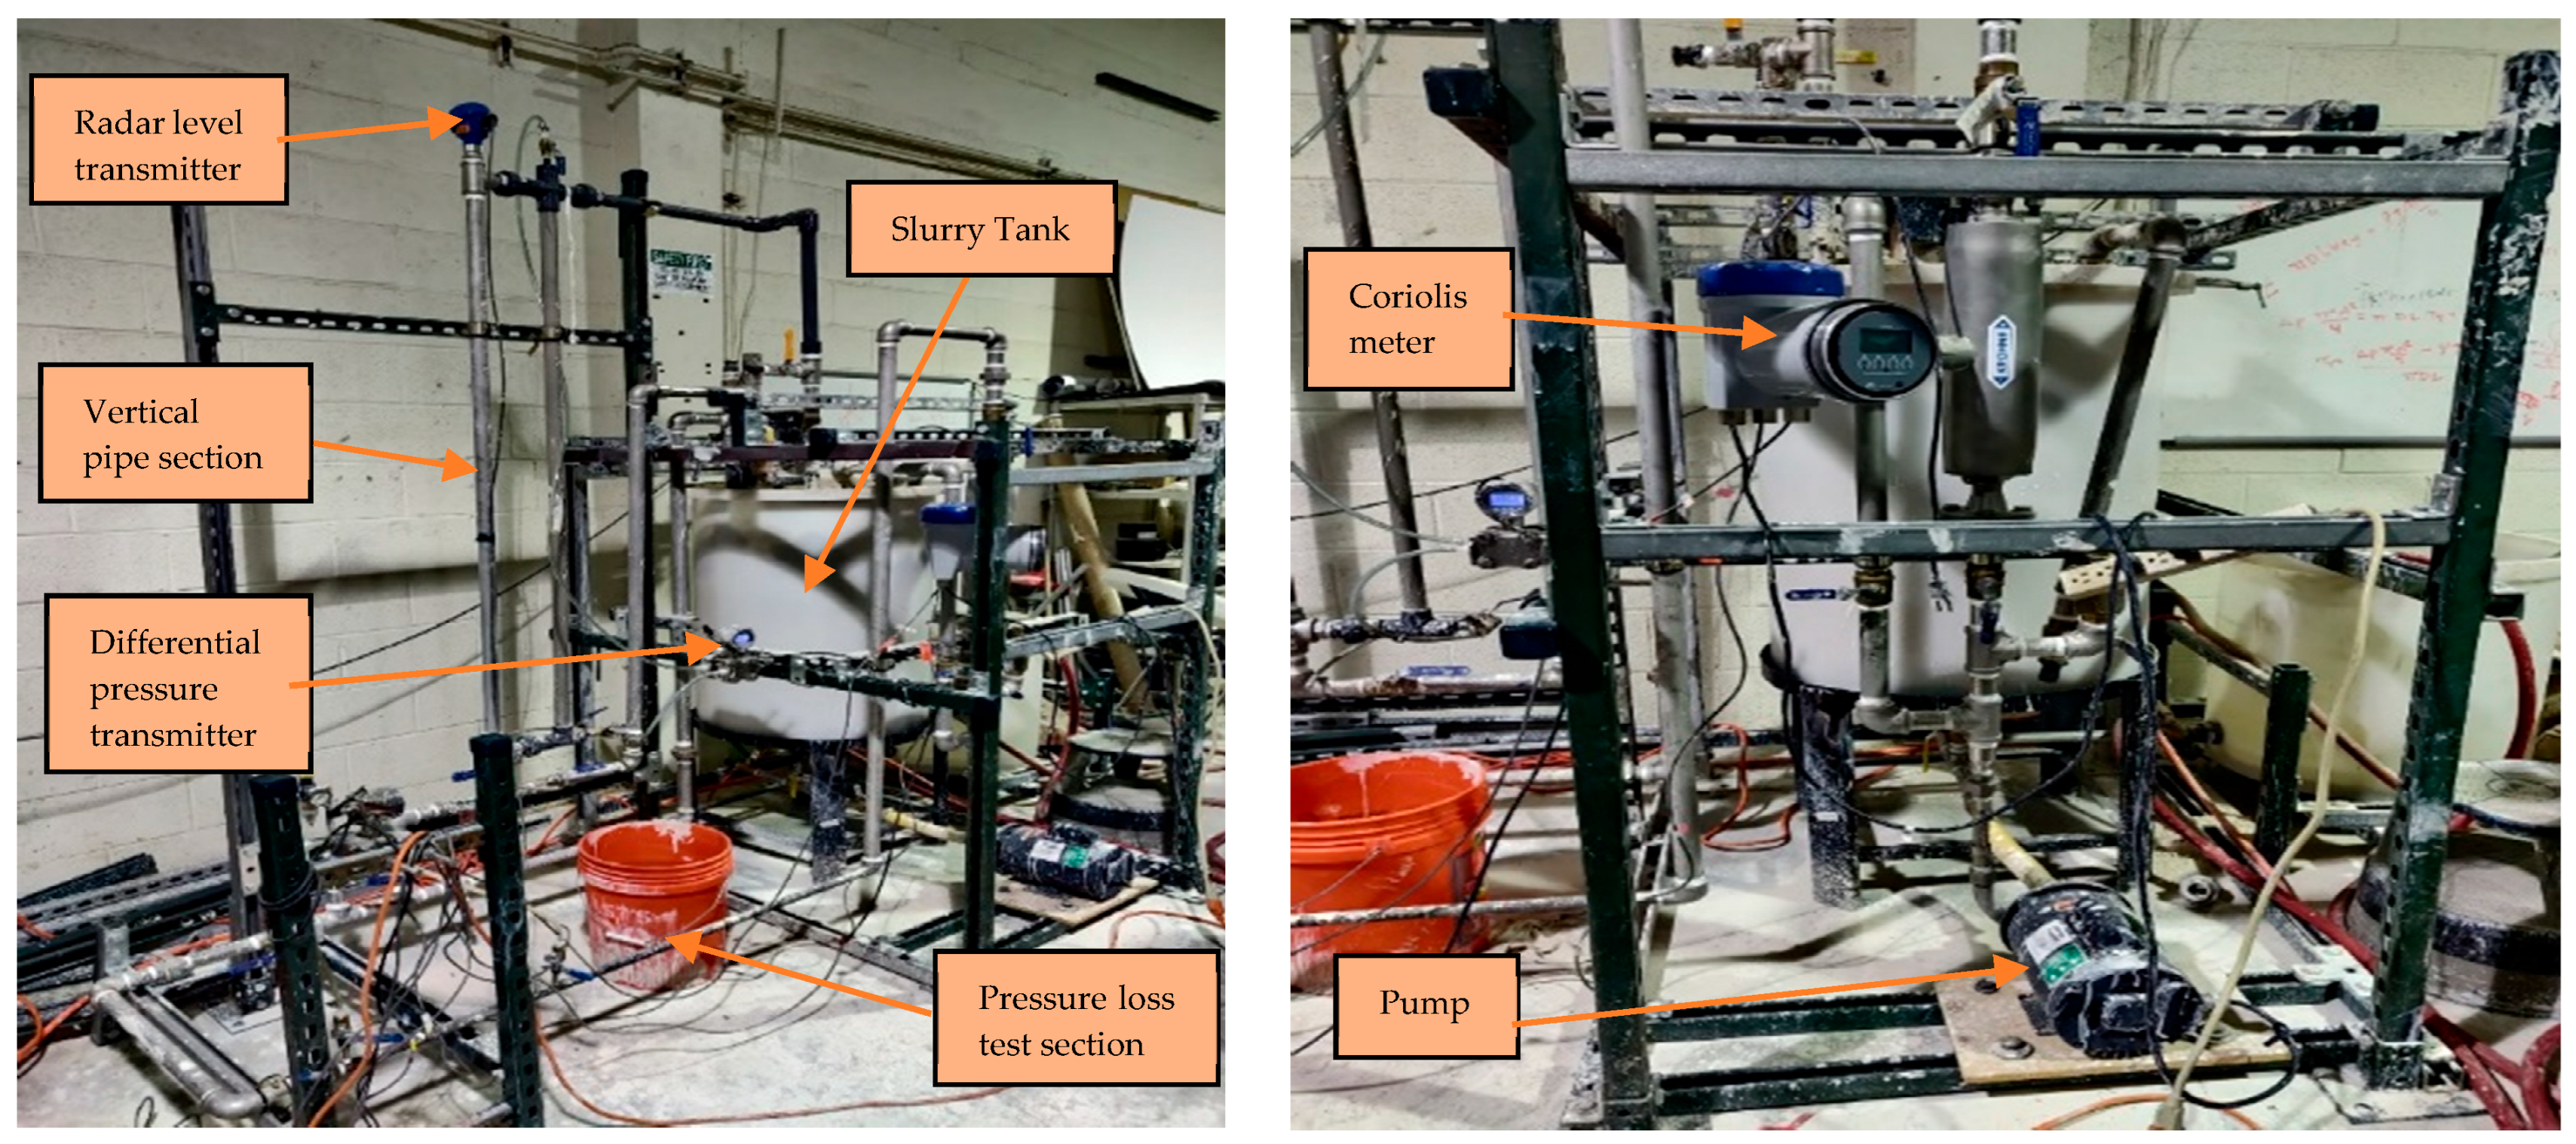
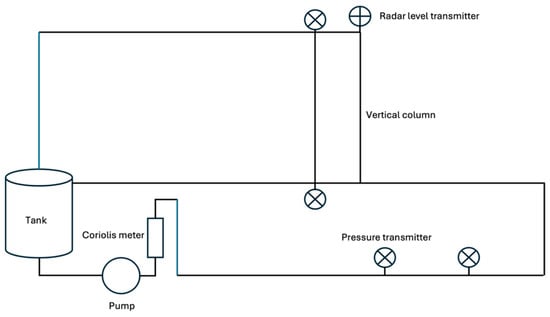
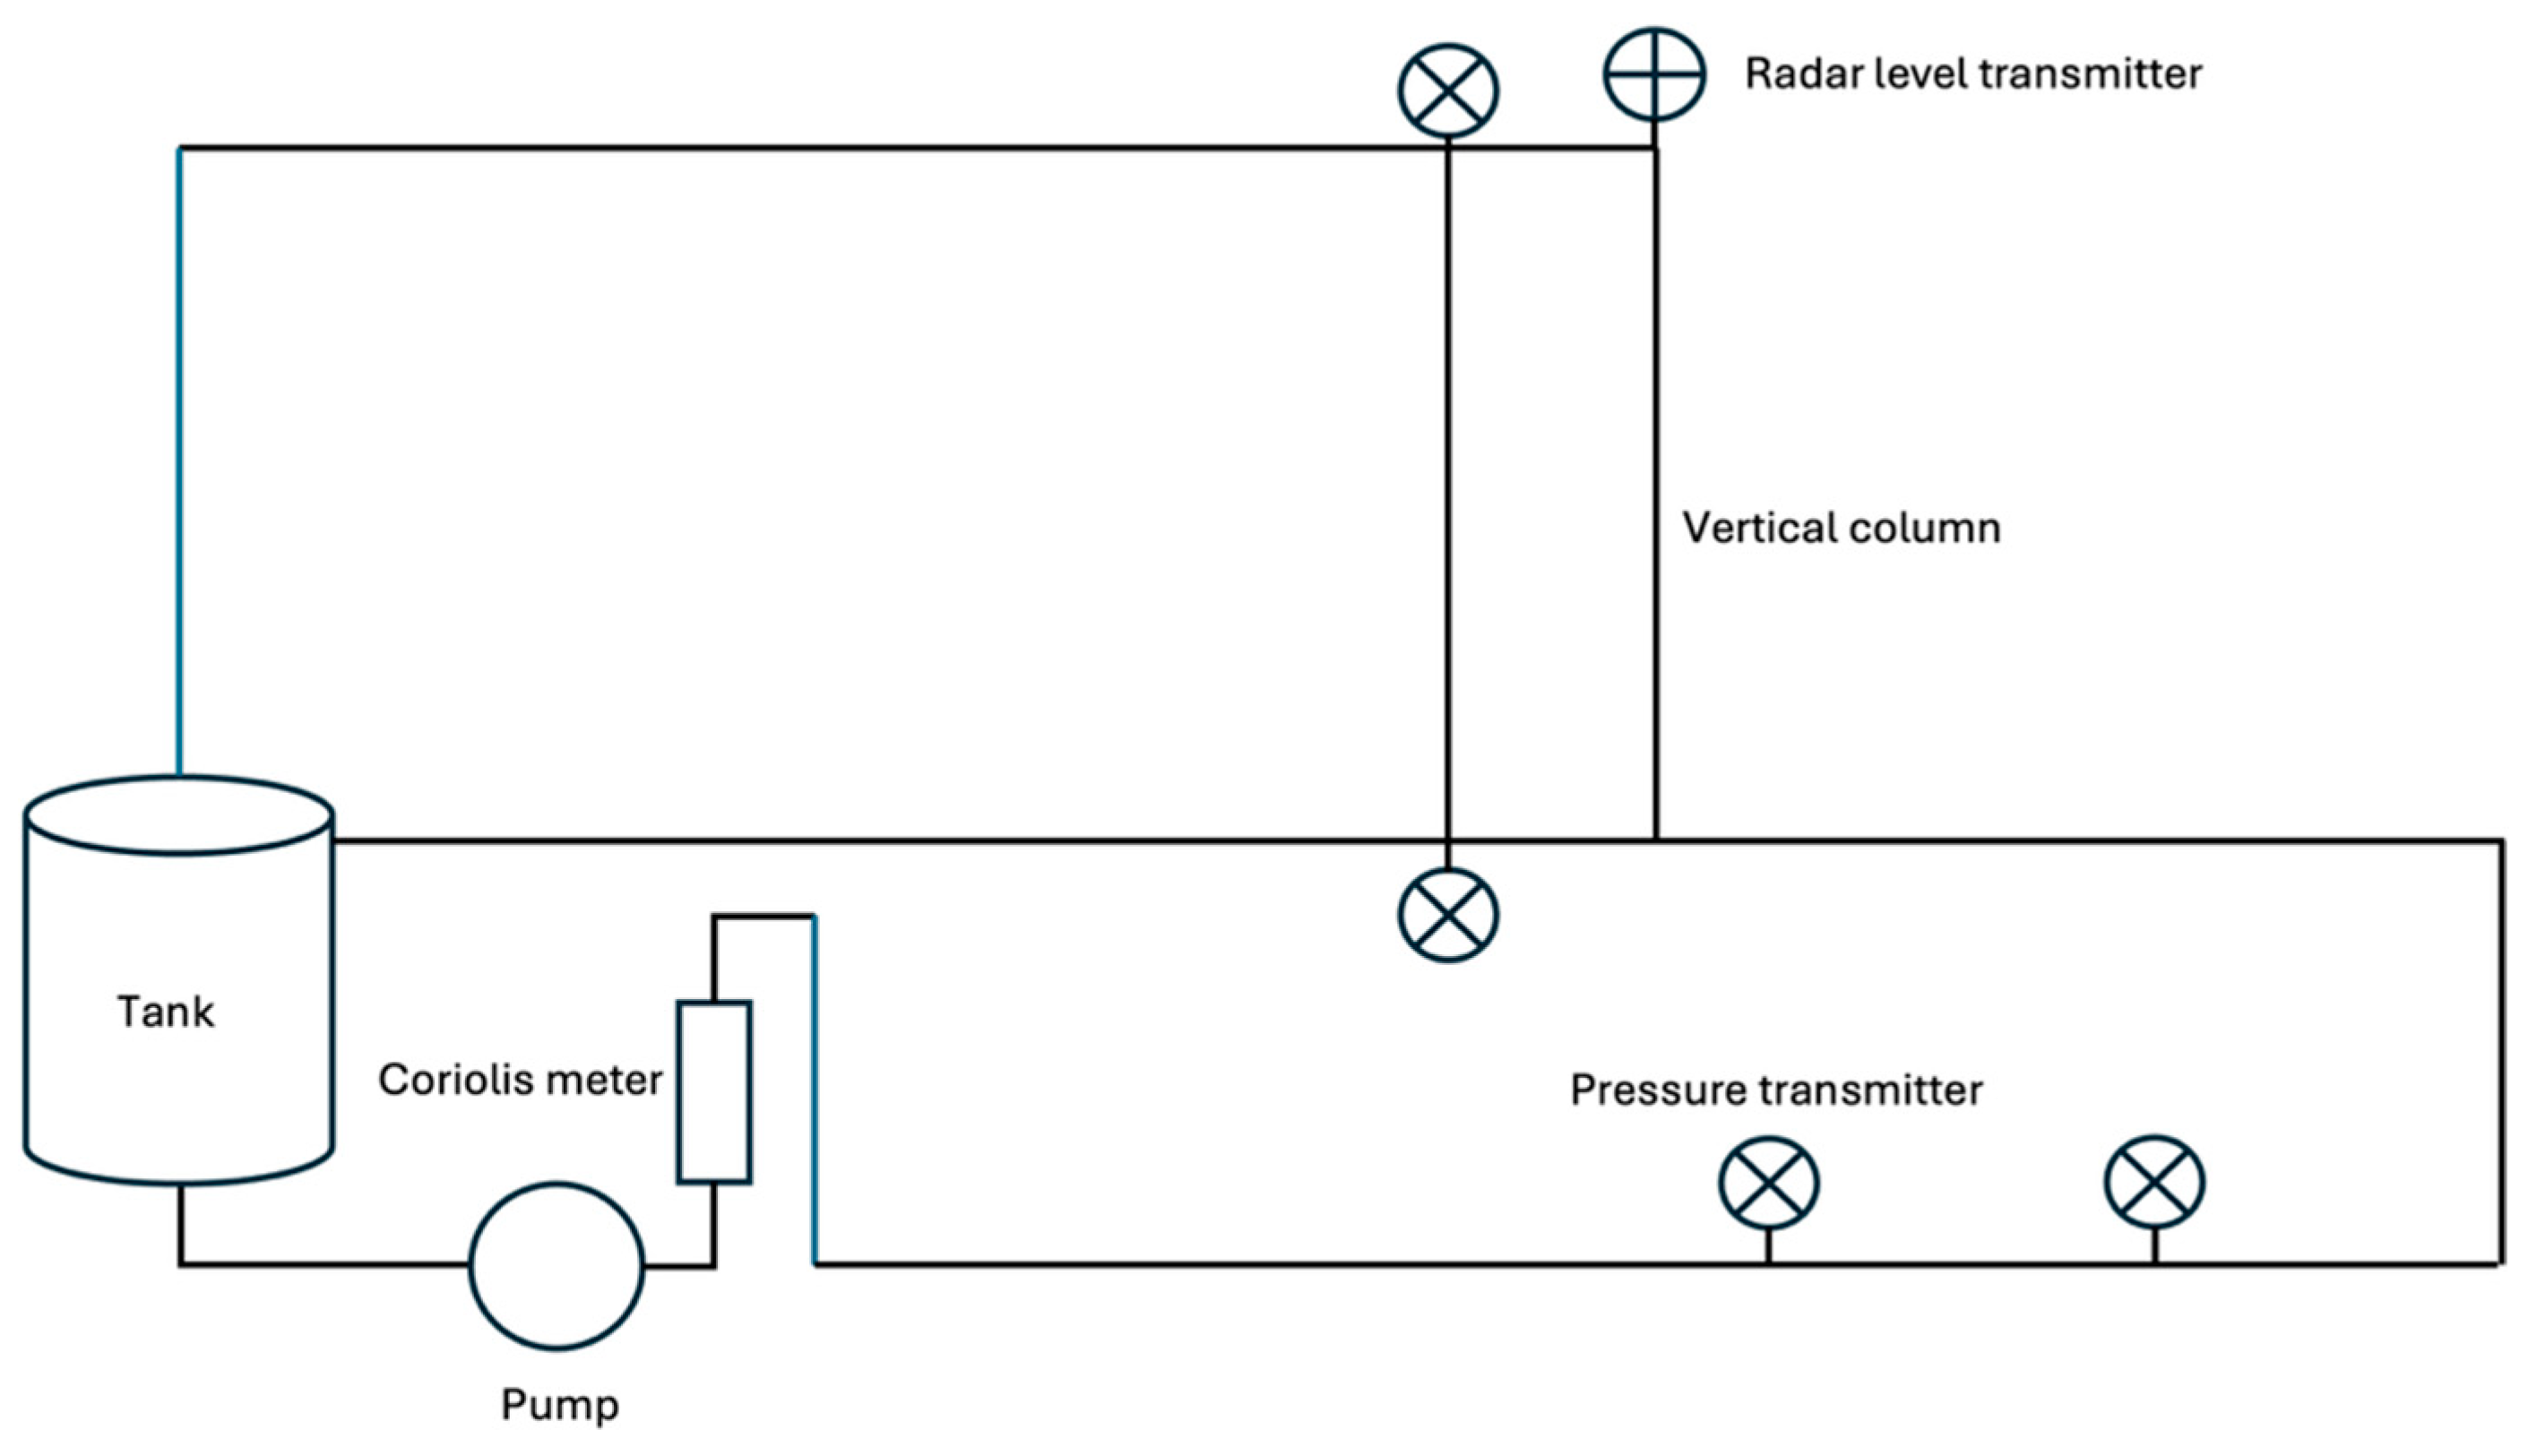
To achieve the objectives of determining the yield stress of the Kaolin–water slurry using the Pressure Loss and Liquid Rise methods, a one-inch diameter standard steel pipe loop was constructed. This loop, shown in Figure 9, contains a pressure drop measurement section of ½-inch nominal diameter schedule-40 pipe for the Pressure Loss method and two 1-inch nominal diameter schedule-40 vertical pipe sections, one steel and one clear PVC, for the Liquid Rise method. The height of slurry in the vertical section of the pipe is measured using a Flowline radar level transmitter. A Dayton 0.5 HP mixer with an upgraded 6” propeller allows for efficient mixture of the slurry, which is transported through the loop via a 36 GPM centrifugal pump. A 1-inch Khrone Optimass 1000 Coriolis (KROHNE Group, Beverly, MA, USA) meter was installed at the entrance of the loop to measure the flow rate and density of the material flowing through the loop in real time. The PX-3005 (Omega, Norwalk, CT, USA) differential pressure transducer was used to measure the pressure difference in various sections of the loop. In addition, measured pressure, flow rate and density data was fed into an in-house LabVIEW and MATLAB code, which enabled real-time monitoring of yield stress during experiments. A schematic diagram of the experimental setup is presented in Figure 10 to illustrate the main components and the overall measurement configuration of the system.
Figure 9.
Experimental setup (1-inch loop) for in-line monitoring of yield stress in real time using the Liquid Rise and Pressure Loss methods.
Figure 10.
Schematic diagram of experimental setup showing pressure taps and vertical riser.
The geometry of the test loop and the location of the measurement instruments are important because the Pressure Loss method requires laminar and fully developed flow between the pressure taps. Therefore, the dimensions of the Pressure Loss section, pressure-tap spacing, vertical column diameter, and available upstream straight lengths were documented. These values are summarized in Table 2.
Table 2.
Main geometric details of the flow loop and measurement sections.
For each Kaolin–water slurry concentration, the slurry was first prepared and mixed in the tank until a visually uniform suspension was obtained. The pump was then started, and the slurry was circulated through the loop. The flow rate was adjusted using the bypass valve or control valve to obtain the desired operating condition. For the Liquid Rise method, the slurry height in the vertical column and the corresponding pressure difference were recorded after the column reached a stable height. For the Pressure Loss method, pressure-drop measurements were recorded across the horizontal test section at two different flow rates for each slurry concentration. The two flow-rate conditions provided the two equations required to solve for the apparent yield stress.
7. Results and Discussion
7.1. Liquid Rise Method
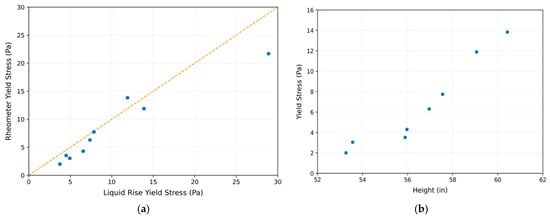
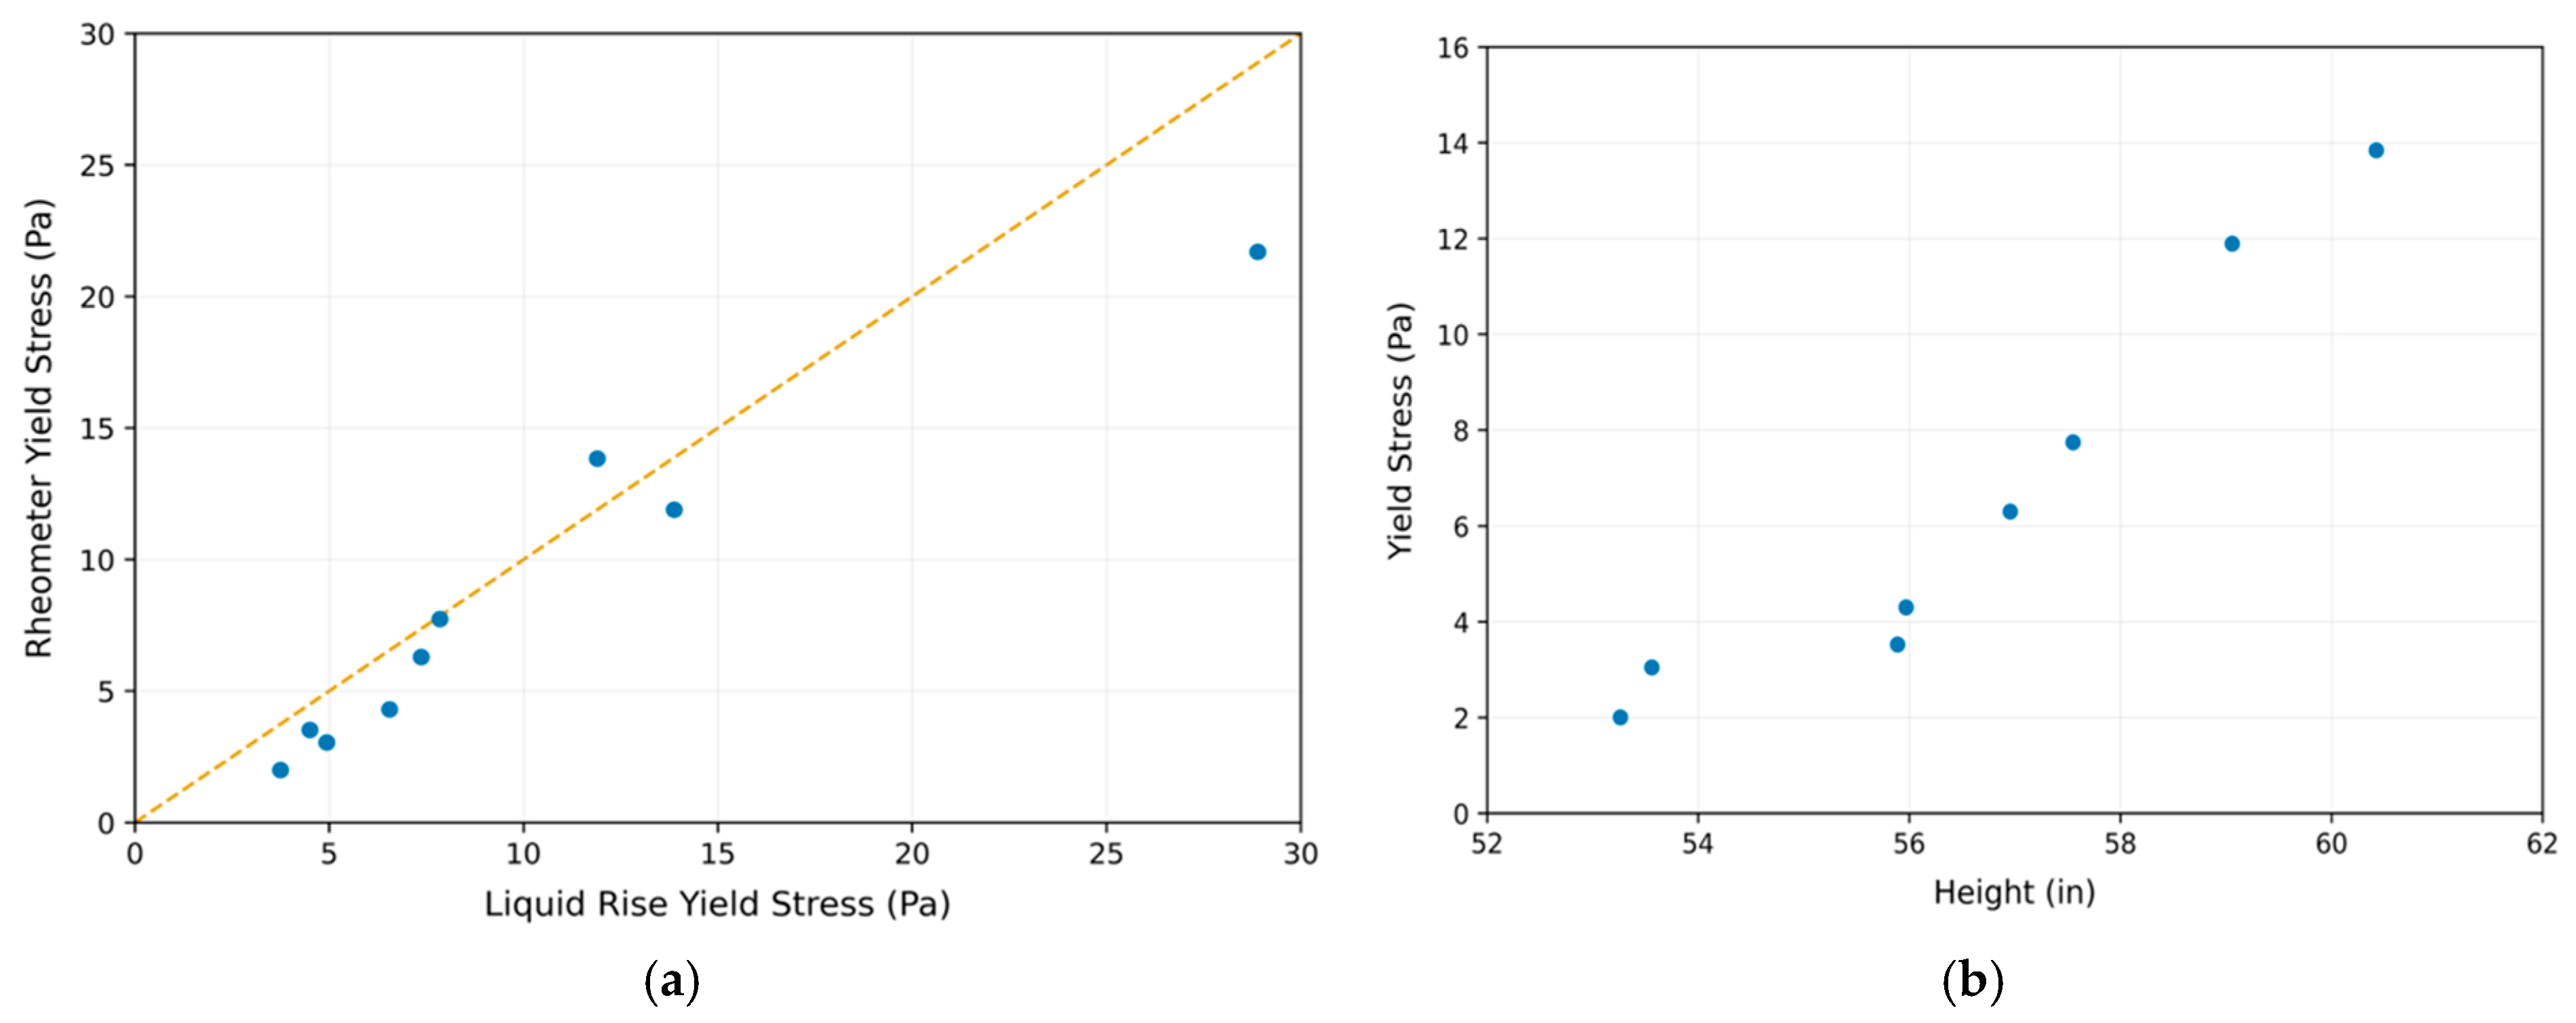
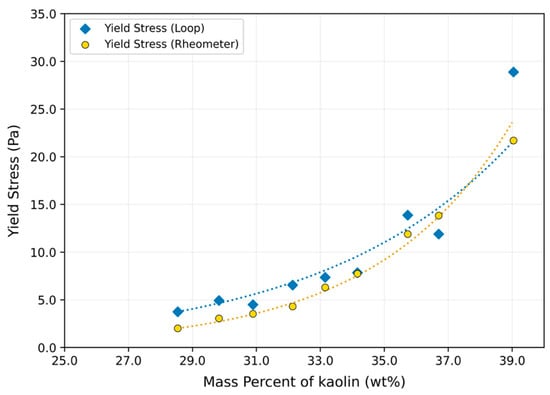
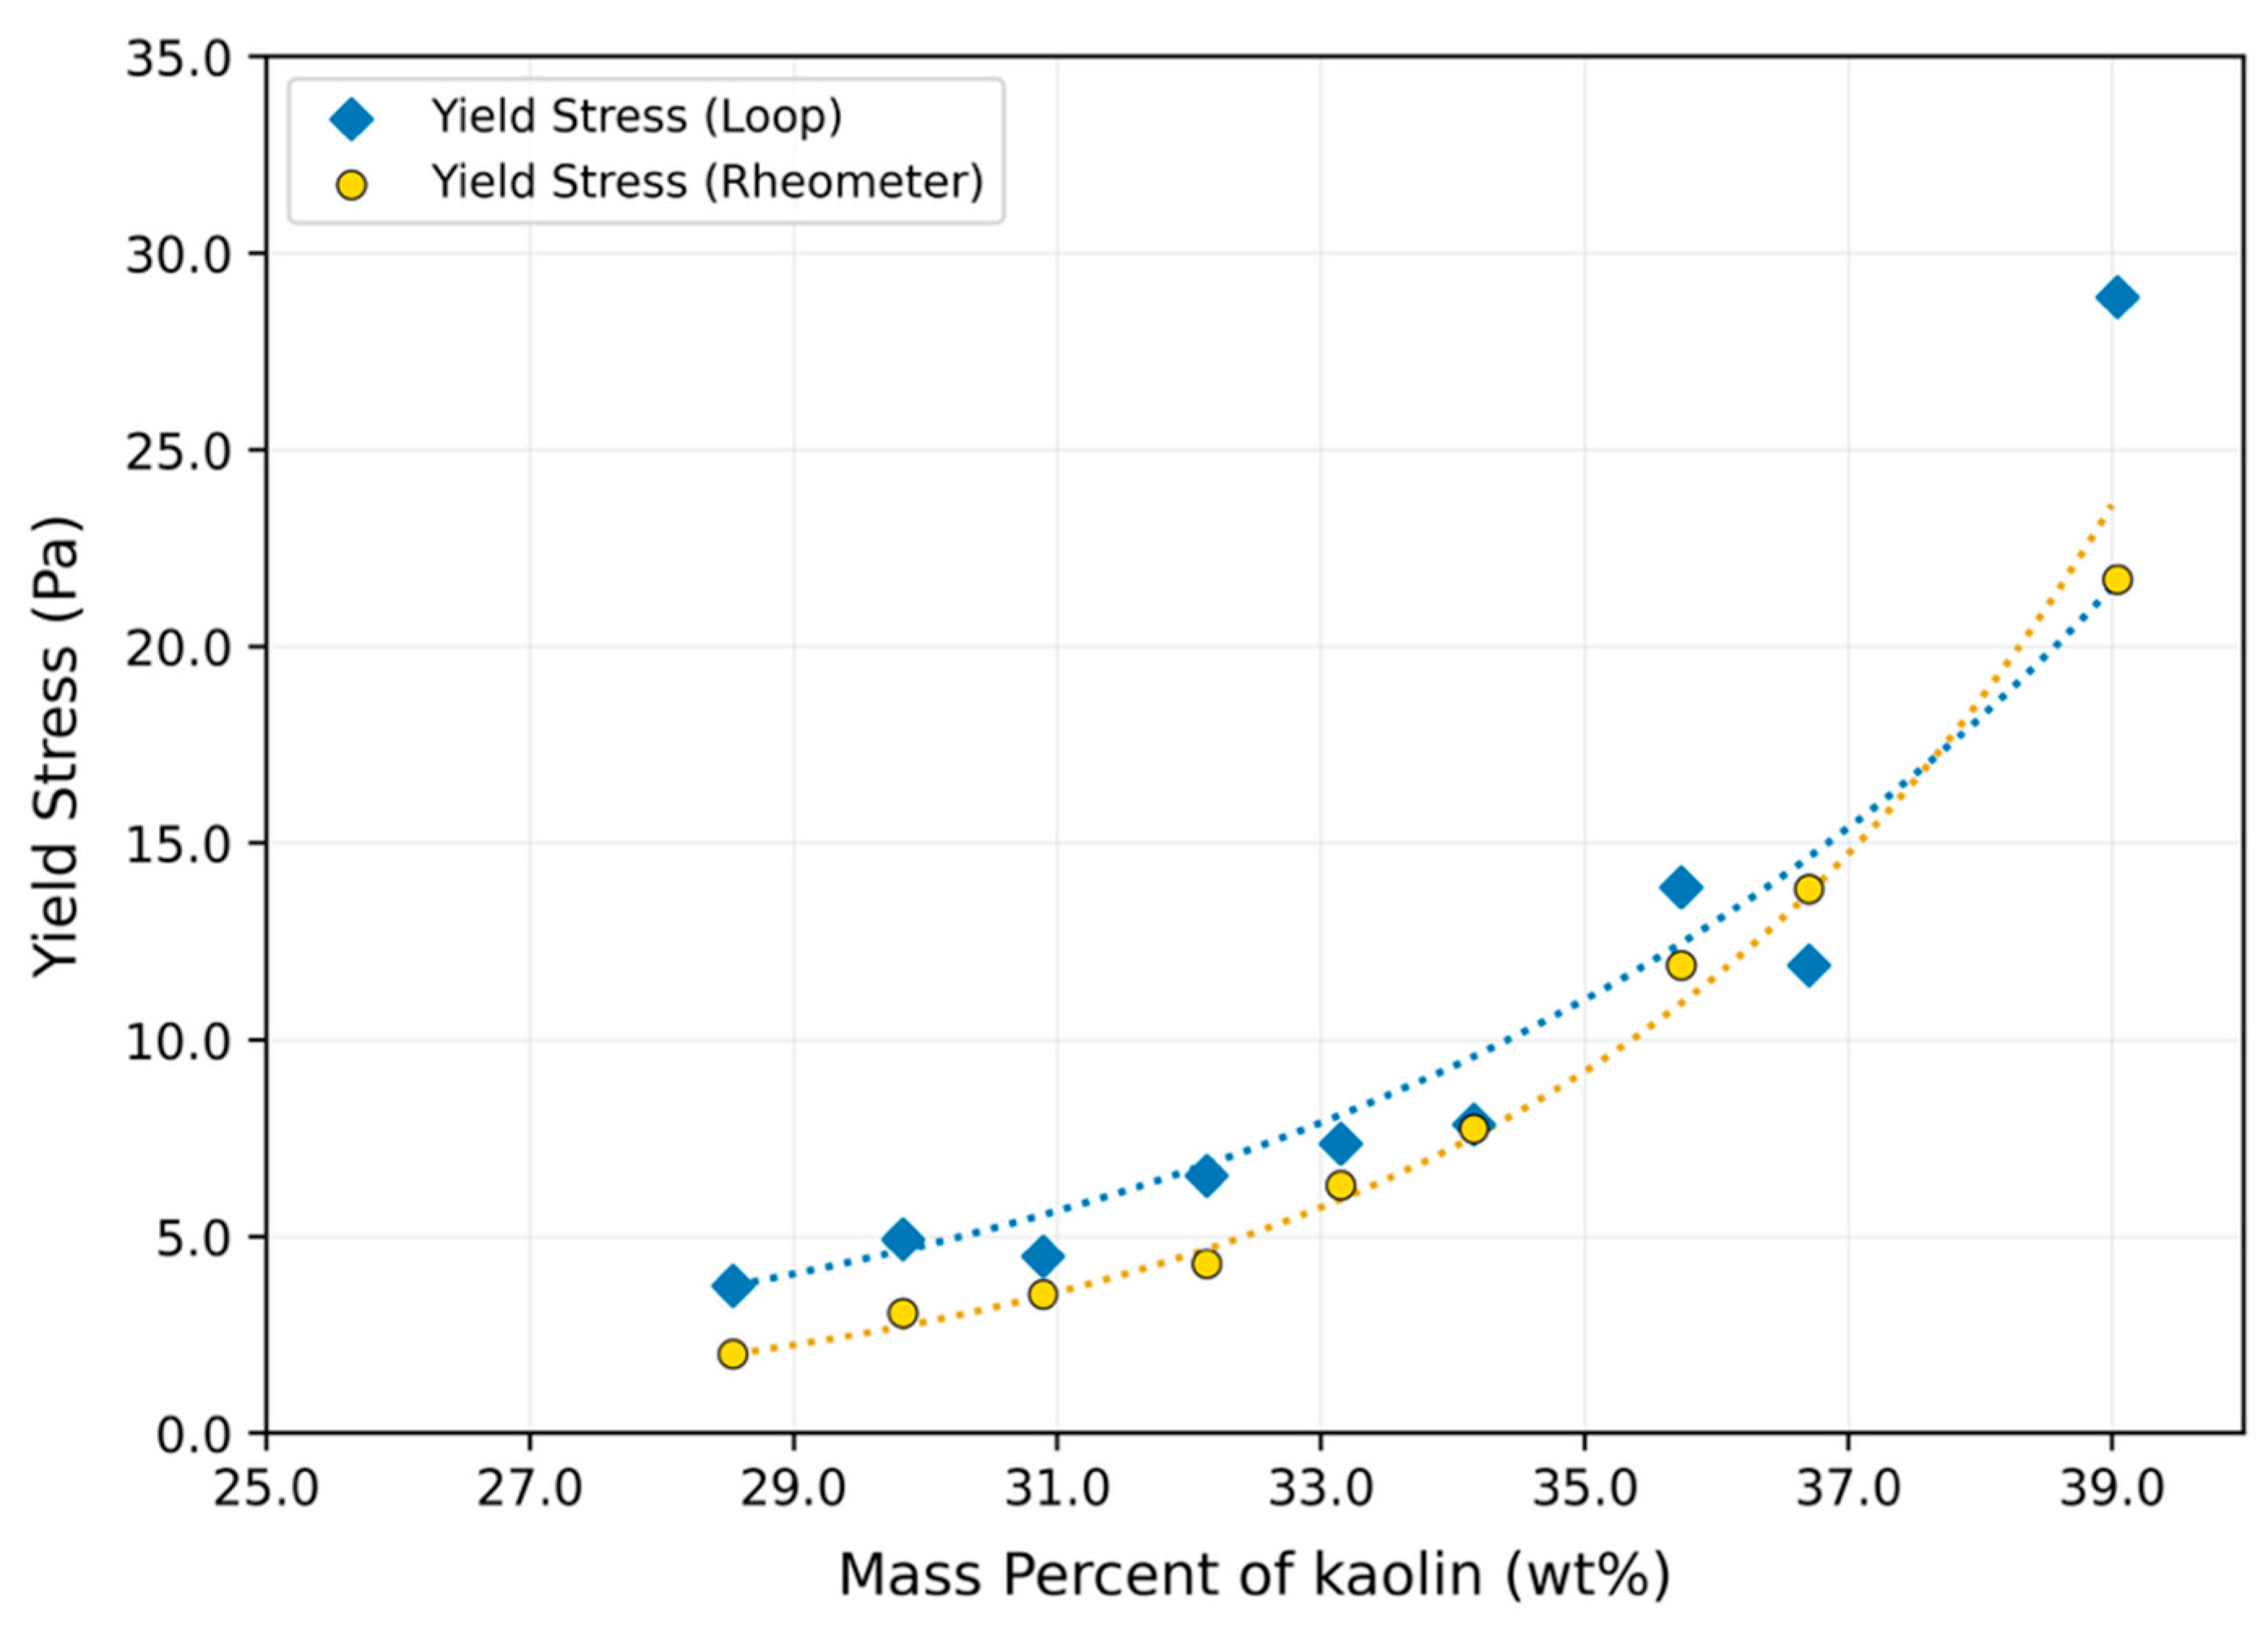
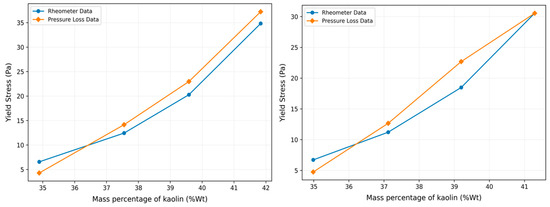
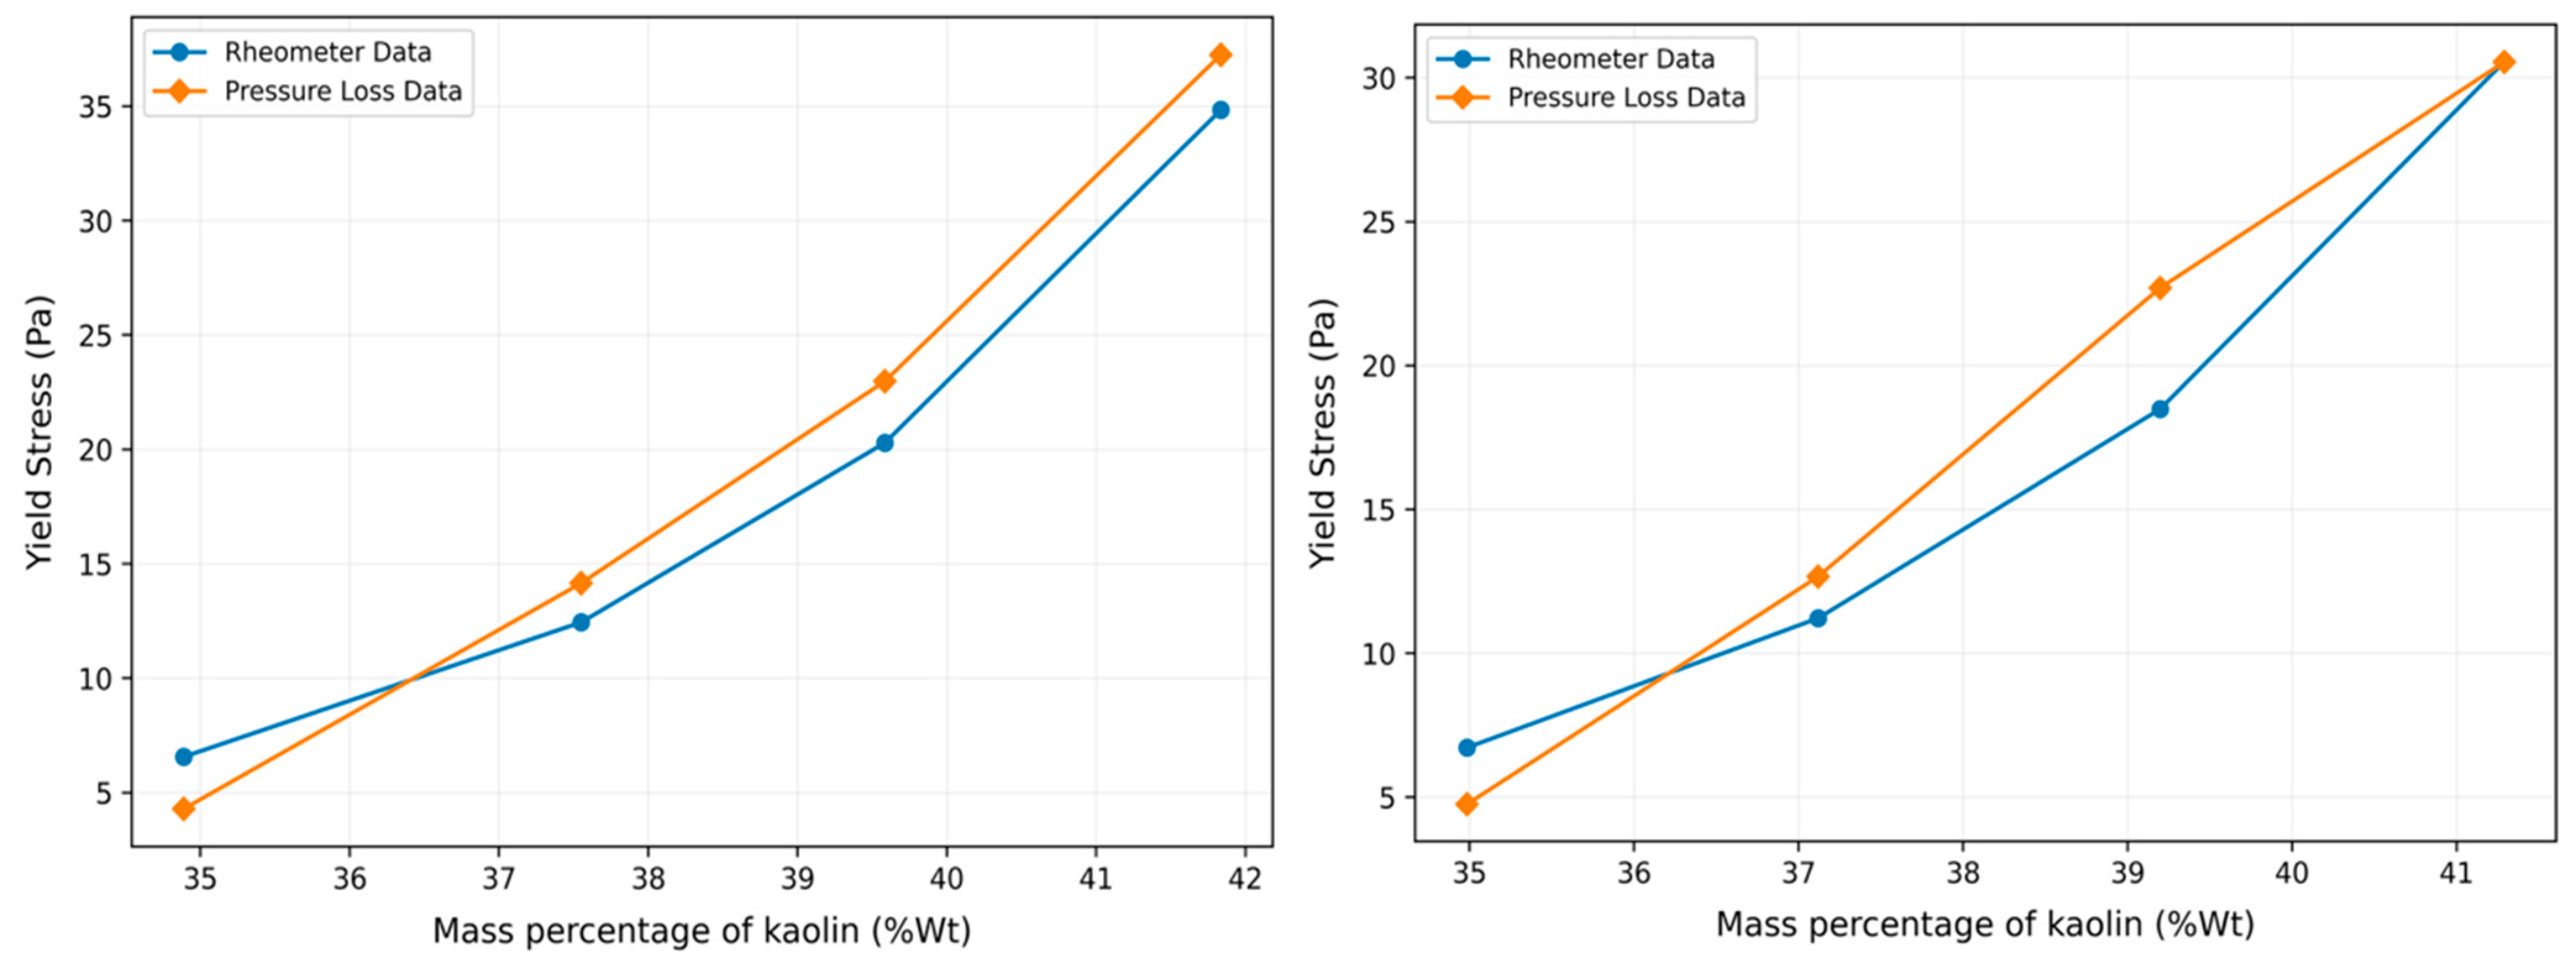
A series of experiments was conducted with kaolin–water slurries of different specific gravities. Experiments were focused on a slurry yield stress range from 2 Pa to 30 Pa, which is the typical yield stress range for the radioactive waste. Estimation of yield stress was done using the Liquid Rise method and an error analysis was performed. For each experiment, slurry samples were tested using the rheometer so that the data could be compared with experimental results. The comparison between the Liquid Rise method and the baseline rheometer measurements is shown in Figure 11a. This figure indicates that the Liquid Rise method captured the increase in apparent yield stress with increasing kaolin concentration. This agreement supports the feasibility of the method as a proof-of-concept approach for estimating apparent yield stress under controlled slurry conditions. Figure 11b shows the linear increment in the height of the slurry column with increasing yield stress.
Figure 11.
(a) Comparison of yield stress measured with the Liquid Rise method and the baseline rheometer. (b) Change in the height of the slurry in the vertical column with increasing yield stress.
The yield stress data obtained from the testing was plotted with the rheometer-measured data in Figure 12. The measured apparent yield stress showed limited variation among the tested conditions, suggesting that the method was relatively stable within the operating range examined.
Figure 12.
Comparison of yield stress measured with the Liquid Rise method and the rheometer.
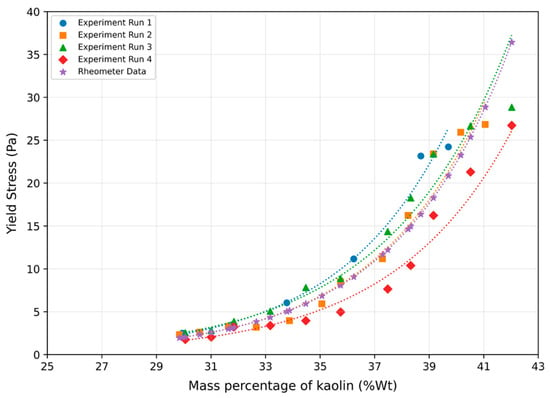
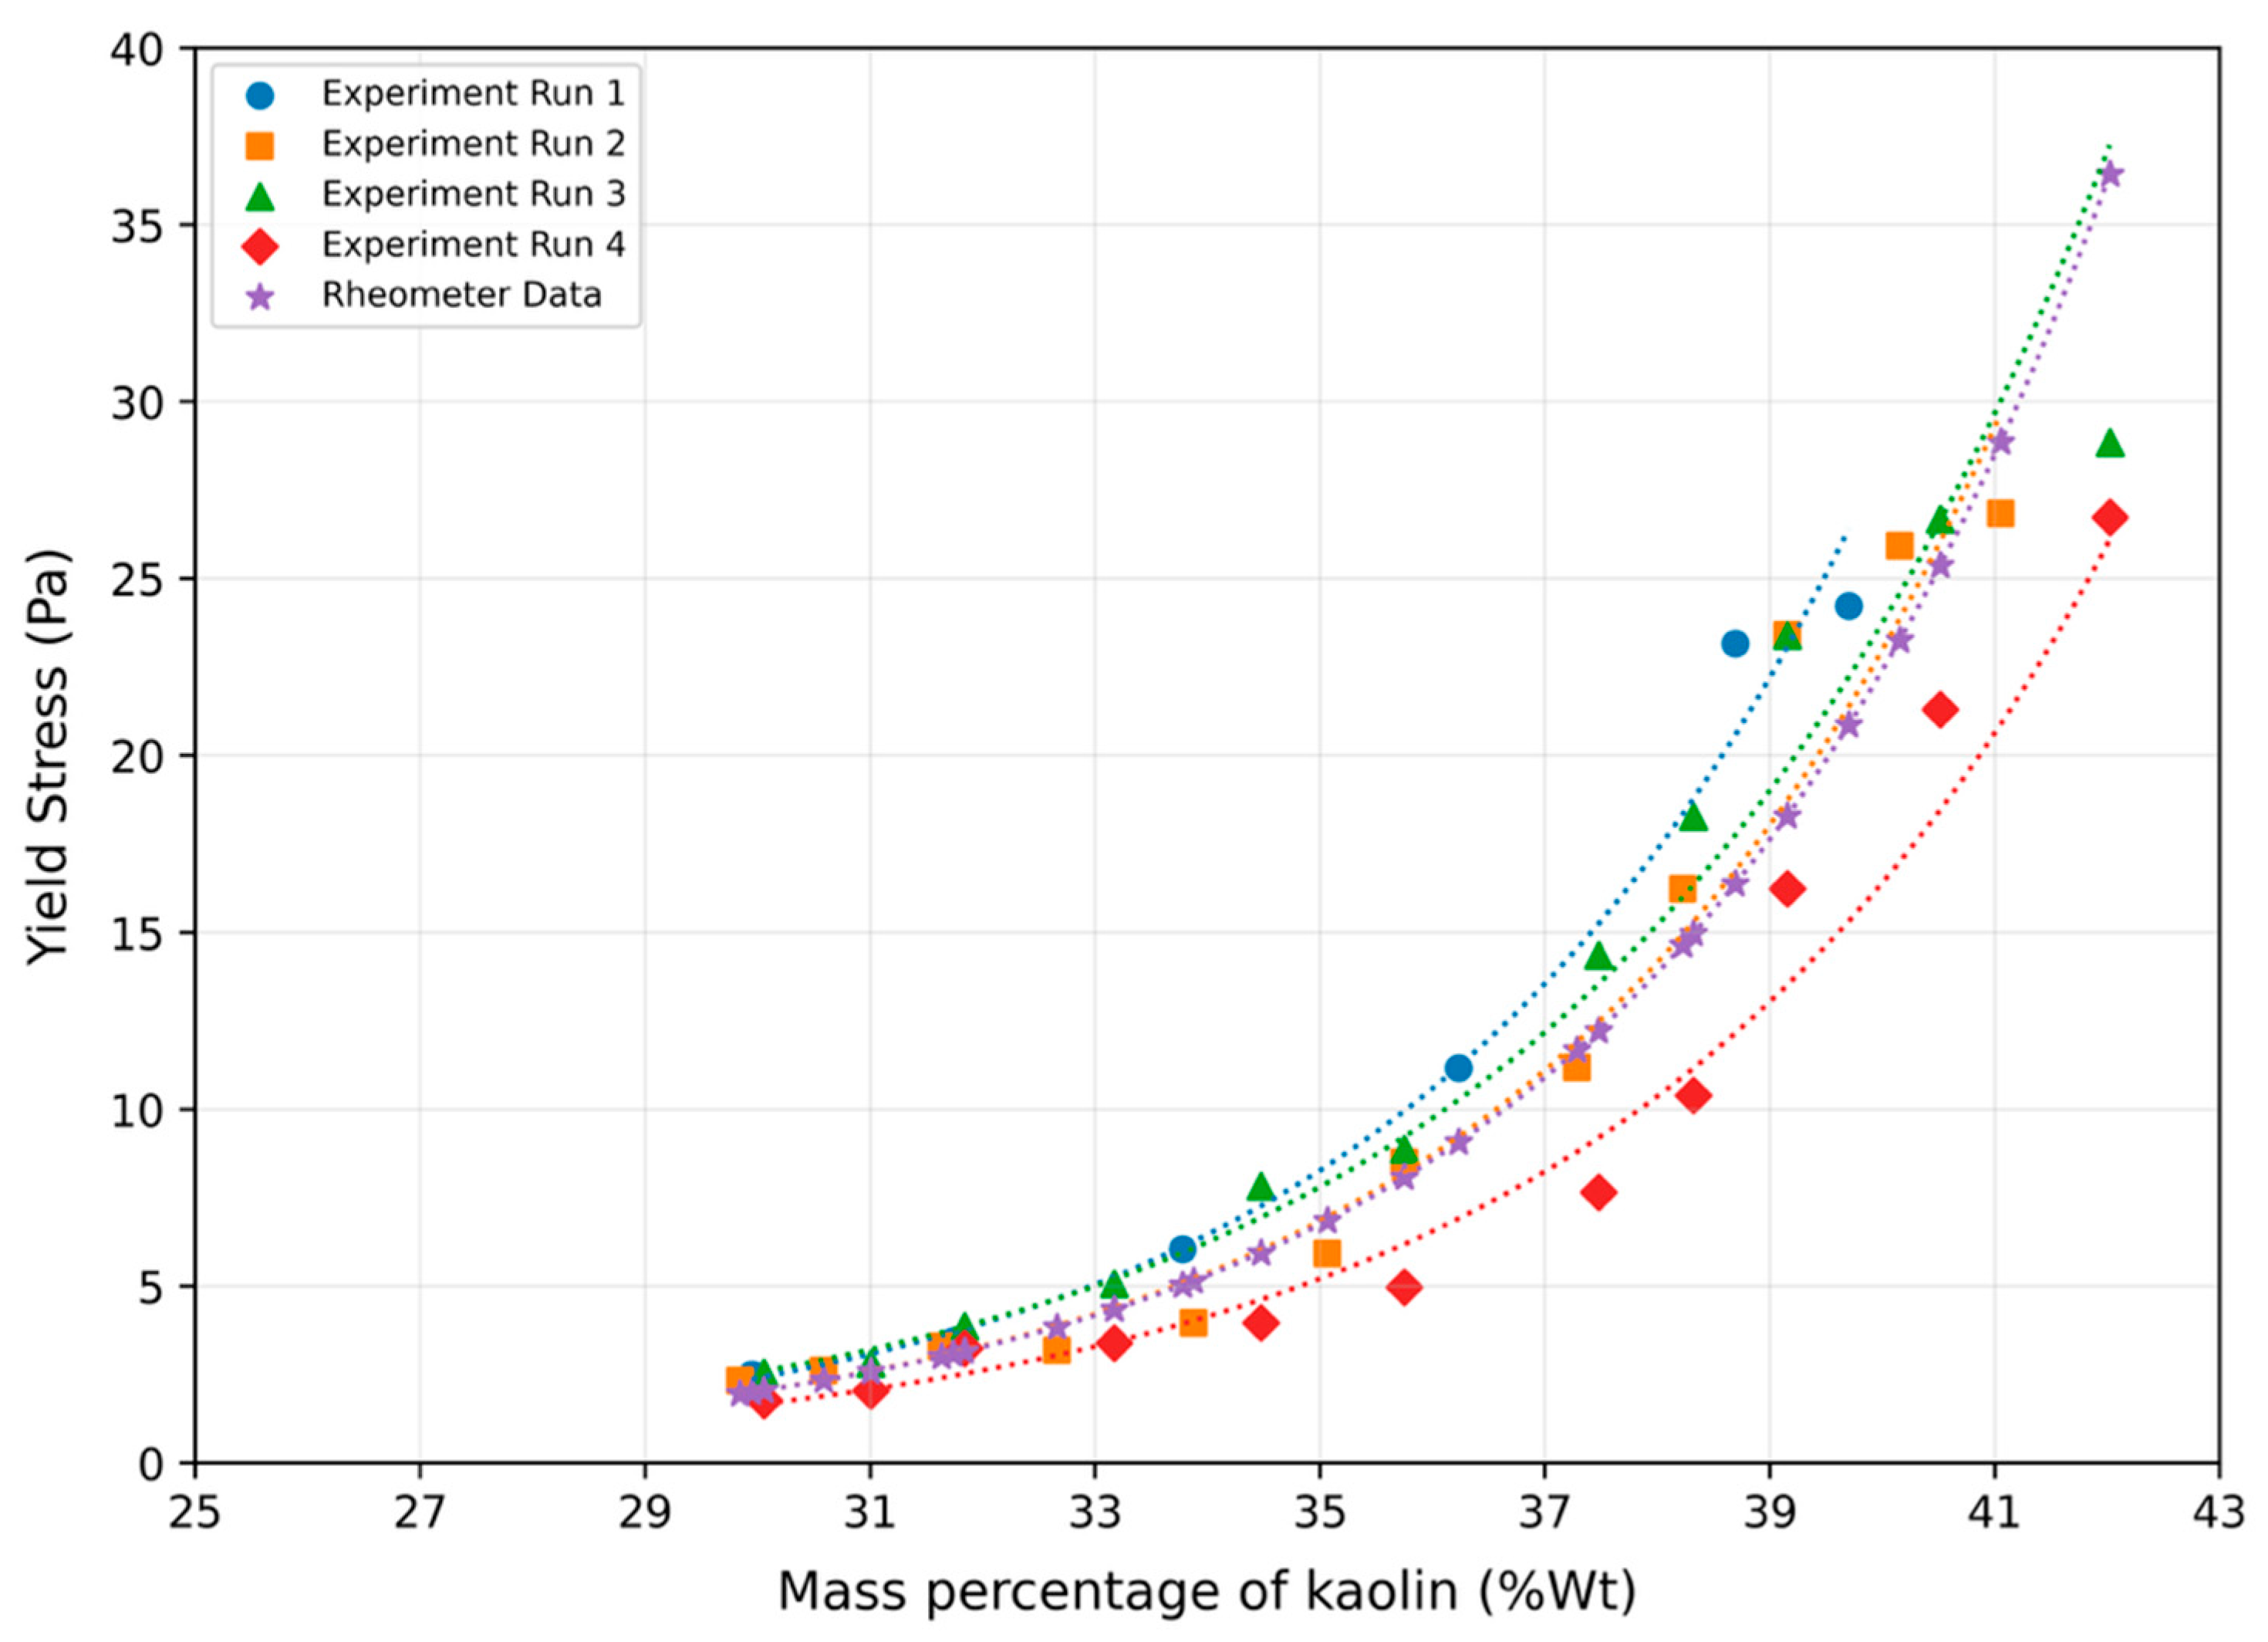
The Liquid Rise method was tested for different flow rates of the slurry to determine the repeatability and dependency of the yield stress data on flow rates. Flow rates were varied by controlling a bypass valve, which regulates the slurry flow through the measurement section. Figure 13 shows the repeatability and flow-rate dependence of the Liquid Rise method for repeated experimental runs. The measured apparent yield stress values from different runs follow the same increasing trend with kaolin concentration and show limited deviation from the baseline rheometer data. This indicates that, within the tested operating range, the Liquid Rise method was relatively insensitive to the flow-rate variations examined and was able to reproduce the yield stress trend consistently.
Figure 13.
Repeatability and flow-rate dependence of apparent yield stress measured using the Liquid Rise method for different experimental runs compared with baseline rheometer data.
The uncertainty of the Liquid Rise method is influenced mainly by uncertainty in the measured pressure difference, column height, slurry density, and vertical pipe diameter. The uncertainty in the Liquid Rise yield stress estimate was calculated using the standard propagation of uncertainty applied to . The uncertainty contributions from pressure difference, slurry-column height, slurry density, and vertical pipe diameter were included. The combined uncertainty was calculated as
where , , , and are the uncertainties associated with pressure difference, column height, slurry density, and pipe diameter, respectively. The corresponding relative uncertainty was calculated as
The pressure and density uncertainties were ±0.075% and ±0.2%, respectively, while the height uncertainty was ±3 mm. Because the vertical pipe diameter uncertainty was asymmetric , upper and lower uncertainty bounds were calculated separately. Using this approach, the measurement-based uncertainty in the Liquid Rise yield stress estimate was approximately +8.2%/−6.8% over the tested conditions. In particular, lower yield stress samples are more sensitive to small height and pressure variations because the calculated stress is smaller.
The uncertainty analysis above accounts for measurement uncertainty in the input variables, but it does not fully include model-related uncertainty. Additional uncertainty may arise from wall slip, sedimentation, density gradients inside the vertical column, time-dependent structural rebuilding, and possible non-uniformity of the slurry column. Since the Liquid Rise method depends on slurry density, maintaining a homogeneous suspension is important. During the experiments, the slurry was continuously mixed in the tank to reduce particle settling before entering the measurement section. The density measured by the Coriolis meter was used as the bulk slurry density in the calculation. However, if sedimentation or concentration gradients occur inside the vertical column, the local density of the column may differ from the measured bulk density, introducing error into the calculated yield stress.
Overall, the Liquid Rise method showed promising agreement with the rheometer baseline and demonstrated the ability to track changes in apparent yield stress with kaolin concentration. Nevertheless, the method should be interpreted as a proof-of-concept approach for estimating apparent static or equilibrium yield stress under controlled, well-mixed slurry conditions.
7.2. Pressure Loss Method
For the Pressure Loss method, experiments were conducted in a range of yield stress from 6 Pa (34.47%wt) to 45.2 Pa (43.29%wt) using kaolin–water slurry. Since the Pressure Loss method requires a system of equations generated at two different flow rates, for each specific gravity of the slurry sample, two measurements of flow rate and corresponding pressure drop were acquired and processed. These two flow conditions were used to solve for the apparent Bingham yield stress and plastic viscosity using the Pressure Loss relationships described in Section 3. The Pressure Loss method assumes that the slurry flow is laminar, fully developed, and reasonably represented by a Bingham-type constitutive model over the tested shear-rate range. Therefore, the calculated values are interpreted as apparent Bingham yield stresses rather than universal yield stress values. To evaluate the validity of the laminar-flow assumption, the Reynolds number and Hedstrom number were calculated for the Pressure Loss experiments using the measured density, flow rate, pipe diameter, and rheological parameters. Table 3 shows the flow regime parametes for the pressure loss experiments.
Table 3.
Flow-regime parameters for the Pressure Loss experiments.
The calculated flow-regime parameters indicate that the analyzed Pressure Loss data were obtained under conditions intended to be laminar. The fully developed flow assumption was assessed by comparing the available upstream straight length before the first pressure tap with the estimated laminar entrance length. As a first-order engineering estimate, the laminar entrance length was evaluated using . For the Pressure Loss experiments, the calculated entrance length requirement ranged from 59 D to 24 D, while the available upstream straight length was 60 D. Therefore, the pressure taps were located beyond the estimated entrance region. This supports the assumption that the measured pressure drop primarily represents developed frictional Pressure Loss. However, because entrance length correlations for concentrated yield stress slurries are approximate and may be affected by wall slip, particle migration, and thixotropy, this assessment is treated as an engineering verification rather than a complete proof of fully developed flow.
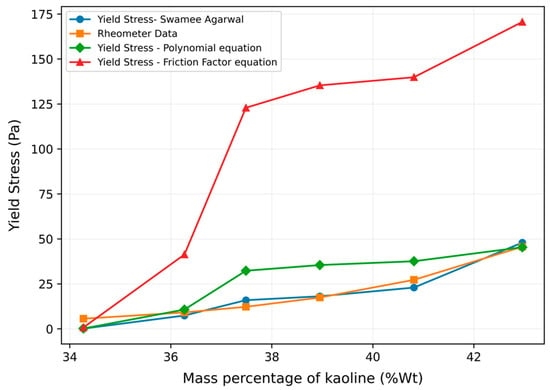
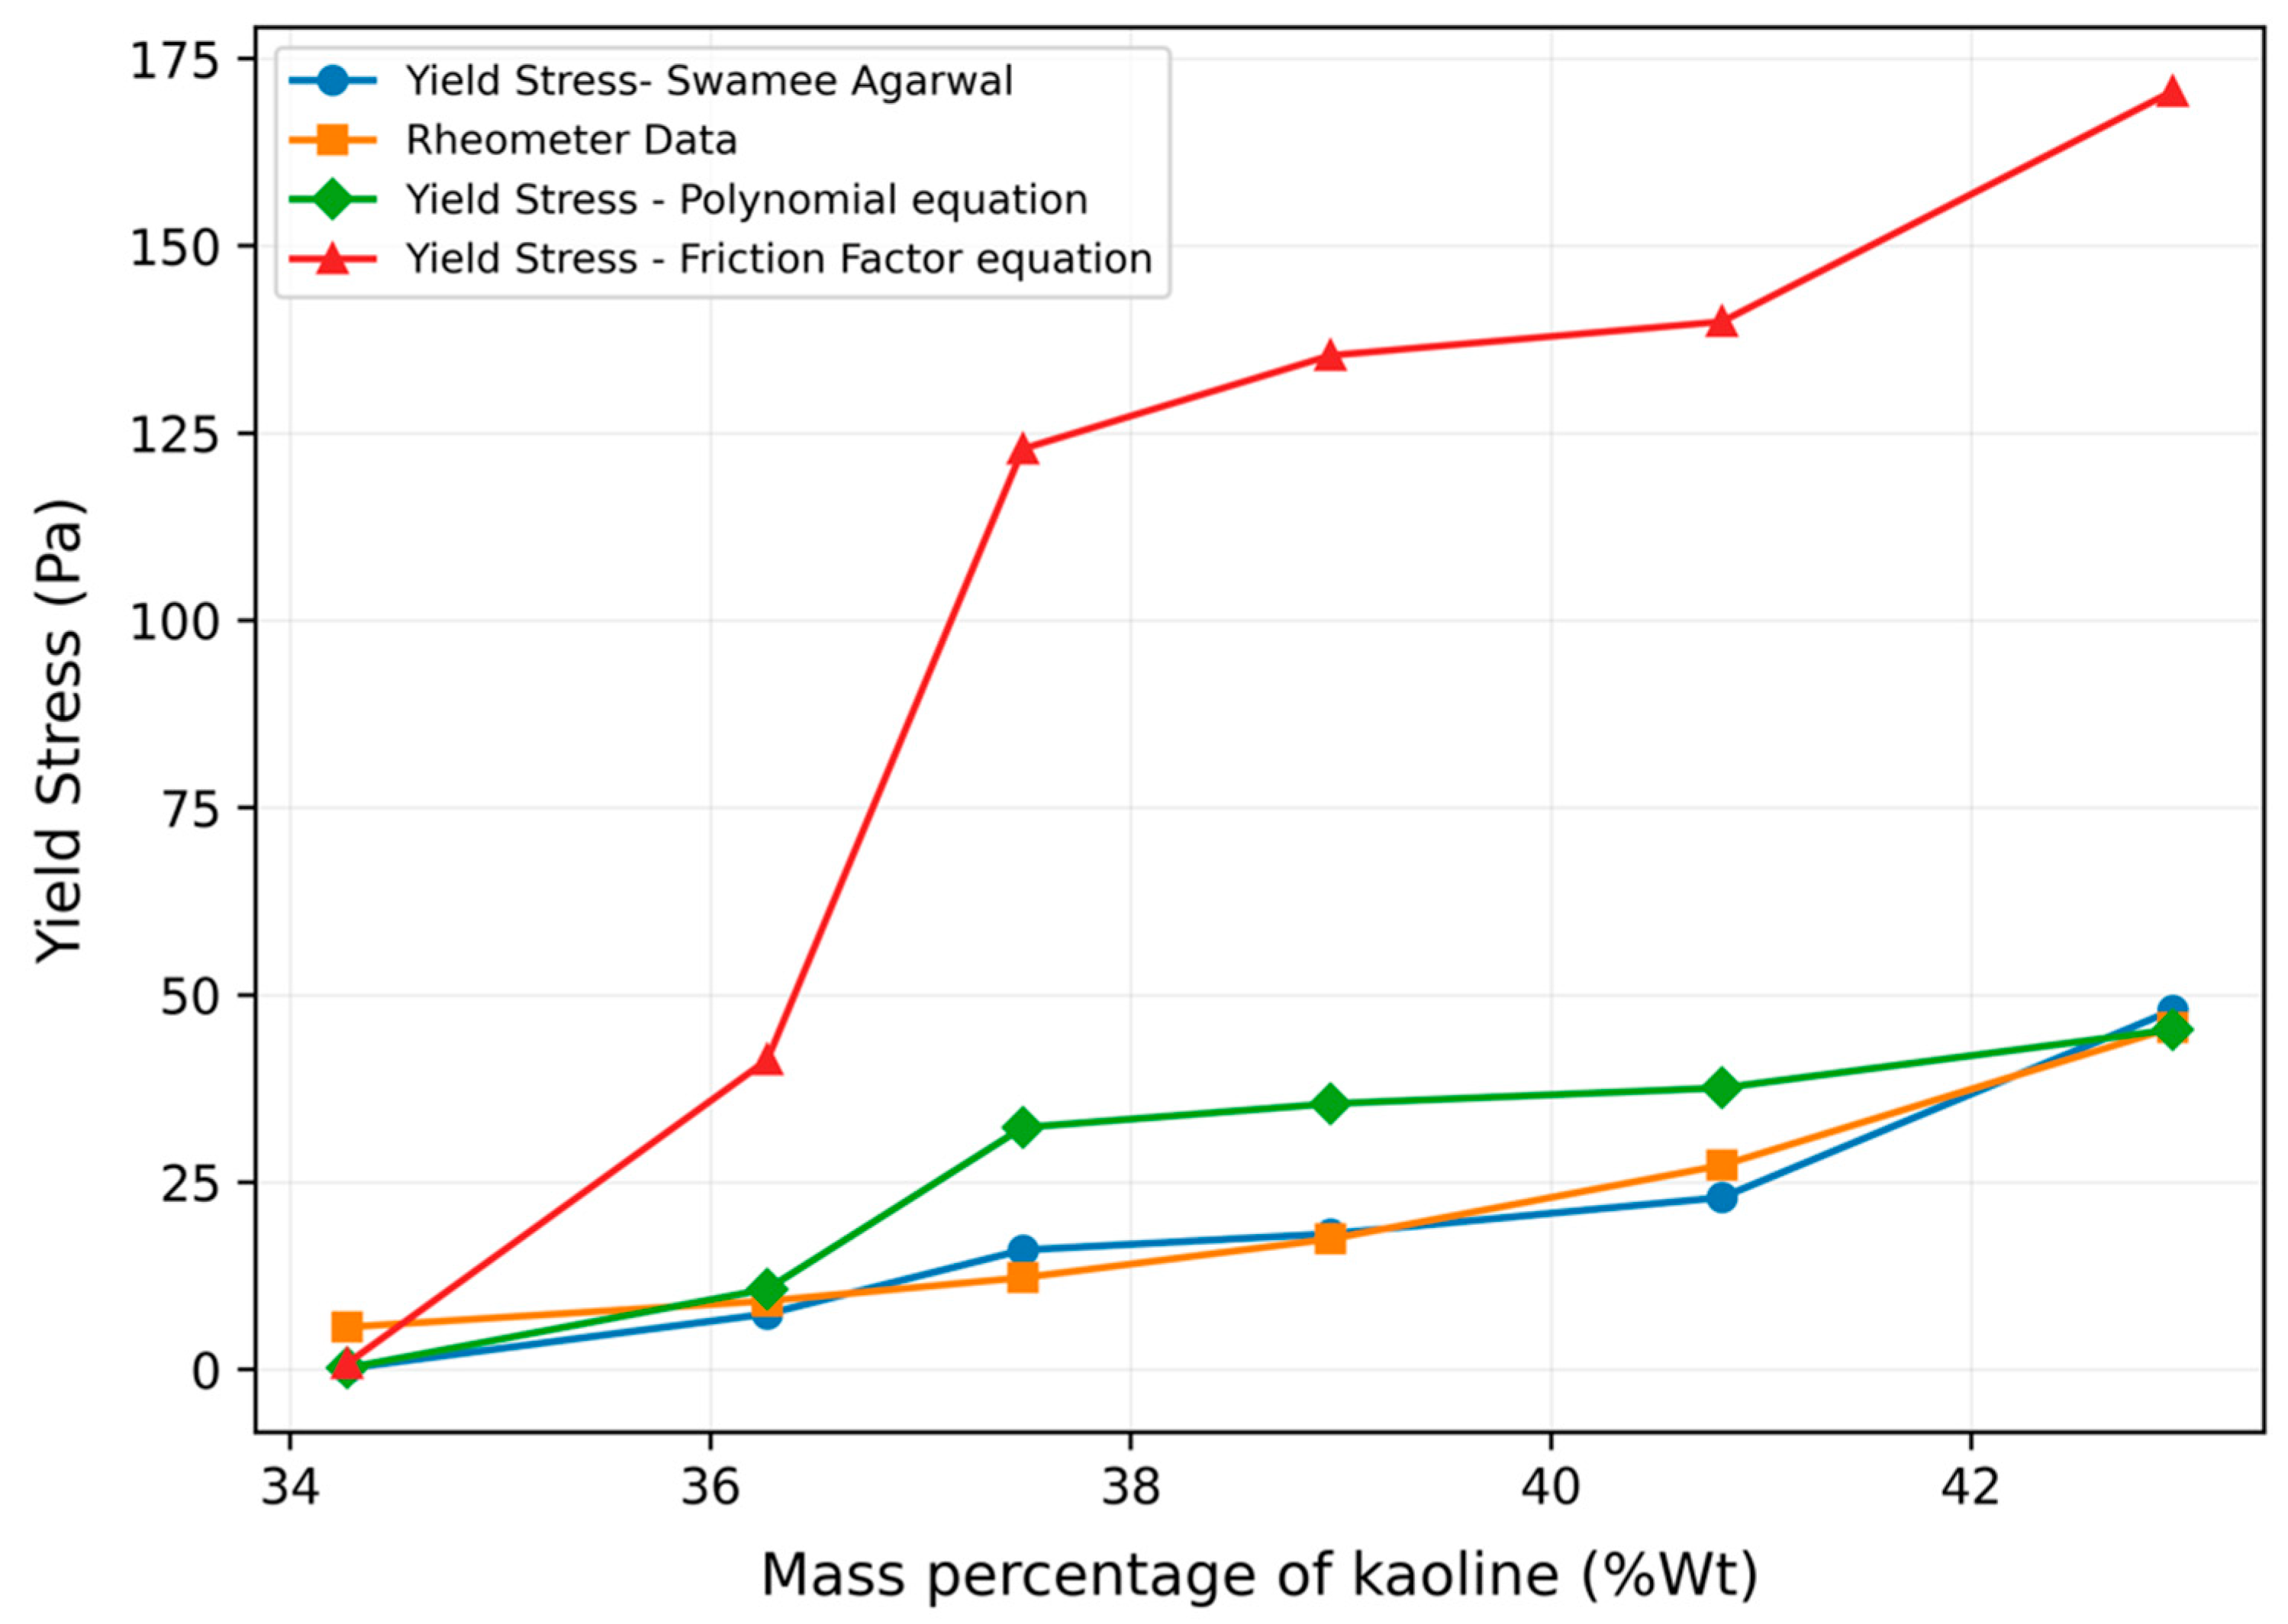
The yield stress was calculated using the Buckingham–Reiner friction factor equation, the Swamee–Agrawal friction factor equation and the polynomial equation. Figure 14 shows the yield stress data calculated using all three equations along with the baseline rheometer data. The results show that the Swamee–Agarwal (SA) equation provides the closest match with rheometer data.
Figure 14.
Comparison of yield stress using different Pressure Loss equations with rheometer data.
In addition, trials were conducted to determine the effect of flow rates on yield stress measurement using the Pressure Loss method. Yield stress was calculated using the SA equation at two different sets of flow rate data. Figure 15 shows that the calculated yield stress followed the same general trend when different pairs of flow rates were used. However, the method is sensitive to the selected flow conditions because is obtained by solving two equations from two pressure-drop measurements. If the two flow rates are too close, or if the pressure-drop difference between the two conditions is small, uncertainty in pressure and flow measurement can be amplified in the calculated yield stress.
Figure 15.
Effect of flow-rate selection on apparent yield stress estimated using the Pressure Loss method.
The primary uncertainty sources for the Pressure Loss method include pressure-drop measurement, flow-rate measurement, density measurement, pipe diameter, pressure-tap spacing, and the choice of constitutive model. Unlike the Liquid Rise method, where yield stress is calculated directly from an explicit force balance, the Pressure Loss method determines indirectly through a system of equations. Therefore, uncertainty in the measured input variables can propagate nonlinearly into the final yield stress and plastic viscosity estimates. This effect is especially important at low pressure-drop values or when the two selected flow rates produce similar Pressure Loss responses.
In addition to measurement uncertainty, the Pressure Loss method is affected by slurry-specific phenomena such as wall slip, particle sedimentation, particle migration, and concentration gradients within the pipe. These effects can change the measured pressure drop and lead to differences between Pressure Loss estimates and rheometer measurements. During the present experiments, the slurry was continuously mixed in the tank and density was monitored using the Coriolis meter to reduce the influence of bulk settling. However, local particle migration or near-wall concentration variation inside the pipe was not directly measured and is therefore acknowledged as a limitation. Furthermore, although the Pressure Loss formulation contains both and µ, the present implementation focuses on estimating apparent yield stress. A full comparison of Pressure-Loss-derived plastic viscosity with rheometer-derived plastic viscosity was not performed and is identified as a limitation of the current study.
Overall, the Pressure Loss method was able to capture the increasing apparent yield stress trend with increasing kaolin concentration, with the Swamee–Agarwal equation providing the closest agreement with the rheometer baseline. Nevertheless, the method should be interpreted as a proof-of-concept approach for estimating apparent Bingham yield stress under controlled laminar-flow conditions.
8. Conclusions
In recent years, there has been growing interest in developing efficient methods for real-time monitoring of yield stress in pipe flow. The ability to measure yield stress accurately and continuously can provide valuable insights into the properties of complex fluids and play a crucial role in process control and optimization in various industries. This study evaluated two in-line approaches, the Liquid Rise method and the Pressure Loss method, for estimating the apparent yield stress of Kaolin–water slurries under controlled flow-loop conditions. The objective was to assess the proof-of-concept feasibility of using pressure, density, flow rate, and liquid-height measurements for real-time monitoring of yield stress behavior during slurry transfer.
The Liquid Rise method provided promising agreement with the baseline rheometer measurements over the tested concentration range. The method was able to capture the increasing apparent yield stress trend with increasing kaolin concentration. However, the yield stress obtained from this method should be interpreted as an apparent static or equilibrium yield stress, because the slurry column rises and then reaches a stationary height. The method also depends on assumptions related to slurry homogeneity, density accuracy, limited sedimentation, and simplified wall-resistance behavior.
The Pressure Loss method also captured the general increase in apparent yield stress with increasing kaolin concentration. Among the equations evaluated, the Swamee–Agarwal formulation showed the closest agreement with the rheometer baseline for the tested conditions. The Pressure Loss results should be interpreted as apparent Bingham yield stresses because the method relies on Bingham-type pipe-flow correlations and requires laminar, reasonably developed flow. Flow-regime assessment using rheometer-derived Bingham parameters, including plastic viscosity and yield stress, was used to support the laminar-flow assumption.
Overall, both methods demonstrated potential for real-time in-line estimation of apparent yield stress in controlled Kaolin–water slurry flow. However, important limitations remain, including uncertainty in baseline rheology repeatability, possible wall slip, particle sedimentation or migration, density gradients, thixotropic rebuilding, and the use of Kaolin–water slurry as a simplified surrogate rather than a fully representative radioactive waste simulant.
Future work should include repeated rheometer measurements, complete uncertainty propagation, verification of fully developed flow over a wider operating range, evaluation of wall slip and particle migration effects, and testing with more representative radioactive waste simulants. Also, future work should extend the Pressure Loss method to complete two-parameter rheological characterization by determining both the apparent yield stress and plastic viscosity from pressure-drop measurements at multiple flow rates. Additional studies in larger-scale loops will also be necessary before these methods can be generalized for field-scale radioactive waste transfer applications.
Author Contributions
Conceptualization, A.S., M.P. and D.M.; Methodology, A.S.; Validation, A.S.; Formal analysis, A.S.; Investigation, A.S.; Data curation, A.S.; Writing—original draft, A.S.; Writing—review & editing, M.P.; Supervision, M.P. and D.M.; Project administration, D.M.; Funding acquisition, M.P. and D.M. All authors have read and agreed to the published version of the manuscript.
Funding
This project has been funded by the Department of Energy (DoE), Minority Serving Institution Partnership Program (MSIPP).
Institutional Review Board Statement
Not applicable.
Informed Consent Statement
Not applicable.
Data Availability Statement
The data supporting the findings of this study are included within the article. Additional experimental data are available from the corresponding author upon reasonable request.
Conflicts of Interest
The authors declare no conflict of interest.
References
- Malvern Instruments worldwide. Understanding Yield Stress Measurements; White Paper WP120416UnderstandYieldStressMeas; Malvern Instruments Limited: Worcestershire, UK, 2015; Available online: https://cdn.technologynetworks.com/TN/Resources/PDF/WP120416UnderstandYieldStressMeas.pdf (accessed on 10 May 2026).
- Caldwell, T.B. Waste Removal Technology Baseline: Technology Development Description; Savanah River Site; Savannah River Remediation LLC: Aiken, SC, USA, 2011. [Google Scholar]
- Farrar, M.E.; Poirier, M.R.; Herman, C.C.; DiPrete, C.C.; Howe, A.M.; Stone, M.E.; Miera, F.R.; Hamel, W.; Wheeler, I.; Mauss, B. Instrumentation for Hanford Direct-Feed Low Activity Waste Real-Time, In-Line Process Monitoring—18339. In Proceedings of the WM2018 Conference, Phoenix, AZ, USA, 18–22 March 2018. [Google Scholar]
- Churchill, S.W.; Usagi, R.A. A general expression for the correlation of rates of transfer and other phenomena. AIChE J. 1972, 18, 1121–1128. [Google Scholar] [CrossRef] [Scilit]
- Barnes, H.A.; Walters, K. The yield stress myth? Rheol. Acta 1985, 24, 323–326. [Google Scholar] [CrossRef] [Scilit]
- Barnes, H.A. The yield stress—A review or “παντα ρει”—Everything flows? J. Non-Newton. Fluid Mech. 1999, 81, 133–178. [Google Scholar] [CrossRef] [Scilit]
- Barnes, H.A. The “yield stress myth?” paper—21 years on. Appl. Rheol. 2007, 17, 43110. [Google Scholar] [CrossRef] [Scilit]
- Coussot, P. Yield stress fluid flows: A review of experimental data. J. Non-Newton. Fluid Mech. 2014, 211, 31–49. [Google Scholar] [CrossRef] [Scilit]
- Møller, P.C.F.; Mewis, J.; Bonn, D. Yield stress and thixotropy: On the difficulty of measuring yield stresses in practice. Soft Matter 2006, 2, 274–283. [Google Scholar] [CrossRef] [Scilit]
- Ewoldt, R.H.; Johnston, M.T.; Caretta, L.M. Experimental Challenges of Shear Rheology: How to Avoid Bad Data. In Complex Fluids in Biological Systems; Spagnolie, S., Ed.; Springer: New York, NY, USA, 2015. [Google Scholar]
- Greenwood, M.S.; Bamberger, J.A. Measurement of viscosity and shear wave velocity of a liquid or slurry for on-line process control. Ultrasonics 2002, 39, 623–630. [Google Scholar] [CrossRef] [Scilit]
- Pfund, D.M.; Greenwood, M.S.; Bamberger, J.A.; Pappa, R.A. Inline ultrasonic rheometry by pulse doppler. Ultrasonics 2006, 44, 477–482. [Google Scholar] [CrossRef] [Scilit] [PubMed]
- Inoue, T.; Tan, T.-S.; Lee, S.-L. An investigation of shear strength of slurry clay. Soils Found. 1990, 30, 1–10. [Google Scholar] [CrossRef] [Scilit]
- Padmanabhan, M.; Bhattacharya, M. In-line measurement of rheological properties of polymer melts. Rheol. Acta 1994, 33, 71–77. [Google Scholar] [CrossRef] [Scilit]
- Hoche, S.; Hussein, M.A.; Becker, T. Ultrasound-based density determination via buffer rod techniques: A review. J. Sens. Sens. Syst. 2008, 2, 103–125. [Google Scholar] [CrossRef] [Scilit]
- Stolojanu, V.; Prakash, A. Characterization of slurry systems by ultrasonic techniques. Chem. Eng. J. 2001, 84, 215–222. [Google Scholar] [CrossRef] [Scilit]
- Denslow, K.M.; Bontha, J.R.; Adkins, H.E.; Jenks, J.W.; Hopkins, D.F.; Thien, M.G.; Kelly, S.E.; Wooley, T.A. System Performance Testing of the Pulse-Echo Ultrasonic Instrument for Critical Velocity Determination. In Proceedings of the Hanford Tank Waste Transfer Operations—13584, WM2013 Conference, Phoenix, AZ, USA, 24–28 February 2013. [Google Scholar]
- Rahman, M. In-Line Rheology of Cement Grout-Feasibility Study of an Ultrsound Based Non-Invive Method; Stiftelsen Bergteknisk Forskening, Rock Engineering Research Foundation: Stockholm, Sweden, 2013. [Google Scholar]
- Hakansson Ulf, A.M.; Rahman, M.; Wiklund, J. In-line measurements of rheological properties of cement-based grouts–Introducing the UVP+PD method. In Proceedings of the Grouting and Deep Mixing, New Orleans, LA, USA, 15–18 February 2012. [Google Scholar]
- Hess, S.; Kroger, M.; Hoover, W.G. Shear modulus of fluids and solids. Phys. A Stat. Mech. Appl. 1997, 239, 449–466. [Google Scholar] [CrossRef] [Scilit]
- Korenchenko, A.E.; Beskachko, V.P. Determining the Shear Modulus of Water in Experiments with A Floating Disk. J. Appl. Mech. Tech. Phys. 2008, 49, 80–83. [Google Scholar] [CrossRef] [Scilit]
- Msall, M.E.; Wright, O.B.; Matsuda, O. Seeking shear waves in liquids with picosecond Ultrasonics. J. Phys. Conf. Ser. 2007, 92, 012026. [Google Scholar]
- Pezeril, T.; Klieber, C.; Andrieu, S.; Nelson, K.A. Ultrafast shear acoustic waves in liquids. Chin. J. Phys. 2011, 49, 23–30. [Google Scholar]
- Samaniuk, J.R.; Shay, T.W.; Root, T.W.; Klingenberg, D.J. A Novel Rheometer Design for Yield Stress Fluids. AIChE J. 2014, 60, 1523–1528. [Google Scholar] [CrossRef] [Scilit]
- Wells, B.E.; Enderlin, C.W.; Gauglitz, P.A.; Peterson, R.A. Assessment of Jet Erosion for Potential Post-Retrieval K-Basin Settled Sludge; PNNL-18831; U.S. Department of Energy: Washington, DC, USA, 2009. [Google Scholar]
- Buckingham, E. On Plastic Flow Through Capillary Tubes. Proc. Am. Soc. Test Mater. 1921, 21, 1154–1156. [Google Scholar]
- Reiner, M. Über die Strömung einer elastischen Flüssigkeit durch eine Kapillare. Kolloid-Z. 1926, 39, 80–87. [Google Scholar] [CrossRef] [Scilit]
- Swamee, P.K.; Aggarwal, N. Explicit equations for laminar flow of Bingham plastic fluids. J. Pet. Sci. Eng. 2011, 76, 178–184. [Google Scholar] [CrossRef] [Scilit]
- Barnes, H.A. A review of the slip wall depletion of polymer solutions, emulsions and particle suspensions in viscometers: Its cause, character, and cure. J. Non-Newton. Fluid Mech. 1995, 56, 221–251. [Google Scholar] [CrossRef] [Scilit]
- Jastrzebski, Z.D. Entrance effects and wall effects in an extrusion rheometer during the flow of concentrated suspensions. Ind. Eng. Chem. Fundam. 1967, 6, 445–454. [Google Scholar] [CrossRef] [Scilit]
- Yoshimura, A.; Prud’homme, R.K. Wall slip corrections for Couette and parallel disk viscometers. J. Rheol. 1988, 32, 53–67. [Google Scholar] [CrossRef] [Scilit]
- Leighton, D.; Acrivos, A. The shear-induced migration of particles in concentrated suspensions. J. Fluid Mech. 1987, 181, 415–439. [Google Scholar] [CrossRef] [Scilit]
- Phillips, R.J.; Armstrong, R.C.; Brown, R.A.; Graham, A.L.; Abbott, J.R. A constitutive equation for concentrated suspensions that accounts for shear-induced particle migration. J. Fluid Mech. 1992, 246, 379–409. [Google Scholar] [CrossRef] [Scilit]
- Nott, P.R.; Brady, J.F. Pressure-driven flow of suspensions: Simulation and theory. J. Fluid Mech. 1994, 275, 157–199. [Google Scholar] [CrossRef] [Scilit]
- Morris, J.F.; Boulay, F. Curvilinear flows of noncolloidal suspensions: The role of normal stresses. J. Rheol. 1999, 43, 1213–1237. [Google Scholar] [CrossRef] [Scilit]
- Gauglitz, P.A.; Tran, D.N.; Buchmiller, W.C. Simulant Development for Hanford Double-Shell Tank Waste; PNNL-21791; Pacific Northwest National Laboratory: Richland, WA, USA, 2012. [Google Scholar]
- Wells, B.E.; Russell, R.L.; Mahoney, L.A.; Brown, G.N.; Rinehart, D.E.; Buchmiller, W.C.; Golovich, E.C.; Crum, J.V. Hanford Sludge Simulant Selection for Soil Mechanics Testing; PNNL-19250; Pacific Northwest National Laboratory: Richland, WA, USA, 2010. [Google Scholar]
- Koopman, D.C. Review of Rheology Models for Hanford Waste Blending; SRNL-STI-2013-00423; Savannah River National Laboratory: Jackson, SC, USA, 2013. [Google Scholar]
- Pease, L.F.; Daniel, R.C.; Burns, C.A. Slurry rheology of Hanford sludge. Chem. Eng. Sci. 2019, 199, 628–634. [Google Scholar] [CrossRef] [Scilit]
- Chun, J.; Oh, T.; Luna, M.; Schweiger, M. Effect of particle size distribution on slurry rheology: Nuclear waste simulant slurries. Colloids Surf. A Physicochem. Eng. Asp. 2011, 384, 304–310. [Google Scholar] [CrossRef] [Scilit]
- Pickup, O.; Turpin, L.; Kachkanov, V.; Mitchell, R.; Barnes, M.; Lockwood, A.; Hunter, T.N.; Harbottle, D. Yield stress modification of suspensions of irregularly shaped particles relevant to nuclear-industry legacy waste. Colloids Surf. A Physicochem. Eng. Asp. 2024, 693, 134062. [Google Scholar] [CrossRef] [Scilit]
- Kealy, T.J.; Bhattacharjee, P.K.; Griffin, P. Assessment of on-line rheology as a control tool for thickened tails. In 20th International Seminar on Paste and Thickened Tailings; University of Science and Technology Beijing: Beijing, China, 2017. [Google Scholar]
- Chilton, R.A.; Stainsby, R. Pressure Loss Equations for Laminar and Turbulent Non-Newtonian Pipe Flow. J. Hydraul. Eng. 1998, 124, 522–529. [Google Scholar] [CrossRef] [Scilit]
- Danish, M.; Kumar, S.; Kumar, S. Approximate explicit analytical expressions of friction factor for flow of Bingham fluids in smooth pipes using Adomian decomposition method. Commun. Nonlinear Sci. Numer. Simul. 1981, 16, 239–251. [Google Scholar] [CrossRef] [Scilit]
- Churchill, S.W. Friction factor equation spans all fluid-flow regimes. Chem. Eng. 1977, 84, 91–92. [Google Scholar]

Disclaimer/Publisher’s Note: The statements, opinions and data contained in all publications are solely those of the individual author(s) and contributor(s) and not of MDPI and/or the editor(s). MDPI and/or the editor(s) disclaim responsibility for any injury to people or property resulting from any ideas, methods, instructions or products referred to in the content. |
© 2026 by the authors. Licensee MDPI, Basel, Switzerland. This article is an open access article distributed under the terms and conditions of the Creative Commons Attribution (CC BY) license.