


Abstract
Extensive intermolecular hydrogen-bond crosslinking in Poria cocos polysaccharide (PCP) contributes to limitations in its water solubility, dispersion stability, and biological activity, restricting its development and application in functional foods. To avoid the limitations associated with chemical modification, a Ginseng protein–Poria cocos polysaccharide complex (PCP-GP) was constructed in this study using a physical complexation strategy. Its structural and physicochemical properties were characterized, its food-processing functional properties were evaluated, and its effects on ethanol-induced GES-1 cell injury were investigated in vitro. Compared with the individual components and the physical mixture (Mixture), PCP-GP showed marked changes in particle size (250.50 nm) and zeta potential (−39.38 mV). FTIR and CD analyses further demonstrated pronounced molecular interactions between PCP and GP, accompanied by substantial reconfiguration of the molecular conformation and protein secondary structure of PCP-GP. XRD showed changes in the diffraction peaks of PCP-GP at 2θ, with the corresponding interplanar spacing decreasing to 0.3802 nm, indicating a more compact arrangement of molecular chains after complexation. SEM showed increased surface wrinkling and denser stacking in PCP-GP, forming a microscopic network structure distinct from those of the individual components. PCP-GP exhibited the highest water-holding capacity (420.50%), oil-holding capacity (376.83%), emulsifying activity (61.50 m2/g), emulsion stability (89.77 min), foaming capacity (170.22%), and foam stability (78.40%). In vitro, PCP-GP treatment showed potential to alleviate ethanol-induced injury in GES-1 cells, as indicated by reduced levels of inflammatory factors including TNF-α, IL-1β, and IL-6; decreased ROS and MDA levels; maintained cell membrane stability; enhanced antioxidant enzyme activities; and modulated mitochondrial membrane potential. These findings suggest that PCP-GP may be a promising bioactive food ingredient and provide a theoretical basis for the application of natural protein–polysaccharide complexes in food processing.
1. Introduction
Proteins and polysaccharides are two of the most important classes of natural biomacromolecules. Both possess advantages such as good biocompatibility, biodegradability, high nutritional value, and low toxicity, and have therefore attracted considerable attention in food processing and functional food development [1]. However, individual proteins are susceptible to denaturation and aggregation during processing in response to environmental factors such as pH, temperature, and ionic strength, leading to deterioration in functional properties including solubility, emulsifying capacity, and foaming ability. Likewise, although polysaccharides possess certain biological activities, poor water solubility and insufficient interfacial activity can limit their efficient application in food systems. Accordingly, constructing protein–polysaccharide complexes has become an important strategy for improving the functional properties of both components. In recent years, protein–polysaccharide complexes driven by non-covalent interactions have become a research focus because of their tunable functionality and application safety [2]. Previous studies have shown that complexation of soy protein isolate with polysaccharides can improve foaming performance [3]. Rice protein/carboxymethyl cellulose complexes prepared by Peng et al. through non-covalent interactions, as well as gliadin/carboxymethyl cellulose complexes prepared by Wan et al., exhibited excellent foaming capacity and foam stability [4,5]. Inspired by these findings, this strategy has increasingly been extended to the modification of functional polysaccharides, in which polysaccharides with unfavorable physicochemical properties are physically modified through non-covalent complexation to optimize their functional and physicochemical characteristics via structural reconfiguration [6].
Poria cocos (Schw.) Wolf is an edible and medicinal fungus with a history of medicinal and dietary use in China spanning more than two millennia [7]. Among its numerous bioactive constituents, Poria cocos polysaccharide is the most abundant component [8] and exhibits multiple biological activities, including antioxidant and anti-inflammatory effects and enhancement of intestinal barrier function [9,10,11]. However, native PCP has notable limitations in physicochemical and functional properties such as water solubility and dispersion stability, which substantially restrict its efficient use in food processing. To address this bottleneck, current studies have mainly employed chemical modification strategies such as sulfation and carboxymethylation to alter the structure of PCP [12]. Although these approaches can improve its properties to some extent, they often involve problems such as organic-solvent residues, harsh reaction conditions, and high production costs, making them difficult to reconcile with the food industry’s demand for sustainable and safe processing technologies. Therefore, developing a mild, safe, and efficient strategy for functional modification of PCP has become an important scientific issue.
Ginseng protein (GP) is an important class of bioactive macromolecules in Panax ginseng C.A. Meyer and exhibits favorable amphiphilic and interfacial properties [13]. GP contains abundant hydrophilic groups, including –OH, –NH2, and –COOH, together with a certain proportion of hydrophobic regions, and its stable spatial conformation provides a structural basis for its use as a carrier. In addition, GP itself exhibits antioxidant activity [14], suggesting that it may not only improve the structural and interfacial properties of polysaccharide systems but also influence the biological activity of the resulting complexes. However, compared with other polysaccharide–protein systems, the intermolecular interactions occurring during PCP-GP complexation and the associated changes in conformation and aggregation state remain insufficiently understood. It also remains unclear how these structural changes affect the functional properties of PCP and whether they can further enhance its biological activity. Therefore, PCP-GP complexes need to be systematically investigated at the levels of molecular interactions, structural characteristics, functional properties, and biological activity.
Based on this background, Ginseng protein and Poria cocos polysaccharide were used to construct a Ginseng protein–Poria cocos polysaccharide complex system (PGP-PCP) through a physical complexation strategy. The particle-size distribution, surface charge, infrared functional-group characteristics, and microstructure of the samples before and after complexation were systematically characterized to clarify structural changes associated with complex formation. Key food-processing functional properties of the complex, including water-holding, oil-holding, emulsifying, and foaming properties, were then comprehensively evaluated. On this basis, an in vitro ethanol-induced injury model of GES-1 gastric epithelial cells was established to assess the potential of PCP-GP against gastric mucosal cell injury. Through these systematic investigations, this study aimed to reveal the structural evolution of the PCP-GP complex during formation and elucidate its impacts on the physicochemical properties and in vitro biological activities, thereby providing a theoretical and scientific basis for the construction of natural protein–polysaccharide complexes and their application in functional foods.
2. Materials and Methods
2.1. Materials and Reagents
HCL was purchased Chengdu Chron Chemical Co., Ltd. (Chengdu, China). NaOH was purchased Guangdong Guanghua Technology Co., Ltd. (Shantou, China). Poria cocos (Schw.) Wolf was purchased from Henan Min’an Pharmaceutical Co., Ltd. (Nanyang, China), and Panax ginseng C.A. Meyer was purchased from Anguo Anxing Traditional Chinese Medicine Decoction Pieces Co., Ltd. (Baoding, China). DMEM, Fetal bovine serum and trypsin were obtained from Gibco Ltd. (New York, NY, USA). CCK-8 and PBS were obtained from Beijing Bioss Co., Ltd. (Beijing, China). GES-1 cells were kindly provided by Cell Bank, Chinese Academy of Sciences. (Shanghai, China). IL-6, IL-1β, TNF-α, MDA, SOD, CAT, GSH-Px kits were purchased in Shanghai Preferred Biotechnology Co., Ltd. (Shanghai, China).
2.2. Sample Preparation
2.2.1. Preparation of PCP
PCP was extracted according to the method described by Shi et al. [15]. Poria cocos was pulverized and passed through a 60-mesh sieve, followed by defatting with 95% ethanol. The defatted powder was mixed with distilled water at a solid-to-liquid ratio of 1:10 (g/mL) and extracted twice in a water bath at 80 °C for 2 h each time. The extracts were combined and centrifuged using the centrifuge (5804 R, Eppendorf, Germany) at 8000 rpm for 10 min. The supernatant was collected and concentrated, and absolute ethanol was added to a final concentration of 80%. The mixture was allowed to stand at 4 °C for 12 h. The precipitate was collected by centrifugation, redissolved and dialyzed for 48 h using a dialysis membrane with a molecular-weight cutoff of 3500 Da. The solution retained inside the dialysis membrane was collected and freeze-dried using a freeze dryer (FDL-2000, EYELA, Tokyo, Japan) to obtain PCP. The extraction yield of PCP was calculated to be 0.57%, and its total polysaccharide content was determined to be 88.12% ± 3.10% using the phenol-sulfuric acid method.
2.2.2. Preparation of GP
Ginseng was pulverized and passed through a 24-mesh sieve. Distilled water was added at a solid-to-liquid ratio of 1:10 (g/mL), the pH was adjusted dropwise to 7.0 ± 0.3 with 1 mol/L NaOH under continuous stirring, with the pH monitored using a calibrated pH meter, and the mixture was extracted twice at room temperature with stirring at 600 rpm for 3 h each time. The extracts were combined and centrifuged at 8000 rpm for 10 min. The supernatant was adjusted to below pH 4.0 with 1 mol/L HCl and then allowed to stand at 4 °C for 2 h, after which the precipitate was collected by centrifugation. The precipitate was redissolved and dialyzed at 4 °C for 48 h using a dialysis membrane with a molecular-weight cutoff of 8000–14,000 Da. The solution retained inside the dialysis membrane was collected and then freeze-dried using a freeze dryer (FDL-2000, EYELA, Tokyo, Japan) to obtain GP. The extraction yield of GP was calculated to be 0.96%, and its total protein content was determined to be 85.04% ± 3.23% using the Bradford method.
2.2.3. Preparation of the PCP-GP
PCP-GP was extracted according to the method described by Liu et al. [16]. PCP was dispersed in deionized water to prepare a 1% (w/v) polysaccharide solution and magnetically stirred at 600 rpm at room temperature for 12 h until fully dissolved. GP was separately dispersed in deionized water to prepare a 1% (w/v) protein solution, magnetically stirred at 600 rpm at room temperature for 2 h, and hydrated overnight at 4 °C. PCP-GP was prepared at a PCP:GP mass ratio of 1:1 and pH 7.0 ± 0.3, with the pH adjusted using 1 mol/L HCl or 1 mol/L NaOH.The mixture was further magnetically stirred at 600 rpm at room temperature for 2 h and centrifuged at 8000 rpm for 10 min (5804 R, Eppendorf, Germany). The supernatant was collected and freeze-dried to obtain PCP-GP (FDL-2000, EYELA, Tokyo, Japan).
2.2.4. Preparation of the Physical Mixture
PCP and GP were mixed directly at a mass ratio of 1:1 to obtain the Poria cocos polysaccharide–Ginseng protein physical mixture (Mixture).
2.3. Particle Size and Zeta Potential
The mean particle size, polydispersity index (PDI), and zeta potential of PCP, GP, PCP-GP, and Mixture were measured using an NS-90Z Plus nanoparticle size and zeta-potential analyzer (Zhuhai OMEC Instruments Co., Ltd., Zhuhai, China).
2.4. Scanning Electron Microscopy (SEM)
SEM was assessed as previously described [17]. Freeze-dried samples were mounted on sample stubs and sputter-coated with gold. Their microstructures were observed using field-emission scanning electron microscopy (SEM) at an accelerating voltage of 5 kV, and images were acquired at different magnifications.
2.5. UV Absorption Spectroscopy
UV was assessed as previously described [18]. Freeze-dried PCP, GP, PCP-GP, and Mixture were dissolved in deionized water to a concentration of 1 mg/mL. UV–visible spectra were recorded from 200 to 400 nm using deionized water as the blank.
2.6. Intrinsic Fluorescence Spectroscopy
Intrinsic fluorescence spectra were recorded using a steady-state fluorescence spectrometer (FLS1000, Edinburgh Instruments, Edinburgh, UK). PCP, GP, PCP-GP, and Mixture were separately prepared at 1 mg/mL and equilibrated at room temperature for 30 min before measurement. The excitation wavelength was 280 nm (Ex = 280 nm), and emission spectra (Em) were scanned from 300 to 600 nm. The slit width and photomultiplier-tube voltage were set to the instrument default values, with a scanning step of 1 nm and an integration time of 0.1 s. Fluorescence emission spectra of all samples were recorded under identical conditions, and changes in fluorescence intensity and maximum emission wavelength (λmax) were compared to analyze interactions between PCP and GP and changes in the protein microenvironment.
2.7. Fourier-Transform Infrared (FTIR) Spectroscopy
FTIR analysis was performed according to the method described by Han et al. [19]. Freeze-dried samples were thoroughly mixed and ground with KBr at a ratio of 1:100 (w/w), pressed into transparent pellets, and scanned using a Fourier-transform infrared spectrometer (Nicolet iS5, Thermo Fisher Scientific, Waltham, MA, USA).
2.8. X-Ray Diffraction (XRD)
Freeze-dried samples were evenly spread on the sample holder and analyzed using an X-ray diffractometer (Rigaku SmartLab SE, Tokyo, Japan) with Cu-Kα radiation (λ = 0.15406 nm) as the X-ray source. The operating voltage and current were 40 kV and 40 mA, respectively. The diffraction angle (2θ) was scanned from 5° to 90° at 2°/min.
2.9. Circular Dichroism (CD) Spectroscopy
Protein secondary structure was analyzed using a JASCO J-1500 circular dichroism spectrometer (JASCO Corporation, Tokyo, Japan). Samples were prepared at appropriate concentrations, and the corresponding solvent was used as the blank. Spectra were recorded in a quartz cuvette over 190–260 nm after subtraction of the blank signal. Each sample was measured three times and the results were averaged. Changes in protein secondary structure were analyzed from the CD data.
2.10. Turbidity Measurement
Turbidity analysis was performed according to the method described by Ge et al. [20]. Turbidity at different pH values was measured using a UV–visible spectrophotometer. The pH of the sample solutions was adjusted from 2.0 to 10.0, and the samples were equilibrated at room temperature for 30 min. Absorbance was then measured at 540 nm and used to characterize system turbidity and the degree of complexation.
2.11. Determination of Intermolecular Forces
The analysis of intermolecular forces was performed according to the method described by Chen et al. [21]. PCP, GP, PCP-GP, and Mixture were separately dispersed in different extraction solutions at a sample concentration of 1 mg/mL. After shaking at room temperature for 1 h, the samples were centrifuged at 10,000 × g for 15 min, and the protein content in the supernatants was measured. Four solutions were used sequentially to disrupt different intermolecular interactions: S1, 0.05 mol/L NaCl (reflecting total soluble protein); S2, 0.6 mol/L NaCl (disrupting electrostatic interactions); S3, 0.6 mol/L NaCl + 1.5 mol/L urea (disrupting hydrogen bonds); and S4, 0.6 mol/L NaCl + 8 mol/L urea (disrupting hydrophobic interactions). Protein content in each solution was determined using the Bradford method. The contributions of the different intermolecular forces were calculated as follows:
where S1, S2, S3, and S4 represent the protein contents measured in the corresponding extraction solutions.
Ionic bonds = S2 − S1
Hydrogen bonds = S3 − S2
Hydrophobic interactions = S4 − S3
Hydrogen bonds = S3 − S2
Hydrophobic interactions = S4 − S3
2.12. Water-Holding Capacity (WHC)
A weighed amount of sample (m) was placed in a centrifuge tube, and the mass of the empty tube was recorded as m1. Distilled water (5.0 mL) was adjusted to specific pH values (2.0, 4.0, 6.0, 8.0, and 10.0) using 1 mol/L HCl or 1 mol/L NaOH and then added to the sample. The mixture was thoroughly mixed and allowed to stand for 30 min. The sample was then centrifuged at 8000 rpm for 10 min, the supernatant was discarded, and the tube was weighed. WHC was calculated as follows:
where m is the sample mass (g), m1 is the mass of the empty centrifuge tube (g), and m2 is the total mass of the centrifuge tube and sample after centrifugation (g).
2.13. Oil-Holding Capacity (OHC)
PCP, GP, PCP-GP, and Mixture (0.5 g each) were separately placed in centrifuge tubes and mixed with 5.0 mL soybean oil. After standing for 30 min at different temperatures, the samples were centrifuged at 8000 rpm for 10 min. The upper oil phase was discarded and the tubes were weighed. OHC was calculated as follows:
where m is the sample mass (g), m1 is the mass of the empty centrifuge tube (g), and m2 is the total mass of the centrifuge tube and sample after centrifugation (g).
2.14. Emulsifying Activity and Emulsion Stability
The emulsifying property was evaluated according to the method described by Chen et al. [22]. PCP, GP, PCP-GP, and Mixture solutions (1 mg/mL) were prepared in deionized water and adjusted to specific pH values (2.0, 4.0, 6.0, 8.0, and 10.0) using 1 mol/L HCl or 1 mol/L NaOH. Soybean oil and sample solution were mixed at an oil-to-water volume ratio of 1:3 and homogenized at 10,000 rpm for 2 min. An 80 μL aliquot of the emulsion was diluted 100-fold with 0.1% SDS solution, and absorbance was measured at 500 nm. Emulsifying activity (EAI) and emulsion stability (ESI) were calculated using the following equations:
where C is the sample concentration (mg/mL), D is the dilution factor (100), Ǿ is the oil-phase volume fraction (0.25), V is the optical path length (0.01 m), and A0 and A10 are the absorbance values measured at 0 and 10 min after homogenization, respectively.
2.15. Foaming Capacity and Foam Stability
PCP, GP, PCP-GP, and Mixture solutions (1 mg/mL) were prepared in deionized water and adjusted to specific pH values (2.0, 4.0, 6.0, 8.0, and 10.0) using 1 mol/L HCl or 1 mol/L NaOH. A 15 mL aliquot of each sample solution was homogenized at 10,000 rpm for 2 min, and the total volume immediately after homogenization (V1) was recorded. After standing at room temperature for 10 min, the volume (V2) was recorded. Foaming capacity (FC) and foam stability (FS) were calculated as follows:
where V0 is the sample volume before homogenization, V1 is the volume immediately after homogenization, and V2 is the volume after standing for 10 min.
2.16. Cell Culture and Experimental Groups
GES-1 cells were cultured in DMEM (GIBCO, New York, NY, USA, cat. no. 10566016) supplemented with 10% fetal bovine serum (FBS), 80 U/mL penicillin, and 0.08 mg/mL streptomycin at 37 °C in a humidified incubator containing 5% CO2.
GES-1 cells were randomly assigned to the control, model, PCP, GP, PCP-GP, and Mixture groups. Except for the control group, cells were exposed to 0.9 M ethanol prepared in culture medium for 24 h to establish the injury model. After ethanol exposure, the ethanol-containing culture medium was completely aspirated and discarded. The cells in the PCP, GP, PCP-GP, and Mixture groups were then treated with the corresponding samples at a final concentration of 200 μg/mL for an additional 24 h. The model group received culture medium without sample treatment and was incubated for the same additional 24 h. Cell viability was evaluated using the CCK-8 assay.
2.17. Determination of Inflammatory and Oxidative-Stress-Related Indices
Logarithmically growing GES-1 cells were selected and seeded in 6-well plates at a density of 1.0 × 10⁵ cells/mL with a volume of 2 mL per well. The cells were then processed based on the cell culture and grouping techniques outlined in Section 2.16. Inflammatory and oxidative-stress-related indices were measured according to the instructions of the corresponding assay kits, including interleukin-6 (IL-6), interleukin-1β (IL-1β), tumor necrosis factor-α (TNF-α), nitric oxide (NO), malondialdehyde (MDA), superoxide dismutase (SOD) activity, catalase (CAT) activity, and glutathione peroxidase (GSH-Px) activity. Furthermore, all assays were strictly performed in triplicate according to the corresponding kit instructions.
2.18. Intracellular ROS Measurement
After treatment as described above, GES-1 cells were stained using a reactive oxygen species (ROS) assay kit (Beyotime Biotechnology Co., Ltd., Shanghai, China) according to the manufacturer’s instructions. Changes in intracellular ROS fluorescence intensity were observed and recorded using a fluorescence microscope.
2.19. Measurement of Mitochondrial Membrane Potential
After treatment as described above, GES-1 cells were stained using a JC-1 mitochondrial membrane potential assay kit (Beyotime Biotechnology Co., Ltd., Shanghai, China) according to the manufacturer’s instructions. Changes in mitochondrial membrane potential were observed using a fluorescence microscope.
2.20. Calcein-AM/PI Dual-Fluorescence Staining
After treatment as described above, GES-1 cells were stained using a Calcein-AM/PI dual-fluorescence staining kit (Beyotime Biotechnology Co., Ltd., Shanghai, China) according to the manufacturer’s instructions. Cell survival and death were observed using a fluorescence microscope.
2.21. Statistical Analysis
All experiments were independently repeated at least three times, and the results are presented as mean ± standard deviation (mean ±SD). Data analysis and graphing were performed using Origin 2024 (OriginLab Corporation, Northampton, MA, USA). Differences among groups were analyzed by one-way analysis of variance (one-way ANOVA) followed by Tukey’s multiple-comparison test using IBM SPSS Statistics 25 (IBM Corp., Armonk, NY, USA). Different asterisks indicate statistical significance (NS, not significant; * p < 0.05; ** p < 0.001).
3. Results and Discussion
3.1. Structural and Physicochemical Properties
3.1.1. Particle Size and Zeta Potential
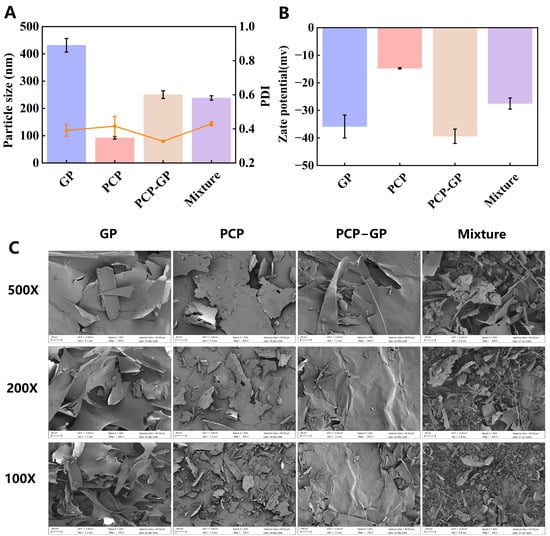
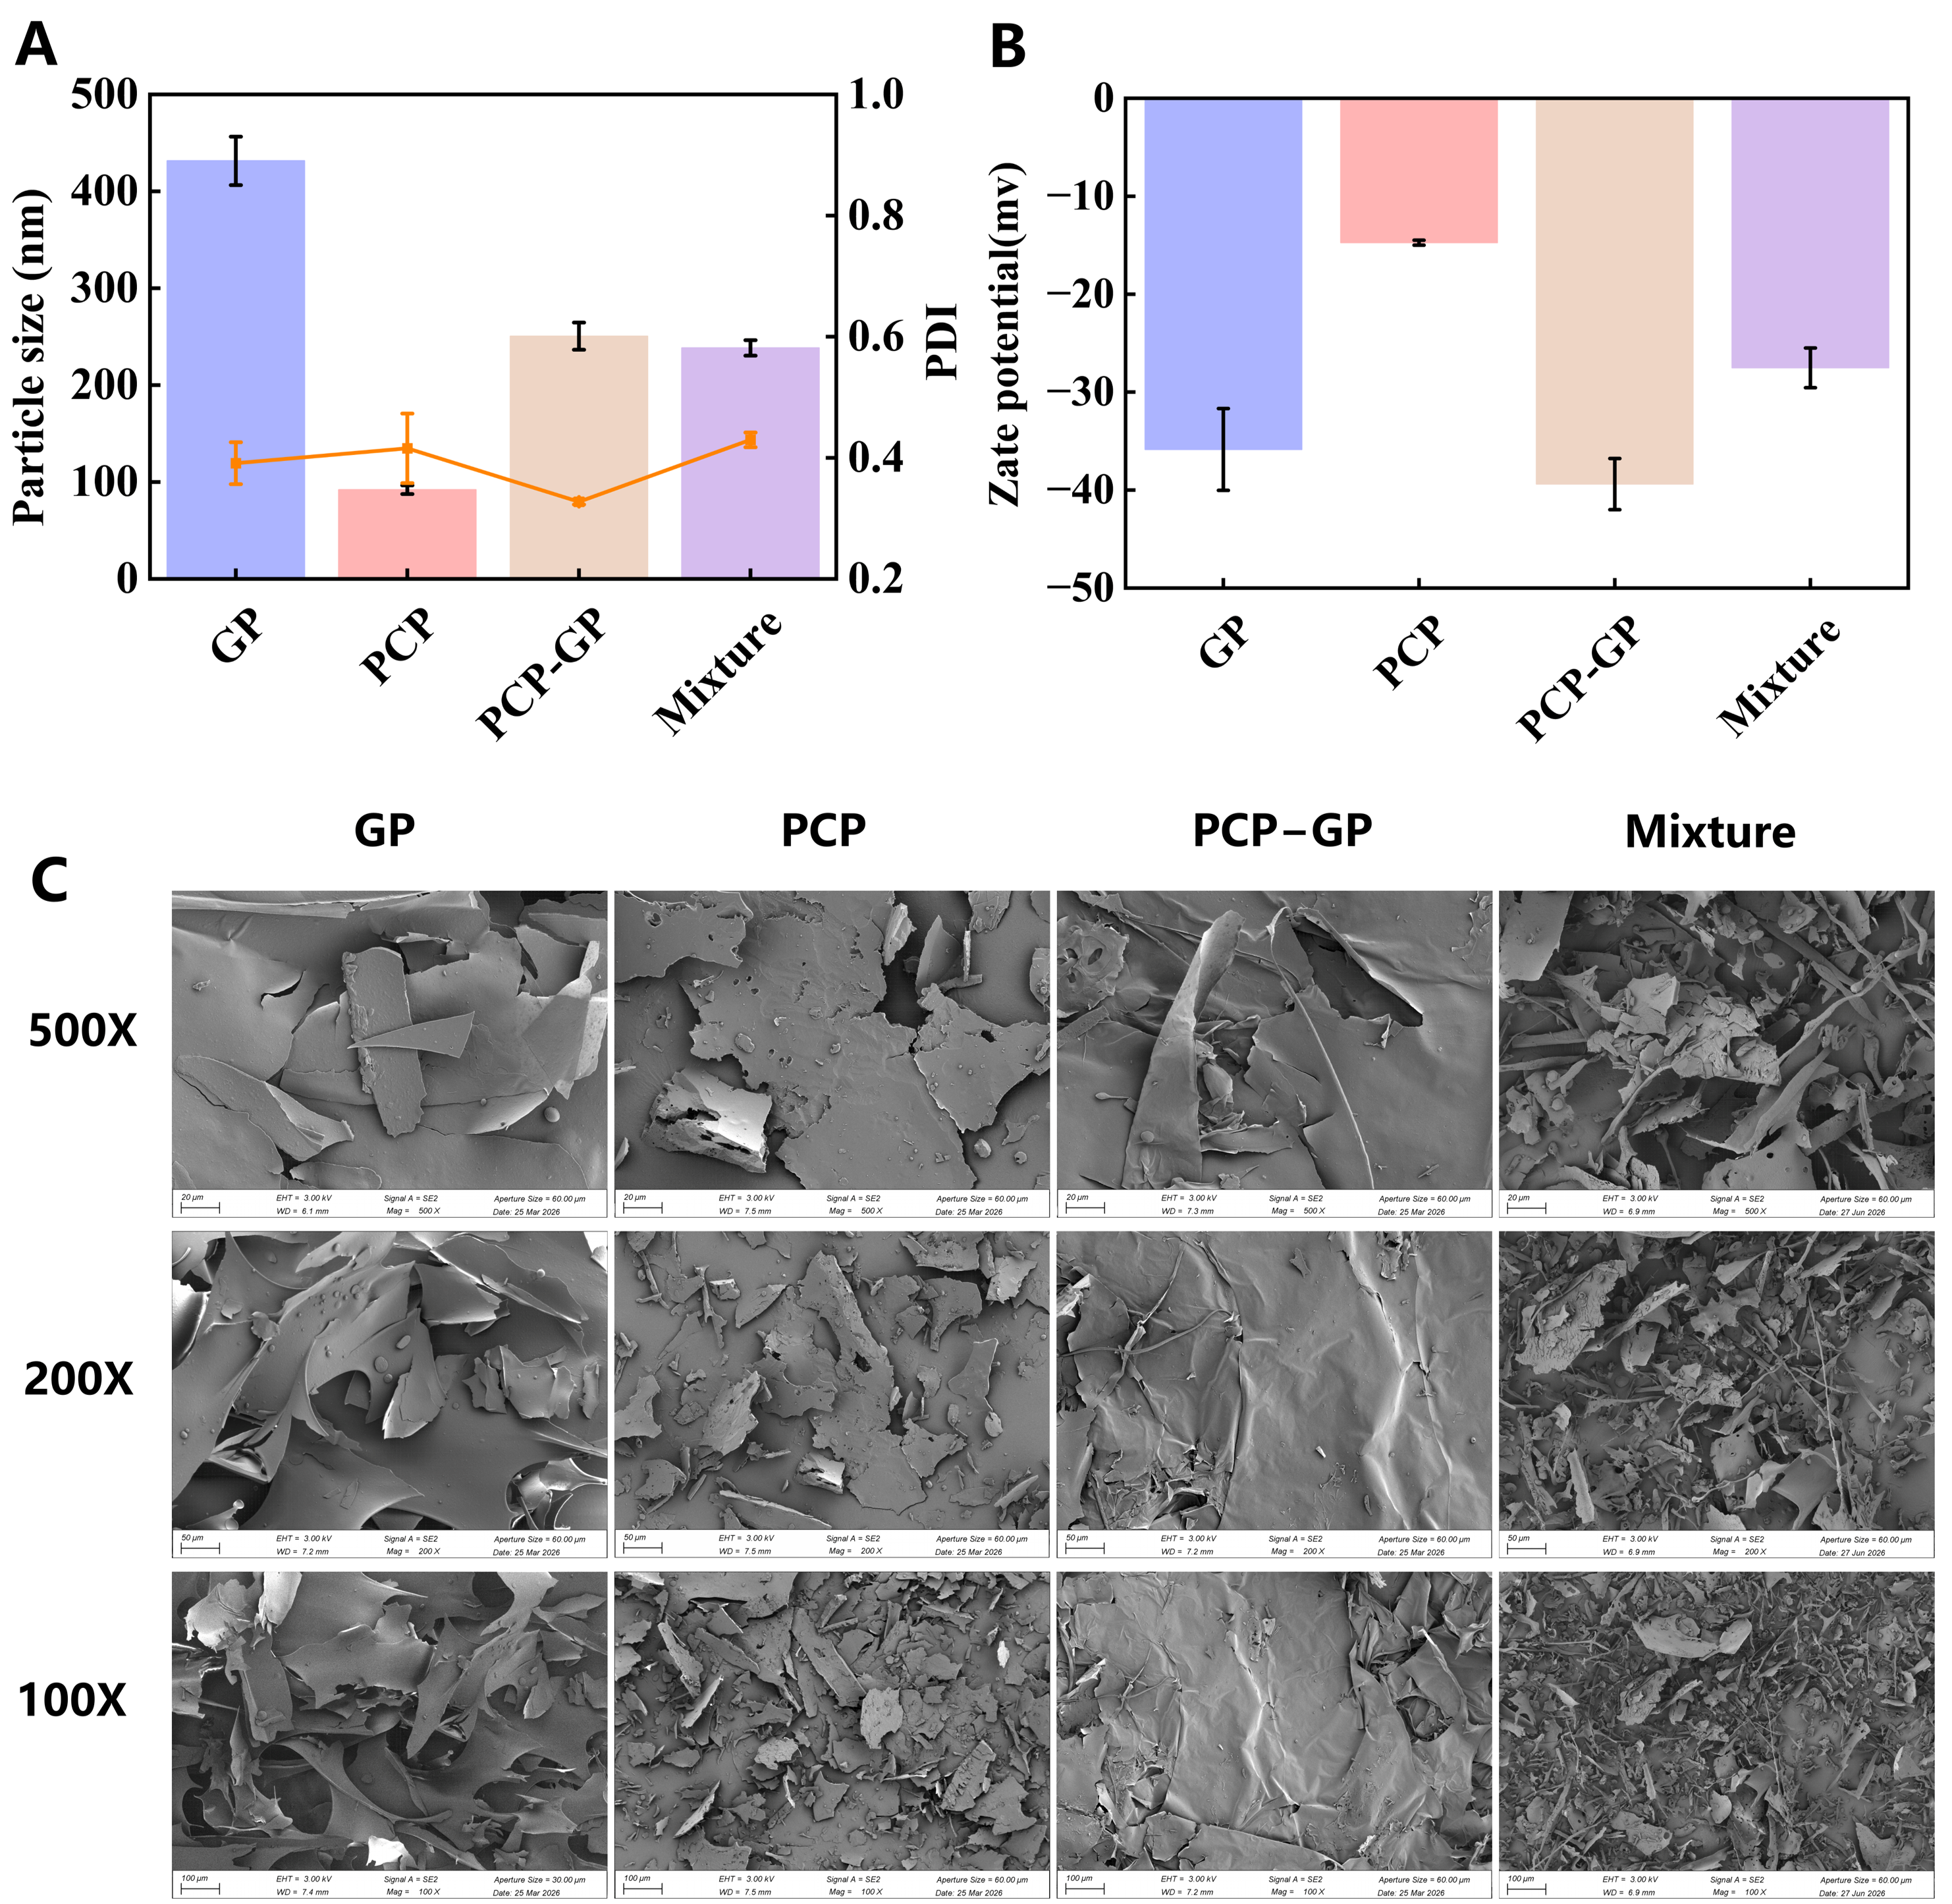
Figure 1A shows the particle sizes of different samples. The GP group had the largest particle size (431.5 nm), which may be related to hydrophobic aggregation between protein molecules forming larger particles; the PCP group had a smaller particle size (92.05 nm), indicating that its molecular chains are in a dispersed state in dilute solution. After complexation, the particle size of the PCP-GP complex was 250.50 nm, a significant reduction compared to the GP group. This suggests that after PCP and GP formed a complex, the polysaccharide chains inhibited protein aggregation through steric hindrance and electrostatic interactions, resulting in a relatively compact complex particle. At the same time, its particle size was larger than that of the PCP alone, consistent with the size characteristics of protein–polysaccharide complexes. The particle size of the physical mixture group (Mixture) was 238.40 nm, which was close to that of the PCP-GP group, suggesting that simple mixing in dilute solution can also yield smaller particles; however, particle size alone is insufficient to distinguish between a composite system and a physical mixture system.
Figure 1.
Comprehensive physical characterisation of the composite’s particle size distribution, surface potential, and microstructure. (A) Particle size; (B) zeta potential; (C) scanning electron microscopy.
The zeta potential reflects the surface charge state of a colloidal system [23]; the zeta potentials of the different samples are shown in Figure 1B. GP exhibits strong negative charge (−35.85 mV), indicating that its surface is rich in negatively charged groups and that electrostatic repulsion between particles is strong; the absolute value of PCP’s zeta potential is lower (−14.73 mV), suggesting a lower surface charge density, weak electrostatic repulsion between particles, and a tendency toward aggregation—which is consistent with its characteristics of poor water solubility and insufficient dispersion stability. After composite formation, the zeta potential of PCP-GP changed to −39.38 mV, with an absolute value higher than that of the individual GP and PCP components. This indicates that during the composite formation process, the conformations of the protein and polysaccharide were redistributed at the interface, exposing more negatively charged groups to the aqueous phase and further enhancing the electrostatic repulsion between particles, which is conducive to the formation of a stable nanodispersion system. In contrast, the zeta potential of the “Mixture” group was only −27.52 mV, falling between those of PCP and GP, indicating a simple superposition of the charges of the two components without the formation of a new surface charge state. Thus, although the PCP-GP and Mixture groups have similar particle sizes, their zeta potentials differ significantly, indicating that PCP and GP are not simply physically mixed but have undergone interfacial reorganization through intermolecular noncovalent interactions.
3.1.2. Scanning Electron Microscopy
Scanning electron microscopy (SEM) enables direct observation of sample surface morphology and microstructure and can reveal the interaction state of PCP-GP at the microscopic level [24]. As shown in Figure 1C, the samples exhibited distinct morphologies. GP had a relatively smooth, lamellar, and compact surface, with only a small number of particles attached, indicating some degree of GP aggregation. PCP displayed an irregular sheet-like structure with a relatively rough surface and pores, suggesting a looser molecular arrangement with a degree of disorder and porosity. Mixture showed a highly disordered and unevenly dispersed morphology, with numerous irregular fragments interwoven with elongated strip-like structures. This disordered appearance is consistent with simple physical mixing, indicating that PCP and GP coexisted mechanically as particles while largely retaining their original aggregation states. In marked contrast, PCP-GP exhibited increased surface wrinkling and stacking and a more compact structure, while the independent structural features of the original protein and polysaccharide were weakened or even disappeared. These observations indicate relatively strong intermolecular interactions between PCP and GP, leading to rearrangement of the molecular chains and formation of a new complex structure.
3.1.3. UV Absorption Spectroscopy
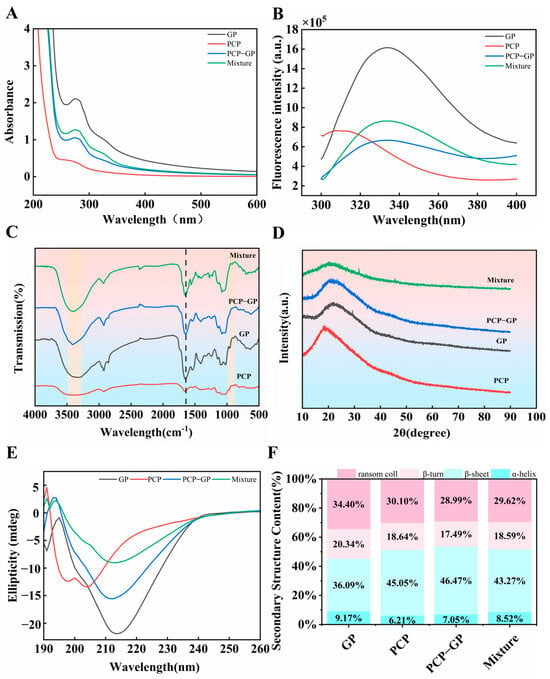
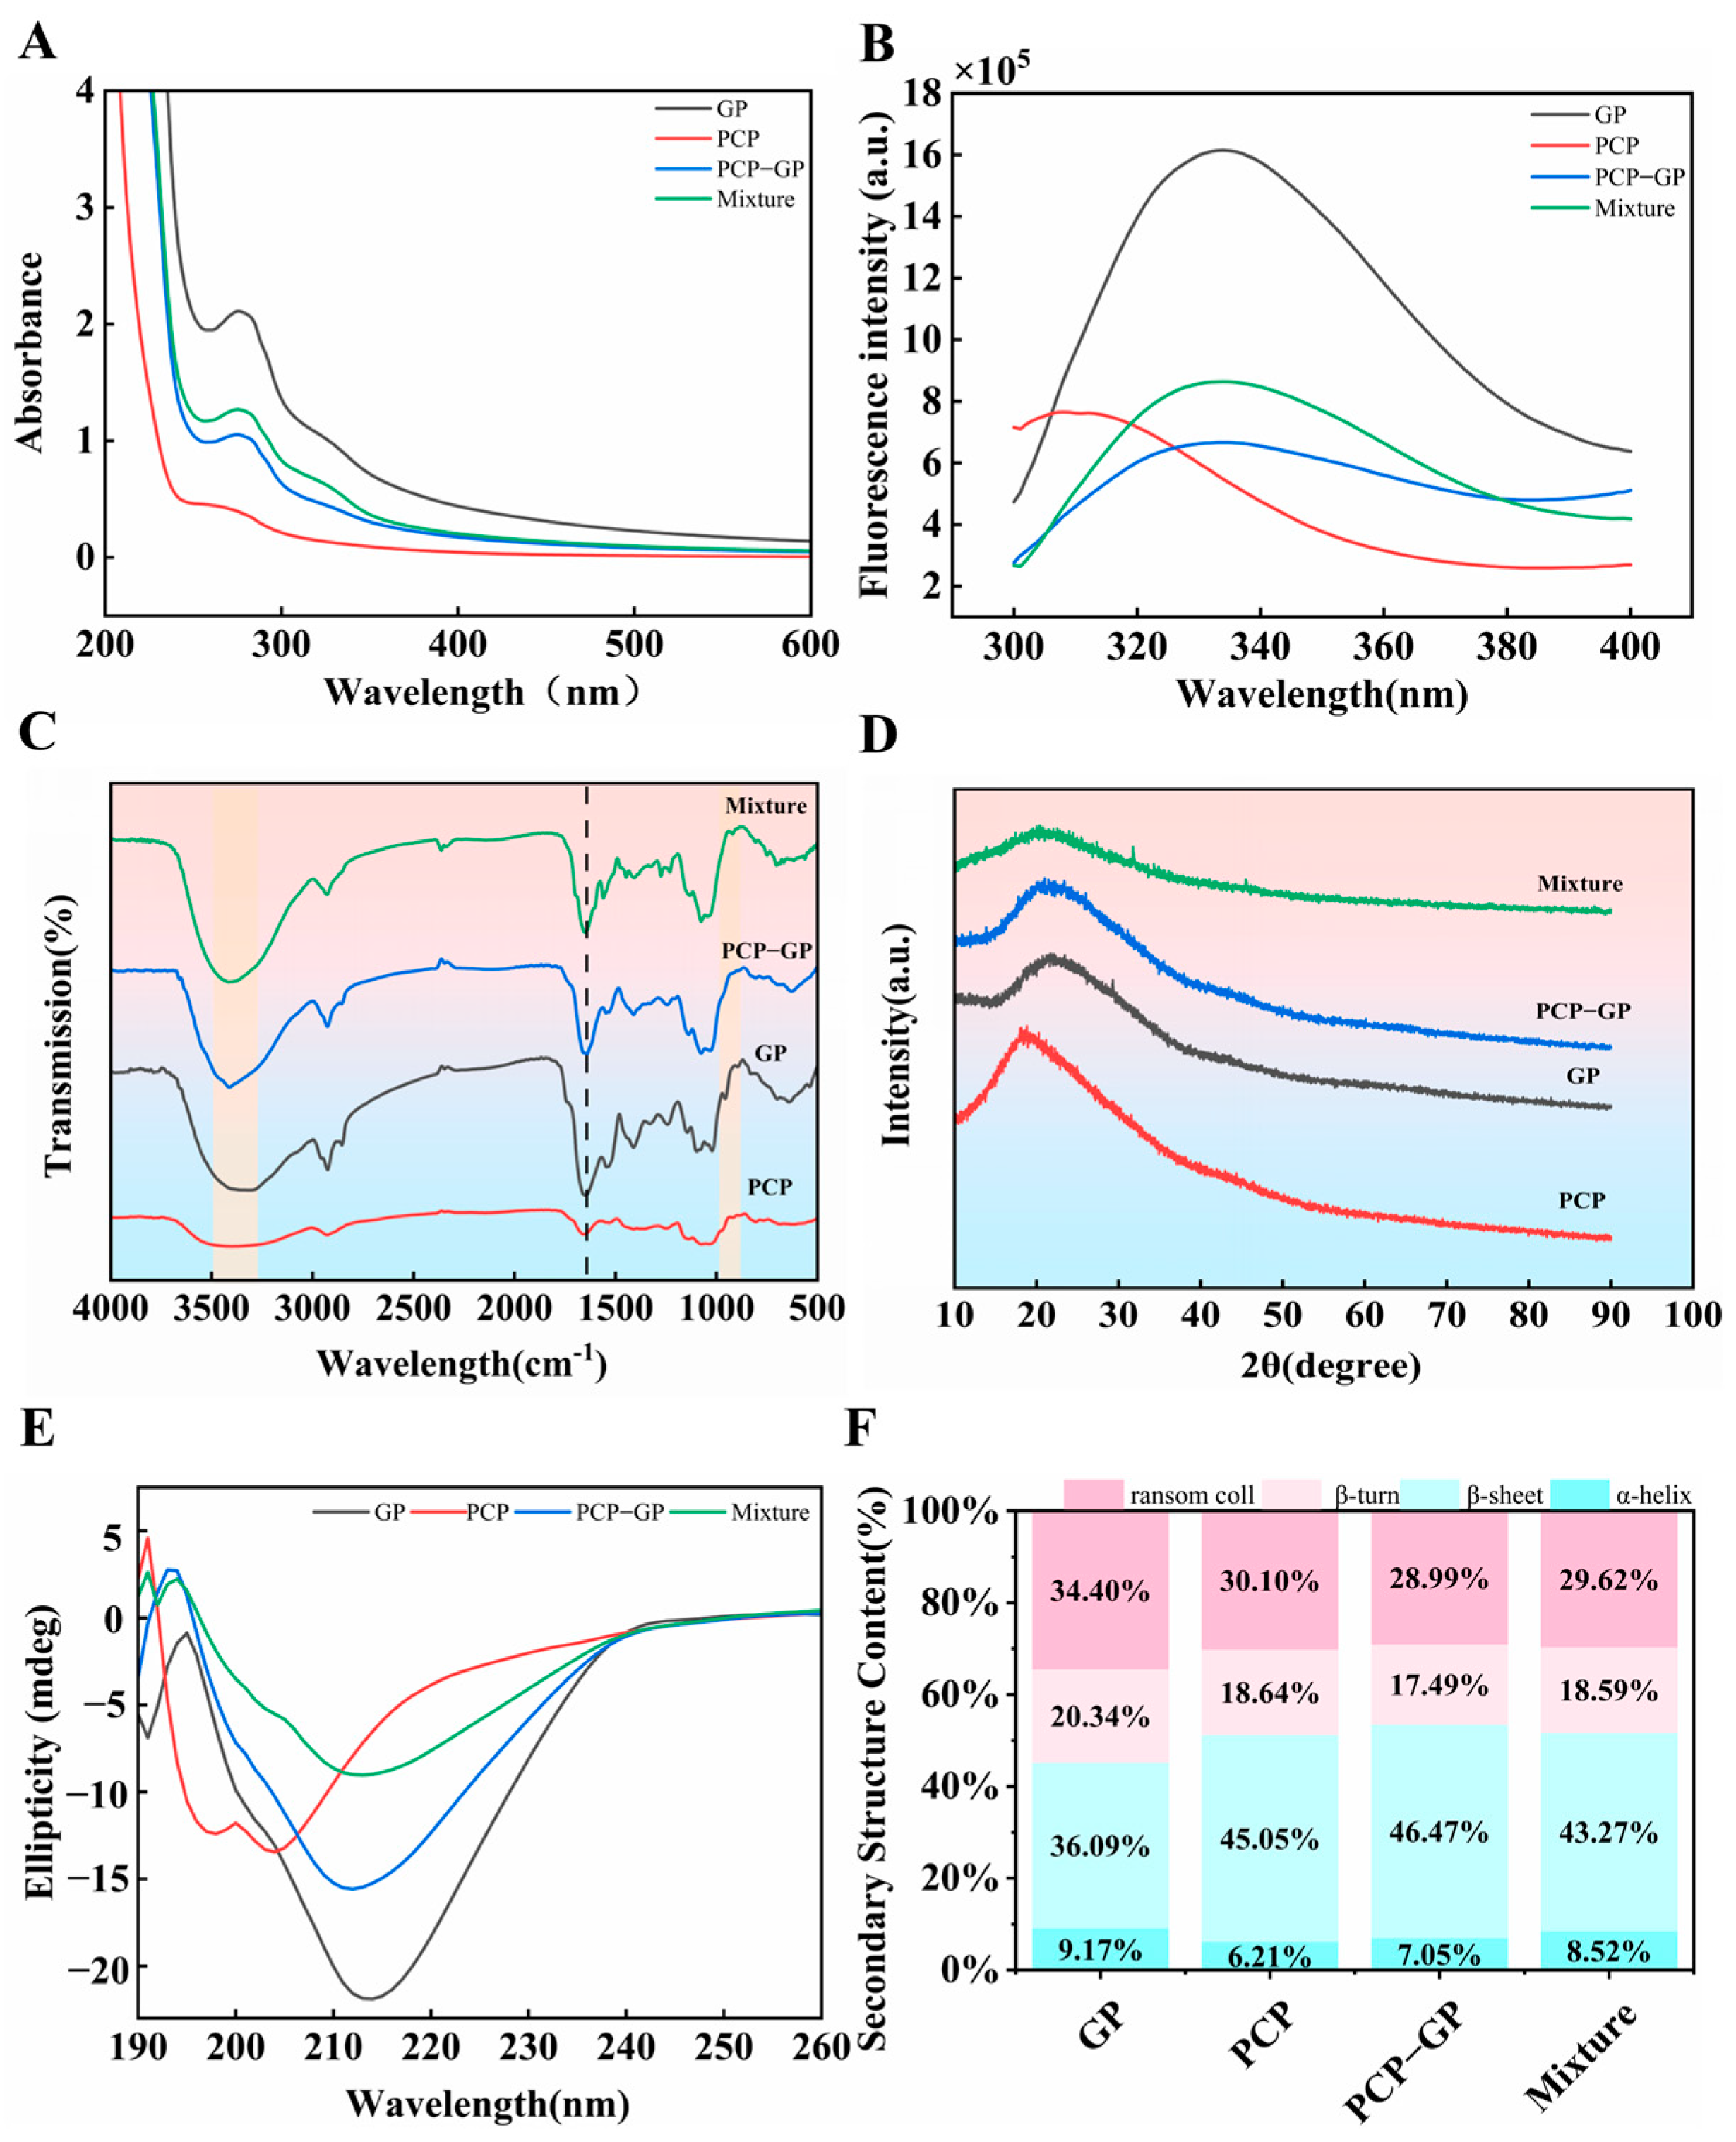
Changes in UV absorption intensity generally reflect alterations in protein conformation and the molecular microenvironment [25]. As shown in Figure 2A, GP exhibited a distinct characteristic absorption peak near 280 nm, whereas PCP showed relatively weak absorption. Compared with GP, PCP-GP displayed a markedly lower absorption intensity over 220–300 nm, and the intensity was also lower than that of Mixture. This observation suggests that intermolecular interactions occurred between GP and PCP, altering the microenvironment surrounding aromatic amino-acid residues in GP and thereby reducing UV absorption. Mixture showed only a slight change in absorption intensity, whereas the further decrease observed for PCP-GP indicates that the two components did not simply undergo physical mixing but formed a new complex system.
Figure 2.
Structural characterisation of the complex. (A) UV absorption spectrum; (B) intrinsic fluorescence spectrum; (C) IR absorption spectrum; (D) XRD; (E) circular dichroism spectrum; (F) secondary structure content.
3.1.4. Fluorescence Spectroscopy
Fluorescence spectroscopy can be used to monitor changes in protein tertiary structure [26]. To further assess the tertiary-structural state of GP after addition of PCP, fluorescence spectra were recorded. As shown in Figure 2B, the fluorescence peak of PCP-GP decreased markedly and was accompanied by a blue shift after addition of PCP. This may be attributable to formation of a more compact gel network through hydrophobic aggregation of GP molecules, as previously reported [27]. In addition, previous findings suggest that the presence of protein can create a more hydrophilic microenvironment around polysaccharide residues, possibly because bound polysaccharide chains shield tryptophan residues. With increasing polysaccharide addition, greater exposure of tyrosine residues may increase hydrogen bonding between the conjugated components. Meanwhile, loss of amide groups from glutamine and asparagine may increase electrostatic repulsion and reduce fluorescence intensity [28]. In the Mixture group, fluorescence intensity was also lower than that of GP but decreased only modestly, suggesting that the amino-acid residues of GP were not substantially affected and that the decrease mainly resulted from the lower proportion of GP in the system. These findings confirm that chemical changes occurred during preparation of PCP-GP. To further explore the binding mode between GP and PCP during complex formation, their intermolecular interactions were subsequently investigated.
3.1.5. Fourier-Transform Infrared Spectroscopy
FTIR spectroscopy can reflect changes in functional groups during complex formation [29]. As shown in Figure 2C, all samples exhibited characteristic absorption bands, and several peak positions shifted to different degrees after complexation, indicating interactions between the protein and polysaccharide. GP exhibited characteristic amide I and amide II bands at 1645 and 1544 cm−1, respectively, whereas PCP showed characteristic glycosidic-bond absorption in the 1035–1135 cm−1 region. Compared with the individual components, the O–H/N–H stretching band of PCP-GP around 3410 cm−1 shifted, indicating hydrogen-bond interactions between GP and PCP and reorganization of the intermolecular hydrogen-bonding network. The GP amide I band shifted from 1645 to 1642 cm−1 and the amide II band from 1544 to 1547 cm−1, indicating involvement of carbonyl and amino groups in complex formation and associated local structural changes in the protein. In addition, peaks in the PCP fingerprint region at 1135, 1074, and 1035 cm−1 shifted to 1137, 1076, and 1031 cm−1, respectively, suggesting participation of hydroxyl groups and glycosidic bonds in intermolecular interactions. Some characteristic bands disappeared or weakened after complexation, possibly because intermolecular interactions restricted molecular vibrations or caused peak overlap, further indicating that the complex was not a simple physical mixture. Overall, GP and PCP appeared to form a relatively stable complex primarily through hydrogen bonding, potentially accompanied by electrostatic and hydrophobic interactions.
3.1.6. X-Ray Diffraction
X-ray diffraction (XRD) can characterize crystalline structural features and molecular ordering in samples [30]. As shown in Figure 2D, the samples exhibited different diffraction characteristics, indicating microstructural changes after complexation. GP showed diffraction peaks at 2θ = 11.82°, 22.80°, and 29.30°, suggesting a certain degree of internal order. PCP exhibited a distinct diffraction peak at 2θ = 18.80°, displaying typical amorphous structural characteristics. Compared with the individual components, PCP-GP showed changes in diffraction peaks at 2θ = 23.38° and 21.50°. In particular, the peak at 23.38° shifted to a higher angle relative to the GP peak at 22.80°, corresponding to a decrease in interplanar spacing from 0.3897 to 0.3802 nm and indicating a more compact arrangement of molecular chains after complexation. This change may result from hydrogen bonding, electrostatic interactions, and hydrophobic interactions between GP and PCP, which strengthen intermolecular interactions and induce structural rearrangement. In addition, changes in both the positions and number of diffraction peaks after complexation indicate that PCP-GP complex formation altered the original molecular arrangement and microstructure. No obvious new crystalline phase was formed; rather, the original structures were reorganized, indicating formation of a relatively stable protein–polysaccharide complex rather than a simple physical mixture.
3.1.7. Circular Dichroism
Circular dichroism (CD) spectroscopy is an effective method for evaluating changes in protein secondary structure. CD analysis of PCP-GP was performed to investigate structural changes induced by interactions between GP and PCP [31]. As shown in Figure 2E, GP exhibited a pronounced negative peak near 215 nm, characteristic of a β-sheet conformation. Because PCP contributes almost no CD signal in the far-UV region, the spectrum of Mixture would theoretically represent the GP signal with essentially no contribution from PCP. The experimental results showed that the intensity of the negative peak decreased markedly after PCP addition, and the decrease was much greater in PCP-GP than in the physical mixture. This difference indicates that the conformational changes in the protein within PCP-GP were not simply caused by dilution of GP by the polysaccharide or by light-scattering interference, but rather by secondary-structure rearrangement resulting from intermolecular interactions between PCP and GP.
As shown in Figure 2F, changes in secondary-structure content further clarified these differences. Compared with GP, the proportions of the different secondary-structure components changed only slightly in Mixture, largely retaining the original conformational profile of the protein, consistent with the nature of simple mixing. PCP-GP, however, showed a distinctly different pattern: β-sheet content increased markedly to 46.37%, β-turn content decreased to a minimum of 17.49%, and α-helix content sharply decreased to 7.05%, substantially below the corresponding value in the physical mixture. These quantitative results further demonstrate that GP was not merely present as an inert component during complexation but actively participated in binding with PCP, disrupting the original hydrogen-bonding network that maintained the α-helical conformation and forming new intermolecular hydrogen bonds with polar groups in the protein backbone or side chains [32].
3.2. Turbidity
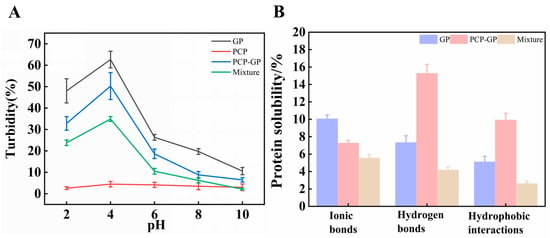
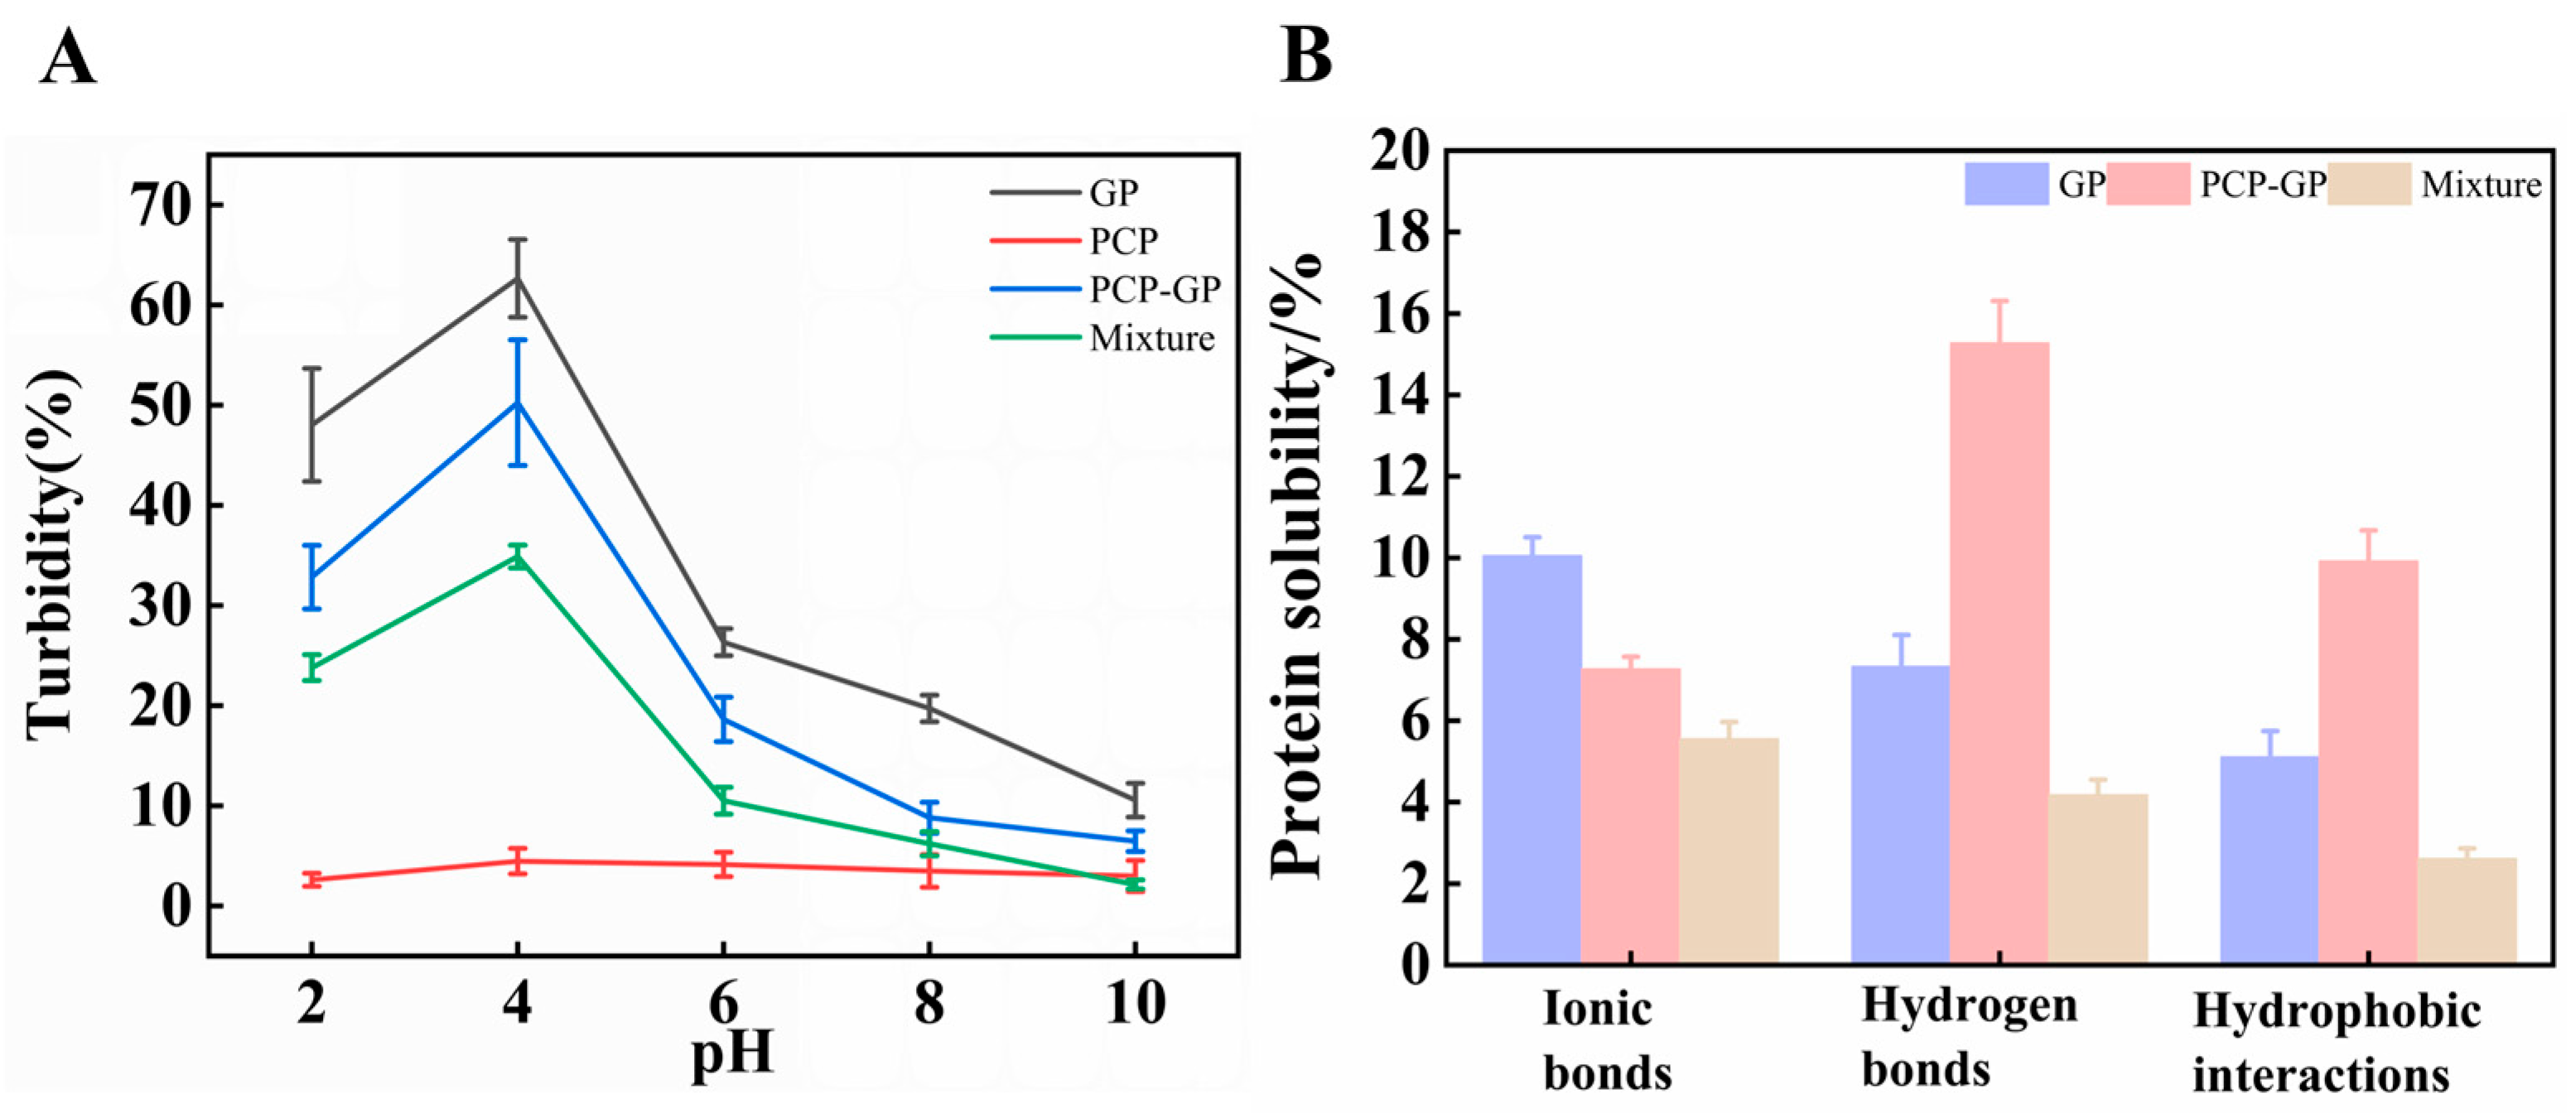
Changes in turbidity can be used to evaluate the phase behavior of biopolymers, including association and separation processes [19]. As shown in Figure 3A, the aggregation state of the samples was strongly affected by pH. GP turbidity initially increased and then decreased with increasing pH, reaching a maximum near the isoelectric point. This may be because the net surface charge of GP approaches zero near the isoelectric point, weakening electrostatic repulsion and facilitating intermolecular aggregation, thereby increasing light scattering. As pH increased further, the negative surface charge of GP increased, strengthening electrostatic repulsion and reducing aggregation, and turbidity consequently declined. PCP-GP showed a similar pH-dependent pattern but lower overall turbidity than GP, indicating that addition of PCP effectively reduced protein aggregation. PCP may adsorb onto the protein surface through electrostatic interactions and steric hindrance, decreasing particle–particle interactions and improving dispersion and stability. By contrast, PCP showed relatively little change in turbidity across the tested pH range, suggesting relatively stable dispersion under different pH conditions. Overall, pH strongly affected aggregation behavior in both the protein and complex systems, whereas complexation of GP with PCP reduced aggregation and improved dispersion and system stability.
Figure 3.
Turbidity and interaction forces of PCP-GP complexes. (A) Turbidity of PCP-GP complexes under different pH conditions; (B) chemical interaction forces of PCP-GP complexes.
3.3. Intermolecular Interactions
Differences in protein solubility in different buffer solutions reflect the relative strengths of intermolecular interactions: NaCl mediates electrostatic interactions, SDS disrupts hydrophobic interactions, and urea interferes with hydrogen-bonding networks [33]. As shown in Figure 3B, the relative contributions of the different intermolecular forces changed to varying degrees after complexation. Compared with GP, PCP-GP showed markedly enhanced hydrogen-bonding and hydrophobic interactions, whereas ionic interactions decreased, indicating a change in the intermolecular interaction pattern during PCP-GP complex formation. The increase in hydrogen bonding was particularly pronounced and may result from formation of new hydrogen bonds between the abundant hydroxyl groups of PCP and polar amino and carboxyl groups in GP, thereby promoting formation of the complex structure. Hydrophobic interactions were also stronger in PCP-GP than in GP, possibly because conformational changes during complexation exposed hydrophobic groups that had previously been buried within the protein and enabled them to participate in intermolecular interactions. By contrast, ionic, hydrogen-bonding, and hydrophobic interactions in Mixture were all lower than those in PCP-GP, and neither hydrogen-bonding nor hydrophobic interactions showed marked enhancement, indicating that simple physical mixing could not generate intermolecular interactions comparable to those in PCP-GP. These results indicate that complexation between PCP and GP generated stronger non-covalent intermolecular interactions, with hydrogen bonding and hydrophobic interactions likely contributing importantly to the structural stability of PCP-GP.
3.4. Functional Properties
3.4.1. Water-Holding Capacity
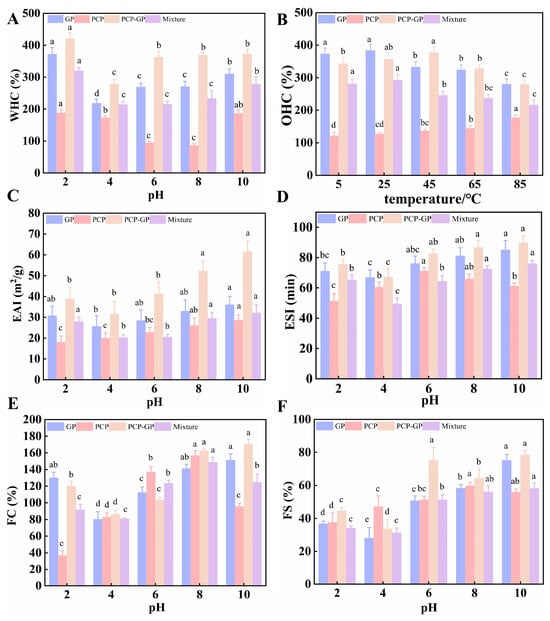
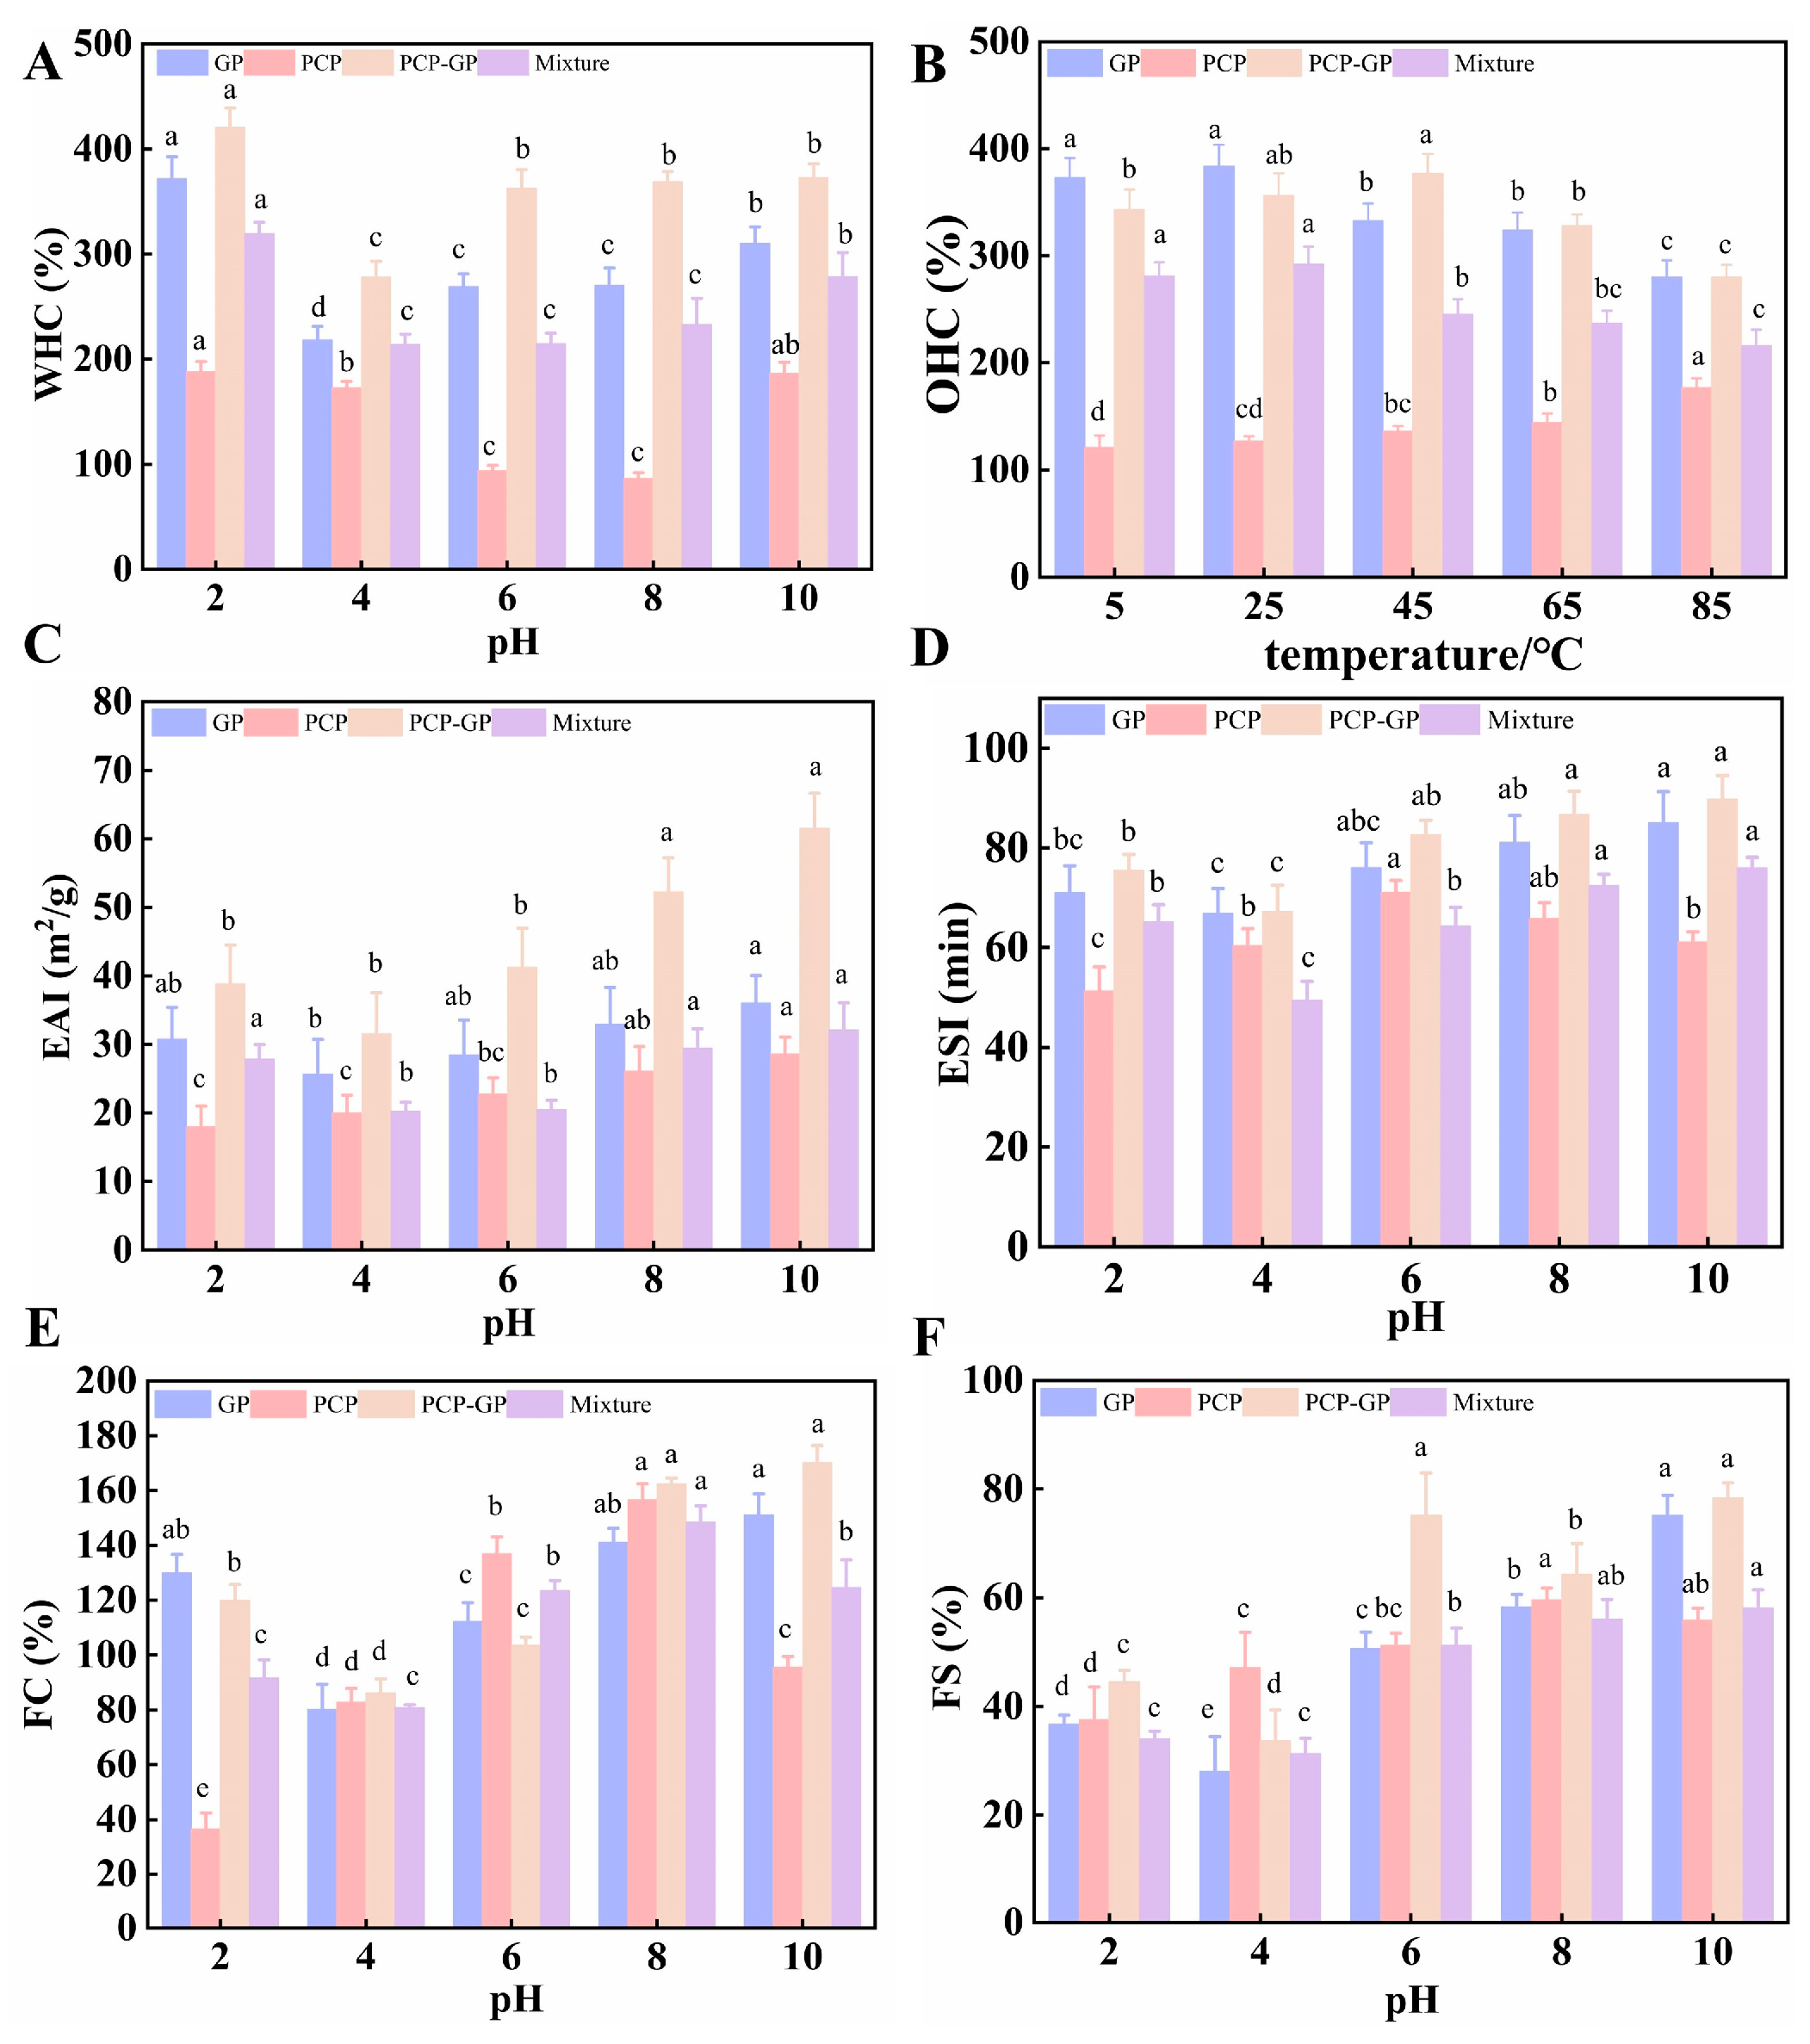
As shown in Figure 4A, the water-holding capacity of all samples first decreased and then increased with changing pH, with the lowest values occurring near the isoelectric point. At this pH, the net surface charge of GP decreases, electrostatic repulsion weakens, and intermolecular aggregation becomes more favorable, resulting in contraction of the GP structure and fewer water-binding sites. As the pH moved away from the isoelectric point, protein molecules gradually unfolded and exposed more hydrophilic groups, leading to recovery of water-holding capacity. Among the individual components, PCP consistently exhibited the lowest water-holding capacity across the tested pH range, whereas GP showed a relatively high capacity. After simple physical mixing, the water-holding capacity of Mixture remained between those of GP and PCP at each pH. In clear contrast, PCP-GP exhibited significantly higher water-holding capacity than Mixture throughout the entire pH range, particularly at pH 6–8, indicating that the performance of the complex was not simply the result of additive contributions from the two components.
Figure 4.
Functional properties. (A) WHC; (B) OHC; (C) emulsifying capacity; (D) emulsion stability; (E) foaming capacity; (F) foam stability. Different lowercase letters (a, b, c, d) within the same sample indicate significant differences among different pH/temperature treatments (p < 0.05).
3.4.2. Oil-Holding Capacity
The oil-holding capacities of all samples showed clear temperature dependence (Figure 4B). PCP exhibited significantly lower oil-holding capacity than GP and PCP-GP at all tested temperatures. Although GP showed relatively high oil-holding capacity overall, its value gradually decreased as temperature increased, indicating that high temperature induced conformational changes in the protein, redistributed some hydrophobic groups, and weakened oil binding. The oil-holding capacity of Mixture remained between those of the protein and polysaccharide and did not show enhanced performance at any temperature. By contrast, PCP-GP maintained relatively high oil-holding capacity at all tested temperatures and reached a maximum of 376.83% at 45 °C, significantly higher than the other sample groups, indicating that polysaccharide–protein complexation markedly improved the oil-retention capacity of the system.
3.4.3. Emulsifying Activity and Emulsion Stability
The emulsifying activity and emulsion stability of the samples at different pH values are shown in Figure 4C,D, and pH clearly affected the emulsifying properties of the system. GP exhibited a certain emulsifying capacity, whereas PCP showed relatively low emulsifying activity. After complexation, the emulsifying activity of PCP-GP increased significantly and rose with increasing pH, indicating that complexation of GP with PCP improved emulsification performance. At pH 10, PCP-GP showed significantly higher emulsifying activity than the other three groups, reaching 61.50 m2/g. This may be because complexation altered the protein conformation, exposing more hydrophobic groups and facilitating their migration to the oil–water interface, while introduction of PCP may have increased steric hindrance and enhanced oil-droplet coverage. PCP showed relatively low emulsion stability overall, whereas both GP and PCP-GP exhibited good emulsion stability. Under most pH conditions, PCP-GP showed greater emulsion stability than GP alone, indicating formation of a more stable interfacial structure after protein–polysaccharide complexation. At pH 10, the emulsion stability of the complex was significantly higher than that of the other three groups, reaching 89.77 min.
To further compare the advantages of PCP-GP, its emulsifying properties were compared with those of Mixture. The emulsifying activity of Mixture remained between those of the protein and polysaccharide at all pH values and showed only a linear additive trend. In contrast, PCP-GP was significantly superior to Mixture, indicating that complexation was not a simple additive process but achieved a genuine improvement in emulsifying performance through strong intermolecular interactions. These findings suggest that PCP-GP produced synergistic enhancement of both emulsifying activity and emulsion stability through protein conformational rearrangement, exposure of hydrophobic groups, and reinforcement of the interfacial network structure, overcoming the additive limitations of Mixture and providing a structural basis for application in emulsion systems and functional foods.
3.4.4. Foaming Capacity and Foam Stability
The foaming capacity and foam stability of the four samples at different pH values are shown in Figure 4E,F, and pH clearly influenced the foaming behavior of the system. GP generally showed increased foaming capacity with increasing pH, whereas PCP exhibited relatively weak foaming ability. PCP-GP showed relatively high foaming capacity under most pH conditions, indicating that complexation of GP with PCP improved foaming performance. This may result from structural changes in the protein after complexation that exposed some hydrophobic groups, enhanced molecular migration to the air–liquid interface, and thereby promoted foam formation. By contrast, the foaming capacity of Mixture remained between those of the protein and polysaccharide at all pH values, whereas PCP-GP showed significantly greater foaming capacity than Mixture under most pH conditions. This indicates that protein–polysaccharide complexation did not merely produce additive functional effects but achieved a genuine improvement in foaming performance through intermolecular interactions. Previous structural characterization further provided a structural basis for the enhanced foaming properties of PCP-GP: FTIR indicated formation of hydrogen-bond and electrostatic cross-links between the protein and polysaccharide, whereas XRD suggested an interfacial arrangement with reduced order but increased spatial extensibility, which may help reduce interfacial tension and facilitate foam formation. Foam stability of PCP-GP was also generally higher than that of GP, PCP, and Mixture. This phenomenon may be attributable to formation of a denser interfacial film after protein–polysaccharide complexation, thereby improving foam stability. In addition, the favorable foaming capacity and foam stability of the complex constitute an important physicochemical basis for its gastric mucosal protective effect [34]. Therefore, an ethanol-induced gastric epithelial cell injury model was further established to evaluate the potential of PCP-GP to alleviate gastric injury.
3.5. Protective Effects Against Ethanol-Induced GES-1 Cell Injury In Vitro
3.5.1. Effects on GES-1 Cell Viability
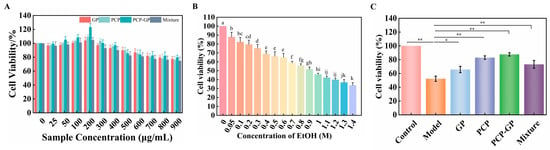
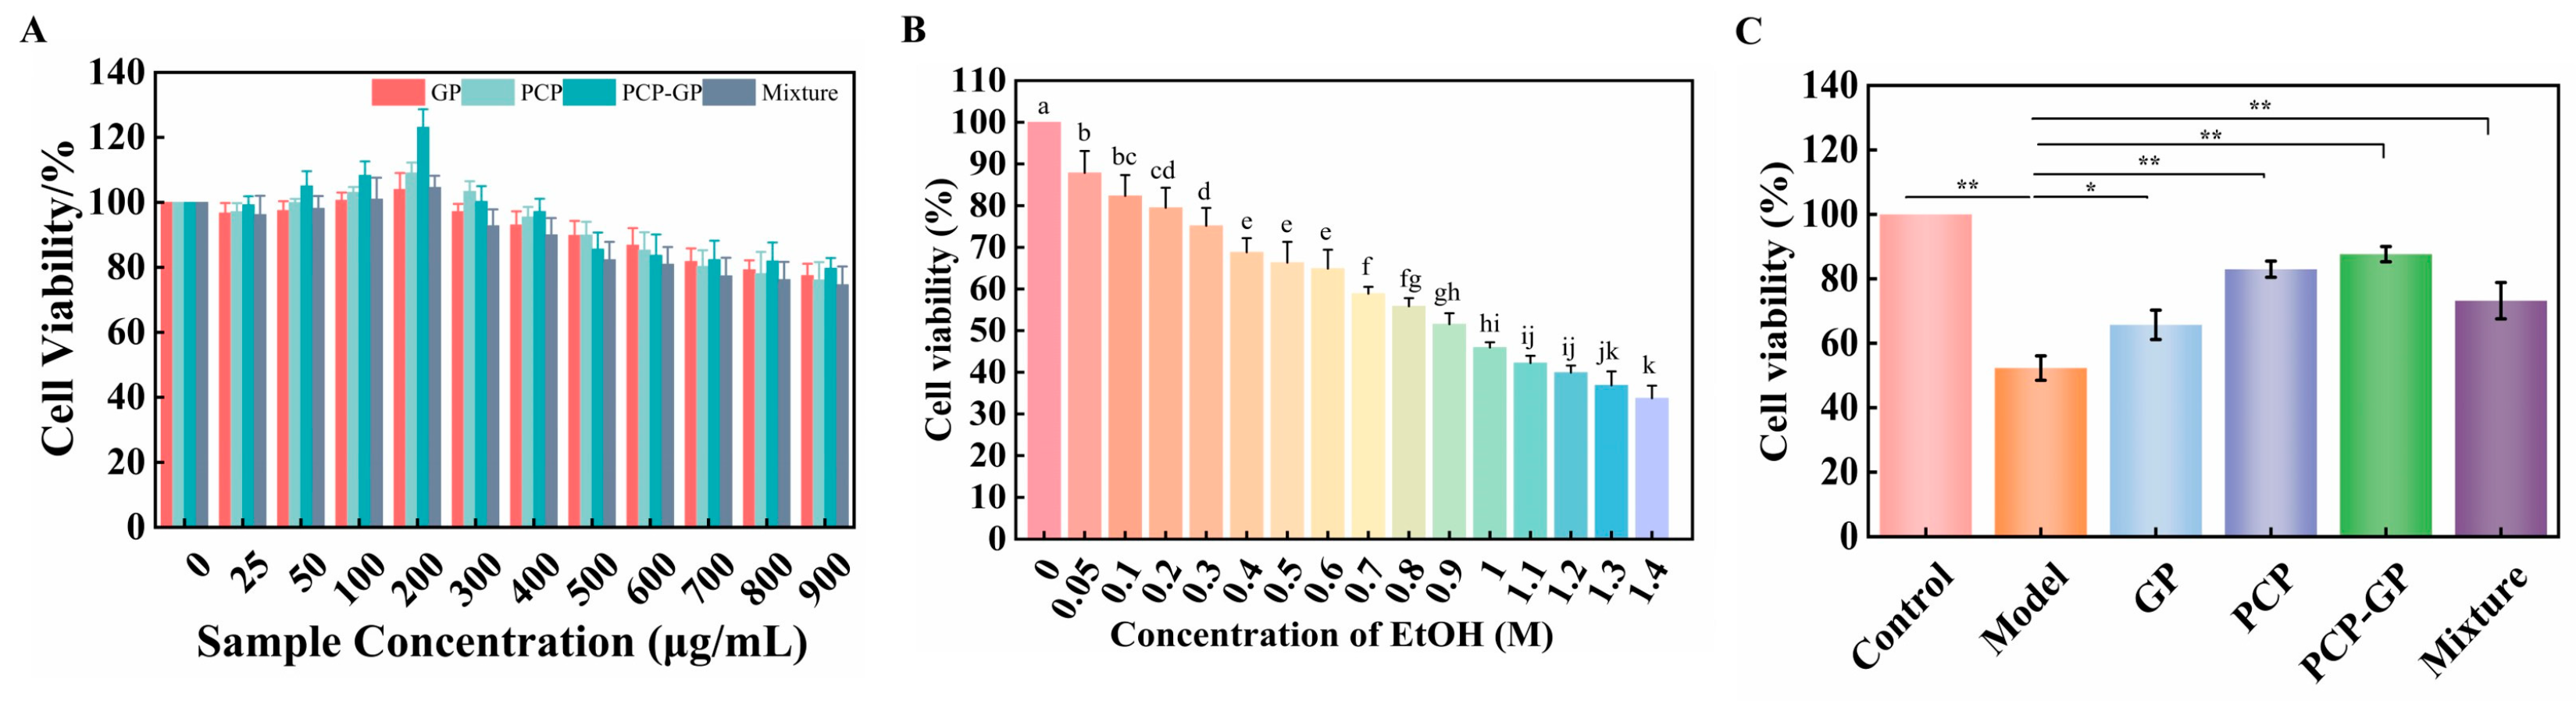
To determine the treatment concentration for each sample, the effects of PCP, GP, Mixture, and PCP-GP at 25, 50, 100, 200, 300, 400, 500, 600, 700, 800, and 900 μg/mL on GES-1 cell viability were systematically evaluated using the CCK-8 assay. As shown in Figure 5A, none of the tested concentration gradients caused a significant decrease in cell viability, indicating that the samples showed no obvious cytotoxicity toward GES-1 cells within the tested concentration range. Cell viability was highest at a treatment concentration of 200 μg/mL in each sample group; therefore, 200 μg/mL was selected as the treatment concentration for all subsequent experiments.
Figure 5.
Establishment of an ethanol-induced GES-1 cell damage model. (A) Sample concentration; (B) ethanol concentration used to induce the model; Different lowercase letters (a–k) indicate significant differences among different EtOH concentrations (p < 0.05). (C) cell repair effect.(* p < 0.05; ** p < 0.001).
To establish a stable model of alcohol-induced gastric mucosal cell injury, GES-1 cells were exposed to different ethanol concentrations to determine the optimal modeling concentration. As shown in Figure 5B, GES-1 cell viability decreased in a concentration-dependent manner as ethanol concentration increased. At 0.9 M ethanol, cell viability decreased to approximately 50% of the normal level, meeting the criterion used for establishment of the in vitro cell-injury model. Therefore, 0.9 M ethanol was used in subsequent experiments to establish the GES-1 alcohol-injury model.
Based on the above screening conditions, an in vitro ethanol-induced injury model of GES-1 gastric epithelial cells was further established to evaluate the protective potential of PCP-GP against alcohol-induced gastric mucosal injury. As shown in Figure 5C, 0.9 M ethanol significantly reduced GES-1 cell viability compared with the control group, confirming successful establishment of the cell-injury model. Following treatment with the different samples, the viability of ethanol-injured GES-1 cells recovered to varying degrees. PCP-GP produced the most pronounced recovery of cell viability and was superior not only to the individual PCP group and individual GP group but also to Mixture, the simple physical mixture of GP and PCP. These results indicate that physical complexation of PCP and GP effectively enhanced the protective potential of the individual components, alleviated ethanol-induced gastric epithelial cell injury, and improved the viability of damaged cells. Thus, physical complexation improved the biological activity of the samples more effectively than simple physical mixing.
3.5.2. Effects on Inflammatory Factors in GES-1 Cells
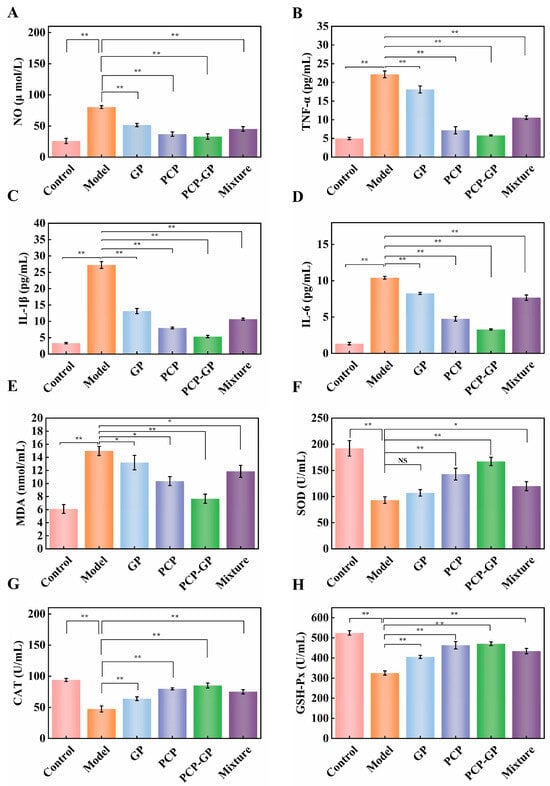
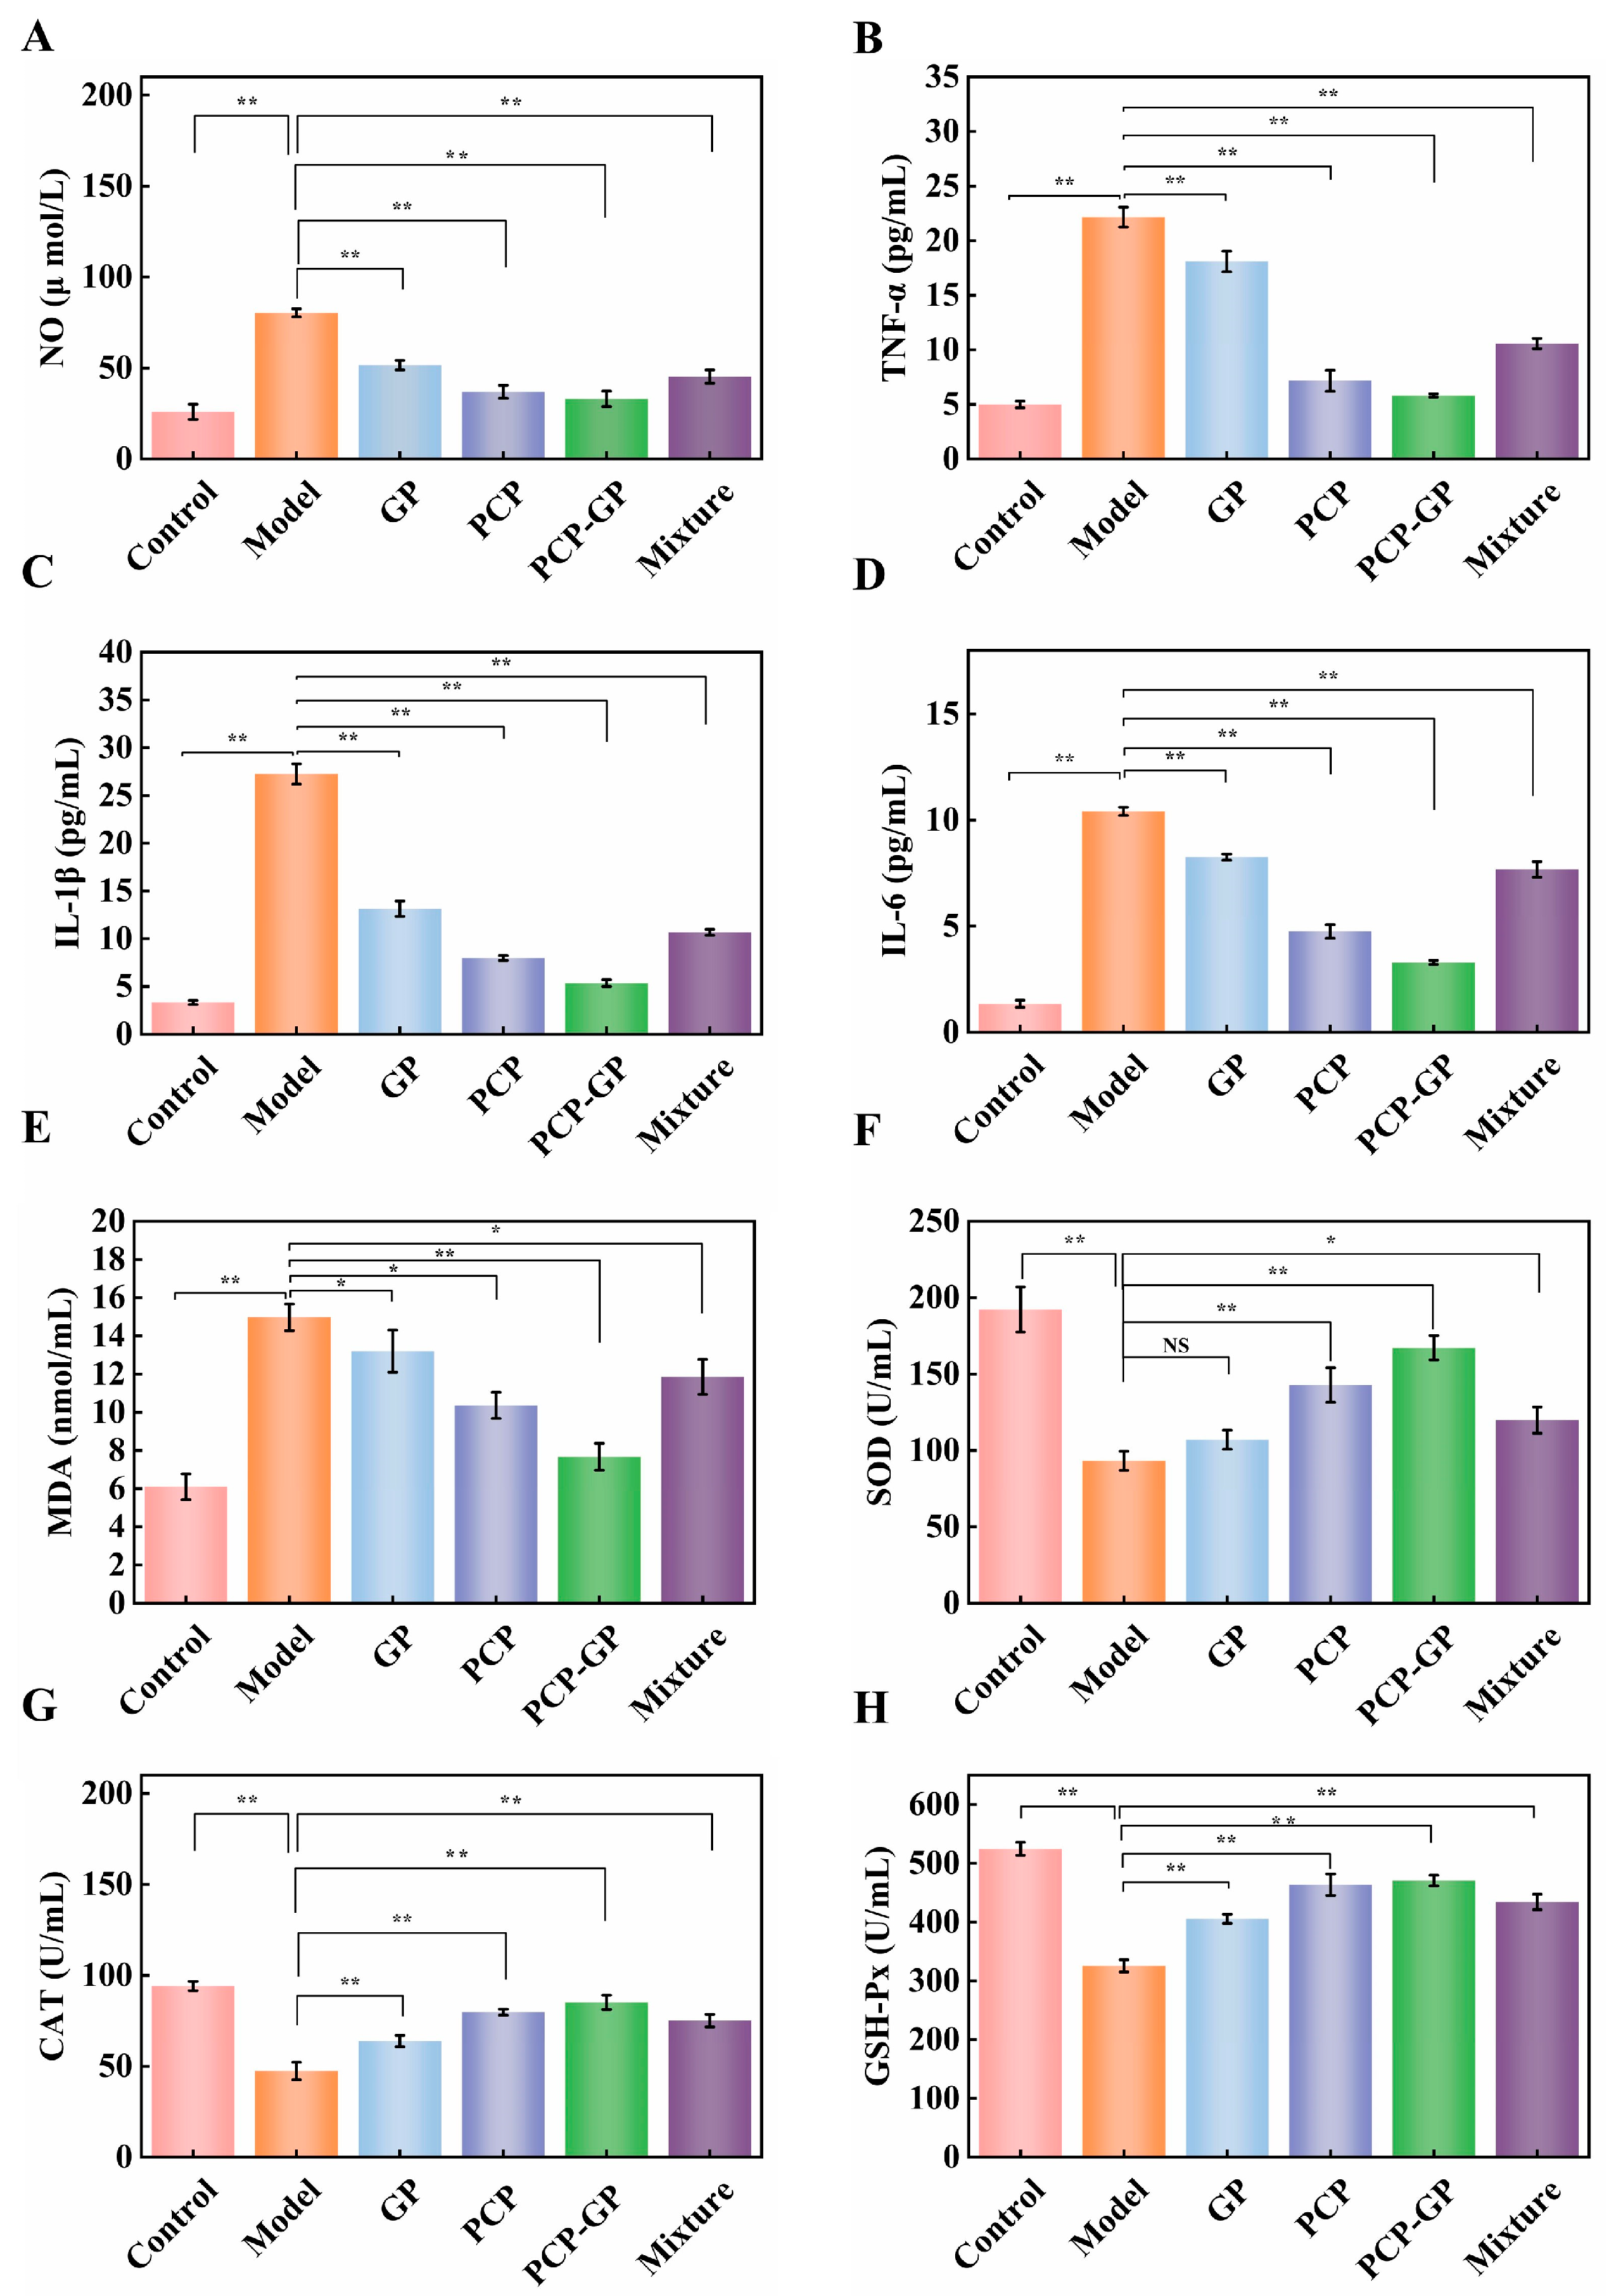
Alcohol-induced gastric mucosal injury is one of the most common disorders of the gastrointestinal system [35]. To investigate the intervention effect of PCP-GP on ethanol-induced inflammatory injury, the levels of the inflammatory mediator NO and the pro-inflammatory cytokines IL-6, TNF-α, and IL-1β were quantitatively determined. Compared with the control group, the NO level in the ethanol model group increased significantly to 80.32 μmol/L, indicating that ethanol successfully induced marked inflammatory injury in GES-1 cells. After treatment with the different samples, NO secretion was significantly reduced in the injured cells. In particular, the NO level in the PCP-GP group decreased to 36.97 μmol/L, which was significantly lower than those in the individual PCP, GP, and Mixture groups.
As shown in Figure 6A–D, ethanol exposure significantly increased the levels of the pro-inflammatory factors IL-6, TNF-α, and IL-1β, whereas the sample-treatment groups inhibited their secretion to varying degrees. Compared with PCP, GP, and Mixture, PCP-GP exhibited the strongest inhibitory effects on these inflammatory mediators and most effectively alleviated the ethanol-induced inflammatory response. These findings indicate that the physical complexation strategy used in this study markedly enhanced the anti-inflammatory potential of GP and PCP. PCP-GP effectively attenuated ethanol-induced inflammatory injury in gastric mucosal cells and its inhibitory capacity was significantly stronger than those of the individual components and the simple physical mixture, highlighting the application advantage of the physical complexation process.
Figure 6.
Regulatory effects of PCP-GP on ethanol-induced oxidative stress and inflammatory responses in GES-1 cells. (A) NO; (B) TNF-α; (C) IL-1β; (D) IL-6; (E) MDA; (F) SOD; (G) CAT; (H) GSH-Px. (NS, not significant; * p < 0.05; ** p < 0.001).
3.5.3. Effects on Oxidative Stress in GES-1 Cells
Oxidative-stress imbalance is an important mechanism underlying ethanol-induced gastric mucosal cell injury [36]. To further evaluate the antioxidant protective potential of PCP-GP in ethanol-injured GES-1 cells, intracellular MDA content and the activities of the endogenous antioxidant enzymes SOD, CAT, and GSH-Px were measured. As shown in Figure 6E–H, compared with the control group, intracellular MDA content in the ethanol model group increased significantly to 14.96 nmol/mL, whereas SOD, CAT, and GSH-Px activities decreased significantly to 93.21 U/mL, 47.42 U/mL, and 325.69 U/mL, respectively, indicating that ethanol exposure disrupted cellular redox homeostasis and induced severe oxidative-stress injury.
After treatment with the different samples, lipid peroxidation in GES-1 cells decreased significantly and antioxidant enzyme activities were effectively restored. PCP-GP reduced cellular MDA content to 10.36 nmol/mL, and the recovery of SOD, CAT, and GSH-Px activities was significantly greater than that observed in the PCP, GP, and Mixture groups. These findings indicate that the physical complexation of GP and PCP produced stronger antioxidant activity, potentially by increasing endogenous antioxidant enzyme activities and reducing lipid peroxidation accumulation, thereby ameliorating ethanol-induced oxidative-stress imbalance. This also suggests that PCP-GP has the potential to alleviate gastric mucosal cell injury in vitro.
Collectively, although PCP-GP demonstrated a significant potential to ameliorate ethanol-induced inflammatory and oxidative-stress injury in GES-1 cells, it must be acknowledged that these findings only reflect its in vitro protective potential. The specific signaling pathways underlying these effects were not investigated in the current study. Therefore, future research is warranted to further validate these pathways to fully elucidate the precise molecular mechanisms of PCP-GP.
3.5.4. Intracellular ROS Levels
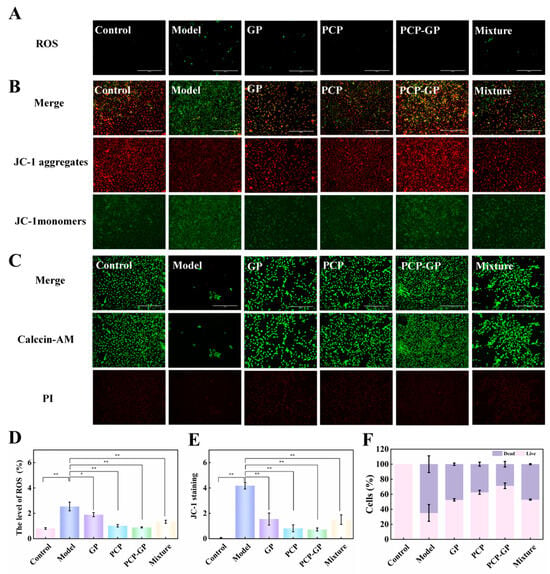
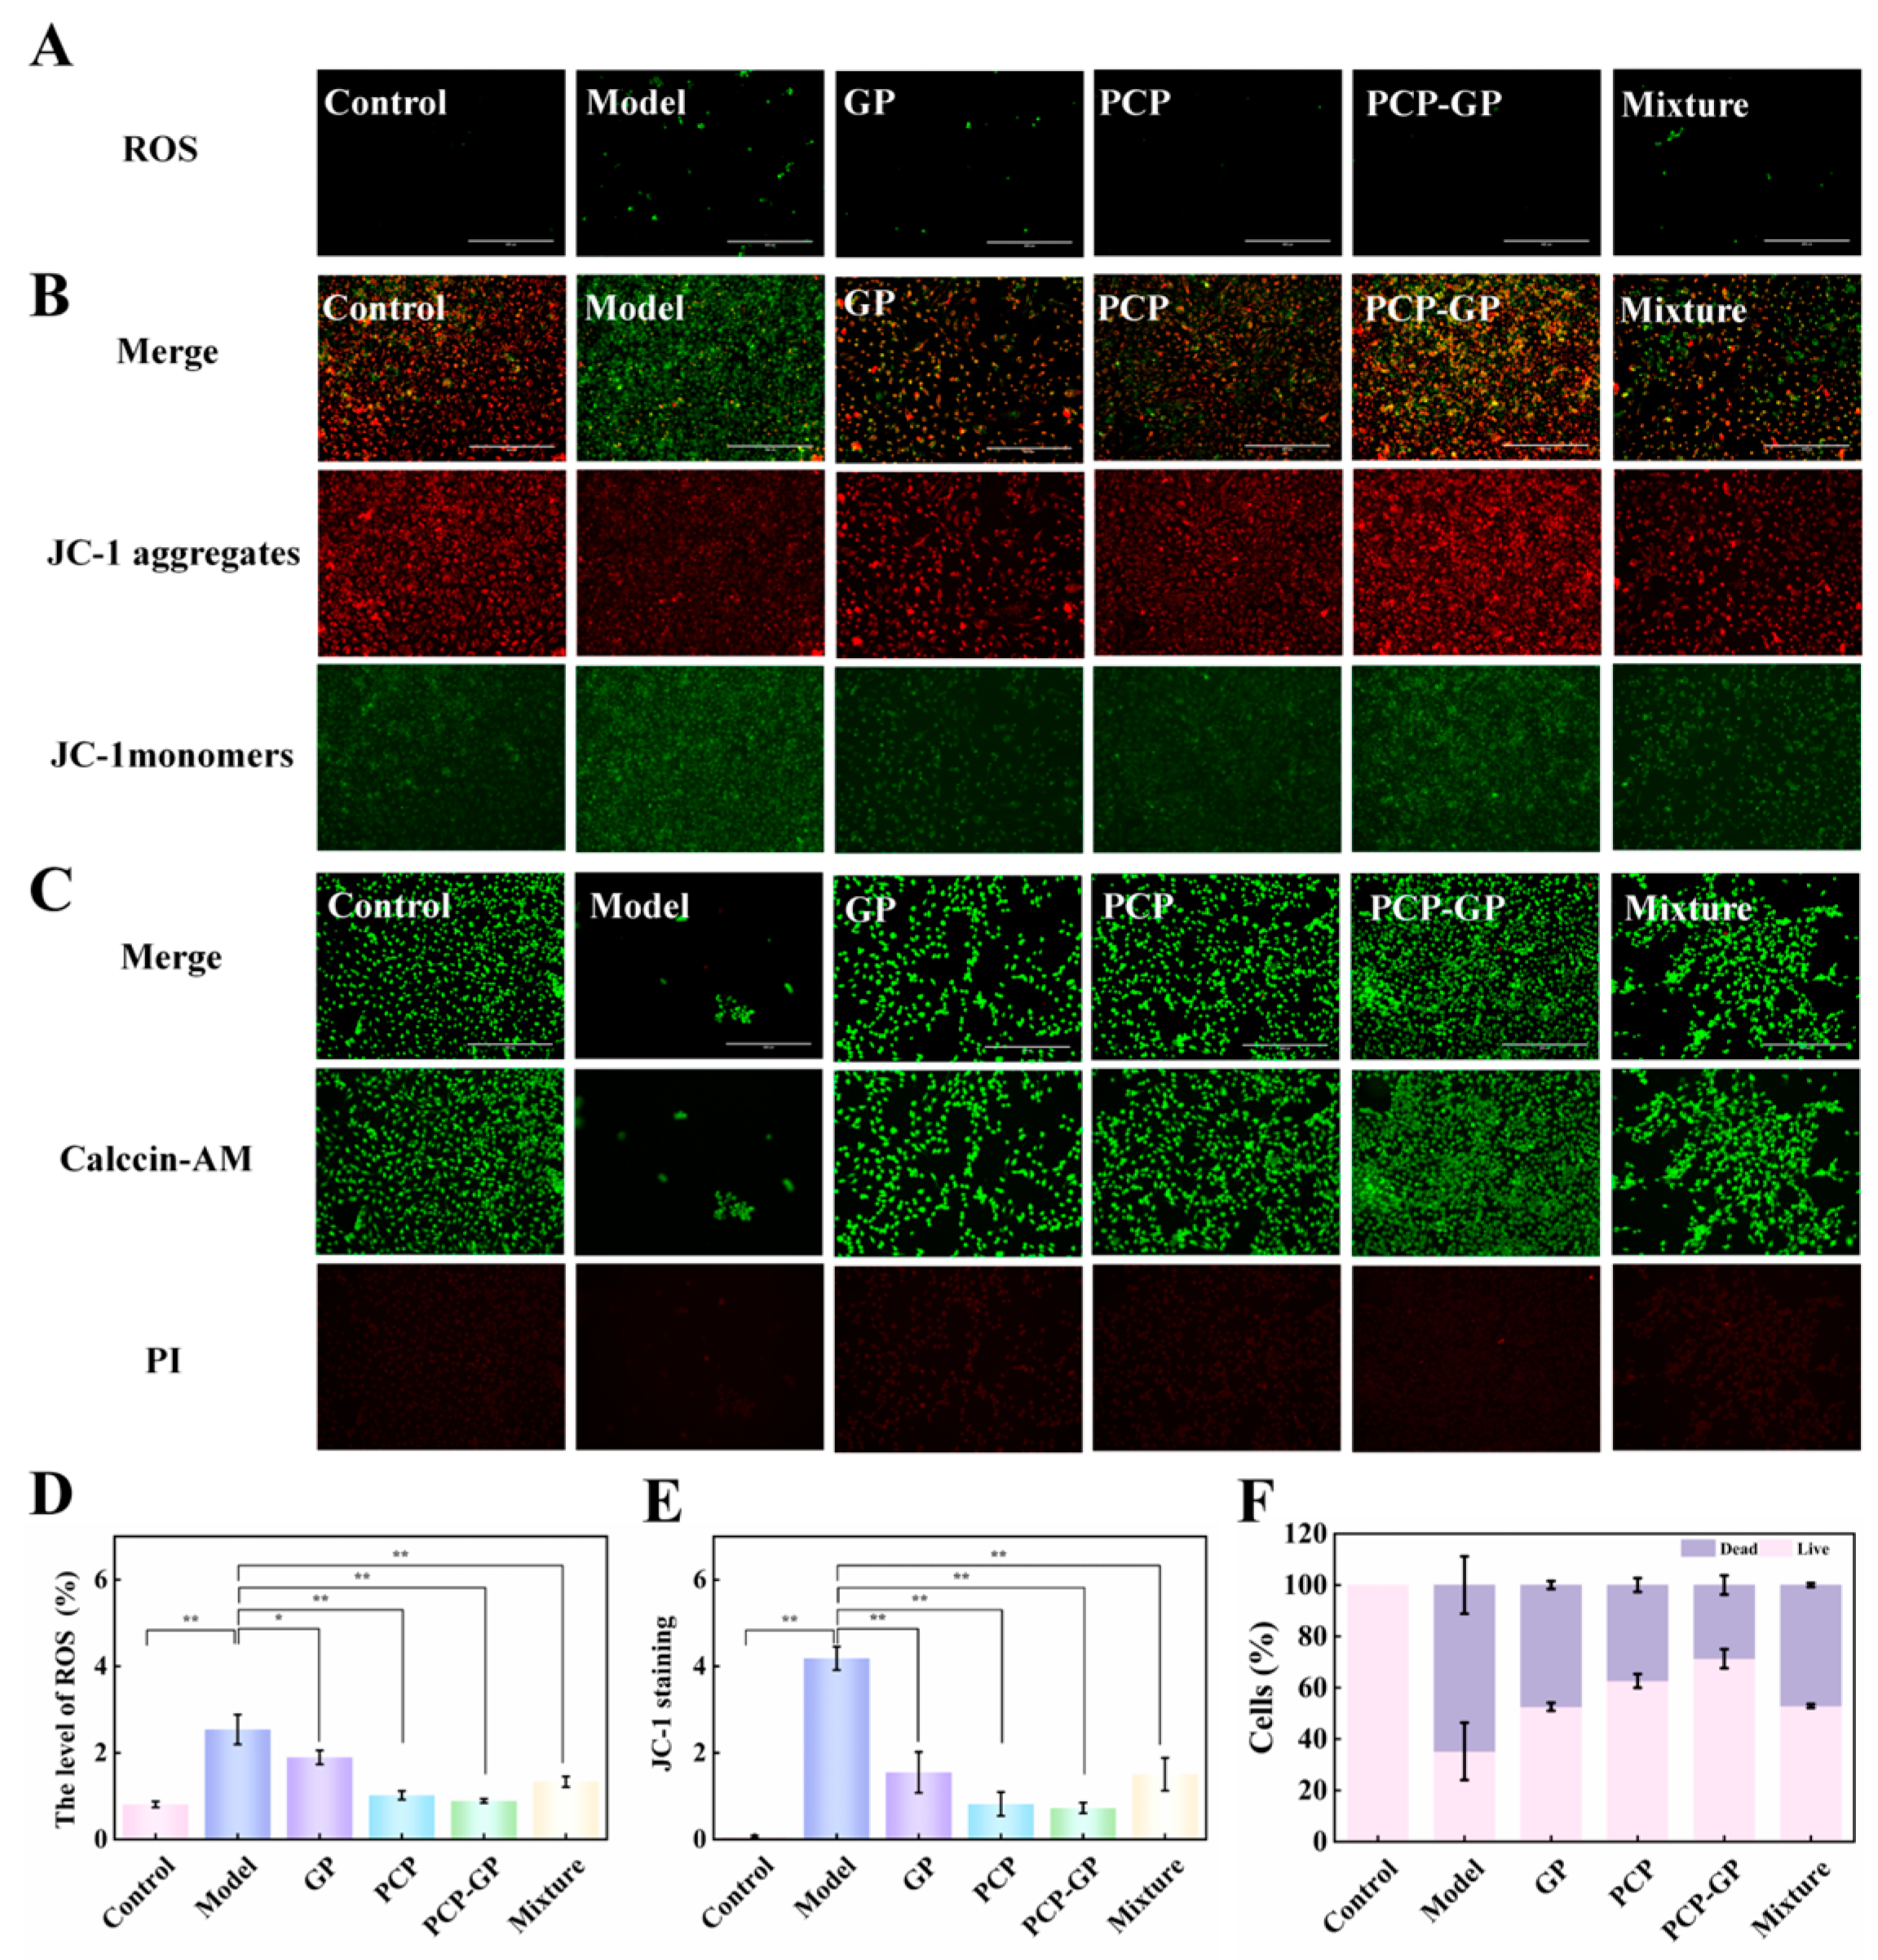
Abnormal accumulation of intracellular reactive oxygen species (ROS) is a key contributor to oxidative-stress injury and cellular damage, and ROS levels directly reflect the degree of cellular oxidative damage. As shown in Figure 7B,E, ROS fluorescence intensity was significantly increased in the ethanol model group compared with the control group, indicating substantial ROS accumulation and a strong oxidative-stress response induced by ethanol. Treatment with each of the four samples effectively reduced intracellular ROS accumulation and attenuated oxidative-stress injury. PCP-GP markedly reduced intracellular ROS levels, with ROS content decreasing substantially and approaching that of the control group. Compared with Mixture, PCP-GP exhibited significantly greater ROS-scavenging capacity, further demonstrating that physical complexation effectively enhanced the antioxidant functions of GP and PCP, promoted clearance of excess ethanol-induced ROS, and attenuated oxidative injury in GES-1 cells.
Figure 7.
Protective effects of PCP-GP against ethanol-induced damage to GES-1 cells. (A,D) Effects on ROS levels in GES-1 cells; (B,E) assessment of mitochondrial membrane potential in GES-1 cells; (C,F) effects on GES-1 cell viability (* p < 0.05; ** p < 0.001).
3.5.5. Measurement of Mitochondrial Membrane Potential
A decrease in mitochondrial membrane potential (MMP) is an early hallmark of mitochondrial dysfunction, and the magnitude of MMP loss is positively associated with the severity of cell injury. As shown in Figure 7C,F, control GES-1 cells maintained a high MMP, exhibiting strong red fluorescence. Following ethanol exposure, MMP decreased significantly in the model group and green fluorescence increased markedly, indicating ethanol-induced mitochondrial dysfunction. Following treatment with the different samples, MMP recovered to varying degrees. The Mixture produced only a modest recovery of MMP, whereas PCP-GP significantly increased MMP in the injured cells and effectively mitigated ethanol-induced MMP loss. Its restorative effect was significantly greater than those of Mixture, PCP, and GP, indicating that PCP-GP could stabilize mitochondrial membrane potential and ameliorate mitochondrial dysfunction.
3.5.6. Calcein-AM/PI Dual-Fluorescence Staining
To visually verify the protective potential of PCP-GP against ethanol-induced GES-1 cell injury, Calcein-AM/PI dual-fluorescence staining was used to label viable and dead cells and to evaluate differences in cell morphology and survival among groups. As shown in Figure 7A,D, control GES-1 cells exhibited a typical spindle-shaped, flattened morphology; grew uniformly as adherent cells; maintained intact and orderly morphology; and showed almost no red fluorescence from dead cells. After ethanol treatment, GES-1 cells displayed marked pathological morphological changes, shrinking from a spindle shape to a rounded form, with extensive cell aggregation, reduced adhesion, and cell detachment. Red fluorescence increased markedly and the number of viable cells decreased substantially, confirming that ethanol induced extensive cell death in GES-1 cells. Compared with the model group, all sample-treatment groups attenuated cell injury to varying degrees and reduced cell death. Mixture only mildly alleviated cell injury and still showed substantial red fluorescence, whereas PCP-GP largely restored normal cell morphology, significantly increased the number of adherent cells, markedly reduced the number of red-fluorescent dead cells, and produced a cell-survival state approaching that of the control group. These findings indicate that PCP-GP shows protective potential against ethanol-induced injury and highlight the advantage of the physical complexation strategy in enhancing the biological activity of the raw components.
4. Conclusions
In this study, Ginseng protein–Poria cocos polysaccharide complexes (PCP-GP) were successfully constructed to regulate functional properties of Poria cocos polysaccharide. The molecular assembly of Poria cocos polysaccharide and Ginseng protein occurs through physical complexation, which induces the conformation and microstructure remodeling of the system. Consequently, with these structural changes, PCP-GP showed improved functional properties such as water-holding capacity, oil-holding capacity, emulsification, and foaming. Furthermore, the results of cell experiments showed that PCP-GP alleviated ethanol-induced inflammation and oxidative stress injury in GES-1 cells; reduced the levels of IL-6, IL-1β, TNF-α, NO, ROS and MDA; increased the activity of antioxidant enzymes; and maintained cell membrane stability and mitochondrial membrane potential, suggesting a regulatory and ameliorative effect on GES-1 cells under inflammation and oxidative stress. The above results show that the physical combination of protein-polysaccharide can further improve its functional properties and expand its gastric mucosal cell protection-related activities by regulating the structural characteristics of PCP, which provides a theoretical basis for the structural regulation and functional utilization of PCP. Moreover, future studies will focus on the in-depth molecular mechanisms of gastric mucosal protection, aiming to provide strong theoretical support for the application of PCP-GP in functional foods development.
Supplementary Materials
The following supporting information can be downloaded at https://www.mdpi.com/article/10.3390/foods15224120/s1. Figure S1. Screening of the optimal ratio for the PCP-PGP complex. (A) Particle size and PDI; (B) Zeta potential; (C) Screening of the modeling concentration (ethanol); (D) Potential of complexes with different ratios to alleviate ethanol-induced gastric mucosal injury.
Author Contributions
Writing—Original draft, X.L.; Methodology, H.Z.; Data curation, C.L.; Visualisation, C.Y.; Writing—Review and editing, G.L. and M.Y. All authors have read and agreed to the published version of the manuscript.
Funding
This research was funded by Jilin Provincial Scientific and Technological Development Program, China, grant number 20240401049YY. This research was funded by Capital construction funds in the provincial budget in 2024 (Jilin Province Development and Reform Commission), China, grant number 2024C012-3.
Institutional Review Board Statement
Not applicable.
Informed Consent Statement
Not applicable.
Data Availability Statement
The original contributions presented in this study are included in the article/Supplementary Materials. Further inquiries can be directed to the corresponding authors.
Conflicts of Interest
The authors declare no conflicts of interest.
Abbreviations
The following abbreviations are used in this manuscript:
| PCP | Poria cocos polysaccharide |
| GP | Ginseng protein |
| FTIR | Fourier-transform infrared |
| XRD | X-ray diffraction |
| CD | Circular dichroism |
| WHC | Water-holding capacity |
| OHC | Oil-holding capacity |
| EAI | Emulsifying activity |
| ESI | Emulsifying activity |
| FC | Foaming capacity |
| FS | Foam stability |
| IL-6 | Interleukin-6 |
| IL-1β | Interleukin-1β |
| TNF-α | Tumor necrosis factor-α |
| NO | Nitric oxide |
| MDA | Malondialdehyde |
| SOD | Superoxide dismutase |
| CAT | Catalase |
| GSH-Px | Glutathione peroxidase |
References
- Yousefi, M.; Jafari, S.M. Recent advances in application of different hydrocolloids in dairy products to improve their techno-functional properties. Trends Food Sci. Technol. 2019, 88, 468–483. [Google Scholar] [CrossRef] [Scilit]
- Tian, X.; Li, Y.; Xu, Z.; Feng, X.; Kong, Q.; Ren, X. Efficient binding paradigm of protein and polysaccharide: Preparation of isolated soy protein-chitosan quaternary ammonium salt complex system and exploration of its emulsification potential. Food Chem. 2023, 407, 135111. [Google Scholar] [CrossRef] [Scilit] [PubMed]
- Han, Y.; Zhu, L.; Zhang, H.; Liu, T.; Wu, G. Characteristic of the interaction mechanism between soy protein isolate and functional polysaccharide with different charge characteristics and exploration of the foaming properties. Food Hydrocoll. 2024, 150, 109615. [Google Scholar] [CrossRef] [Scilit]
- Peng, D.; Jin, W.; Arts, M.; Yang, J.; Li, B.; Sagis, L.M.C. Effect of CMC degree of substitution and gliadin/CMC ratio on surface rheology and foaming behavior of gliadin/CMC nanoparticles. Food Hydrocoll. 2020, 107, 105955. [Google Scholar] [CrossRef] [Scilit]
- Li, X.; He, Y.; Zeng, P.; Liu, Y.; Zhang, M.; Hao, C.; Wang, H.; Lv, Z.; Zhang, L. Molecular basis for Poria cocos mushroom polysaccharide used as an antitumour drug in China. J. Cell. Mol. Med. 2019, 23, 4–20. [Google Scholar] [CrossRef] [Scilit] [PubMed]
- Wan, Y.; Lin, C.; Li, Y.; Wang, R.; Feng, W.; Chen, Z.; Wang, T.; Luo, X.; Wu, X. Tuning the electrostatic interaction between rice protein and carboxymethyl cellulose toward hydrophilic composites with enhanced functional properties. Int. J. Biol. Macromol. 2023, 235, 123918. [Google Scholar] [CrossRef] [Scilit] [PubMed]
- Zhao, Y.Y.; Feng, Y.L.; Du, X.; Xi, Z.H.; Cheng, X.L.; Wei, F. Diuretic activity of the ethanol and aqueous extracts of the surface layer of Poria cocos in rat. J. Ethnopharmacol. 2012, 144, 775–778. [Google Scholar] [CrossRef] [Scilit] [PubMed]
- Zhang, W.; Chen, L.; Li, P.; Zhao, J.; Duan, J. Antidepressant and immunosuppressive activities of two polysaccharides from Poria cocos (Schw.) Wolf. Int. J. Biol. Macromol. 2018, 120, 1696–1704. [Google Scholar] [CrossRef] [Scilit] [PubMed]
- Wang, N.; Zhang, Y.; Wang, X.; Huang, X.; Fei, Y.; Yu, Y.; Shou, D. Antioxidant property of water-soluble polysaccharides from Poria cocos Wolf using different extraction methods. Int. J. Biol. Macromol. 2016, 83, 103–110. [Google Scholar] [CrossRef] [Scilit] [PubMed]
- Zhao, J.M.; Niu, X.Y.; Yu, J.J.; Xiao, X.; Li, W.Q.; Zang, L.L.; Hu, Z.; Ip, P.S.; Li, W.F. Poria cocos polysaccharides attenuated ox-LDL-induced inflammation and oxidative stress via ERK activated Nrf2/HO-1 signaling pathway and inhibited foam cell formation in VSMCs. Int. Immunopharmacol. 2020, 80, 106173. [Google Scholar] [CrossRef] [Scilit] [PubMed]
- Xing, C.; Wang, Y.; Xu, Y.; Liu, Z.; Wang, X.; Tian, Y.; Ren, L.; Wang, M. Polysaccharides from Poria cocos alleviate adenine-induced chronic renal injury via improving gut microbiota disorder. Carbohydr. Res. 2026, 570, 110101. [Google Scholar] [CrossRef] [Scilit] [PubMed]
- Zhang, F.M.; Zheng, H.; Zheng, T.; Xu, P.; Xu, Y.; Cao, Y.X.; Jia, F.; Zeng, Y.Q.; Fan, Y.B.; He, K.; et al. Adsorption, in vitro digestion and human gut microbiota regulation characteristics of three Poria cocos polysaccharides. Food Sci. Hum. Wellness 2024, 13, 1685–1697. [Google Scholar] [CrossRef] [Scilit]
- Sheng, Y.; Yang, W.; Li, Y.; Xia, W.; Fu, X. Preparation of ginsenoside Re-ginseng protein nanoparticles and their ex vivo and in vivo studies. Food Biosci. 2025, 71, 107196. [Google Scholar] [CrossRef] [Scilit]
- Zhang, H.; Wang, H.; Zhou, H.; Shi, J.; Wan, Z.; Li, G.; Yan, M. Synergistic effect in the co-extraction of Ginseng and Schisandra protein. Front. Nutr. 2024, 11, 1482125. [Google Scholar] [CrossRef] [Scilit] [PubMed]
- Shi, L.; Wang, S.; Song, C.; Cui, F.; Zhang, M.; Ma, Y.; Bai, Y.; Song, Z.; Zhang, Z.; Zhang, F.; et al. An adjuvant codelivery nanosystem using Poria cocos polysaccharide for strengthened antitumor immunophototherapy. Colloids Surfaces. B Biointerfaces 2026, 262, 262115512. [Google Scholar] [CrossRef] [Scilit] [PubMed]
- Liu, J.; Shi, L.; Wang, Q.; Zheng, Z.; Wang, P.; Saleh, A.S.; Xiao, Z.; Liu, H.; Ma, C. Synergistic effects of soybean hull polysaccharide concentration and pH on the formation and functional properties of soy protein isolate gels. Food Hydrocoll. 2026, 172, 112164. [Google Scholar] [CrossRef] [Scilit]
- Xing, H.; Liu, X.; Hu, Y.; Hu, K.; Chen, J. Effect of Lycium barbarum polysaccharides on heat-induced gelation of soy protein isolate. Food Hydrocoll. 2024, 147, 109323. [Google Scholar] [CrossRef] [Scilit]
- Ye, Z.; Gan, S.; Wang, J.; Yang, F.; Dong, G. Conjugation of flaxseed protein and plant polysaccharides: Process optimization, structural characterization and technical-function evaluation. Food Hydrocoll. 2025, 166, 111371. [Google Scholar] [CrossRef] [Scilit]
- Han, B.; Liu, H.; Chen, L.; Ye, Q.J.; Li, P.; Du, B.; Li, L. Effect of pH shift on the formation and structural properties of Inca peanut albumin-Dendrobium officinale polysaccharide composite gels. Food Chem. 2025, 498, 147105. [Google Scholar] [CrossRef] [Scilit] [PubMed]
- Ge, W.; Chen, J.; Wang, Y.; Hu, Z.; Wang, H. Insight on the functionalization of hesperidin: Encapsulated by the complex of soybean protein isolate and polysaccharides. Food Chem. 2025, 488, 144902. [Google Scholar] [CrossRef] [Scilit] [PubMed]
- Chen, Q.; Ji, H.; Wang, Z.; Wang, Y.; Wang, X.; Chen, Z. Effects of different charged polysaccharides on the gelation properties and in vitro digestibility of potato protein gel: Insight into underlying mechanisms. Food Hydrocoll. 2025, 164, 111187. [Google Scholar] [CrossRef] [Scilit]
- Chen, P.; Bao, H. The Effect of Dihydromyricetin (DMY) on the Mechanism of Soy Protein Isolate/Inulin/Dihydromyricetin Interaction: Structural, Interfacial, and Functional Properties. Foods 2024, 13, 3488. [Google Scholar] [CrossRef] [Scilit] [PubMed]
- Serrano-Lotina, A.; Portela, R.; Baeza, P.; Alcolea-Rodriguez, V.; Villarroel, M.; Avila, P. Zeta potential as a tool for functional materials development. Catal. Today 2023, 423, 113862. [Google Scholar] [CrossRef] [Scilit]
- Nourmohammadi, N.; Campanella, O.H.; Chen, D. Effect of limited proteolysis and CaCl2 on the rheology, microstructure and in vitro digestibility of pea protein-carboxymethyl cellulose mixed gel. Food Res. Int. 2024, 188, 114474. [Google Scholar] [CrossRef] [Scilit] [PubMed]
- Dai, Q.; Wang, H.; Zhu, X.; Hornung, P.S.; Zhang, Y.; Hu, W.; Lin, A.; Yao, A.; Beta, T. Assessment of pH-induced conformational changes in whey protein isolate–dextran conjugate using spectral technology. Foods 2025, 14, 1952. [Google Scholar] [CrossRef] [Scilit] [PubMed]
- Deng, F.; Luo, S.; Hu, X.; Liu, C. Preparation, structural characterization and properties of feruloyl oligosaccharide–rice protein hydrolysate conjugates. Food Res. Int. 2024, 176, 113844. [Google Scholar] [CrossRef] [Scilit] [PubMed]
- Zhao, C.B.; Yin, H.H.; Yan, J.N.; Niu, X.; Qi, B.K.; Liu, J.S. Structure and acid-induced gelation properties of soy protein isolate-maltodextrin glycation conjugates with ultrasonic pretreatment. Food Hydrocoll. 2021, 112, 106278. [Google Scholar] [CrossRef] [Scilit]
- Ding, X.Y.; Zeng, N.; Zhang, G.W.; Pan, J.H.; Hu, X.; Gong, D.M. Influence of transglutaminase-assisted ultrasound treatment on the structure and functional properties of soy protein isolate. J. Food Process. Preserv. 2019, 43, 10. [Google Scholar] [CrossRef] [Scilit]
- Ma, B.; Chen, N.; Cai, W.; Shao, X. Understanding the protein conformation transition within polymer hydrogels using a near-infrared water spectroscopy probe. Int. J. Biol. Macromol. 2025, 290, 138995. [Google Scholar] [CrossRef] [Scilit] [PubMed]
- Dong, Z.; Yu, S.; Zhai, K.; Bao, N.; Rashed, M.M.A.; Wu, X. Fabrication and characterization of complex coacervation: The integration of sesame protein isolate-polysaccharides. Foods 2023, 12, 3696. [Google Scholar] [CrossRef] [Scilit] [PubMed]
- Jahromi, S.H.R.; Farhoosh, R.; Hemmateenejad, B.; Varidi, M. Characterization of the binding of cyanidin-3-glucoside to bovine serum albumin and its stability in a beverage model system: A multispectroscopic and chemometrics study. Food Chem. 2020, 311, 126015. [Google Scholar] [CrossRef] [Scilit] [PubMed]
- Zang, Z.; Tian, J.; Chou, S.; Lang, Y.; Tang, S.; Yang, S.; Yang, Y.; Jin, Z.; Chen, W.; Liu, X.; et al. Investigation on the interaction mechanisms for stability of preheated whey protein isolate with anthocyanins from blueberry. Int. J. Biol. Macromol. 2024, 255, 9. [Google Scholar] [CrossRef] [Scilit] [PubMed]
- Zhao, H.B.; Yu, B.; Hemar, Y.; Chen, J.; Cui, B. Improvement of calcium sulfate-induced gelation of soy protein via incorporation of soy oil before and after thermal denaturation. LWT-Food Sci. Technol. 2020, 117, 108690. [Google Scholar] [CrossRef] [Scilit]
- Takbirgou, H.; Salami, M.; Askari, G.; Emam-Djomeh, Z.; Löbenberg, R.; Serpe, M.J.; Davies, N.M.; Lai, W.-F. Development and evaluation of alginate-based gastroretentive raft-forming systems enabling sustained release of propolis in gastric ulcer treatment. Drug Deliv. 2026, 33, 2616887. [Google Scholar] [CrossRef] [Scilit] [PubMed]
- Zheng, Z.; Sun, N.; Mao, C.; Tang, Y.; Lin, S. Val-Leu-Leu-Tyr (VLLY) alleviates ethanol-induced gastric mucosal cell impairment by improving mitochondrial fission. J. Agric. Food Chem. 2023, 71, 18722–18734. [Google Scholar] [CrossRef] [Scilit] [PubMed]
- Wang, H.; Liu, J.; Li, X.; Xu, Z.; Zhang, F. Role of Sanqi Baiji San in mitigating ethanol-induced gastric epithelial cell injury via PI3K/AKT-related signaling. J. Vis. Exp. 2026, 233, e71942. [Google Scholar] [CrossRef] [Scilit] [PubMed]
Disclaimer/Publisher’s Note: The statements, opinions and data contained in all publications are solely those of the individual author(s) and contributor(s) and not of MDPI and/or the editor(s). MDPI and/or the editor(s) disclaim responsibility for any injury to people or property resulting from any ideas, methods, instructions or products referred to in the content. |
© 2026 by the authors. Licensee MDPI, Basel, Switzerland. This article is an open access article distributed under the terms and conditions of the Creative Commons Attribution (CC BY) license.