


Abstract
To address the difficulty in continuously and accurately quantifying the time-dependent damage size of targets under coupled laser–tangential airflow action, this paper proposes a piecewise exponential damage inversion modeling method combining deep learning and physical driving. A synchronous laser–tangential airflow experimental platform is built, and 0–5 s damage time-series images are collected to construct a dataset. The YOLO26 real-time visual detection network is selected to realize automatic identification of ablation molten spot regions, with model precision of 0.984, mAP@0.5:0.95 = 0.966, and single-frame inference time of 27.6 ms. Relying on a self-developed visual interactive program, batch time-series image automatic recognition and size conversion are completed, and 1.6–5.0 s is determined as the reliable quantitative interval. Based on the effective data in this interval, the competitive coupling effect between airflow shear-induced melting enhancement and convective cooling is analyzed. A piecewise exponential evolution model containing a quadratic modulation term of tangential airflow is constructed, which well describes the three-stage nonlinear law of damage “initiation–expansion–stabilization”. A genetic algorithm is used to complete global parameter fitting under multiple working conditions. The average relative errors of the model for damage length and width are both lower than 2.1%, RMSE is less than 0.7 mm, MAE is less than 0.52 mm, and is higher than 0.994. This work can provide a theoretical basis and technical scheme for quantitative time-series analysis of damage in metal targets irradiated by high-energy lasers.
1. Introduction
Laser is a special light source generated based on the principle of stimulated radiation, with core optical characteristics such as extremely high brightness, strong directivity, excellent monochromaticity and high coherence [1]. Relying on excellent beam regulation performance, laser technology has been widely applied in the field of material processing, covering process scenarios such as cutting, drilling, ablation and photolithography [2]. When high-energy laser irradiates metal targets, incident light energy is rapidly converted into thermal energy, inducing a series of multi-scale complex thermophysical behaviors such as material temperature rise, melting, gasification and melt sputtering [3]. If tangential high-speed airflow acts synchronously on the target surface, airflow shear force will drive directional migration of molten pool melt to form asymmetric accumulation morphology, thereby significantly changing the geometric shape of ablation pits and the dynamic law of damage expansion [4,5]. Under this thermal–fluid–solid multi-field coupling system, only by accurately obtaining continuous time-series evolution data of material laser damage under different intensities of tangential airflow can the coupling mechanism between airflow and laser be quantitatively analyzed, providing support for rapid quantitative evaluation of laser damage capability.
However, laser–airflow coupled damage is a typical thermal–fluid–solid multi-field coupling problem, and its internal temperature field, flow field and molten pool evolution are difficult to observe directly. In terms of numerical simulation, the thermal–fluid–solid coupled calculation model has strong dependence on mesh division, boundary constraints and material physical parameters, and the simulation computing cost is huge, which cannot meet the engineering requirements of batch rapid evaluation of multiple working conditions [6,7]. At the experimental measurement level, manual caliper measurement and grayscale threshold segmentation rely on subjective intervention, with low batch processing efficiency and large boundary recognition error, which cannot support quantitative analysis of long-term evolution laws [8]. Therefore, automatic and high-precision damage quantification means need to be introduced.
In recent years, deep learning target detection algorithms represented by the YOLO series have provided a new path for automatic quantification of laser damage morphology [9,10], but current relevant research still has key and systematic defects, which make it difficult to support the core research demand of unified temporal prediction of damage under different intensities of tangential airflow:
First, most detection schemes aim at a single static working condition, lacking systematic quantification of continuous time-series data under multi-subsonic and supersonic airflow [11,12];
Second, target detection alone can only obtain the apparent damage size at a single moment, lacking a standardized process for batch conversion and structured export of complete image frames, making it difficult to establish a quantitative correlation model between damage time-series evolution and different tangential airflow intensities [13];
Third, existing time-series prediction of laser damage mostly adopts single linear or exponential functions, which cannot fully describe the piecewise nonlinear evolution law of damage over time, and lacks modulation terms for different tangential airflow intensities, making it difficult to realize unified prediction for different airflow conditions [14].
The root cause of the above shortcomings is that existing methods separate the two links of “intelligent visual recognition” and “physical time-series modeling”. In view of the above problems, scholars at home and abroad have carried out a large amount of basic research from two paths of numerical simulation and experimental observation. In terms of numerical simulation, Peng Guoliang et al. established a metal melt-through calculation model coupled with airflow and laser [15]; Liu Xiaoying et al. explored the influence of irradiation position on melt migration under subsonic airflow [7]; Huang Yihui et al. confirmed that high-speed airflow reconstructs the target temperature field through convective heat transfer [8]; Zhang Xiaoteng et al. clarified the joint decisive effect of airflow velocity, laser power and irradiation duration [16]; Zhang Jialei et al. constructed a thermal–mechanical coupling simulation framework [17]. In terms of experimental observation, Yuan Chun et al. confirmed that airflow condition is the core variable of damage expansion rate [18]; Zhang Jianmin et al. revealed the regulation mechanism of tangential airflow velocity on thermal damage behavior [19]; Chen Geng et al. revealed the strong coupling relationship among laser power density, airflow velocity and irradiation time [20]. Although the above research has accumulated rich achievements, the extraction of damage size in experiments still highly relies on manual work or traditional algorithms, making it difficult to stably obtain high-precision, long-term and batch-continuous damage evolution datasets. Meanwhile, inverting time-series evolution only by surface morphology is a typical nonlinear parameter inversion problem, which has strict requirements on model structure and parameter identification algorithm.
The 7075 aluminum alloy, as a typical representative of Al–Zn–Mg–Cu ultra-high-strength aluminum alloys, has high specific strength, good machinability and excellent stress corrosion resistance and is widely used in key load-bearing parts such as aerospace vehicle skins, structural parts and landing gear. Under intense laser irradiation, this material exhibits prominent thermal damage behavior due to its relatively low melting point (about 635 °C) and relatively high thermal conductivity (about 160 W/(m·K)) [21]. It is a typical target material in laser irradiation damage assessment. Therefore, selecting 7075 aluminum alloy to carry out laser damage time-series research under tangential airflow coupling can provide representative experimental data and theoretical basis for laser protection and damage assessment of aviation aluminum alloy materials.
Based on the above, this paper takes the whole process of damage evolution of 7075 aluminum alloy irradiated by coupled tangential high-speed airflow and high-energy laser as the research object and proposes a dynamic damage time-series prediction method integrating YOLO26 target detection and a piecewise exponential physical model. YOLO26 adopts a RepCSP reparameterizable backbone and a BiC bidirectional feature fusion structure [22]. While maintaining real-time inference speed, it significantly improves the detection accuracy of multi-scale targets. Compared with YOLOv7 and YOLOv6, YOLO26 has improved target boundary localization accuracy and is more suitable for accurate extraction of irregular molten pool contours. YOLO26 removes the traditional DFL module and adopts direct scalar L1 regression for bounding box localization, which has fewer regression range limitations for large-scale and irregular targets [22]. Preliminary comparative experiments show that on the same dataset, YOLO26 achieves a certain degree of improvement in mAP compared with other YOLO models, while the inference speed is comparable.
Based on the above analysis, the main innovations of this paper are as follows:
- (1)
- real-time automatic damage identification scheme based on YOLO26-M: the medium-depth YOLO26-M real-time detection network is selected, combined with a self-developed visual interactive program, to realize automatic batch extraction and standardized export of time-series damage length and width data under different tangential airflow intensities.
- (2)
- based on high-precision time-series quantitative data, the nonmonotonic regulation law of different tangential airflow intensities on damage evolution is revealed, and the competitive coupling mechanism of airflow shear-induced melting enhancement and convective cooling is discussed with indirect evidence such as microscopic composition characterization.
- (3)
- piecewise exponential evolution model with tangential airflow modulation term: a three-stage piecewise exponential function is designed, the quadratic term of tangential airflow intensity is introduced as a global modulation parameter, and a genetic algorithm is adopted to realize unified global fitting under multiple working conditions, establishing a quantitative prediction relationship between tangential airflow intensity and time-series damage size.
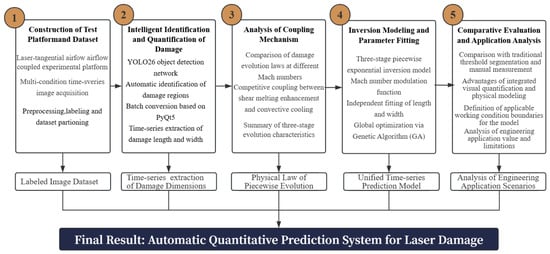
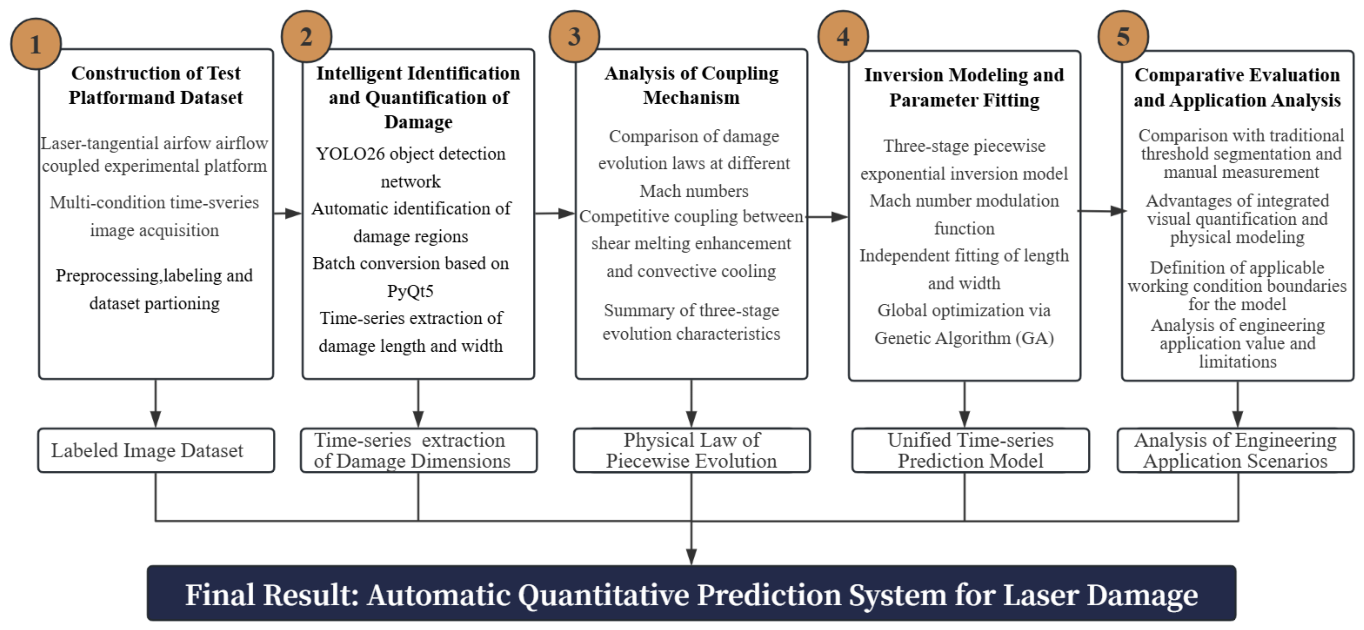
The overall technical route of this paper is shown in Figure 1.
Figure 1.
Integrated research flow of laser damage temporal prediction.
Following the progressive research idea of “experimental database construction—intelligent quantification—mechanism analysis—model fitting—comparative verification”: Rely on the coupled test platform to collect multi-Mach time-series damage images and construct datasets; use YOLO26 and self-developed visualization tools to obtain standardized time-series size data through batch conversion; reveal the competitive coupling effect of airflow shear and cooling and three-stage damage evolution characteristics based on quantitative results; construct a piecewise exponential model with tangential airflow modulation, and adopt a genetic algorithm for parameter fitting; clarify the applicable scope of the method through comparison with traditional measurement methods, and form a complete system for automatic quantitative prediction of laser damage.
2. Experimental Data, Image Dataset and Temporal Visualization Processing Program
2.1. Acquisition of Experimental Data
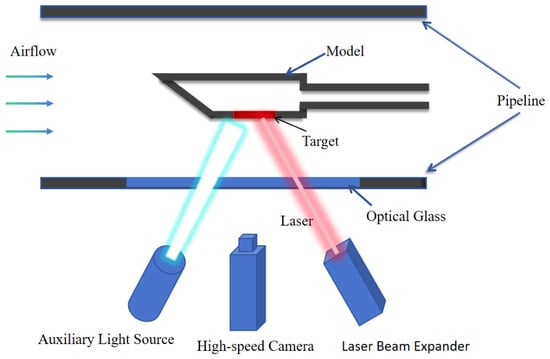
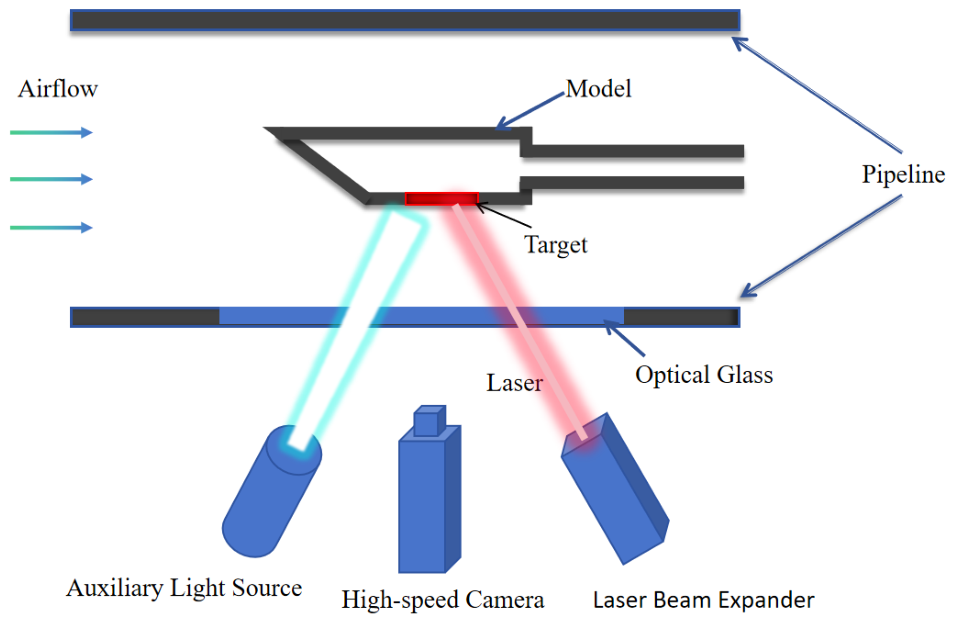
Experimental data are mainly obtained by high-speed camera. The no-airflow comparative test and the airflow-coupled test adopt the same laser action conditions. The laser parameters and target dimensions are directly given in this paper. The no-airflow experimental data are derived from previous work [23], and their working conditions are consistent with this test. The supersonic airflow condition experimental data are mainly obtained through the device shown in Figure 2.
Figure 2.
Schematic diagram of in situ observation experimental system for target irradiated by coupled tangential airflow and laser.
A continuous-wave fiber laser (wavelength 1080 nm; self-developed in our laboratory, Mianyang, China) was used for laser irradiation, with an output power of 8 kW. After beam transmission, the power reaching the target surface was calibrated to approximately 7.6 kW, corresponding to a target surface irradiance of 1.08 kW/cm2; the beam mode was Gaussian. The beam expander (self-developed in our laboratory, Mianyang, China) adjusted the laser beam diameter to 30 mm and aligned the center of the laser irradiation area with the center of the target front surface. The laser incident angle was set to 5°, and the irradiation time was 10 s. A laser power meter (self-developed in our laboratory, Mianyang, China) covering the beam diameter range of the laser output was adopted, and its readings were recorded synchronously upon laser activation to assist in determining the target breakdown time and laser cut-off after penetration.
The target specimen was 7075 aluminum alloy with dimensions of 110 mm × 3 mm. The surface was machined to Ra1.6, and no blackening or coating treatment was applied before the test. The specimen was fixed on one side inside the ventilation pipeline. Tangential airflow was supplied by a high-pressure gas source system (self-developed in our laboratory, Mianyang, China) with compressed air as the working medium. Four working conditions were realized by adjusting the pipeline airflow velocity: 0 m/s, 510 m/s, 1020 m/s and 1360 m/s. The airflow temperature measured by a thermocouple at the pipeline inlet was approximately 298 K (room temperature), and the airflow temperature remained approximately consistent across all working conditions, with a variation within 10 K. TTo maintain stable equipment operation, the water chiller (local manufacturer, Mianyang, China) was set to a working temperature of 22.5 °C, mainly for cooling the fiber laser, beam expander system and power meter.
For image acquisition and auxiliary monitoring, a high-speed camera (local manufacturer, Mianyang, China) was used for in situ imaging of the laser-irradiated target area with the assistance of a supplementary light source. The sampling frequency was set to 10 Hz, and the recording duration was 30 s, mainly to monitor morphological changes on the target front surface under laser loading and assist in determining the target breakdown time. The supplementary light source (self-developed in our laboratory, Mianyang, China) operated at 20,000 Hz for 30 s to compensate for the intense light emission generated by the material during laser ablation and to improve the clarity of images captured by the high-speed camera. Meanwhile, a thermocouple (local manufacturer, Mianyang, China) with a measurement range of 0–1250 °C was attached to the center of the target back surface.Back-surface temperature data were collected by a dynamic temperature acquisition system (self-developed in our laboratory, Mianyang, China) at a sampling frequency of 10 Hz over 30 s, also to assist in determining the target breakdown time. During the test, the laser, high-speed camera and data acquisition system were triggered synchronously to ensure temporal consistency of all measurement channels. A calibration ruler (local manufacturer, Mianyang, China) of known dimensions was placed on the target plane at the same object distance for imaging calibration, and the pixel-to-millimeter conversion coefficient k (unit: mm/pixel) was calculated for subsequent quantitative conversion of damage size.
In the experimental design, the laser incident angle was set to 5° to prevent reflected light from propagating along the original optical path and damaging laser optical components, which would occur under vertical incidence. Meanwhile, the effect of this small angular deviation on the energy density distribution on the target surface can be neglected. The tip angle of the model head was set to 15° to form a stable tangential airflow boundary layer inside the ventilation pipeline, avoid large-scale flow separation or strong turbulent pulsation upstream of the target and ensure uniform and steady tangential airflow on the target surface. This work focuses on the rapid damage evolution in the early stage of laser irradiation. Within 0–5 s, the damage morphology exhibits typical initiation, expansion and early stabilization characteristics, which can fully reflect the damage evolution law under airflow coupling. The effective quantitative interval was further restricted to 1.6–5.0 s: in the interval of 0–1.6 s, the molten spot is tiny, the image signal-to-noise ratio is insufficient, YOLO26 detection confidence remains below 0.5 and bounding box localization is unreliable; in contrast, within 1.6–5.0 s, the molten pool contour is clear and imaging is stable, and detection confidence stays at a relatively high level, making this interval suitable as the effective quantitative window for model parameter fitting.
Based on the above effective quantitative data, a time-series image data processing program was developed (see Section 2.3 for details) to achieve automatic batch output of the time-series damage length and width dataset.
2.2. Dataset Construction and Preprocessing
After obtaining images of the target damage process, LabelImg is used to manually label damage areas under various working conditions, and rectangular bounding boxes are adopted to describe the spatial range of damage areas. The dataset contains four airflow working conditions (airflow velocities of 0 m/s, 510 m/s, 1020 m/s and 1360 m/s). Multiple independent repeated experiments were carried out under each working condition. Adjacent frames do not appear simultaneously in the training set or validation set. The validation set and test set are divided by different frames to avoid dataset overlap.
The numbers of effective labeled images under each working condition are as follows: 240 frames for 0 m/s, 306 frames for 510 m/s, 138 frames for 1020 m/s and 306 frames for 1360 m/s, totaling 990 frames.
To avoid data leakage caused by random division of temporally continuous images, this paper divides the dataset based on independent experiments rather than randomly splitting single-frame images. The test set does not participate in model training and is only used for final model performance evaluation after training. During the specific division, all frames of the same experiment are ensured to appear only in the same data subset. After dividing the independent experimental units at a ratio of 8:1:1, the training set contains 792 frames, the validation set contains 99 frames and the test set contains 99 frames. Each subset contains samples of the four airflow working conditions to ensure the balance of working conditions in model training and evaluation.
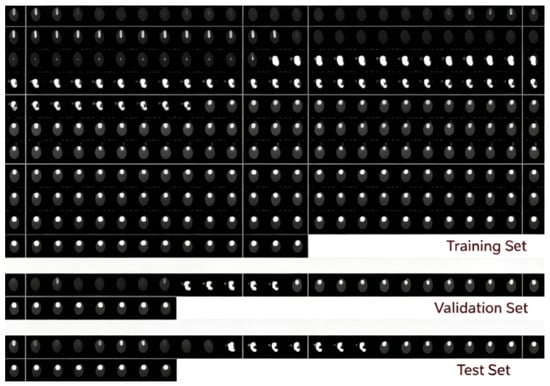
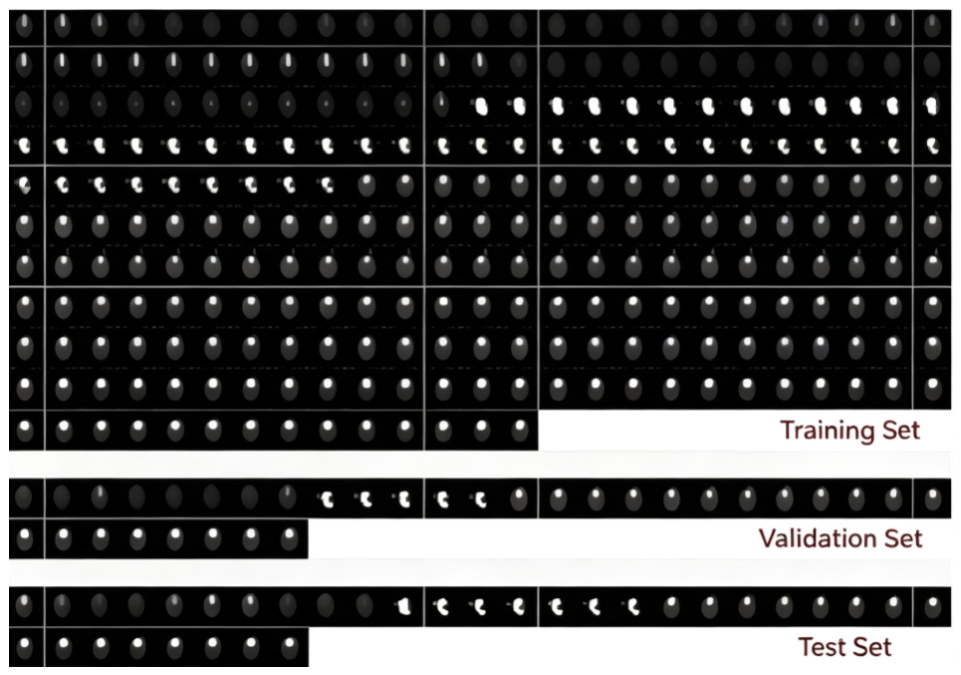
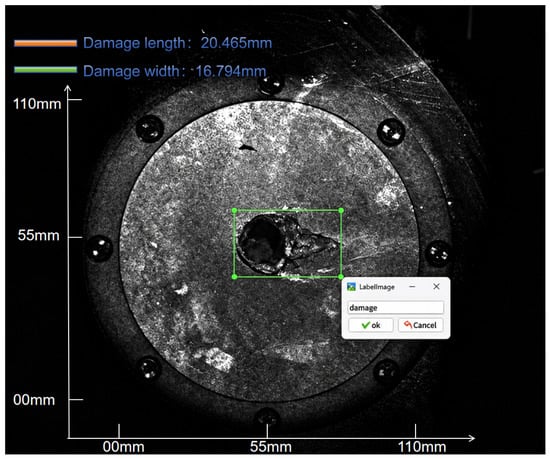
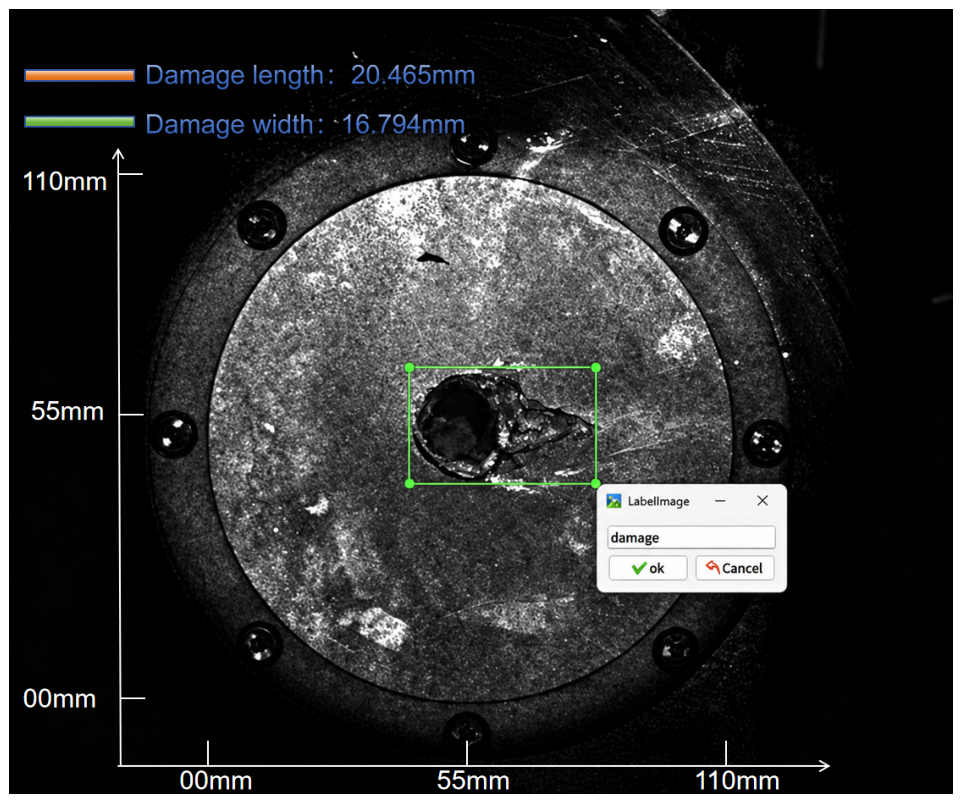
Before model training, preprocessing is carried out on original images, including image screening, unified size adjustment, pixel normalization, label file matching and dataset division. Image samples with serious blurring, occlusion, or unidentifiable damage areas are eliminated; then, images are uniformly scaled to 640 × 640 pixels, and the consistent mapping relationship between label box coordinates and image size is maintained. The dataset division is shown in Figure 3. Figure 4 shows dataset labeling examples only for the 510 m/s airflow condition; the labeling process for other working conditions is consistent with this example.
Figure 3.
Target damage dataset (top: training set; middle: validation set; bottom: test set).
Figure 4.
Labeling of target damage process images.
2.3. Visual Interactive Temporal Image Processing Program for Targets
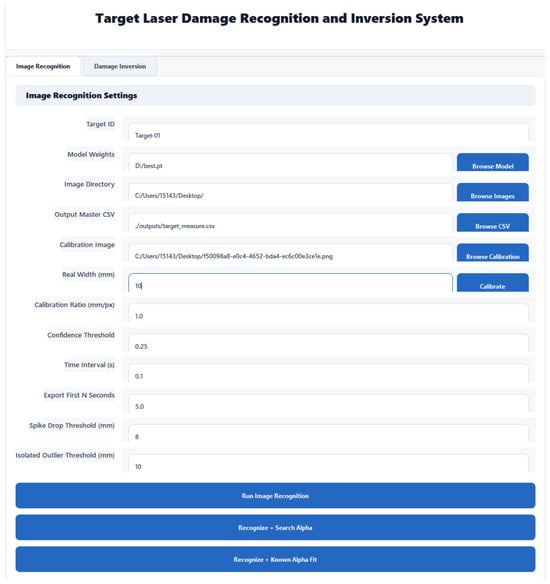
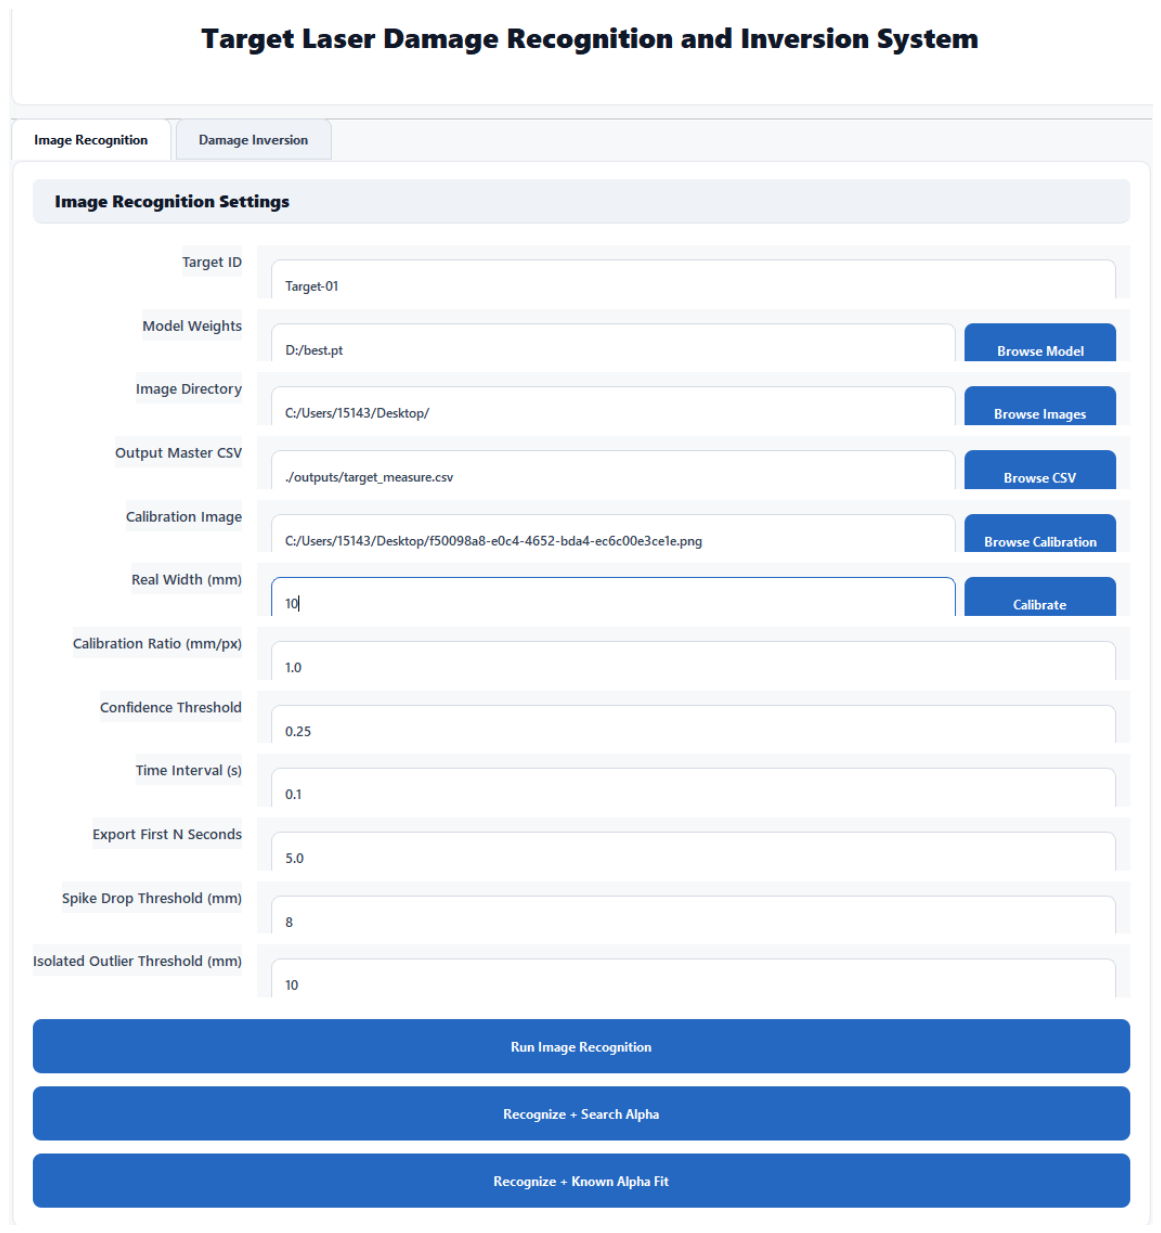
To solve the problems of low batch processing efficiency, strong subjectivity of boundary identification and difficulty in structured export of time-series data of traditional grayscale threshold segmentation methods, this paper develops a visual interactive time-series image processing program based on PyQt5, integrating target detection, scale calibration, size conversion and time-series data export functions, eliminating manual measurement and manual recording steps and providing standardized time-series datasets for damage evolution analysis and inversion modeling. The main interactive interface of the program is shown in Figure 5.
Figure 5.
Image recognition interface of intelligent identification and inversion system for target laser damage.
The interface is divided into five functional areas: image configuration, model loading, calibration parameters, time-series control and execution operations. Users can independently select the optimal YOLO26 weights, the folder of images to be processed and the data output path. After importing a calibration image and inputting the actual size, the pixel-to-millimeter conversion coefficient is automatically generated. The interface also supports user-defined detection confidence thresholds and image acquisition time intervals and includes a built-in abnormal data filtering function to automatically remove mutation values without physical significance in time-series curves. The function buttons at the bottom sequentially perform batch image recognition, scale coefficient inversion and damage time-series parameter fitting so that the entire workflow of image quantification and model fitting can be completed in a closed loop within the same interface.
The complete processing flow consists of four steps: the program reads time-series images in batches in chronological order; YOLO26 is called to detect damage regions frame by frame and output bounding box pixel coordinates and confidence; the calibration coefficient is used to automatically convert the results into millimeter-level damage length and width, and abnormal detection points are filtered out; finally, visualized images with annotation boxes and CSV data tables storing damage size, time and confidence are output synchronously.
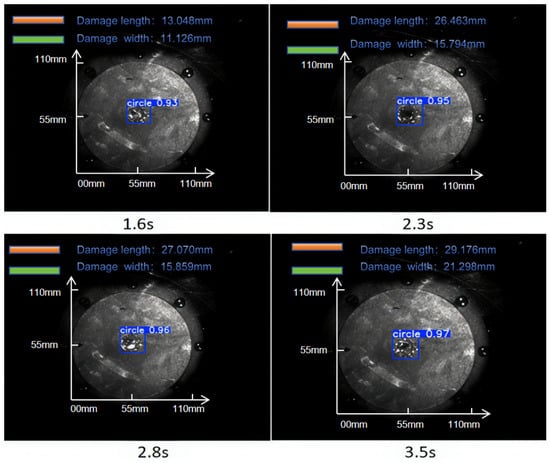
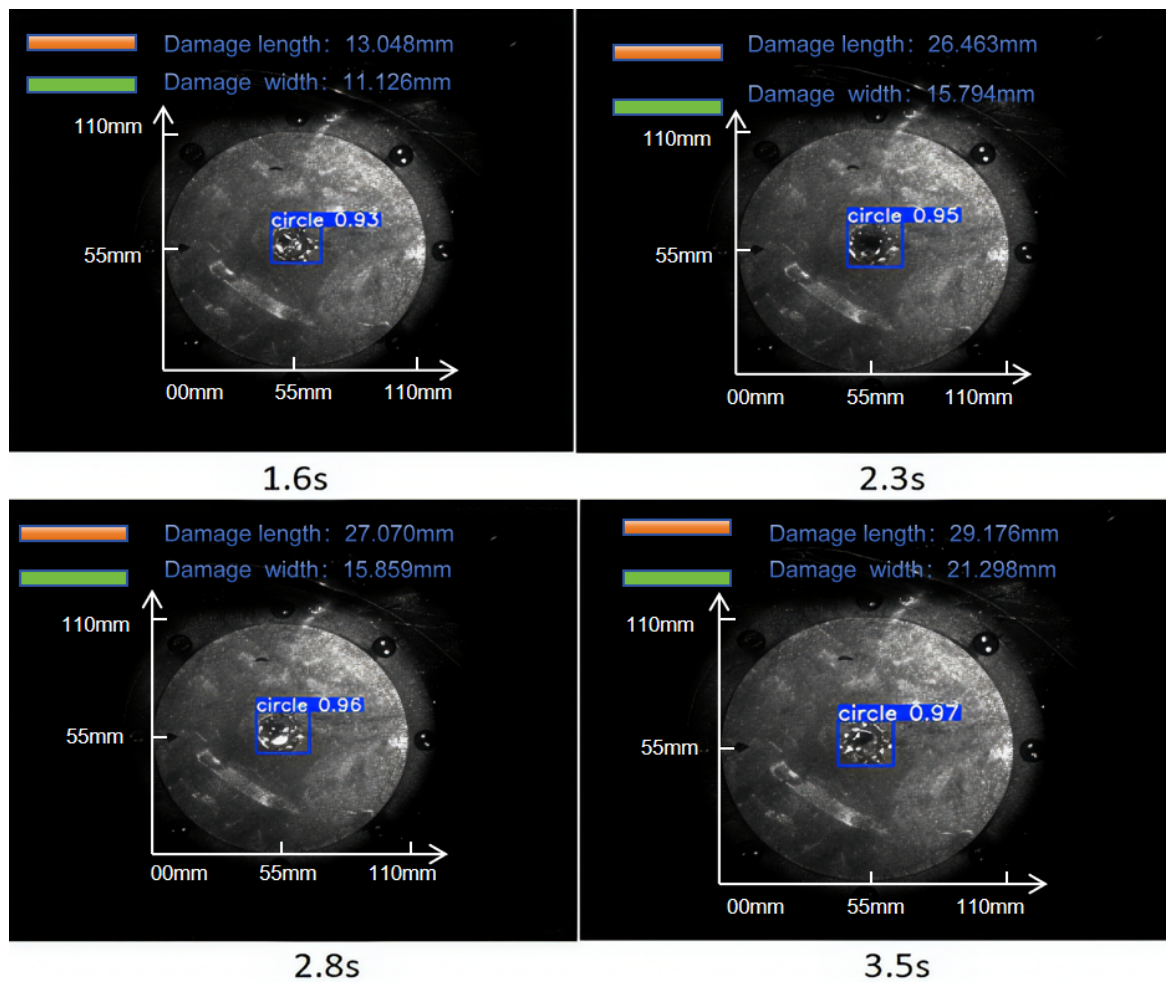
A complete set of laser–airflow coupled tests collects time-series image frames from 0 to 9.9 s, generating 99 frames at equal intervals of 0.1 s. In the early stage of the test, the molten spot size is tiny and the image signal-to-noise ratio is low. Within the interval of 1.6–5.0 s, the molten pool contour is clear and the imaging is stable. Theoretically, 24 frames can be collected in this interval. After filtering with the confidence threshold, 7 abnormal samples caused by strong reflection and aerosol occlusion are removed, and 17 groups of effective quantitative samples are finally obtained. This paper adopts an automatic confidence threshold filtering strategy, marking frames with detection confidence lower than 0.5 as invalid samples and removing them. The selection of this threshold is based on statistical analysis of bounding box localization accuracy: when the confidence is lower than 0.5, the localization deviation increases significantly. Among the 24 frames in the effective interval of 1.6–5.0 s, 7 frames are removed by threshold filtering (mainly due to strong reflection saturation and aerosol occlusion), and 17 effective samples are retained, with a discard rate of approximately 29.2%. It should be noted that the discarded frames are concentrated at moments with severe reflection and aerosol interference, where the damage boundaries are also difficult to accurately identify by manual visual inspection. Therefore, the filtering operation mainly removes measurement samples that are inherently unreliable, rather than random discarding, and the risk of introducing selection bias is low. Four irradiation moments of 1.6 s, 2.3 s, 2.8 s and 3.5 s under an airflow velocity of 510 m/s are randomly selected to output annotated images, intuitively demonstrating the model recognition effect. The detection and annotation results of key frames in the time-series images are shown in Figure 6.
Figure 6.
Visualization results of target detection for target damage at different irradiation moments.
It can be seen from the labeled images that the model uniformly identifies the laser ablation molten pool as the “damage area” category, and the blue prediction box can well enclose the actual outer contour of damage, with reliable target positioning. Statistical analysis is carried out on all quantitative results in the effective detection interval (not limited to the example images in Figure 6): the damage length distribution ranges from 12.0 to 30.078 mm, and the damage width distribution ranges from 11.106 to 28.291 mm; the average detection confidence of all quantitative frames in the effective quantitative interval is 0.573, mainly because the interval covers the early and late stages of damage evolution—the early molten spot is tiny and the edge is blurred, and the later melt splashing causes boundary distortion, both leading to low detection confidence in some frames; after automatic threshold filtering and manual review, 17 effective samples are retained, with an average confidence of 0.93–0.97, and the highest detection confidence is 0.97. Figure 6 shows the detection results at four representative moments: 1.6 s, 2.3 s, 2.8 s and 3.5 s.
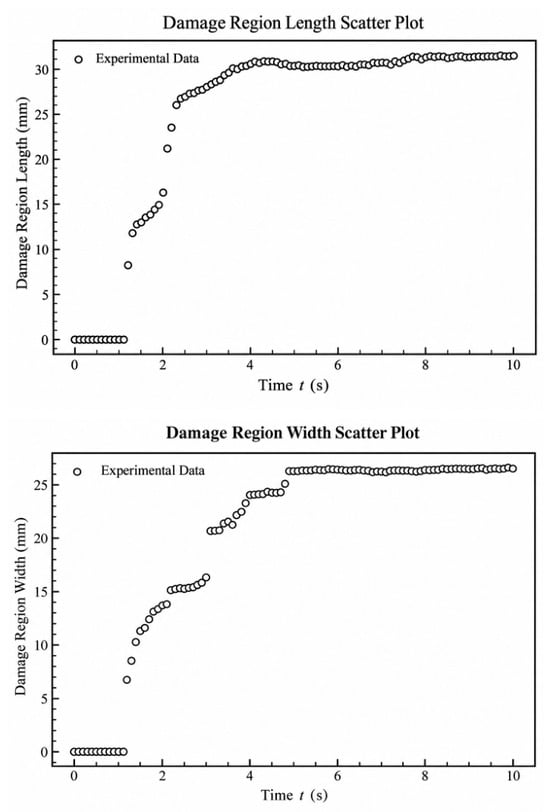
Based on effective time-series quantitative samples, the scatter plots of damage length and damage width under the working condition of 510 m/s are simultaneously plotted, as shown in Figure 7.
Figure 7.
Scatter plot of damage size.
From the image trend and the composition change characteristics of the damage center area, it can be inferred that the damage length and width in the interval of 1.6–5.0 s show a stepwise rapid rise, with obvious jumps near 1.6 s and 2.5 s. In this stage, laser melting plays a dominant role, and tangential airflow drags the molten metal to spread, promoting continuous expansion of damage size. After 4.0 s, the growth of damage size slows down significantly and gradually tends to saturation. It is inferred that the convective cooling and melt stripping effects of high-speed airflow gradually take the advantage, causing the liquid boundary of the molten pool to solidify rapidly and the surface melt to splash away from the target. This inference is mainly based on the following indirect evidence: first, the temporal variation of damage length and width presents a typical “latency–step expansion–slow saturation” characteristic; second, previous microscopic characterization results show that with the increase in airflow velocity, the aluminum content in the damage center area decreases from 78.70 wt% to 61.08 wt% (indicating that material is continuously stripped away), while the oxygen content increases from 7.46 wt% to 12.44 wt% (indicating that airflow enhances oxygen transport and oxidation reaction) [23]. The time-series CSV data output by the processing program do not need manual secondary correction and can be directly imported into the genetic algorithm module to complete global parameter identification under multiple working conditions; the program internally adopts a confidence threshold automatic filtering mechanism to eliminate frames with blurred boundaries or abnormal detection, reducing subsequent modeling errors. It should be noted that, limited by experimental conditions, this paper does not directly measure the target temperature field and flow field under tangential airflow. The above mechanism explanation is a reasonable inference based on indirect evidence such as temporal morphology and composition characterization of the damage center area and still needs to be verified by direct observation of thermal–fluid fields in the future.
3. Intelligent Identification Method of Damage Area Based on YOLO26
3.1. Network Structure and Size Extraction Process
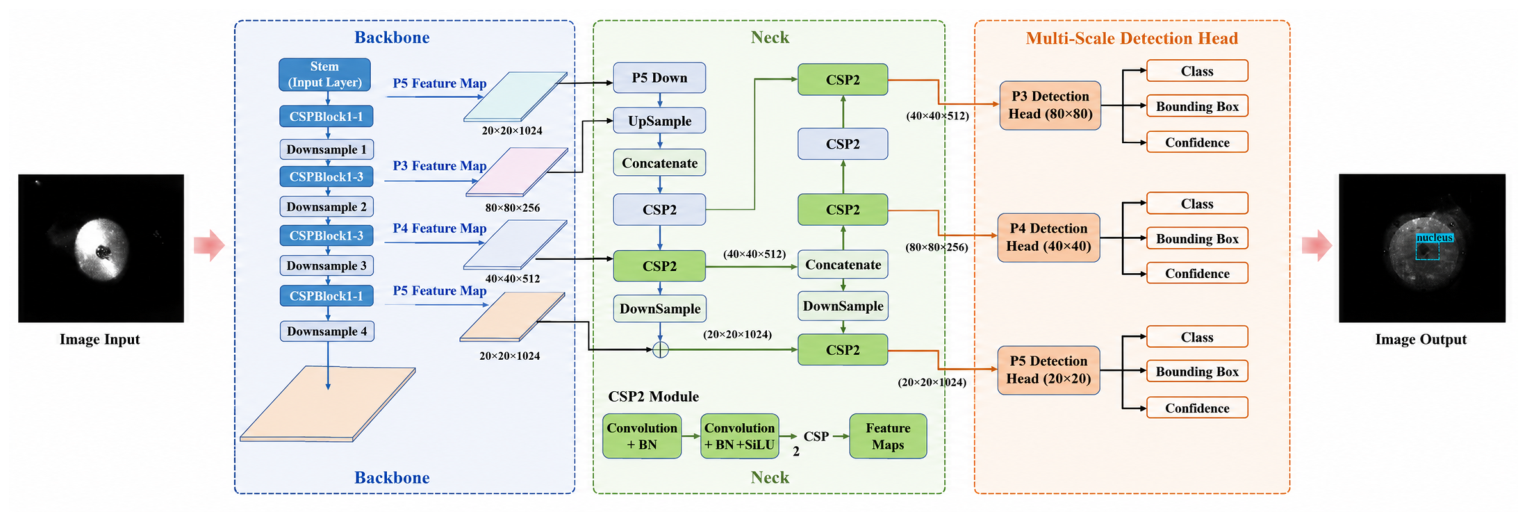
Based on YOLO26 released by Ultralytics [22], the medium-scale detection network YOLO26-M is adopted, and the overall network architecture is shown in Figure 8.
Figure 8.
Structure diagram of YOLO26-M target damage detection network.
The network is divided into three major modules: backbone, bidirectional feature fusion neck and three-layer multi-scale detection head. The backbone adopts reparameterizable RepCSP modules for layered downsampling, outputting three layers of multi-scale features P3(80 × 80), P4(40 × 40) and P5(20 × 20) [22]; the neck adopts a BiC bidirectional fusion structure, fusing shallow edge details and deep global semantics through upsampling and downsampling branches; the three-layer detection heads are, respectively, matched with tiny molten spots, medium ablation pits and large-area molten corrosion areas and output target category, bounding box coordinates and confidence in parallel.
Intersection over union calculation formula:
where is the network predicted damage box; is the manual labeled ground truth box. An threshold of 0.5 is used for mAP@0.5 calculation, and the mean over the interval 0.5–0.95 is used for mAP@0.5:0.95 calculation. Both are used for model accuracy evaluation. YOLO26 adopts a two-head end-to-end training mechanism, and the total loss is dynamically weighted and fused by one-to-many dense branch loss and one-to-one inference branch loss through a progressive loss strategy:
is the one-to-many dense branch loss, is the one-to-one inference branch loss, and the weight coefficient decays linearly with training epochs. Both branches include classification loss , confidence loss and bounding box regression loss. YOLO26 removes the traditional DFL module, and the bounding box adopts direct scalar L1 regression without regression range limitation, which can improve the positioning accuracy of large-scale and irregular molten pool targets.
Activation function SiLU [24]:
The batch recognition, size conversion and time-series data export of damage images are uniformly completed by the visual interactive program described in Section 2.3. The program integrates batch image import, model loading inference, damage box visual rendering, pixel–physical size conversion and time-series data export functions. It can synchronously display original damage images, labeled and predicted damage rectangular boxes and real-time calculated pixel length and width of damage, eliminating repetitive operations of manual reading and recording.
Let the horizontal pixel length of the detection box be , the vertical pixel width be and the spatial calibration coefficient of the high-speed camera image be k (unit: mm/pixel). According to the mapping relationship between pixel scale and actual physical scale, the true length and width of the damage area can be expressed as:
Relying on the pixel–physical scale conversion relationship of Equation (4), combined with the YOLO26 detection network and self-developed visualization tools, the automatic batch output of time-series damage size can be completed, providing standardized datasets for inversion modeling and standardized high-precision time-series datasets for analysis of damage evolution laws under multi-Mach working conditions and parameter fitting of piecewise exponential inversion models.
In summary, this paper uses rectangular detection boxes to characterize the damage area size mainly based on the following considerations: in engineering rapid evaluation scenarios, the length and width of the circumscribed rectangle of damage are effective simplified indicators for measuring the spatial scale of damage; the YOLO series network natively outputs rectangular bounding boxes without an additional segmentation head, and the inference efficiency is higher, which can meet the needs of batch time-series processing. Although the molten pool morphology is irregular, the horizontal and vertical spans of the rectangular box can reflect the maximum extension size of damage in two orthogonal directions and are comparable to the “maximum length” and “maximum width” measured by manual calipers. The damage length and damage width are defined as the maximum spans of the detection box in the horizontal and vertical directions of the image (see the annotation box in Figure 6), respectively, to characterize the spatial extension of the damage area in two orthogonal directions. To verify the accuracy of rectangular box measurement, 50 frames are randomly selected from the test set, and the rectangular box size output by YOLO is compared with the manually labeled circumscribed rectangle size. The average absolute deviations in length and width are 0.82 mm and 0.67 mm, respectively. It should be pointed out that instance segmentation can obtain finer damage contours, but its annotation cost and inference time are significantly higher than those of object detection; considering the efficiency and economy in engineering applications, the object detection method based on YOLO is still a more feasible technical approach for batch time-series damage quantification.
3.2. Comparison of Models with Different Network Depths
To analyze the influence of network complexity on recognition performance and inference efficiency, three types of models with low, medium and high network depths are trained respectively, and precision, mean average precision (mAP) and single-image prediction time are adopted as evaluation indicators. The results are shown in Table 1. Model training and inference are completed on a fixed computing platform: Model training and inference are completed on a fixed computing platform: Intel Xeon Gold 6248 CPU (Intel, Santa Clara, CA, USA) @ 2.50 GHz, NVIDIA Tesla V100 GPU (NVIDIA, Santa Clara, CA, USA) (32 GB memory), CUDA 11.8 (NVIDIA, Santa Clara, CA, USA), PyTorch 2.0.1 (Meta AI, Menlo Park, CA, USA).
Table 1.
Training results of models with different network depths.
With the increase of network depth, detection accuracy and inference time increase synchronously. Comparing the performance of the three types of networks, the low-depth model has the optimal inference speed, but the precision and average precision indicators are low; the high-depth model has a slight lead in detection accuracy, while the single-frame inference time reaches 47.1 ms, with a significant increase in delay compared with the medium-depth model and very limited accuracy gain. From low depth to medium depth, the precision increases by 0.3 percentage points and mAP@0.5:0.95 increases by 0.6 percentage points, while the inference time only increases by 7.8 ms; from medium depth to high depth, both precision and mAP@0.5:0.95 increase by only 0.1 percentage points, while the inference time increases by 19.5 ms (an increase of 70.7%), and the number of parameters increases by 124.7%. Considering detection accuracy, inference efficiency and computational resource consumption, the medium-depth model achieves the best balance among the three and is selected as the basic detection model in this paper.
4. Construction of Damage Inversion Model
4.1. Model Form
The evolution law of the target damage area is as follows: in the initial stage, damage has not yet started; in the middle stage, damage accumulates rapidly; in the later stage, under the dominance of a new evolution mechanism, damage continues to grow and gradually tends to stabilize. Based on this law, a piecewise exponential function is used to describe the time-history evolution of damage area variables (length and width). When , , corresponding to the material not yet having observable damage. In the stage , damage is triggered by initial disturbance and grows rapidly, and an exponential approaching form is used to characterize its accumulation process. When , damage enters the second stage, the system continues to evolve on the basis of the previous damage and the exponential growth form is continuously used to characterize subsequent damage expansion. To ensure the physical continuity of the model at the piecewise nodes, the following continuity constraint is imposed: let , that is, the damage size at the damage initiation time is zero (i.e., ). The initial value of the second stage is not determined by independent fitting but is uniquely determined by the function value of the first segment at , that is:
The above continuity constraint is imposed as a hard constraint in the genetic algorithm fitting; is fixed to 0 and does not participate in optimization; is calculated from the parameters of each generation and is not used as an independent fitting parameter. This ensures that is continuous at both and . Furthermore, to reflect the coupling effect of Mach number on the amplitude and rate of damage evolution, an airflow modulation function is introduced:
where is the tangential airflow intensity, and is the influence coefficient of tangential airflow intensity. and are set for the length and width directions, respectively, to reflect the difference in response of damage expansion in different directions to airflow conditions. The piecewise damage evolution model can be expressed as:
All unknown parameters in the established piecewise damage evolution function have clear and definite physical connotations: is the damage initiation time, i.e., the critical time when the material transitions from an undamaged state to damage initiation under external action; represents the transition time when damage evolution enters the second stage from the first stage, used to distinguish damage growth processes under different dominant mechanisms. is the characteristic damage size corresponding to any irradiation time t, which intuitively quantifies the degree of internal damage accumulation of materials; is the damage size at the piecewise critical time and also serves as the initial reference value for damage evolution in the second stage. and are the basic damage growth amplitudes of the first and second stages, respectively, quantitatively characterizing the severity of damage accumulation in the two stages; and are the characteristic time constants corresponding to the evolution of the two segments in turn, which directly determine the expansion rate of damage in each stage. The model introduces the tangential airflow modulation function , which specifically describes the modulation effect of airflow velocity change on damage evolution amplitude and evolution time scale.
The above complete set of parameters jointly constrain the damage initiation threshold, piecewise node of evolution, piecewise growth amplitude and expansion rate, which can completely reproduce the nonlinear evolution law of damage size over time under different Mach airflow working conditions. The complete application process of the model is as follows: after obtaining time-series measured data of target damage under multi-Mach working conditions, the piecewise exponential function is combined with tangential airflow modulation terms to fit the time-series curves of damage length and width synchronously; combined with damage initiation time, piecewise transition time, piecewise growth amplitude, characteristic time constant and tangential airflow intensity, the length and width of damage at any irradiation time can be directly solved, and the differential nonlinear expansion mechanisms of the two stages can be quantitatively distinguished.
4.2. Global Parameter Identification Based on Genetic Algorithm
The piecewise exponential model contains multiple groups of coupled unknown parameters, and its parameter inversion is essentially a nonlinear multi-parameter optimization problem [25]. Traditional local linearization methods rely heavily on initial models and easily make solution estimation fall into local minima of the objective function [26]. In contrast, a genetic algorithm is a nonlinear global optimization algorithm, which can avoid the shortcomings of gradient-based methods and significantly improve the search efficiency of model parameter space. Therefore, a genetic algorithm is adopted in this paper to complete global optimization fitting of model parameters.
In data processing, the time-series curves of damage length and width are fitted separately to solve the corresponding Mach modulation coefficients and , respectively; among them, the modulation term under the no-airflow condition is taken as the benchmark evolution reference to calibrate the basic damage evolution characteristics under no airflow. The Mach correction function is:
Considering the randomness of the genetic algorithm, 30 independent optimizations with different random seeds were carried out for each group of data, and the mean, standard deviation and coefficient of variation (CV) of the fitting parameters were counted to evaluate the stability and repeatability of the parameter identification results. To eliminate the influence of data magnitude differences among different experimental groups on the global parameter identification results, the normalized root mean square error (NRMSE) is used as the fitting error evaluation index for a single group of data. The NRMSE of the j-th group of experimental data is defined as:
where is the number of sample points of the j-th group of data; and are the experimental value and model fitting value at the i-th moment in the j-th group of experiments, respectively; and are the maximum and minimum values of the experimental data in this group, respectively.
On this basis, the weighted average of the NRMSE of all experimental groups participating in parameter identification is used as the fitness function of the genetic algorithm:
The genetic algorithm takes the minimization of the fitness function as the optimization objective:
where m is the total number of datasets participating in parameter identification; is the weight of the j-th group of data.
In terms of algorithm parameter settings, the population size is set to 100, the crossover probability is 0.80, the mutation probability is 0.05, and the maximum number of iterations is 1000. An early stopping criterion is also added: when the relative improvement of the optimal fitness for 100 consecutive generations is less than , the iteration stops. The parameter search boundaries are set according to the physical mechanism: , . The parameter identification results after 30 independent optimizations are shown in Table 2. The mean value of the length-direction modulation coefficient is 6.797235, the standard deviation is 0.785749458, and the coefficient of variation is 11.55984%. The mean value of the width-direction modulation coefficient is 19.39503, the standard deviation is 0.385232437 and the coefficient of variation is only 1.986243%. It can be seen that the parameter identification results in the width direction having extremely high stability, while the stability in the length direction is slightly lower but still within an acceptable range, indicating that the algorithm has good global convergence and result repeatability.
Table 2.
Parameter identification results and stability statistics of the genetic algorithm.
After the iteration process converges, the complete set of parameters such as damage initiation time, piecewise transition time, piecewise growth amplitude, characteristic time constant and Mach modulation coefficient are output, and then the optimal parameters are substituted back into the piecewise evolution model to calculate the relative prediction error, quantitatively evaluating the overall fitting accuracy. It should be pointed out that the above evaluation can only reflect the goodness of fit of the model to known training data and cannot characterize the generalization prediction ability of the model under unknown working conditions. The core identification scheme of the genetic algorithm in this section is summarized in Table 3.
Table 3.
Core settings of genetic algorithm parameter identification.
5. Results and Discussion
5.1. Influence of Tangential Airflow Intensity on Damage Evolution
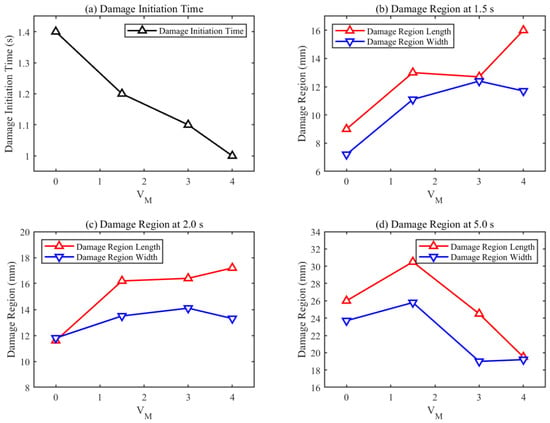
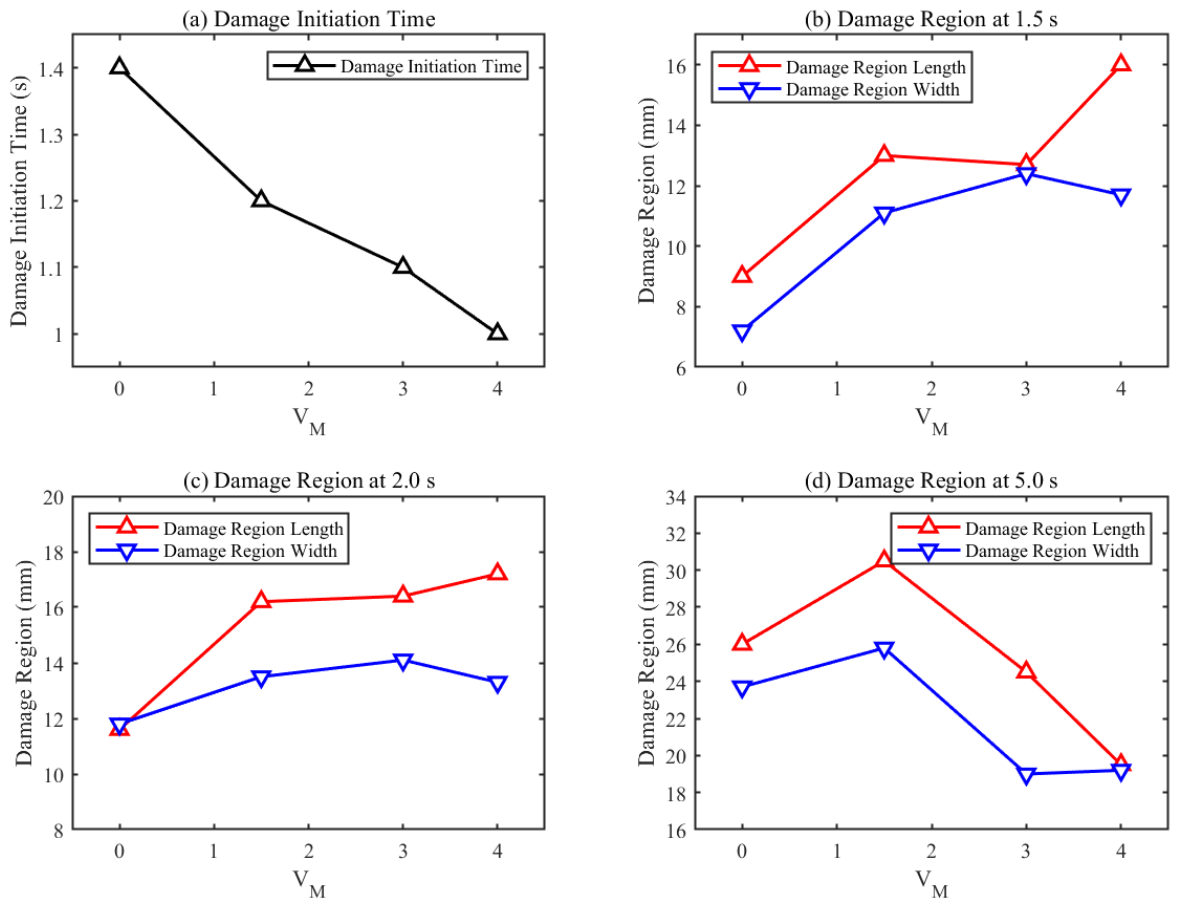
Different tangential airflow intensities synchronously regulate damage initiation time and full-cycle expansion rate through dual competitive effects of airflow shear melting enhancement and convective cooling inhibition [8,11]. The summary of damage sizes at typical moments under multiple working conditions is shown in Figure 9.
Figure 9.
Comparison of damage initiation and size at typical moments under different tangential airflow intensities.
From the perspective of damage initiation time, with the increase in tangential airflow intensity, the nonzero time of damage length and width is advanced as a whole: damage appears at about 1.4 s under the no-airflow condition, about 1.2 s under low-speed airflow, about 1.1 s under medium-speed airflow and about 1.0 s under high-speed airflow. It indicates that higher-velocity airflow can trigger surface material failure earlier.
However, damage expansion does not increase monotonically with tangential airflow intensity. The length expansion under the high-speed airflow condition is faster in the early stage, while the low-speed airflow condition shows stronger continuous expansion ability after entering 3 to 5 s. At 5.0 s, the damage lengths are about 25.740 mm for no-airflow, 30.433 mm for low-speed airflow, 24.708 mm for medium-speed airflow and 19.134 mm for high-speed airflow; the widths are about 24.073 mm, 26.268 mm, 19.248 mm and 19.659 mm, respectively. The results show that moderate airflow may be more conducive to the coupling of thermal action and aerodynamic action, while stripping and carrying effect of materials under excessively high-intensity airflow may inhibit continuous expansion in the later stage. It should be particularly noted that the quantitative fitting and verification interval of this model is strictly limited to 1.6–5.0 s. The damage initiation time of 1.0–1.6 s does not come from the quantitative detection results of YOLO26. The damage initiation time is based on the first visible melting sign on the target surface in the original high-speed camera images, independently judged by visual inspection by experimenters and averaged. It is used as a qualitative criterion and does not participate in the parameter fitting of the piecewise exponential model, nor is it used as an evaluation basis for model prediction accuracy.
5.2. Fitting Results of Inversion Model
To quantitatively verify the fitting accuracy of the piecewise exponential model with tangential airflow modulation term for damage time series under different working conditions, the measured time-series data of damage length and width under each working condition are substituted into the model, a genetic algorithm is adopted to complete unified global parameter identification and the maximum relative error, mean relative error, root mean square error (RMSE), mean absolute error (MAE) and coefficient of determination () corresponding to damage length and width of each group are calculated. The statistical results are shown in Table 4.
Table 4.
Error statistics of damage inversion model under different working conditions.
From the error data in Table 4, the following conclusions can be drawn: first, the mean relative errors of damage length and width under all working conditions are lower than 2.1%, the RMSE is less than 0.7 mm, the MAE is less than 0.52 mm and the values are all above 0.994, indicating that the model predictions are in excellent agreement with the measured values within the tested working conditions, fully meeting the deviation constraint indicators for damage prediction under this experimental condition; second, the error shows an overall downward trend with the increase in tangential airflow intensity. The length error under the no-airflow condition reaches the peak of 16.92% in the whole group, which is rooted in the unoriented flow of molten melt without airflow constraint, gentle grayscale transition of ablation boundary and irregular contour, introducing additional quantification deviation in the image detection link; while high-speed airflow can strip molten pool melt directionally, the damage boundary is clear and regular, and the maximum relative errors of length and width are only 4.97% and 7.20%, with the optimal model matching effect.
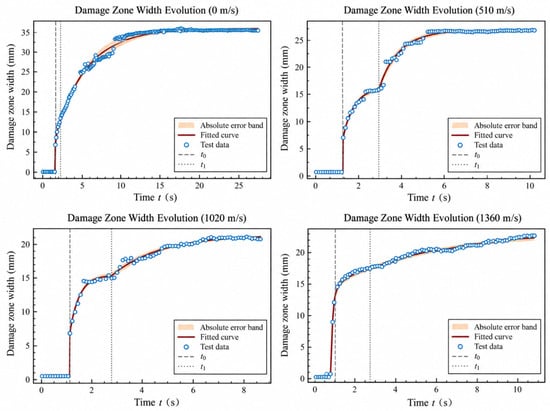
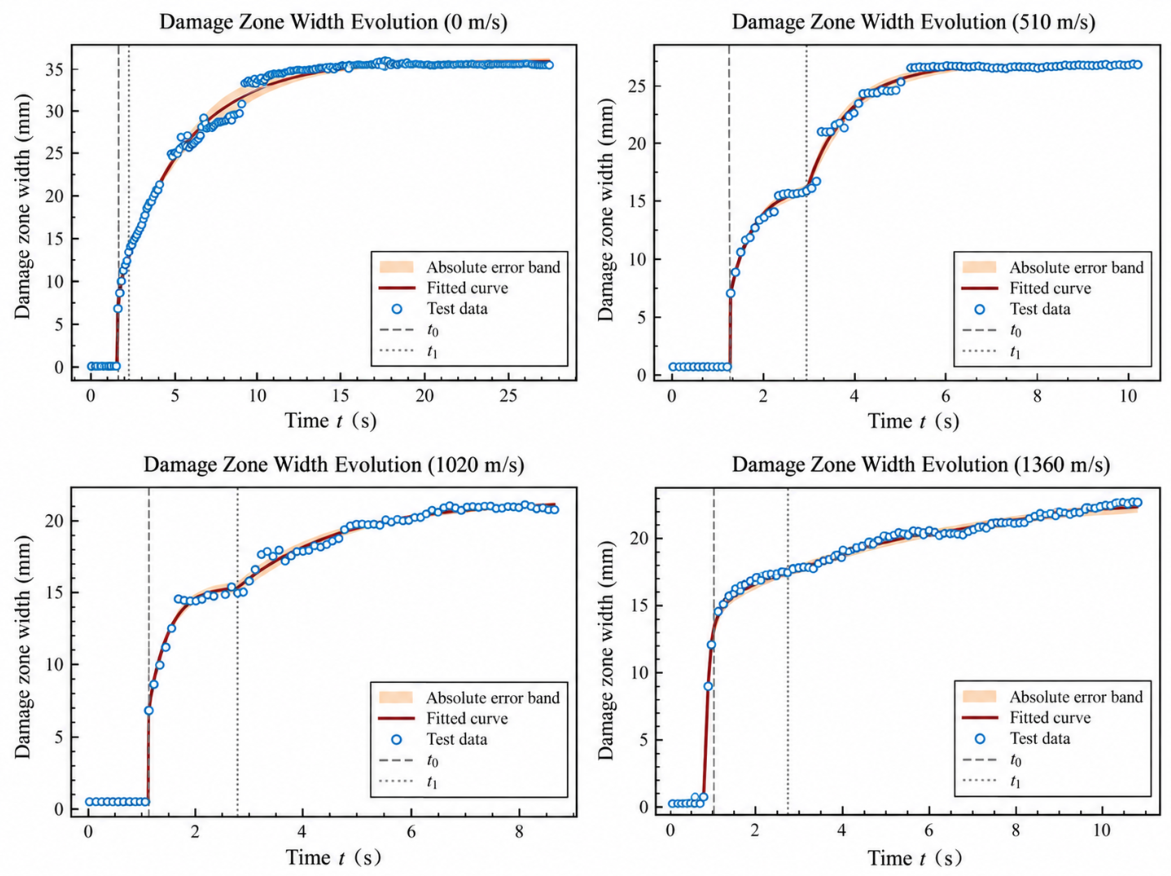
It can be intuitively observed from the time-series curves in Figure 10 that the piecewise exponential model can accurately reproduce the three-stage evolution characteristics of damage “latency—rapid expansion—slow saturation”. In the damage initiation stage, the model can accurately capture the critical starting time ; in the medium-term rapid expansion interval, the fitting curve highly overlaps with the measured scatter points; after entering the later saturation stage, the exponential convergence trend of the model is completely consistent with the law of slowing growth of experimental data. Meanwhile, the width of absolute error bands at all moments is maintained in a small range, and only a small number of data points in the middle and later stages of the no-airflow condition have slightly large deviation, which is mutually confirmed with the error statistical law in Table 4.
Figure 10.
Fitting results of representative damage evolution.
Combining the error statistics and time-series fitting curves, it can be confirmed that the piecewise exponential model with quadratic tangential airflow modulation term has extremely high fitting goodness within the four covered airflow working conditions, can uniformly describe the time-series evolution laws of damage length and width of aluminum alloy under full-gradient tangential airflow conditions and can support the time-series prediction requirements of laser damage in a high-speed airflow environment. It should be noted that the above evaluation is mainly based on the statistical results of fitting parameters back-substituted into the same dataset, reflecting the fitting ability of the model to this batch of known experimental data, and does not mean that the model has extrapolation prediction ability for untested airflow conditions.
To further clarify the positioning of the method in this paper, the results are compared and discussed with existing related research: in terms of detection accuracy, the mAP@0.5:0.95 of the YOLO26 model in this paper is 0.966, which is superior to traditional grayscale threshold segmentation methods on the same dataset, and the single-frame inference time of 27.6 ms can meet the needs of batch time-series processing; in terms of damage evolution trend, the observed phenomenon of “high-speed airflow advancing initiation but inhibiting later expansion” is qualitatively consistent with the observation results of Ma et al. [11] in a high-speed wind tunnel, and this paper further provides a quantitative description through the piecewise exponential model; in terms of prediction error, the mean relative errors in the length and width directions within the effective quantitative interval are both lower than 2.1% (maximum relative errors are 16.92% and 9.61%, respectively), which can provide a quantitative reference for similar damage time-series modeling; in terms of airflow influence, the nonmonotonic regulation law revealed in this paper refines the conclusion of Yuan Chun et al. [18] that “airflow condition is the core variable of damage expansion rate” and clarifies the differentiated action mechanism in different airflow intensity intervals.
6. Research Conclusions and Analysis
This paper constructs an integrated analysis framework combining YOLO26 real-time detection and a piecewise exponential time-series model, realizes automatic extraction and unified modeling of laser damage length and width of 7075 aluminum alloy under tangential airflow and uses a genetic algorithm to complete global parameter identification. The medium-depth YOLO26 achieves a balance between detection accuracy and inference speed, with precision of 0.984, mAP = 0.966 and single-frame inference time of 27.6 ms. The quantitative fitting and verification of this paper are strictly limited to the effective quantitative interval of 1.6–5.0 s. Within this interval, the model performs global fitting for the damage length and width of four airflow working conditions. The maximum relative errors are 16.92% and 9.61%, respectively, the mean relative errors are both lower than 2.1%, the RMSE is less than 0.7 mm, the MAE is less than 0.52 mm and the values are all above 0.994, indicating that the model has high fitting accuracy within the measured working conditions. The research shows that high-speed airflow can advance damage initiation and accelerate initial expansion, but convective cooling and melt stripping effects inhibit continuous growth in the later stage; low-speed airflow shows stronger continuous expansion ability in the later stage of irradiation, revealing the nonmonotonic regulation mechanism of airflow on damage evolution. The piecewise exponential model with a quadratic tangential airflow modulation term can well describe the three-stage nonlinear law of damage “initiation–expansion–stabilization”. It should be pointed out that the damage size at the initiation time of 1.0–1.6 s comes from manual visual interpretation and is only used for qualitative trend comparison, not participating in model fitting and accuracy evaluation; the model in this paper is mainly constructed and evaluated based on a small number of measured working conditions, and its parameter identification and error statistics are completed within the measured working conditions. In the future, more working conditions will be tested to further verify the extrapolation prediction ability of the model.
Author Contributions
Writing—original draft: P.G. and X.J.; Writing—review and editing: P.G. and S.H.; Data curation: S.H.; Supervision: Y.M. All authors have read and agreed to the published version of the manuscript.
Funding
This research received no external funding.
Data Availability Statement
Dataset available on request from the authors.
Conflicts of Interest
The authors declare no conflict of interest.
References
- Svelto, O. Principles of Lasers, 5th ed.; Springer: New York, NY, USA, 2010. [Google Scholar] [CrossRef] [Scilit]
- Steen, W.M.; Mazumder, J. Laser Material Processing, 4th ed.; Springer: London, UK, 2010. [Google Scholar] [CrossRef] [Scilit]
- Ready, J.F. Effects of High-Power Laser Radiation; Academic Press: Cambridge, MA, USA, 1971. [Google Scholar]
- Wei, C.H.; Zhu, Y.X.; Zhou, M.L.; Ma, Z.L.; Wu, T.T. Melt removal mechanism by transverse gas flow during laser irradiation. In Proceedings of SPIE Defense+Commercial Sensing; SPIE: Anaheim, CA, USA; Volume 10173. [CrossRef] [Scilit]
- Zhang, L.; Li, M.; Tan, F.; Zhang, Y.; He, J.; Zhao, J. Numerical simulation of laser-heated metal plates under high-speed airflow. High Power Laser Part. Beams 2015, 27, 86–90. [Google Scholar] [CrossRef]
- Liu, F.; Peng, G.; Du, T.; Zheng, Y.; Yan, H. Influence of tangential airflow on non-melting perforation effect of laser-heated metal plates. Chin. Opt. 2013, 6, 332–338. [Google Scholar] [CrossRef] [Scilit]
- Liu, X.; Wei, C.; Huang, S.; Lu, F. Laser ablation behavior at different spatial positions under subsonic airflow. Trans. China Weld. Inst. 2025, 46, 10–18. [Google Scholar] [CrossRef]
- Huang, Y.; Song, H.; Huang, C. Numerical simulation of target failure induced by high-power laser irradiation under supersonic airflow. High Power Laser Part. Beams 2013, 25, 2229–2234. [Google Scholar] [CrossRef] [Scilit]
- Redmon, J.; Divvala, S.; Girshick, R.; Farhadi, A. You Only Look Once: Unified, Real-Time Object Detection. In Proceedings of the IEEE Conference on Computer Vision and Pattern Recognition; IEEE: Las Vegas, NV, USA, 2016; pp. 779–788. [Google Scholar] [CrossRef] [Scilit]
- Pietzsch, S.; Dybeck, J.L.; Roth, M.; Grimm, P.; Schmitz, B. Can one model do it all? Segmenting surface damage and radiochromic films with YOLO in high-power laser applications. J. Image Video Process. 2026, 2026, 12. [Google Scholar] [CrossRef] [Scilit]
- Ma, T.; Wang, J.; Yuan, W.; Song, H.; Wang, R. Study on transient failure behavior induced by high-power laser in high-speed wind tunnel based on high-temperature in-situ observation. Chin. J. Lasers 2023, 50, 1602201. [Google Scholar] [CrossRef] [Scilit]
- Wang, R.X.; Yuan, W. Instantaneous Ablation Behavior of Laminated CFRP by High-Power Continuous-Wave Laser Irradiation in Supersonic Wind Tunnel. Materials 2023, 16, 790. [Google Scholar] [CrossRef] [Scilit]
- Ben Soltane, I.; Hallo, G.; Lacombe, C.; Lamaignère, L.; Bonod, N.; Néauport, J. Estimating and monitoring laser-induced damage size on glass windows with a deep-learning-based pipeline. J. Opt. Soc. Am. A 2022, 39, 1881. [Google Scholar] [CrossRef] [Scilit]
- Negres, R.A.; Norton, M.A.; Cross, D.A.; Carr, C.W. Growth behavior of laser-induced damage on fused silica optics under UV, ns laser irradiation. Opt. Express 2010, 18, 19966–19976. [Google Scholar] [CrossRef] [Scilit]
- Peng, G.; Wei, C.; Du, T.; Zhang, X. Study on laser melt-through effect of metal plates under airflow action. Laser Optoelectron. Prog. 2016, 53, 061408. [Google Scholar] [CrossRef] [Scilit]
- Zhang, X.; Li, Z.; Zhou, Y.; Shen, Z. Perforation effect of continuous laser irradiation on aluminum alloy under subsonic airflow. Infrared Laser Eng. 2022, 51, 126–135. [Google Scholar] [CrossRef] [Scilit]
- Zhang, J.; Liu, G.; Wang, W.; Liu, C. Numerical simulation of thermal ablation of carbon fiber reinforced composites irradiated by laser. High Power Laser Part. Beams 2013, 25, 1888–1892. [Google Scholar] [CrossRef] [Scilit]
- Yuan, C.; Jiang, H.M.; Zhao, G.M. 45# steel interaction with DF laser beam in different gas flow. High Power Laser Part. Beams 2015, 27, 041011. [Google Scholar] [CrossRef] [Scilit]
- Zhang, J.; Ma, Z.; Feng, G.; He, M.; Liu, W.; Wei, C. Influence of tangential air flow velocity on laser ablation heat of glass fiber reinforced resin matrix composites. Chin. J. Lasers 2015, 42, 0306004. [Google Scholar] [CrossRef] [Scilit]
- Chen, G.; Tang, J.; Zhou, Y.; Pan, Y.; Zhang, H.; Li, Z.; Shen, Z.; Lu, J. Perforation effect of continuous laser on glass fiber reinforced resin matrix composites under subsonic tangential airflow. Chin. J. Lasers 2023, 50, 1401002. [Google Scholar] [CrossRef] [Scilit]
- Xia, G. 7075 Aluminum: Properties, Composition and Applications of This High-Strength Aerospace Alloy[EB/OL]. 18 September 2025. Available online: https://www.rapid-protos.com/7075-aluminum-properties-composition-and-applications-of-this-high-strength-aerospace-alloy (accessed on 14 September 2026).
- Jocher, G.; Qiu, J.; Liu, M.; Lyu, S.; Akyon, F.C.; Kalfaoglu, M.E. Ultralytics YOLO26: Unified Real-Time End-to-End Vision Models. arXiv 2026, arXiv:2606.03748. [Google Scholar]
- Hong, S.Z.; Pu, Q.; Jia, X.D.; Cao, X. Study on a Laser-Resistant Coating’s Protective Effect on 7075 Aluminum Alloy. Appl. Sci. 2026, 16, 6312. [Google Scholar] [CrossRef] [Scilit]
- Elfwing, S.; Uchibe, E.; Doya, K. Sigmoid-weighted linear units for neural network function approximation in reinforcement learning. Neural Netw. 2018, 107, 3–11. [Google Scholar] [CrossRef] [Scilit]
- Wei, P.; Zhang, Z.; Han, H. Genetic algorithm for parameter inversion of two-phase media. Acta Mech. Solida Sin. 2002, 23, 459–462. [Google Scholar] [CrossRef]
- Shi, D.; Sun, Y.; Ma, K.; He, D.; Zhang, S. Random search method for parameter estimation of distance observation equations. Beijing Surv. Mapp. 2021, 35, 520–523. [Google Scholar] [CrossRef]

Disclaimer/Publisher’s Note: The statements, opinions and data contained in all publications are solely those of the individual author(s) and contributor(s) and not of MDPI and/or the editor(s). MDPI and/or the editor(s) disclaim responsibility for any injury to people or property resulting from any ideas, methods, instructions or products referred to in the content. |
© 2026 by the authors. Licensee MDPI, Basel, Switzerland. This article is an open access article distributed under the terms and conditions of the Creative Commons Attribution (CC BY) license.