


Abstract
A simple and efficient QuEChERS-HPLC-DAD method was developed and validated for the simultaneous determination of benzoic acid, sorbic acid, and eight parabens in diverse food matrices. The sample preparation procedure was systematically optimized by evaluating the extraction solvent composition, salting-out conditions, and dispersive solid-phase extraction clean-up to achieve satisfactory recoveries while minimizing matrix interferences. Chromatographic separation was accomplished using isocratic elution on a C18 column with dual-wavelength ultraviolet detection, enabling the simultaneous determination of both authorized preservatives and non-authorized parabens within a single analytical run. The validated method exhibited excellent linearity (R2 > 0.996), low to moderate matrix effects (within ±20%), satisfactory recoveries (79–112%), and good precision (RSD < 7.3%), meeting the performance criteria for routine residue analysis. The applicability of the method was demonstrated by analyzing commercial food samples from six food categories. Benzoic acid and sorbic acid were the most frequently detected preservatives, whereas only methylparaben and propylparaben were identified among the investigated parabens. No non-authorized parabens were detected in the analyzed samples. Owing to its simplicity and reliability, the proposed QuEChERS-HPLC-DAD method represents a practical analytical approach for routine multi-matrix monitoring of food preservatives in quality control and food safety laboratories.
1. Introduction
In the modern food industry, chemical preservatives are widely used to inhibit microbial growth, extend shelf-life, and maintain the quality and safety of processed foods [1,2]. Among the authorized preservatives, benzoic acid (BA), sorbic acid (SA), and their corresponding sodium, potassium, and calcium salts are extensively applied because of their broad antimicrobial activity, chemical stability, and cost-effectiveness [2,3,4]. Although these preservatives are generally recognized as safe when used within established regulatory limits, excessive dietary exposure may be associated with adverse health effects, particularly among sensitive individuals [3,4]. To protect consumer health, their use is strictly regulated through maximum permitted levels for specific food categories [5]. Parabens are a group of p-hydroxybenzoic acid esters with well-established antimicrobial properties [6]. They have been widely used as preservatives in cosmetic, pharmaceutical, and personal care products [7]. Under the current Vietnamese food additive regulatory framework, which incorporates relevant Codex provisions, methylparaben (MeP; E218) and ethylparaben (EtP; E214) are recognized as food preservatives and are subject to specified maximum use levels for particular food categories [5,8]. In contrast, propylparaben (PrP; E216) is no longer included among the preservative provisions of the current Codex General Standard for Food Additives (GSFA), while butylparaben (BuP) and the other parabens investigated in this study, including isopropylparaben (iPrP), phenylparaben (PhP), isobutylparaben (iBuP), and benzylparaben (BeP), are not listed as authorized food preservatives in the current GSFA [8]. Nevertheless, these compounds may still be detected in food products as a result of unauthorized use during food processing or, for some parabens, migration from food contact materials such as plastic packaging [9,10,11]. Their occurrence is therefore relevant to food safety and regulatory compliance. Consequently, routine food surveillance requires analytical methods capable of not only quantifying authorized preservatives but also simultaneously screening for non-authorized parabens.
Numerous analytical methods have been reported for the determination of food preservatives, including gas chromatography [12], capillary electrophoresis [13], liquid chromatography equipped with tandem mass spectrometry (LC-MS/MS) [14], and high-performance liquid chromatography coupled with ultraviolet detection (HPLC-UV) [15,16]. Among these techniques, LC-MS/MS offers excellent sensitivity and selectivity but it requires expensive instrumentation, high operating costs and specialized expertise [14]. In contrast, HPLC-UV remains one of the most widely available analytical platforms in routine food testing laboratories because of its robustness, reasonableness and acceptable performance for compounds exhibiting strong ultraviolet absorption. Therefore, HPLC-UV represents a practical and economical option for routine determination of food preservatives, particularly in laboratories where high-throughput analysis is required.
Although numerous chromatographic methods have been developed, simultaneous determination of BA, SA and multiple parabens remains challenging. This is explained by the fact that these compounds possess substantially different physicochemical characteristics. BA and SA are weak organic acids and parabens are relatively hydrophobic neutral compounds. For BA and SA, extraction efficiencies are highly dependent on pH. Consequently, many published methods have focused on either organic acid preservatives [17,18] or parabens [10,11] separately, and only a limited number of studies have attempted to determine both groups within a single analytical procedure [15,19]. Furthermore, conventional extraction techniques, such as liquid–liquid extraction and solid-phase extraction, are generally labor-intensive, require relatively large volumes of organic solvents and are less suitable for routine analysis involving large numbers of samples. QuEChERS (Quick, Easy, Cheap, Effective, Rugged and Safe) has become one of the most widely adopted sample preparation techniques for multi-residue analysis because of its operational simplicity, rapid extraction, low solvent consumption and compatibility with chromatographic methods [20,21,22]. Although QuEChERS has been successfully applied to the determination of pesticides [22,23], veterinary drugs [24] and other organic contaminants, its application to the simultaneous extraction of authorized organic acid preservatives and non-authorized parabens has been relatively limited [20]. Owing to the considerable differences in polarity and acid-base properties between these compounds, optimization of the extraction procedure is essential to achieve satisfactory recoveries while maintaining a simple workflow suitable for routine laboratory implementation.
In Vietnam, routine monitoring programs have mainly focused on regulated food preservatives (i.e., BA and SA), whereas information regarding the occurrence of parabens in commercial food products remains limited. A single analytical method capable of simultaneously determining benzoic acid, sorbic acid and multiple parabens would therefore improve analytical efficiency by enabling both compliance assessment of authorized preservatives and screening of non-authorized compounds in one chromatographic analysis. Such a method would also provide useful data for food safety surveillance and support regulatory authorities in monitoring preservative use in the food supply.
The aim of this study was to develop and validate a modified QuEChERS extraction procedure in combination with HPLC-DAD for the simultaneous determination of benzoic acid, sorbic acid and eight parabens in various food matrices. The extraction procedure and chromatographic conditions were first optimized to obtain satisfactory analytical performance for target analytes with different physicochemical properties. Then, the method was validated according to AOAC guidelines [25] and subsequently applied to commercial food products collected from the Vietnamese market. The proposed method provides a simple, economical and reliable approach for routine food analysis, enabling simultaneous determination of authorized preservatives and screening of non-authorized parabens in a single analytical workflow.
2. Materials and Methods
2.1. Chemicals and Reagents
Analytical standards of BA, SA, MeP, EtP, PrP, iPrP, BuP, iBuP, PhP, and BeP were purchased from Sigma-Aldrich (St. Louis, MO, USA). The purity of benzoic acid was 99.7%, whereas sorbic acid and all parabens exhibited purities above 99%. HPLC-grade acetonitrile (ACN) was supplied by Fisher Scientific (Fair Lawn, NJ, USA). Acetic acid, ammonium acetate, anhydrous magnesium sulfate (MgSO4), and sodium chloride (NaCl) were obtained from Merck (Darmstadt, Germany). Primary secondary amine (PSA) sorbent was purchased from Agilent (Santa Clara, CA, USA). Ultrapure water (18.2 MΩ.cm) was generated using a laboratory water purification system (WG203, Yamato Scientific Co., Ltd., Tokyo, Japan).
Individual stock standard solutions (1000 mg/L) were prepared in acetonitrile and stored at −18 °C. Intermediate mixed standard solutions (100 mg/L) were prepared by appropriate dilution of the stock solutions with acetonitrile. Working calibration standards (0.5, 1, 2, 5 and 10 mg/L) were freshly prepared by diluting the intermediate mixed standard solution with acetonitrile and ultrapure water before analysis.
2.2. Development of Chromatographic Separation
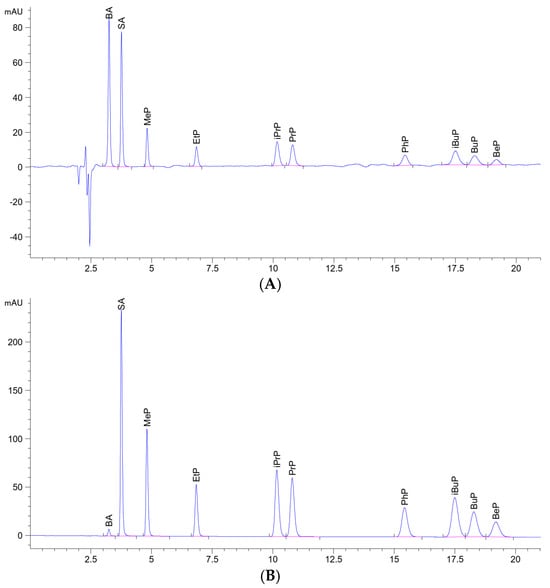
A chromatographic separation method was developed to achieve simultaneous determination of ten preservatives, including two organic acid preservatives and eight parabens, using a conventional HPLC-DAD system. Method development focused on obtaining baseline separation with acceptable chromatographic efficiency while minimizing the overall analysis time. Chromatographic analysis was performed on an Agilent 1220 HPLC system (Agilent Technologies, Santa Clara, CA, USA) equipped with a diode-array detector. Separation was achieved on an Agilent ZORBAX Eclipse Plus C18 column (250 × 4.6 mm i.d., 5 µm; Agilent Technologies, Santa Clara, CA, USA) at 30 °C. The mobile phase consisted of acetonitrile (phase A) and 20 mM acetate buffer (phase B). Separation was carried out under isocratic elution at a flow rate of 1.0 mL/min with a total analysis time of 20 min. The injection volume was 20 μL. Benzoic acid was monitored at 230 nm, whereas sorbic acid and all parabens were detected at 254 nm. The optimized chromatogram is presented in Figure 1.
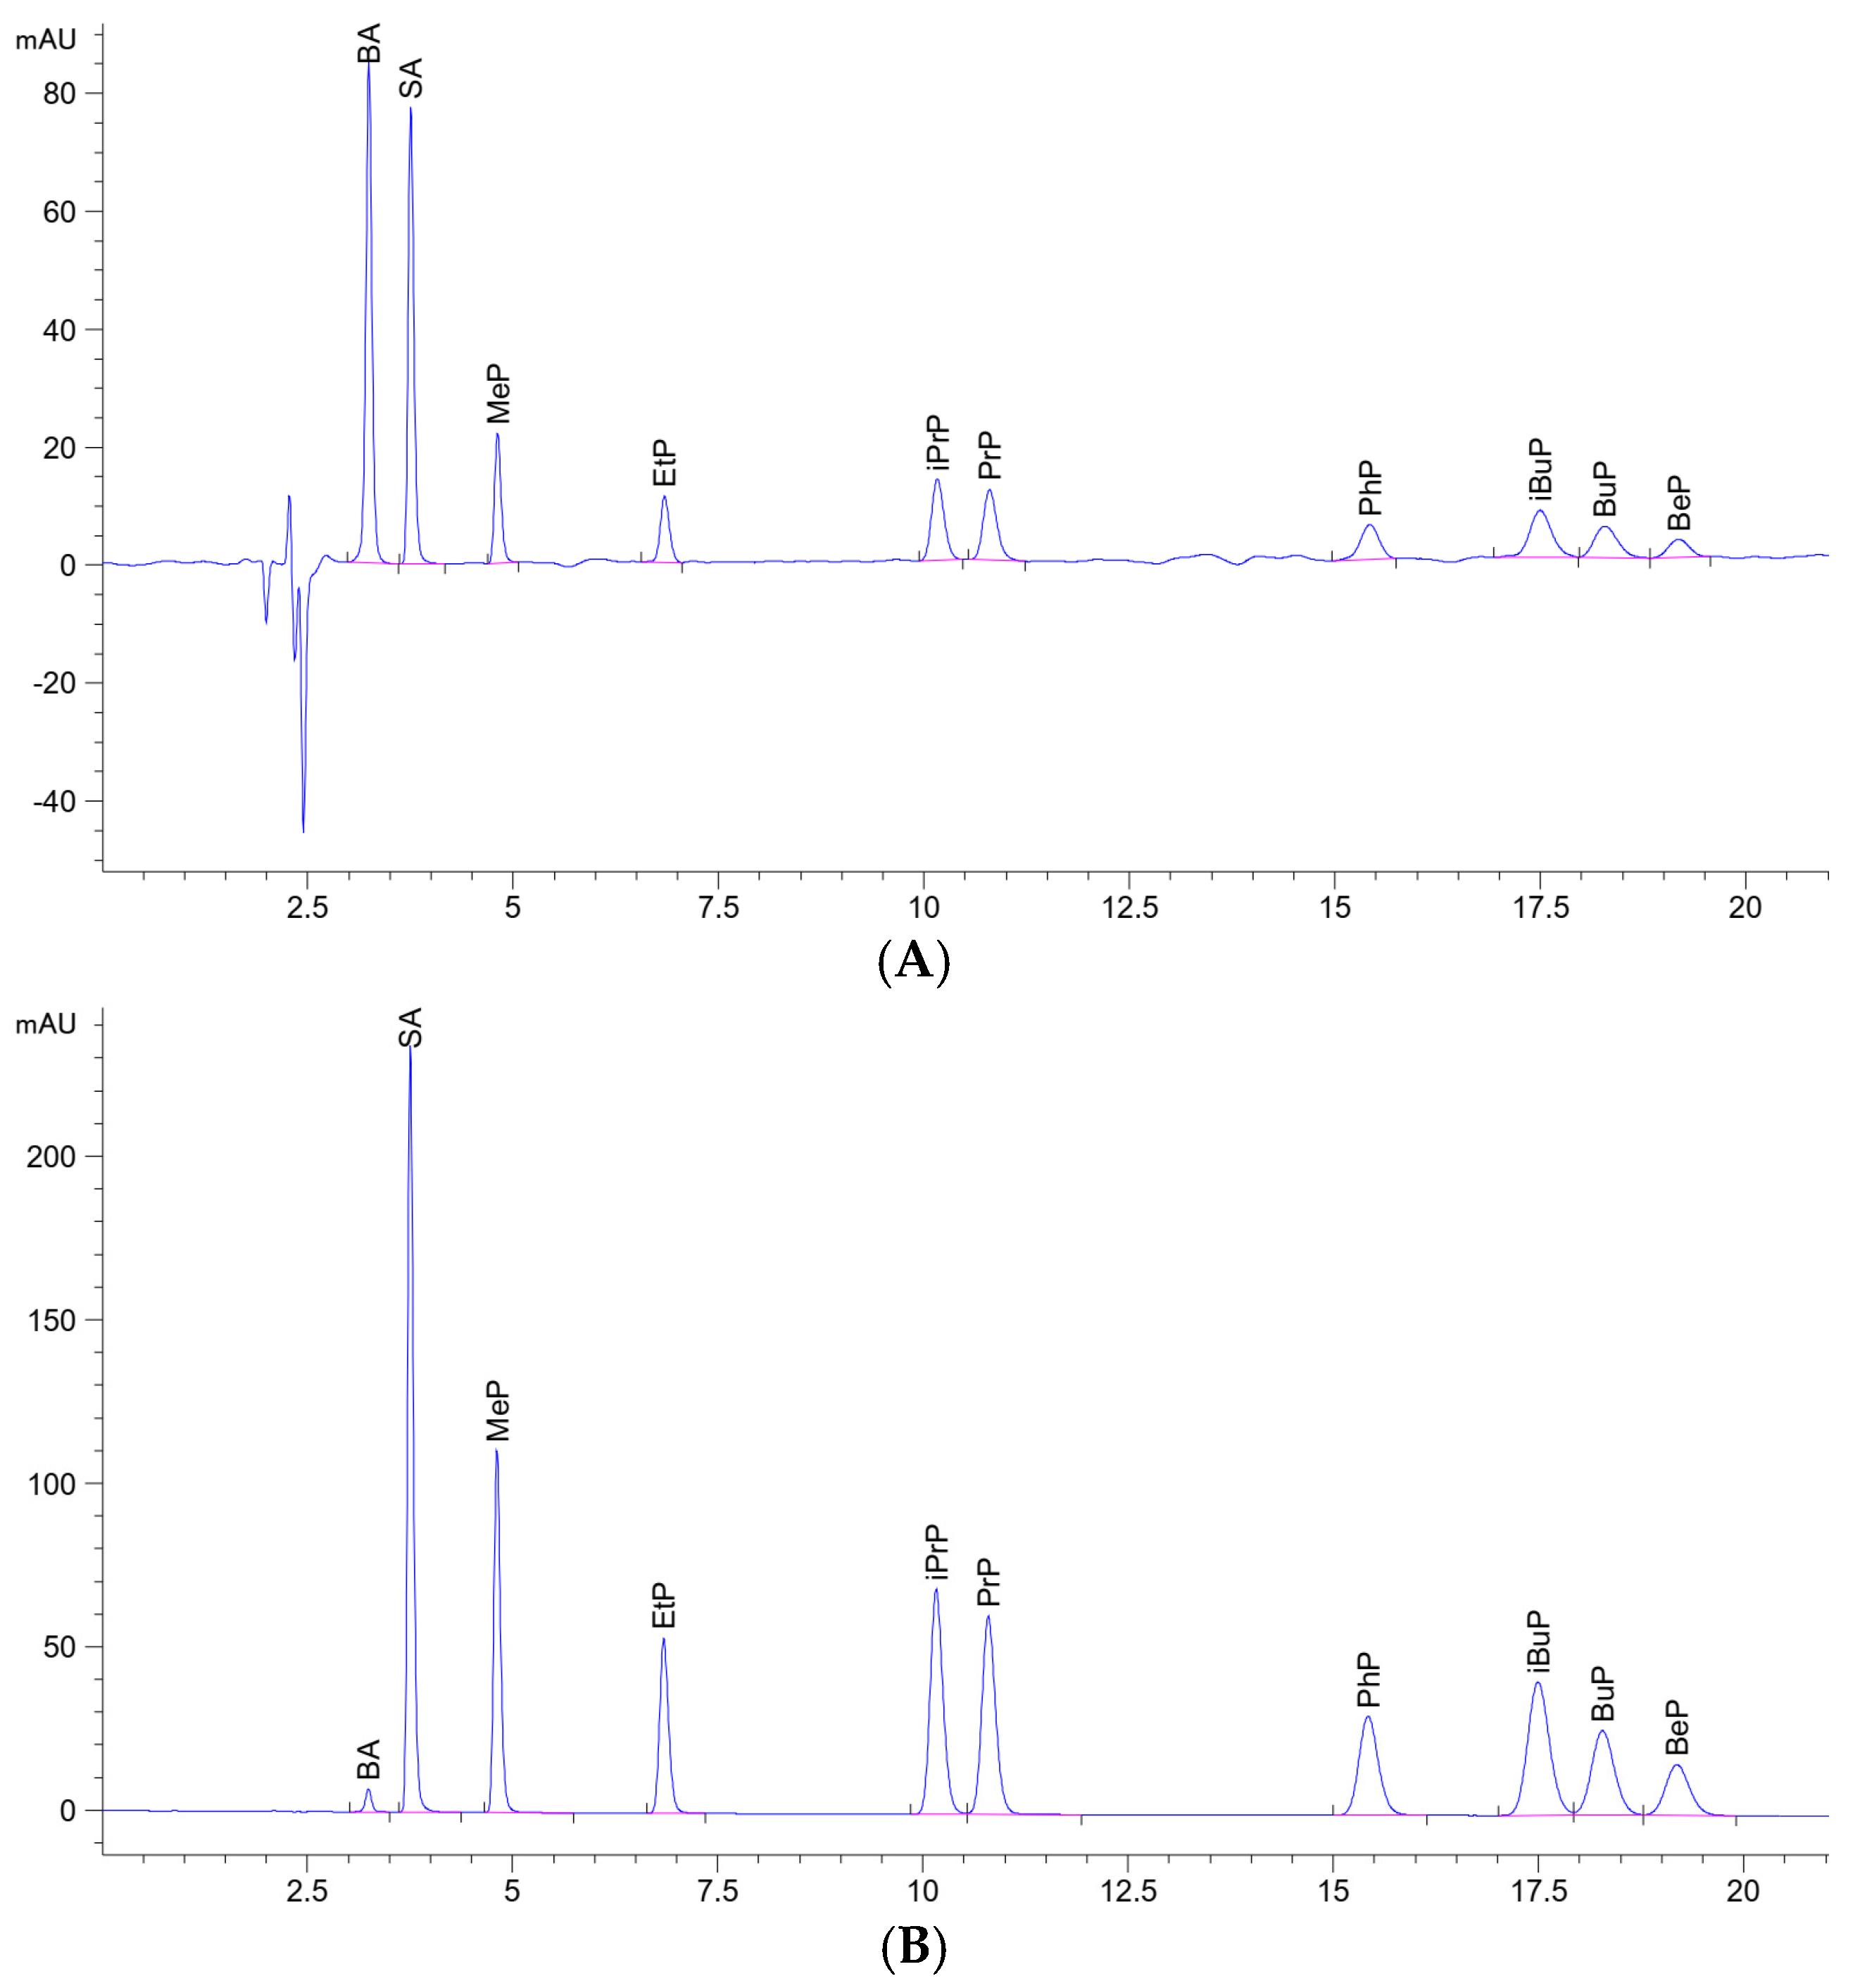
Figure 1.
Typical chromatogram of ten preservatives under optimum conditions at concentration of 5 mg/L. Upper and lower panels were recorded at 230 nm (A) and 254 nm (B), respectively.
Chromatographic conditions were systematically optimized by varying the acetonitrile content of the mobile phase from 30% to 50% (v/v) and adjusting the acetate buffer pH to 3.3, 4.3, and 5.3. The optimum chromatographic conditions were selected based on baseline separation of all analytes, minimum chromatographic resolution (Rs ≥ 1.5) between adjacent peaks, acceptable peak symmetry, and the shortest achievable analysis time.
2.3. Development of the QuEChERS Extraction Procedure
A unified QuEChERS extraction procedure was developed to enable simultaneous extraction of preservatives with substantially different physicochemical properties from various food matrices. The optimization strategy aimed to satisfy analyte recoveries while providing efficient matrix clean-up for routine HPLC-DAD analysis.
Solid food samples were homogenized using a laboratory blender prior to extraction. Carbonated beverages were degassed by ultrasonication for 10 min to remove dissolved carbon dioxide. Approximately 2.0 ± 0.1 g of homogenized sample was transferred into a 50 mL polypropylene centrifuge tube. Subsequently, 5.0 mL of ultrapure water was added and the mixture was vortex-mixed for 1 min. Sample extraction was initiated by adding 50 μL of acetic acid and 5.0 mL of acetonitrile, followed by vortex mixing for 5 min. Phase partitioning was induced by the addition of 3.0 g MgSO4 and 0.5 g NaCl. The extraction tube was immediately vortexed for 1 min and centrifuged at 3150× g for 5 min. An aliquot (1.0 mL) of the upper acetonitrile phase was transferred into a polypropylene tube containing 100 mg MgSO4 and 50 mg PSA for dispersive solid-phase extraction (d-SPE). After vortex mixing for 1 min and centrifugation at 3150× g for 5 min, the purified extract was filtered through a 0.45 μm PTFE membrane filter. To improve chromatographic compatibility with the aqueous mobile phase, 500 μL of the filtrate was mixed with an equal volume of 20 mM acetate buffer (pH 4.3). Finally, 20 μL of the sample solution was injected into the HPLC-DAD system. All experiments were performed in triplicate.
The extraction procedure was systematically optimized by investigating the effects of acetic acid concentration (0–2.0%, v/v), MgSO4 amount (1.0–3.0 g), NaCl amount (0–2.0 g), and PSA amount (0–150 mg). Optimization experiments were conducted using representative food matrices, including soy sauce, milk, soft drinks, dried rice noodles, and pickled vegetables. Blank samples were fortified with the mixed standard solution at concentration of 25 mg/kg and processed according to the proposed extraction procedure. The optimum extraction conditions were selected based on analyte recoveries, extraction reproducibility, and matrix clean-up efficiency.
2.4. Method Validation
The analytical method was validated according to AOAC Appendix F: Guidelines for Standard Method Performance Requirements [25]. Validation parameters included linearity, matrix effect (ME), limits of detection (LOD), limits of quantification (LOQ), accuracy, and repeatability. LOD and LOQ were estimated using the approach described in the International Council for Harmonisation (ICH) Q2 (R2) guideline [26].
2.4.1. Linearity and Matrix Effect
Linearity was evaluated using external calibration curves at five concentration levels ranging from 0.5 to 10.0 mg/L. Calibration curves were established by plotting chromatographic peak area against analyte concentration, and linear regression analysis was performed for each preservative. The coefficient of determination (R2) was used as a measure of the goodness of fit, and the statistical significance of the linear regression was further evaluated by analysis of variance (ANOVA), with p-value < 0.05 considered statistically significant.
The MEs were investigated to evaluate the applicability of solvent-based calibration and the robustness of the proposed analytical method. Matrix-matched calibration curves were prepared by spiking blank food extracts at concentration levels identical to those used for solvent calibration.
The ME was calculated as
Positive values indicate signal enhancement, whereas negative values indicate signal suppression. The MEs within ±20% were considered negligible and solvent-based calibration curve was used.
2.4.2. Limits of Detection and Quantification
Blank samples of various foods fortified at 1.0 mg/kg were analyzed following the optimized QuEChERS-HPLC-DAD procedure. Seven replicate determinations were performed under repeatability conditions.
LOD and LOQ were calculated as [26]
where σ is the standard deviation (SD) of the analytical response and S is the slope of the calibration curve.
LOD = 3.3 × σ/S
LOQ = 10 × σ/S
2.4.3. Accuracy and Precision
Method accuracy and repeatability were evaluated simultaneously by recovery experiments using blank food samples fortified at three concentration levels (2.5, 25, and 50 mg/kg), covering the working range of the method. Four independently fortified samples were prepared at each concentration level and analyzed following the proposed QuEChERS-HPLC-DAD procedure. Method accuracy was expressed as mean recovery (R, %), whereas repeatability was evaluated as the relative standard deviation (RSD, %) of the measured concentrations.
2.5. Application of the Developed Analytical Method
Following method validation, the proposed QuEChERS-HPLC-DAD method was applied to the determination of BA, SA, and eight parabens in commercial food products. A total of 40 food samples were collected from supermarkets and traditional markets in Ho Chi Minh City, Vietnam. The samples comprised five validated food matrix categories, including non-alcoholic beverages, dairy products, pickled canned foods, soy sauce and sauces, and dried rice noodles. In addition, dietary supplement samples in syrup form were included as an exploratory application of the method, particularly to assess its capability for the determination of parabens in real samples. For each food category, commercially available products were selected to represent different preservative-labeling conditions, including products declaring the use of preservatives, products labeled as preservative-free, and blind samples with the product labels concealed prior to analysis. This sampling strategy was adopted to evaluate the applicability of the proposed method to food products with different preservative profiles under routine analytical conditions. Upon collection, the samples were stored under refrigerated conditions or according to the storage recommendations provided by the manufacturers until analysis. Before extraction, all samples were homogenized and pretreated as described in Section 2.3. Sample preparation and chromatographic analysis were subsequently performed using the proposed QuEChERS-HPLC-DAD procedure. The concentration of each preservative in the original sample was calculated using the following equation:
where C is the preservative concentration in the food sample (mg/kg), Cx is the concentration determined from the calibration curve (mg/L), V is the volume of the acetonitrile extract (mL), m is the sample mass (g), and F is the dilution factor.
2.6. Statistical Analysis
Data are presented as the mean ± SD of at least three independent replicates. Statistical analyses were performed using IBM SPSS Statistics version 25.0 (IBM Corp., USA). Differences among experimental conditions were evaluated by one-way analysis of variance (ANOVA) followed by Tukey’s HSD multiple comparison test, with statistical significance set at p < 0.05. Calibration curves and graphs were generated using Microsoft Excel 2021 (Microsoft Corp., USA).
3. Results and Discussion
3.1. Optimization of HPLC-DAD Conditions
The chromatographic conditions were optimized by investigating the effects of the mobile phase composition and buffer pH on the separation of the ten target preservatives. The optimum conditions were selected based on chromatographic separation and total analysis time.
The acetonitrile content in the mobile phase was evaluated at 30, 40, and 50% (v/v) under isocratic elution conditions with flow rate of 1 mL/min. Increasing the acetonitrile content reduced the retention times of all analytes owing to the higher elution strength of the mobile phase. When the acetonitrile content was increased to 50% (v/v), total run time was only 10 min. However, the separation between several adjacent peaks deteriorated, particularly for iBuP, BuP and BeP. In contrast, 30% acetonitrile resulted in excessive retention of the more hydrophobic parabens and prolonged the analysis time with run time of 27 min. Moreover, the isomeric pairs, namely PrP/iPrP and BuP/iBuP, could not be chromatographically resolved. A mobile phase consisting of 40% acetonitrile and 60% acetate buffer provided the best balance between chromatographic separation and analytical efficiency, allowing all target analytes to be separated within 20 min as shown in Figure 1.
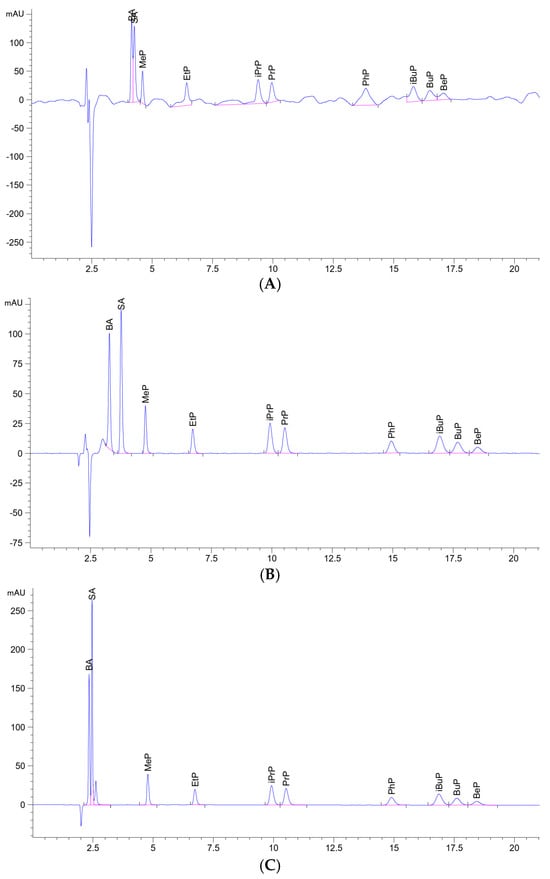
The effect of buffer pH was subsequently investigated at pH 3.3, 4.3, and 5.3. As shown in Figure 2, the separation of BA and SA was strongly influenced by the mobile phase pH, whereas the retention behavior of the parabens remained essentially unchanged over the investigated pH range. At pH 3.3, both BA and SA existed predominantly in their non-ionized forms due to their pKas of 4.20 and 4.76, respectively. Consequently, the two compounds exhibited similar hydrophobicity and comparable retention on the C18 stationary phase, resulting in only partial chromatographic separation. The retention times of BA and SA are 4.146 min and 4.269 min, respectively (Figure 2A). When the buffer pH was increased to 4.3, BA (pKa ~ 4.2) became partially ionized, whereas sorbic acid (pKa ~ 4.76) remained predominantly in its non-ionized form. This difference in the degree of ionization increased the selectivity of the chromatographic system and led to complete separation of the two analytes. The retention time of BA is 3.278 min in comparison to that of 3.765 min for SA (Figure 2B). At pH 5.3, both BA and SA were predominantly present in their ionized forms, resulting in substantially weaker interactions with the hydrophobic C18 stationary phase. Consequently, both analytes eluted rapidly with reduced retention, leading to overlapping chromatographic peaks (Figure 2C). In contrast, the retention of the parabens was marginally affected by the investigated pH values because these compounds remain largely non-ionized within this pH range. Therefore, a mobile phase consisting of 40% acetonitrile and 20 mM acetate buffer (pH 4.3) was selected as the optimum chromatographic condition for the simultaneous determination of BA, SA, and eight parabens within 20 min.
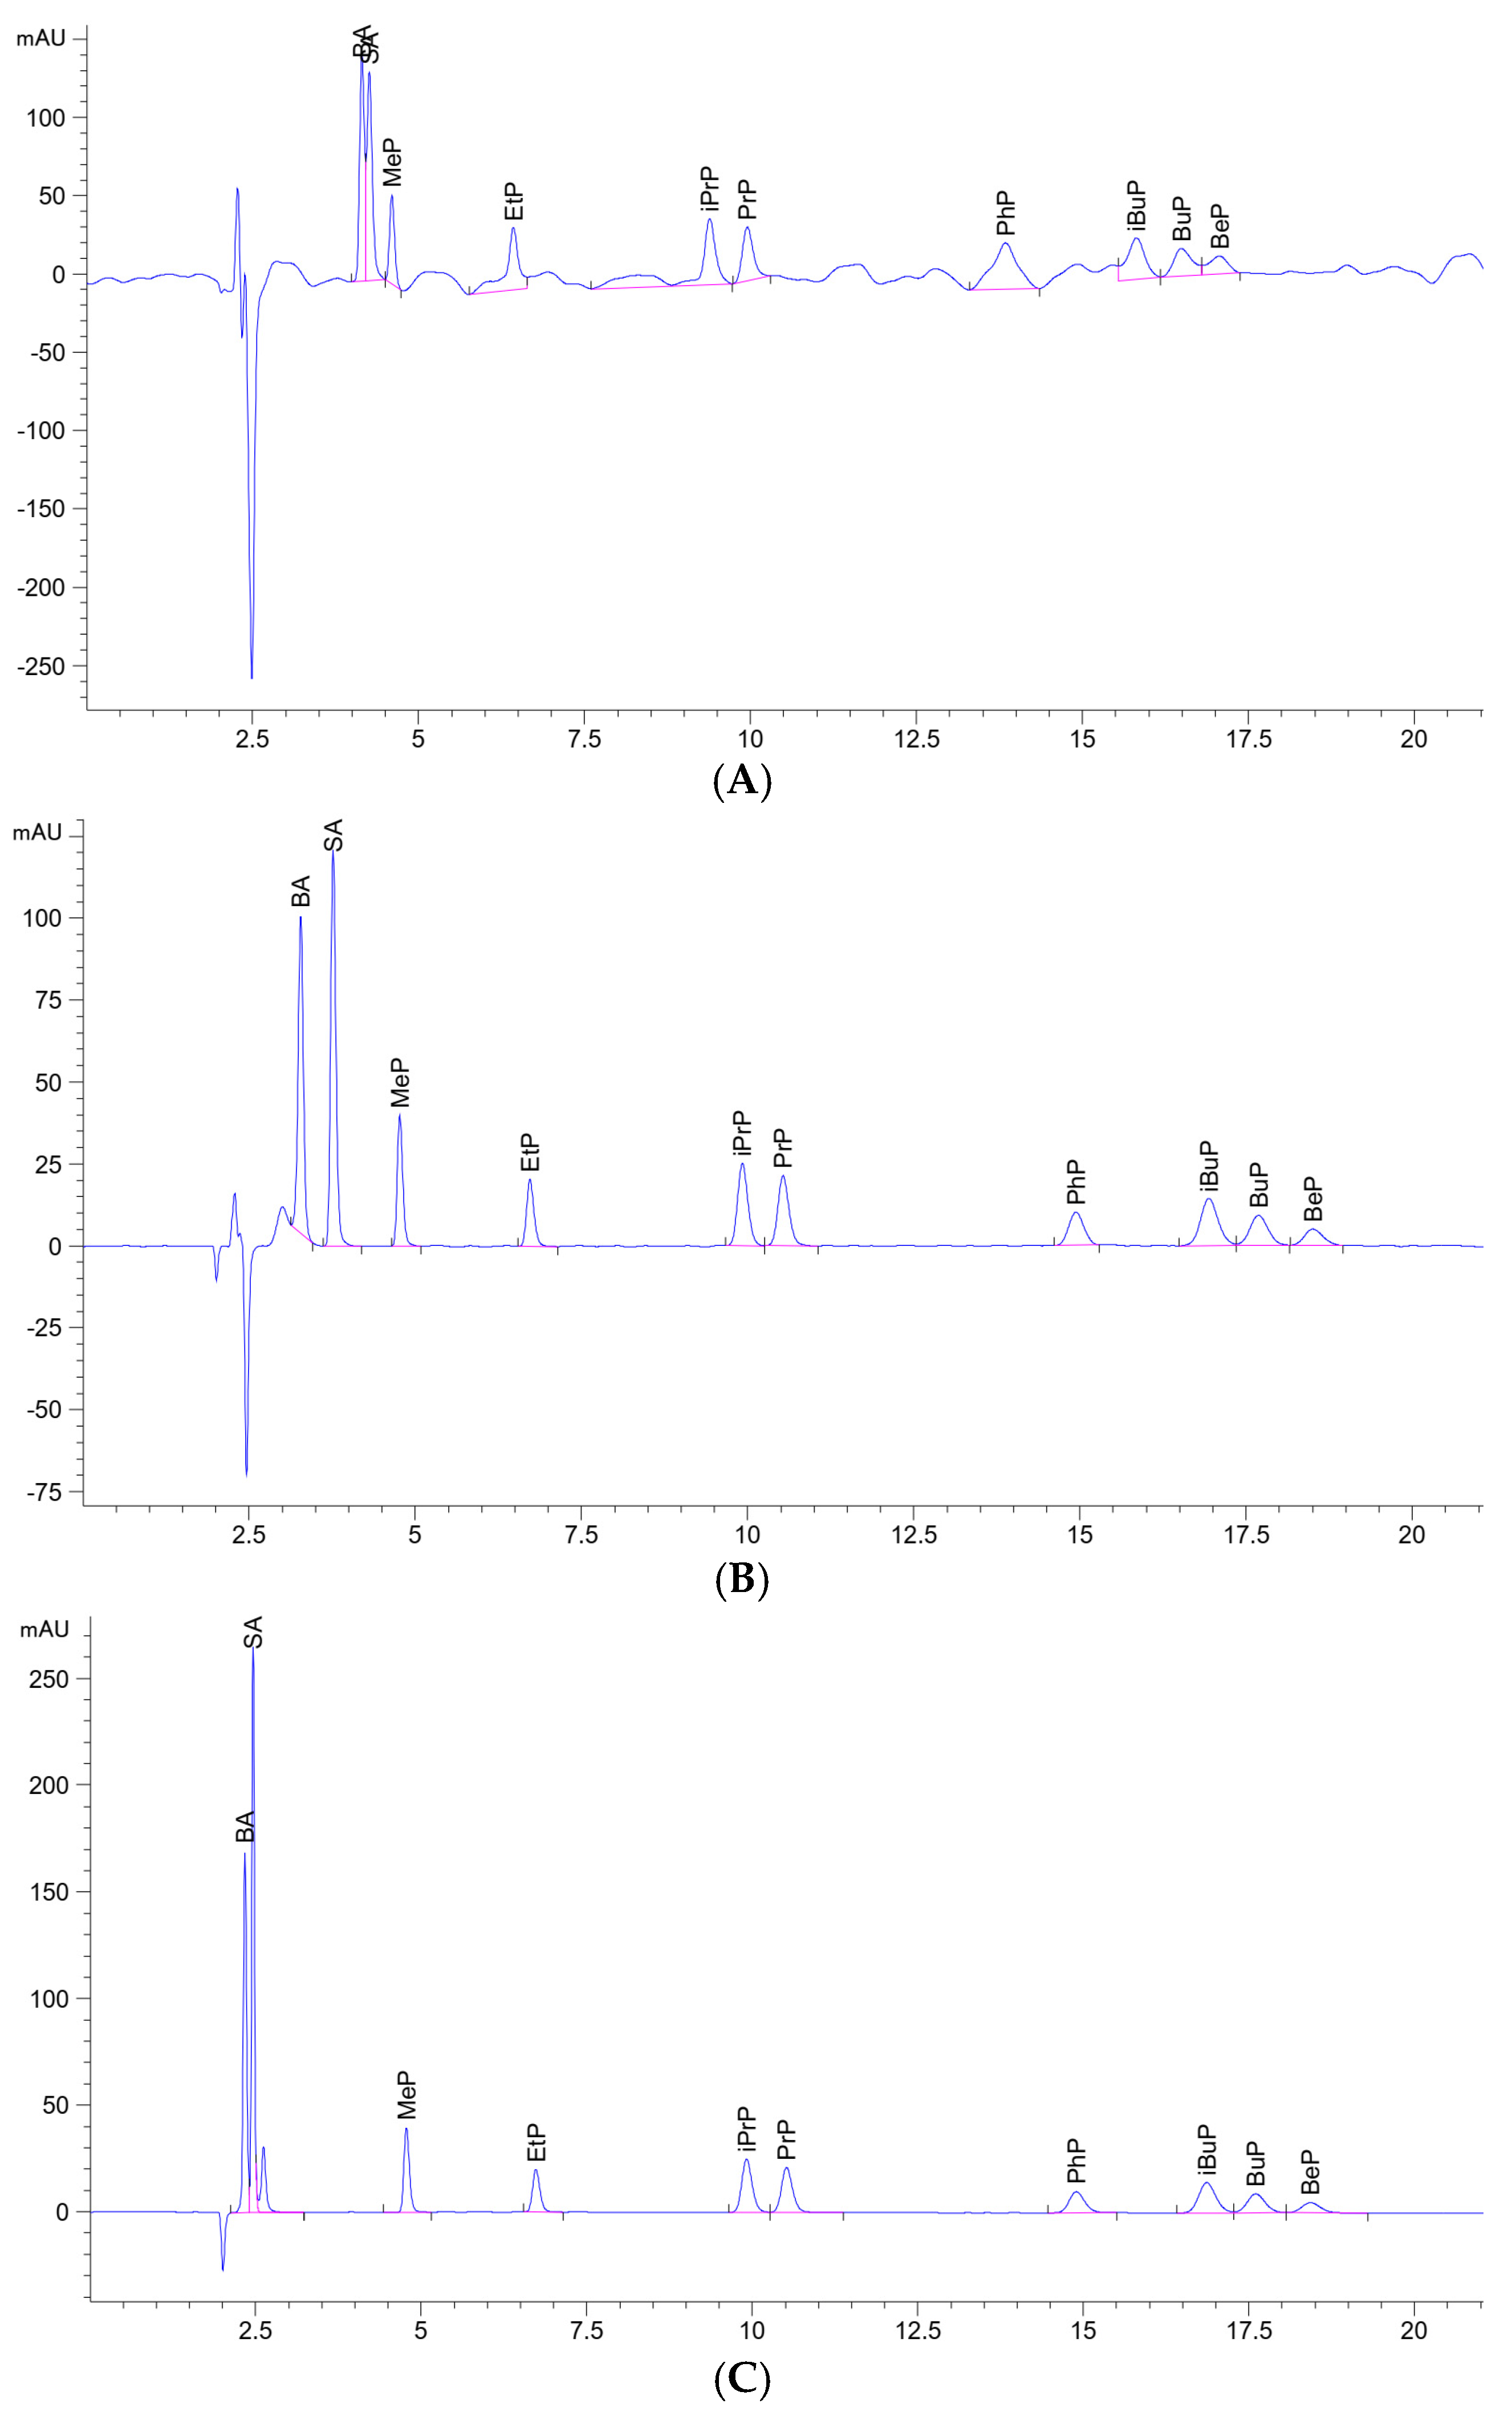
Figure 2.
Effect of mobile phase pH 3.3 (A), 4.3 (B) and 5.3 (C) on the chromatographic separation of BA, SA and eight parabens. Only chromatograms at 230 nm were shown for comparison of BA and SA. Corresponding chromatograms at 254 nm are provided in Figure S1.
Compared with the method reported by Iwakoshi et al. [27], which used gradient elution, the present method uses isocratic elution. This simplifies the chromatographic procedure and shortens the total run time from 35 to 20 min. Importantly, the developed chromatographic conditions enabled clear and baseline separation of the paraben isomers investigated in this study, particularly iPrP and PrP, as well as iBuP and BuP. To the best of our knowledge, such explicit demonstration of the separation of these closely related paraben isomers has not been reported in the chromatographic results of previous food studies, including those conducted by de Oliveira Arias et al. [15] and So et al. [19]. This feature enhances the method’s capability for the reliable identification and quantification of individual parabens in complex food matrices.
3.2. Optimization of QuEChERS Method
The QuEChERS extraction procedure was optimized to develop a simple, robust, and universal sample preparation method suitable for the simultaneous determination of BA, SA, and eight parabens in different food matrices. The optimization was carried out using representative food samples with diverse physicochemical characteristics, including soy sauce, milk, carbonated drinks, dried rice noodles, and pickled canned foods. Chromatograms of five representative blank samples are shown in Figure S2 to demonstrate the absence of endogenous interferences at the retention times of the target analytes, while a chromatogram of a representative UHT milk sample fortified at 25 mg/kg is presented in Figure S3 as an example of a fortified matrix. The extraction conditions were selected according to the overall recoveries of the target analytes across all studied matrices.
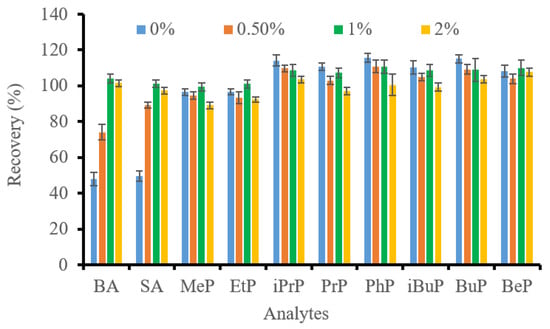
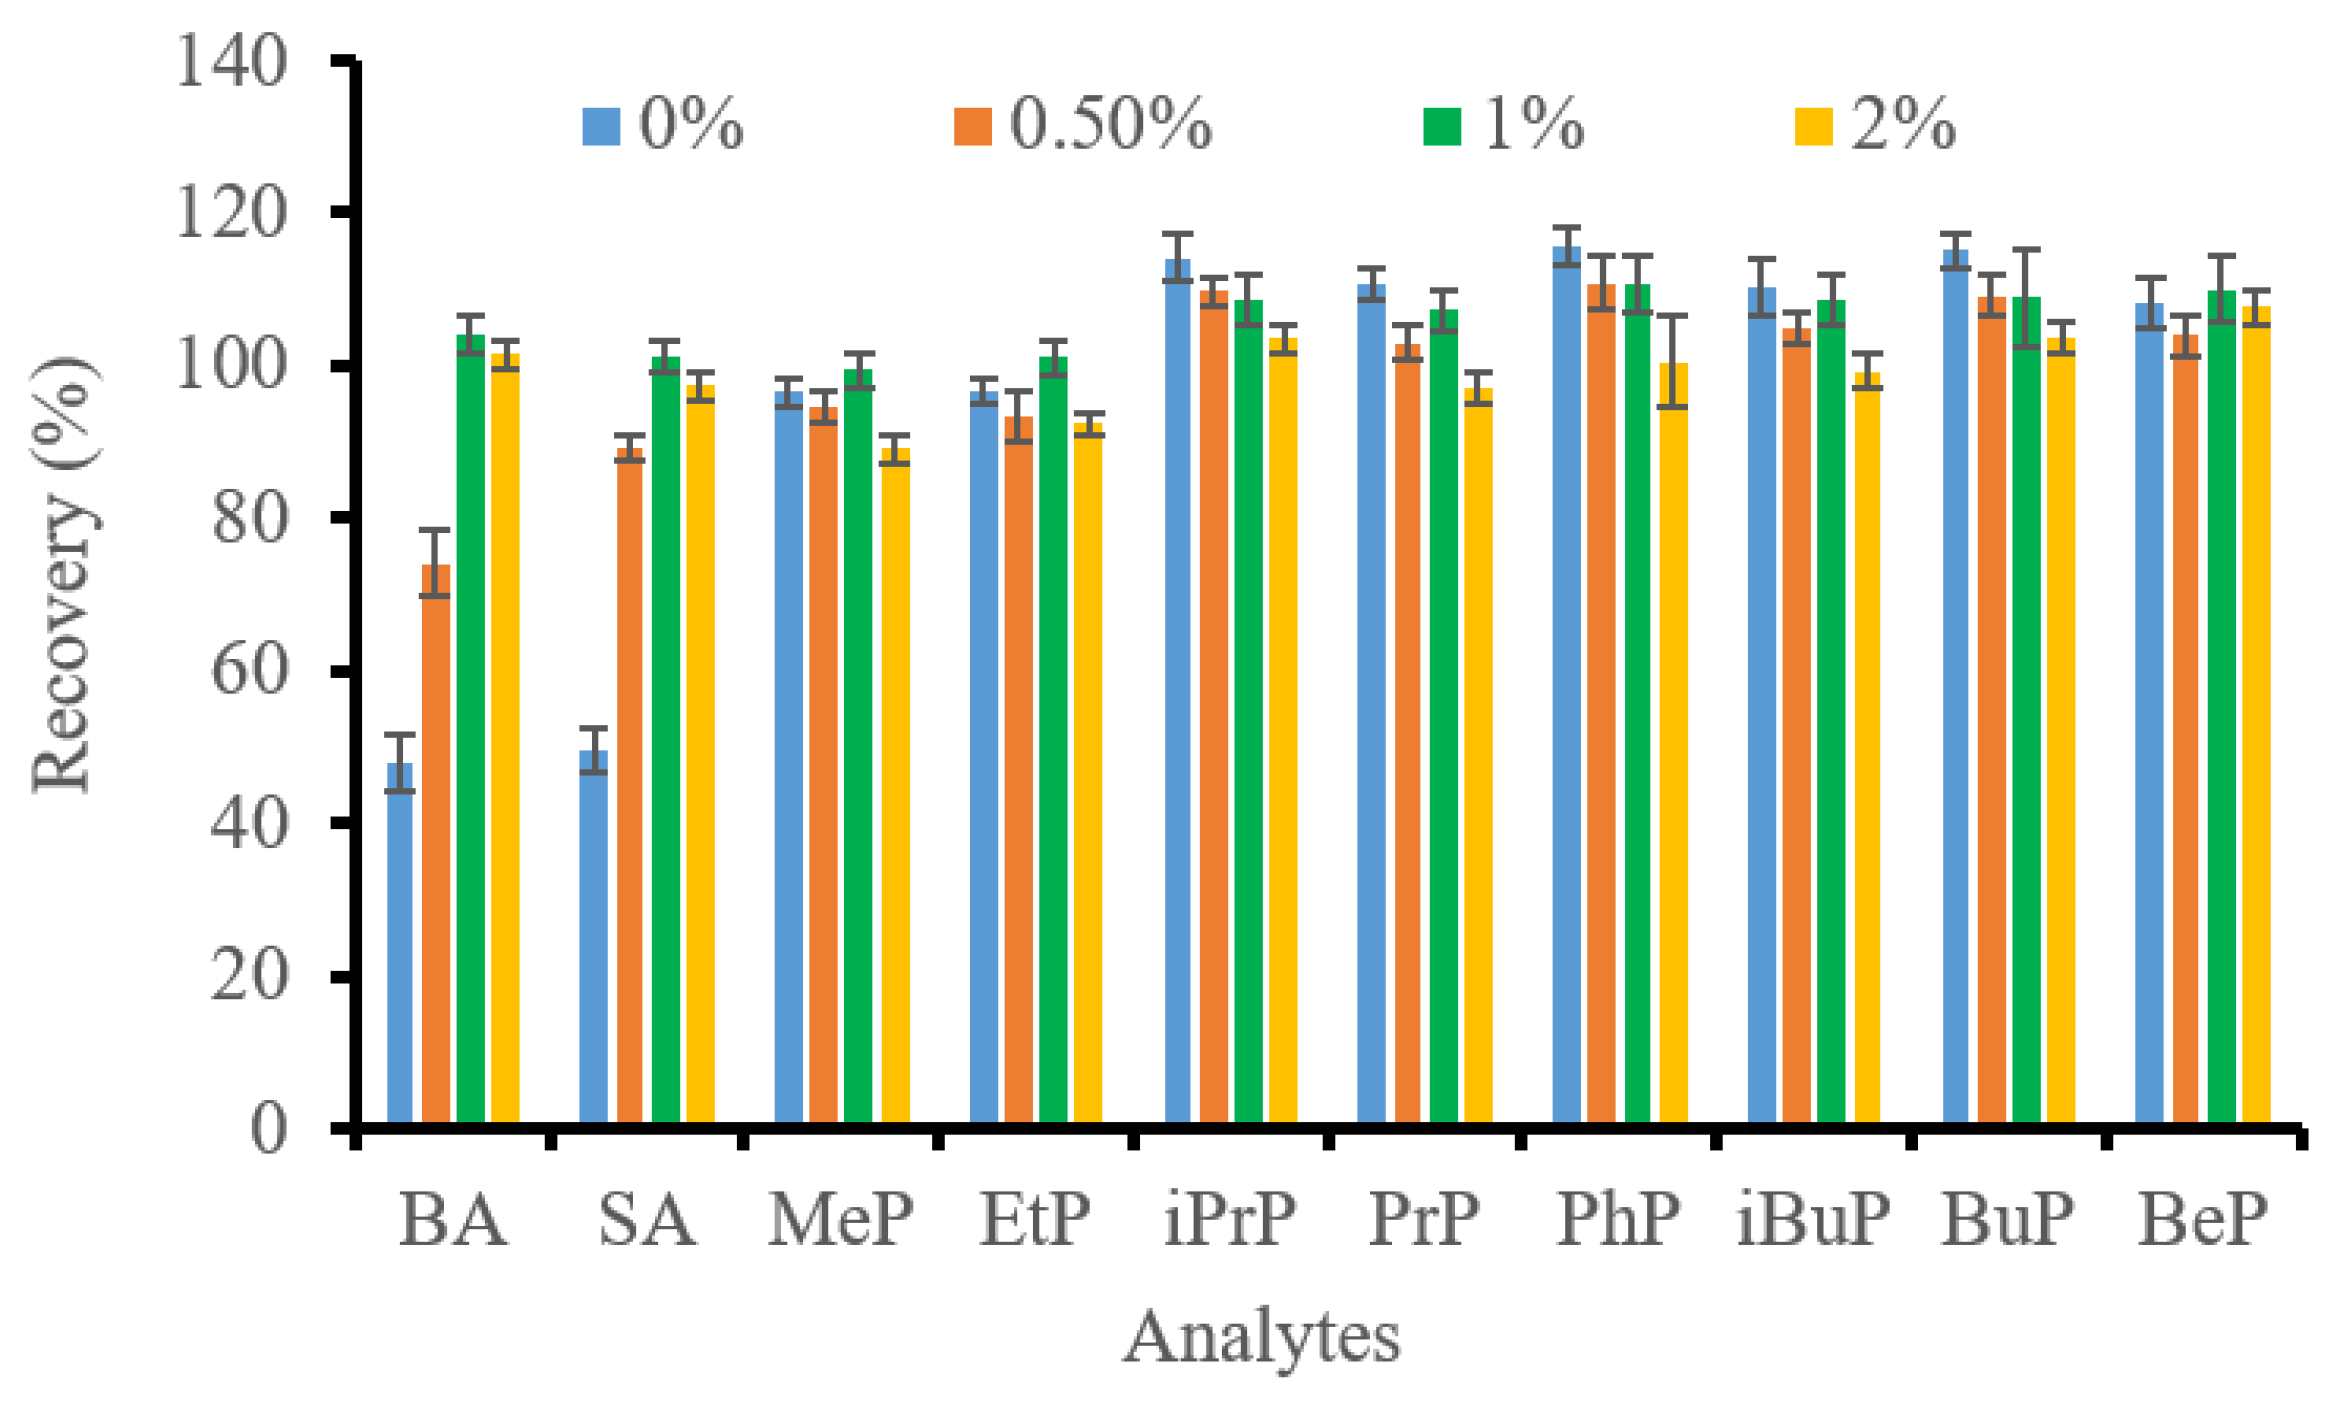
The effect of acetic acid concentration in the extraction solvent was evaluated at 0, 0.5, 1, and 2% (v/v). As shown in Figure 3, increasing the acetic acid concentration from 0 to 1% markedly improved the recoveries of BA and SA, with average recoveries increasing from approximately 48% to 104%. The acetic acid concentration significantly affected the extraction efficiencies of these analytes (one-way ANOVA, p-value < 0.05). In contrast, minor variations were observed in the recoveries of the eight parabens over the studied concentration range. The different extraction behaviors can be explained by the acid-base properties of the analytes. BA and SA are weak acids with pKa values of approximately 4.2 and 4.8, respectively. Acidification of the extraction solvent shifts the acid-base equilibrium toward their non-ionized forms, thereby enhancing their partitioning into the acetonitrile phase and improving extraction efficiency. In contrast, parabens are weakly acidic phenolic esters with pKa values of approximately 8.2–8.5 and therefore remain predominantly in their neutral forms throughout the investigated pH range. Consequently, further acidification had little influence on their extraction efficiencies, which is consistent with previous reports on the extraction behavior of parabens under acidic conditions [28]. Increasing the acetic acid concentration from 1% to 2% did not further improve the recoveries of BA and SA, whereas a slight decrease was observed for several parabens. Since the analytes were already predominantly present in their favorable extraction forms at the acetic acid concentration of 1%, additional acidification provided no further benefit and may have slightly altered analyte partitioning or matrix interactions during extraction. Considering both extraction efficiency and method robustness, the acetic acid concentration of 1% was selected as the optimum extraction condition for subsequent experiments.
Figure 3.
Effect of acetic acid concentration (%) on the recoveries of the target analytes. Extraction was performed using 2 g MgSO4 and 0.5 g NaCl, followed by d-SPE cleanup with 50 mg PSA. Bars represent the mean recoveries across five evaluated food matrices.
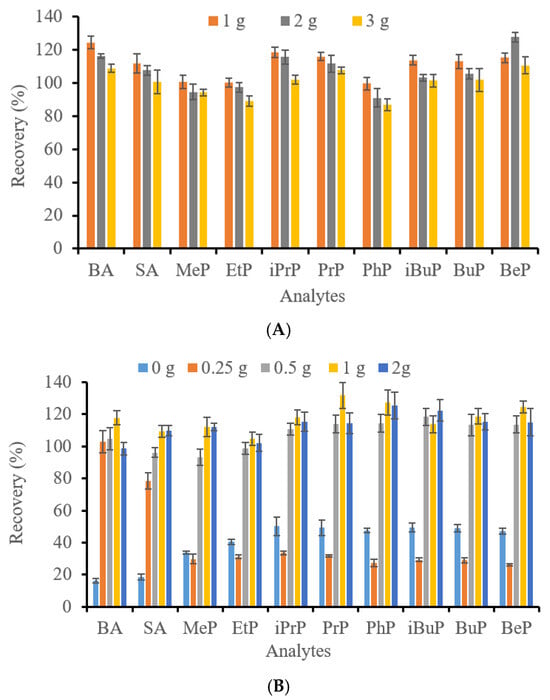
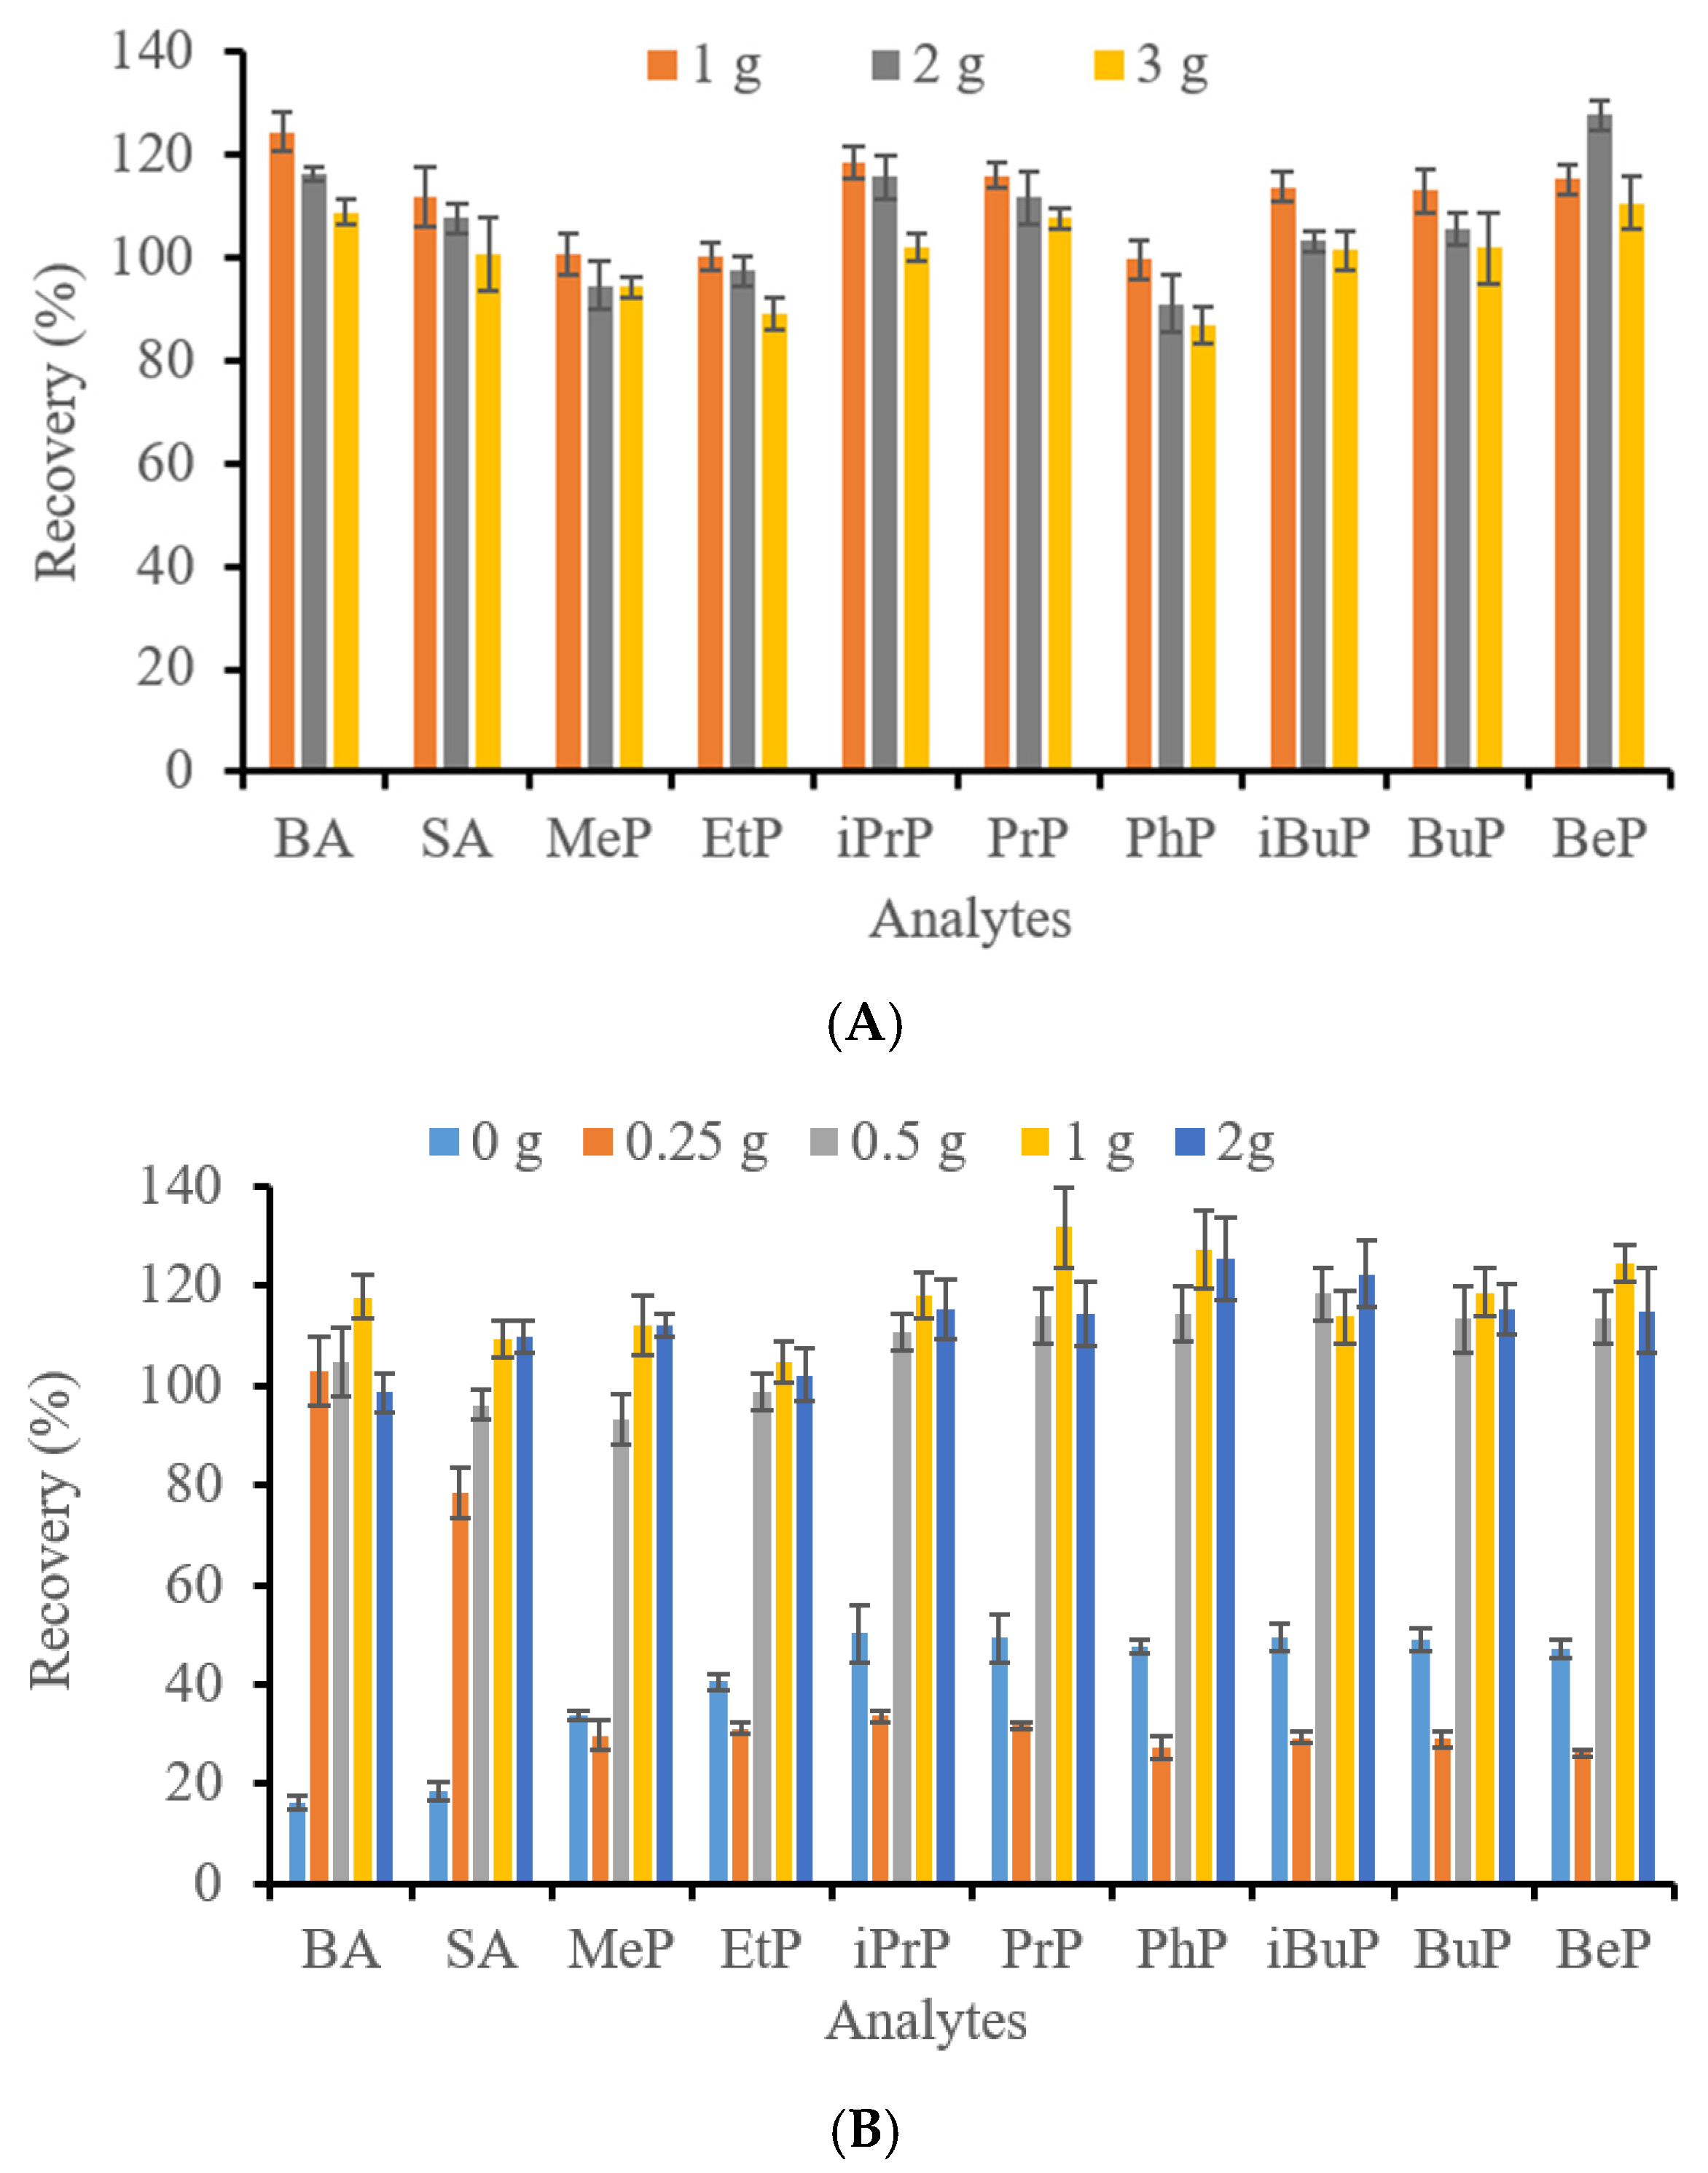
The amount of anhydrous MgSO4 was optimized over the range of 1 to 3 g. As shown in Figure 4A, the amount of MgSO4 markedly affected the extraction performance. Recoveries of several analytes exceeded 110% when 1 g MgSO4 was used. When the amount was increased to 3 g, satisfactory recoveries for all target analytes were obtained. Minor differences were observed between 1 and 2 g MgSO4. During phase partitioning, anhydrous MgSO4 primarily acts as a drying agent by removing water from the organic phase while simultaneously enhancing the salting-out effect. It facilitates phase separation between acetonitrile and the aqueous phase. Higher efficient dehydration reduces the amount of water remaining in the acetonitrile extract and limits the co-extraction of water-soluble matrix constituents. These lead to cleaner extracts and more reliable quantitative determination. As visual observation, the use of 3 g MgSO4 produced a noticeably larger volume of the separated acetonitrile phase than 1 g, indicating more efficient phase separation. Similar functions of anhydrous MgSO4 in QuEChERS extraction have been widely reported in the original QuEChERS method and subsequent methodological studies [21,29,30]. Considering both analytical recovery and the robustness of phase separation, 3 g anhydrous MgSO4 was selected as the optimum amount for subsequent experiments.
Figure 4.
Effect of (A) MgSO4 amount (g) and (B) NaCl amount (g) on the recoveries of the target analytes. For panel (A), the extraction was performed using 1% (v/v) acetic acid in acetonitrile, with 0.5 g NaCl and 50 mg PSA; for panel (B), the extraction was performed using 1% (v/v) acetic acid in acetonitrile, with 3 g MgSO4 and 50 mg PSA. Bars represent the mean recoveries across five evaluated food matrices.
To further improve the salting-out efficiency, the amount of NaCl was subsequently investigated. The results are shown in Figure 4B. Increasing the NaCl amount from 0 to 0.5 g significantly enhanced the recoveries of the target analytes by promoting their partitioning into the acetonitrile phase. NaCl increases the ionic strength of the aqueous phase, thereby reducing the solubility of acetonitrile and water and enhancing the salting-out effect. Consequently, the transfer of analytes from the aqueous phase into the organic phase is facilitated, resulting in improved extraction efficiency. However, no further improvement was observed when the NaCl amount was increased to 1 or 2 g, suggesting that efficient phase partitioning had already been achieved under the present extraction conditions. Therefore, 0.5 g NaCl was selected as the optimum amount for subsequent experiments. This finding is consistent with previous QuEChERS studies [15,21,30]. Moderate amounts of NaCl are sufficient to promote effective phase partitioning, whereas further increases provide little additional improvement in extraction performance.
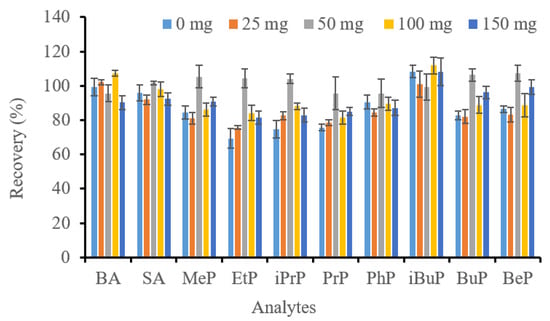
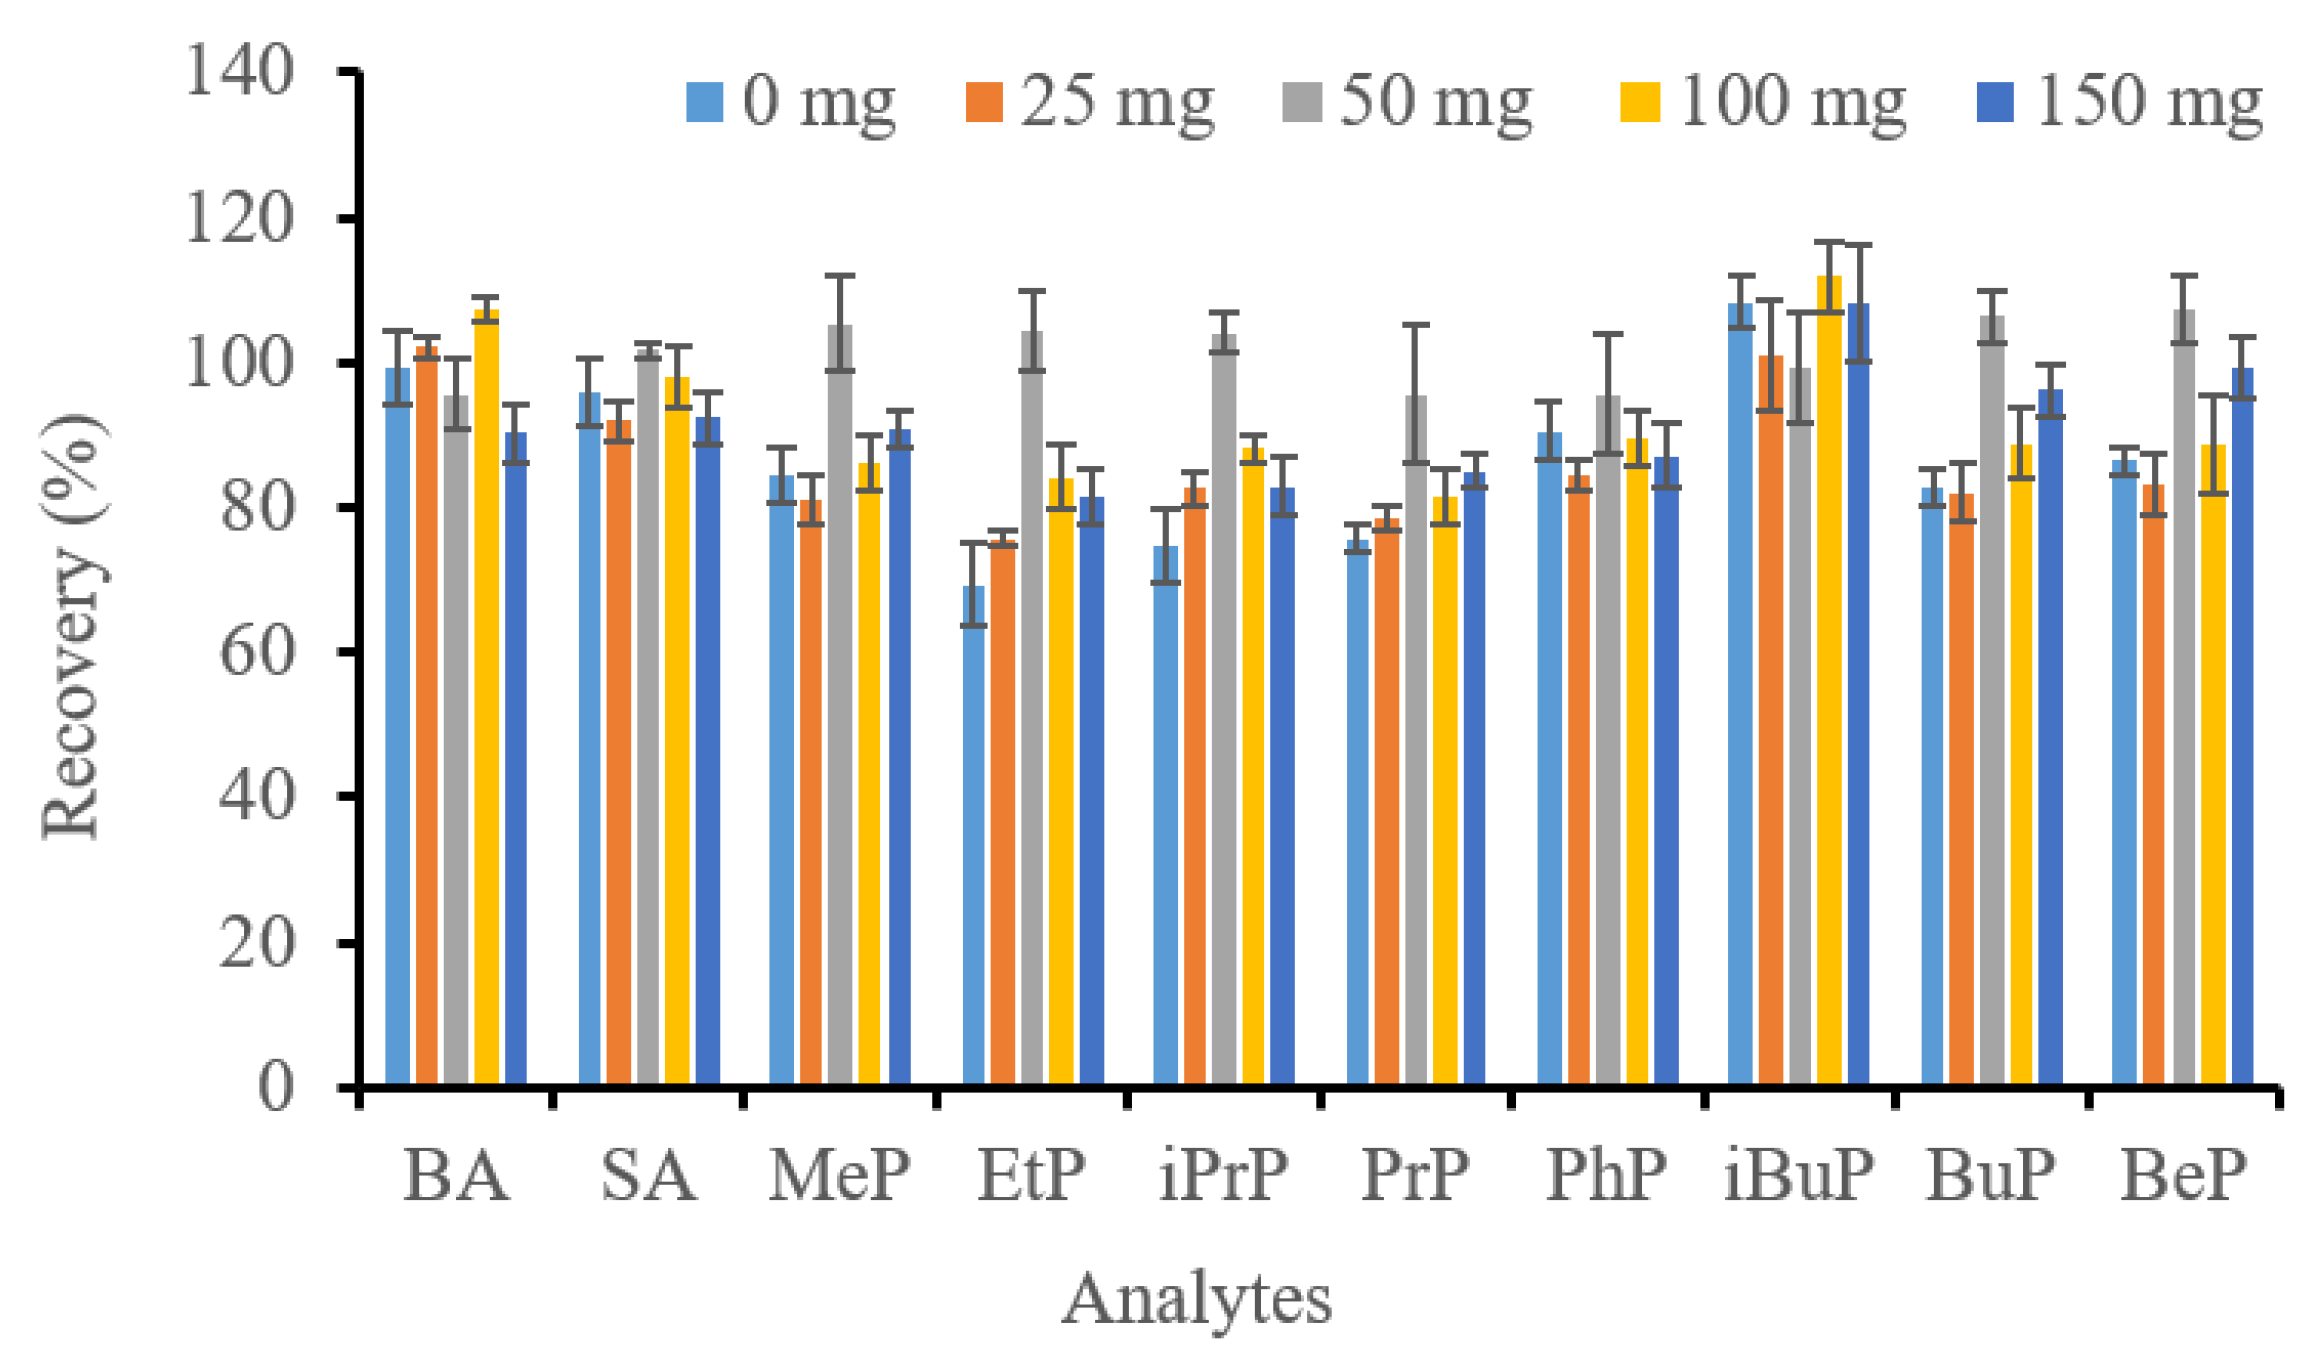
The amount of primary secondary amine (PSA) was optimized to achieve an appropriate balance between matrix clean-up and analyte recovery. As shown in Figure 5, increasing the PSA amount progressively improved extract purification by removing polar matrix co-extractives [20,21,30]. However, when the PSA amount reached 100 mg or higher, a slight decrease in the recoveries of several parabens was observed. This reduction may be attributed to partial retention of the target analytes together with matrix components during the dispersive solid-phase extraction clean-up process. Therefore, 50 mg PSA was selected as the optimum amount, providing effective extract clean-up while maintaining satisfactory recoveries for all target analytes. The previous studies demonstrated that PSA effectively removes polar matrix co-extractives, whereas excessive amounts of sorbent may lead to unnecessary analyte loss without further improvement in extract purification [20].
Figure 5.
Effect of PSA amount (mg) on the recoveries of the target analytes. Extraction was performed using 1% (v/v) acetic acid in acetonitrile, with 3 g MgSO4 and 0.5 g NaCl for phase separation. Bars represent the mean recoveries across five evaluated food matrices.
Based on the optimization results, the final QuEChERS procedure employed acetonitrile containing 1% (v/v) acetic acid as the extraction solvent, followed by salting-out partitioning with 3 g anhydrous MgSO4 and 0.5 g NaCl, and d-SPE clean-up using 50 mg PSA. The optimized conditions consistently provided satisfactory recoveries and effective matrix clean-up for food samples with diverse compositions, including beverages, dairy products, condiments, cereal-based products, and pickled foods. These results demonstrate that a single QuEChERS protocol can be successfully applied as a robust and practical sample preparation approach for the routine HPLC-DAD determination of ten preservatives (i.e., BA, SA, and eight parabens) in a wide variety of food matrices.
3.3. Validation Results
The analytical method was validated according to the AOAC Guidelines (Appendix F, 2016) [25] by evaluating linearity, ME, LOD and LOQ, accuracy, and precision. LOD and LOQ were calculated in accordance with the ICH Q2 (R2) guideline [26].
3.3.1. Evaluation of Linearity and Matrix Effect
Calibration curves were constructed in the concentration range of 0.5–10 mg/L using both solvent standards and QuEChERS extracts obtained from five representative food matrices. The ME was evaluated by comparing the slopes of the solvent-based and matrix-matched calibration curves, as described in Section 2.4.
The coefficients of determination (R2) ranged from 0.9962 to 1.0000, indicating an excellent fit of the linear regression models over the investigated concentration range (Table 1). ANOVA confirmed that the linear regressions were statistically significant for all target analytes (p-value < 0.0001). The calculated MEs ranged from −16.7% to 13.7% across the five representative food matrices. Although slight signal enhancement or suppression was observed for several analytes, all ME values were within ±20%, indicating low to moderate MEs [31,32]. These results indicate that the optimized QuEChERS procedure effectively minimized matrix interference despite the considerable differences in food composition among the studied food matrices. Since the MEs remained within the generally accepted limit of ±20%, solvent-based calibration was considered adequate for quantitative analysis. Therefore, a single solvent calibration curve was employed for the routine determination of benzoic acid, sorbic acid, and eight parabens in different food matrices. This approach simplifies the analytical procedure while maintaining satisfactory analytical performance.
Table 1.
Coefficients of determination (R2) and matrix effect (ME, %) in various food matrices. Solvent-based calibration curve was prepared in mobile phase, and matrix-matched calibration curves were prepared in QuEChERS extracts obtained from five representative food matrices.
3.3.2. Estimation of Limits of Detection and Quantification
The LOD and LOQ values obtained for the ten target preservatives are summarized in Table 2. The LODs ranged from 0.005 to 0.58 mg/kg, while the LOQs ranged from 0.01 to 1.95 mg/kg. Although the LOQs varied among the investigated food matrices, satisfactory sensitivity was achieved across the validated matrices. Compared with previously reported methods, the obtained LOQs were generally comparable to or lower than those reported by de Oliveira Arias et al. (0.13–0.33 mg/kg) [15], So et al. (0.45–0.93 mg/kg) [19], and Iwakoshi et al. (5–10 mg/kg) [27]. The results demonstrate that the proposed method provides adequate sensitivity for the determination of the target preservatives in diverse food matrices, supporting its suitability for routine food safety surveillance.
Table 2.
The estimated LOD and LOQ values for studied food matrices.
3.3.3. Recovery and Precision Studies
The accuracy of the proposed method was evaluated by recovery experiments using representative blank samples from five food groups, including pickled canned foods, soy sauce, milk, carbonated drinks, and dried rice noodles. Blank samples were initially selected based on the product labels indicating the absence of added preservatives and were subsequently confirmed by HPLC-DAD analysis to be free of detectable target analytes. The samples were fortified at three concentration levels (2.5, 25, and 50 mg/kg), representing low, medium, and high concentrations within the working range of the method. Four independently prepared samples were analyzed at each fortification level, and the recoveries were calculated to evaluate method accuracy. Method precision was assessed under repeatability conditions using the same fortified samples and expressed as the RSD of four independent determinations.
The recovery and precision results are summarized in Table 3 for 2.5 mg/kg, Table 4 for 25 mg/kg and Table 5 for 50 mg/kg. Based on a total of 600 recovery determinations, the average recoveries ranged from 79.0% to 112.0%. Among all measurements, 95% of the recovery values were within 80–110%, whereas only 4.1% exceeded 110% and 1% were lower than 80%. These results indicate that the optimized QuEChERS procedure achieved efficient extraction with minimal analyte loss across food matrices with markedly different physicochemical characteristics. The few recoveries slightly outside the 80–110% range were mainly observed for individual analytes in specific matrices and are likely attributable to differences in matrix composition and extraction behavior rather than systematic bias.
Table 3.
Recovery (%) and RSD (%) of preservatives from various food matrices at spiking level of 2.5 mg/kg.
Table 4.
Recovery (%) and RSD (%) of preservatives from various food matrices at spiking level of 25 mg/kg.
Table 5.
Recovery (%) and RSD (%) of preservatives from various food matrices at spiking level of 50 mg/kg.
The repeatability of the method was also satisfactory. The RSD values ranged from 0.1% to 7.3%, with only 1.3% of the results exceeding 5%. All RSD values remained well below the generally accepted criterion for quantitative residue analysis, demonstrating excellent repeatability of the proposed analytical procedure.
The good recoveries and low RSD values confirm that the optimized QuEChERS protocol provides efficient extraction and reproducible quantification of benzoic acid, sorbic acid, and eight parabens despite the substantial differences in sample composition among beverages, dairy products, condiments, cereal-based products, and pickled foods. Similar findings have been reported for QuEChERS-based methods applied to different food matrices [15]. Optimization of the extraction and cleanup conditions reduces matrix interference and ensures satisfactory accuracy and precision across diverse food samples. Overall, the validation results demonstrated that the proposed QuEChERS-HPLC-DAD method possesses satisfactory linearity, sensitivity, accuracy, and precision for the simultaneous determination of BA, SA, and eight parabens in diverse food matrices. These findings confirm the suitability of the method for routine food safety monitoring and regulatory compliance testing.
3.4. Real Sample Analysis
The validated QuEChERS-HPLC-DAD method was applied to the determination of BA, SA, and eight parabens in 40 commercial food samples representing five validated food matrix categories, including non-alcoholic beverages, dairy products, pickled foods, sauces, and noodle products. In addition, dietary supplement samples in syrup form were analyzed as an exploratory application of the method. The analytical results are summarized in Table 6. Representative chromatograms of positive samples are shown in Figure S4. Both BA and SA were the most frequently detected preservatives, whereas MeP and PrP were detected only in dietary supplement products. It is important to note that the dietary supplement samples analyzed in this study were commercially purchased products bearing the statement, “This product is not a medicine and is not intended to replace medicines.” According to current Vietnamese regulations, PrP is not listed among the preservatives authorized for use in foods [5]. Therefore, this product category warrants further investigation in future studies. None of the other investigated parabens, including EtP, BuP, iPrP, iBuP, PhP, and BeP were detected in any of the analyzed samples. The absence of these compounds suggests that the use of unauthorized parabens was not common among the studied commercial products, with the exception of PrP, as mentioned above.
Table 6.
Concentration of preservative in food samples determined by QuEChERS-HPLC-DAD.
The measured preservative profiles were generally consistent with the product label declarations. Products labeled with E211 contained BA, those labeled with E202 contained SA, and products declaring both additives contained the corresponding preservatives simultaneously. Furthermore, all blind samples were successfully characterized according to their preservative composition, demonstrating the reliability of the proposed method for routine food inspection.
Among the products labeled as preservative-free, no target preservatives were detected in most samples. Only trace concentrations of BA were found in one formula milk sample (5.1 mg/kg) and one fresh rice noodle sample (14.0 mg/kg). These concentrations were substantially lower than those observed in products declaring preservative use and may originate from naturally occurring BA [33,34]. The concentrations of BA and SA varied considerably among the studied food categories, reflecting differences in food formulation and preservation requirements. Higher concentrations were generally observed in sauces, pickled foods, and dietary supplements, whereas beverages and dairy products contained relatively lower preservative levels [15,19].
Comparison of the analytical results with the maximum permitted levels specified in the Vietnamese food additive regulation (Table S1) [5] indicated that most analyzed products were consistent with the declared preservative usage and appeared to comply with the corresponding regulatory requirements for their respective food categories. However, several products contained relatively high concentrations of BA and/or SA, exceeding the maximum levels permitted for certain food categories. Because the regulatory limits depend on the specific food classification defined in the legislation, definitive compliance assessment requires classification of each product according to its corresponding food category. Nevertheless, these findings highlight the importance of continuous market surveillance and routine monitoring of preservative levels, particularly for processed foods in which preservatives are commonly used.
Overall, the successful application of the proposed method to a broad range of commercial food matrices confirms its suitability for routine determination of BA, SA and parabens. The combination of a single QuEChERS extraction procedure, conventional HPLC-DAD instrumentation, and solvent-based calibration provides a practical and cost-effective analytical approach for routine quality control laboratories. Moreover, the capability of simultaneously quantifying permitted preservatives while screening for prohibited parabens enables comprehensive regulatory monitoring using a single analytical workflow.
4. Conclusions
A simple and reliable QuEChERS-HPLC-DAD method was successfully developed and validated for the simultaneous determination of BA, SA, and eight parabens (MeP, EtP, PrP, iPrP, PhP, iBuP, BuP, and BeP) in diverse food matrices. The optimized sample preparation procedure, consisting of extraction with acetonitrile containing 1% acetic acid, salting-out with 3 g MgSO44 and 0.5 g NaCl, and 50 mg PSA cleanup, provided satisfactory analytical performance across the investigated matrices. The method showed good linearity over the investigated concentration range, with coefficients of determination (R2) ranging from 0.9962 to 1.0000. The LODs ranged from 0.005 to 0.58 mg/kg, while the LOQs ranged from 0.01 to 1.95 mg/kg. Although the LOQs varied among food matrices, satisfactory sensitivity, recovery, and precision were achieved across the validated matrices, with acceptable matrix effects. The developed chromatographic conditions also enabled clear and baseline separation of the investigated paraben isomers, particularly iPrP/PrP and iBuP/BuP, within a 20 min chromatographic run using isocratic elution. The method was subsequently applied to 40 commercial food samples representing six food categories. Both BA and SA were frequently detected, while MeP and PrP were detected in dietary supplement products and the other investigated parabens were not detected in the analyzed samples. The results demonstrate that the proposed method can simultaneously monitor authorized preservatives and other parabens of regulatory concern using a single extraction procedure and conventional HPLC-DAD instrumentation. Owing to its simplicity, robustness, and broad applicability, the proposed method represents a practical analytical tool for routine food quality control and regulatory monitoring.
Supplementary Materials
The following supporting information can be downloaded at: https://www.mdpi.com/article/10.3390/separations13090248/s1; Table S1. Maximum permitted levels (MPLs) of benzoic acid, sorbic acid, and parabens in the investigated food categories according to current Vietnamese regulations; Figure S1. Effect of mobile phase pH 3.3 (A), 4.3 (B) and 5.3 (C) on the chromatographic separation of BA, SA and eight parabens. Chromatograms at 254 nm were shown; Figure S2. Chromatograms of representative blank samples: (A) soft drink, (B) UHT milk, (C) soy sauce, (D) pickled mustard greens, and (E) dried noodles; Figure S3. Chromatogram of a representative UHT milk sample fortified at 25 mg/kg: (A) 230 nm and (B) 254 nm; Figure S4. Representative chromatograms of positive samples.
Author Contributions
Conceptualization, D.H.H.; Methodology, D.H.H.; Resources, D.H.H.; Funding acquisition, D.H.H.; Writing—original draft, D.H.H.; Writing—review and editing, D.H.H. and L.T.N.H.; Investigation, L.T.N.H. All authors have read and agreed to the published version of the manuscript.
Funding
This work was financially supported by Ho Chi Minh City University of Industry and Trade under Contract no 124/HĐ-DCT dated 15 July 2024.
Data Availability Statement
The original contributions presented in this study are included in the article. Further inquiries can be directed to the corresponding author.
Acknowledgments
The authors gratefully acknowledge Ho Chi Minh City College of Technology for providing laboratory facilities and analytical equipment used in this study.
Conflicts of Interest
The authors declare no conflicts of interest.
Abbreviations
The following abbreviations are used in this manuscript:
| QuEChERS | Quick, Easy, Cheap, Effective, Rugged and Safe |
| HPLC-DAD | High-performance liquid chromatography-diode-array detector |
| PSA | Primary and Secondary Amines |
| d-SPE | dispersive Solid Phase Extraction |
| LOD | Limits of detection |
| LOQ | Limits of quantification |
| BA | Benzoic acid |
| SA | Sorbic acid |
| MeP | Methylparaben |
| EtP | Ethylparaben |
| PrP | Propylparabe |
| iPrP | i-propylparaben |
| BuP | Butylparaben |
| iBuP | i-butylparaben |
| PhP | Phenylparaben |
| BeP | Benzylparaben |
References
- Esimbekova, E.N.; Asanova, A.A.; Deeva, A.A.; Kratasyuk, V.A. Inhibition effect of food preservatives on endoproteinases. Food Chem. 2017, 235, 294–297. [Google Scholar] [CrossRef] [Scilit]
- Silva, M.M.; Lidon, F.C. Food preservatives-An overview on applications and side effects. Emir. J. Food Agric. 2016, 28, 366. [Google Scholar] [CrossRef] [Scilit]
- EFSA Panel on Food Additives Nutrient Sources (ANS). Scientific Opinion on the re-evaluation of benzoic acid (E 210), sodium benzoate (E 211), potassium benzoate (E 212) and calcium benzoate (E 213) as food additives. EFSA J. 2016, 14, 4433. [Google Scholar] [CrossRef] [Scilit]
- EFSA Panel on Food Additives Nutrient Sources added to Food (ANS). Scientific Opinion on the re-evaluation of sorbic acid (E 200), potassium sorbate (E 202) and calcium sorbate (E 203) as food additives. EFSA J. 2015, 13, 4144.
- Ministry of Health (Vietnam). Circular No. 24/2019/TT-BYT: Guiding the Management and Use of Food Additives; Ministry of Health: Hanoi, Vietnam, 2019.
- Crovetto, S.I.; Moreno, E.; Dib, A.L.; Espigares, M.; Espigares, E. Bacterial toxicity testing and antibacterial activity of parabens. Toxicol. Environ. Chem. 2017, 99, 858–868. [Google Scholar] [CrossRef] [Scilit]
- Chatterjee, S.; Adhikary, S.; Bhattacharya, S.; Chakraborty, A.; Dutta, S.; Roy, D.; Ganguly, A.; Nanda, S.; Rajak, P. Parabens as the double-edged sword: Understanding the benefits and potential health risks. Sci. Total Environ. 2024, 954, 176547. [Google Scholar] [CrossRef] [Scilit] [PubMed]
- Codex Alimentarius Commission. General Standard for Food Additives (CXS 192-1995). Food and Agriculture Organization of the United Nations; World Health Organization. Available online: https://www.fao.org/gsfaonline/index.html (accessed on 12 August 2026).
- Monteagudo, C.; Robles-Aguilera, V.; Salcedo-Bellido, I.; Gálvez-Ontiveros, Y.; Samaniego-Sánchez, C.; Aguilera, M.; Zafra-Gómez, A.; Burgos, M.A.M.; Rivas, A. Dietary exposure to parabens and body mass index in an adolescent Spanish population. Environ. Res. 2021, 201, 111548. [Google Scholar] [CrossRef] [Scilit] [PubMed]
- Liao, C.; Liu, F.; Kannan, K. Occurrence of and Dietary Exposure to Parabens in Foodstuffs from the United States. Environ. Sci. Technol. 2013, 47, 3918–3925. [Google Scholar] [CrossRef] [Scilit] [PubMed]
- Liao, C.; Chen, L.; Kannan, K. Occurrence of parabens in foodstuffs from China and its implications for human dietary exposure. Environ. Int. 2013, 57–58, 68–74. [Google Scholar] [CrossRef] [Scilit] [PubMed]
- Wang, L.; Hu, Z.; Chen, J.; Wang, T.; Wu, P.; Ying, Y. Simultaneous Determination of 12 Preservatives in Pastries Using Gas Chromatography–Mass Spectrometry. Foods 2023, 12, 3819. [Google Scholar] [CrossRef] [Scilit] [PubMed]
- Wu, Y.; Li, J.; Zhao, S.; Ding, X. Simultaneous Determination of 11 Food Additives by Micellar Electrokinetic Capillary Chromatography. Food Anal. Methods 2016, 9, 589–595. [Google Scholar] [CrossRef] [Scilit]
- Detry, P.; Willame, P.; Van Hoeck, E.; Van Loco, J.; Goscinny, S. Development, validation and application of multi-class methods for the analysis of food additives by liquid chromatography coupled to tandem mass spectrometry. Food Addit. Contam. Part A 2022, 39, 1349–1364. [Google Scholar] [CrossRef] [Scilit] [PubMed]
- de Oliveira Arias, J.L.; Rocha, C.B.; Santos, A.L.Q.S.; Marube, L.C.; Kupski, L.; Caldas, S.S.; Primel, E.G. Fast and simple method of simultaneous preservative determination in different processed foods by QuEChERS and HPLC-UV: Method development, survey and estimate of daily intake. Food Chem. 2019, 293, 112–119. [Google Scholar] [CrossRef] [Scilit] [PubMed]
- Neofotistos, A.-D.G.; Gkountanas, K.; Boutsikaris, H.; Dotsikas, Y. A Validated RP-HPLC Method for the Determination of Butamirate Citrate and Benzoic Acid in Syrup, Based on an Experimental Design Assessment of Robustness. Separations 2021, 8, 163. [Google Scholar] [CrossRef] [Scilit]
- Chaleshtori, F.S.; Arian, A.; Chaleshtori, R.S. Assessment of sodium benzoate and potassium sorbate preservatives in some products in Kashan, Iran with estimation of human health risk. Food Chem. Toxicol. 2018, 120, 634–638. [Google Scholar] [CrossRef] [Scilit] [PubMed]
- Ferreira, I.M.P.L.V.O.; Mendes, E.; Brito, P.; Ferreira, M.A. Simultaneous determination of benzoic and sorbic acids in quince jam by HPLC. Food Res. Int. 2000, 33, 113–117. [Google Scholar] [CrossRef] [Scilit]
- So, J.S.; Lee, S.B.; Lee, J.H.; Nam, H.S.; Lee, J.K. Simultaneous determination of dehydroacetic acid, benzoic acid, sorbic acid, methylparaben and ethylparaben in foods by high-performance liquid chromatography. Food Sci. Biotechnol. 2023, 32, 1173–1183. [Google Scholar] [CrossRef] [Scilit] [PubMed]
- Musarurwa, H.; Chimuka, L.; Pakade, V.E.; Tavengwa, N.T. Recent developments and applications of QuEChERS based techniques on food samples during pesticide analysis. J. Food Compos. Anal. 2019, 84, 103314. [Google Scholar] [CrossRef] [Scilit]
- Anastassiades, M.; Lehotay, S.J.; Stajnbaher, D.; Schenck, F.J. Fast and easy multiresidue method employing acetonitrile extraction/partitioning and “dispersive solid-phase extraction” for the determination of pesticide residues in produce. J. AOAC Int. 2003, 86, 412–431. [Google Scholar] [CrossRef] [Scilit]
- Dafir, M.; Labjar, N.; El Hajjaji, S. Optimization and Validation of a Modified QuEChERS-UPLC-MS/MS Method for Multi-Residue Pesticide Analysis in Tea and Rosemary Leaves with Experimental Uncertainty Assessment. Analytica 2026, 7, 45. [Google Scholar] [CrossRef] [Scilit]
- Jeong, I.-S.; Kwak, B.-M.; Ahn, J.-H.; Jeong, S.-H. Determination of pesticide residues in milk using a QuEChERS-based method developed by response surface methodology. Food Chem. 2012, 133, 473–481. [Google Scholar] [CrossRef] [Scilit] [PubMed]
- Rahman, M.M.; Lee, H.S.; Abd El-Aty, A.M.; Kabir, M.H.; Chung, H.S.; Park, J.-H.; Kim, M.-R.; Kim, J.-H.; Shin, H.-C.; Shin, S.S.; et al. Determination of endrin and δ-keto endrin in five food products of animal origin using GC-μECD: A modified QuEChERS approach to traditional detection. Food Chem. 2018, 263, 59–66. [Google Scholar] [CrossRef] [Scilit] [PubMed]
- AOAC. Appendix F: Guidelines for Standard Method Performance Requirements; AOAC International: Rockville, MD, USA, 2016; pp. 1–18. [Google Scholar]
- International Council for Harmonisation of Technical Requirements for Pharmaceuticals for Human Use (ICH). ICH Harmonised Guideline; Validation of Analytical Procedures Q2(R2); International Council for Harmonisation (ICH): Geneva, Switzerland, 2022. [Google Scholar]
- Iwakoshi, K.; Shiozawa, Y.; Yamajima, Y.; Baba, I.; Monma, K.; Kobayashi, C.; Sasamoto, T. Determination of nine preservatives in processed foods using a modified QuEChERS extraction and quantified by HPLC-PDA. Food Addit. Contam. Part A 2019, 36, 1020–1031. [Google Scholar] [CrossRef] [Scilit] [PubMed]
- Cabaleiro, N.; de la Calle, I.; Bendicho, C.; Lavilla, I. An overview of sample preparation for the determination of parabens in cosmetics. TrAC Trends Anal. Chem. 2014, 57, 34–46. [Google Scholar] [CrossRef] [Scilit]
- Perestrelo, R.; Silva, P.; Porto-Figueira, P.; Pereira, J.A.M.; Silva, C.; Medina, S.; Câmara, J.S. QuEChERS—Fundamentals, relevant improvements, applications and future trends. Anal. Chim. Acta 2019, 1070, 1–28. [Google Scholar] [CrossRef] [Scilit] [PubMed]
- Lehotay, S.J.; Mastovská, K.; Lightfield, A.R. Use of buffering and other means to improve results of problematic pesticides in a fast and easy method for residue analysis of fruits and vegetables. J. AOAC Int. 2005, 88, 615–629. [Google Scholar] [CrossRef] [Scilit]
- Pihlström, T.; Fernández-Alba, A.R.; Amate, C.F.; Poulsen, M.E.; Hardebusch, B.; Anastassiades, M.; Lippold, R.; Cabrera, L.C.; de Kok, A.; ORegan, F. Analytical Quality Control and Method Validation Procedures for Pesticide Residues Analysis in Food and Feed; SANTE 11312/2021; European Commission: Brussels, Belgium, 2021; pp. 1–54. [Google Scholar]
- Bulaić Nevistić, M.; Kovač Tomas, M. Matrix Effect Evaluation in GC/MS-MS Analysis of Multiple Pesticide Residues in Selected Food Matrices. Foods 2023, 12, 3991. [Google Scholar] [CrossRef] [Scilit] [PubMed]
- Sieber, R.; Bütikofer, U.; Bosset, J.O. Benzoic acid as a natural compound in cultured dairy products and cheese. Int. Dairy J. 1995, 5, 227–246. [Google Scholar] [CrossRef] [Scilit]
- Qi, P.; Hong, H.; Liang, X.; Liu, D. Assessment of benzoic acid levels in milk in China. Food Control 2009, 20, 414–418. [Google Scholar] [CrossRef] [Scilit]

Disclaimer/Publisher’s Note: The statements, opinions and data contained in all publications are solely those of the individual author(s) and contributor(s) and not of MDPI and/or the editor(s). MDPI and/or the editor(s) disclaim responsibility for any injury to people or property resulting from any ideas, methods, instructions or products referred to in the content. |
© 2026 by the authors. Licensee MDPI, Basel, Switzerland. This article is an open access article distributed under the terms and conditions of the Creative Commons Attribution (CC BY) license.