


Abstract
This study developed a detection method for hymexazol residues in sugar beet, targeting its low molecular weight, high polarity, and lack of chromophores. The method optimized mass spectrometry conditions, liquid chromatography parameters, and extraction/purification protocols to address the matrix characteristics of sugar beet. Specifically, the sample pretreatment involved extraction with acetonitrile, followed by purification using GCB, silica, and C18 sorbents to minimize matrix interference. Sensitivity was enhanced by reducing flow rate and spray voltage. The method demonstrated high performance and was applied to analyze real samples. The LOD and LOQ were theoretically determined to be 1.22 and 3.80 μg/kg, respectively, using the blank standard deviation method. At the spiked levels of 5.0, 10, and 50 μg/kg, the intraday and interday recoveries were 80.2–97.9% and 78.1–101.7%, with corresponding RSDs of 4.8–6.4% and 4.6–8.8%, respectively. These results could meet the requirements for pesticide residue analysis and regulatory monitoring.
1. Introduction
Hymexazol (CAS No. 10004-44-1) is a systemic fungicide with the chemical name 3-hydroxy-5-methylisoxazole. It exhibits high efficacy, low toxicity, higher penetration rate, and the ability to enhance crop vitality. It is effective in controlling fungal diseases such as Banded Sclerotial Blight, damping-off, and wilt in major crops including rice, melons, cotton, and legumes.
Currently, the analysis of hymexazol residues in agricultural products primarily employs gas chromatography–flame photometric detector (GC-FPD) [1,2,3], gas chromatography–nitrogen phosphorus detector (GC-NPD) [3,4,5], high-performance liquid chromatography–diode array detection (HPLC-DAD) [6], gas chromatography–mass spectrometry (GC-MS) [7,8], liquid chromatography–tandem mass spectrometry (LC-MS/MS) [3,9,10,11]. Table 1 summarizes the applicable matrices, sample pretreatment methods, performance metrics, and limitations of previously reported methods for the detection of hymexazol in plant-derived products.
Table 1.
Comparison of reported methods for the detection of hymexazol.
As shown in Table 1, the existing methods reported in the literature for the detection of hymexazol in plant-derived products were either laborious and time-consuming or sufferred from low sensitivity, making it difficult to meet the maximum residue limits (MRLs) of hymexazol in sugar beets. Moreover, none of these studies addressed the optimization of key parameters, such as the spray voltage and flow rate, for hymexazol. This may be one of the reasons contributing to the insufficient sensitivity reported in these studies.
As a primary source for the sugar industry, sugar beets have garnered extensive attention from both domestic and international stakeholders regarding pesticide residue limits. The “GB 2763-2026 National Food Safety Standard—Maximum Residue Limits for Pesticides in Food [12]” stipulates that the residue limit of hymexazol in sugar beets is 0.1 mg/kg. In November 2019, the European Food Safety Authority (EFSA) proposed adjusting the maximum residue limit of hymexazol in sugar beets from 0.1 mg/kg to 0.01 mg/kg, while further considerations were still underway for its limits in other commodities. Due to its low molecular weight, high polarity, and lack of chromophores, hymexazol residue analysis presents certain challenges [9]. Reported LOQs in the literature were typically high, and the sugar beet matrix contains substantial pigments and alkaloids, making it difficult to meet the hymexazol residue requirements in sugar beets. Additionally, the process was cumbersome and unsuitable for large-scale testing. This study developed a liquid chromatography–tandem mass spectrometry method for detecting hymexazol residues in sugar beets. By reducing flow rate and spray voltage, the method enhances hymexazol response sensitivity. The approach also optimized mass spectrometry conditions and extraction purification protocols based on the characteristics of the sugar beet matrix. The theoretical LOD and LOQ of this method for hymexazol in sugar beet were 1.22 and 3.80 μg/kg respectively, meeting the requirements for hymexazol detection and regulatory oversight.
2. Materials and Methods
2.1. Reagents and Materials
The solid standards of hymexazol for this study were purchased from CATO Research Chemicals Inc. (Guangzhou, China) with a purity of 98.2%. LC-MS grade methanol and acetonitrile were purchased from Fisher Scientific (Waltham, MA, USA). Analytical grade sodium chloride was purchased from National Medicines Corporation (Beijing, China). GCB, silica, and C18 cartridges were purchased from Dikma Technologies (Beijing, China).
2.2. Instrumentation
This work was carried out using an HPLC system from Agilent Technologies (Santa Clara, CA, USA). The triple quadrupole mass spectrometer model was API 5500Q from AB Sciex (Concord, ON, Canada) equipped with electrospray ionization source. Data acquisition and processing were performed using SCIEX OS software (version 3.4.0.19154, SCIEX). Vortex mixing was performed using an MS3 Basic vortex mixer (IKA, Staufen, Germany). Centrifugation was performed using an Eppendorf Centrifuge 5810R (Hamburg, Germany). A G-285 electronic balance (Mettler Toledo, Greifensee, Switzerland) was used for weighing.
2.3. Sugar Beet Sample Preparation
The sugar beet samples were purchased randomly from the Pinduoduo online retail platform from March to June 2026. The samples used for method validation were confirmed to be negative (free of hymexazol residue). Upon receipt, the samples were simply cut into small pieces and then mixed thoroughly.
Every 5 g of the sample was weighed to be tested (accurate to 0.01 g) into a 50 mL centrifuge tube with a stopper. A total of 10 mL of acetonitrile was added. After vibration for 2 min, 1 g of sodium chloride was added. The mixture was vortexed for another 3 min and centrifuged at 9000 r/min. Then 1.0 mL of the supernatant was transferred into a glass centrifuge tube, and 50 mg each of GCB, silica, and C18 powder were added. After being vortexed and centrifuged, the supernatant was filtered through a 0.2 μm organic membrane for testing.
2.4. HPLC-MS/MS Analysis
The analytes were determined using HPLC–MS/MS under the following conditions: Poroshell 120 AQ-C18 column (100 mm × 2.1 mm i.d.; 2.7 μm), maintained at 40 °C; mobile phase (A) water containing 0.1% formic acid (v/v) and (B) methanol; elution gradient: 1% B from 0 to 1.5 min; changing until reaching 5% B at 2.0 min and remaining until 4.0 min; returning to 1% B at 4.1 min and remaining until 6 min; mobile phase flow rate: 0.30 mL min−1; injection volume: 10 µL; ionization source: electrospray ionization (ESI); and triple quadrupole mass spectrometric detector, operating in Multiple Reaction Monitoring (MRM) positive ion mode. Other selected parameters were as follows: source temperature: 650 °C; spray voltage: 2500 V; atomizing gas, curtain gas, auxiliary gas, and collision gas were all high-purity nitrogen gas.
2.5. Statistical Analysis
All statistical analyses were performed using OriginPro 2026 (OriginLab Corp., Northampton, MA, USA). Differences in the extraction rates among the treatment groups were evaluated using one-way analysis of variance (ANOVA), followed by Tukey’s test. Statistical significance was set at p < 0.05.
2.6. Method Validation
The method was validated according to the national standard GB/T 27417-2017 (Conformity assessment—Guidance on validation and verification of chemical analytical methods) [13]. The validation parameters included linearity, recovery, precision, matrix effects, LOD and LOQ.
Linearity was evaluated by a solvent-based calibration curve. The acceptance criterion was a correlation coefficient (R2) ≥ 0.99.
The selectivity of the method was evaluated by comparing the chromatograms of the blank matrix and the spiked samples. Retention time is a critical parameter evaluated during system suitability testing to ensure the precision and reliability of the chromatographic system. The acceptance criteria for hymexazol retention time RSD were typically set at ≤1.0%.
According to the national standard GB/T 27417-2017 [13], LOD and LOQ were determined using the blank standard deviation method. Sample blanks spiked at the lowest acceptable concentration were independently analyzed 10 times to calculate the standard deviation (s) of the results. The theoretical LOD and LOQ were calculated as the mean of the blank plus 3s and the mean of the blank plus 10s, respectively.
The matrix effect was evaluated by comparing the slopes obtained from matrix-matched calibration curves with those from standard solution calibration curves. The matrix/solvent slope ratio was calculated to assess the matrix effect (ME) of hymexazol using the following equation:
ME(%) = (Kmatrix/Ksolvent − 1) × 100%
According to the literature [14], a matrix effect (ME) of 0–20% is considered weak, 20–50% is moderate, and >50% is strong.
Recovery and precision were assessed by analyzing fortified blank samples at 5.0, 10 and 50 μg/kg concentrations, which covered low, medium and high concentration levels. Intraday recovery was evaluated using three levels with six replicates, while interday recovery was assessed over three consecutive days at three concentration levels, each with two replicates. According to GB/T 27417-2017 [13], the acceptable recovery range is 60–120%.
3. Results and Discussion
3.1. Optimization of Mass Spectrometry Conditions for Hymexazol
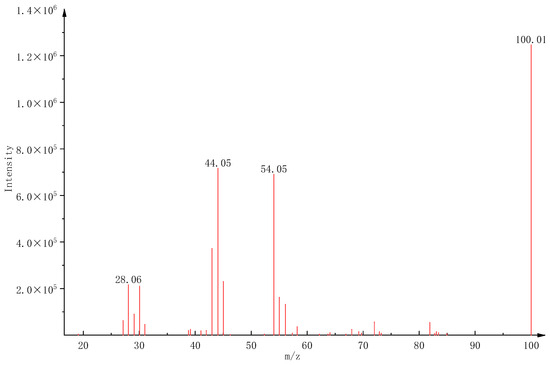
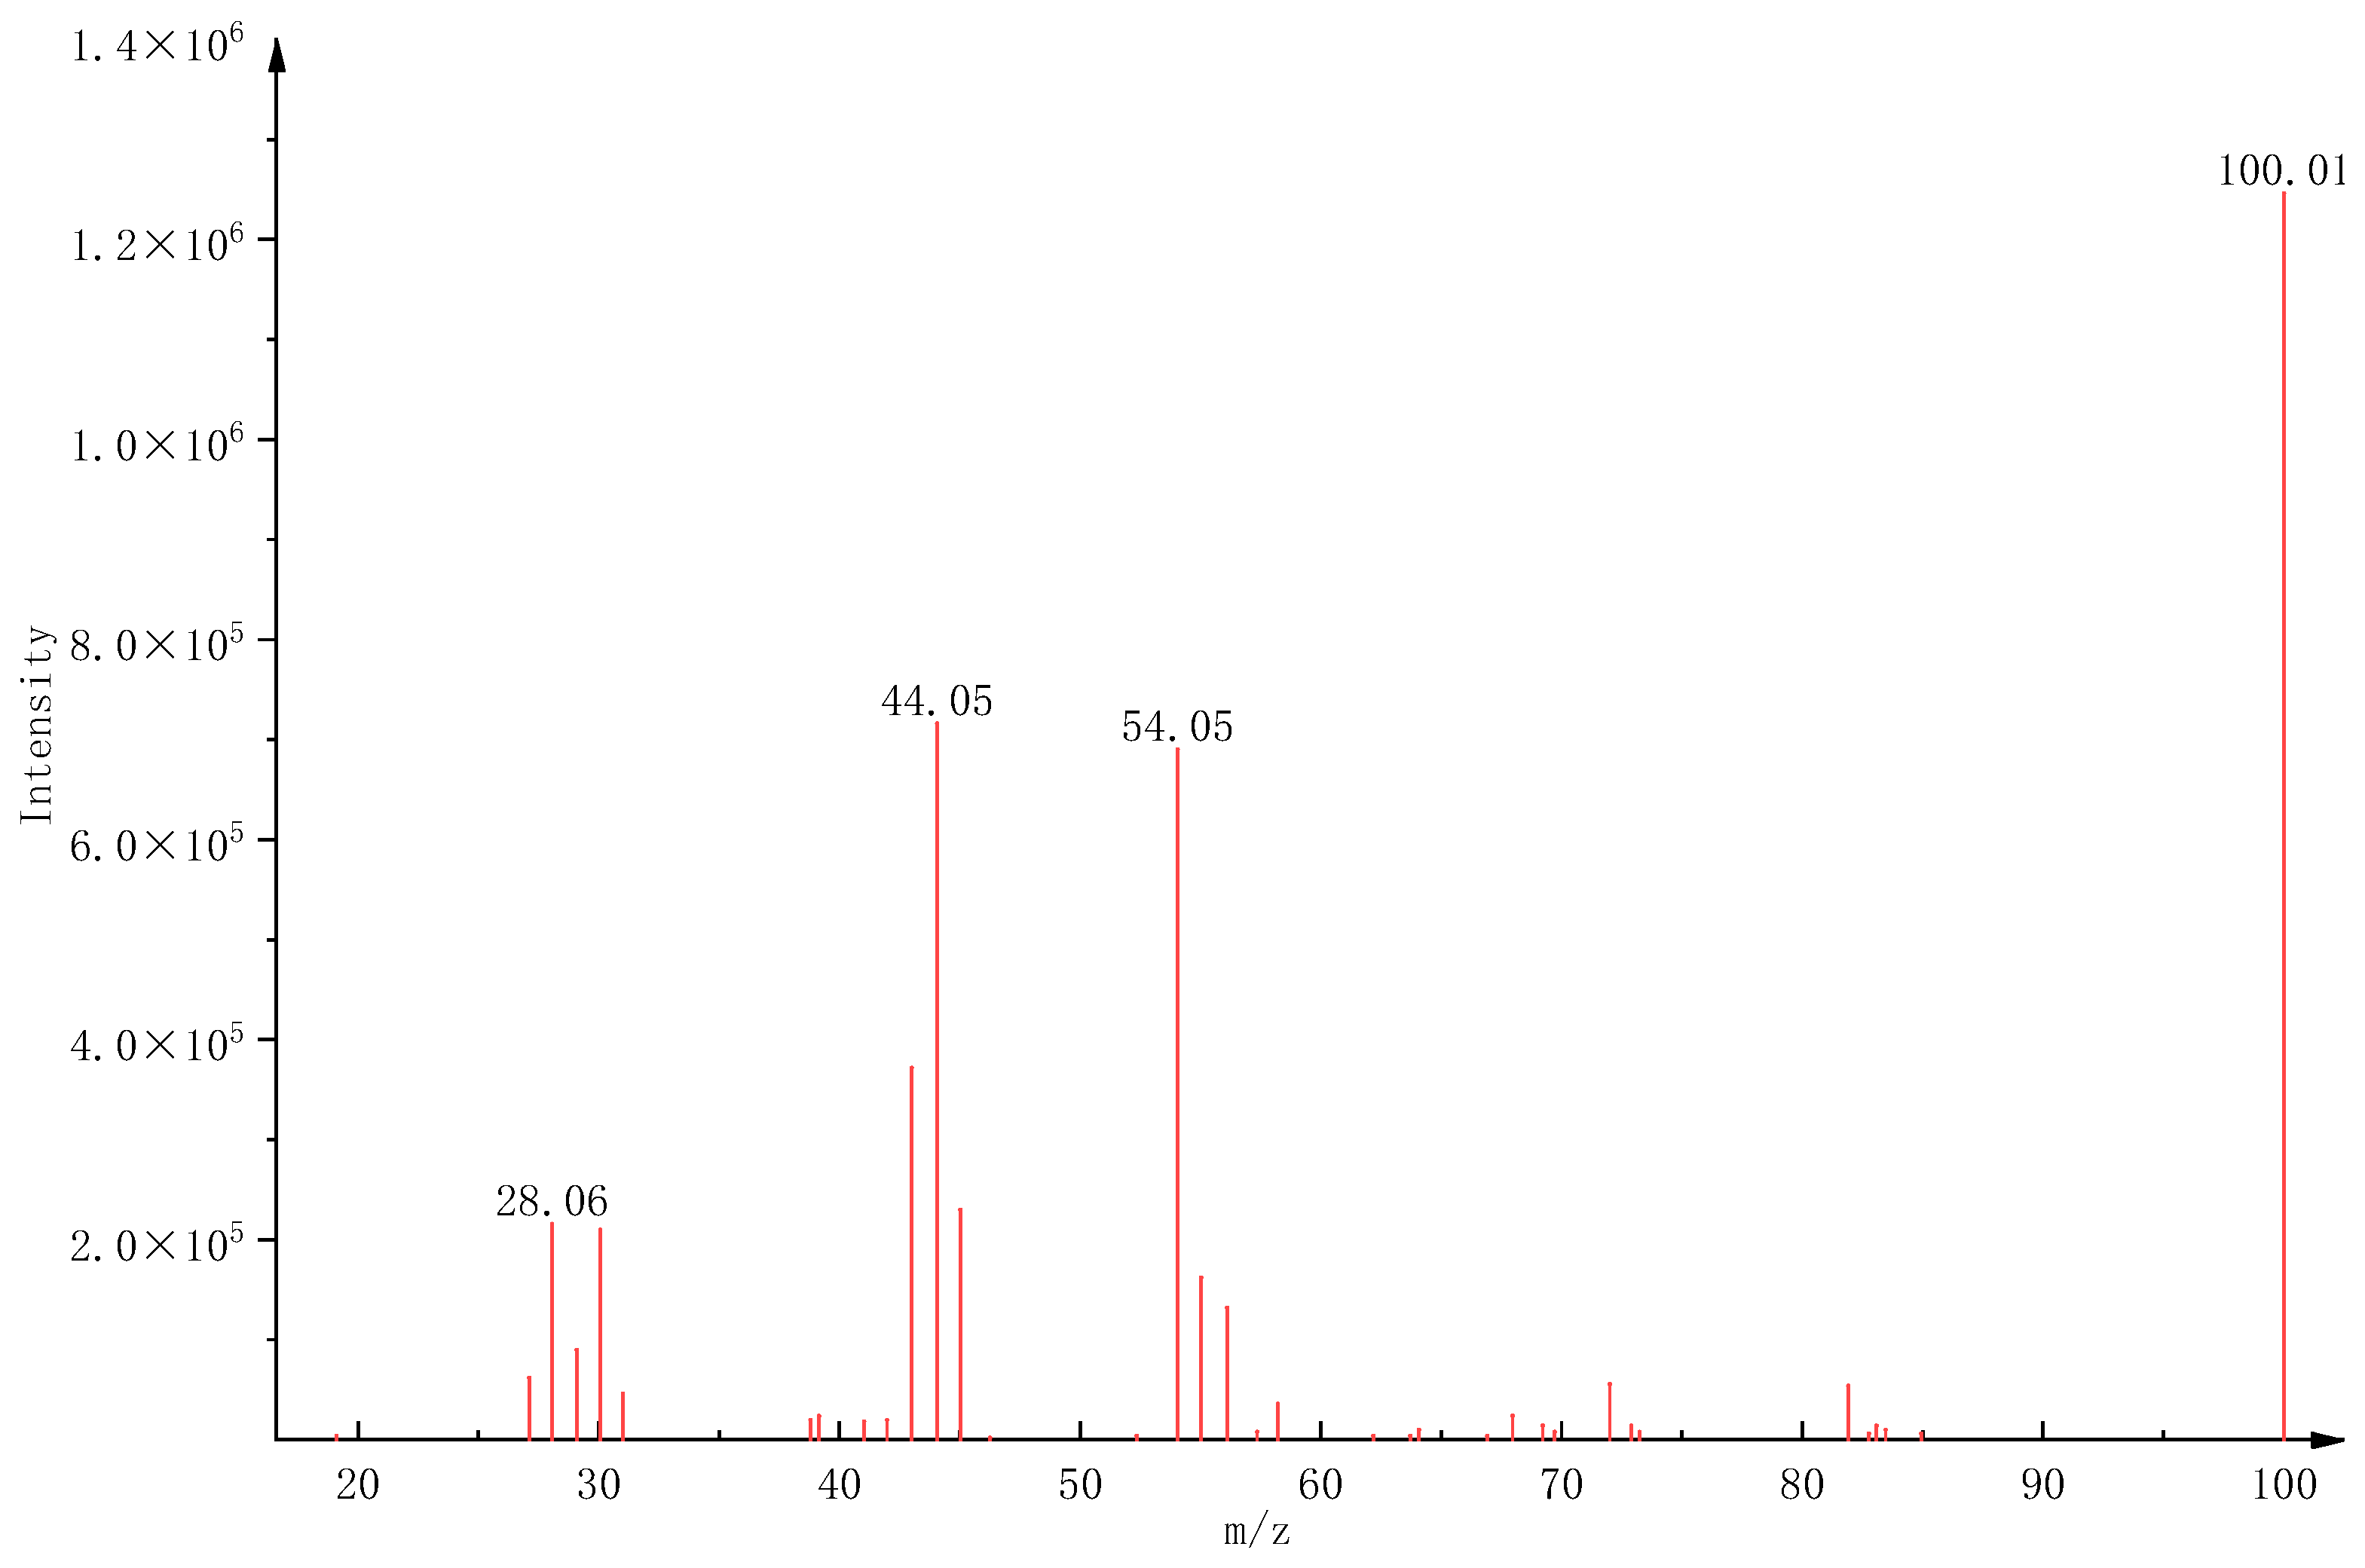
The standard solution of hymexazol was introduced via direct flow injection. The precursor ion of the compound was first identified through full-scan mode, followed by tandem mass spectrometry (MS/MS) scanning to obtain the fragment ions. After condition optimization, the resulting MS/MS spectrum is shown in Figure 1.
Figure 1.
Full-scan mass spectrum of hymexazol product ions.
Ion pairs with relatively high abundance were selected via MRM and identified as qualitative and quantitative ion pairs. Parameters such as declustering potential and collision energy were optimized. Taking into account factors like ion abundance and background interference, the final mass spectrometry conditions are summarized in Table 2. Based on the measured ion abundance ratio of approximately 22%, the ion ratio tolerance was set at ±25% in accordance with the GB 23200.121-2026 [15] standard.
Table 2.
Triple quadrupole ion pairs and related voltage parameter settings.
The spray voltage was optimized by investigating the response of hymexazol under voltages of 500, 1000, 1500, 2000, 2500, 3000, 3500, 4000, 5000, and 5500 V. The results indicated that the response decreased when the spray voltage was below 1500 or above 3000 V. This may be attributed to the strong water solubility of hymexazol and the relatively high surface tension of the solution caused by the low flow rate (0.3 mL/min) used to enhance sensitivity. Under these conditions, a continuous and uniform Taylor cone spray can be formed at a spray voltage of 2500 V. Furthermore, since hymexazol contains a hydroxyl functional group and possesses electrochemical oxidation activity, high-voltage environments can easily trigger tip discharge and precursor ion depletion, ultimately leading to increased background noise and reduced response values.
3.2. Comparison and Optimization of Liquid Chromatography Columns
According to the literature reports, the residual analysis of hymexazol primarily utilized reversed-phase columns, such as C6, C8, and C18. In this study, the peak shape and response of hymexazol were evaluated on AQ-C18, VDX, HILIC, PFP, and C8 columns. The results revealed that hymexazol exhibited poor retention, ineffective separation, and peak tailing on the HILIC column, and even showed peak splitting on the VDX column. Furthermore, the responses were relatively poor on the PFP and C8 columns. Conversely, the AQ-C18 column yielded symmetrical and sharp peaks. These findings are consistent with the studies by Jiang [9] and Kiljanek [16] but differ from those reported by Viñas [6] and Xu et al. [17]. This discrepancy may be attributed to the differences in packing materials and modification processes among columns from various manufacturers. Therefore, the AQ-C18 column was selected as the analytical column for this study.
3.3. Optimization of the Mobile Phase
The mobile phase was optimized by testing methanol and acetonitrile as organic phases and water, 0.1% formic acid, and 10 mM ammonium acetate as aqueous phases. The results indicated that using methanol as the organic phase resulted in a higher response and sharper peak shape compared to acetonitrile. Additionally, when methanol was used as the organic phase, the addition of formic acid to the aqueous phase further enhanced the response. This is because hymexazol contains nitrogen and oxygen atoms; the addition of formic acid provides protons (H+), which effectively improves the response intensity of the precursor ion [M+H]+. Consequently, methanol and 0.1% formic acid were selected as the organic and aqueous phases, respectively. Under these conditions, the baseline was stable, the peak shape was excellent, and the response was high. Furthermore, this study found that reducing the flow rate significantly improved the response of hymexazol. Considering both sensitivity and detection efficiency, the flow rate was set to 0.3 mL/min. Under the experimental conditions described, the retention time of hymexazol was approximately 3.09 min.
Hymexazol undergoes keto-enol prototropic tautomerism [18,19]. In a theoretical study, Nagy [19] investigated the tautomerism of the 3-hydroxyisoxazole parent skeleton. It has been demonstrated that the proton transfer between the enol and keto tautomers of hymexazol proceeds rapidly. Consequently, the two tautomers are hardly separated under conventional liquid chromatographic conditions and usually show a single chromatographic peak in LC-MS analysis.
3.4. Selection and Optimization of Extraction Solvents
To compare the extraction efficiencies of acetonitrile, acetonitrile containing 1% acetic acid, and acetonitrile containing 1% formic acid, this study employed the standard addition method. Hymexazol standard substances were extracted using the three solvents mentioned above at a spiked level of 80 µg/kg, and the recoveries were calculated (see Table 3). Statistical analysis was performed using one-way ANOVA followed by Tukey’s test (p < 0.05) to evaluate the extraction rates.
Table 3.
Results of Tukey’s test for different extraction solvents (n = 6).
The results showed that when pure acetonitrile was used as the extraction solvent, the average recovery of hymexazol was 97.7% with an RSD of 2.0%. For acetonitrile containing 1% formic acid, the average recovery was 93.1% (RSD = 3.6%), and for acetonitrile containing 1% acetic acid, it was 97.3% (RSD = 4.6%). No significant differences were observed in the extraction recoveries among the three solvents. Therefore, pure acetonitrile was selected as the extraction solvent by the drafting group.
3.5. Selection and Optimization of Cleanup Sorbents
Sugar beet samples have a complex matrix containing large amounts of pigments, alkaloids, and other organic and inorganic components. To achieve accurate quantification of the target analyte and protect the instrument from contamination, this study evaluated the cleanup performance of various sorbents, including activated carbon (AC), acidic alumina (Al-A), basic alumina (Al-B), neutral alumina (Al-N), C8, C18, cyanopropyl (CN), Florisil, graphitized carbon black (GCB), phenyl (Ph), primary secondary amine (PSA), strong cation exchange (SCX), strong anion exchange (SAX), and silica. The amount of each sorbent added was 50 mg.
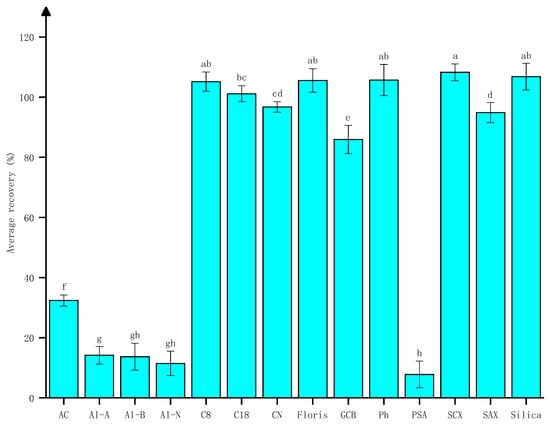
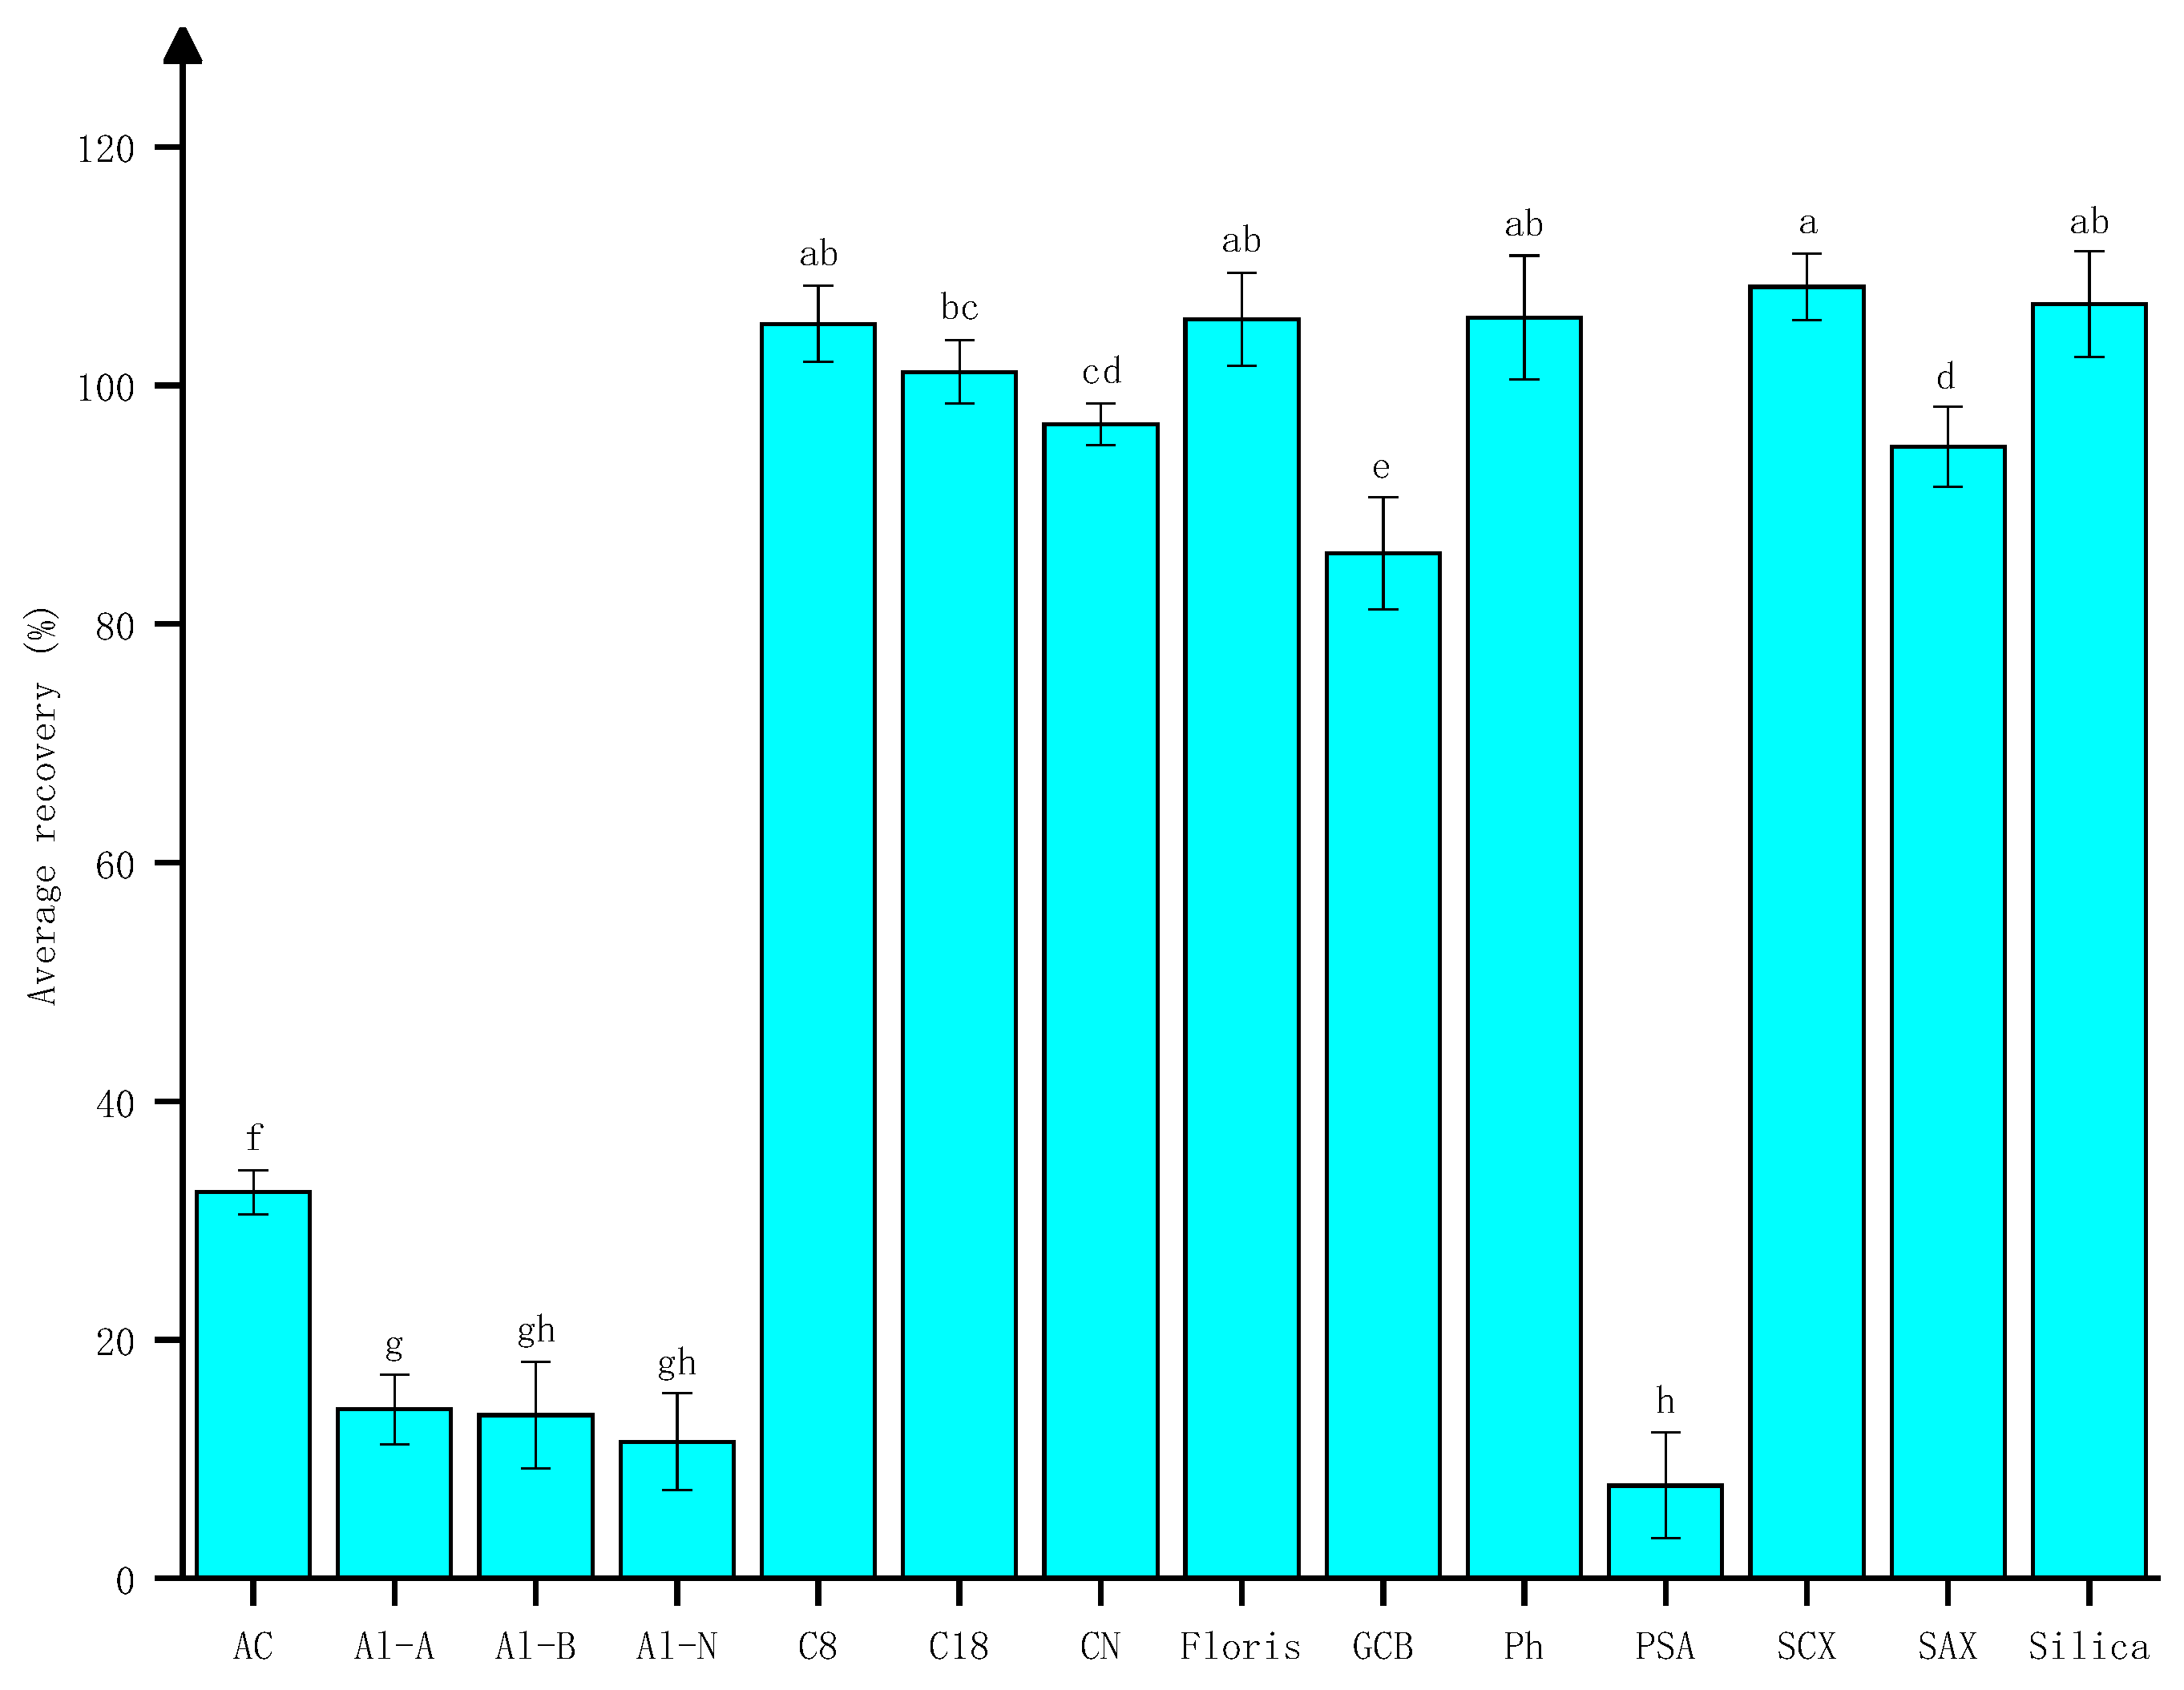
The results indicated that AC, Al-A, Al-B, Al-N, and PSA exhibited strong adsorption towards hymexazol, whereas the adsorption of hymexazol on GCB was within an acceptable range. No adsorption of hymexazol was observed on C8, C18, CN, Florisil, Ph, SCX, and silica. The average recoveries of hymexazol using GCB, C8, C18, CN, Florisil, Ph, SCX, and silica ranged from 85.9 to 108.2%, with relative standard deviations (RSDs) between 1.7 and 5.2%. These sorbents are all suitable for the cleanup step in the LC-MS/MS detection of hymexazol. Statistical analysis was performed using one-way ANOVA followed by Tukey’s test (p < 0.05) to evaluate the extraction rates. The average recoveries and significance analysis are shown in Figure 2.
Figure 2.
Average recovery of hymexazol after cleanup with different sorbents (hymexazol at 100 ng/mL). Different letters indicated significant differences among groups (p < 0.05) as determined by Tukey’s test.
The analysis revealed significant differences in extraction rates among the 14 treatment groups (F = 1218.08, p < 0.0001, df = 13, 70). As exhibited in Figure 2, the extraction rates ranged from 7.8 ± 0.3% (PSA) to 108.2 ± 3.0% (SCX). Ten homogeneous subsets were identified with Tukey’s test. The highest extraction rates were observed in SCX (108.2 ± 3.0%), silica (106.8 ± 4.8%), Ph (105.7 ± 5.5%), Florisil (105.5 ± 4.1%), and C8 (105.1 ± 3.4%). These groups did not differ significantly from one another (all p > 0.05). C18 (101.1 ± 2.7%) showed no significant difference compared to the top-performing group (p = 0.0894) but was significantly higher than CN and SAX (p = 0.0081). CN (96.7 ± 1.7%) and SAX (94.9 ± 3.2%) constituted the same subset; while not significantly different from each other (p = 0.9999), both were significantly lower than the high-performing groups (all p ≤ 0.0081). Distinctly, GCB (85.9 ± 4.0%) formed subset e, and AC (32.4 ± 0.6%) formed subset f, with each being significantly different from all other groups (all p < 0.0001). The lowest extraction rates were observed in Al-A (14.2 ± 0.4%), Al-B (13.7 ± 0.6%), Al-N (11.5 ± 0.5%), and PSA (7.8 ± 0.3%), which showed no significant differences among themselves (all p > 0.05) but were significantly lower than the high-performing groups (all p < 0.0001).
Considering that GCB, silica, and C18 can effectively remove pigments, polysaccharides, phenolic impurities, and alkaloids from the sugar beet extract, respectively, these three sorbents were selected for the cleanup procedure.
3.6. Method Validation Results
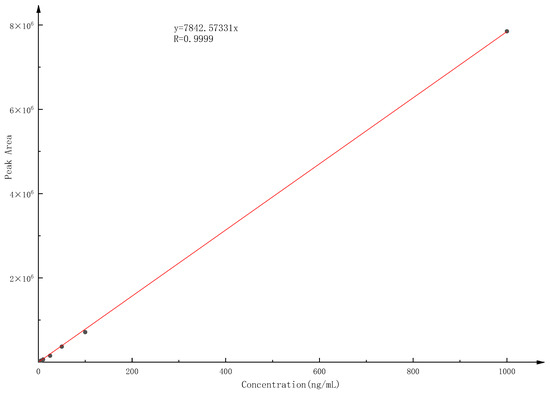
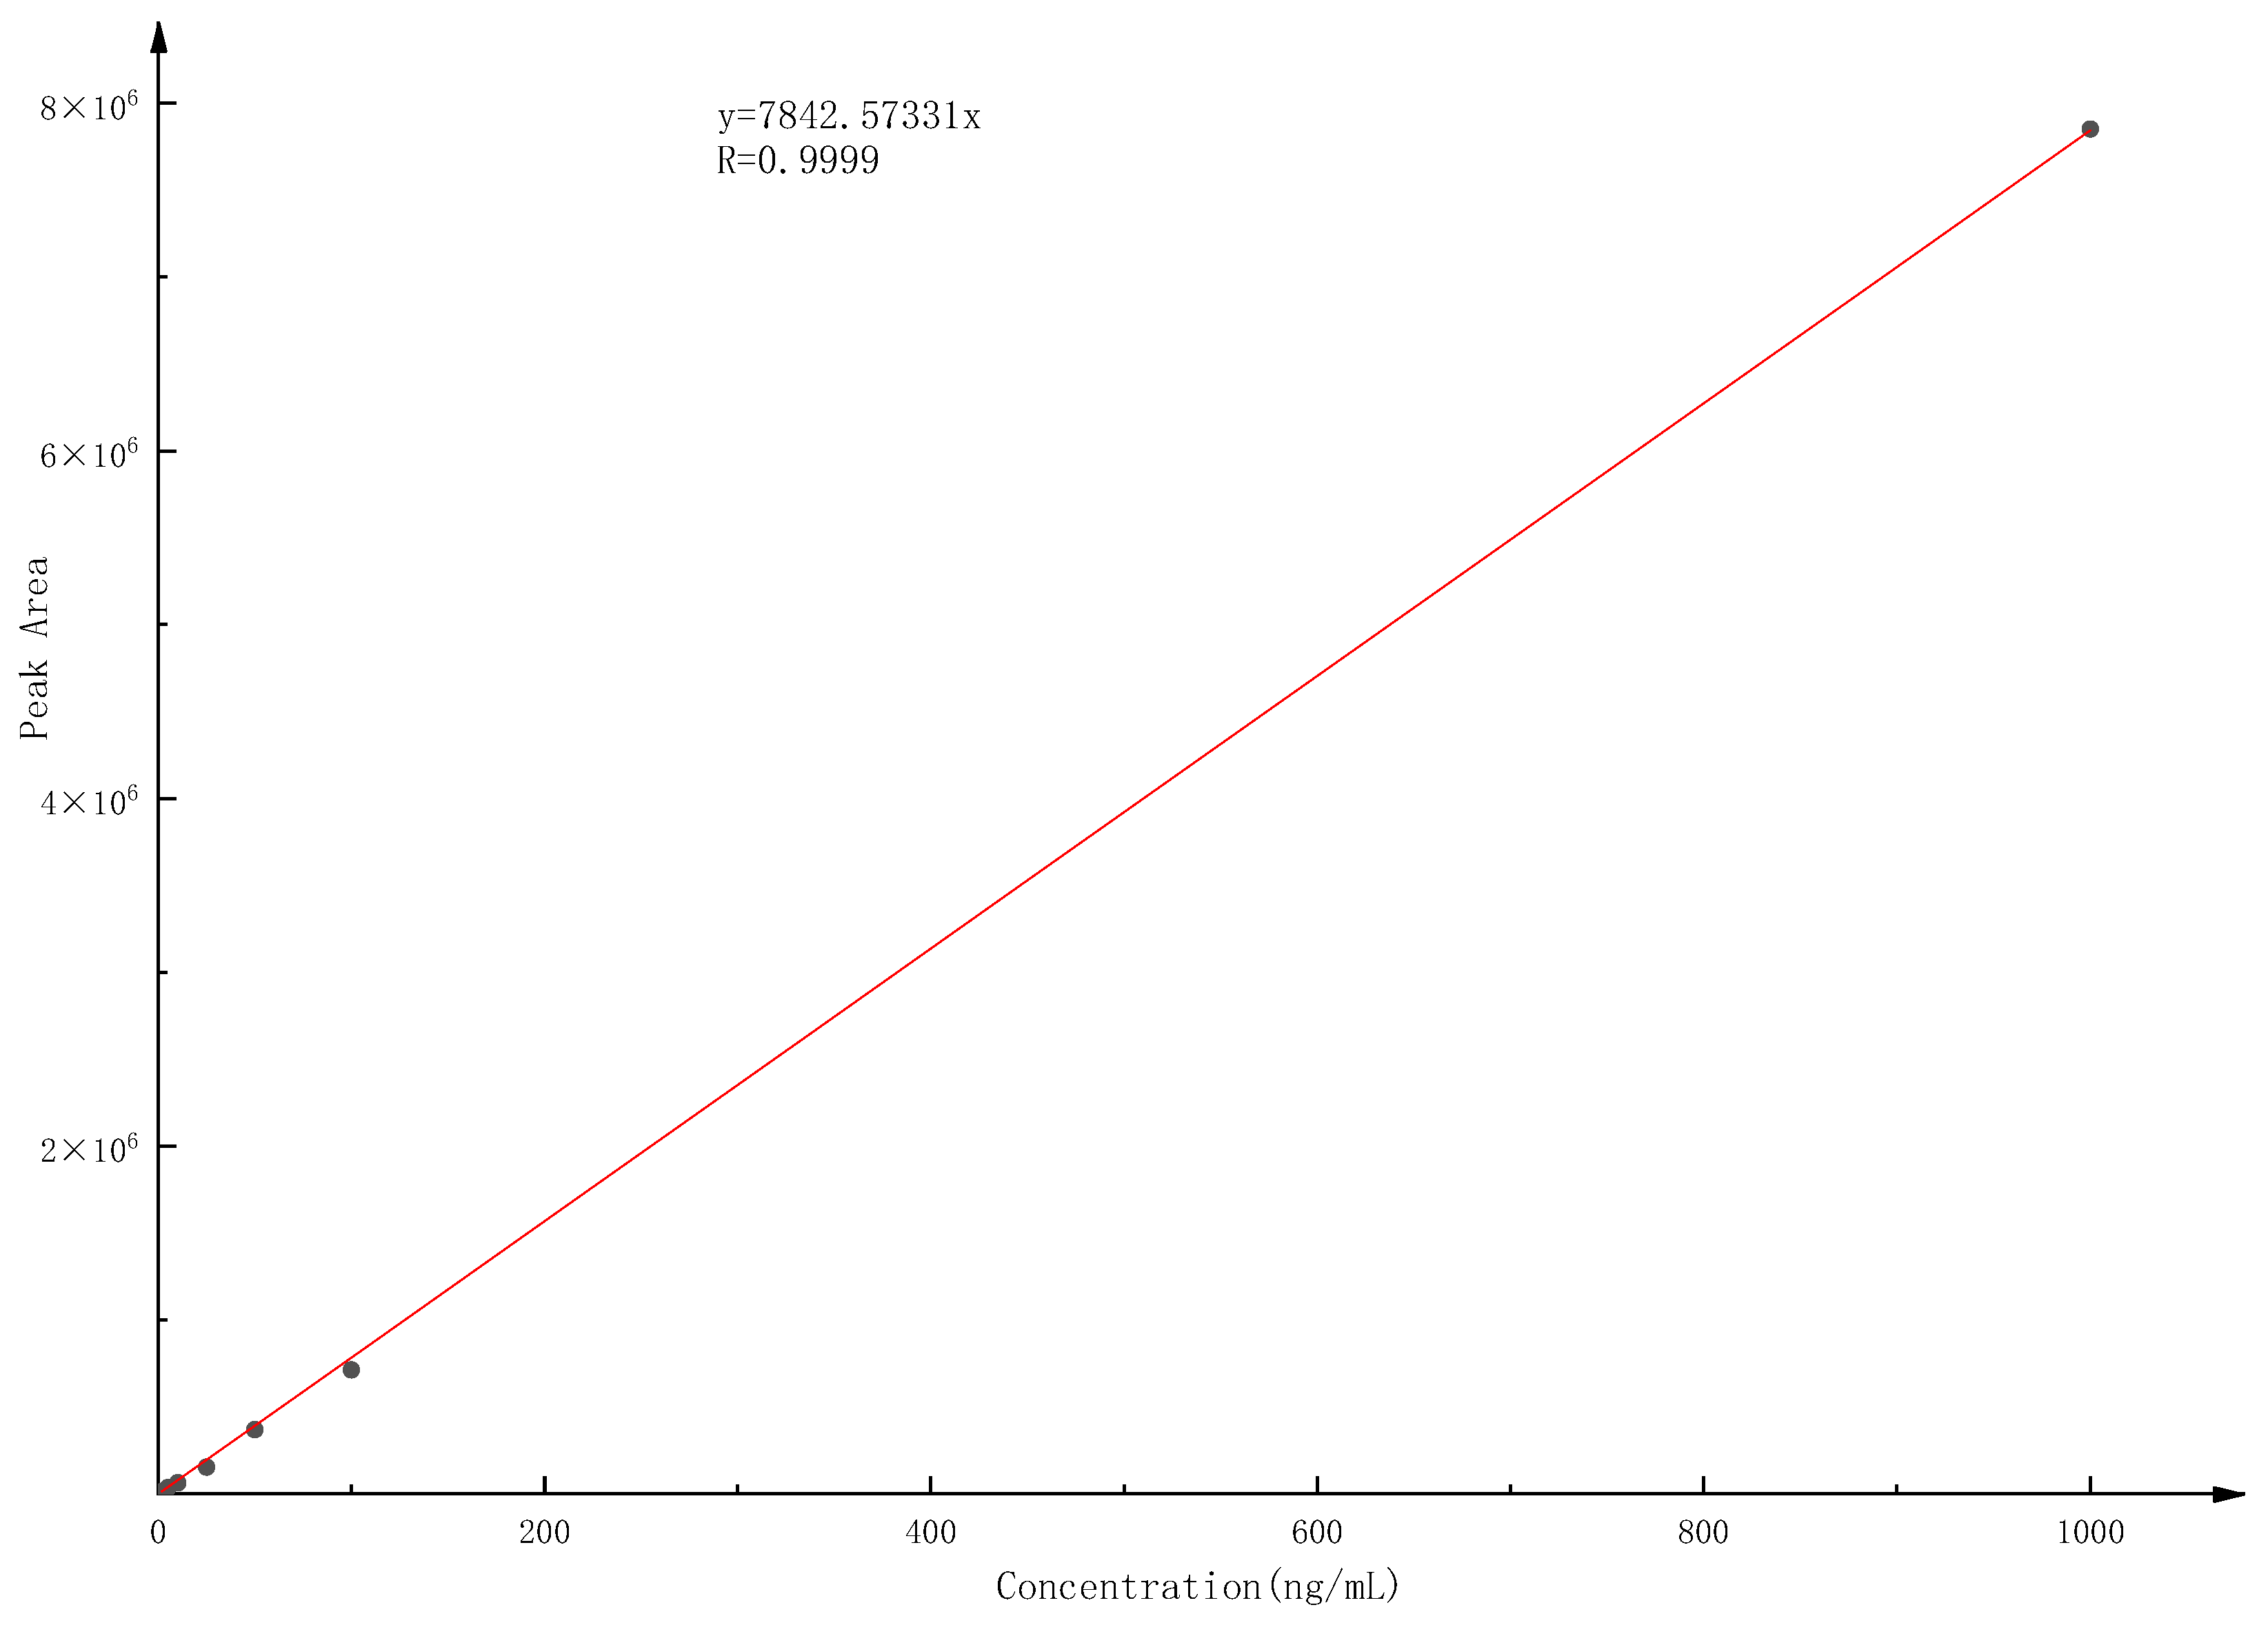
Hymexazol was prepared at concentrations of 1.8, 5, 10, 25, 50, 100, and 1000 ng/mL. The linearity results demonstrated that hymexazol exhibited excellent linearity in the range of 1.8–1000 ng/mL. The linear regression equations and correlation coefficients are summarized in Table 4. The standard calibration curve of hymexazol (1.8–1000 ng/mL) is shown in Figure 3.
Table 4.
Linear regression equations and correlation coefficients for hymexazol.
Figure 3.
Standard calibration curve of hymexazol (1.8–1000 ng/mL).
The theoretical LOD and LOQ are shown in Table 5. The s value at the lowest acceptable spiked level was 0.37. Accordingly, the theoretical LOD and LOQ were 1.22 and 3.80 μg/kg respectively.
Table 5.
LOD and LOQ of hymexazol in sugar beet.
By comparing acetonitrile and matrix-matched standard solutions over a concentration range of 1.8–100 ng/mL, the matrix effect was evaluated, as shown in Table 6. As indicated by the data in Table 6, the sugar beet sample exhibited a weak matrix effect. Therefore, the solvent calibration curve was selected for quantification.
Table 6.
The matrix effects of sugar beet.
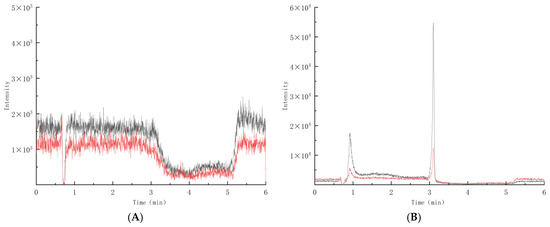
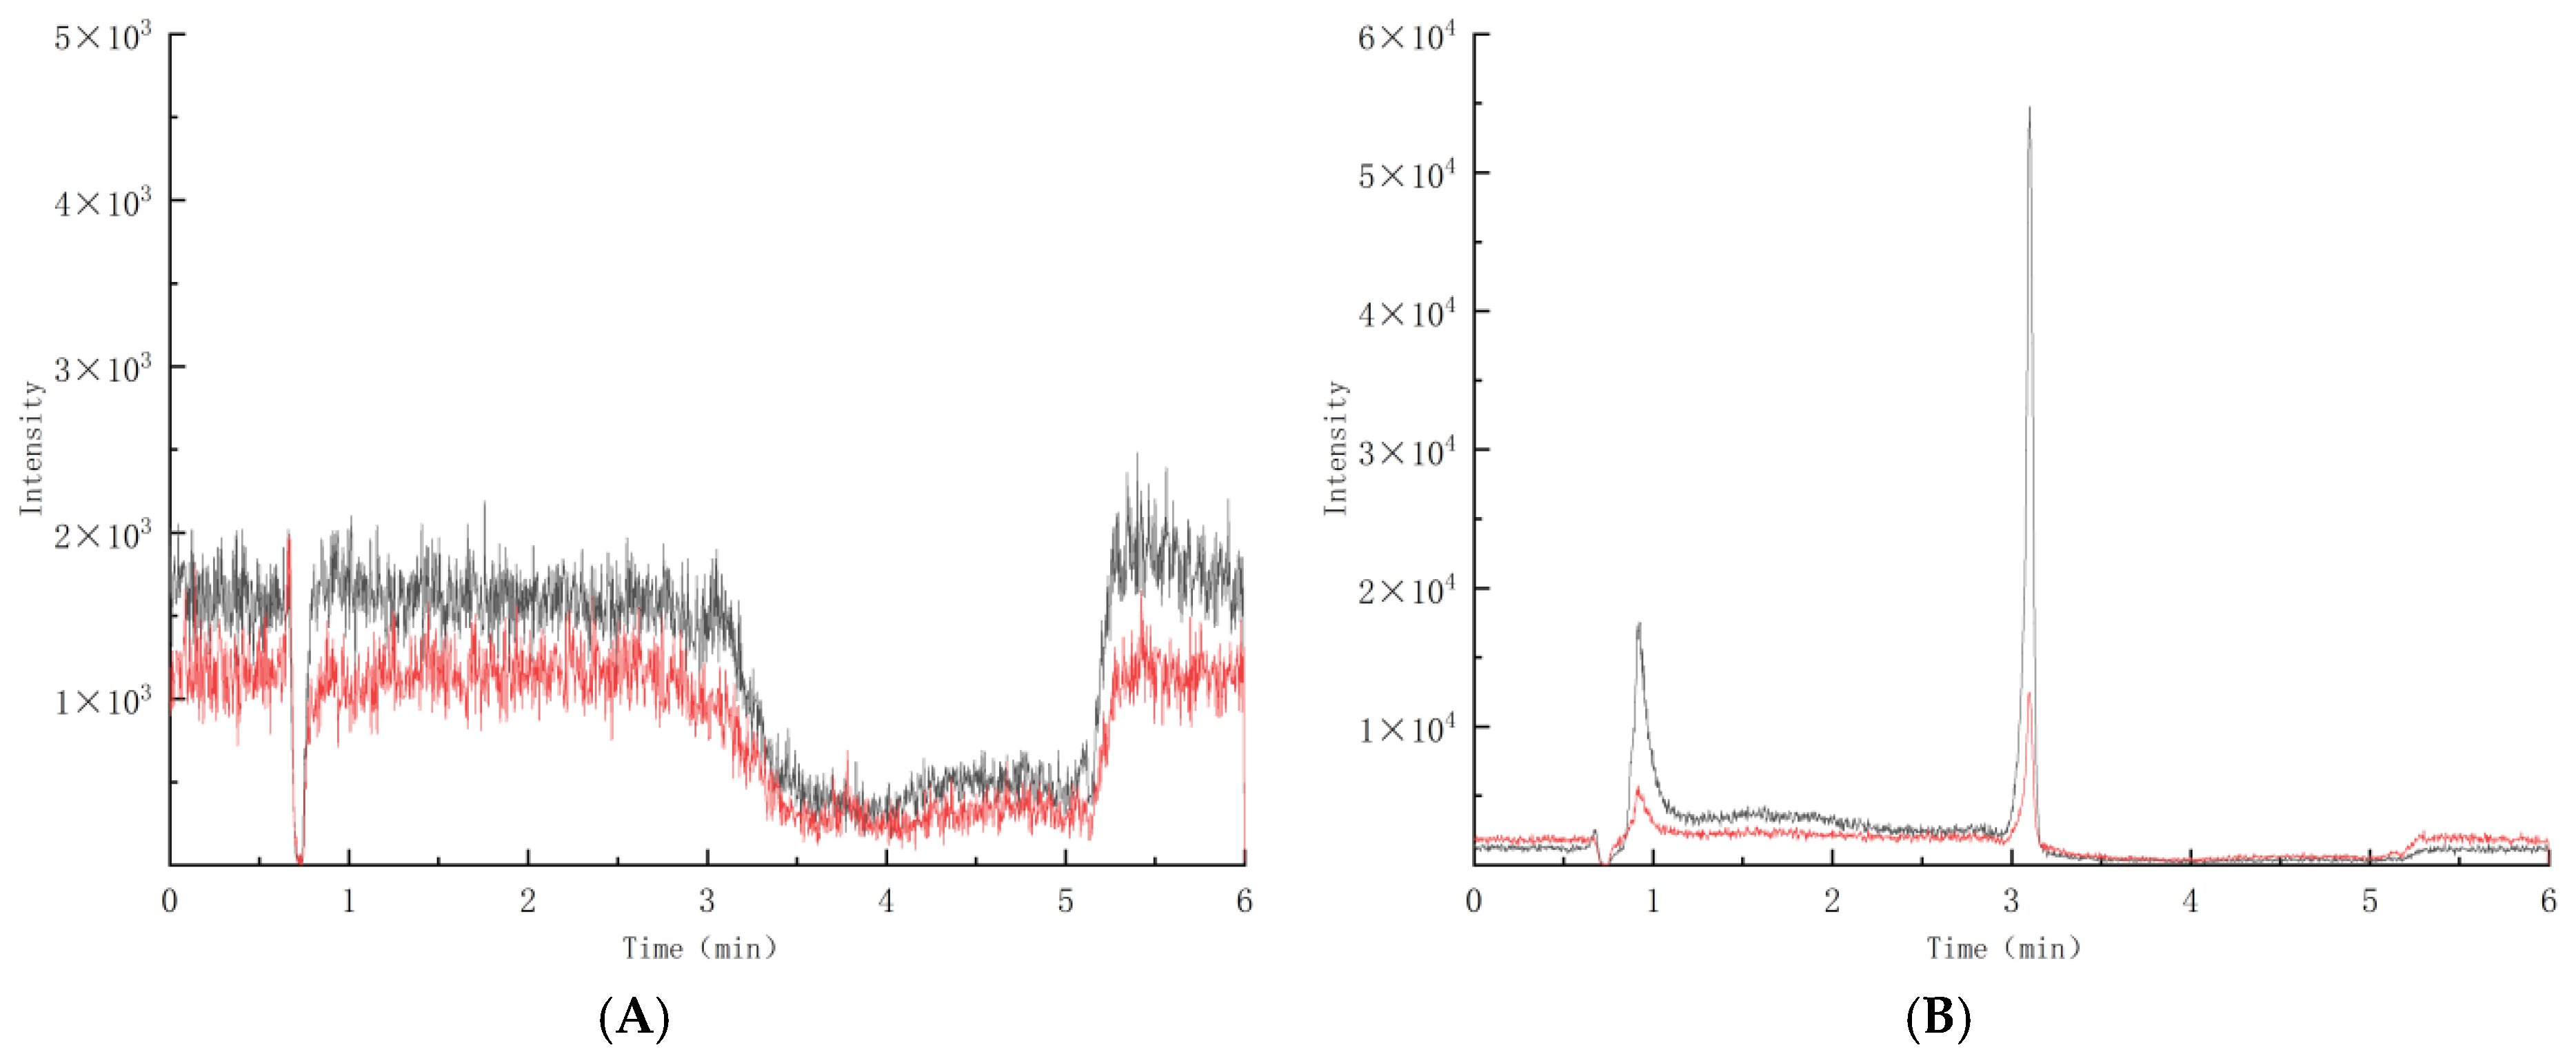
The MRM chromatograms of blank sugar beet matrix and spiked sample are shown in Figure 4. No significant interfering peaks were observed at the retention time of hymexazol, confirming the high selectivity of the method.
Figure 4.
MRM chromatograms of blank sugar beet matrix and spiked sample (The black trace represents the quantitative ion pair, while the red trace represents the qualitative ion pair). (A) MRM chromatogram of blank sugar beet matrix. (B) MRM chromatogram of spiked sugar beet sample (spiked at 50 μg/kg).
The spiked levels were set at 5.0, 10 and 50 μg/kg. The recovery rates and RSDs of spiked sugar beet samples are shown in Table 7.
Table 7.
Sugar beet sample intraday and interday recovery rates and RSDs.
As shown in Table 7, the intraday recovery rates of hymexazol spiked in sugar beet samples ranged from 80.2 to 97.9%, with RSDs ranging from 4.8 to 6.4%. The interday recovery rates ranged from 78.1 to 101.7%, with RSDs ranging from 4.6 to 8.8%. The RSDs were all less than 15%. All the obtained validation parameters met the criteria specified in GB/T 27417-2017 [13]. Additionally, the RSDs of retention time were 0.24% for intraday and 0.25% for interday.
3.7. Analysis of Real Samples
The proposed method was applied to analyze 15 commercially available sugar beet samples, and hymexazol was not detected in any of the samples.
Although no hymexazol residues were detected in the actual samples in this study, matrix spike assays demonstrated the acceptable accuracy and reliability of the method in the sugar beet matrix.
4. Conclusions
In this study, a rapid, simple, sensitive, and reliable method was developed and validated for the determination of hymexazol residues in sugar beets. The experimental conditions, including mass spectrometry parameters, chromatographic column, mobile phase, cleanup sorbents, and matrix effects, were systematically investigated and optimized. The proposed method exhibited excellent linearity with a correlation coefficient (r) greater than 0.999. The theoretical LOD and LOQ were 1.22 and 3.80 μg/kg, respectively. At the spiked levels of 5.0, 10, and 50 μg/kg, the intraday and interday recoveries were 80.2–97.9% and 78.1–101.7%, with corresponding RSDs of 4.8–6.4% and 4.6–8.8%, respectively. These results fully met the requirements for pesticide residue analysis and the analytical requirements for the MRLs of hymexazol in sugar beets (roots) in the European Union and China. Furthermore, the method has been successfully applied to the analysis of real samples.
In summary, this method is highly suitable for regulatory compliance monitoring and the highly sensitive determination of hymexazol residues in sugar beets, serving as a reliable reference for future routine screening.
Author Contributions
Methodology, Y.W., Z.L. (Zhengang Liang) and H.H.; Validation, Y.W., Z.L. (Zhengang Liang), H.H., Z.L. (Zhenfeng Lin) and Q.L.; Formal analysis, H.H. and Q.L.; Investigation, Z.L. (Zhenfeng Lin) and Q.L.; Data curation, Z.L. (Zhenfeng Lin); Writing—original draft, Y.W.; Writing—review and editing, Y.W.; Project administration, Y.W.; Funding acquisition, Y.W. All authors have read and agreed to the published version of the manuscript.
Funding
This research was funded by the Hainan Provincial Natural Science Foundation of China (326MS0343), the Program for Customs Technical Specifications of General Administration of Customs, China (Plan No. 2024B161), and the Research Project of General Administration of Customs, China (2025HK171).
Data Availability Statement
The data presented in this study are available within the article.
Conflicts of Interest
The authors declare no conflicts of interest.
References
- Sun, D.; Li, L.; Ji, R.; Li, W.; Ye, H.; Wu, Y.; Liu, C. Determination of hymexazol in cucumber and soil samples by derivatization using GC-FPD. Bull. Environ. Contam. Toxicol. 2011, 87, 653–656. [Google Scholar] [CrossRef] [Scilit]
- Ban, R.; Song, B.; Yang, S.; Hu, D.; Wang, J.; Zeng, S.; Huang, R. Degradation dynamics of hymexazol in Polygonum capitatum Buch. Agrochemicals 2007, 46, 187–188, 201. [Google Scholar]
- Li, H.; Jiang, Z.; Cao, W.; Yang, L.; Shao, H.; Jin, F.; She, Y.; Jin, M.; Wang, S.; Zheng, L.; et al. Determination of hymexazol in 6 plant-derived agro-products by three analytical methods. J. Instrum. Anal. 2016, 35, 1434–1439. [Google Scholar]
- Tan, Z.; Guo, Z. Determination of hymexazol residue in rice by GC. Pestic. Sci. Adm. 2011, 32, 29–31. [Google Scholar]
- Tamura, Y.; Takano, I.; Kobayashi, M.; Tomizawa, S.; Tateishi, Y.; Sakai, N.; Kamijo, K.; Ibe, A.; Nagayama, T. Determination of hymexazol in agricultural products by GC-NPD. J. Food Hyg. Soc. Jpn. 2008, 49, 223–227. [Google Scholar] [CrossRef] [Scilit]
- Viñas, P.; Aguinaga, N.; Campillo, N.; Hernández-Córdoba, M. Comparison of stir bar sorptive extraction and membrane-assisted solvent extraction for the ultra-performance liquid chromatographic determination of oxazole fungicide residues in wines and juices. J. Chromatogr. A 2008, 1194, 178–183. [Google Scholar] [CrossRef] [Scilit]
- Viñas, P.; Campillo, N.; Aguinaga, N.; Martínez-Castillo, N.; Hernández-Córdoba, M. Solid-phase microextraction for the gas chromatography mass spectrometric determination of oxazole fungicides in malt beverages. Anal. Bioanal. Chem. 2008, 391, 1425–1431. [Google Scholar] [CrossRef] [Scilit]
- Vinas, P.; Martínez-Castillo, N.; Campillo, N.; Hernández-Córdoba, M. Liquid-liquid microextraction methods based on ultrasound-assisted emulsification and single-drop coupled to gas chromatography–mass spectrometry for determining strobilurin and oxazole fungicides in juices and fruits. J. Chromatogr. A 2010, 1217, 6569–6577. [Google Scholar] [CrossRef] [Scilit]
- Jiang, Z.; Li, H.; Cao, X.; Du, P.; Shao, H.; Jin, F.; Jin, M.; Wang, J. Determination of hymexazol in 26 foods of plant origin by modified QuEChERS method and liquid chromatography tandem -mass spectrometry. Food Chem. 2017, 228, 411–419. [Google Scholar] [CrossRef] [Scilit]
- Guo, C.; Song, Y.; Li, J.; Xie, L.; Wang, G.; Xu, Q.; Xu, F. Determination of hymexazol pesticide residues in Ginseng by HPLC-MS/MS. Ginseng Res. 2023, 3, 32–33. [Google Scholar]
- Báez-Sañudo, M.A.; Jiménez-Ortega, L.A.; de Jesús Bastidas-Bastidas, P. Assessment of Residuality of Hymexazol in Strawberry (Fragaria × ananassa) Crop by a Modified QuEChERS Method and Liquid Chromatography Tandem-Mass Spectrometry. Agronomy 2022, 12, 3110. [Google Scholar] [CrossRef] [Scilit]
- GB 2763-2026; National Food Safety Standard—Maximum Residue Limits for Pesticides in Food. Standards Press of China: Beijing, China, 2026.
- GB/T 27417-2017; Comformity Assessment-Guidance on Validation and Verification of Chemical Analytical Methods. Standards Press of China: Beijing, China, 2017.
- Walorczyk, S. Validation and use of a QuEChERS-based gas chromatographic–tandem mass spectrometric method for multiresidue pesticide analysis in blackcurrants including studies of matrix effects and estimation of measurement uncertainty. Talanta 2014, 120, 106–113. [Google Scholar] [CrossRef] [Scilit]
- GB 23200.121-2026; National Food Safety Standard-Determination of 352 Pesticides and Metabolitesresidues in Foods of Plant Origin-Liquid Chromatography-Tandem Mass Spectrometry Method. Standards Press of China: Beijing, China, 2026.
- Kiljanek, T.; Niewiadowska, A.; Semeniuk, S.; Gaweł, M.; Borzęcka, M.; Posyniak, A. Multi-residue method for the determination of pesticides and pesticide metabolites in honeybees by liquid and gas chromatography coupled with tandem mass spectrometry—Honeybee poisoning incidents. J. Chromatogr. A 2016, 1435, 100–114. [Google Scholar] [CrossRef] [Scilit]
- Xu, Y.; Cui, L.; Wang, Y.; Wang, C.; Gao, J. Study on Residual Decline and Final Residues of Hymexazol in Panax ginseng and Soil. Mod. Agrochem. 2015, 14, 29–31. [Google Scholar]
- Qin, Z.; Mao, S.; Liang, X. The study on tautomerism of hymexazol. Chin. J. Magn. Reson. 2000, 17, 143–147. [Google Scholar]
- Nagy, P.I. Replacement of oxygen by sulfur in small organic molecules. 3. Theoretical studies on the tautomeric equilibria of the 2OH and 4OH-substituted oxazole and thiazole and the 3OH and 4OH-substituted isoxazole and isothiazole in the isolated state and in solution. Int. J. Mol. Sci. 2016, 17, 1094. [Google Scholar] [CrossRef] [Scilit]

Disclaimer/Publisher’s Note: The statements, opinions and data contained in all publications are solely those of the individual author(s) and contributor(s) and not of MDPI and/or the editor(s). MDPI and/or the editor(s) disclaim responsibility for any injury to people or property resulting from any ideas, methods, instructions or products referred to in the content. |
© 2026 by the authors. Licensee MDPI, Basel, Switzerland. This article is an open access article distributed under the terms and conditions of the Creative Commons Attribution (CC BY) license.