


Abstract
Plant-based dietary supplements are regulated as food and made from raw materials of variable composition, so their quality control requires reliable analytical processes. A procedure for the determination of calcium and iron by high-resolution continuum source flame atomic absorption spectrometry (HR-CS FAAS) was developed, optimized, and validated. It comprised microwave-assisted digestion and optimization of flame atomization with a flame height of 8 mm and a lanthanum releasing agent concentration 0.4%, used to suppress chemical interferences in calcium determination. The limits of detection for calcium and iron were 0.13 mg L−1 and 0.02 mg L−1, respectively. The accuracy of the method was validated using INCT-MP4-2 (Mixed Polish Herbs) certified reference material and complemented by spike recovery tests. The determined contents showed satisfactory agreement with certified values and added amounts, as confirmed by a t-test at a 95% confidence level. The procedure was applied to sixteen commercial plant-based samples representing four distinct botanical sources (nettle, moringa, spirulina, and chlorella). Iron content per serving ranged from 0.14 to 3.34 mg, whereas calcium content per serving did not exceed 32.80 ± 0.46 mg in any of the tested products.
1. Introduction
Iron is an essential element for the human body. It is a core component of hemoglobin and myoglobin—proteins responsible for oxygen transport and storage of oxygen—and is indispensable for proper growth and development [1]. Its daily requirement depends on age, sex, and diet, reaching 18 mg for adult women and 27 mg during pregnancy [2]. Insufficient iron intake can lead to fatigue, poor concentration, headaches, and impaired immune function. Iron deficiency is particularly common among people following a vegetarian or vegan diet [1,3]. Therefore, iron dietary supplements are widely used in the prevention and treatment of iron deficiency anemia [1]. In recent years, plant-based iron supplements have attracted growing interest, especially among vegetarians and vegans [4,5].
Plant-based iron supplements are commonly produced from raw materials such as nettle (Urtica dioica), moringa (Moringa oleifera), spirulina (Arthrospira platensis) and chlorella (Chlorella vulgaris) [6,7,8]. Leaves of nettle and moringa are used as natural sources of iron. Dried moringa leaves can contain approximately 25 mg of iron per 100 g, while dried nettle leaves typically contain between 19 mg and more than 200 mg of iron per 100 g of dry matter, depending on soil conditions and harvest time [9]. However, iron from moringa leaves is reported to be poorly bioavailable [10]. Spirulina and chlorella, although not plants in the botanical sense, contain considerably more iron, on the order of 100 mg per 100 g of dry biomass [6,7], and are frequently used in products aimed at vegetarians and vegans. Nevertheless, iron in spirulina occurs mainly in ferric form, which is less bioavailable [6]. At the same time, these materials naturally contain considerable amounts of calcium, from approximately 280 to 790 mg per 100 g of nettle [11] and more than 2000 mg per 100 g of dried moringa leaves [12] to more than 1000 mg per 100 g of spirulina supplements [8]. Plant-based iron supplements can therefore deliver both elements simultaneously.
Natural raw materials vary inherently in their chemical composition. The desired component usually constitutes only a small fraction of the plant mass, and once the sample is brought to solution, it contains many other compounds originating from the raw material. In addition, the content of active substances can differ between batches depending on the species, variety, environmental conditions, and maturity at harvest, which makes the standardization of plant-derived active substances considerably more difficult. The composition of a supplement is also affected by how the raw material is obtained and processed: drying and storage conditions, as well as the degree of grinding, can lead to degradation of substances and influence the fraction of iron available for extraction. In addition, due to soil and water pollution, plant materials can contain small amounts of microbial contaminants and chemical contaminants such as pesticides and heavy metals. The latter are particularly dangerous to consumers, as heavy metals can accumulate in body tissues and cause toxic effects, such as liver damage [13].
For this reason, herbal medicinal products are subject to strict registration requirements. They undergo rigorous quality control for purity, stability, bioavailability, and clinical efficacy [14,15]. In contrast, plant-based dietary supplements are regulated as food, which means they are subject to less supervision and to less frequent and stricter controls, which can negatively affect product quality [16,17]. This highlights the need for independent analytical control of the composition of plant-based iron supplements, including the content of accompanying elements such as calcium.
In addition to product quality, the effectiveness of iron supplementation depends not only on the dose but also on the bioavailability of iron. Non-heme iron, which is characteristic of plant-derived products, is poorly absorbed, and its absorption is strongly influenced by other components of the diet, such as calcium, vitamin C, and polyphenols [18]. Calcium is a vital element involved in the structure of bones and teeth, as well as in the function of cell membranes and many enzymes [19,20]. Its recommended intake is 1000–1300 mg per day, depending on the stage of life [20,21,22]. The presence of calcium in plant-based iron supplements can inhibit iron absorption [20,21]. Determining the calcium content of these products is therefore important for assessing their quality and actual nutritional value.
The analysis of plant-based samples is challenging due to their complex matrix. Interfering species such as aluminum, titanium, silicates, phosphates, and sulfates can form stable compounds with calcium and decrease the analytical signal [23]. Calcium can be determined by several techniques, including ICP-MS [24], ICP-OES [25], flame photometry [26], ion chromatography [27], and complexometric titration with EDTA [28]. These methods differ in sensitivity, selectivity, cost, and complexity. Among them, flame atomic absorption spectrometry (FAAS) is the most widely applied. It combines low operating costs, simplicity, short analysis time, and good repeatability with adequate sensitivity, compared to plasma-based instruments. Its main limitations are the lack of simultaneous multi-element capability and the potential for chemical and spectral interference, which can be reduced by proper sample preparation, dilution, and the use of ionization buffers or matrix modifiers [29].
Iron in dietary supplements can be determined using a similar range of analytical techniques. Classical methods include redox titrations and UV-Vis spectrometry [30]. These methods are simple and inexpensive, but less sensitive than instrumental techniques and more susceptible to interference from the sample matrix [31]. Atomic spectrometry techniques are, therefore, more widely used. FAAS enables fast and reliable determination of iron at 248.3 nm in the typical concentration range of supplements, whereas graphite furnace AAS (GF-AAS) offers lower detection limits when iron content is low [32]. Inductively coupled plasma techniques, ICP-OES and ICP-MS, allow simultaneous multi-element determination, including iron together with calcium and other accompanying elements, but require more expensive equipment [25]. Most techniques require complete mineralization of the organic matrix, most often by wet digestion with concentrated acids, to obtain reliable results [33].
Despite the wide use of FAAS, the data on Ca and Fe in plant-based iron supplements remain limited. HR-CS FAAS has been applied mainly to beverages [34,35], and reports on supplements focus on Fe and Zn without Ca [32]. Calcium is a major natural component of nettle, moringa, spirulina, and chlorella [8,9,11], so after digestion it is present in the sample solution at substantial concentrations together with phosphates, silicates, and other species that suppress the Ca signal. This makes the determination of Ca in such matrices more demanding than in simple solutions, and the conditions of releasing-agent use should be verified in a real plant matrix. Moreover, Ca may inhibit non-heme iron absorption, so both elements should be determined in the same product. This study aimed to develop and validate an HR-CS FAAS procedure for Ca and Fe in plant-based supplements and foods, optimising the concentration of La in a certified plant matrix and determining the amounts of calcium and iron delivered per serving, which can be considered in the context of reported calcium–iron interactions. Although these results provide precise data on the total analytical composition required for quality control and labelling verification, they do not imply direct physiological availability, which is subject to complex dietary and metabolic interactions.
2. Materials and Methods
2.1. Reagents
All chemical reagents used in this study were of analytical grade or higher purity. High-purity water (resistivity ≥ 18.2 MΩ∙cm) was used throughout the study. It was initially obtained from a reverse osmosis system (DEMIWA 5 Rosa, Watek, Ledeč nad Sázavou, Czech Republic) and subsequently purified by distillation in a Bi18 quartz still (Heraeus, Hanau, Germany). Concentrated reagents, including 65% (w/w) nitric acid, 40% (w/w) hydrofluoric acid, 30% (w/w) hydrogen peroxide, and 32% (w/w) hydrochloric acid, were purchased from Merck (Darmstadt, Germany). Lanthanum chloride hexahydrate (LaCl3∙6H2O, 99.9% REO) was obtained from Alfa Aesar (Ward Hill, MA, USA). Ca and Fe working standard solutions were prepared by appropriately diluting commercially available 1000 mg L−1 atomic absorption stock standards (Merck, Darmstadt, Germany).
The lanthanum solution (approximately 26 g L−1 La), used as a release agent, was prepared by dissolving 65.9 g of LaCl3·6H2O in high-purity water in a 1000 mL volumetric flask, adding 50 mL of concentrated hydrochloric acid and, after the solution had cooled, diluting it to the mark with high-purity water. Compressed air of N-50 purity (99.999%), purchased from BOC GAZY (Poznań, Poland), served as the oxidant gas without further purification. Compressed acetylene of medical purity, obtained from Cezal (Poznań, Poland), was used as the fuel gas to sustain the air–acetylene flame.
2.2. Certified Reference Material
The certified reference material INCT-MP4-2 (Mixed Polish Herbs), obtained from the Institute of Nuclear Chemistry and Technology in Warsaw, Poland, was used to verify the accuracy of the proposed analytical method.
2.3. Dietary Supplements and Food Samples
Sixteen commercial food products and dietary supplements in various physical forms (powders, tablets, and loose products) were analyzed. Five packages of each product, from different batches of production, were purchased from local pharmacies and grocery stores. The contents of the five packages were combined into one composite sample per product. The samples NL, NH, NT1, and NT2 were derived from stinging nettle (Urtica dioica); MP1, MP2, MT1 and MT2 from moringa (Moringa oleifera); CP1, CP2, CT1, and CT2 from chlorella (Chlorella vulgaris); and SP1, SP2, ST1, and ST2 from spirulina (Arthrospira platensis). Each product was manufactured by a different company. Before digestion, the samples were homogenized by manual grinding in a ceramic mortar, followed by thorough mixing and sieving through a 2 mm sieve. The samples were analysed as sold; they were not dried and the results were not corrected for moisture. Therefore, all concentrations refer to the products as sold. A detailed overview of the analyzed samples is presented in Table 1.
Table 1.
Categorization and botanical sources of the analyzed plant-based food products and dietary supplements.
2.4. Microwave-Assisted High Pressure Teflon Bomb Digestion
Sample mineralization was performed using a UniClever focused microwave decomposition system (Plazmatronika, Wrocław, Poland), which operates at a microwave frequency of 2450 MHz with a maximum power capability of 300 W. The digestion parameters, including temperature, pressure, and applied power, were monitored and regulated in real time through a computer-controlled interface. The process was conducted in closed 110 mL high-pressure TFM-PTFE vessels rated for up to 100 atm and 300 °C.
Approximately 500 mg of powdered supplement (one digestion per composite sample as sold, not dried) were weighed in a TFM-PTFE vessel using an M2P microanalytical balance (Sartorius, Göttingen, Germany). To avoid aggressive foaming, the samples were pre-wetted with 1.75 mL of 30% (w/w) H2O2. Thereafter, 6.0 mL of concentrated 65% (w/w) HNO3 and 0.25 mL of 40% (w/w) HF were added. Microwave irradiation was applied at a constant power of 300 W for 15 min. The temperature increased to approximately 208 °C and the pressure to approximately 15 atm. The addition of hydrofluoric acid (HF) was necessary to achieve complete dissolution of biogenic silica and mineral silicates inherently present in plant-based matrices, preventing the chemical entrapment of calcium and iron in an undissolved residue. Potential interferences or analyte losses due to fluoride precipitation were effectively avoided by minimizing the HF volume to 0.25 mL and performing subsequent serial dilutions of the transparent digests, which was further confirmed by satisfactory recoveries from the certified reference material. After cooling, the resulting completely transparent digests were quantitatively transferred into 10 mL volumetric flasks and diluted to volume with high-purity water. Depending on the target Ca and Fe concentrations, appropriate serial dilutions were performed before the spectrometric measurements, and the lanthanum solution was added to the Ca solutions to a final concentration of 0.4% (w/v La, i.e., 4 g L−1), which was also maintained in the calibration standards, procedural blanks, CCV standards, spiked solutions, and sample solutions. Procedural blanks were prepared simultaneously following the same microwave-assisted digestion protocol.
2.5. Preparation of Herbal Infusions
To evaluate the water-extractable fractions of Ca and Fe, aqueous infusions were prepared from loose herbs and tea bags. The dried material (one tablespoon (2.5 g) or a single tea bag) was infused with 250 mL of boiling high-purity water and allowed to steep in a covered vessel for 15 min. After steeping, the infusions were filtered through 0.22 µm PTFE syringe filters (Cameo, GE Water & Process Technologies, Feasterville-Trevose, PA, USA) to remove suspended particulate matter. The clarified extracts were transferred to polyethylene flasks and stored at 4 °C for no more than three days before analysis.
The elements in the infusions were determined directly in the filtered solutions, without mineralisation, with La added to the Ca solutions as for the digests, and the results are expressed as the amount (mg) transferred to 250 mL of the beverage. In contrast, the total contents (mg 100 g−1 for all samples and mg per single dose for the remaining products) were determined after microwave mineralisation of the material as sold.
2.6. FAAS Determination Procedure
Measurements were performed using a ContrAA 700 high-resolution continuum source atomic absorption spectrometer (Analytik Jena GmbH, Jena, Germany) equipped with a 300 W xenon short-arc lamp operated at 9 A as the continuum radiation source. To maximise sensitivity, the analytical lines selected for quantification were 422.7 nm for Ca and 248.3 nm for Fe. A standard 10 cm burner slot was used to maintain the air–acetylene flame. Depending on the analyte, the flame stoichiometry and gas flow rates were adjusted to optimise atomisation efficiency and minimise background noise. For Fe, a lean air-acetylene flame (oxidising) was maintained with an acetylene flow rate of 65 L h−1 and an air flow rate of 490 L h−1. For Ca, a rich (reducing) flame was used, with an increase in the acetylene flow of 90 L h− 1 and the same air flow. The raw data stored in the instrument memory were exported to a computer and evaluated using specialized software ASpect CS, version 2.3.1 (Analytik Jena GmbH, Jena, Germany). Both peak height and peak area were recorded; peak height was used for all evaluations because it gave better precision than peak area. Analytical blanks were carried out throughout the procedure, and the blank value was subtracted from the sample results. Linear calibration curves were used for the quantification of Ca and Fe. Each digest was measured five times and the mean and standard deviation of these five readings were reported.
3. Results and Discussion
The selection of appropriate operating conditions is a crucial step in FAAS analysis, since they directly affect the atomization process and, consequently, the analytical signal. Properly optimized conditions are also essential for preparing suitable calibration curves, which are used to determine the concentration of the target element in the tested samples.
In calcium determination, both the flame conditions and the composition of the matrix are of great importance. Interferents such as phosphates, sulfates, aluminum, and silicon can form stable calcium compounds, resulting in a reduced absorbance signal [23]. For this reason, the study began with the optimization of the height of the flame and the concentration of lanthanum, the latter used to suppress matrix-derived interferences [29]. A single-variable approach was applied, in which one parameter was changed while the others were kept constant. The purpose of the optimization was to maximize sensitivity to calcium and suppress possible matrix interferences.
3.1. Optimization of Flame Height
The flame height influences the atomization stage and, consequently, the analytical signal, because different zones of the flame differ in temperature and degree of atomization. If the flame height is too low, atomization may be incomplete; if it is too high, atoms may ionize or disperse. In both cases, the absorbance decreases.
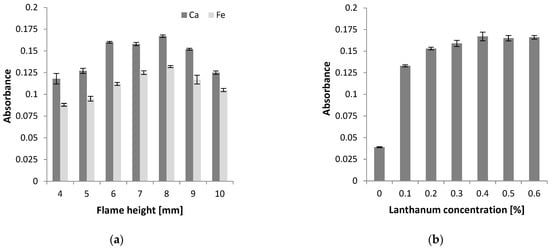
The flame height was optimized by measuring the absorbance of the same standard solution as a function of height, which made it possible to select the position at which the absorbance of calcium and iron was highest. The procedure was performed for a calcium standard solution at a concentration of 2 mg L−1 in the presence of 0.5% (w/v) lanthanum (as La), and for an iron standard at 1 mg L−1. The flame height was tested over the range of 4–10 mm. The absorbance reached its maximum at a height of 8 mm for both analytes (Figure 1a); therefore, this value was selected for further analyses. The lanthanum concentration used at this stage (0.5%) lies within the plateau later found in the matrix of the certified material (0.4–0.6%; Section 3.2), so it is not expected to have affected the choice of flame height. The lanthanum concentration was then optimized at this height (Section 3.2).
Figure 1.
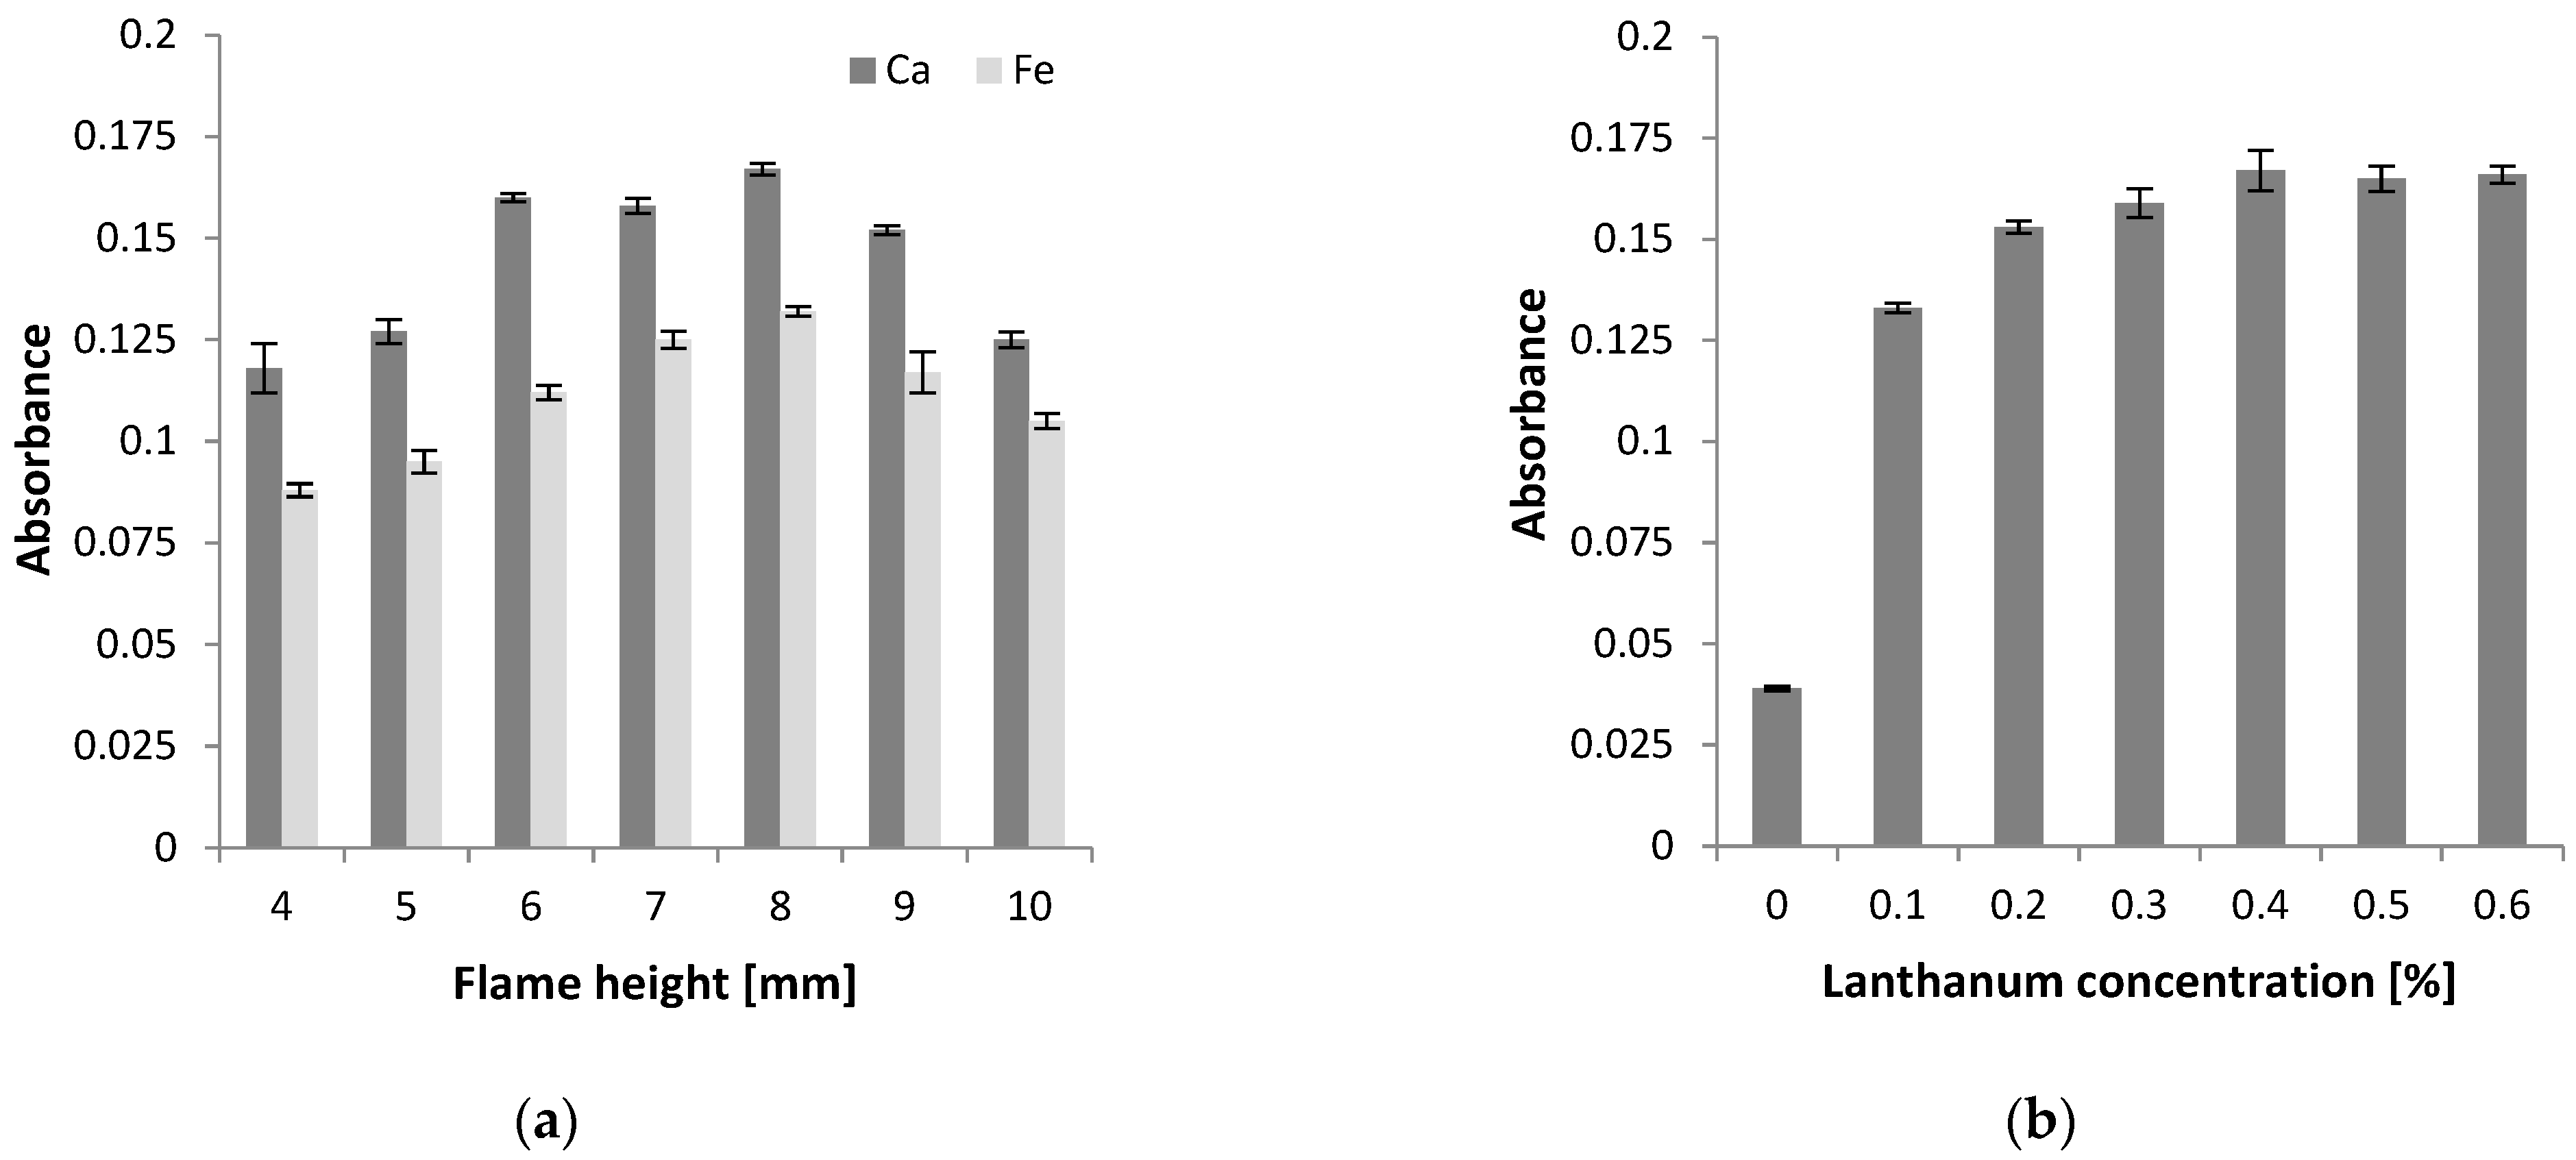
Optimization of the FAAS conditions: (a) effect of flame height on the absorbance of calcium (2 mg L−1 Ca in the presence of 0.5% La) and iron (1 mg L−1 Fe); (b) effect of lanthanum concentration on the absorbance of calcium (2 mg L−1 Ca) at a flame height of 8 mm. The bars show mean values and the error bars show standard deviations (n = 5).
3.2. Optimization of Lanthanum Concentration
In the determination of calcium by FAAS, interferents, especially phosphates, sulfates, and aluminum, have to be taken into account. Phosphates and sulfates can form low-volatility compounds with calcium, which hinders atomization and reduces the intensity of the analytical signal. To suppress the influence of the matrix, lanthanum salts are added to the solutions. Lanthanum has a greater affinity for the interfering species than calcium does, which means that it binds to them and releases calcium, limiting the formation of stable calcium compounds. As a result, the number of free calcium atoms in the flame increases, leading to a higher absorbance signal [23]. Therefore, selecting an appropriate concentration of lanthanum makes it possible to reduce matrix effects and improve the reliability of the results.
The lanthanum concentration was optimized by measuring the absorbance as a function of the lanthanum concentration at the previously optimized flame height of 8 mm. To reproduce the matrix of real plant samples, the digest of the certified reference material INCT-MP4-2 (Mixed Polish Herbs), diluted to a calcium concentration of 2 mg L−1, was used. This material is rich in Ca (10.8 g kg−1 certified), comparable to the upper range found in the analyzed products (0.3–9.9 g kg−1), so its digest contains Ca together with matrix-derived interferents, as in the sample solutions.
According to the literature, the lanthanum content used depends on the application and varies between 0.1% and 1.0% (w/v) [23]. In this study, lanthanum concentrations of 0.0–0.6% (w/v) La, final concentration in the measured solution) were tested in steps of 0.1% (Figure 1b). The absorbance signal reached a plateau at a lanthanum concentration of 0.4% (4 g L−1 La), and further increases did not result in significant changes in the signal. Therefore, a lanthanum concentration of 0.4% was used in the subsequent analyses. This was the lowest concentration on the plateau, which also limits the background noise introduced by lanthanum (see Section 3.3). Because the optimization was carried out in the digest of a certified plant material rather than in a pure Ca standard, the selected concentration takes into account Ca present in the sample solution together with the interferents (phosphates, sulfates, aluminum, and silicon), and it is lower than the 1% La used in a previous HR-CS FAAS study [34]. The same La concentration was maintained in the calibration standards, procedural blanks, CCV standards, spiked solutions, and sample solutions for Ca.
3.3. Analytical Figures of Merit
The LOD and LOQ values were established following the IUPAC recommendations, using the equations LOD = 3 SD/m and LOQ = 10 SD/m, where SD is the standard deviation of ten successive blank measurements of one blank solution (containing 0.4% La and the same acid matrix as the digests) and m is the slope of the calibration curve [36]. This approach yielded LOD values of 0.13 mg L−1 (Ca) and 0.02 mg L−1 (Fe), with corresponding LOQ values of 0.43 and 0.07 mg L−1, respectively.
These values are higher than those reported for HR-CS FAAS by Zambrzycka-Szelewa et al. [34], who obtained LODs of 2.8–3.5 µg L−1 for Fe (LOQ 9.4–11 µg L−1) and 3.6 µg L−1 for Ca (LOQ 12 µg L−1) in solutions without a releasing agent. After the addition of 1% lanthanum, the LOD for Ca in that study increased to 85 µg L−1 (LOQ 285 µg L−1) [34], which is of the same order of magnitude as the value obtained in this study in the presence of lanthanum. The LODs obtained here are also comparable to those determined by other authors for the direct analysis of instant coffee brews [35]. The LOD obtained for Fe (0.02 mg L−1) was twofold lower than the literature value (0.04 mg L−1), whereas the LOD for Ca was higher (0.13 vs. 0.03 mg L−1). The higher Ca LOD can be attributed to the addition of lanthanum, which, although essential for suppressing chemical interferences in complex matrices, probably increases the background noise and thus the standard deviation of the blank.
The precision of the method was good, with relative standard deviations (RSD) of 1.3–3.4% for Ca and 1.2–3.3% for Fe, calculated from five successive measurements of each sample digest. These values characterize the repeatability of the measurement and do not include variability between independent digestions. Seven-point external calibration curves were prepared freshly at the beginning of each run. Linearity was verified over the working intervals of 1–8 mg L−1 (Ca) and 0.5–6.0 mg L−1 (Fe) with the lowest calibration standard as the lower limit of the working range; all sample solutions were measured within these ranges, yielding representative equations of y = 0.0536x + 0.0407 (R2 = 0.9978) and y = 0.0711x − 0.0073 (R2 = 0.9985), respectively. A calibration was accepted when R2 was ≥0.995 and the back-calculated concentration of each calibration point was within ±10% of the nominal value. For a representative run, the back-calculated Ca concentrations deviated from the nominal values by −3.0 to +6.1%, with a maximum absolute residual of 0.013 absorbance units and a slight curvature of the residuals; for Fe, the deviations were −1.5 to +5.6% with a maximum residual of 0.015 absorbance units. Continuing calibration verification (CCV) standards were used to monitor system stability and potential drift; the acceptance criterion for recovery was 90–110% for both element.
3.4. Accuracy Verification
To evaluate the precision and precision of the optimized procedure, validation was performed using the INCT-MP4-2 certified reference material (CRM) (Mixed Polish Herbs). This material was selected as a surrogate because a CRM tailored to dietary supplements was not available. INCT-MP4-2 provides a certified value for Ca and an informative (uncertified) value for Fe. The analytical data are summarized in Table 2. The repeatability of the method was assessed on the basis of the standard deviation (SD) calculated from five successive measurements of the CRM digest. Student’s t-test at 95% confidence level revealed no significant differences between the experimental results and the reference values. For Ca, the found value (10.3 ± 0.5 g kg−1) agrees with the certified value (10.8 ± 0.7 g kg−1) within its uncertainty. For Fe, only an informative value without stated uncertainty is available, so the agreement (recovery of 104%) is indicative only, and the accuracy and ruggedness for iron determination rely primarily on comprehensive post-digestion spike recovery tests carried out across all evaluated food and supplement matrices (Section 3.5). This agreement indicates that the method is suitable for the determination of Ca and Fe in plant-based matrices after sample digestion. Because HF may cause loss of Ca through formation of poorly soluble CaF2, the Ca recovery from the CRM digested with HF (95%) and the spike recoveries (94–106%) were used to verify that no significant loss occurred. The digests were also diluted before measurement, and La was added to the Ca solutions.
Table 2.
Determination of Ca and Fe (concentration in g kg−1) in the certified reference material INCT-MP4-2 (Mixed Polish Herbs) using HR-CS FAAS.
3.5. Standard Addition Tests
To further verify the accuracy of the method, recovery experiments were performed by spiking the samples with known amounts of Ca and Fe. For each of the 16 products and each element, a spiked solution was prepared at a single level (1.0 mg L−1 Ca and 0.5 mg L−1 Fe) by introducing the analyte after the digestion run. Recovery was calculated as the amount found in the spiked solution minus that of the unspiked solution, divided by the amount added. The t-test compared the mean of the five measurements with the added amount. As shown in Table 3, the determined amounts agreed well with the added amounts (recoveries of 94–106%). Student’s t-test at the 95% confidence level showed no significant differences. These findings confirm the accuracy of the proposed procedure for the determination of Ca and Fe in the complex matrices of dietary supplements and food products.
Table 3.
Recovery of Ca and Fe (concentration in mg L−1 ± SD, n = 5) from spiked dietary supplements and food samples determined by HR-CS FAAS.
3.6. Determination of Ca and Fe in Dietary Supplements and Foods
To evaluate the practical applicability of the method, the samples were analyzed under the established experimental conditions, using an external calibration. The results are shown in Table 4. The SD values reported for the samples describe the repeatability of the instrumental measurement and do not include variability between batches or between independent digestions. The results therefore refer to the composite sample of each product.
Table 4.
Total concentration (after mineralization, product as sold) and content per single dose of Ca and Fe in the analyzed samples, determined by HR-CS FAAS; for NL and NH, the content per single dose is the amount transferred into the infusion.
The iron content varied substantially between the plant-based products tested, both in total concentration (mg 100 g−1) and in content per serving (mg per single dose). The total iron concentration ranged from 16.6 ± 0.2 mg 100 g−1 in MP2 to 153.2 ± 2.6 mg 100 g−1 in NT2. However, when evaluating the amount of iron delivered per serving, the highest was provided by CT2 (3.34 ± 0.09 mg), followed by CP2 (1.82 ± 0.05 mg) and CT1 (1.77 ± 0.02 mg), while the lowest was found for MT1 (0.14 ± 0.01 mg), followed by MT2 (0.17 ± 0.01 mg). The per-dose values of NL and NH (Table 4, footnote 2) are the amounts transferred into the infusion and not the total contents. For NL, the total content in the 2.5 g portion is approximately 23.6 mg Ca and 0.67 mg Fe, so about 51% of Ca and about 25% of Fe were transferred into the beverage. Because of this difference, NL and NH were not included in the comparisons of the per-serving contents between products below.
These findings show that a high iron concentration does not necessarily translate into a high iron content per serving, which depends heavily on the serving size recommended by the manufacturer. From a nutritional perspective, iron intake is particularly important for vegetarians and vegans, because plant-based diets provide only non-heme iron. This form has a significantly lower bioavailability (typically 5–12%) than heme iron from animal sources (15–35%) [37]. Consequently, the Recommended Dietary Allowance (RDA) for iron is estimated to be 1.8 times higher for vegetarians and vegans [2]. Products with higher iron content per serving (e.g., the CT and CP series) can contribute substantially to these elevated requirements; one serving of CT2, for example, supplies about 19% of the 18 mg RDA for adult women, or about 10% of the 1.8-fold higher requirement. In contrast, products with minimal iron content per serving (such as MT1, NL, or MT2) may be insufficient to support the prevention of iron deficiency anemia.
Calcium concentrations and contents per serving were even more widely dispersed among the plant-derived samples analyzed. The total concentration ranged from 31.4 ± 0.4 mg 100 g−1 (CT1) to 988.4 ± 12.8 mg 100 g−1 (SP1). In terms of calcium per serving, the highest amounts were provided by MP2 (32.80 ± 0.46 mg) and SP1 (29.70 ± 0.39 mg), while NT2 and CT1 provided negligible amounts (0.33 ± 0.01 mg and 0.46 ± 0.01 mg, respectively).
The high calcium content of SP1 and MP2 likely reflects the natural composition of spirulina and moringa, which are rich in calcium [8,9], rather than deliberate fortification. Since strict vegans entirely exclude dairy—the primary source of calcium in Western diets—they often rely on fortified plant products and plant-based supplements to meet their daily requirements and preserve bone mineral density; however, even the highest value found here (32.80 mg) covers only about 3% of the lowest recommended daily intake of 1000 mg [20,21,22]. Calcium content per serving also differed markedly between products from the same botanical source (e.g., SP1 vs. ST1 and MP2 vs. MT1), which reflects differences in the form and serving size of products from different manufacturers.
In addition to product-specific differences, powdered products provided more calcium per serving than tablets. As an exploratory comparison, a one-way analysis of variance (ANOVA) was performed with the product as the experimental unit (powders, n = 6; tablets, n = 8; loose herbs and herbal tea, NL and NH, were excluded): F(1,12) = 12.9, p = 0.004. To ensure statistical validity and avoid pseudoreplication, the mean value of each independent commercial product (SKU) was utilized as a single observation rather than instrumental technical replicates, reflecting only measurement precision. The mean calcium content per serving was 17.7 mg for powders and 1.29 mg for tablets. This comparison describes only the set of products analyzed. The groups were not balanced with respect to botanical source (nettle was available only as tablets), and each product came from a different manufacturer, with a different formulation and serving size (approximately 3–5 g for powders and 0.3–3.1 g for tablets). Consequently, the observed significant difference is strongly confounded by these formulation variables and the manufacturer’s defined serving sizes rather than the physical form itself. When expressed per 100 g of product, the difference was smaller (mean 463 vs. 157 mg 100 g−1; F(1,12) = 5.1, p = 0.04), which shows that serving size contributed to it.
When evaluating these products against their commercial positioning, a clear distinction emerges between items intended for the provision of targeted iron and general plant-origin foods. Microalgae products (chlorella and spirulina series) are commonly marketed to vegetarians as concentrated nutritional supports, which reflects their higher iron contribution per serving observed in this study. In contrast, nettle and moringa products generally serve as traditional dietary ingredients without explicit iron-targeted therapeutic claims. Regarding label conformity, most evaluated products lacked specific quantitative mineral declarations on their packaging, which is typical for plant-based foods regulated under standard food law rather than medicinal frameworks. In the limited cases where nutritional values were declared, the measured concentrations were within acceptable market tolerances, verifying the absence of unauthorized mineral fortification.
A critical aspect of the evaluated multi-mineral matrices is the simultaneous presence of calcium and iron in the same serving, which may lead to interactions at the absorption stage. Calcium inhibits the absorption of both heme and non-heme iron in a dose-dependent manner when consumed concurrently. The mechanism has not been fully elucidated; the inhibition occurs at the enterocyte level and may involve competition during the transport of divalent metals or modulation of intracellular transport pathways. For vegetarians and vegans, this interaction is particularly relevant because plant-based diets are naturally high in phytates, polyphenols, and oxalates, which strongly inhibit the absorption of non-heme iron. A supplement that delivers iron and calcium simultaneously can exacerbate this problem [38,39].
The results in Table 4 show that the Ca content per recommended serving did not exceed 33 mg in any of the tested samples (0.3–32.8 mg). In human studies, Ca inhibited non-heme iron absorption in a dose-dependent manner, with examined doses ranging from 40 to 600 mg Ca per meal [38]. However, the magnitude of the effect also depends on the chemical form of Ca, on the composition of the meal, in particular phytate [38,39], and on Ca from other dietary sources consumed together with the supplement. Because iron absorption and bioavailability were not measured in this study, our data do not allow conclusions to be drawn about whether the Ca present in these products affects Fe absorption.
It must be critically emphasized that total analytical composition represents the upper chemical limit of the elements present in the product, while the physiological availability is determined by the fraction released from the food matrix and absorbed by the enterocytes. Because our method utilizes strong mineral acids for complete sample decomposition, it cannot distinguish between distinct chemical species or explain the enzymatic and physical barriers of human digestion.
Even within this range, the products differ in the relative proportions of the two elements. As compositional indicators, the Ca:Fe molar ratios per serving were approximately 29 for SP1 (29.70 ± 0.39 mg Ca and 1.44 ± 0.02 mg Fe) and approximately 55 for MP2 (32.80 ± 0.46 mg Ca and 0.83 ± 0.01 mg Fe), compared to about 0.5 for CT2 (1.11 mg Ca and 3.34 mg Fe) and about 3.0 for CP2 (3.96 mg Ca and 1.82 mg Fe). These ratios describe only the composition of the products. They are not evidence of a physiological effect and should not be used alone to predict iron absorption, which depends on the chemical forms of both elements and the composition of the meal, and was not assessed in this study.
4. Conclusions
This study developed an HR-CS FAAS procedure for the determination of calcium and iron after microwave digestion and verified it for the analyzed matrices (products based on nettle, moringa, chlorella, and spirulina) using a reference material (certified for Ca, informative value for Fe) and spike recovery tests (instrumental LOD of 0.13 mg L−1 for Ca and 0.02 mg L−1 for Fe; recoveries of 94–106%). Optimization of the lanthanum concentration in a certified plant matrix and the use of a single microwave digestion for both elements made it possible to determine both elements in all 16 products. In the analyzed products (one composite sample of each, as sold), the iron content per serving ranged from 0.14 mg (MT1) to 3.34 mg (CT2) and the calcium content per serving from 0.33 mg (NT2) to 32.80 mg (MP2); for NL and NH, these are the amounts transferred into the infusion. In this set, powders supplied more calcium per serving than tablets (exploratory comparison); this difference may reflect the botanical source, formulation, manufacturer, and serving size. In conclusion, the proposed HR-CS FAAS procedure is a robust, non-hypothetical tool for the strict analytical control of total mineral content in complex plant matrices. However, a clear distinction must be maintained between these total compositional values and their actual physiological availability, the evaluation of which requires complementary in vitro gastrointestinal digestion models or in vivo studies. Iron absorption and bioavailability were not assessed, so these data do not allow conclusions regarding iron bioavailability, the prevention of iron deficiency, or the nutritional effectiveness of the products.
Author Contributions
Conceptualisation, M.K.-C. and A.N.; investigation, M.K.-C. and A.N.; resources, M.K.-C.; writing—original draft preparation, M.K.-C. and A.N.; visualisation, M.K.-C. and A.N.; supervision, M.K.-C.; project administration, M.K.-C.; methodology, M.K.-C.; validation, M.K.-C. and A.N.; formal analysis, M.K.-C.; data curation, M.K.-C.; funding acquisition, M.K.-C. All authors have read and agreed to the published version of the manuscript.
Funding
This study was financially supported by the Polish Ministry of Science and Higher Education.
Data Availability Statement
All relevant data are included in this article and presented as figures and tables. Other data are available from the corresponding author upon reasonable request.
Conflicts of Interest
Author Adrianna Nowak was employed by Jost Chemical Poland sp. z o.o., Poland, and this affiliation does not constitute a conflict of interest with regard to the present study. The remaining authors declare that the research was conducted in the absence of any commercial or financial relationships that could be construed as potential conflicts of interest.
References
- Aggett, P.J. Iron. In Present Knowledge in Nutrition, 10th ed.; Erdman, J.W., Macdonald, I.A., Zeisel, S.H., Eds.; Wiley-Blackwell: Washington, DC, USA, 2012; pp. 506–520. [Google Scholar] [CrossRef] [Scilit]
- Institute of Medicine (US) Panel on Micronutrients. Dietary Reference Intakes for Vitamin A, Vitamin K, Arsenic, Boron, Chromium, Copper, Iodine, Iron, Manganese, Molybdenum, Nickel, Silicon, Vanadium, and Zinc; The National Academies Press: Washington, DC, USA, 2001. [Google Scholar] [PubMed]
- Camaschella, C. Iron-Deficiency Anemia. N. Engl. J. Med. 2015, 372, 1832–1843. [Google Scholar] [CrossRef] [Scilit] [PubMed]
- Gouveia, L.; Batista, A.P.; Sousa, I.; Raymundo, A.; Bandarra, N.M. Microalgae in Novel Food Products. In Food Chemistry Research Developments; Papadopoulos, K.N., Ed.; Nova Science Publishers: New York, NY, USA, 2008; pp. 75–112. [Google Scholar]
- Patil, S.V.; Mohite, B.V.; Marathe, K.R.; Salunkhe, N.S.; Marathe, V.; Patil, V.S. Moringa Tree, Gift of Nature: A Review on Nutritional and Industrial Potential. Curr. Pharmacol. Rep. 2022, 8, 262–280. [Google Scholar] [CrossRef] [Scilit] [PubMed]
- Podgórska-Kryszczuk, I. Spirulina—An Invaluable Source of Macro- and Micronutrients with Broad Biological Activity and Application Potential. Molecules 2024, 29, 5387. [Google Scholar] [CrossRef] [Scilit] [PubMed]
- Bito, T.; Okumura, E.; Fujishima, M.; Watanabe, F. Potential of Chlorella as a Dietary Supplement to Promote Human Health. Nutrients 2020, 12, 2524. [Google Scholar] [CrossRef] [Scilit] [PubMed]
- Janda-Milczarek, K.; Szymczykowska, K.; Jakubczyk, K.; Kupnicka, P.; Skonieczna-Żydecka, K.; Pilarczyk, B.; Tomza-Marciniak, A.; Ligenza, A.; Stachowska, E.; Dalewski, B. Spirulina Supplements as a Source of Mineral Nutrients in the Daily Diet. Appl. Sci. 2023, 13, 1011. [Google Scholar] [CrossRef] [Scilit]
- Antarkar, R.; Khanal, P. Formulation and Evaluation of Suspension of Urtica Dioica (Nettle) Powder to Treat Anemia. Int. J. Pharm. Sci. 2026, 4, 837–844. [Google Scholar] [CrossRef]
- Masitlha, E.P.; Seifu, E.; Teketay, D. Nutritional Composition and Mineral Profile of Leaves of Moringa oleifera Provenances Grown in Gaborone, Botswana. Food Prod. Process. Nutr. 2024, 6, 3. [Google Scholar] [CrossRef] [Scilit]
- Rutto, L.K.; Xu, Y.; Ramirez, E.; Brandt, M. Mineral Properties and Dietary Value of Raw and Processed Stinging Nettle (Urtica dioica L.). Int. J. Food Sci. 2013, 2013, 857120. [Google Scholar] [CrossRef] [Scilit] [PubMed]
- Gopalakrishnan, L.; Doriya, K.; Kumar, D.S. Moringa oleifera: A Review on Nutritive Importance and Its Medicinal Application. Food Sci. Hum. Wellness 2016, 5, 49–56. [Google Scholar] [CrossRef] [Scilit]
- Ali, R.F.M.; El-Anany, A.M.; Almujaydil, M.S.; Alhomaid, R.M.; Alharbi, H.F.; Algheshairy, R.M.; Alzunaidy, N.A.; Alqaraawi, S.S. Impact of Chlorella vulgaris Powder on the Nutritional Content and Preference of Khalas Date Spread. Front. Nutr. 2025, 12, 1617754. [Google Scholar] [CrossRef] [Scilit] [PubMed]
- European Parliament; Council of the European Union. Directive 2001/83/EC of the European Parliament and of the Council of 6 November 2001 on the Community Code Relating to Medicinal Products for Human Use. Off. J. Eur. Communities 2001, L 311, 67–128. Available online: http://data.europa.eu/eli/dir/2001/83/oj (accessed on 29 September 2026).
- European Parliament; Council of the European Union. Directive 2004/24/EC of the European Parliament and of the Council of 31 March 2004 Amending, as Regards Traditional Herbal Medicinal Products, Directive 2001/83/EC on the Community Code Relating to Medicinal Products for Human Use. Off. J. Eur. Union 2004, L 136, 85–90. Available online: http://data.europa.eu/eli/dir/2004/24/oj (accessed on 29 September 2026).
- European Parliament; Council of the European Union. Directive 2002/46/EC of the European Parliament and of the Council of 10 June 2002 on the Approximation of the Laws of the Member States Relating to Food Supplements. Off. J. Eur. Communities 2002, L 183, 51–57. Available online: http://data.europa.eu/eli/dir/2002/46/oj (accessed on 29 September 2026).
- European Parliament; Council of the European Union. Regulation (EC) No 178/2002 of the European Parliament and of the Council of 28 January 2002 Laying Down the General Principles and Requirements of Food Law, Establishing the European Food Safety Authority and Laying Down Procedures in Matters of Food Safety. Off. J. Eur. Communities 2002, L 31, 1–24. Available online: http://data.europa.eu/eli/reg/2002/178/oj (accessed on 29 September 2026).
- Piskin, E.; Cianciosi, D.; Gulec, S.; Tomas, M.; Capanoglu, E. Iron Absorption: Factors, Limitations, and Improvement Methods. ACS Omega 2022, 7, 20441–20456. [Google Scholar] [CrossRef] [Scilit] [PubMed]
- Cormick, G.; Belizán, J.M. Calcium Intake and Health. Nutrients 2019, 11, 1606. [Google Scholar] [CrossRef] [Scilit] [PubMed]
- National Institutes of Health. Calcium: Fact Sheet for Health Professionals; U.S. Department of Health and Human Services, Office of Dietary Supplements: Bethesda, MD, USA, 2026. Available online: https://ods.od.nih.gov/factsheets/Calcium-HealthProfessional/ (accessed on 29 September 2026).
- Lönnerdal, B. Calcium and iron absorption—Mechanisms and public health relevance. Am. J. Clin. Nutr. 2010, 92, 1412–1415. [Google Scholar] [CrossRef] [Scilit] [PubMed]
- Ross, A.C.; Taylor, C.L.; Yaktine, A.L.; Del Valle, H.B. (Eds.) Institute of Medicine (US) Committee to Review Dietary Reference Intakes for Calcium and Vitamin D. Dietary Reference Intakes for Calcium and Vitamin D; National Academies Press: Washington, DC, USA, 2011; Available online: https://pubmed.ncbi.nlm.nih.gov/21796828/ (accessed on 29 September 2026). [PubMed]
- Hosking, J.W.; Snell, N.B.; Sturman, B.T. Interferences in the determination of calcium by flame atomic absorption spectrometry. J. Chem. Educ. 1977, 54, 128–130. [Google Scholar] [CrossRef] [Scilit]
- Liu, Y.; Wang, W.; Zheng, X.; Yan, Y.; Fing, D.; Li, A. ICP–MS determination of essential and trace mineral composition in commercial plant-based milks and evaluation of label–composition agreement. J. Food Compos. Anal. 2026, 159, 109533. [Google Scholar] [CrossRef] [Scilit]
- Marcinkowska, M.; Barałkiewicz, D. Recent Advances in the Determination of Major and Trace Elements in Plant Samples Using Inductively Coupled Plasma Optical Emission Spectrometry. Molecules 2024, 29, 3169. [Google Scholar] [CrossRef] [Scilit] [PubMed]
- Puffeles, M.; Nessim, N.E. Direct flame-photometric determination of calcium in soil and plant extracts, water and serum with special reference to sodium, potassium and phosphate interference. Anal. Chim. Acta 1959, 20, 38–46. [Google Scholar] [CrossRef] [Scilit]
- Cataldi, T.; Margiotta, G.; Del Fiore, A.; Bufo, S. Ionic content in plant extracts determined by ion chromatography with conductivity detection. Phytochem. Anal. 2003, 14, 176–183. [Google Scholar] [CrossRef] [Scilit] [PubMed]
- Shishov, A.; Volodina, N.; Nechaeva, D.; Bulatov, A. Calcium Determination by Complexometric Titration with Digital Endpoint Detection. Water 2025, 17, 1757. [Google Scholar] [CrossRef] [Scilit]
- Evans, C.C.; Grimshaw, H.M. Use of lanthanum and sulphuric acid to suppress interferences in the flame photometric determination of calcium m soil extracts. Talanta 1968, 15, 413–415. [Google Scholar] [CrossRef] [Scilit] [PubMed]
- Fernandes Filgueiras, M.; Borges, E.M. Iron Quantification in Dietary Supplements using Four Colorimetric Assays. J. Chem. Educ. 2022, 99, 2067–2078. [Google Scholar] [CrossRef] [Scilit]
- Omolo, O.J.; Chhabra, S.C.; Nyagah, G. Determination of iron content in different parts of herbs used traditionally for anaemia treatment in East Africa. J. Ethnopharmacol. 1997, 58, 97–102. [Google Scholar] [CrossRef] [Scilit] [PubMed]
- Aydinoglu, S. Iron and Zinc Determination in Dietary Supplements by Flame and Graphite Furnace Atomic Absorption Spectrometry. Braz. J. Pharm. Sci. 2022, 58, e21094. [Google Scholar] [CrossRef] [Scilit]
- Bankaji, I.; Kouki, R.; Dridi, N.; Ferreira, R.; Hidouri, S.; Duarte, B.; Sleimi, N.; Caçador, I. Comparison of Digestion Methods Using Atomic Absorption Spectrometry for the Determination of Metal Levels in Plants. Separations 2023, 10, 40. [Google Scholar] [CrossRef] [Scilit]
- Zambrzycka-Szelewa, E.; Nalewajko-Sieliwoniuk, E.; Zaremba, M.; Bajguz, A.; Godlewska-Żyłkiewicz, B. The Mineral Profile of Polish Beers by Fast Sequential Multielement HR CS FAAS Analysis and Its Correlation with Total Phenolic Content and Antioxidant Activity by Chemometric Methods. Molecules 2020, 25, 3402. [Google Scholar] [CrossRef] [Scilit] [PubMed]
- Stelmach, E.; Szymczycha-Madeja, A.; Pohl, P. A Simplified Determination of Total Concentrations of Ca, Fe, Mg and Mn in Addition to Their Bioaccessible Fraction in Popular Instant Coffee Brews. Food Chem. 2016, 197, 388–394. [Google Scholar] [CrossRef] [Scilit] [PubMed]
- Currie, L.A. Nomenclature in evaluation of analytical methods including detection and quantification capabilities (IUPAC Recommendations 1995. Pure Appl. Chem. 1995, 67, 1699–1723. [Google Scholar] [CrossRef] [Scilit]
- Monsen, E.R. Iron nutrition and absorption: Dietary factors which impact iron bioavailability. J. Am. Diet. Assoc. 1988, 88, 786–790. [Google Scholar] [CrossRef] [Scilit]
- Hallberg, L.; Brune, M.; Erlandsson, M.; Sandberg, A.S.; Rossander-Hultén, L. Calcium: Effect of different amounts on nonheme- and heme-iron absorption in humans. Am. J. Clin. Nutr. 1991, 53, 112–119. [Google Scholar] [CrossRef] [Scilit] [PubMed]
- Gibson, R.S.; Perlas, L.; Hotz, C. Improving the bioavailability of nutrients in plant foods at the household level. Proc. Nutr. Soc. 2006, 65, 160–168. [Google Scholar] [CrossRef] [Scilit] [PubMed]

Disclaimer/Publisher’s Note: The statements, opinions and data contained in all publications are solely those of the individual author(s) and contributor(s) and not of MDPI and/or the editor(s). MDPI and/or the editor(s) disclaim responsibility for any injury to people or property resulting from any ideas, methods, instructions or products referred to in the content. |
© 2026 by the authors. Licensee MDPI, Basel, Switzerland. This article is an open access article distributed under the terms and conditions of the Creative Commons Attribution (CC BY) license.