


Abstract
This article presents research focusing on the analysis of lightweight polymer–cement mortar using combined impact-echo (IE) and computed tomography (CT) methods after exposure to extreme temperatures. Lightweight mortar based on blended cement and waste cellulose fibers was developed for this purpose. The mortar consisted of a polymer–cement matrix (60% Portland cement, 40% blast furnace slag and polymer modifier) and porous aggregate (expanded clay with grain size from 0 to 2 mm) including other minor components (superplasticizer) and admixtures (silica fume). Mortars with two types of dispersed reinforcement based on waste cellulose (G-500T and G-700T) in amounts ranging from 0.5 to 1.5 kg/m3 were analyzed. The materials were tested at the age of 28 days upon exposure to 20 °C (storage in laboratory conditions), 600 °C, 800 °C and 1000 °C. Aside from IE and CT, the outputs were supplemented by testing basic physical and mechanical parameters (strength, volume changes, etc.), as well as microstructure analysis, specifically testing of microcracks using SEM. The purpose of the CT and SEM was confirmation of cracks, specifically microcracks (including their character and areas of appearance), along with possible anomalies occurring during high-temperature stress of polymer–cement composites.
1. Introduction
The fire resistance of reinforced concrete structures is one of the key aspects in terms of the safety in use of buildings. Particular attention must therefore be paid to buildings with a high concentration of people, restricted access and, in general, operating conditions that complicate the extinguishing of a potential fire. It is therefore necessary to ensure that building materials used, for example, in linear infrastructure—such as tunnels—have increased resistance to high temperatures. Here, given the operating conditions, and despite the provision of ventilation, a fire may break out in the event of a road traffic accident, with temperatures potentially reaching over 1000 °C [1]. The surface sections are most severely affected by the fire. According to Krzemień and Hager [2], when a concrete slab was exposed to a temperature of 1000 °C, a temperature of approximately 600 °C was measured at a depth of 30 mm from the surface and approximately 400 °C at a depth of 60 mm, with a reduction in compressive strength of approximately 30%. The degradation of the structure and properties of cementitious composites exposed to extreme temperatures is influenced, among other factors, by the method and rate of cooling, i.e., gradual versus rapid (air, water) cooling [3,4,5]. Equally important is the synergistic effect of degradation mechanisms. Concrete in structures exposed to the outdoor environment is usually subjected to degradation caused by various factors—frost, chlorides, sulfates, sulphites, etc. Degradation caused by climatic factors or aggressive substances in the surrounding environment has a negative impact on the resistance of cementitious composites to high temperatures [6,7]. In case a fire occurs and the structure requires repair, it is advisable to use a repair compound with enhanced fire resistance for the restoration of concrete or reinforced concrete surfaces. The solution lies in the research and development of polymer–cement mortar with enhanced fire resistance.
In recent years, there has been a dynamic increase in pressure to use alternative raw materials and to reduce the energy consumption involved in the production of building materials. For this reason, the research presented here deliberately focused on environmental considerations. The subject of the research was therefore a composite material combining a polymer–cement matrix based on a blended cement (Portland cement and blast furnace slag), lightweight aggregate and fibers derived from waste cellulose. During designing the composition of the material, consideration was naturally given not only to environmental aspects but also to the effect of extreme temperatures on the behavior of the material under development. The suitability of modifying a Portland cement-based matrix with alternative components to enhance resistance to extreme temperatures has been demonstrated by numerous authors, e.g., [8,9,10]. For this reason, blast furnace slag was selected, as it is characterized by a relatively constant composition and ensures a significant improvement in the resistance of the blended cement matrix to extreme temperatures [3,4,7]. This is due to differing reactions, and consequently different hydration products, particularly the morphology of the CSH phases, which results from varying C/S ratios [11]. Similarly, polymer fibers are an essential component of mortars with enhanced resistance to high temperatures [12,13,14,15]. This dispersed reinforcement is important for the controlled formation of channels (capillary pores) through which the products of CSH decomposition—Ca(OH)2, CaCO3, etc.—escape. This controlled escape (particularly of gases) then eliminates the internal stress that might otherwise develop in a dense polymer–cement composite. Some authors have already investigated alternatives to polymer fibers obtained from waste or by-products [16,17].
An unconventional combination of non-destructive techniques was selected in addition to the standard tests and analytical methods for evaluation of the properties and behavior of the lightweight polymer–cement repair mortar exposed to extreme temperatures. This allowed detailed examination of the structural changes in thermally stressed materials and, at the same time, determination of the suitability of the chosen combination of methods, specifically impact-echo (IE) and computed tomography (CT). These non-destructive methods (NDT) enable the determination of material parameters that are either entirely impossible to identify through destructive methods or only indirectly possible. NDT can provide information regarding the type and degree of damage, as well as its localization in the area of testing parts of building structures in situ. The suitability of acoustic NDT for testing was proven in the area of testing cement composites [18,19]. Specifically, in the case of damage to concrete structures, the IE acoustic resonance method is considered by experts to be among the most suitable methods for testing [20]. This method is able to localize crevices and cracks of surface elements [21], delamination in bridge constructions [22], lack of homogeneity in concrete [23], as well as controlling the condition of tension anchors [24], etc. The exposure of cement mortars to extreme temperatures affects their mechanical properties, which causes a shift of the resonance frequencies to lower frequency bands [25]. This change is accompanied by the lowering of the amplitude of the recorded signals and a higher degree of noise in the signal due to the presence of microcracks and defects [25]. Despite the proven effectiveness of the IE method for evaluation of cement-based materials exposed to fire, there is still a knowledge gap which should be elucidated. Especially lightweight cement mortars based on high amounts of alternative raw materials are still a quite unexplored area, because mostly various types of concrete have been analyzed by IE [5,26,27].
There has been dynamic development in research into building materials using computed tomography (CT) over the last 10 years. Research during this period has been relatively intensive, and significant progress has been made in the use of CT in terms of analyzing the properties and behavior of building materials. However, despite this relatively significant progress, a knowledge gap still exists, as evidenced by the continuous publication of new findings in this field—e.g., [28,29,30,31]. Researchers, among other things, have investigated the effect of high temperatures on cementitious composites; their work mainly concerns dense concretes [32,33,34] or mortars [35,36], or cement pastes [37,38]. CT is mainly used to evaluate the structure of pores and cavities, or cracks and fracture mechanisms, in cement concrete, mortar or paste exposed to elevated (or extremely high) temperatures. Not many studies have been conducted that deal with lightweight polymer–cement mortars containing waste cellulose fibers. Similarly, there are no studies in which a combination of IE and CT has been used to evaluate the behavior of these materials at high temperatures.
2. Materials and Methods
The goal of this research was to analyze the properties and behavior of a polymer–cement mortar based on blended cement and waste cellulose fibers that could be used in the rehabilitation of reinforced concrete structures. Concurrently, that material should be characterized by increased resistance to extreme temperatures. Additionally, given the current environmental situation, attention should also be paid to components obtained from alternative material resources. Therefore, the individual components forming the silicate composite were selected based on the above criteria and aspects. A lightweight polymer–cement mortar was specifically developed for this purpose.
Partial substitution of cement was performed with respect to the findings of numerous research studies. Several researchers, for example, Donatello et al. [8], Wang [39] and Hossain [9], have proven the positive effect of the substitution of Portland cement with fly ash or blast furnace slag on the heat resistance of mortar and concrete. Hence, the mortar used in this study contained a mixed polymer-silicate matrix formed by cement (CEM I 42.5 R, Heidelberg Materials CZ, a.s., Mokrá, Czech Republic), blast furnace slag (SMŠ 400, LB Cemix, Štramberk, Czech Republic) and a polymer modifier based on vinyl acetate-ethylene (VAE) copolymer with a high ethylene content in the polymer chain (Vinnapas 4240, Wacker Chemie AGStuttgart, Germany). The polymer modifier adjusts both the properties in uncured condition (improved adhesiveness to the rehabilitated surface) and the flexibility of the cured material (which relates to the modulus of elasticity); see, for example, Assaad [40] and Issa and Assaad [41]. Silica fume (Füller CZ, Sika CZ, s.r.o., Brno, Czech Republic) was used to further enhance the matrix properties, also contributing to the improved heat resistance of the resulting silicate composite, as is evident from research outputs by Heikal et al. [42] and Koksal et al. [43].
The cement used is characterized by a specific surface area of 409 m2/kg, density 3106 kg/m3 and loss of ignition 2.9%. Finely ground granulated blast furnace slag shows specific surface 359 m2/kg, density 2812 kg/m3 and loss of ignition 2.1%. The microsilica used consisted of 94.7% amorphous SiO2 with a bulk density 223 kg/m3, specific surface area 24,357 m2/kg and loss of ignition 0.84%. Table 1 and Table 2 show the chemical and mineralogical composition of the cement, blast furnace slag and microsilica.
Table 1.
Chemical composition of matrix components (in weight %).
Table 2.
Mineralogical composition of matrix components (AP—amorphous phase).
Expanded clay aggregate, a porous aggregate commercially produced by the expansion of clay soil and referred to as Ceramsite (Keramzit LIAPOR, Liapor, s.r.o., Vintířov, Czech Republic), was used as a filler. Porous aggregates in relation to better heat resistance cement or polymer–cement mortars were proved [10,43,44]. Concrete containing lightweight aggregate reaches a lower internal thermal strain compared to concrete containing other dense types of aggregate (quartzite, basalt and limestone) [45,46]. The excellent properties of porous aggregate from the perspective of heat resistance are also evident from the findings of Černý et al. [47,48]. The authors focus on porous aggregate from sintered ash, where the production of the aggregate occurs through self-combustion. The results of this study suggest a possible heat resistance of the aggregate produced in laboratory conditions up to temperatures nearing 1500 °C.
It was necessary to adjust the granularity curve of the aggregate to achieve the optimum properties of the composite. Thus, two types of aggregates were used: expanded clay aggregate with a grain size of 0–1 mm (bulk density 1900 kg/m3 and loose bulk density 650 kg/m3) and a grain size of 0–2 mm (bulk density 1050 kg/m3 and loose bulk density 570 kg/m3), combined in the volume ratio of 1:2.7 (see Figure 1). The final mixture of the aggregate is characterized by a bulk density of 1710 kg/m3 and a loose bulk density of 628 kg/m3.
Figure 1.
Sieve analysis of used porous aggregate (Cer—Ceramsite; mixture for composite—1:2.7).
From the perspective of heat resistance, cement composites (various types of mortar and concrete) show the rather significant effect of polymer fibers, as is evident from the results presented, for example, by Ezziane et al. [13], Abaeian et al. [12], Sahmaran et al. [14] and Xargay et al. [15]. The purpose of the reinforcement (on a macromolecular basis) that disintegrates during pyrolysis, is the formation of an evenly distributed network of channels and crevices of a suitable size. This suitably distributed network of capillary pores enables the problem-free escape of residue of dissociative reactions. Typically, these are escaping CO2 and H2O from the disintegration of limestone, portlandite and CSH phases, etc. As in the case of other components for the production of mortar and concrete, the selection effort of the distributed reinforcement leads to the use of alternative materials. These options were explored, for example, by Gupta et al. [49] and Figueiredo et al. [50].
Two types of fibers based on waste cellulose, G-500T and G-700T (BUKÓZA INVEST spol. s r.o., Hencovce, Slovakia; see Figure 2, Figure 3 and Figure 4), were used in the amount of 0.5 to 1.5 kg/m3. Both types of fibers have equal properties of 80% cellulose content, 93% minimal dry matter content, maximum 20% of ash content and pH 7 ± 1. The maximum length of fibers in G-500T is 400 µm; in the case of G-700T, it is 600 µm. The volumetric weight of the G-500T fibers ranges between 50–100 kg/m3 and in the case of G-700T in the interval of 40–70 kg/m3. Both mentioned types of distributed reinforcement contain a minimum of 15% of fibers in the length < 32 µm and a maximum 15% of fibers in the length > 200 µm.
Figure 2.
Fibers based on waste cellulose G-500T (a) and G-700T (b).
Figure 3.
Fibers based on waste cellulose in detail (optical microscope Keyence VHX-950F) G-500T (a) and G-700T (b).
Figure 4.
Microstructure of fibers based on waste cellulose (SEM) G-500T (a,b) and G-700T (c,d).
The composition of the analyzed polymer–cement mortar is shown in the table below (see Table 3). The composition of all formulations is very similar; the main differences lie in the amount and type of fibers. The constitution of the composite was thus modified by two types of distributed reinforcement at three different fiber contents (see Table 3). There were very minor adjustments in the amount of water to sustain the same consistency in all materials.
Table 3.
Composition of mixtures—kg/m3.
The reference mortar without fibers was not tested and analyzed. The primary reason was that cement (or polymer–cement) composites without dispersed polymer reinforcement exhibit severe degradation (spalling, cracks, etc.) at temperatures above 300–400 °C, as documented in numerous publications on this topic—[15,50,51], among others. The aim of the research presented here was to analyze mortars potentially suitable for the repair and protection of fire-damaged concrete structures where there is an increased risk of fire occurring or where fire suppression conditions are compromised.
2.1. Sample Preparation
Test specimens measuring 40 × 40 × 160 mm were manufactured in accordance with EN 12190 technical standard [52] for the research purposes; a total 120 specimens (1 set = 5 test specimens) were produced. During production, the dry components were first mixed, then the partly pre-saturated aggregate was added. Finally, water, including the super-plastifying admixture (Viscocrete 1035, Sika CZ, s.r.o., Brno, Czech Republic), was added. Steel forms were filled with the material in two layers, each of which was densified by vibration. Immediately upon densification, the specimens were covered by wet textile and foil. The humid storage (covered specimens) lasted 72 h.
Subsequently, the specimens were removed from their molds for the remaining 25 days and left in the open under laboratory conditions, meaning at a temperature (20 ± 2) °C at a relative humidity of approximately 50%. After that, testing of parameters took place, including thermal exposure (up to 1000 °C).
2.2. Thermal Exposure
The test specimens from polymer–cement mortar were exposed to increased temperatures of 600 °C, 800 °C and 1000 °C (see Figure 5, Figure 6 and Figure 7). The tests also used a comparison set of specimens stored at a temperature of approximately 22 °C.
Figure 5.
Test specimens during thermal exposition in a furnace (1000 °C).
Figure 6.
Temperature curves—“Tp” programmed temperature on furnace, “Tm” actual (measured) temperature in furnace for all regimes, i.e., Tmax 600 °C, 800 °C and 1000 °C.
Temperature regime is same as presents Melichar et al. [3,6,7]. A steep increase to maximum temperature is apparent from the course of the curve (see Figure 6). The gradient of the temperature increase was 10 °C/min. The isothermal endurance at maximum temperature was 90 min. The last phase of the isothermal regime was gradually managed cooling at the gradient approx. of 1 °C/min. Two temperature curves are shown in Figure 6: programmed and actual (measured). Programmed temperature (Tp) was set on the control unit of the furnace (type 2018S, CLASIC CZ, spol. s.r.o., Řevnice, Czech Republic). The actual temperature (Tm) was measured using sensors located directly inside the furnace. Temperature sensors are an integral part of the furnace.
Test specimens were visually observed (by naked eye) after the thermal exposure, i.e., cooling. The focus was placed on identifying potential defects and anomalies, such as cracks, spalling, changes in color, etc.
Figure 7.
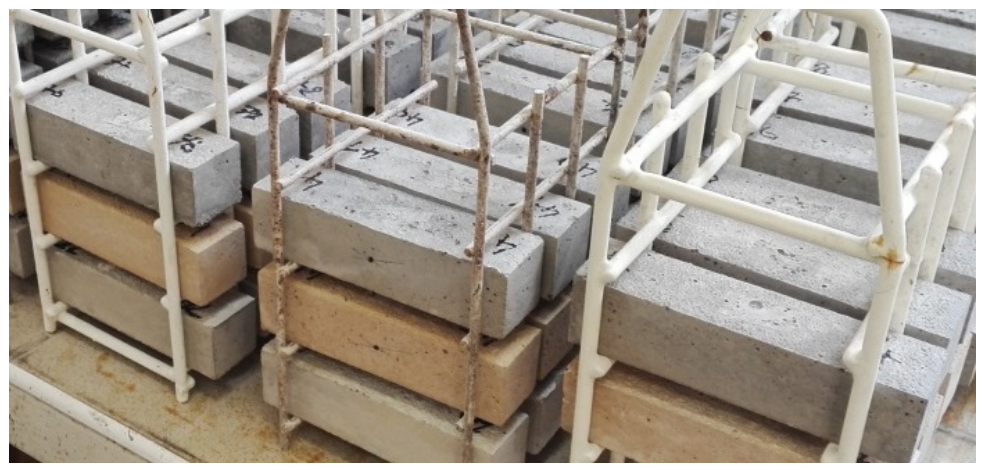
Test specimens after thermal exposure in a furnace.
2.3. Impact-Echo Technique
Given the ongoing development of the designed mortar varieties, non-destructive testing using the acoustic impact-echo method was chosen for this study. This method of testing previously proved its ability to identify the level of degradation by chemical agents [53], as well as temperature [54]. Its main benefit is in simple usability, fast rates of execution and a non-destructive character, where the test specimens, tested elements or structures are in no way damaged during testing.
The method (scheme—see Figure 8) is based on the creation of a low-frequency mechanical impulse that vibrates the tested specimen. Excitation is performed using the impact from a small spherical hammer applied to the tested structure. The mechanical wave is formed by three basic components: longitudinal waves (P-waves), shear waves (S-waves) and surface Rayleigh waves (R-waves). Each type of wave travels through a solid material as a different rate. While the longitudinal waves are fastest, the shear waves reach approximately 62% of the speed of the longitudinal waves [55]. In the case of a perfectly homogenous material, the mechanical wave travels through the material in an unchanged manner until it hits an interface between materials with different acoustic impedance.
Figure 8.
Testing scheme of impact-echo measurement.
At that moment, an absorption, reflection and partial scattering of the mechanical waves occur. Simultaneously, each interface of materials of different acoustic impedance acts as a new source of mechanical waves [56]. Using a piezoelectric sensor, the vibration of the test specimen is translated over time into an analog signal.
In this testing setup, piezoceramic MIDI 446s10 sensors (Dakel, Hořovice, Czech Republic) were selected for recording the excited vibrations, while a 175 g spherical hammer was used for exciting the signal. Using beeswax, the piezoceramic sensors are glued to the surface of the tested construction. The signal is recorded using the Handyscope HS3 digital oscilloscope (TiePie, Sneek, Netherlands) with a sampling frequency of 195.3 kHz and a vertical resolution of 16 bits. The test specimens were measured in the longitudinal testing direction and the resonance frequency was evaluated in the longitudinal direction fL by placing the sensor and the entry location of the impulse on the opposite sides of the test specimen in the lengthwise direction (see Figure 9).
Figure 9.
Test scheme of impact-echo measurement: 1—position of the sensor, 2—position of impact.
Several frequencies relating to the density of the tested material, shape, inner tension, homogeneity, etc. may be measured on a single test specimen, appearing in a degree corresponding to the condition of the tested material.
Each stored record contains 65,536 samples (335.5 ms), including a pre-trigger section of 3.4 ms preceding the impact. The impact was repeated until a clear, well-defined resonance peak appeared in the spectrum displayed during the measurement; depending on the condition of the specimen, one to five impacts were needed, since the thermally degraded specimens dampen the impact energy more and require a more precise impact. A single record per specimen and test configuration was then stored. Three specimens of each set (72 specimens in total) were measured approximately one week after the thermal exposure, and the same specimens were subsequently tested destructively.
The measured signals were subsequently processed by two analytical methods: the wide-spread and frequently used fast Fourier transform (FFT) and continuous wavelet transform (CWT).
The dominant frequencies were evaluated from the amplitude spectrum of the whole record (FFT, frequency resolution 2.98 Hz): the longitudinal frequency fL from the record of the longitudinal configuration (Figure 9) and the fundamental flexural frequency fF from the record of the transverse configuration. The peaks were selected manually by the operator in an in-house labeling software, with the cursor snapped to the nearest local maximum of the spectrum; narrow interference lines of the digitizer at multiples of 3.05 kHz were disregarded. The dynamic modulus of elasticity was calculated from fL, the mass m and the dimensions of each specimen as Ed = 4LmfL2/(bh) (ASTM C215).
The fast Fourier transformation is a time-frequency representation, as well as a function of time t0 and frequency f, and provides an approximation to the frequency content of the signal over a small-time interval about time t0. This approach is most widely used for signal processing in building vibro-acoustic diagnostics [55,56,57] as the dominant resonance frequency is most often assessed. The output of the FFT is the frequency spectrum where dominant and harmonic frequencies are evaluated. We can describe the presence of defect or change in physical-mechanical properties by the change of dominant frequency.
Continuous wavelet transformation (CWT) can be viewed as filtering of the signal by a dilated version of mother wavelet ψ(t). The wavelet can be viewed in a time window with adjusted width and height, depending on the scale—widening for long-scale (low-frequencies) information and narrowing for small-scale (high-frequency) content.The CWT is a time-frequency or, more correctly, a time-scale representation and produces a complex-valued surface. As the Gabriella Epasto et al. [57] mentioned, the CWT method of interpreting the signal can provide the dominant frequency as well as FFT, but in the case of a noised signal and heavily damaged material, a CWT method can provide more parameters and rapid detection of flaws and defects. The scalograms in Section 3.2. were calculated in MATLAB R2017 (function cwt) and with the fCWT library v2.0.0 [58] using the Morlet wavelet (σ = 6) and 300 logarithmically spaced frequencies between 1 and 20 kHz, from the first 20 ms of the record after the trigger; the spectra and statistics were evaluated in Python v3.13.12 (NumPy v2.2.4, SciPy v1.15.2).
2.4. Computed Tomography
The three-dimensional analysis was executed using the Phoenix v|tome|x M300 computer tomography device (GE Sensing & Inspection Technologies GmbH, Wunstorf, Germany) in the AdMaS Center (a part of Brno University of Technology; see Figure 10). The voltage of 150 kV and a 200 µA current were used to irradiate test specimens measuring 40 × 40 × 160 mm. The three-dimensional image of the test specimen was always composed of 3000 images (semi-turns), where each image is an average of three measurements. The achieved resolution of one image pixel was 40 µm. The tomography device was used to explore the structure in relation to previous findings from the non-destructive impact-echo method.
Figure 10.
CT—XRD tomography device (phoenix v|tome|x m 300) for non-destructive assessment of three-dimensional structure (detail of the measuring chamber with a specimen).
The specimens were analyzed in all three planes (x, y, z) and images of interesting areas were captured (see Section 3). The particular intent was to prove the presence of non-homogenous materials or defects in the structure of both the matrix and the filler, including their interface. All specimens were examined using CT prior to executing any destructive tests, in order to prevent a negative effect on their structure.
2.5. Microstructure
Microstructure was examined using a TESCAN MIRA3 XMU device (TESCAN GROUP, a.s., Brno, Czech Republic), enabling maximum magnification up to 1,000,000×. The device is equipped with a Schottky auto-emission cathode. The measurement was executed at the acceleration voltage of 20 kV in the SE mode (primary electron beam). Prior to microstructure analysis, a thin layer of gold was applied to the specimens in a vacuum. The goal of examining the microstructure was the analysis of very fine defects or possible changes to the structural arrangement of mineralogical phases of the matrix.
The study of microstructure was further focused on the interfacial zone between the matrix and porous aggregate. The transition zone between the matrix and the aggregate is the most problematic area when affected by the shock of extreme temperatures. This is due to fundamentally different components (in terms of parameters) that come into the interface in this area.
However, significant attention was also paid to the behavior or the distributed reinforcement. The anchoring of fibers into the matrix, along with their defects or clusters (the evenness of distribution) were monitored in reference specimens. In the case of the thermal-exposed mortar, only those cavities left after the disintegration of fibers were identified and evaluated. The shape or interconnectedness of the porous system were essential, as well as the character (integrity, etc.) of the cavity walls (channels).
2.6. Physical and Mechanical Tests
Additionally, the physical and mechanical properties were also established to supplement and verify the outputs of the previous analyses. Specifically, volumetric weight, compressive strength and bending tensile strength were tested.
These properties were established in accordance with European technical norms EN 12190 [52] and EN 196-1 [59]. The above properties were also tested on specimens in the shape of prisms measuring 40 × 40 × 160 mm. The testing took place both prior to and post thermal exposure, and the respective graphs (see Section 3.1) also include percentile changes of the monitored parameter due to the effect of temperature.
3. Results and Discussion
After exposing the test specimens to extreme temperatures and subsequently allowing them to cool gradually—prior to physical and mechanical analysis—a visual inspection was conducted. Virtually no significant defects, such as spalling or numerous wide cracks, were observed. As the temperature increased, specifically at 800 °C and 1000 °C, noticeable changes in color shade were observed, ranging from the original gray to a more pronounced beige, which is related to changes in the phase composition of polymer–cement matrix. Furthermore, minor cracks were observed on the specimens exposed to a temperature of 1000 °C. These cracks occurred only in localized areas in small amount on the surface of the specimens and were up to approximately 0.1 mm wide.
3.1. Physical and Mechanical Analysis
The following graphs (Figure 11, Figure 12, Figure 13 and Figure 14) show the comparison of average values of the physical and mechanical parameters monitored. In the case of strength characteristics, errors are also evaluated (see the following graphs—Figure 13 and Figure 14).
The bulk density of the composites in hardened states reached approximately 1400 kg/m3, while mortar G71 through G73 had moderately higher values. A decrease of 10–11% took place at temperatures approaching 600 °C (see Figure 11). Subsequently, the decrease of volumetric weight only fluctuated between 13 and 15% at the exposure of 1000 °C (resulting in deeper decrease by 2 to 5% from the temperature of 600 °C to 1000 °C). Mortar G51 through G53 could be evaluated slightly better in terms of the decrease of volumetric weight, where the maximum decrease recorded was up to 13.9% while, in the case of G71 through G73, it was up to 15.3%.
Figure 11.
Bulk density and its changes after thermal exposure: (a) (G51–G53), (b) (G71–G73).
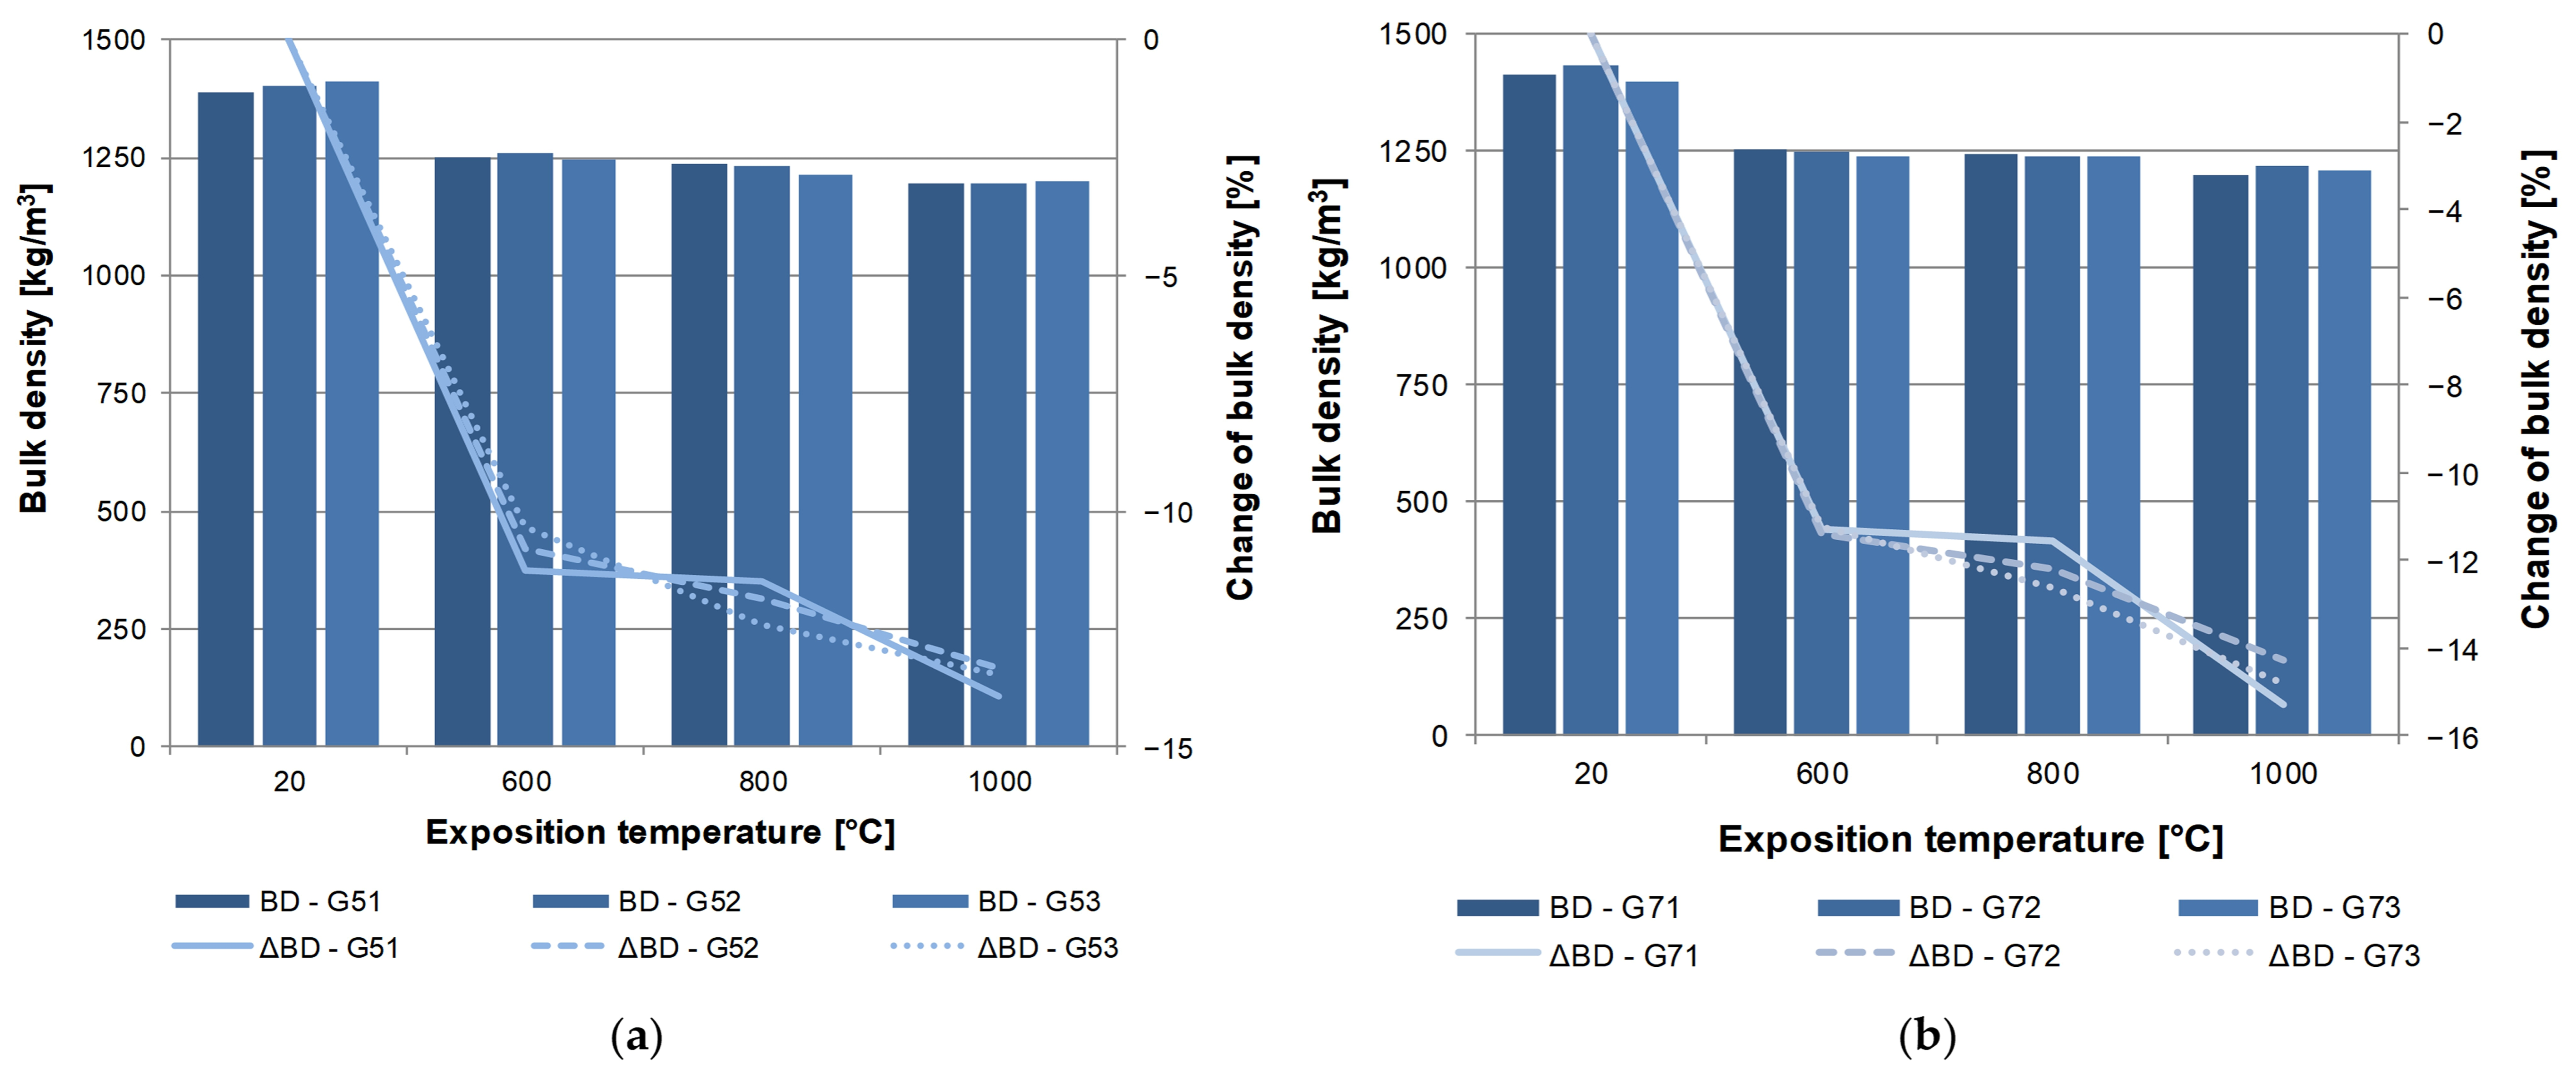
The decrease in bulk density is particularly interesting in the area of thermal exposure of 800 °C. Evidently, a change of structural behavior occurred, particularly showing itself in materials containing the lowest portion of fibers—0.5 kg/m3. Notably, this change occurred in both types of fibers. However, the differences in the parameters of the actual fibers are not particularly significant. Therefore, this fact could be, to a degree, expected. The relative errors of bulk density for the individual variously heat-exposed sets of specimens ranged between 0.14 to 0.56% (materials G5X) and 0.08 to 0.70% (materials G7X). These values can be characterized as very low.
In order to objectively evaluate all changes from the perspective of bulk density, changes in volume and weight were also monitored separately, aside from this parameter (see Figure 12). As is apparent, the weight and volume of all mortar types decreased with increasing thermal exposure. These changes relate to the escape of free water, as well as with the decomposition of the hydrating products of the matrix of the tested mortar.
Figure 12.
Volume and weight changes after thermal exposure: (a) G51–G53, (b) G71–G73.
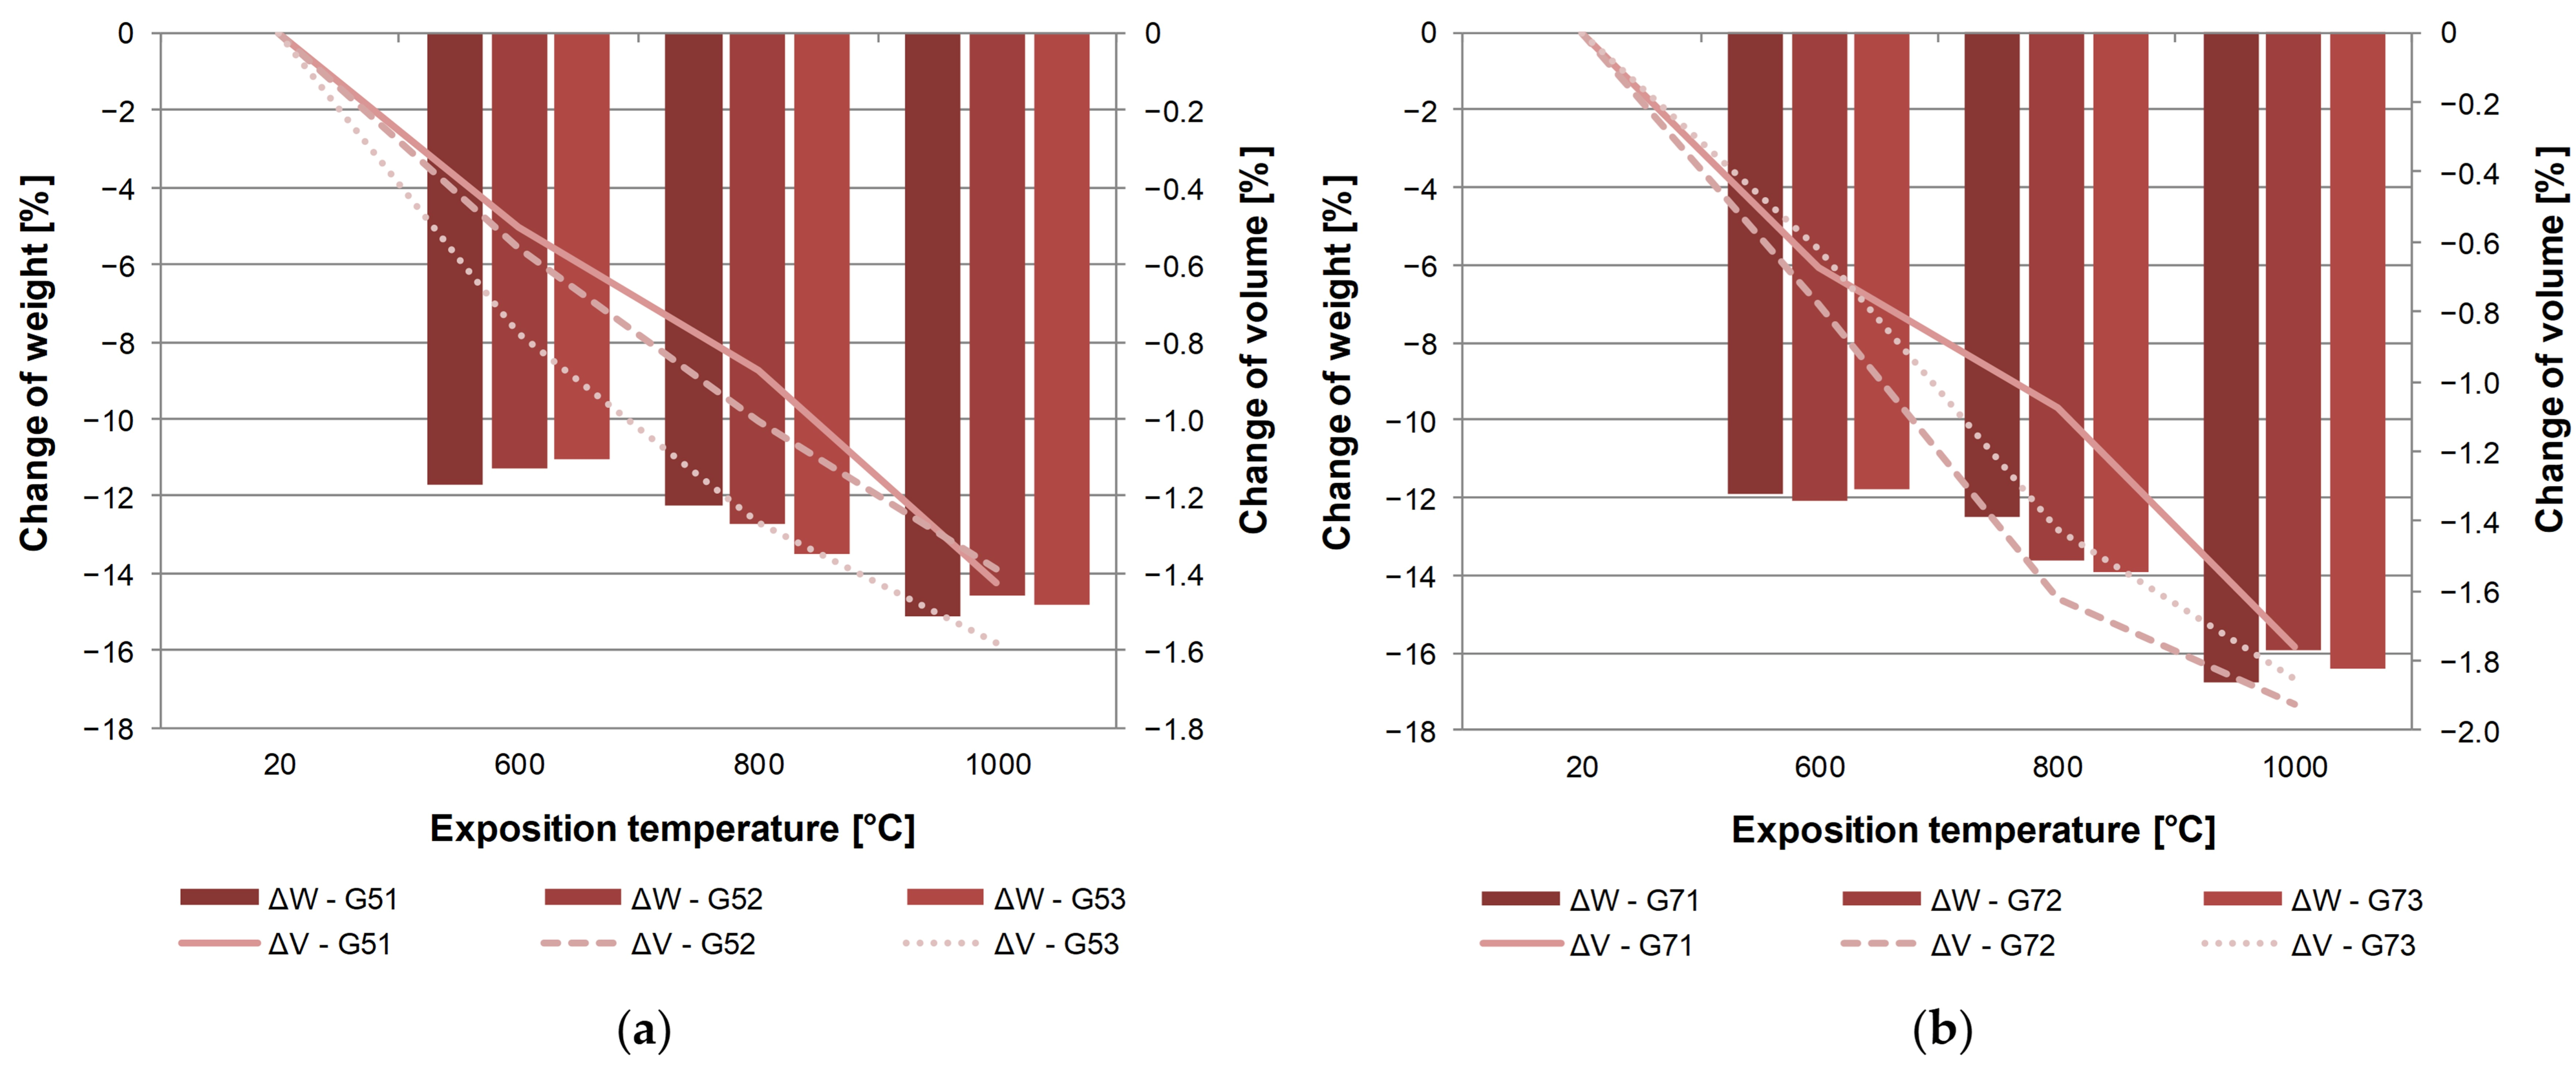
Specifically, the decomposition of CSH (amorphous and crystalline) and CH (Portlandite) phases, as well as CaCO3, can be mentioned. The weight of the entire composite decreases, due to the physical and chemical escape of bonded water, particularly through water contained in the matrix. The decomposition of components also causes a decrease in volume of the given composite (in this case of polymer–cement mortar). The fact that the decomposition of polymers, specifically of the distributed reinforcement as well as the polymer modifier of the matrix, also takes place is significant. The course of volume changes does not correspond to the trend of curves showing the decrease of volumetric weight. As in the case of changes of volumetric weight, a significant jump can only be observed in the decrease of weight as such.
Given the decrease of weight (which relates to physical and chemical changes and changes of the microstructure), it cannot be clearly determined which type or amount of fibers is optimal, as various reductions take place over the course of the heating. An adverse course of changes of weight reductions after the exposure to temperatures of 800 °C is apparent in both cases, namely in composites G5X and G7X.
Volume changes were recorded to a lesser degree in mortar G51 through G53. The maximum change of volume was established at approximately 1.6%. Upon exposure to the temperature of 1000 °C, composite G73 reached a volume change of approximately 1.9%. An interesting finding was the direct dependence of the increased amount, meaning G51 through G53, where the shrinkage is more notable (see Figure 12a). Also, the mutual difference in the trend of volume changer between G51 and G52 is significant, in that it does not show in the same manner as in the increase of the fiber portion to 1.5 kg/m3 (meaning the difference between G52 and G53). Differences in volume changes are to a larger degree particularly apparent in the case of G71 through G73 after exposure to a temperature of 800 °C. Both materials appear as the most resistant from the perspective of volume changes at the fiber portion of 0.5 kg/m3 (meaning G51 and G71).
The average compressive strength of the mortars that have not been exposed to high temperatures ranged between 31 and 35 N/mm2 (see Figure 13). Higher strengths were recorded in the case of mortar G51 through G53 (see Figure 13a). The maximum was achieved in the case of G52 mortar—35 N/mm2. The decrease of strength upon exposure to the temperature of 1000 °C ranges approximately within the interval of 62 through 65%. This is very good result because common concrete reaches approx. 90 to 100% decrease according to Ma et al. [45] (Ma collected data from 46 literary sources). Significant reduction in compressive strength concrete containing waste rubber fiber was also proved by Gupta et al. [49]. Cement composites or mortars containing lightweight aggregate reaches ca. to 90% decrease in compressive strength [51]. Interesting resistance to elevated temperature was noted by Koksal et al. [43], i.e., ca. 46 to 50% decrease in compressive strength. However, Koksal analyzed lightweight mortar characterized by reference (without elevated temperature exposition) compressive strength 7.3 to 16.4 MPa, which is not sufficient for structural repair mortar.
Figure 13.
Compressive strength and its changes after thermal exposure: (a) G51–G53 (b) G71–G73.
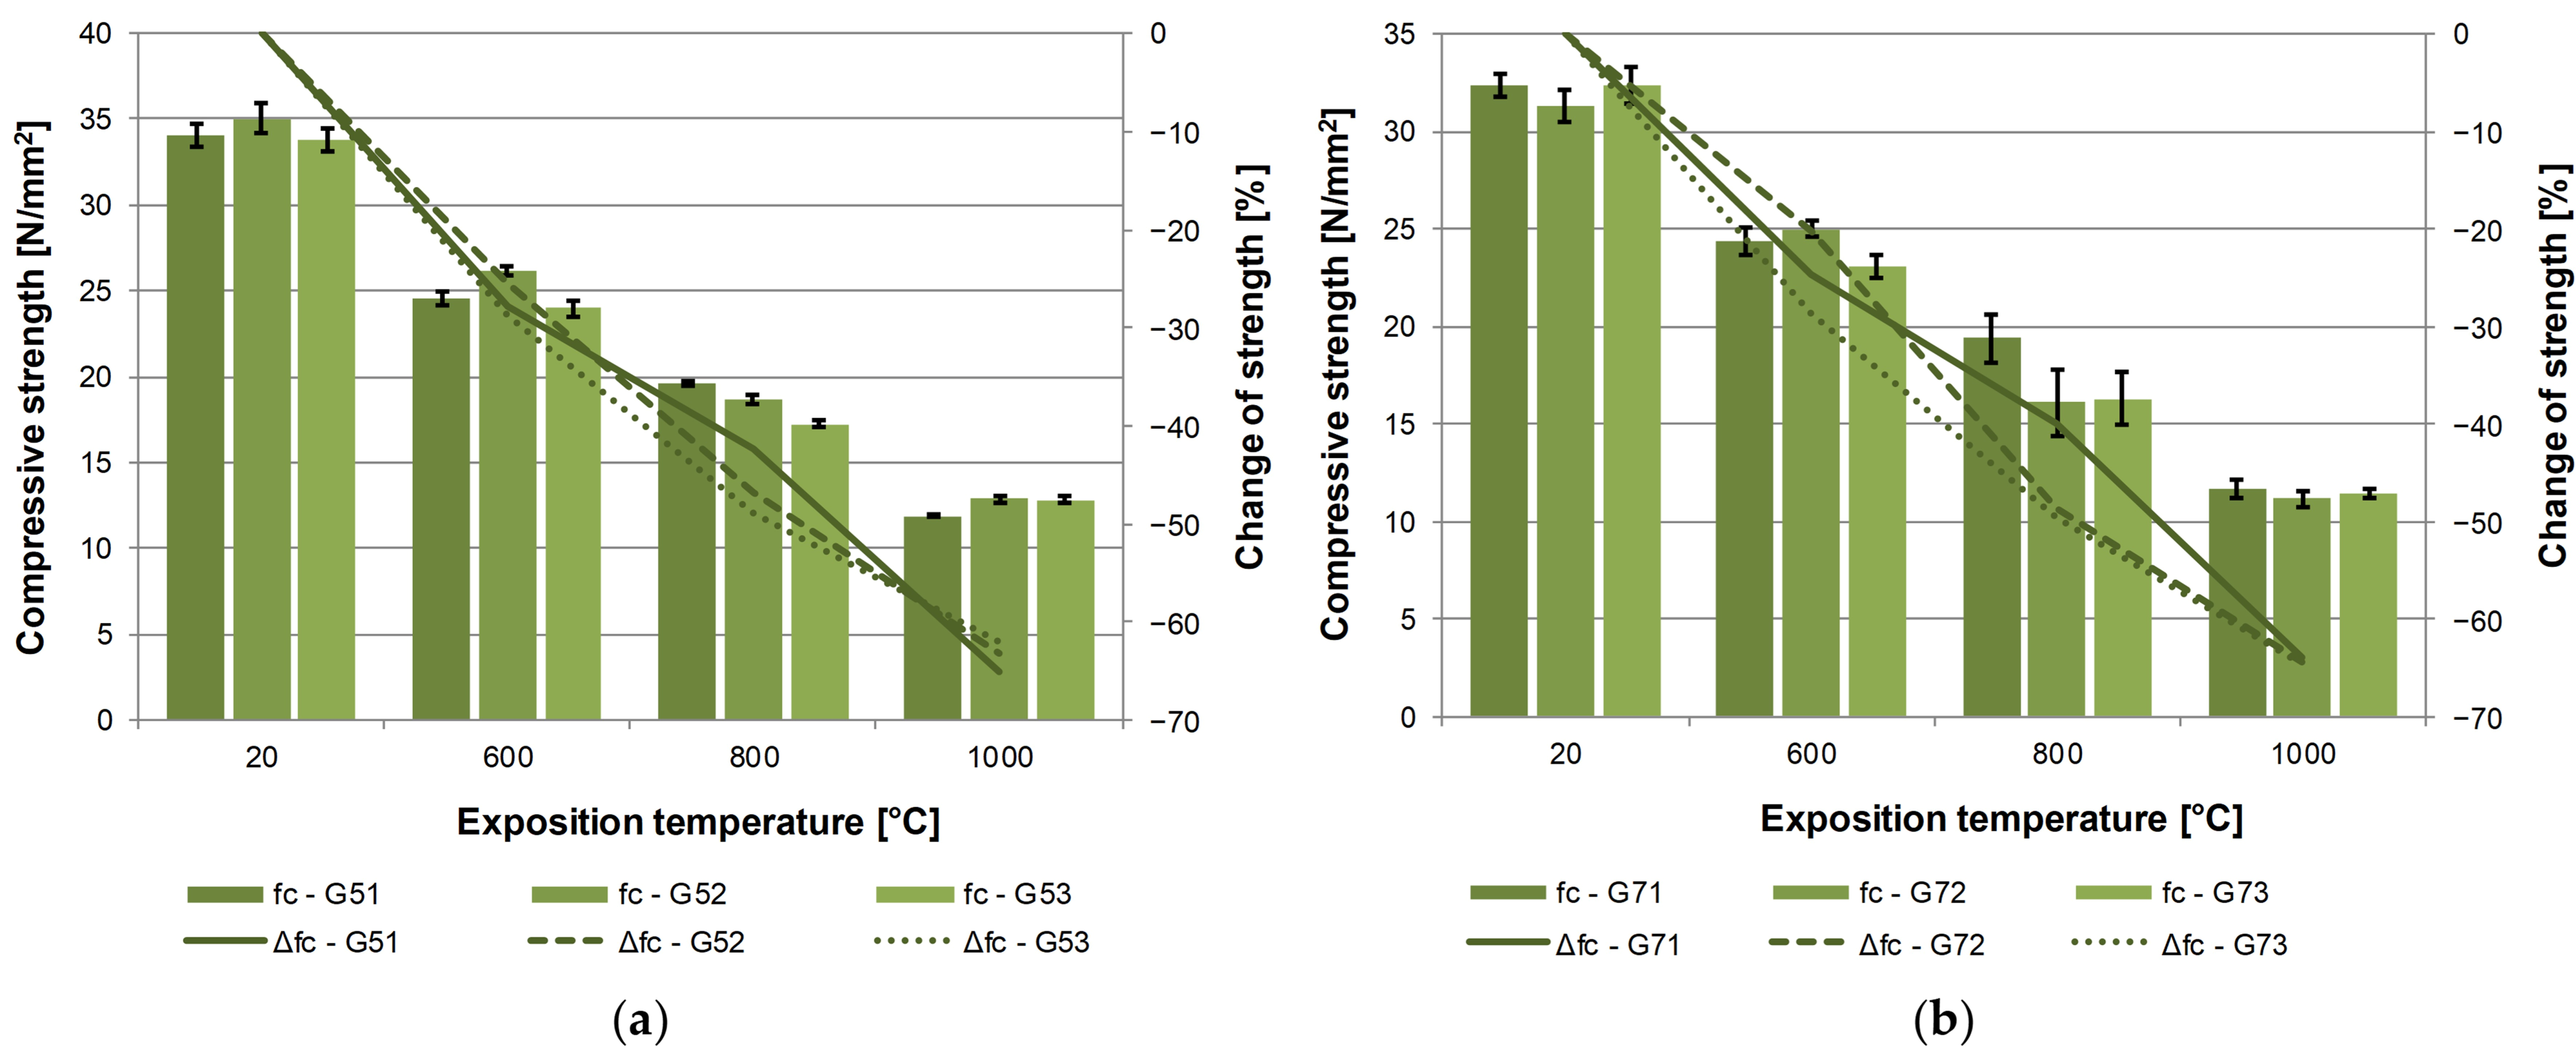
It is not possible to deduce an exact dependence between the compressive strength and the amount of fiber in the given mixture from the course of compressive strength data. Material G51 appears to be the most resistant to temperature changes; however, this is only true for the exposure to a temperature of 800 °C. Material G52 (meaning fiber portion of 1.0 kg/m3) shows a more leveled course of heat resistance, characterized by the decrease of compressive strength.
More significant spreads of compressive strength values due to thermal exposure were found in the case of materials G71 through G73. However, it may be stated with certainty that the least heat resistant was G73 (meaning with the fiber amount of 1.5 kg/m3). Composite G72 is more resistant to thermal stress up to the temperature of 600 °C, but beyond that, material G71 appears as more suitable. Upon reaching the threshold of 1000 °C all mortars containing the G-700T behave practically identically (see Figure 13b).
Differences in behavior of the analyzed mortars are also suggested by the established errors that may partly serve as evidence of anomalies, defects or faults in structure. Notably different faults in compressive strength are apparent in materials G7X upon exposure to the temperature of 800 °C, meaning the relative error ranged between 6.37 and 10.28%.
The performance of analyzed materials from the perspective of flexural strength (see Figure 14) was very interesting. Bending tensile strength ranged from 5.2 to 7.0 N/mm2 and the decrease of this strength shows a rather wide interval (compared to compressive strength), that is approximately 56 the 66%.
Figure 14.
Flexural strength and its changes after thermal exposure: (a) G51–G53 (b) G71–G73.
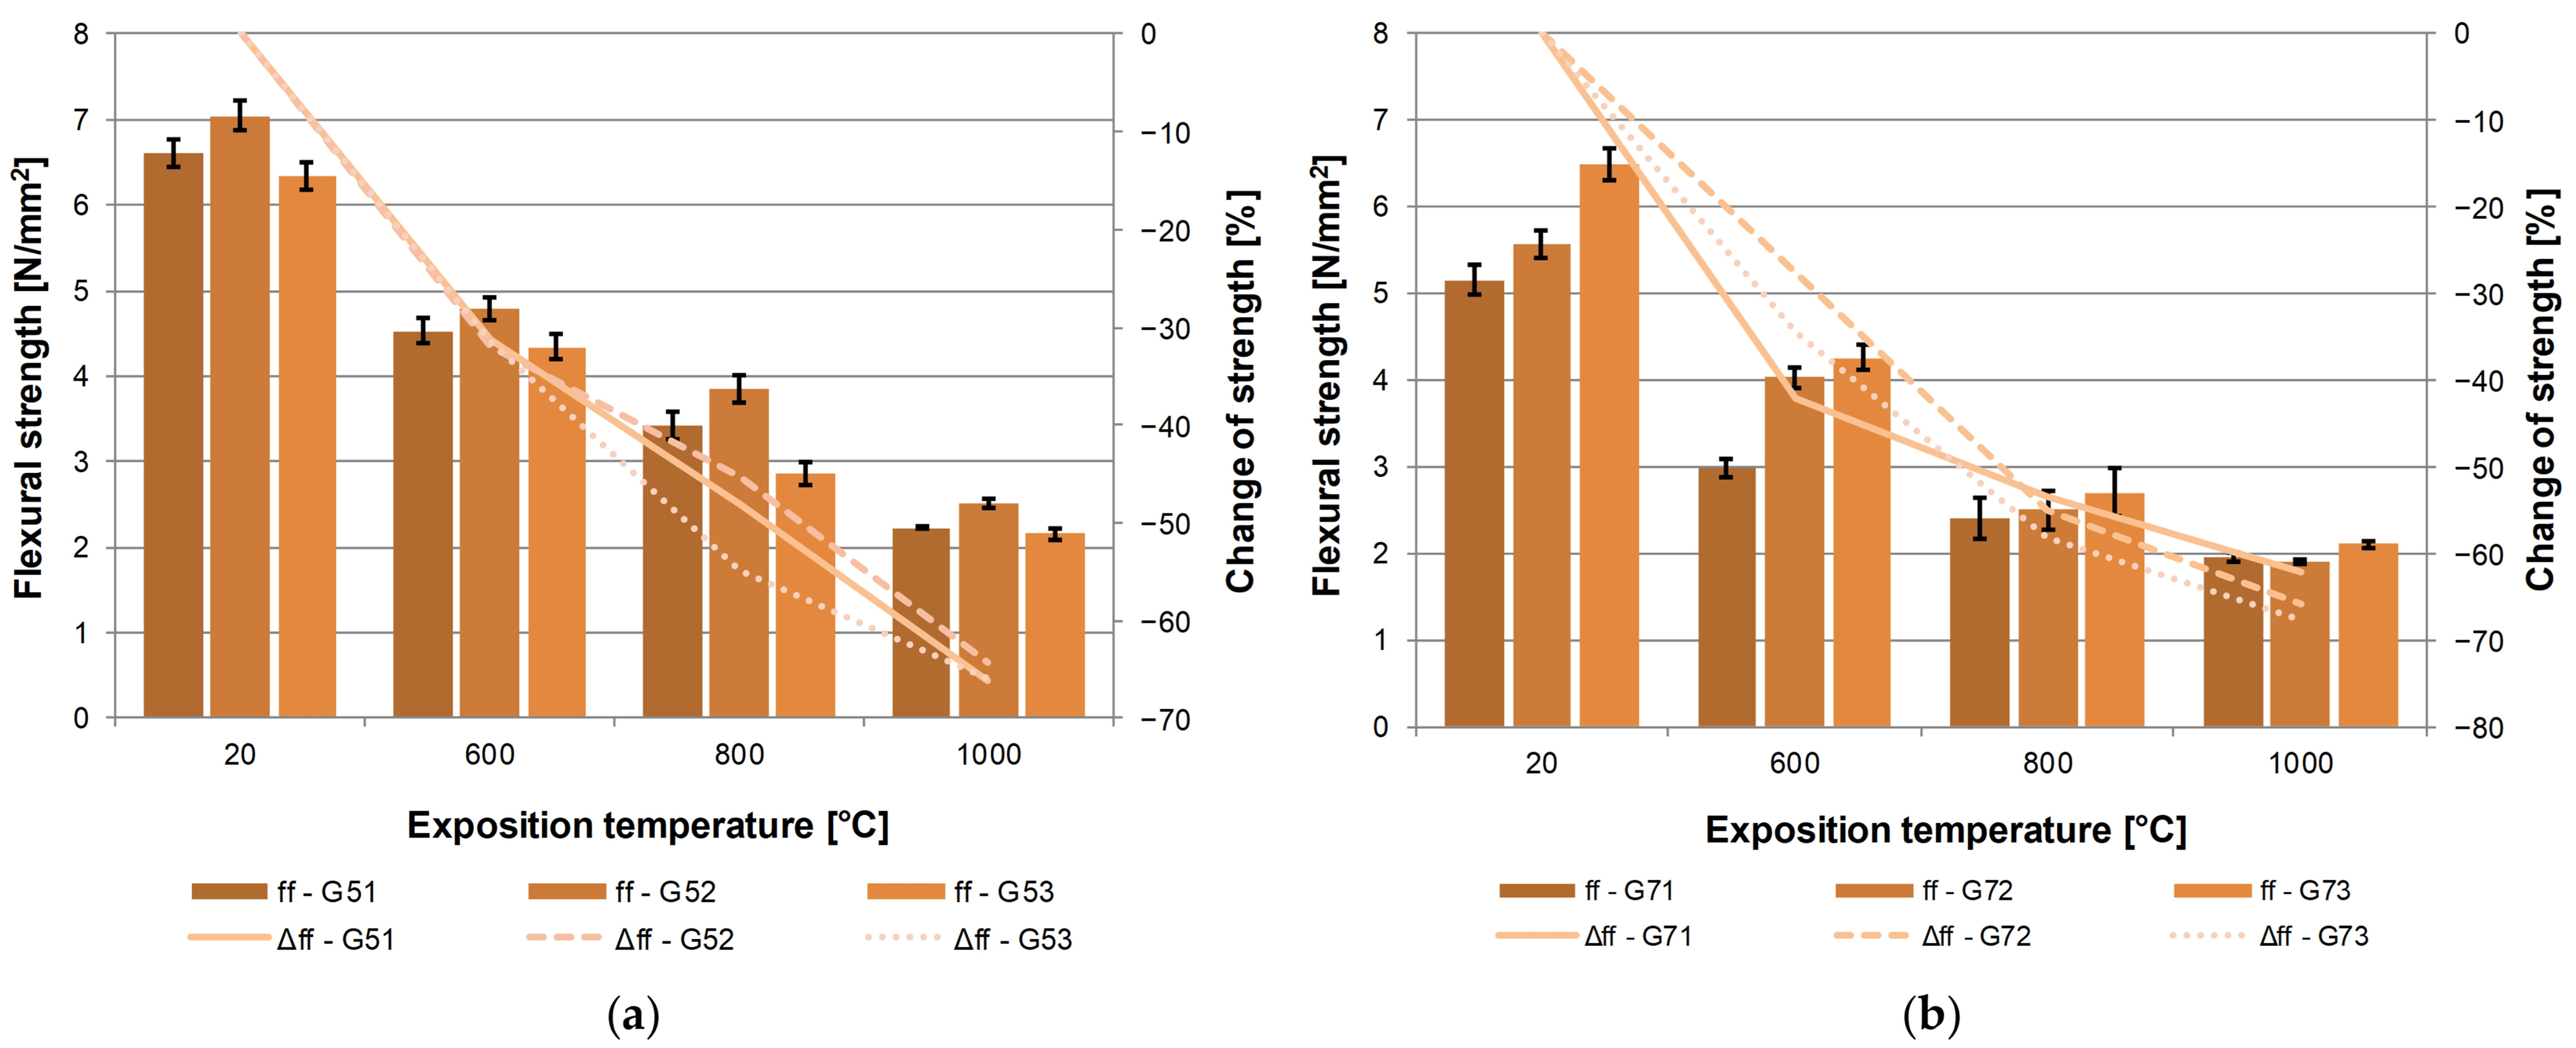
The portion of G-500T fibers up to the temperature of 600 °C behaved practically identically. The most notable difference was recorded upon the exposure to the temperature of 800 °C. At 1000 °C the changes of flexural strength are very similar, meaning 64.4 through 66% (see Figure 14b). Mortar G52 (fiber content of 1.0 kg/m3) resists the effects of temperature the most.
The behavior of the mortar containing the G-700T fibers is more diverse from the perspective of flexural strength (see Figure 14b). It is possible to a larger degree to note value spreads moving in dependence on the portion of fibers. However, the course of flexural strength is interesting, specifically its decrease, from the exposure temperature of 600 °C. When comparing mortars G71 and G73 upon exposure to the temperature of 600 °C, G73 may be considered a more resistant type. However, at higher temperatures, the more resistant material is the one containing a lower amount of fibers. G71, in comparison with all three portions of distributed reinforcement, shows the best heat resistance. Upon the temperature of 1000 °C, a decrease of flexural strength was recorded at 62.2% (2.0 N/mm2) in the case of G71 and up to 67.6% (2.1 N/mm2) in the case of the G73 formula.
Compared to the behavior of materials under compressive strength, the relative error in flexural strength reached higher values. As in compression, more significant errors were apparent in the case of materials G7X, where relative errors at the exposure temperature of 800 °C were established in the interval of 9.12 through 9.96%. To the contrary, in the case of G5X materials, the relative error was established between 4.11 and 4.88%.
3.2. IE Analysis
A non-destructive analysis of the mortar structure was carried out using selected heat-exposed as well as reference mortar. As is apparent from the graphs below (Figure 15), a shift of resonance frequency to lower values was recorded in all tested sets upon measuring resonance frequencies in the longitudinal direction. In all cases, the amplitude of the resonance frequency of the reference specimens was within the range of 9.6 through 10.1 kHz, with amplitude around 5 mV. The amplitude of resonance frequency of thermally degraded testing sets differed in relation to both the varying thermal degradations and the varying amounts of fibers used. The ignition temperature of cellulose ranges around 270–315 °C [60] and pyrolysis of recycled cellulose fibers occurs 250–450 °C [16], which is apparent from the fact that sets burned at temperatures of 600–1000 °C contain no cellulose fibers. This creates channels left after burned fibers that then form the material additional interface air/mortar inside the test specimens.
Figure 15.
Change of longitudinal resonance frequency of samples degraded by different temperature: (a) G52, (b) G53, (c) G72 and (d) G73.
In the case of materials containing the G-500 T fibers and subsequently exposed to the temperature of 1000 °C, a gradual decrease of their own frequency took place from 10 kHz to 6.7–7.1 kHz (means of the sets).
Mortar with the G-700 T fibers showed a slightly different trend in resonance frequency. The mean fL of the sets exposed to 800 °C was 6.4–6.8 kHz, while the sets exposed to 1000 °C showed 6.7–6.8 kHz; in G71 and G72, fL thus slightly increased between 800 and 1000 °C (by 3.7% and 2.8%), whereas in G73 it remained practically unchanged (−0.2%). This behavior is analyzed at the level of individual specimens below (Figure 16). Also, the amplitude of the measured frequencies ranged within the values of 15 to 20 mV for all temperature sets, showing considerably clearer responses of test specimens on the excited mechanical impulses. One of the reasons why this phenomenon occurs is the burning of the distributed reinforcement, meaning porousness increases in the structures of the examined materials.
Figure 16.
Longitudinal resonance frequency fL (top) and dynamic modulus of elasticity Ed (bottom) of individual specimens (small symbols) and means ± standard deviation of the sets (lines) versus exposure temperature; G-500T fibers (a), G-700T fibers (b); n = 2–3 specimens per set. G71 at 800 °C: fL from the original evaluation of the measurement (records not archived; open symbols), Ed not available.
Additionally, the disintegration of some phases (Portlandite, calcite, CSH, etc.) at higher temperatures contributes to the expansion of the porous and capillary systems. Figure 16 shows the longitudinal resonance frequency fL and the dynamic modulus of elasticity Ed of the individual specimens together with the means and standard deviations of the sets. Since fL also depends on the length of the specimen (fL = (1/2L) · (Ed/ρ)1/2) and the specimens of G73 (20 °C) and G53 (800 °C) were approximately 165 mm instead of 160 mm long, Ed is used as a geometry-independent measure of stiffness.
A considerably notable similarity may be found in a comparison of the course of the curves indicating flexural strength decrease and frequency curves fL. The G5X test set showed evidently higher strength in the reference set than the G7X material. However, both test sets, G5 and G7, reached comparable flexural strengths within the range of 2–2.5 N/mm2 upon thermal stress at 1000 °C.
The differences between the reference sets are small (fL 9.7–10.2 kHz, Ed 14.3–15.1 GPa); the lower fL of G73 (9.7 kHz) results from the greater length of these specimens, as its Ed (14.3 GPa) is comparable with that of the other sets.
Up to 800 °C, fL decreased by 26–37% and Ed by 52–64% in all mixtures. Between 800 and 1000 °C, the behavior of the two fiber types differs (Figure 16). In G51 and G52, both fL and Ed decreased further (fL by 5.1% and 8.3%, Ed by 12.5% and 19.3%). In the G-700T mixtures, Ed of G72 increased by 4.6% and that of G73 changed by only −2.2%, although the bulk density decreased by 1.5–2.3% and the compressive strength by 29–30%. The slight increase of fL of G7X between 800 and 1000 °C thus reflects a preserved, or partially restored, stiffness of the material at 1000 °C, which is attributed to the onset of sintering of the matrix and the expanded clay aggregate between 800 and 1000 °C, whereas the strength, governed by the cracks formed during heating and cooling, continues to decrease. In G53, the apparent increase of fL (+2.3%) results from the greater length of the specimens exposed to 800 °C, as its Ed decreased by 3.8%. The changes between 800 and 1000 °C are small compared with the overall decrease and comparable with the scatter within the sets; with two to three specimens per set, statistically significant changes were found only for G72 (increase of fL, p = 0.03) and G52 (decrease of fL and Ed, p = 0.048 and 0.034; Welch t-test).
The scatter of the IE results within the sets is low: the coefficient of variation of fL ranged from 0.04 to 5.1% (median 1.3%), compared with 1.7–25.1% (median 12.3%) for the flexural strength and 1.4–14.1% (median 5.0%) for the compressive strength of the same specimens. fL showed a lower coefficient of variation than both the flexural and the compressive strength in 22 of the 23 evaluated sets. The largest scatter of fL was found at 800 °C (G51 and G52, 5.1% and 4.0%).
The following graphs (Figure 17) show the first 800 μs of the recorded response of the test specimen to the mechanical impulse for the individual test sets. The response amplitude in all cases ranges approximately ± 1.3 V, where the reference set always reaches the lowest response, except for set G52, where the amplitude of both signals (meaning G52—20 °C and G52—1000 °C) nearly overlap, which corresponds with the findings in the case of fL (see Figure 16a).
Figure 17.
Signal recorded by the piezoelectric sensor from IE measurement of samples: (a) G52, (b) G53, (c) G72, (d) G73.
The higher damping of the reference set is apparent from these graphs, which was already evident during the determination of FFT. Specimen sets exposed to 600, 800 and 1000 °C no longer contain used fibers. Thus, it may be concluded from the measured results that the presence of fibers and thermally undamaged structure of the tested material has a higher damping effect than in the case of sets burned at 600 through 1000 °C, thus confirming previous findings (see Figure 15 and Figure 16). Despite having evidently lower physical and mechanical properties and resonance frequencies, these sets behave as less of a vibration-damping medium than their reference sets.
According to depicting the bulk density of test specimens (Figure 11a), it is apparent that set G5X shows a decrease around 13–14% upon exposure to 1000 °C and set G7X is characterized by approximately 14–15% decrease at the same thermal stress (see Figure 11b). The steepest decrease was recorded in the case of specimens exposed to 600 °C, which corresponds with the burning of used cellulose fibers and the escape of physically and chemically bound water. The most notable degradation probably took place in the case of the G53 material, where the decrease of resonance frequency was not as notable, but the measured amplitude in both FFT and the signal was the lowest among all other measurements. Analysis of CT images (see Section 3.3) clearly shows numerous recognizable cavities and a network of cracks in the structure of the thermally exposed G53 material, which corresponds with those changes determined using IE.
With respect to heat resistance, set G7X appears more homogenous in terms of structure (meaning without the occurrence of defects and faults) than set G5X at the thermal stress of 600 °C. Although the initial properties of the G5X set are slightly higher than those of G7X, upon degradation caused by exposure to the temperature of 1000 °C their properties are comparable from the perspective of conventional destructive tests. In the case of materials G72 and G73, higher spreads of measured resonance frequencies appeared (see Figure 15d).
The results of the IE signals (see Figure 17a,b) of the G5X materials point to anomalies or defects, as well as the possible lack of homogeneity in the structure of the specimens exposed to temperatures of 600 °C. While in the G7X set this is a phase shift without notable deformations of recorded oscillation for all temperature sets, in the case of the G5X set at 600 °C, there appears to be the presence of noise and the resulting signal is difficult to parse, which became particularly apparent in their FFT (see Figure 15a,b). The comparison of properties of materials exposed to the temperature of 600 °C shows the best results in the case of the G5X material G52. However, from the perspective of the overall parameter evaluation of materials exposed to the temperature of 600 °C, the G5X set appears worse than the G7X set.
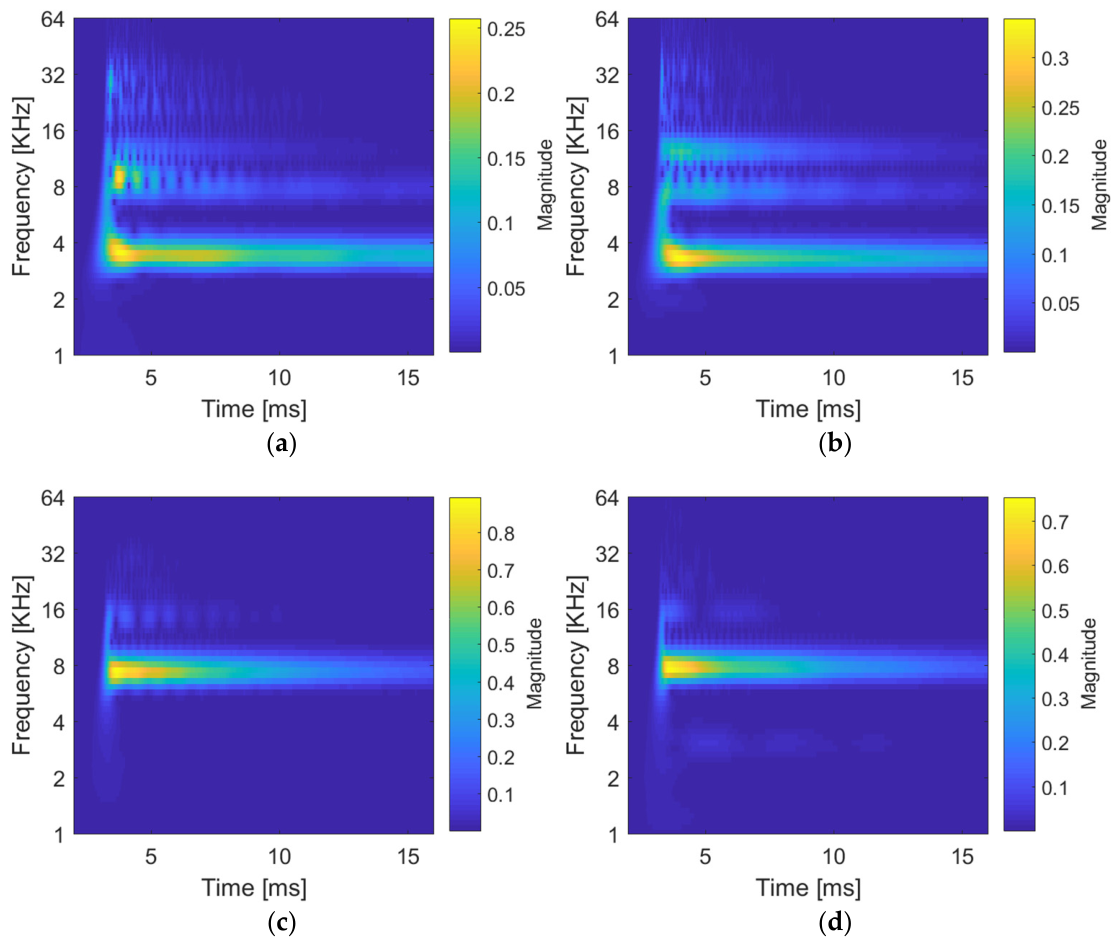
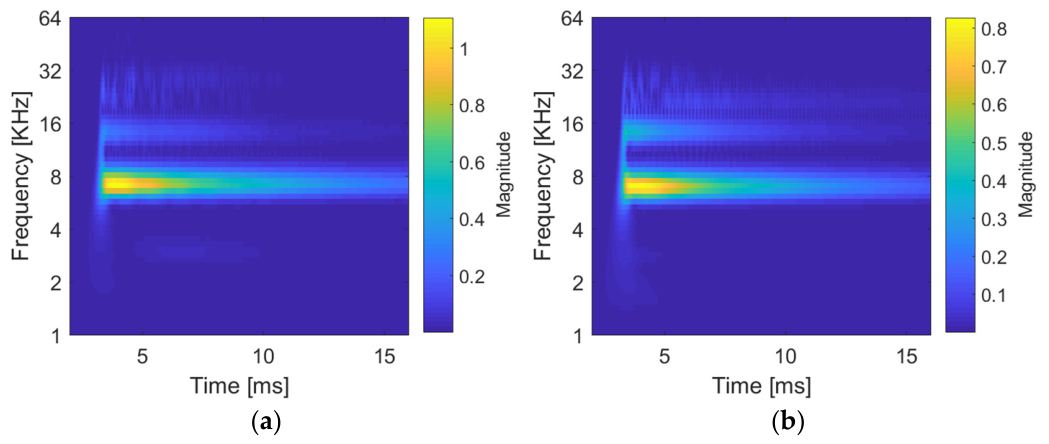
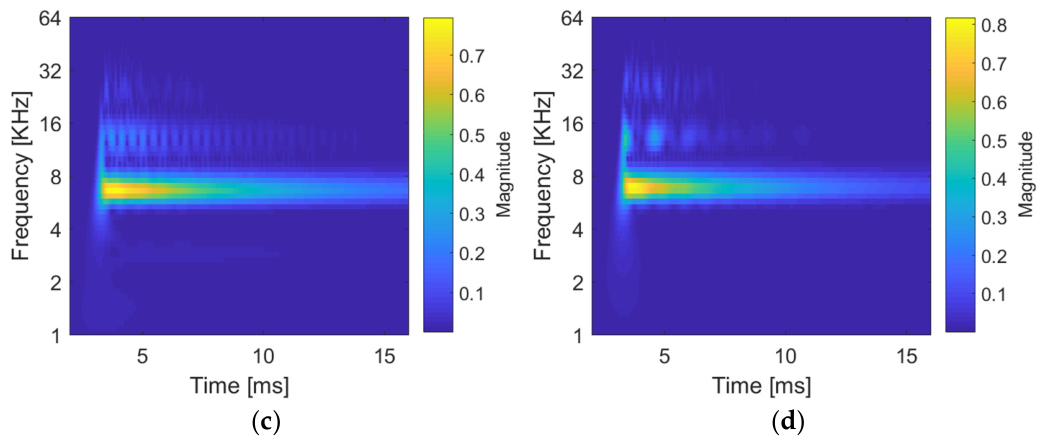
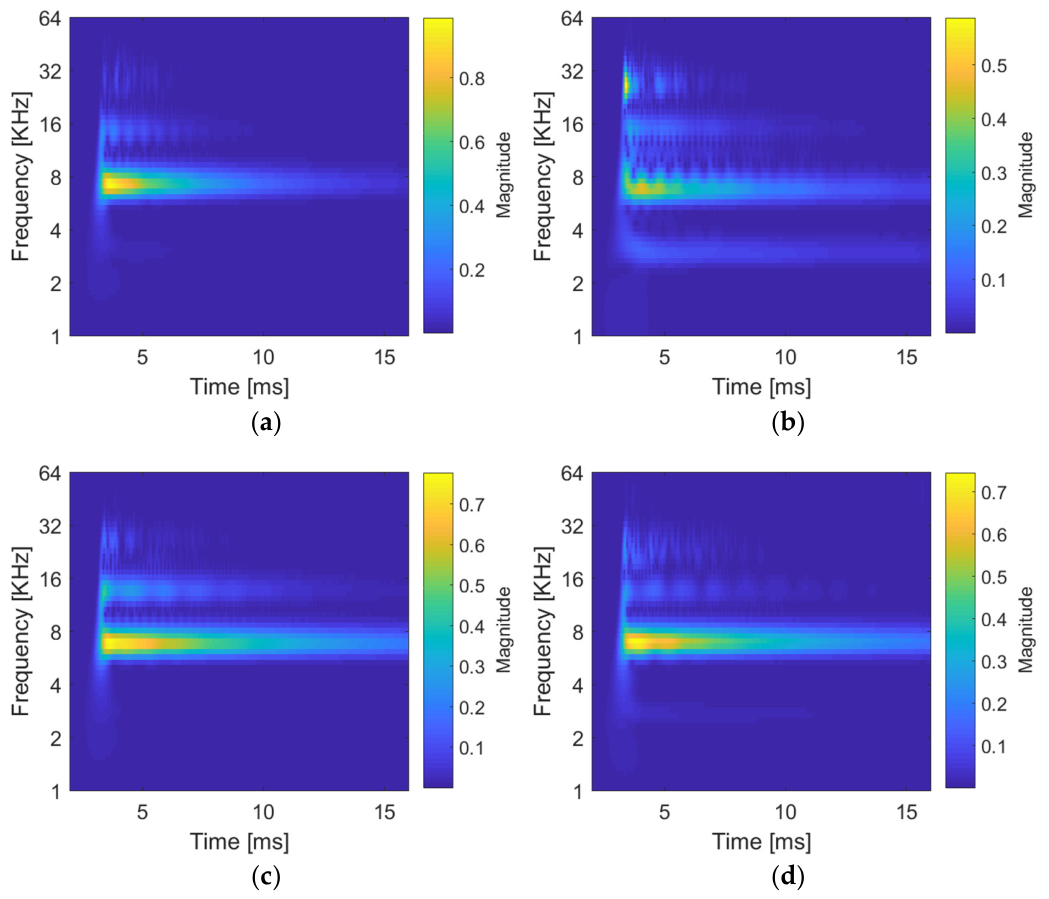
The internal changes of the tested sets may also be compared using the CWT method, where the timeline is sustained in the created scalogram, thus enabling the analysis of the development of signal frequencies over time. The individual scalograms are shown in the following images (Figure 18, Figure 19 and Figure 20); Figure 21 compares one specimen of G52 and G72 across all exposure temperatures.
Upon comparison of the behavior of both sets, specifically G5X and G7X at 600 °C (see Figure 18), differences may be observed in the presence of frequencies over time. At first glance, it is clearly apparent that additional dominant frequencies are present here in comparison to FFT. The presumption of the diversity of structure (appearance of non-homogeneity, defects, etc. due to thermal stress) of set G5X compared to G7X at 600 °C may also be confirmed by the considerably brighter dominant frequency on the scalogram (see Figure 18a,b). Here, one dominant frequency that clearly corresponds with FFT is present.
Upon comparison of sets G5X and G7X degraded at 1000 °C, a lower presence of non-resonance frequencies may be observed, although it is present in both the cases in sets G5X as well as G7X. The effect of temperature on the tested sets primarily appeared in cases where the designed material is approaching its physical and mechanical limits at such high temperatures.
Figure 18.
Scalogram (cwt) of samples degraded at 600 °C: (a) sample G52, (b) sample G53, (c) sample G72, (d) sample G73.
Materials G52 and G53 exposed to the temperatures of 800 °C and 1000 °C reach higher resonance frequencies than set G7X, although they also feature the presence of additional non-resonance frequencies. The scalograms of both sets exposed to 800 °C and 1000 °C are shown in the following images (see Figure 19 and Figure 20). The main difference may be observed in the frequency area of 12–32 KHz, where in this interval set G7X and G5X differ; nonetheless, the course is similar for both tested series. Here, the resonance frequency corresponds with the frequency obtained using FFT.
Figure 19.
Scalogram (cwt) of samples degraded at 800 °C: (a) sample G52, (b) sample G53, (c) sample G72, (d) sample G73.
In terms of scatter, the coefficient of variation of fL of the G5X sets exposed to 800 and 1000 °C was 0.1–5.1%, whereas that of the G7X sets was 0.6–2.5%.
Therefore, it may be concluded that although the G5X set had a higher initial and ending resonance frequency, at the same time it appears as less stable (from the perspective of structure) upon thermal stress.
Figure 20.
Scalogram (cwt) of samples degraded at 1000 °C: (a) sample G52, (b) sample G53, (c) sample G72, (d) sample G73.
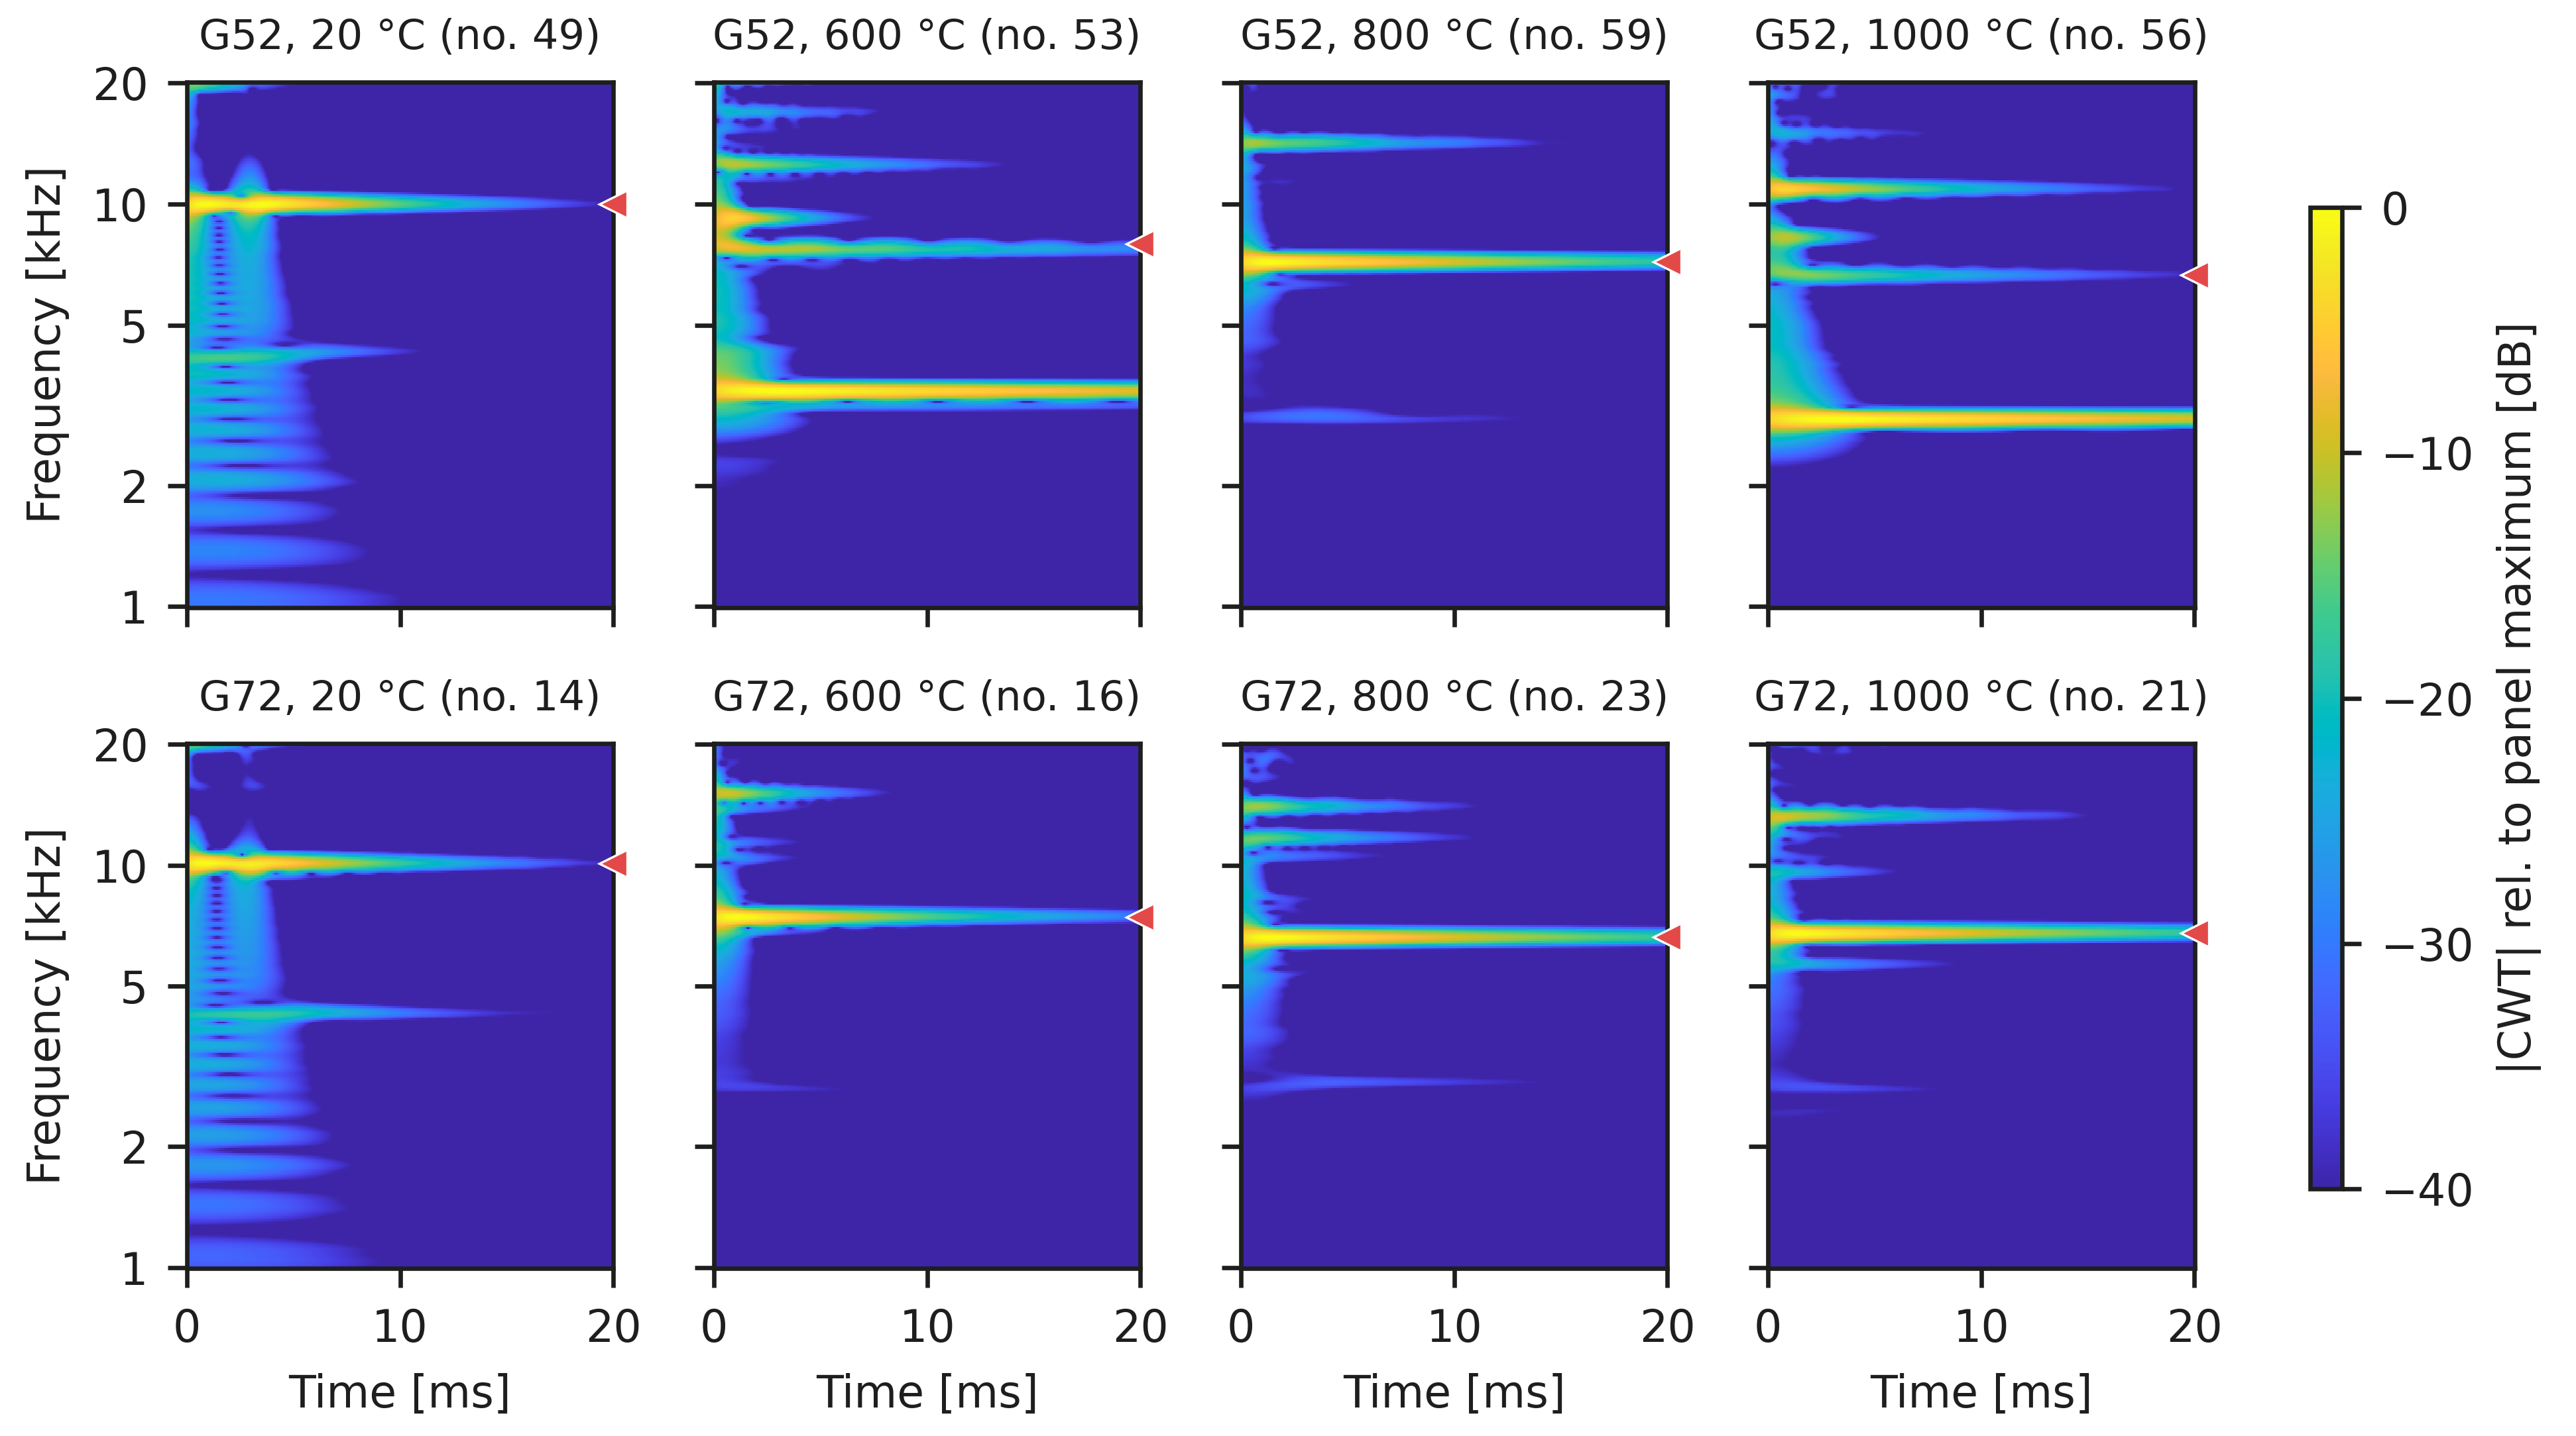
For a direct comparison of the effect of the exposure temperature, Figure 21 shows the scalograms of one representative specimen of G52 and G72 (the specimen with fL closest to the median of the set) at each exposure temperature. In the reference specimens, the energy is concentrated at fL (approximately 10 kHz), with a weaker component of the flexural mode at approximately 4.3 kHz that decays within about 5 ms. After thermal exposure, fL shifts to 6.6–8.0 kHz and the response of the G-500T specimens becomes multimodal: at 600 °C and 1000 °C, the strongest component is the flexural mode (3.4 and 2.9 kHz), and several components of comparable intensity appear in the band of fL. In G72, the longitudinal mode remains dominant at all temperatures and persists over the whole 20 ms window, with only weak additional components at higher frequencies. The presence of several competing modes in the degraded G-500T specimens explains why the dominant peaks in the spectra (Figure 15) do not follow a uniform trend with temperature: the highest peak does not always belong to the same vibration mode, and several peaks of comparable height may occur in the band of fL.
Figure 21.
Scalograms (fCWT, Morlet wavelet) of the longitudinal IE record of one representative specimen per exposure temperature: G52 (top) and G72 (bottom); color scale in dB relative to the maximum of each panel; dashed line—fL evaluated from the FFT.
The analysis using IE and interpretation using FFT and CWT proved the ability to identify materials with a less stable structure. Unlike in conventional tests, it was possible to evaluate the degree of defects and a general decrease of homogeneity using a non-destructive measurement. Although these defects did not directly affect the physical and mechanical properties of the tested materials in all cases, they may be the cause of future damage from the perspective of the lifespan of the fire-affected building structures (specifically their materials).
Cavities and other defects in the interfacial zone between the matrix and the filler (which are further analyzed by the CT method, see Section 3.3), may lead to the progression of defects, whether due to temperature shocks of transfers, or possibly due to the migration of humidity within the building structure (frost, extremely high temperature, etc.). The fact that the resonance frequency of the G7X set at 800 and 1000 °C temperatures were lower than in the case of the G5X set in this situation does not indicate worse overall properties.
It has been proven that the IE method enables quite reliable identification of a material that shows a lower spread of the individual values of the given parameter, which is essential. The reason is the fact that a material which handles higher (strength and thermal) stress but with greater variability of the monitored property (meaning a larger spread of values of the given parameter) may be less suitable in the end. This phenomenon may then appear more notably during synergetic stress, through multiple forms of negative effects of the environment (CO2, SO2, Cl−, frost, etc.).
These results and findings prove a high degree of correspondence between conventional methods (strength characteristics established through destructive methods) and the less frequently used technique of impact-echo (Figure 22).
Figure 22.
Pearson correlation matrix of the impact-echo resonance frequencies (fL, fF), dynamic modulus Ed and physical and mechanical parameters of individual specimens (all temperatures, 65–72 pairs per coefficient); values in bold are statistically significant (p < 0.05), values in grey are not.
The advantage of the IE technique lies in the discovery of structural diversity that may be caused by various aspects, although in the case of the research presented here, the changes of structure are related to thermal stress of lightweight polymer–cement materials.
To support the relationship between the IE results and the conventional tests by a quantitative analysis, Pearson correlation coefficients r were calculated at the level of individual specimens (Figure 22). The three specimens of each set measured by IE were subsequently tested destructively; therefore, the longitudinal (fL) and flexural (fF) resonance frequencies of each specimen could be paired with its bulk density ρ, mass change Δm and volume change ΔV after thermal exposure, flexural strength fcf and compressive strength fc. The matrix comprises 72 specimens; depending on the availability of the IE record and the destructive test, each coefficient is based on 65 to 72 pairs of values.
Both resonance frequencies correlate strongly with the residual mechanical properties: r = 0.88 for fL and fcf and r = 0.91 for fL and fc (0.89 and 0.91 for fF; all p < 0.001). Very strong correlations were also found between fL and the bulk density (r = 0.96) and the mass change (r = 0.98). In contrast, the fiber dosage does not correlate with any of the monitored parameters (|r| ≤ 0.13), i.e., within the studied range of 0.5–1.5 kg/m3 its effect is small compared with the effect of the exposure temperature.
Since all monitored parameters decrease with the exposure temperature (|r| ≥ 0.81 for T), part of these correlations reflects the common effect of temperature. The relationship was therefore also verified on the thermally exposed specimens only (600–1000 °C, n = 48), where fL still correlates with fcf (r = 0.85) and fc (r = 0.83; both p < 0.001), and within the individual temperature levels after subtracting the mean value of each level, where the correlation is weaker but statistically significant (r = 0.32, p = 0.010 for fcf; r = 0.28, p = 0.022 for fc). The IE resonance frequency thus reflects not only the temperature level but also differences in residual strength between specimens exposed to the same temperature.
3.3. CT Analysis
The identification of microcracks (including their characterization) is essential and beneficial, particularly in clarifying the behavior of the given material during specific conditions of exposure to various influences such as temperature changes and chemically aggressive environments, etc. Therefore, the focus of this study also led to computed tomography. This analytical method rather precisely enabled the exploration of the internal structure of both reference materials and those exposed to thermal stress, including the comparison of the effect of different properties of the fibers used, as well as their quantity.
The highest percentage of defects in the form of cracks was found in thermally stressed materials at temperatures of 800 and 1000 °C. It may be concluded that CT outputs correspond rather well with the results found using physical and chemical parameters, as well as the IE method. The following image (Figure 23a) shows a typical structure of G52 material exposed to the temperature of 800 °C. For clarity, an example of the 3D imaging of the test specimen using CT analysis is also included (see Figure 23b).
Figure 23.
CT image of G52, exposure 800 °C; typical structure. (a) a typical structure of G52 material exposed to the temperature of 800 °C; (b) an example of the 3D imaging of the test specimen using CT analysis.
Upon evaluation of the G52 structure (800 °C), it is apparent that there are not a high percentage of cracks (see representative typical structure in Figure 24a). A more detailed analysis of the structural defects that formed due to a temperature shock leads to the conclusion that cracks are randomly formed in the structure, while a higher percentage is notable in areas that mostly contain the matrix.
Figure 24.
CT image of sample: (a) G52 (exposure 800 °C, typical structure), (b) G52 (exposure 800 °C, detail of microcracks), (c) G52 (exposure 1000 °C, typical structure), (d) G52 (exposure 1000 °C, microcracks).
The cracks have a character of irregular curves that cut through both the matrix and the aggregate, thus not respecting their interface (see Figure 24b).
When compared to G52 material exposed to 800 °C and 1000 °C, it is evident that the mortar stressed by lower temperature contains fewer cracks, although in certain places these cracks are wider than in the case of G52 exposed to 1000 °C (see Figure 24c,d). Test specimens exposed to the temperature of 600 °C showed only trace amounts of cracking. These cracks could be characterized as very subtle in width and shorter length, forming an unconnected network of microcracks. With respect to the resolution capabilities of the CT equipment used, it may be assumed that the structure also contained microcracks of very small sizes that were not possible to reliably identify using this method.
Compared to G52, material G53 (for both its exposition temperatures) contains a higher percentage of cracks (see Figure 25). Also, the non-homogeneity of the structure was locally recorded, where it was apparent that mostly matrix is present in some parts, while in other parts smaller clusters of porous aggregate were identified. However, this only occurred to a local or unusual degree, as is apparent, for example, from the following image (see Figure 25a).
Figure 25.
CT image of sample: (a) G53 (exposure 800 °C, detail of typical structure and cracks), (b) G53 (exposure 800 °C, detail of cracks), (c) G53 (exposure 1000 °C, detail of typical structure and crack), (d) G53 (exposure 1000 °C, detail of cracks).
The character of defects is also apparent from the image. A crack (in the longitudinal direction of the test specimen) mostly enters the matrix and it may be concluded that it copies the area along the edge between the lightweight aggregate and the matrix (see Figure 25a). In the case of G53, this phenomenon was quite frequent, which is interesting, because in the case of G52 material (that is with a lower portion of distributed reinforcement) a rather different character of cracks and their location was identified.
The behavior of the G53 material from the perspective of the formation of cracks and their character could be described in the same way as G52—at the exposure to 800 °C, fewer cracks were formed, however, these were wider in their character. To the contrary, at 1000 °C exposure, denser networks of cracks with a smaller width and much less regular distribution were identified. They entered both the matrix and the lightweight aggregate without an apparent continuity (see Figure 25c,d).
The changes in the structure due to thermal stress were of a slightly different character in the case of sets G71 through G73 (for selected images see Figure 26 and Figure 27). This finding also corresponds with the established strength values (particularly flexural tensile strength), as well as the outputs of IE.
Figure 26.
CT image of sample: (a) G72 (exposure 800 °C, typical structure and detail of crack), (b) G72 (exposure 800 °C, detail of cracks), (c) G72 (exposure 1000 °C, typical structure with cracks), (d) G72 (exposure 1000 °C, detail of cracks).
Figure 27.
CT image of sample: (a) G73 (exposure 800 °C, typical structure and of cracks), (b) G73 (exposure 800 °C, detail of cracks), (c) G73 (exposure 1000 °C, detail of typical structure and cracks), (d) G73 (exposure 1000 °C, detail of cracks).
Upon comparison of the structural changes of sets G5X and G7X, it may be concluded that the degree of defects in the case of G7X is slightly higher, which corresponds with outputs from the physical and mechanical tests. Structural changes were most apparent in flexural strength values. As is apparent on the previous image, a notable visible crack enters both the matrix and the actual aggregate, including the interfacial zone of the aggregate and matrix (see Figure 26a). Microcracks in the structure in the area of porous aggregate grain are visible in the bottom left portion of the image. It is evident that a crack was formed in the matrix/aggregate interface and, in relation to this crack, also in its proximity in the matrix.
A particular network of small cracks located in the matrix was identified in G72 material exposed to the temperature shock of 800 °C (see Figure 26b). Therefore, it is evident that G72 material exposed to 800 °C contained more diverse types of structural defects, meaning more continuous cracks of larger width, as well as the network of random microcracks. This fact also corresponds with the identified levels of flexural strength where, in the case of G7X exposed to the temperature shock of 800 °C, the flexural strength values were only slightly higher than in test specimens exposed to 1000 °C (see Figure 18b). To the contrary, materials G5X shows a much steeper decrease of flexural strength values with increasing temperatures from 800 °C to 1000 °C.
The images (Figure 26c,d) depict typical examples of structure and its defects for G72 material exposed to the temperature of 1000 °C. The character of these defects (cracks) may be evaluated similarly to the case of the 800 °C exposure, with a slightly larger extent of the defects in the case of the material exposed to 1000 °C. Again, this confirms the notable decrease properties upon thermal stress of 800 °C, while further in the exposure of materials to 1000 °C there is a more gradual degradation of physical and mechanical properties (as is also confirmed by outputs from the IE method).
The last material analyzed was G73, which showed the highest extent of identified defects of all tested mortar types (see Figure 27). The following images depict both the typical structure of the stressed material and selected details of its typical defects. As is apparent from the detailed images, cracks form both on top of and further away from the surface of those tested specimens that were in direct contact with the environment and extreme temperature.
These cracks do not copy the interfacial edge between the matrix and the porous aggregate but cut through both the matrix and the filler in a certain direction, while in the case of a larger crack a single direction prevails. This is particularly apparent in the longitudinal profile of the test specimens when evaluating the structure.
Radial cracks around a grain of the porous aggregate are apparent in the upper right part of the image (see Figure 27b) and in the case of G73 material, these were possible to identify in a greater extent compared to the other materials.
No relations were found suggesting that the shape of the specimen would affect the course, size or number of cracks in various locations. Thus, it cannot be concluded that, for example, more cracks would form in the longitudinal or transverse direction, etc.
3.4. Microstructure—SEM
Microstructure analysis discovered that, according to the presumption and known physical and chemical changes, decomposition processes take place with increasing temperature, which shows through the degradation of microstructures. Given that the matrix and the aggregate were the same in the cases of all analyzed materials, causing identical decomposition processes of the individual components of the mortar, the main focus centered on the function of the distributed reinforcement.
First, the ability and degree of anchoring of the fibers within the matrix structure was monitored and additionally, the character of the individual channels forming during the decomposition of the waste cellulose-based reinforcement. The following images depict details of fibers anchored in the matrix of materials G53 and G73 (Figure 28).
Figure 28.
Microstructure of composite without thermal exposure; detail of fiber in polymer–cement matrix—(a) composite G53, mag. 2000×; (b) composite G73, mag. 2000×.
From the perspective of thermal exposure, greater attention was paid to those materials exposed to temperatures of 800 and 1000 °C, where the most significant structural changes of the polymer–cement materials occur.
The character of the interfacial zone between the porous aggregate and the matrix materials exposed to the temperature shock of 800 °C is apparent from the following image (see Figure 29a). Here, it is possible to identify a practically perfect connection of two phases without apparent flaws or defects.
Figure 29.
Microstructure of G53, exposure 800 °C: (a) interfacial transition zone between porous aggregate and polymer–cement matrix, mag. 2000×; (b) hollow after burnt fiber, mag. 5000×.
The next image shows the structure of a channel wall formed by the decomposition of the reinforcement fiber (see Figure 29b). Microscopic cracks with widths ranging between 0.5 and 1 µm were identified in the channel wall. The study of the effects that contribute to the formation of these cracks presents an interesting subject for further research, as this is a rather complicated topic.
There may be many aspects causing the formation of these microcracks, such as the actual method of production of these materials, the properties of the individual components, compatibility between the matrix and the fiber, the character of the surface of these fibers, the length of thicker structure of the fibers, and more. Clarification of the causes and formation of these microscopic-size cracks requires a specific approach and very detailed research of diverse internal and external factors.
By studying the detailed view of the structure of the channel formed by the decomposition of G-700 T fiber (see Figure 30), a conclusion may be reached that the wall appears very compact without apparent defects or anomalies.
Figure 30.
Microstructure of G72, exposure 800 °C: (a) hollow after burnt fiber, mag. 2000×; (b) detail of hollow surface, mag. 10,000×.
Only at the 10,000× magnification is it possible to discern a partly degraded structure of the polymer–cement matrix, where the decomposition of CH, CSH phases, partly of calcite, etc. took place.
The surface of the cavity left after the decomposed fiber in the G73 material exposed to 800 °C shows signs of defects (see Figure 31). However, rather than cracks, it is possible to observe hollows that could have been formed either during the production of test specimens or subsequently and partly by the decomposition of the polymer–cement matrix. However, these hollows are only apparent in very detailed magnification. Another reason for their formation could be an imperfect structure of the given fiber that does not enable smooth adhesion of the matrix to its surface.
Figure 31.
Microstructure of G73, exposure 800 °C: (a) hollow after burnt fiber, mag. 2000×; (b) detail of hollow surface, mag. 10,000×.
The structure of materials exposed to 1000 °C shows a higher percentage of microscopic defects (see Figure 32, Figure 33 and Figure 34). Despite these defects, the interfacial zone between the matrix and the aggregate appears in the majority of cases to be perfectly homogenous. The hollows or channels left behind the decomposed fibers appear to be notably porous, just as in the remaining part of the matrix, which is mostly related to the decomposition processes that took place in the matrix (CSH, CH phases, calcite, etc.; see Figure 33 and Figure 34).
Figure 32.
Microstructure of G71, exposure 1000 °C: (a) crack in the polymer–cement matrix, mag. 500×; (b) hollow after burnt fiber, mag. 500×.
Figure 33.
Microstructure of G72, exposure 1000 °C: (a) hollow after burnt fiber, mag. 2000×; (b) detail of hollow surface, mag. 10,000×.
Figure 34.
Microstructure of G73, exposure 1000 °C: (a) hollow after burnt fiber, mag. 2000×; (b) detail of hollow surface, mag. 5000×.
4. Conclusions
The research presented focused on analyzing a developed lightweight polymer–cement repair mortar intended for the rehabilitation of reinforced concrete structures exposed to extreme temperatures. The mortar contained a blended cement matrix with blast furnace slag and silica fume, lightweight (expanded clay) aggregate, a polymer modifier and fibers made from waste cellulose. In addition to high-temperature resistance, the design of the material also took into account the aspect of sustainability through the use of alternative raw materials. In this first stage, only basic physical and mechanical parameters of the mortar supported by IE, CT and SEM were analyzed.
Experimental results confirmed that exposure to temperatures of 600, 800 and 1000 °C led to a gradual degradation of all the properties under investigation. The strength characteristics were reduced by approximately 62 to 67% following exposure to a temperature of 1000 °C. The type and dosage of waste cellulose-based fibers had a significant influence on the behavior of the developed mortars under thermal stress. In view of the properties achieved, G-500T fibers at a dosage of 1.0 kg/m3 appear to be optimal. By contrast, the highest fiber content (1.5 kg/m3) resulted in greater structural heterogeneity and a wider range of cracks, as confirmed by a combination of IE and CT methods.
The combination of IE and CT has proved to be a highly effective tool for identifying temperature-induced structural changes in lightweight polymer–cement mortars exposed to extreme temperatures. The longitudinal resonance frequency decreased by 26–37% after exposure to 800 °C in all mixtures, reflecting the progressive degradation of the material’s structure; between 800 and 1000 °C, the dynamic modulus of the G-700T mixtures remained stable or slightly increased (−2 to +5%), which is attributed to the onset of sintering, while that of G51 and G52 continued to decrease. At the specimen level, the longitudinal resonance frequency correlated strongly with the residual flexural and compressive strengths (Pearson r = 0.88 and 0.91), and the correlation remained significant also between specimens exposed to the same temperature. At the same time, the considerably lower scatter of fL within the sets (median coefficient of variation 1.3%, compared with 12.3% for the flexural and 5.0% for the compressive strength) confirms the suitability of this method for the reliable assessment of fire-damaged cement composites. CT provided significant additional information on the development of internal damage and confirmed the formation of microcracks and crack networks as the temperature rose. Observations using SEM further demonstrated that the decomposition of waste cellulose fibers creates a system of channels that allows gaseous decomposition products to escape and limits the build-up of internal pressures during heating. Simultaneously, it was found that the ITZ between the lightweight aggregate and the polymer–cement matrix remained compact in most cases, even after exposure to high temperatures.
The results of the research presented confirm that the combination of a slag-modified polymer–cement matrix, lightweight aggregate and waste cellulose fibers represents a promising solution for the development of repair mortars with enhanced fire resistance. The high potential of the combination of IE and CT as complementary non-destructive techniques for the assessment of cementitious composites damaged by high temperatures has also been confirmed.
Future research should focus on evaluating materials that have been significantly modified using alternative raw materials. One option is the complete replacement of lightweight aggregate with agloporite (an aggregate based on sintered fly ash), the properties and behavior of which are described by Černý et al. [47,48]. Alternatively, the use of a more significantly modified blended cement could be considered. An interesting option is use of fly ash contaminated by denitrification process as analyzed by Hodul et al. [61] in polymer repair products. The next stage of future research will also aim to assess all essential parameters (at laboratory conditions and after high-temperature exposure), especially bond strength, where the mortar is applied on concrete substrate, as presents among others Melichar et al. [3]. This is a very important parameter, because the behavior of the mortar applied to the cement substrate will be significantly different and more representative of its behavior when applied to real buildings. From the perspective of follow-up research, it is also essential to verify long-term durability, i.e., following the synergistic effects of extreme temperatures and adverse environmental influences (CO2, SO2, frost, Cl ions, etc.).
Author Contributions
Conceptualization, T.M., R.D. (Richard Dvořák) and J.B.; methodology, T.M. and R.D. (Richard Dvořák); validation, J.B., R.D. (Rostislav Drochytka), J.Z., T.M. and R.D. (Richard Dvořák); formal analysis, T.M., R.D. (Rostislav Drochytka) and V.Č.; investigation, T.M., R.D. (Richard Dvořák), A.P., J.M. and V.Č.; resources, T.M. and R.D. (Richard Dvořák); data curation, R.D. (Richard Dvořák), J.Z. and J.B.; writing—original draft preparation, T.M. and R.D. (Richard Dvořák); writing—review and editing, T.M., R.D. (Richard Dvořák), R.D. (Rostislav Drochytka), J.M. and J.Z.; visualization, T.M. and R.D. (Richard Dvořák); supervision, J.B., R.D. (Rostislav Drochytka), J.Z., V.Č. and T.M.; project administration, J.Z. and J.B.; funding acquisition, J.Z., R.D. (Rostislav Drochytka) and T.M. All authors have read and agreed to the published version of the manuscript.
Funding
Research presented in the article was supported by the Ministry of Education, Youth and Sports of the Czech Republic under the specific higher education research of Brno University of Technology, project FAST-S-26-8986 “Advanced building materials with reduced environmental impact and greenhouse emissions”.
Data Availability Statement
The datasets used and/or analyzed during the current study are available from the corresponding author on reasonable request.
Acknowledgments
All tests and analyses were carried out at Brno University of Technology, Faculty of Civil Engineering, Institute of Technology of Building Materials and AdMaS Centre (Czech Republic) and The Vilnius Gediminas Technical University, Faculty of Civil Engineering (Lithuania).
Conflicts of Interest
The authors declare no conflicts of interest.
References
- Xi, B.P.; Wu, Y.C.; Chen, L.H.; Guo, Q.H.; Zhu, H.H. Study on the Temperature Distribution and Thermal Damage of Concrete Lining in the Maximum Temperature Section of Tunnel Under Fire Condition. In Proceedings of the Geoshanghai 2018 International Conference: Tunnelling and Underground Construction; Springer: Singapore, 2018; pp. 612–624. [Google Scholar]
- Krzemień, K.; Hager, I. Post-fire assessment of mechanical properties of concrete with the use of the impact-echo method. Constr. Build. Mater. 2015, 96, 155–163. [Google Scholar] [CrossRef] [Scilit]
- Melichar, T.; Bydzovsky, J.; Dufka, A. Composites Based on Alternative Raw Materials at High Temperature Conditions. Period Polytech.-Civ. 2017, 61, 911–919. [Google Scholar]
- Aydin, S. Development of a high-temperature-resistant mortar by using slag and pumice. Fire Saf. J. 2008, 43, 610–617. [Google Scholar] [CrossRef] [Scilit]
- Anand, N.; Thanaraj, D.P.; Andrushia, D.; Lublóy, E.E.; Kiran, T.; Kanagaraj, B.; Kodur, V. Microstructure investigation, strength assessment, and thermal modelling of concrete exposed to different heating cooling regimes. J. Therm. Anal. Calorim. 2023, 148, 3221–3247. [Google Scholar] [CrossRef] [Scilit]
- Melichar, T.; Bydzovsky, J.; Dufka, A. Durability of Materials Based on a Polymer-Silicate Matrix and a Lightweight Aggregate Exposed to Aggressive Influences Combined with High Temperatures. Mater. Tehnol. 2017, 51, 751–758. [Google Scholar] [CrossRef] [Scilit]
- Melichar, T.; Dufka, A.; Bydzovsky, J. Changes in the Composite Structure and Parameters after an Exposure to a Synergic Action of Various Extreme Conditions. Mater. Tehnol. 2017, 51, 243–249. [Google Scholar] [CrossRef] [Scilit]
- Donatello, S.; Kuenzel, C.; Palomo, A.; Fernández-Jiménez, A. High temperature resistance of a very high volume fly ash cement paste. Cem. Concr. Comp. 2014, 45, 234–242. [Google Scholar] [CrossRef] [Scilit]
- Hossain, K.M.A. High strength blended cement concrete incorporating volcanic ash: Performance at high temperatures. Cem. Concr. Comp. 2006, 28, 535–545. [Google Scholar] [CrossRef] [Scilit]
- Melichar, T.; Bydzovsky, J. Study of the parameters of lightweight polymer-cement repair mortars exposed to high temperatures. Appl. Mech. Mater. 2013, 395–396, 429–432. [Google Scholar] [CrossRef] [Scilit]
- Rodriguez, E.T.; Garbev, K.; Merz, D.; Black, L.; Richardson, I.G. Thermal stability of C-S-H phases and applicability of Richardson and Groves’ and Richardson C-(A)-S-H(I)models to synthetic C-S-H. Cem. Concr. Res. 2017, 93, 45–56. [Google Scholar] [CrossRef] [Scilit]
- Abaeian, R.; Behbahani, H.P.; Moslem, S.J. Effects of high temperatures on mechanical behavior of high strength concrete reinforced with high performance synthetic macro polypropylene (HPP) fibres. Constr. Build. Mater. 2018, 165, 631–638. [Google Scholar] [CrossRef] [Scilit]
- Ezziane, M.; Kadri, T.; Molez, L.; Jauberthie, R.; Belhacen, A. High temperature behaviour of polypropylene fibres reinforced mortars. Fire Saf. J. 2015, 71, 324–331. [Google Scholar] [CrossRef] [Scilit]
- Sahmaran, M.; Özbay, E.; Yücel, H.E.; Lachemi, M.; Li, V.C. Effect of Fly Ash and PVA Fiber on Microstructural Damage and Residual Properties of Engineered Cementitious Composites Exposed to High Temperatures. J. Mater. Civ. Eng. 2011, 23, 1735–1745. [Google Scholar] [CrossRef] [Scilit]
- Xargay, H.; Folino, P.; Sambataro, L.; Etse, G. Temperature effects on failure behavior of self-compacting high strength plain and fiber reinforced concrete. Constr. Build. Mater. 2018, 165, 723–734. [Google Scholar] [CrossRef] [Scilit]
- Bubeník, J.; Zach, J.; Krízová, K.; Novák, V.; Sedlmajer, M.; Zizková, N. Behavior and properties of ultra-lightweight concrete with foamed glass aggregate and cellulose fibres under high temperature loading. J. Build. Eng. 2023, 72, 106677. [Google Scholar] [CrossRef] [Scilit]
- Krízová, K.; Baránek, S.; Bubeník, J.; Mazán, T. Study of the behaviour of recycled and traditional fibres in cement composite at extreme temperatures. J. Build. Eng. 2024, 95, 110134. [Google Scholar] [CrossRef] [Scilit]
- Chobola, Z.; Stefková, D.; Samárková, K. The Use of Acoustic Methods for Non-destructive Testing of High-temperature-degraded Cement-based Composite. Adv. Res. Mater. Sci. Mech. Eng. 2014, 446–447, 1395–1399. [Google Scholar] [CrossRef] [Scilit]
- Tupy, M.; Sotiriadis, K.; Kusák, I.; Stefková, D.; Lunák, M.; Petránek, V. Exposure of Mortars Modified with Rubber Aggregates and Polymer Admixtures to Acid Environments and Elevated Temperature Conditions. J. Mater. Civ. Eng. 2016, 28. [Google Scholar] [CrossRef] [Scilit]
- Zhang, J.K.; Yan, W.Z.; Cui, D.M. Concrete Condition Assessment Using Impact-Echo Method and Extreme Learning Machines. Sensors 2016, 16, 447. [Google Scholar] [CrossRef] [Scilit]
- ASTM C1383-15; Standard Test Method for Measuring the P-Wave Speed and the Thickness of Concrete Plates Using the Impact-Echo Method. ASTM International: West Conshohocken, PA, USA, 2015.
- Mazzeo, B.A.; Patil, A.N.; Guthrie, W.S. Acoustic impact-echo investigation of concrete delaminations using liquid droplet excitation. Ndt&E Int. 2012, 51, 41–44. [Google Scholar] [CrossRef] [Scilit]
- Kang, J.M.; Song, S.; Park, D.; Choi, C. Detection of cavities around concrete sewage pipelines using impact-echo method. Tunn. Undergr. Sp. Tech 2017, 65, 1–11. [Google Scholar] [CrossRef] [Scilit]
- Hsieh, C.T.; Lin, Y.C. Detecting debonding flaws at the epoxy concrete interfaces in near surface mounted CFRP strengthening beams using the impact echo method. Ndt&E Int. 2016, 83, 1–13. [Google Scholar] [CrossRef] [Scilit]
- Stefková, D.; Tupy, M.; Sotiriadis, K.; Samárková, K.; Chobola, Z. High-temperature Degradation of Mortar Containing Rubber Aggregates and EVA Binder Evaluated by Impact-echo Method. Adv. Dev. Ind. Appl. Mech. 2014, 627, 272–275. [Google Scholar] [CrossRef] [Scilit]
- Yang, H.C.; Lin, Y.C. A simplified procedure for evaluation of damage-depth in concrete exposed to high temperature using the impact-echo method. Ndt&E Int. 2025, 149, 103270. [Google Scholar] [CrossRef] [Scilit]
- Liu, Y.L.; Xu, H.B.; Ma, X.X.; Wang, D.H.; Huang, X. Study on Impact-Echo Response of Concrete Column near the Edge. Appl. Sci. 2023, 13, 5590. [Google Scholar] [CrossRef] [Scilit]
- Takahashi, H. Synchrotron X-ray CT observation of crack path selection in mortar exposed to elevated temperatures: Effect of aggregate mineralogy. Results Eng. 2026, 32, 112053. [Google Scholar] [CrossRef] [Scilit]
- Li, G.; Li, W.Q.; Zhang, J.C.; Dong, P.; Gao, Y.; Xie, F.; Hong, S.X.; Dong, B.Q.; Zheng, Y. Estimating the hydration degree of cement paste using micro X-ray computed tomography (X-ray μCT). J. Build. Eng. 2025, 114, 114310. [Google Scholar] [CrossRef] [Scilit]
- Hedjazi, L.; Stephant, N.; Guessasma, S. On the characterization of microstructural characteristics and mechanical behaviour of mortar modified by flax fibre residues. Constr. Build. Mater. 2025, 458, 139618. [Google Scholar] [CrossRef] [Scilit]
- Mishra, A.; Carrara, P.; Griffa, M.; De Lorenzis, L. Fracture in concrete: X-ray tomography with in-situ testing, digital volume correlation and phase-field modeling. Cem. Concr. Res. 2026, 199, 108012. [Google Scholar] [CrossRef] [Scilit]
- Zhang, D.; Zhang, Y.; Dasari, A.; Tan, K.H.; Weng, Y.W. Effect of spatial distribution of polymer fibers on preventing spalling of UHPC at high temperatures. Cem. Concr. Res. 2021, 140, 106281. [Google Scholar] [CrossRef] [Scilit]
- Ríos, J.D.; Cifuentes, H.; Leiva, C.; Seitl, S. Analysis of the mechanical and fracture behavior of heated ultra-high-performance fiber-reinforced concrete by X-ray computed tomography. Cem. Concr. Res. 2019, 119, 77–88. [Google Scholar] [CrossRef] [Scilit]
- Zhang, D.; Tan, K.H.; Dasari, A.; Weng, Y.W. Effect of natural fibers on thermal spalling resistance of ultra-high performance concrete. Cem. Concr. Comp. 2020, 109, 103512. [Google Scholar] [CrossRef] [Scilit]
- Lv, Y.J.; Liu, J.Z.; Yang, H.; Zuo, L.G.; Lu, P.; Jin, W.Z. Investigation on the high-temperature thermal damage mechanism of hybrid steel-polypropylene fiber reinforced UHPC using X-ray computed tomography. Dev. Built Environ. 2026, 26, 100939. [Google Scholar] [CrossRef] [Scilit]
- Guan, Z.Z.; Guo, S.B.; Wang, S.F.; Sun, G.W.; Yang, Y.M.; Song, L.L.; Zhang, Y. Insights into damage behavior and microscopic deterioration mechanism of mortar under high temperature based on 4D X-ray CT. Constr. Build. Mater. 2025, 502, 144336. [Google Scholar] [CrossRef] [Scilit]
- Kim, K.Y.; Yun, T.S.; Park, K.P. Evaluation of pore structures and cracking in cement paste exposed to elevated temperatures by X-ray computed tomography. Cem. Concr. Res. 2013, 50, 34–40. [Google Scholar] [CrossRef] [Scilit]
- Sikora, P.; Abd Elrahman, M.; Chung, S.Y.; Cendrowski, K.; Mijowska, E.; Stephan, D. Mechanical and microstructural properties of cement pastes containing carbon nanotubes and carbon nanotube-silica core-shell structures, exposed to elevated temperature. Cem. Concr. Comp. 2019, 95, 193–204. [Google Scholar] [CrossRef] [Scilit]
- Wang, H.Y. The effects of elevated temperature on cement paste containing GGBFS. Cem. Concr. Comp. 2008, 30, 992–999. [Google Scholar] [CrossRef] [Scilit]
- Assaad, J.J. Development and use of polymer-modified cement for adhesive and repair applications. Constr. Build. Mater. 2018, 163, 139–148. [Google Scholar] [CrossRef] [Scilit]
- Issa, C.A.; Assaad, J.J. Stability and bond properties of polymer-modified self-consolidating concrete for repair applications. Mater. Struct. 2017, 50, 1. [Google Scholar] [CrossRef] [Scilit]
- Heikal, M.; El-Didamony, H.; Sokkary, T.M.; Ahmed, I.A. Behavior of composite cement pastes containing microsilica and fly ash at elevated temperature. Constr. Build. Mater. 2013, 38, 1180–1190. [Google Scholar] [CrossRef] [Scilit]
- Koksal, F.; Gencel, O.; Kaya, M. Combined effect of silica fume and expanded vermiculite on properties of lightweight mortars at ambient and elevated temperatures. Constr. Build. Mater. 2015, 88, 175–187. [Google Scholar] [CrossRef] [Scilit]
- Won, J.P.; Kang, H.B.; Lee, S.J.; Lee, S.W.; Kang, J.W. Thermal characteristics of high-strength polymer-cement composites with lightweight aggregates and polypropylene fiber. Constr. Build. Mater. 2011, 25, 3810–3819. [Google Scholar] [CrossRef] [Scilit]
- Ma, Q.M.; Guo, R.X.; Zhao, Z.M.; Lin, Z.W.; He, K.C. Mechanical properties of concrete at high temperature-A review. Constr. Build. Mater. 2015, 93, 371–383. [Google Scholar] [CrossRef] [Scilit]
- Schneider, U. Concrete at High-Temperatures—A General-Review. Fire Saf. J. 1988, 13, 55–68. [Google Scholar]
- Cerny, V. Quality of the Structure of Ash Bodies Based on Different Types of Ash. Mater. Tehnol. 2015, 49, 601–605. [Google Scholar] [CrossRef] [Scilit]
- Cerny, V.; Keprdova, S. Usability of fly ashes from Czech Republic for sintered artificial aggregate. Adv. Mater. Res. 2014, 887–888, 805–808. [Google Scholar] [CrossRef] [Scilit]
- Gupta, T.; Siddique, S.; Sharma, R.K.; Chaudhary, S. Effect of elevated temperature and cooling regimes on mechanical and durability properties of concrete containing waste rubber fiber. Constr. Build. Mater. 2017, 137, 35–45. [Google Scholar] [CrossRef] [Scilit]
- Figueiredo, F.P.; Shah, A.H.; Huang, S.S.; Angelakopoulos, H.; Pilakoutas, K.; Burgess, I. Fire Protection of Concrete Tunnel Linings with Waste Tyre Fibres. Procedia Eng. 2017, 210, 472–478. [Google Scholar] [CrossRef] [Scilit]
- Huang, Z.Y.; Liew, J.Y.R.; Li, W. Evaluation of compressive behavior of ultra-lightweight cement composite after elevated temperature exposure. Constr. Build. Mater. 2017, 148, 579–589. [Google Scholar] [CrossRef] [Scilit]
- EN 12190; Products and Systems for the Protection and Repair of Concrete Structures—Test Methods—Determination of Compressive Strength of Repair Mortar. The European Committee for Standardization, CEN: Brussels, Belgium, 1999.
- Pazdera, L.; Topolar, L.; Mikulasek, K.; Smutny, J.; Hodulakova, M.; Chobola, Z.; Seelman, H. Flexure response of thermal loaded concrete specimens by acoustic emission method. Matec Web Conf. 2017, 107, 00040. [Google Scholar] [CrossRef] [Scilit]
- Sansalone, M.; Lin, J.M.; Streett, W.B. A procedure for determining P-wave speed in concrete for use in impact-echo testing using a P-wave speed measurement technique. Aci Mater. J. 1997, 94, 531–539. [Google Scholar] [CrossRef] [Scilit]
- Carino, N.J. The Impact-Echo Method: An Overview. In Proceedings of the Structures 2001: A Structural Engineering Odyssey (2001 Structures Congress & Exposition); American Society of Civil Engineers: Reston, VA, USA, 2001; pp. 1–18. [Google Scholar]
- Malhotra, V.M.; Carino, N.J. Handbook on Nondestructive Testing of Concrete, 2nd ed.; CRC Press: Boca Raton, FL, USA, 2003. [Google Scholar]
- Epasto, G.; Proverbio, E.; Venturi, V. Evaluation of fire-damaged concrete using impact-echo method. Mater. Struct. 2010, 43, 235–245. [Google Scholar] [CrossRef] [Scilit]
- Arts, L.; van den Broek, E. The fast continuous wavelet transformation (fCWT) for real-time, high-quality, noise-resistant time–frequency analysis. Nat. Comput Sci. 2022, 2, 47–58. [Google Scholar] [CrossRef] [Scilit]
- EN 196-1; Methods of Testing Cement—Part 1: Determination of Strength. The European Commitee for Standardization,CEN: Brussels, Belgium, 2016.
- Shen, D.; Fang, M.; Chow, C.W.K. A review on ignition of cellulose materials under external heat flux. Int. J. Eng. Perform.-Based Fire Codes 2006, 8, 28–42. [Google Scholar]
- Hodul, J.; Mészárosová, L.; Drochytka, R.; Struhárová, A. Polymer repair products containing fly ash contaminated by denitrification process. Constr. Build. Mater. 2021, 267, 120641. [Google Scholar] [CrossRef] [Scilit]
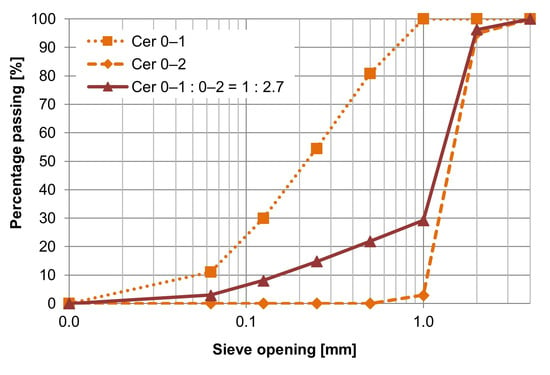
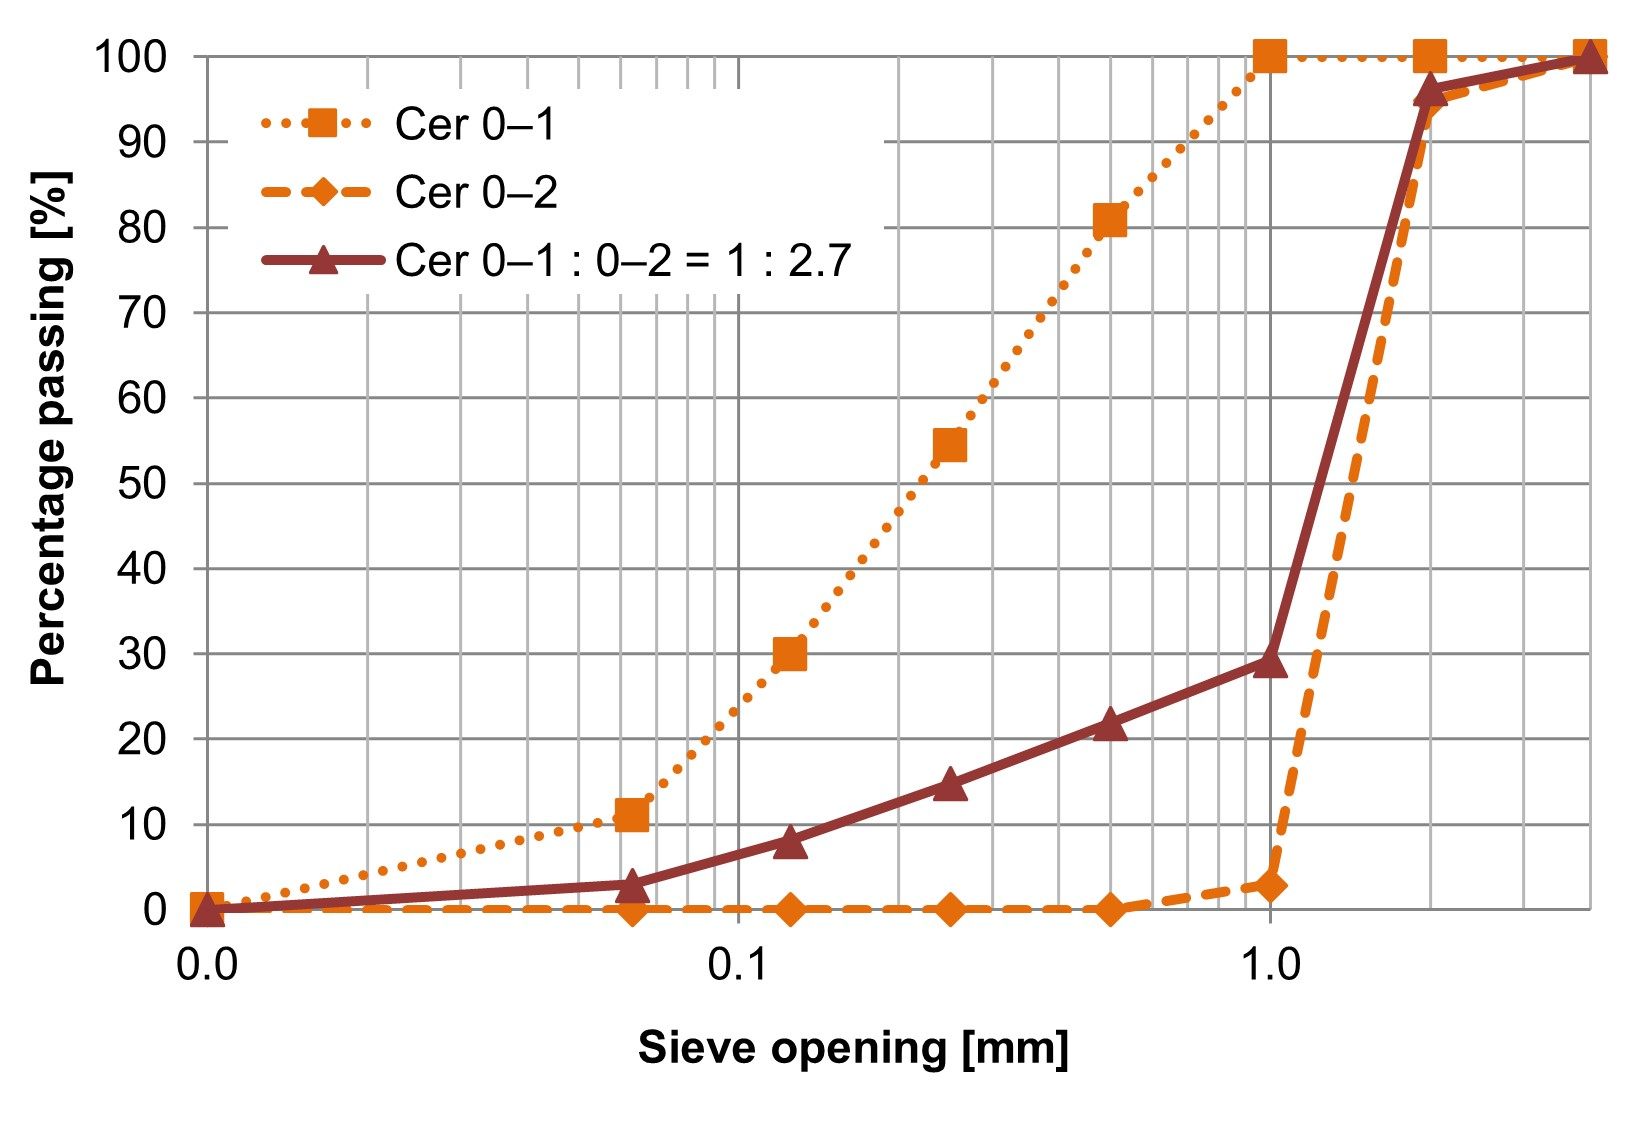
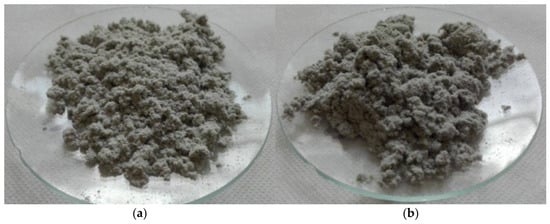
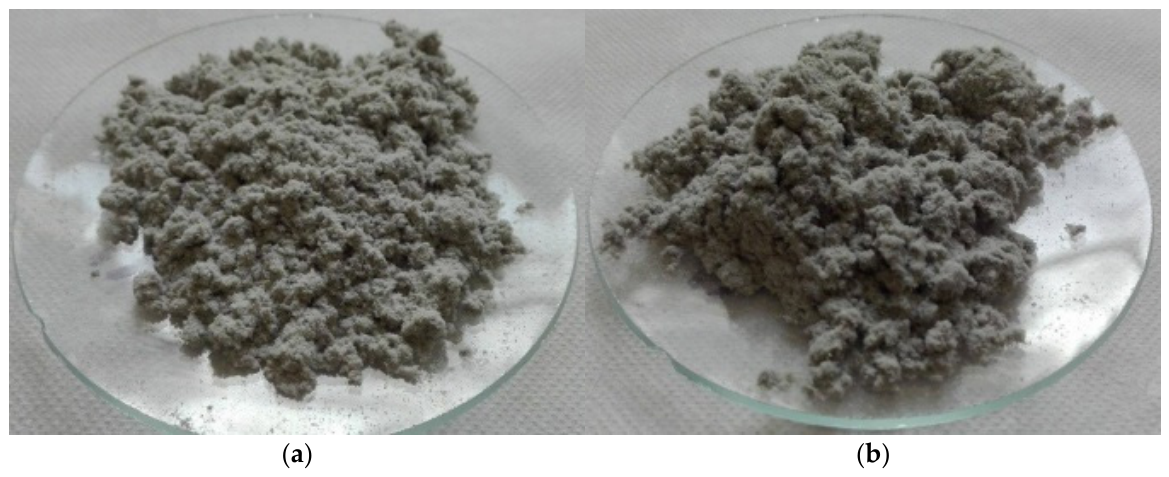
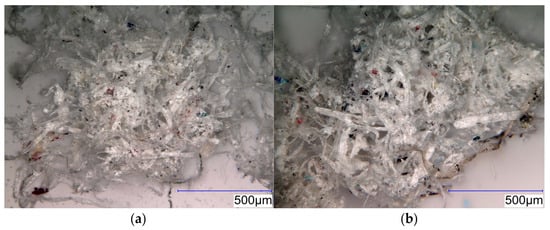
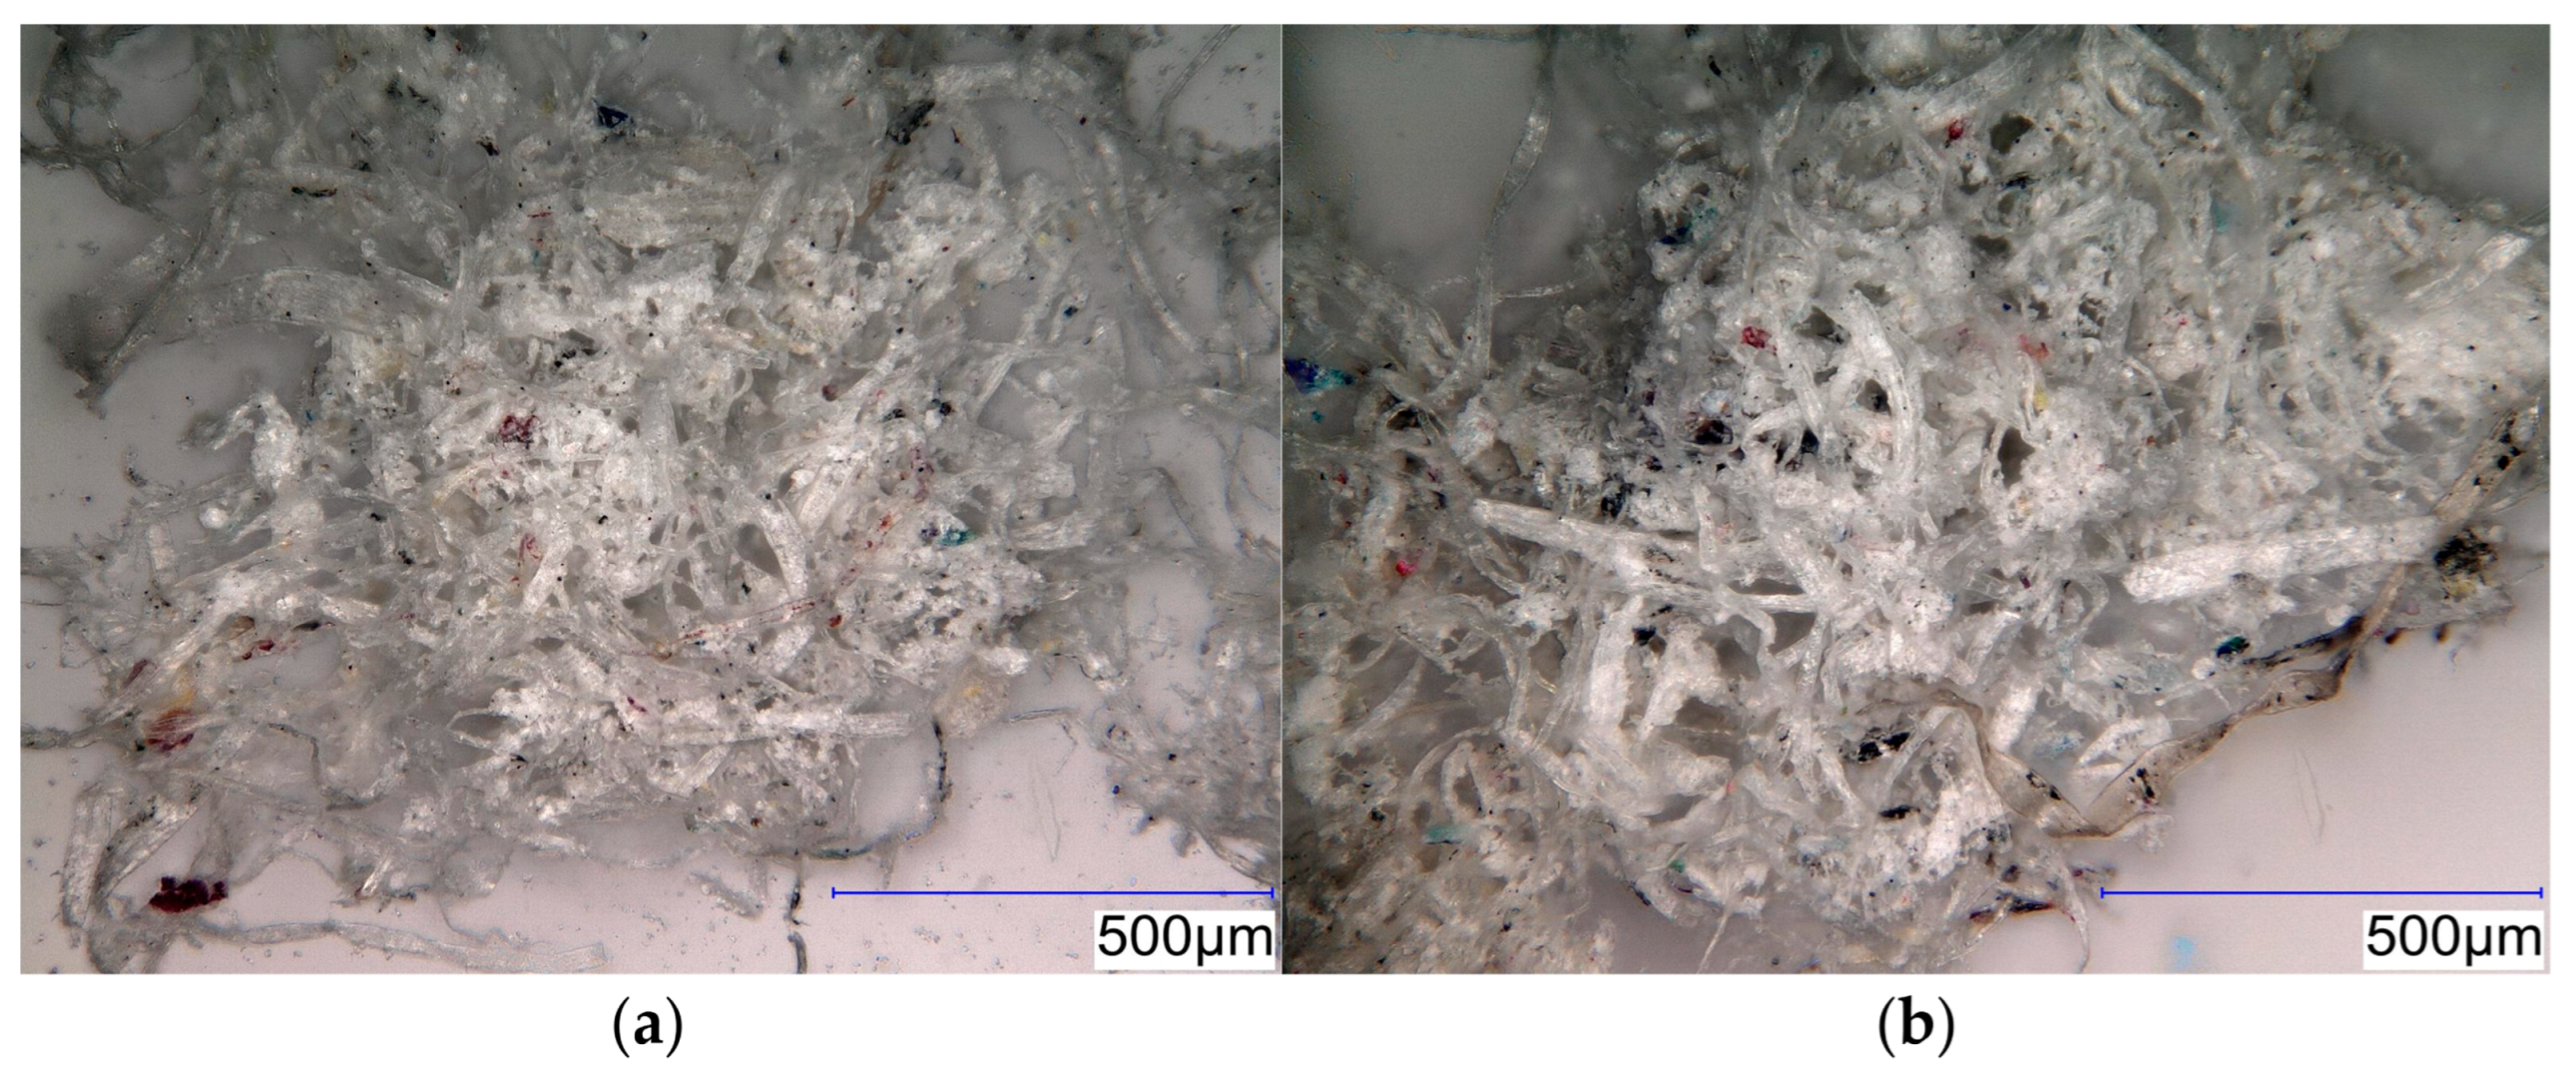
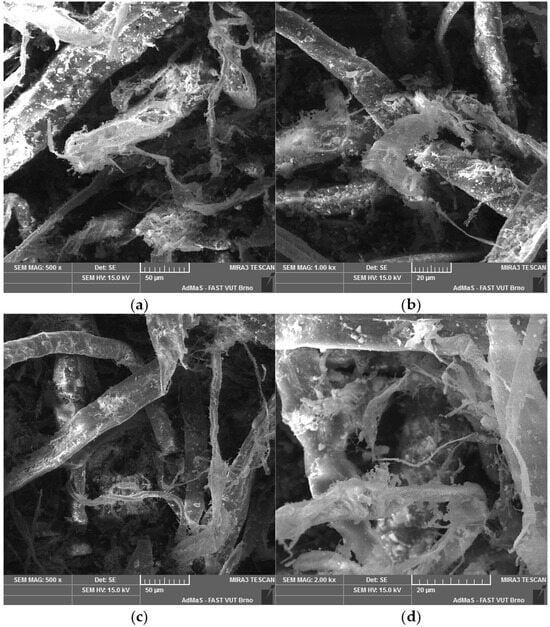
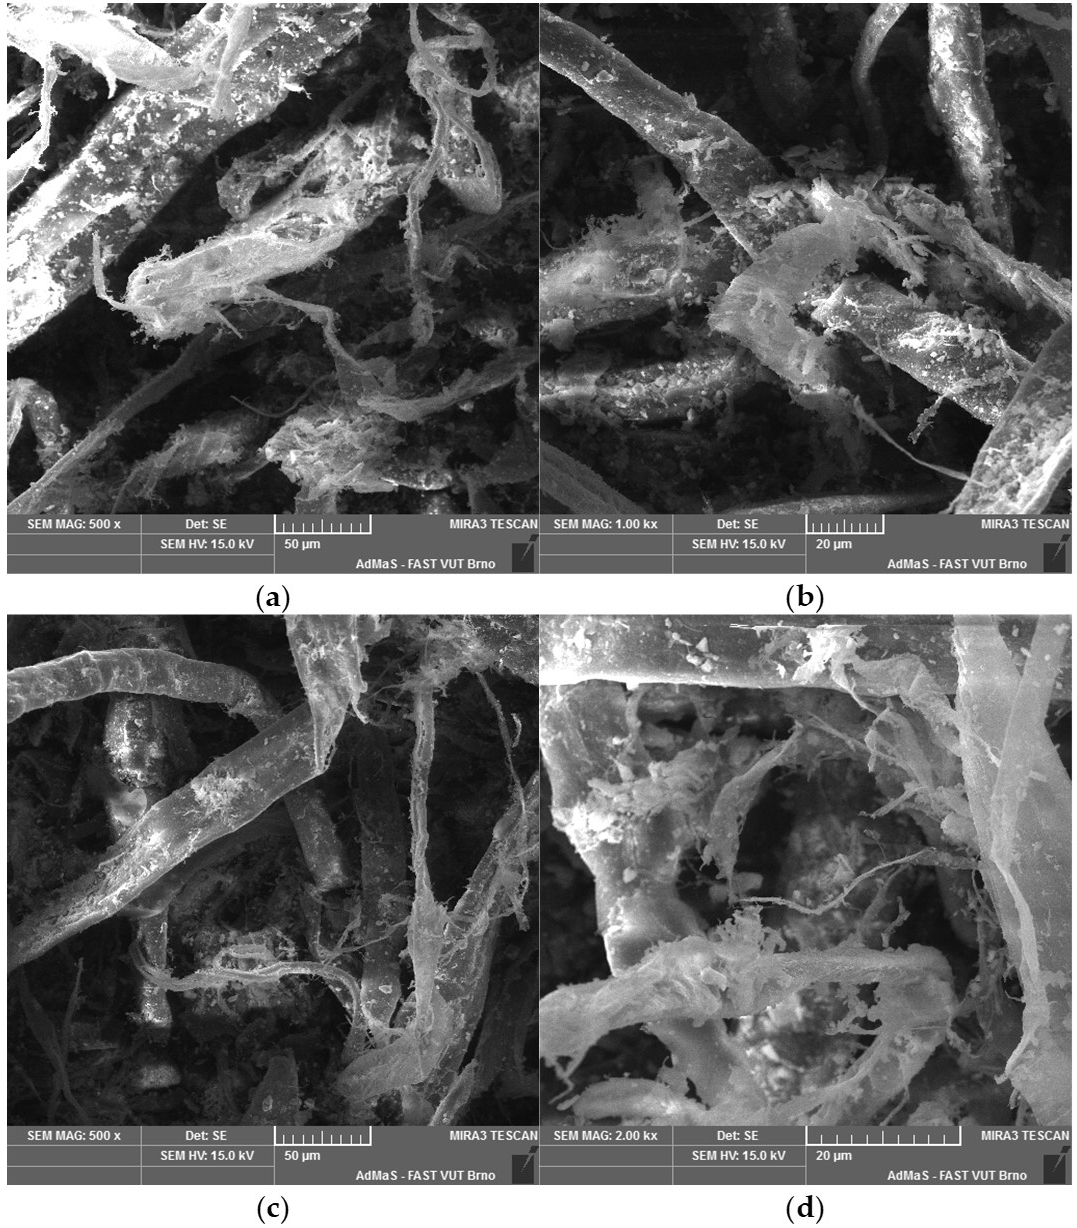
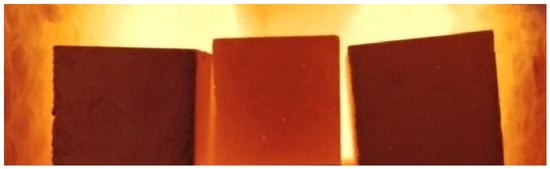
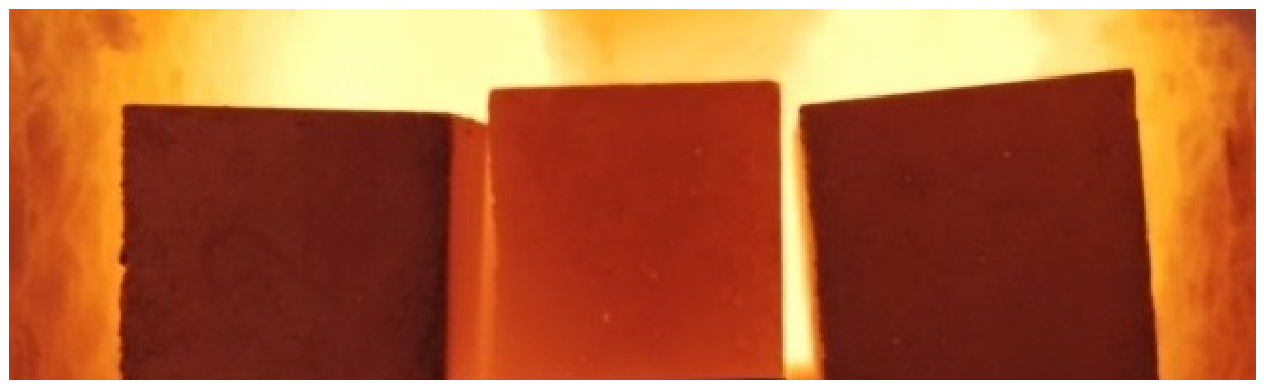
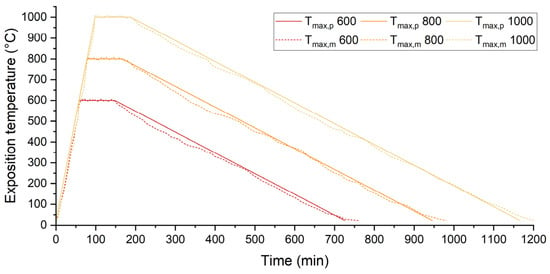
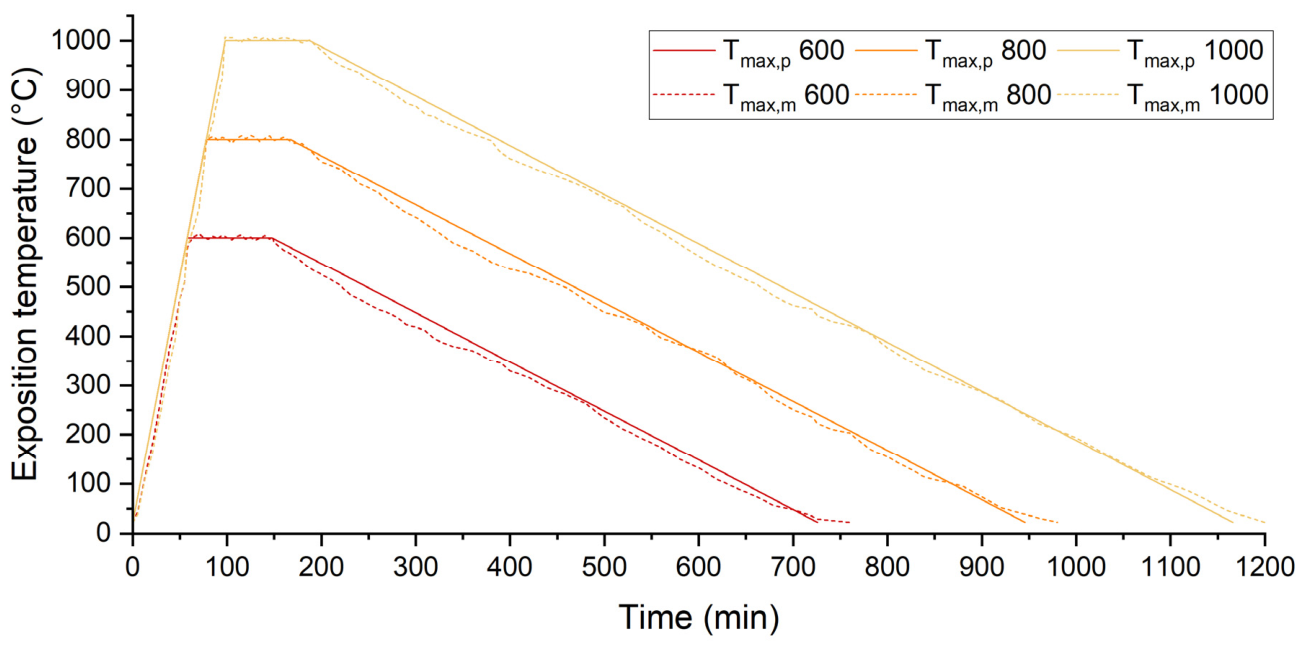
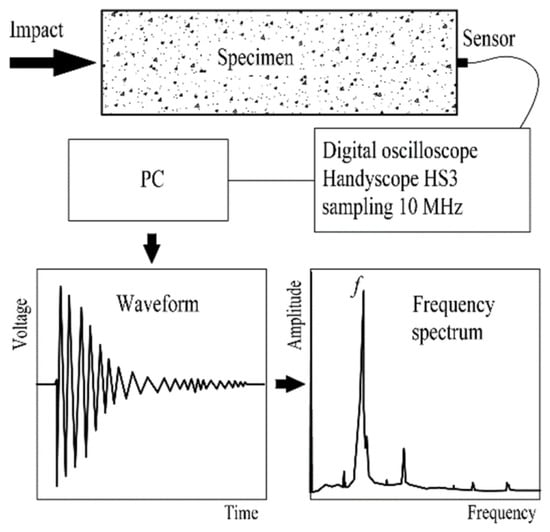
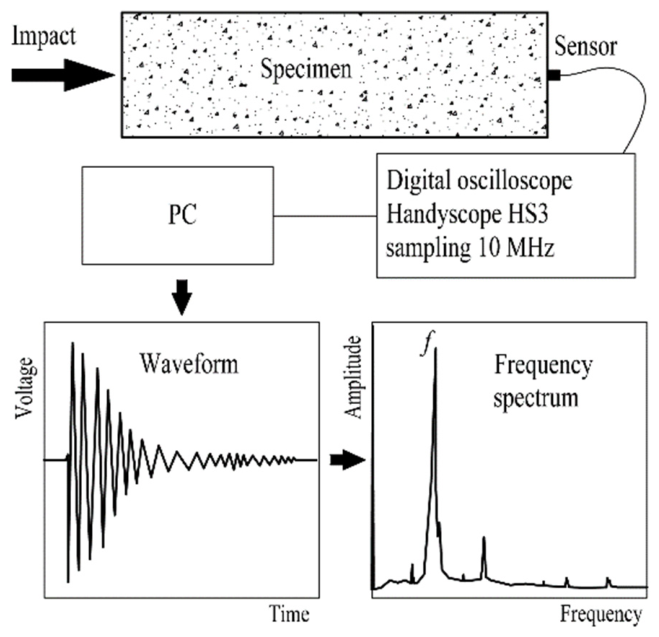
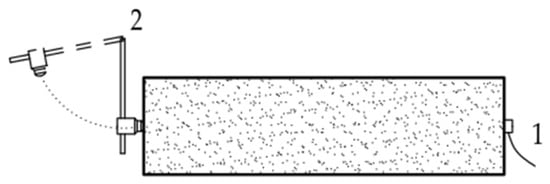
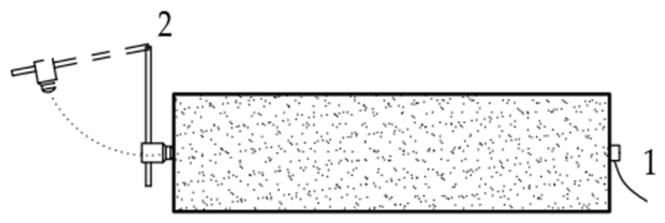
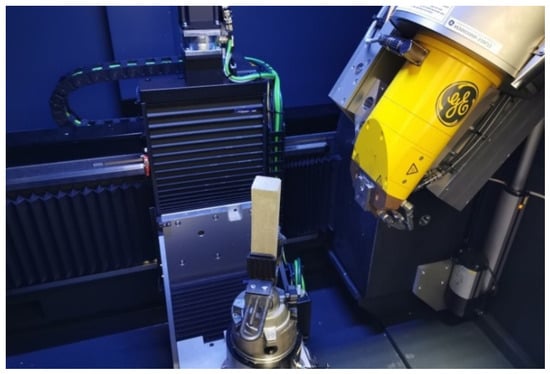
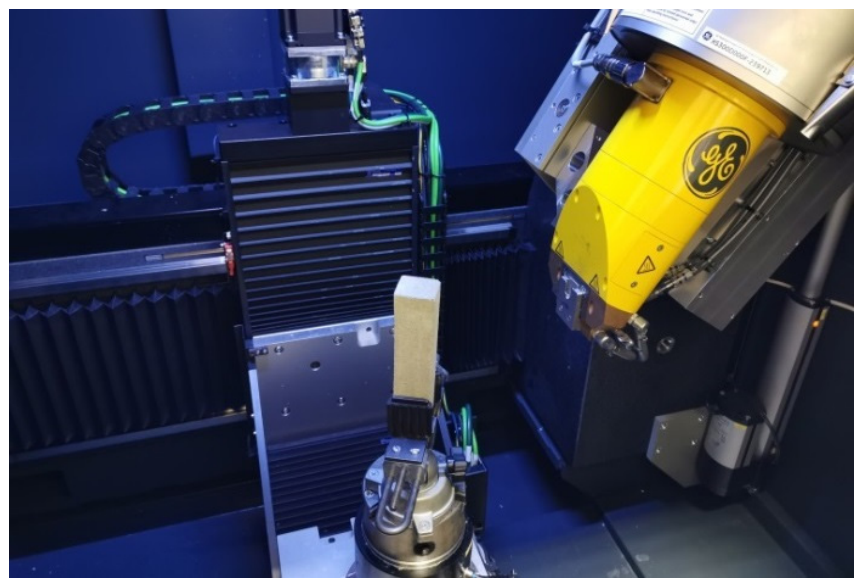
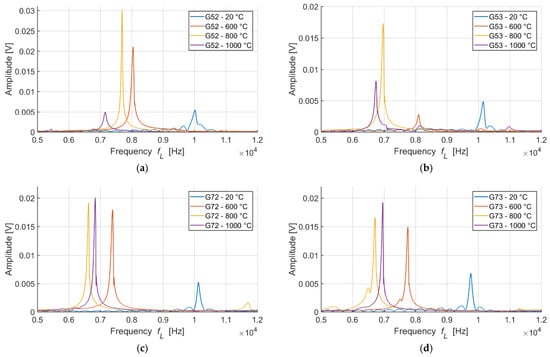
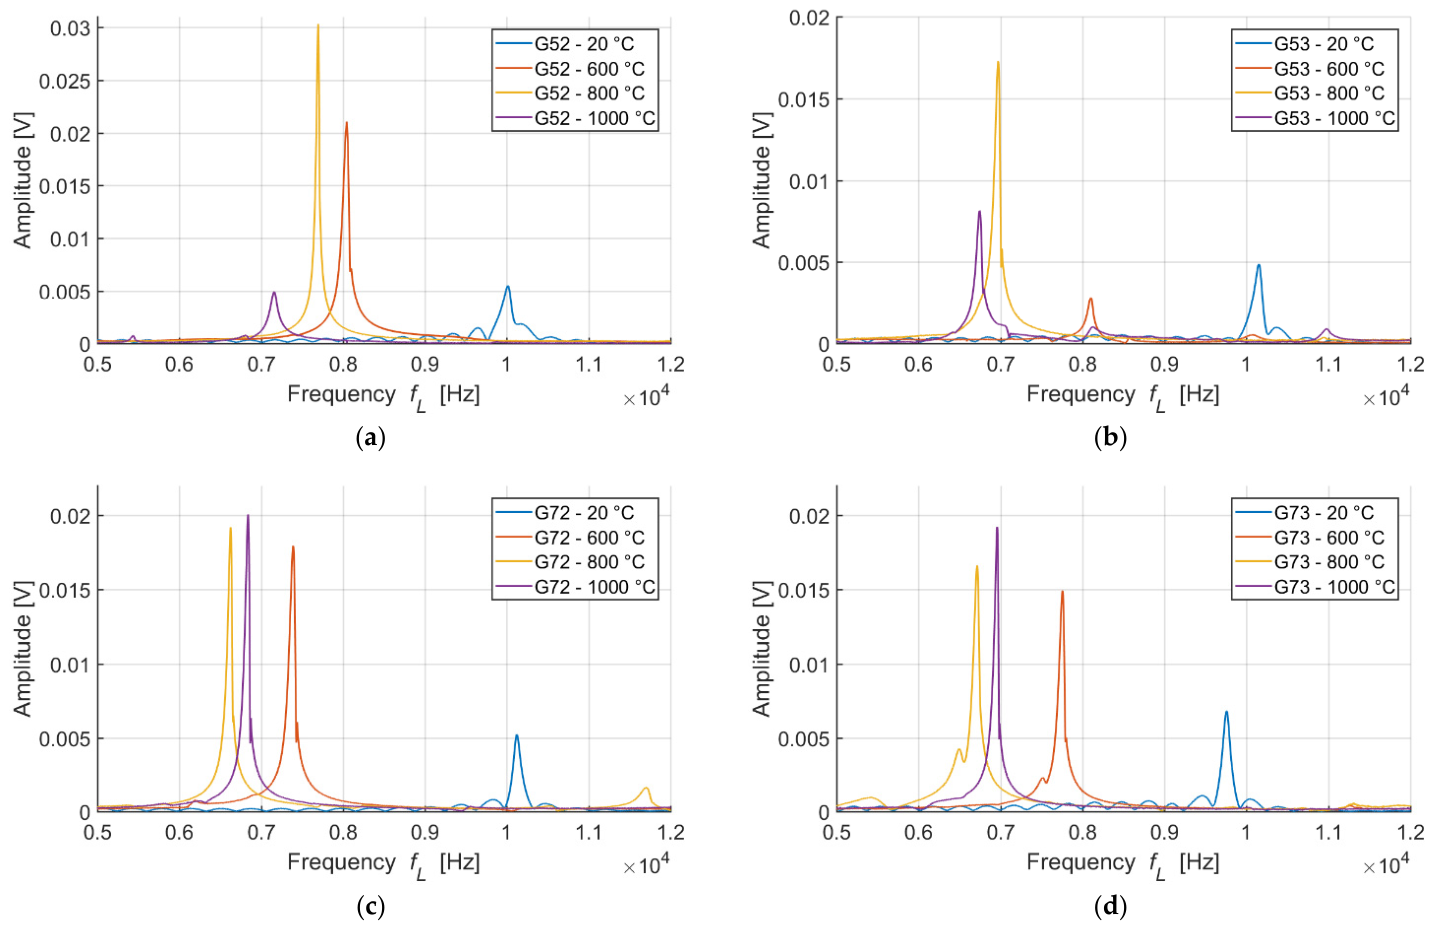
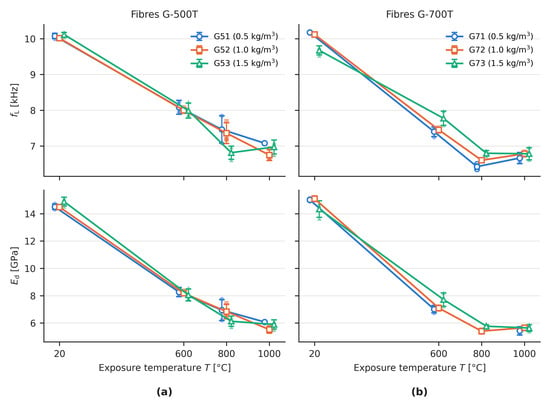
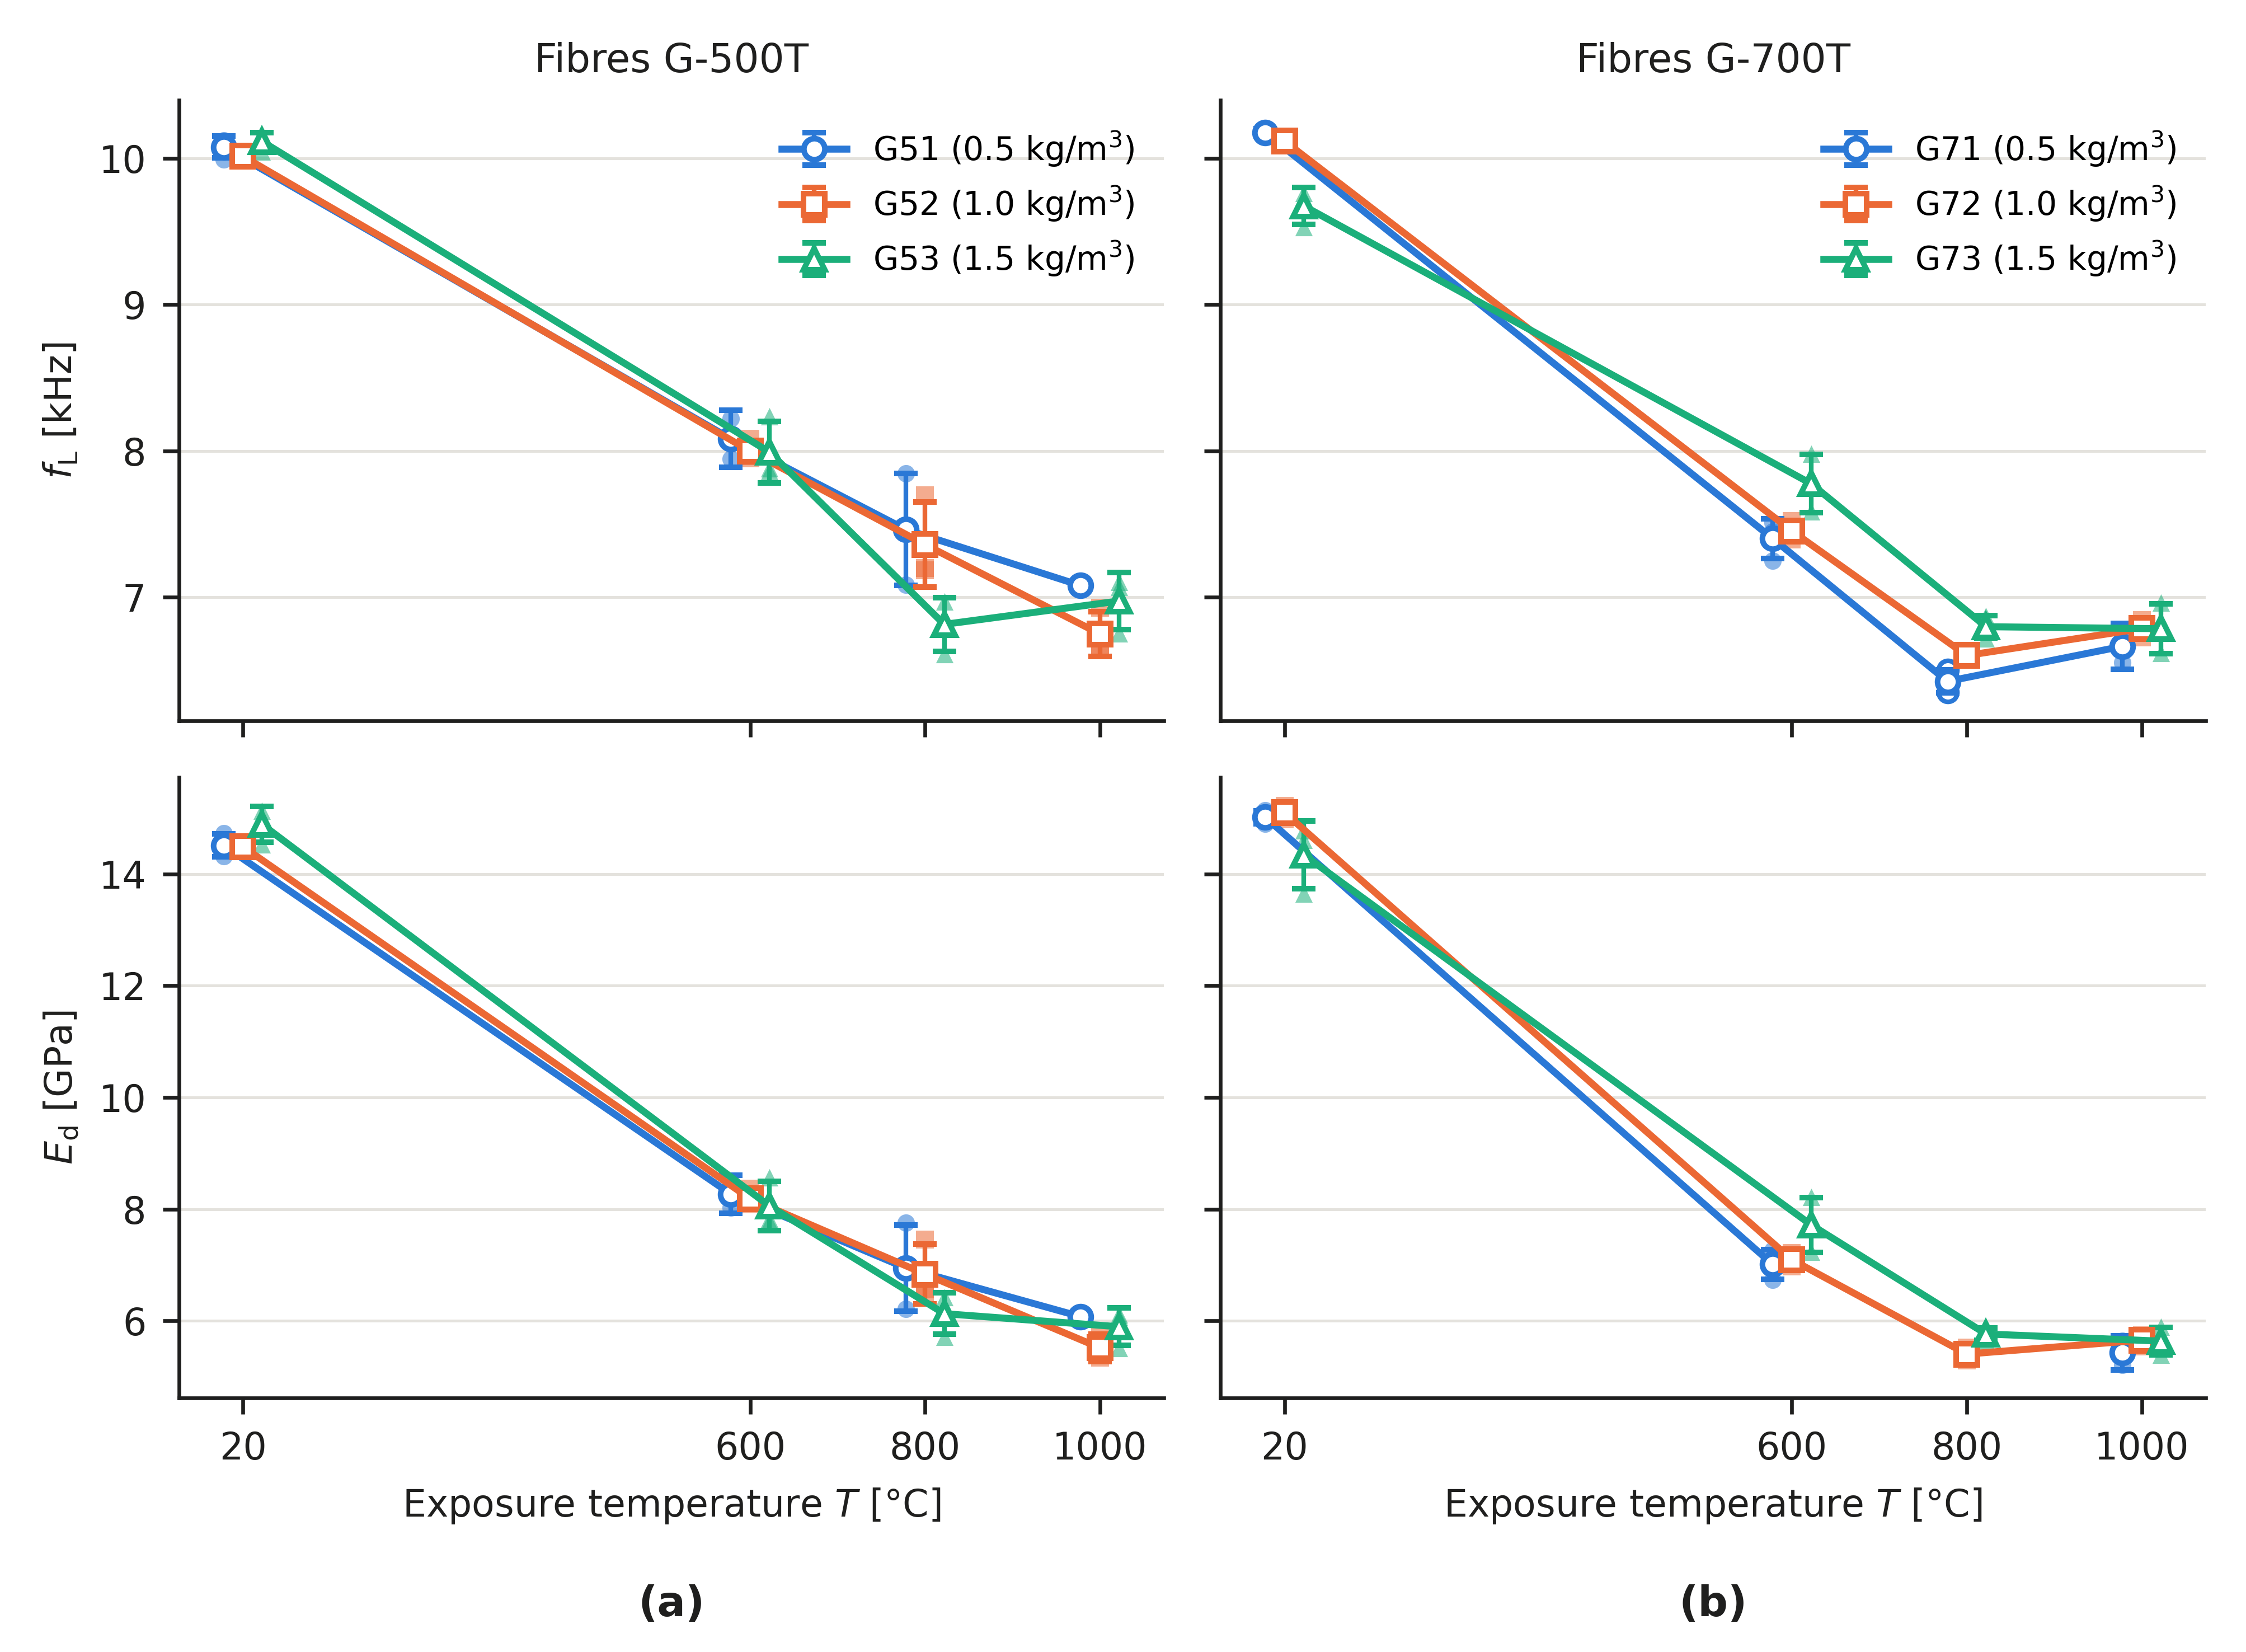
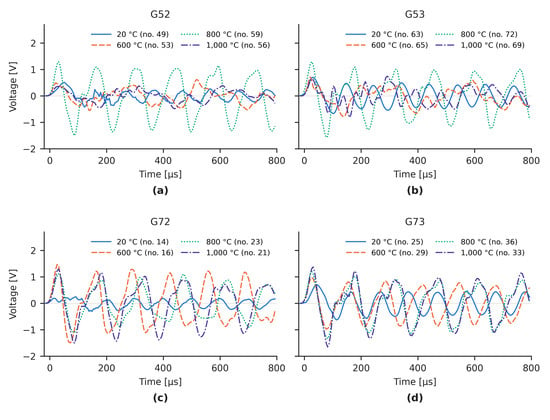
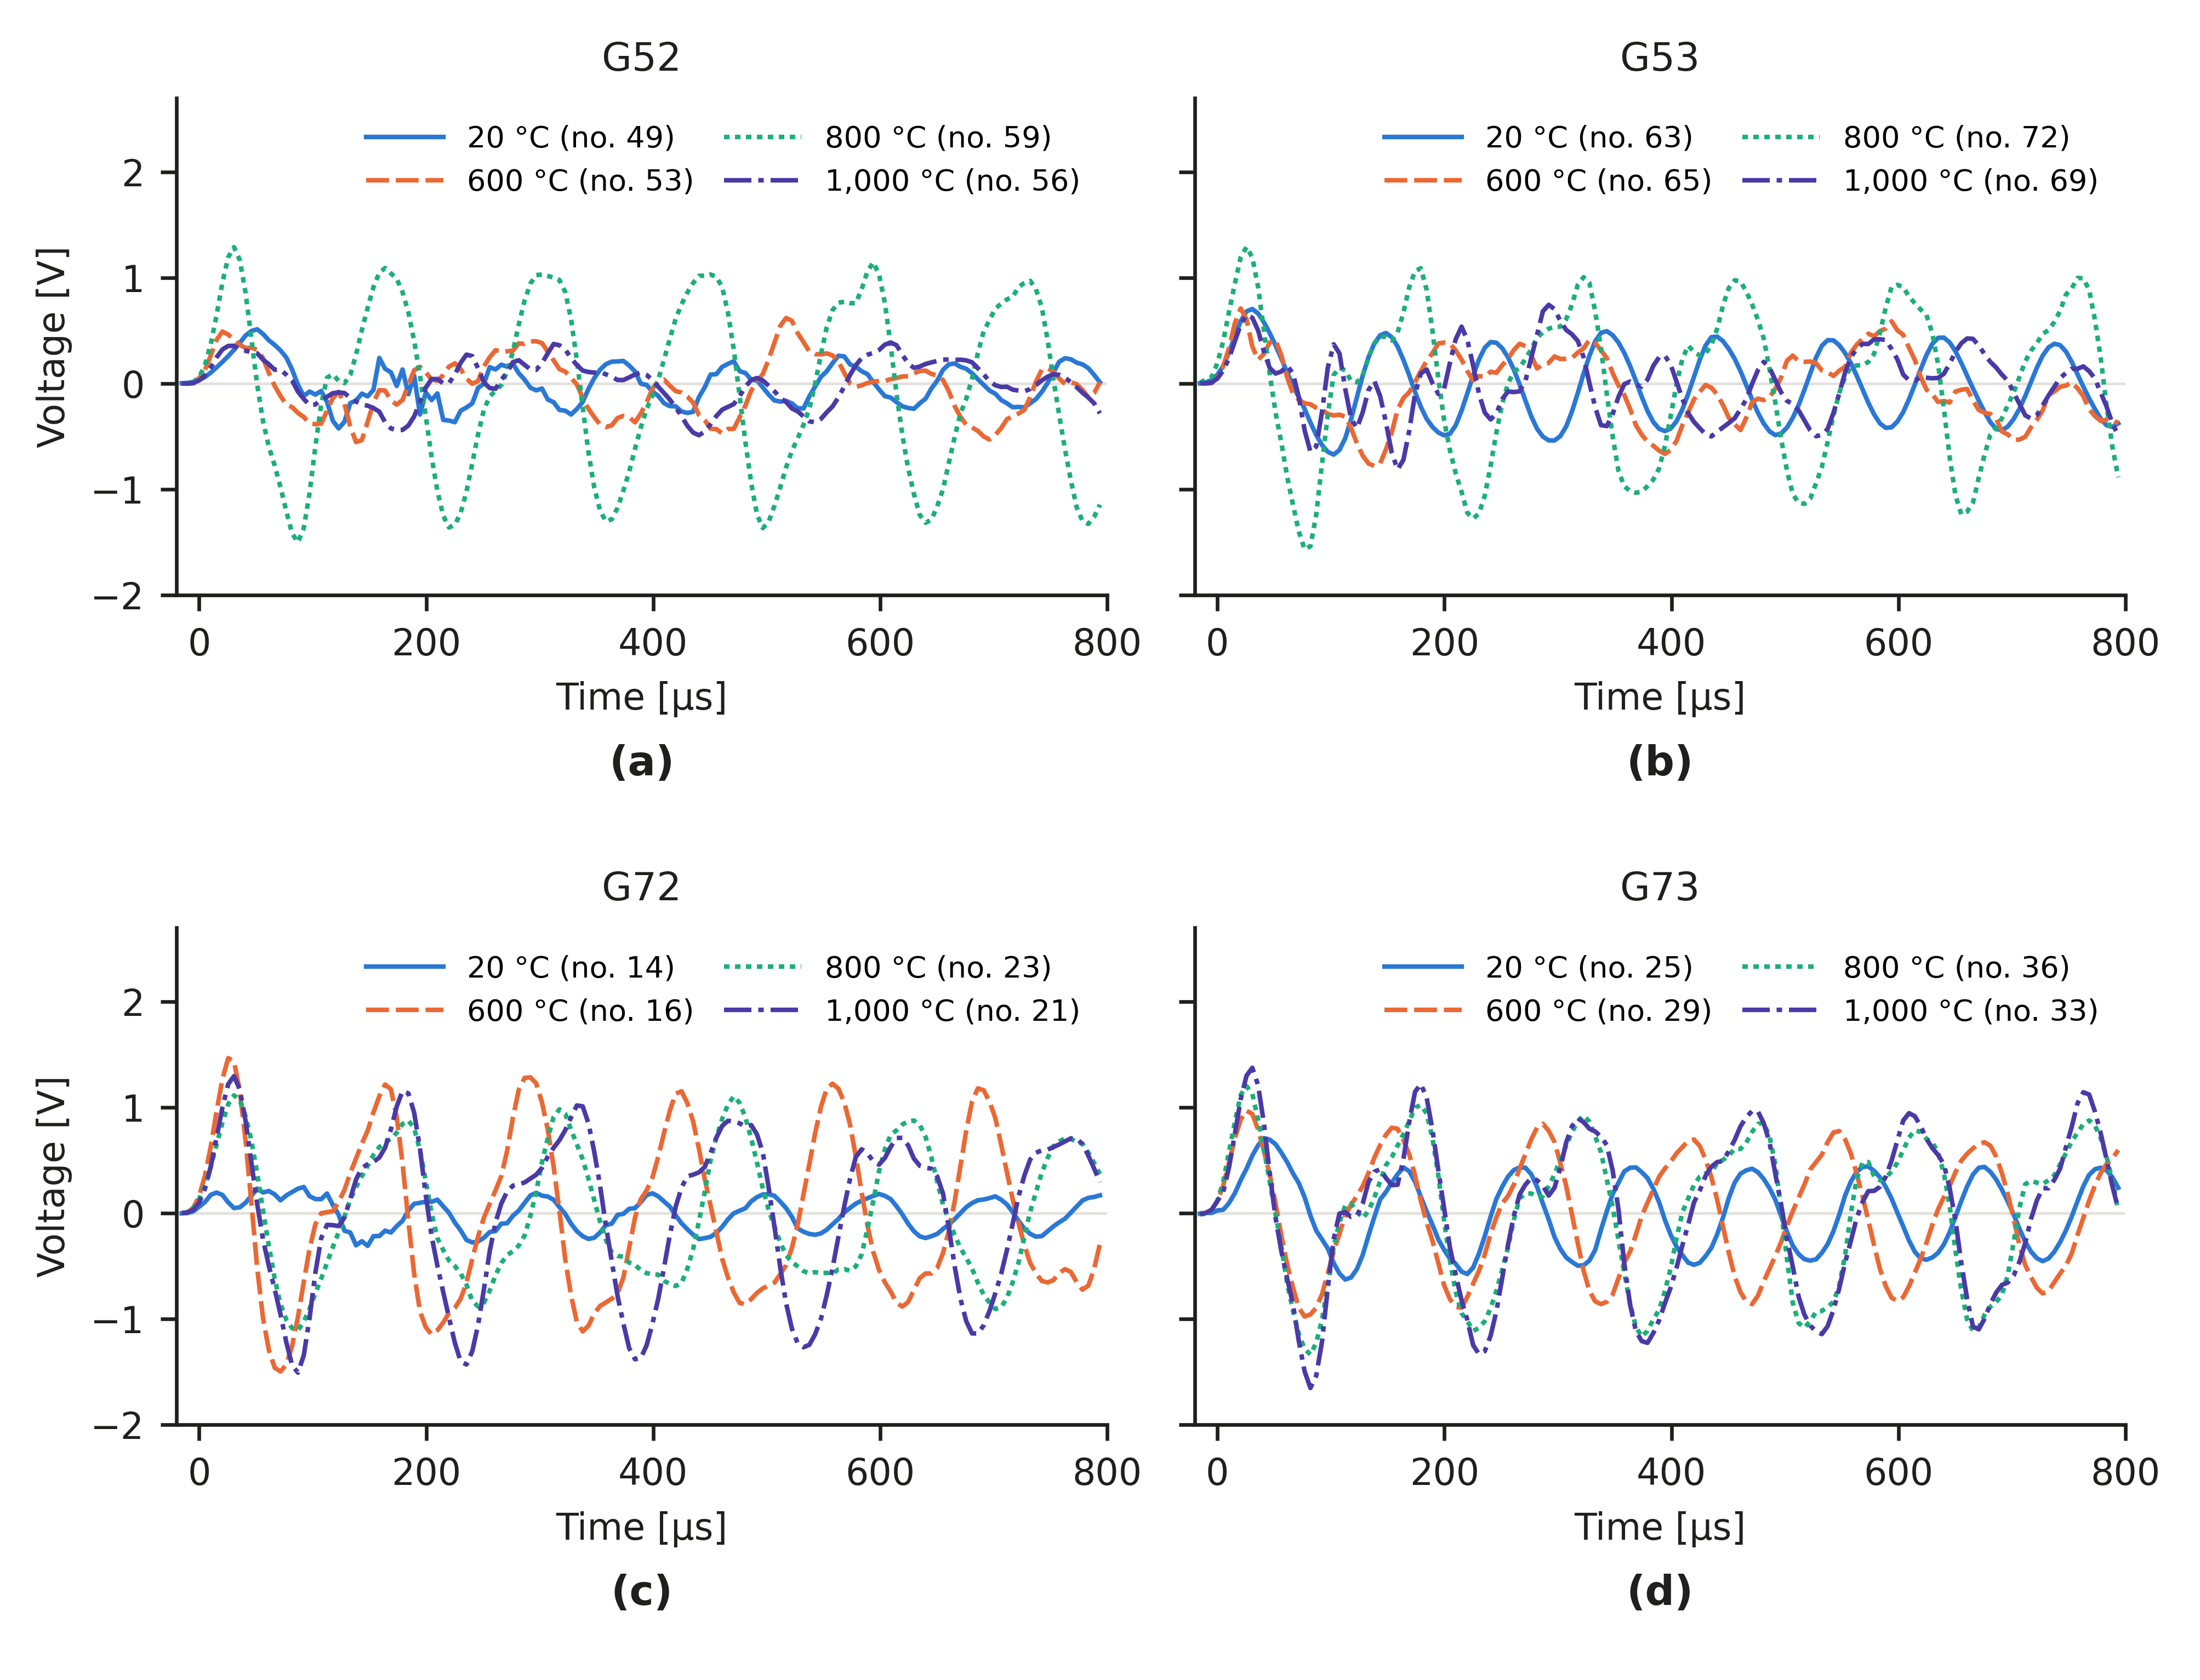
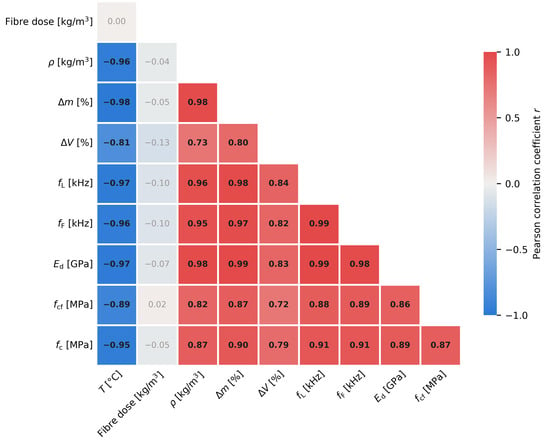
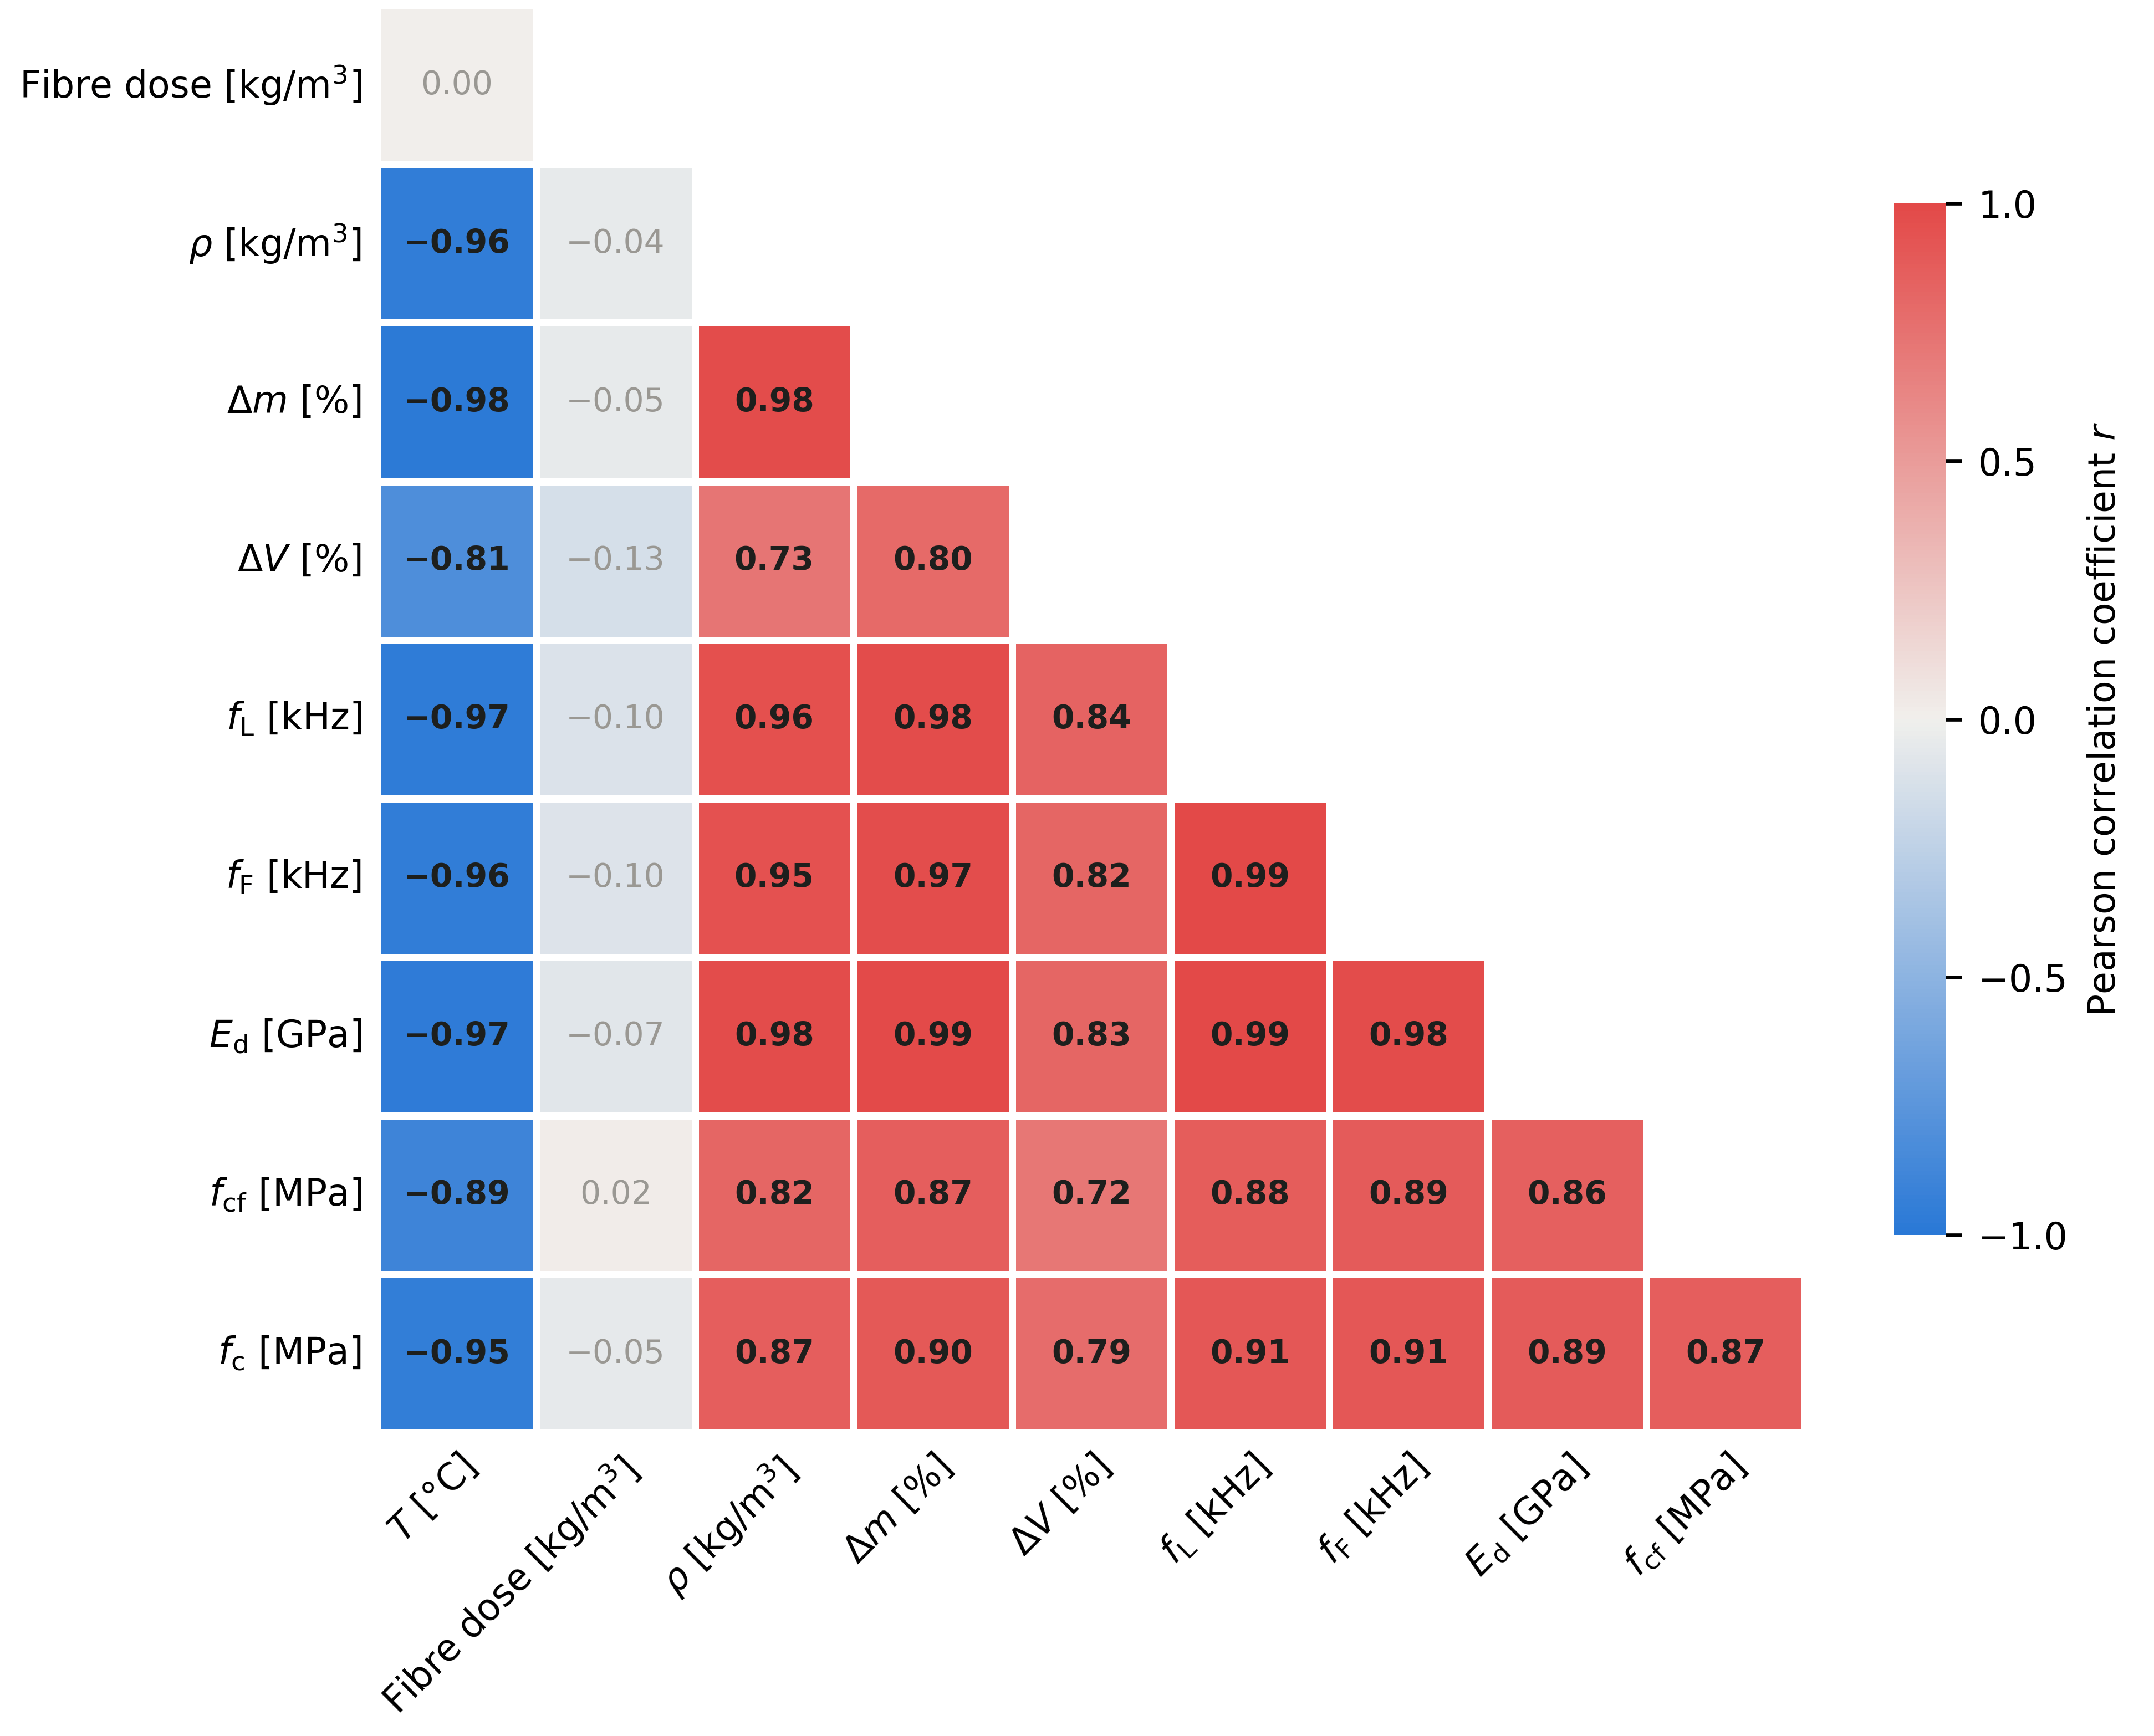
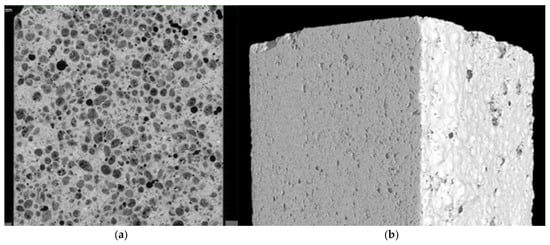
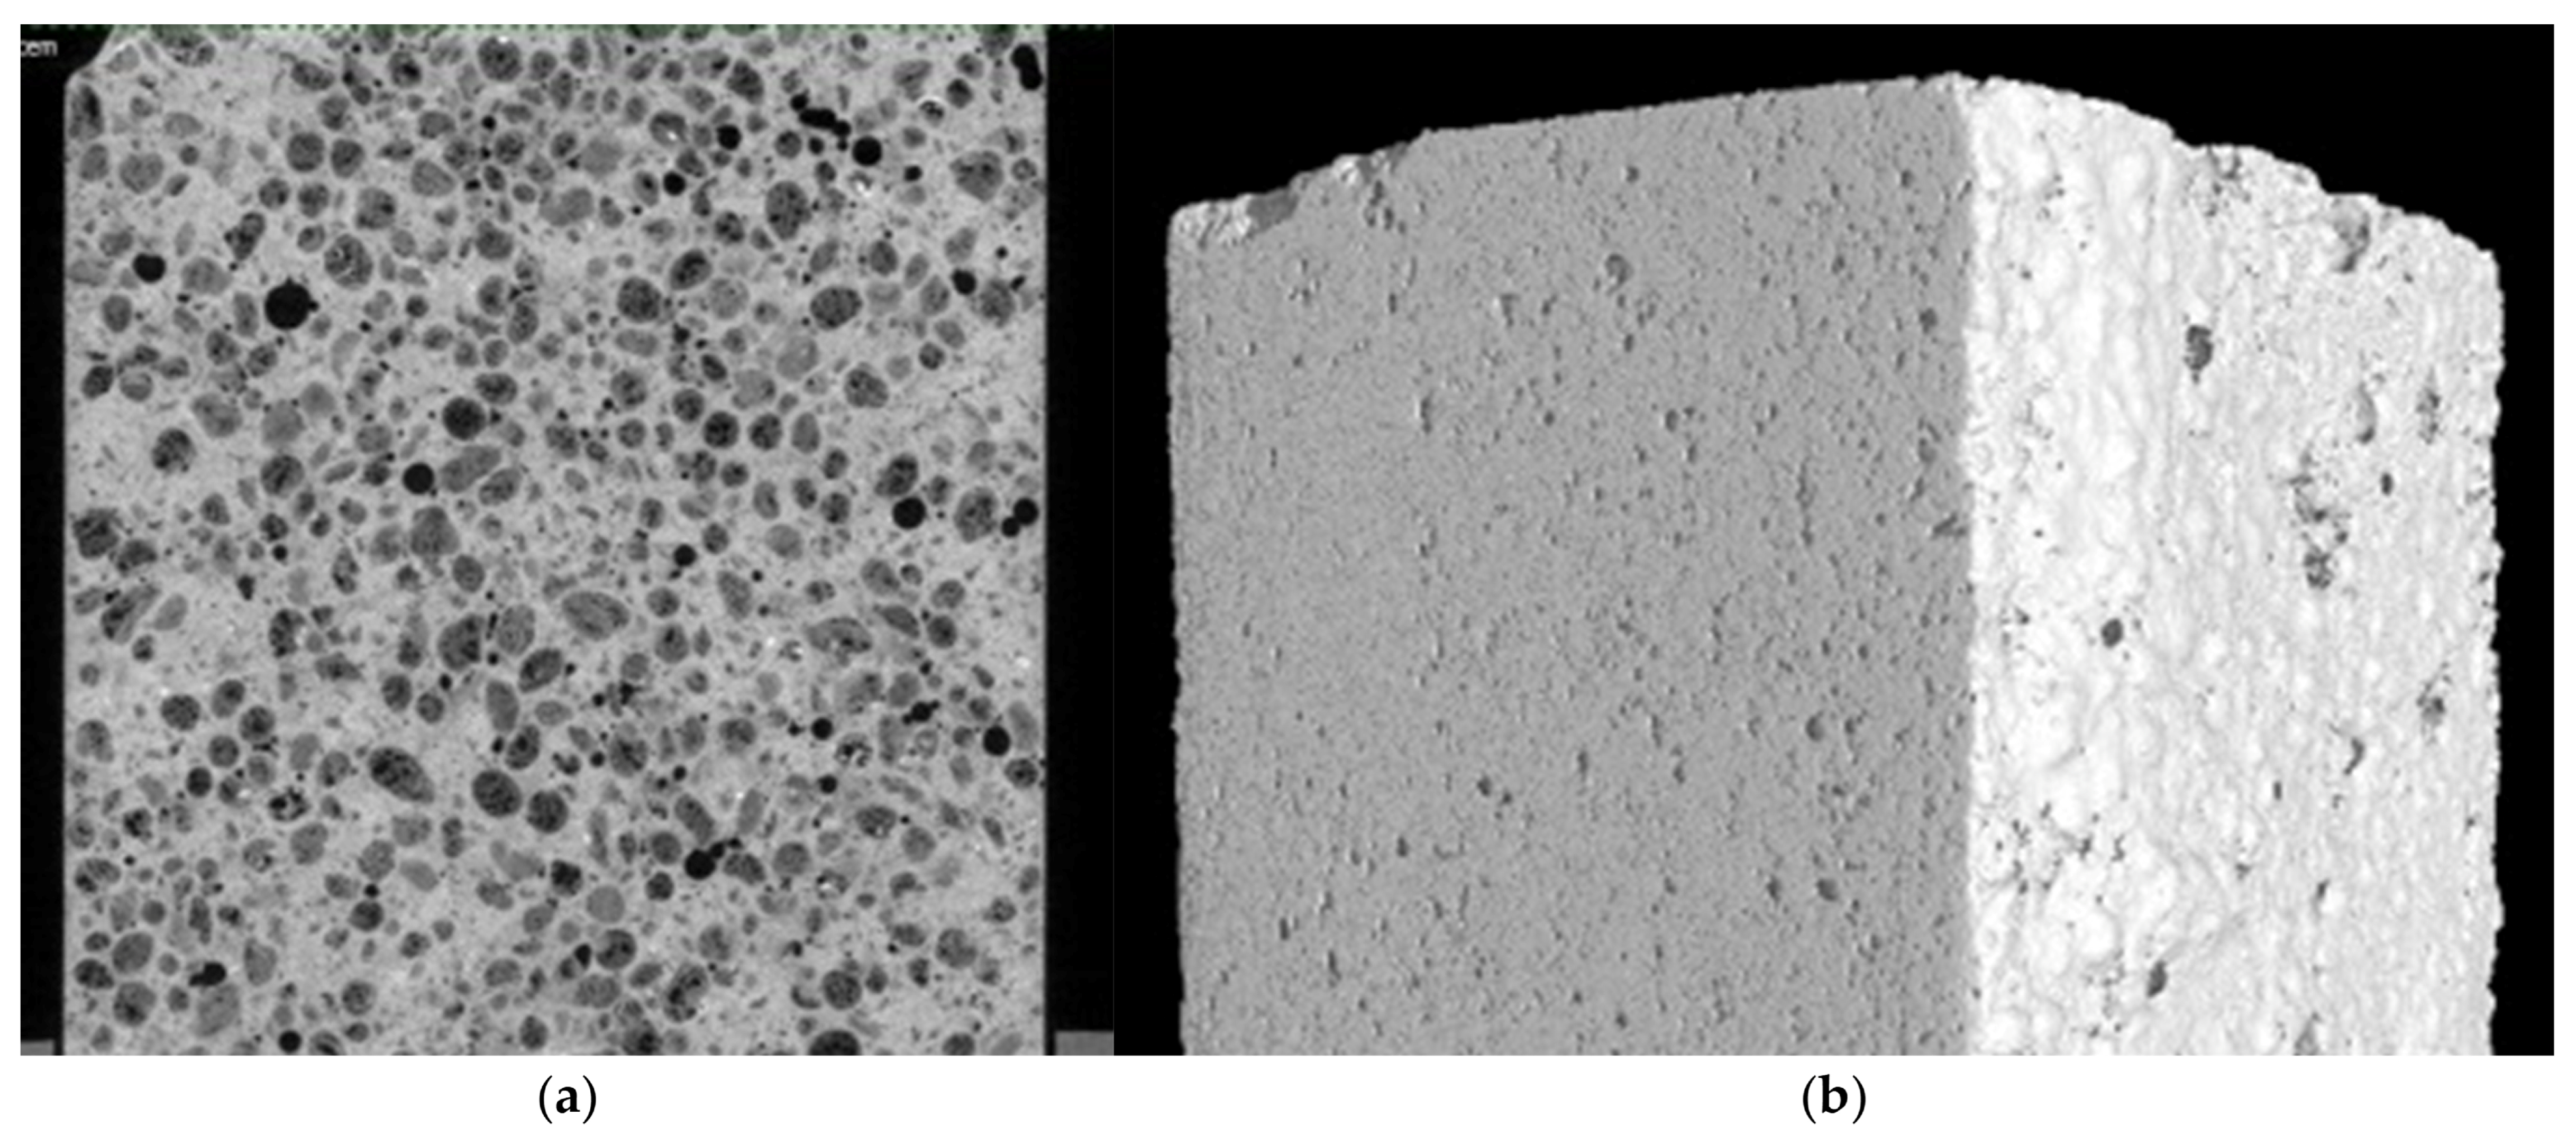
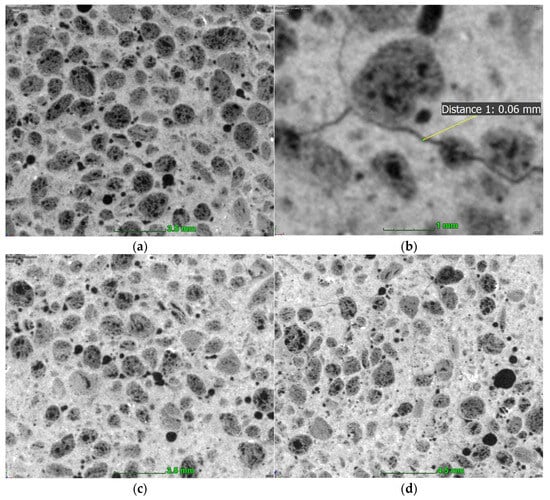
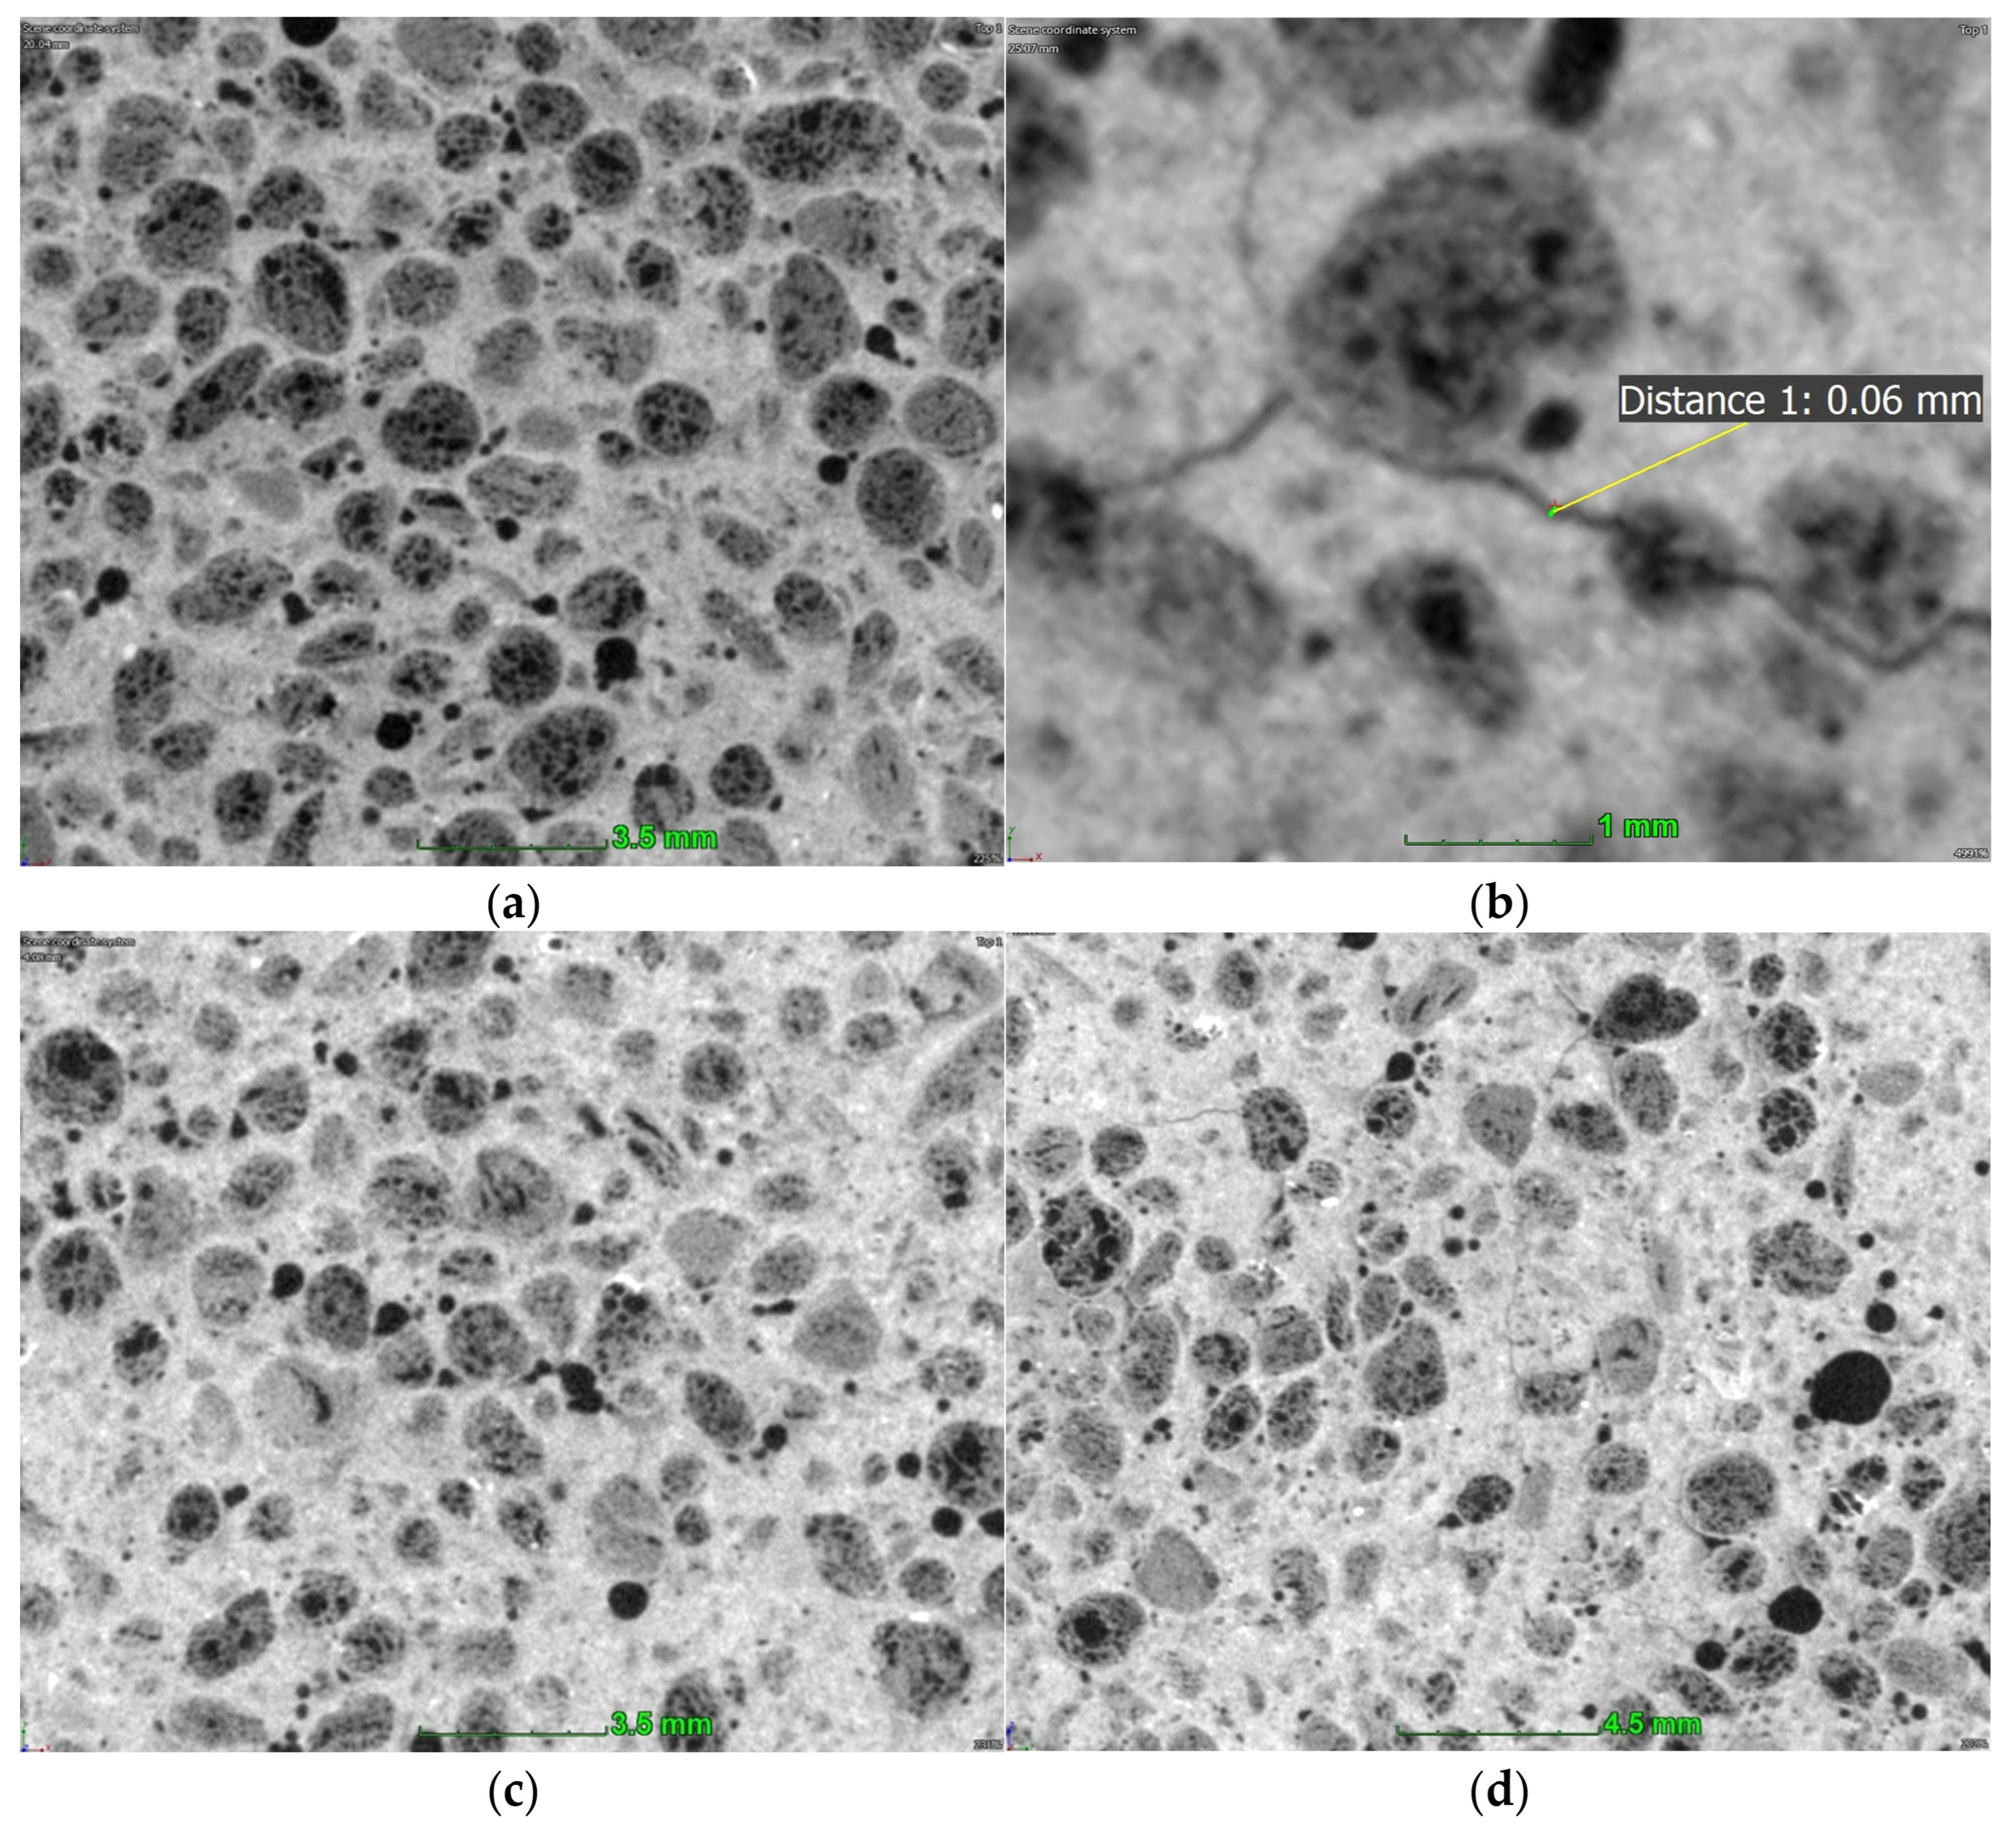
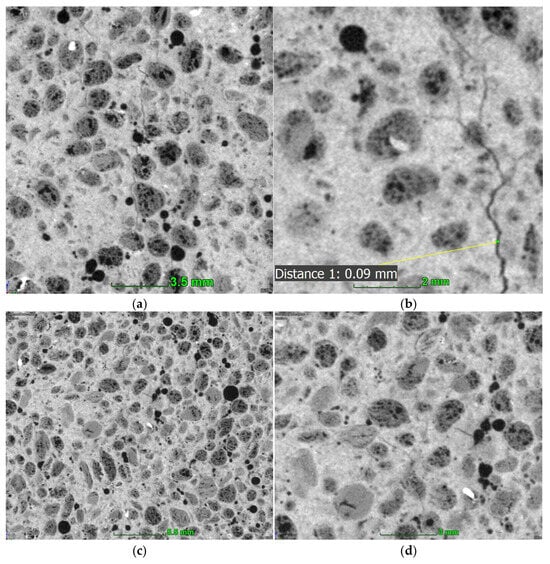
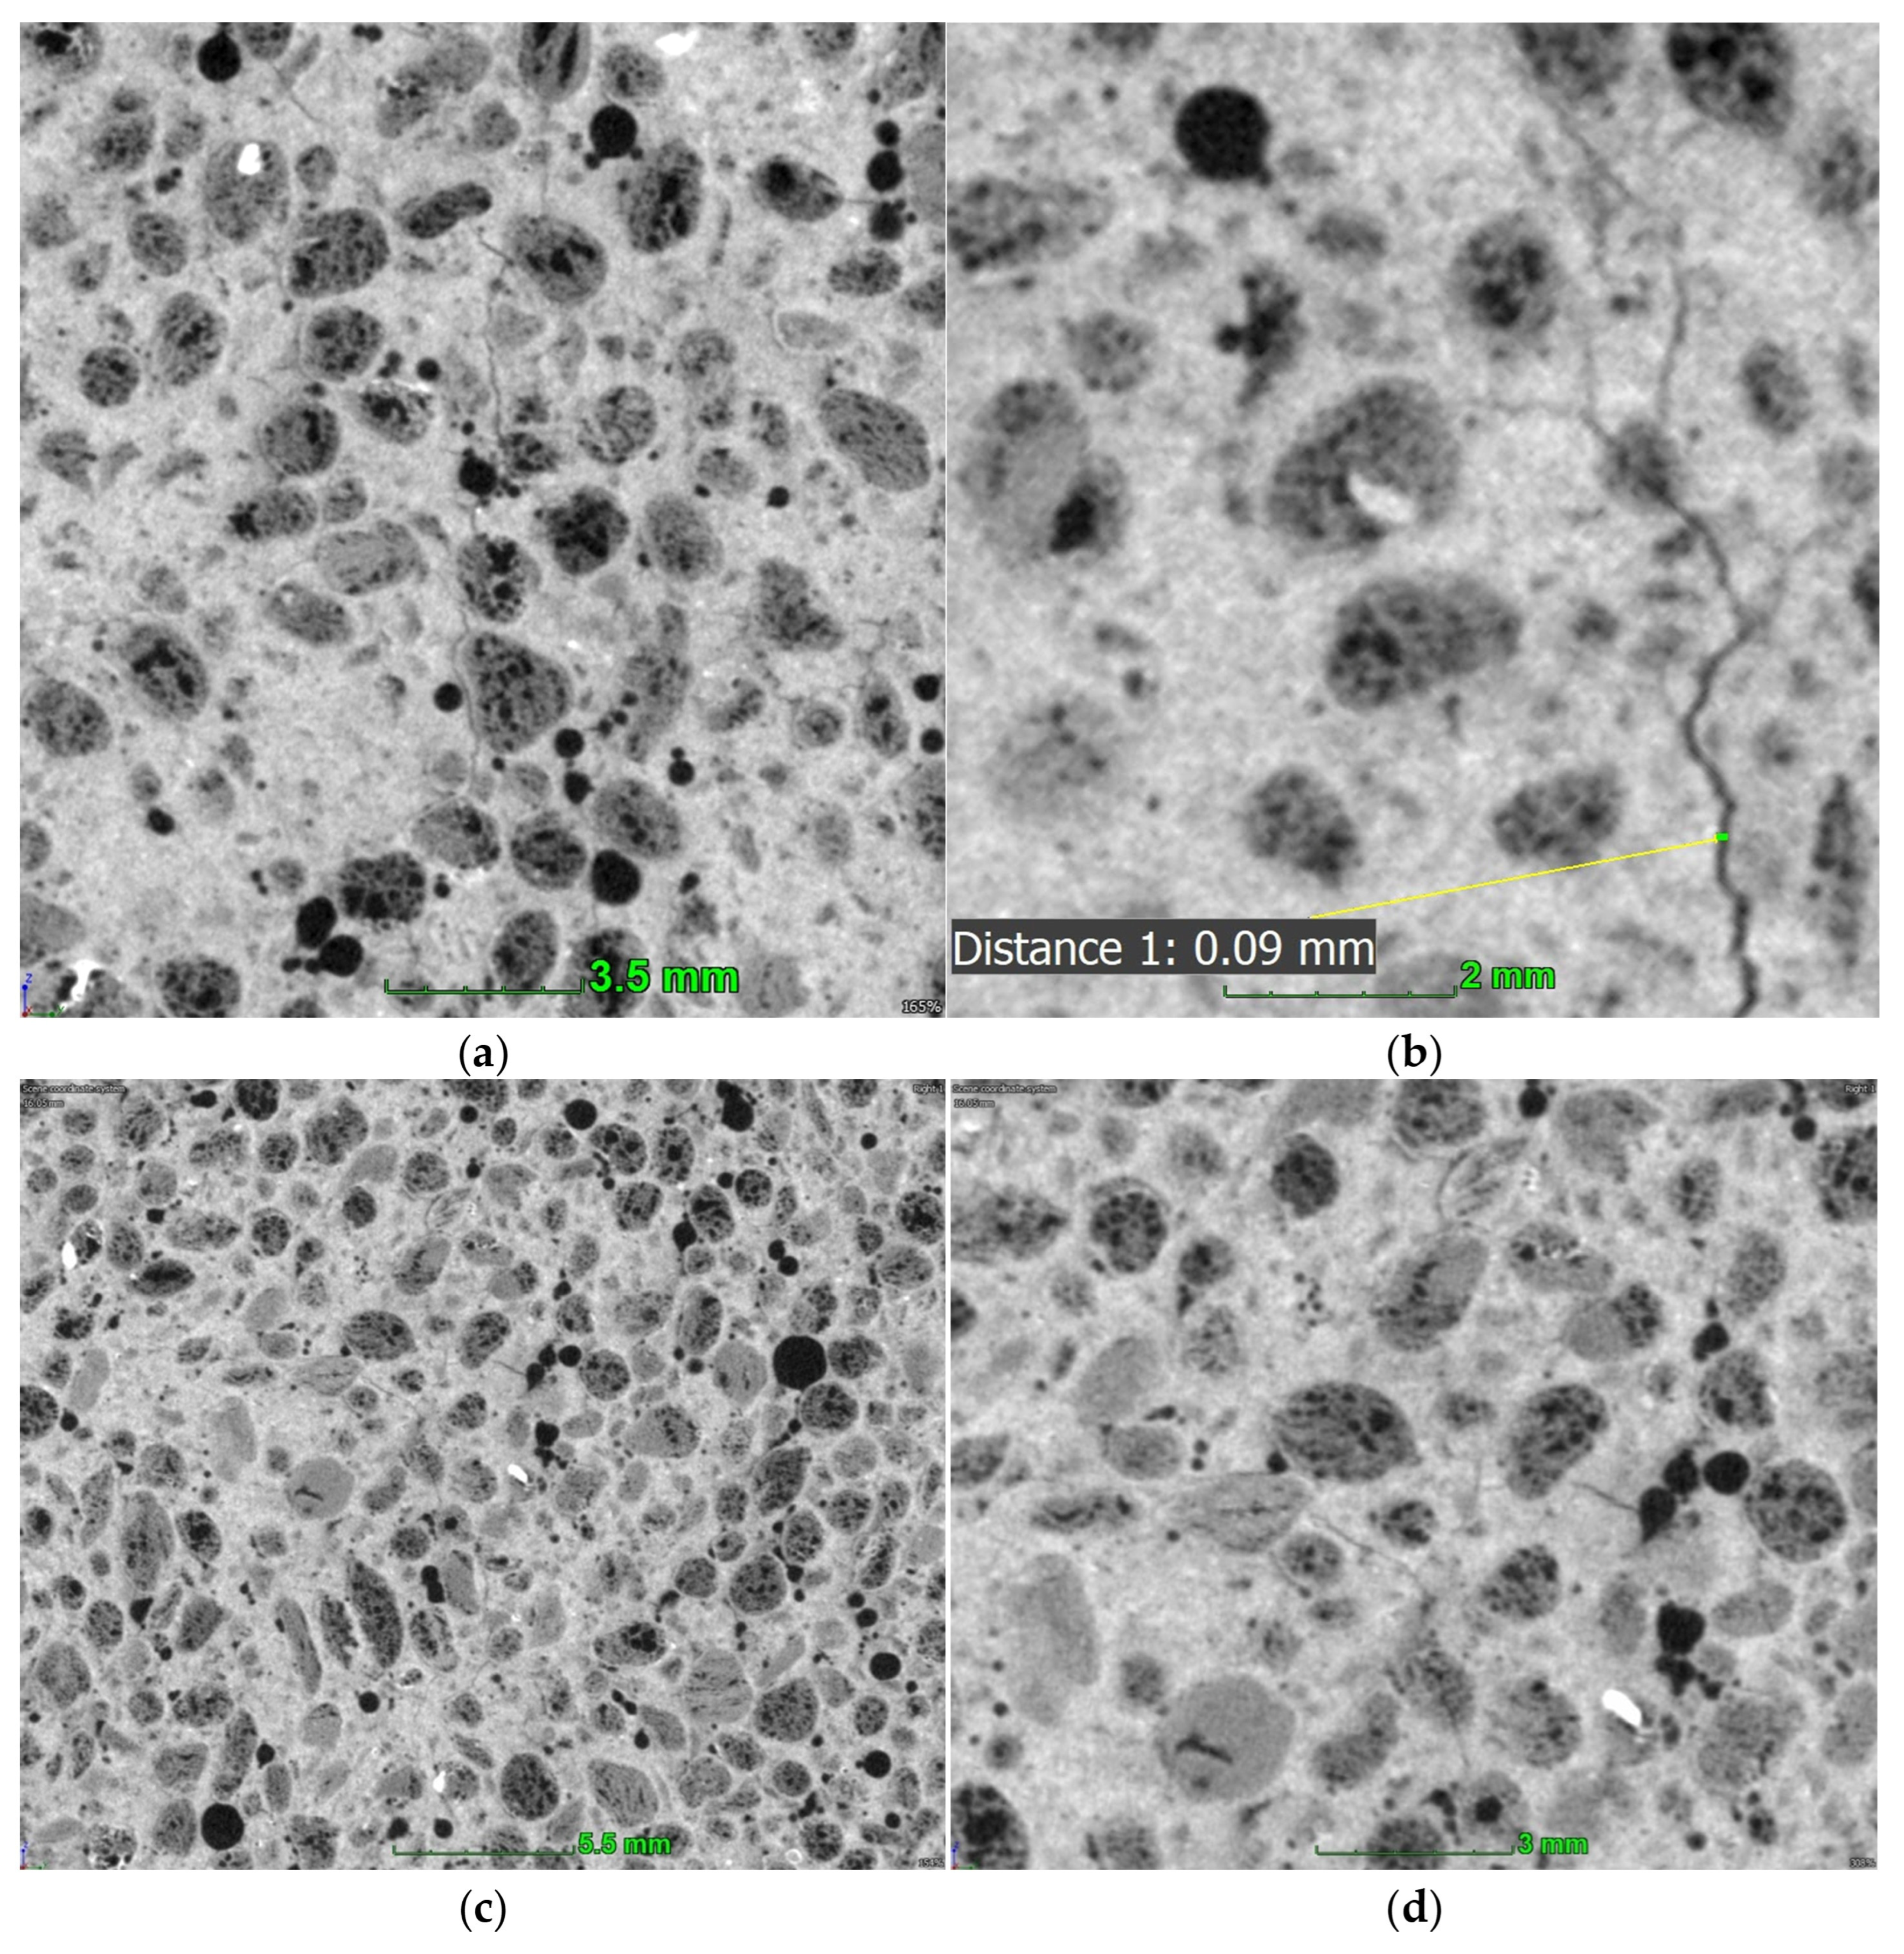
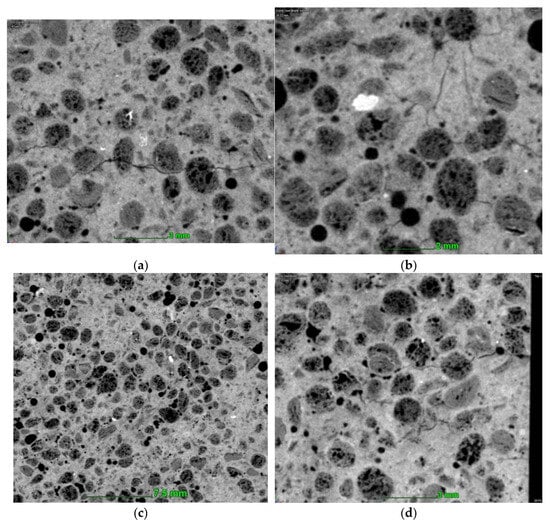
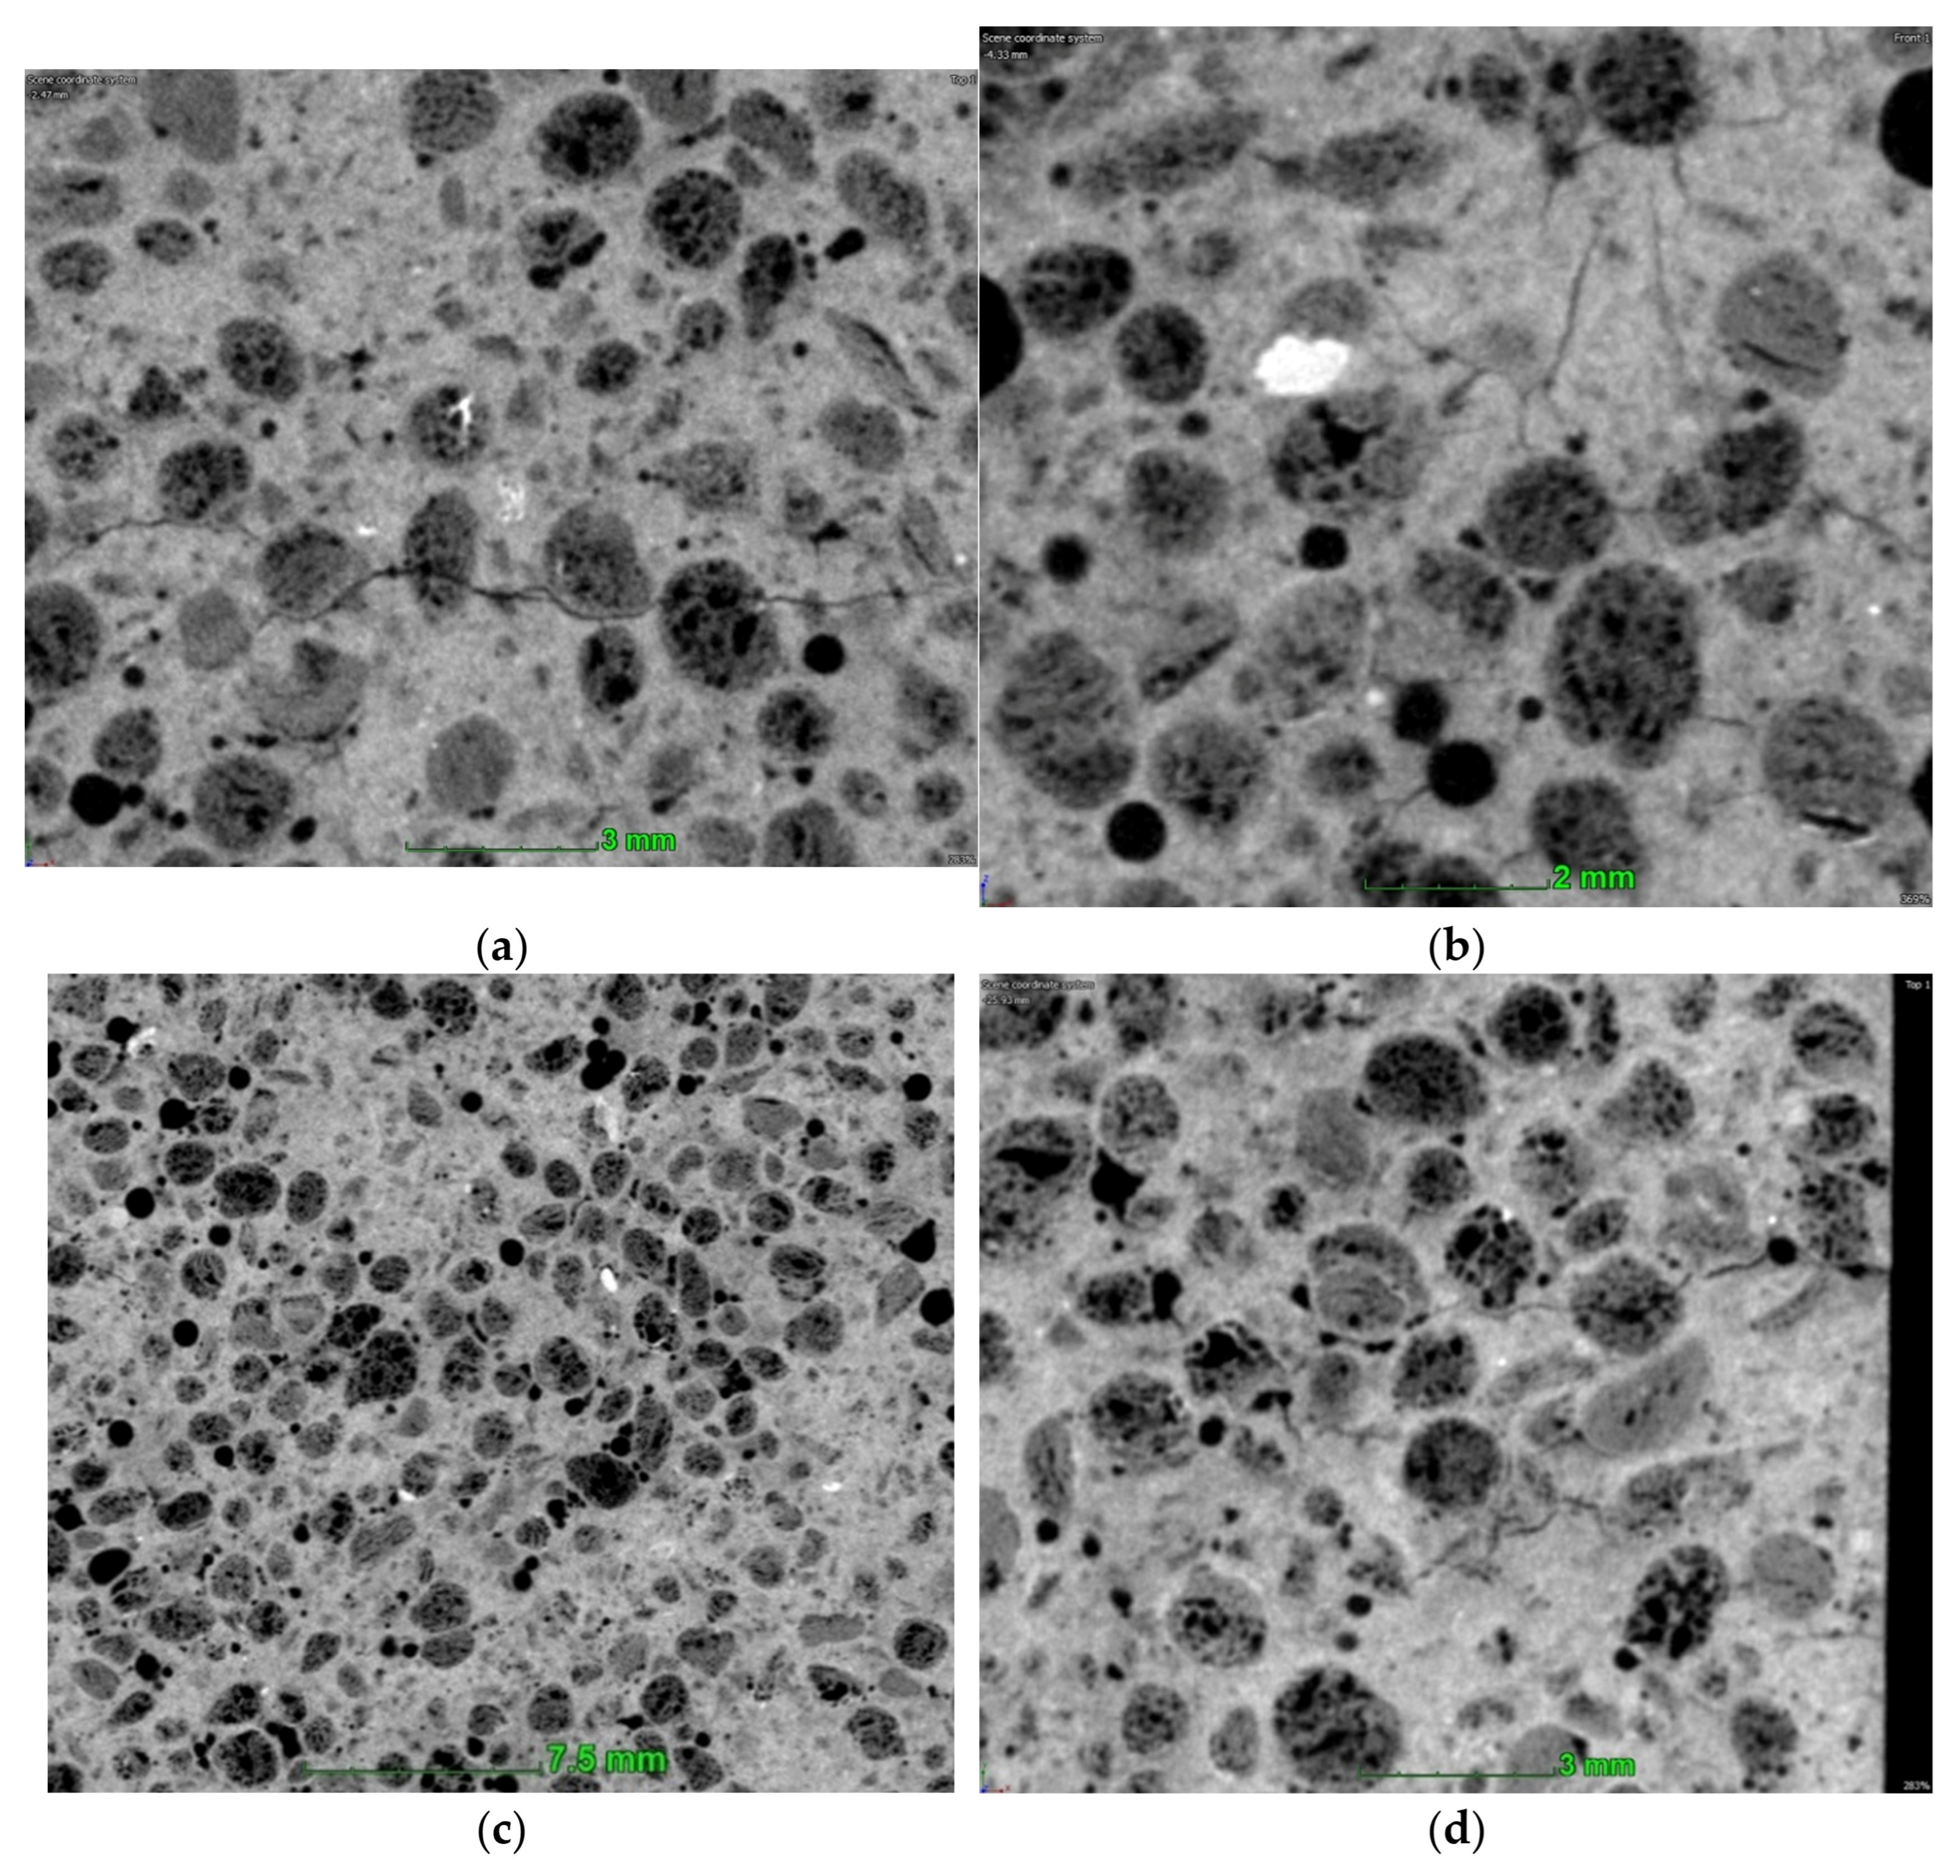
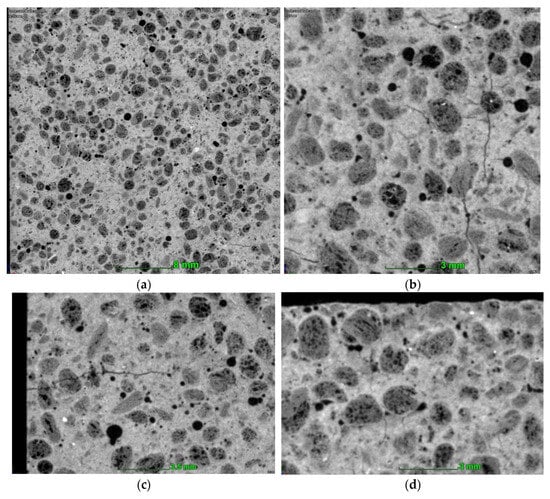
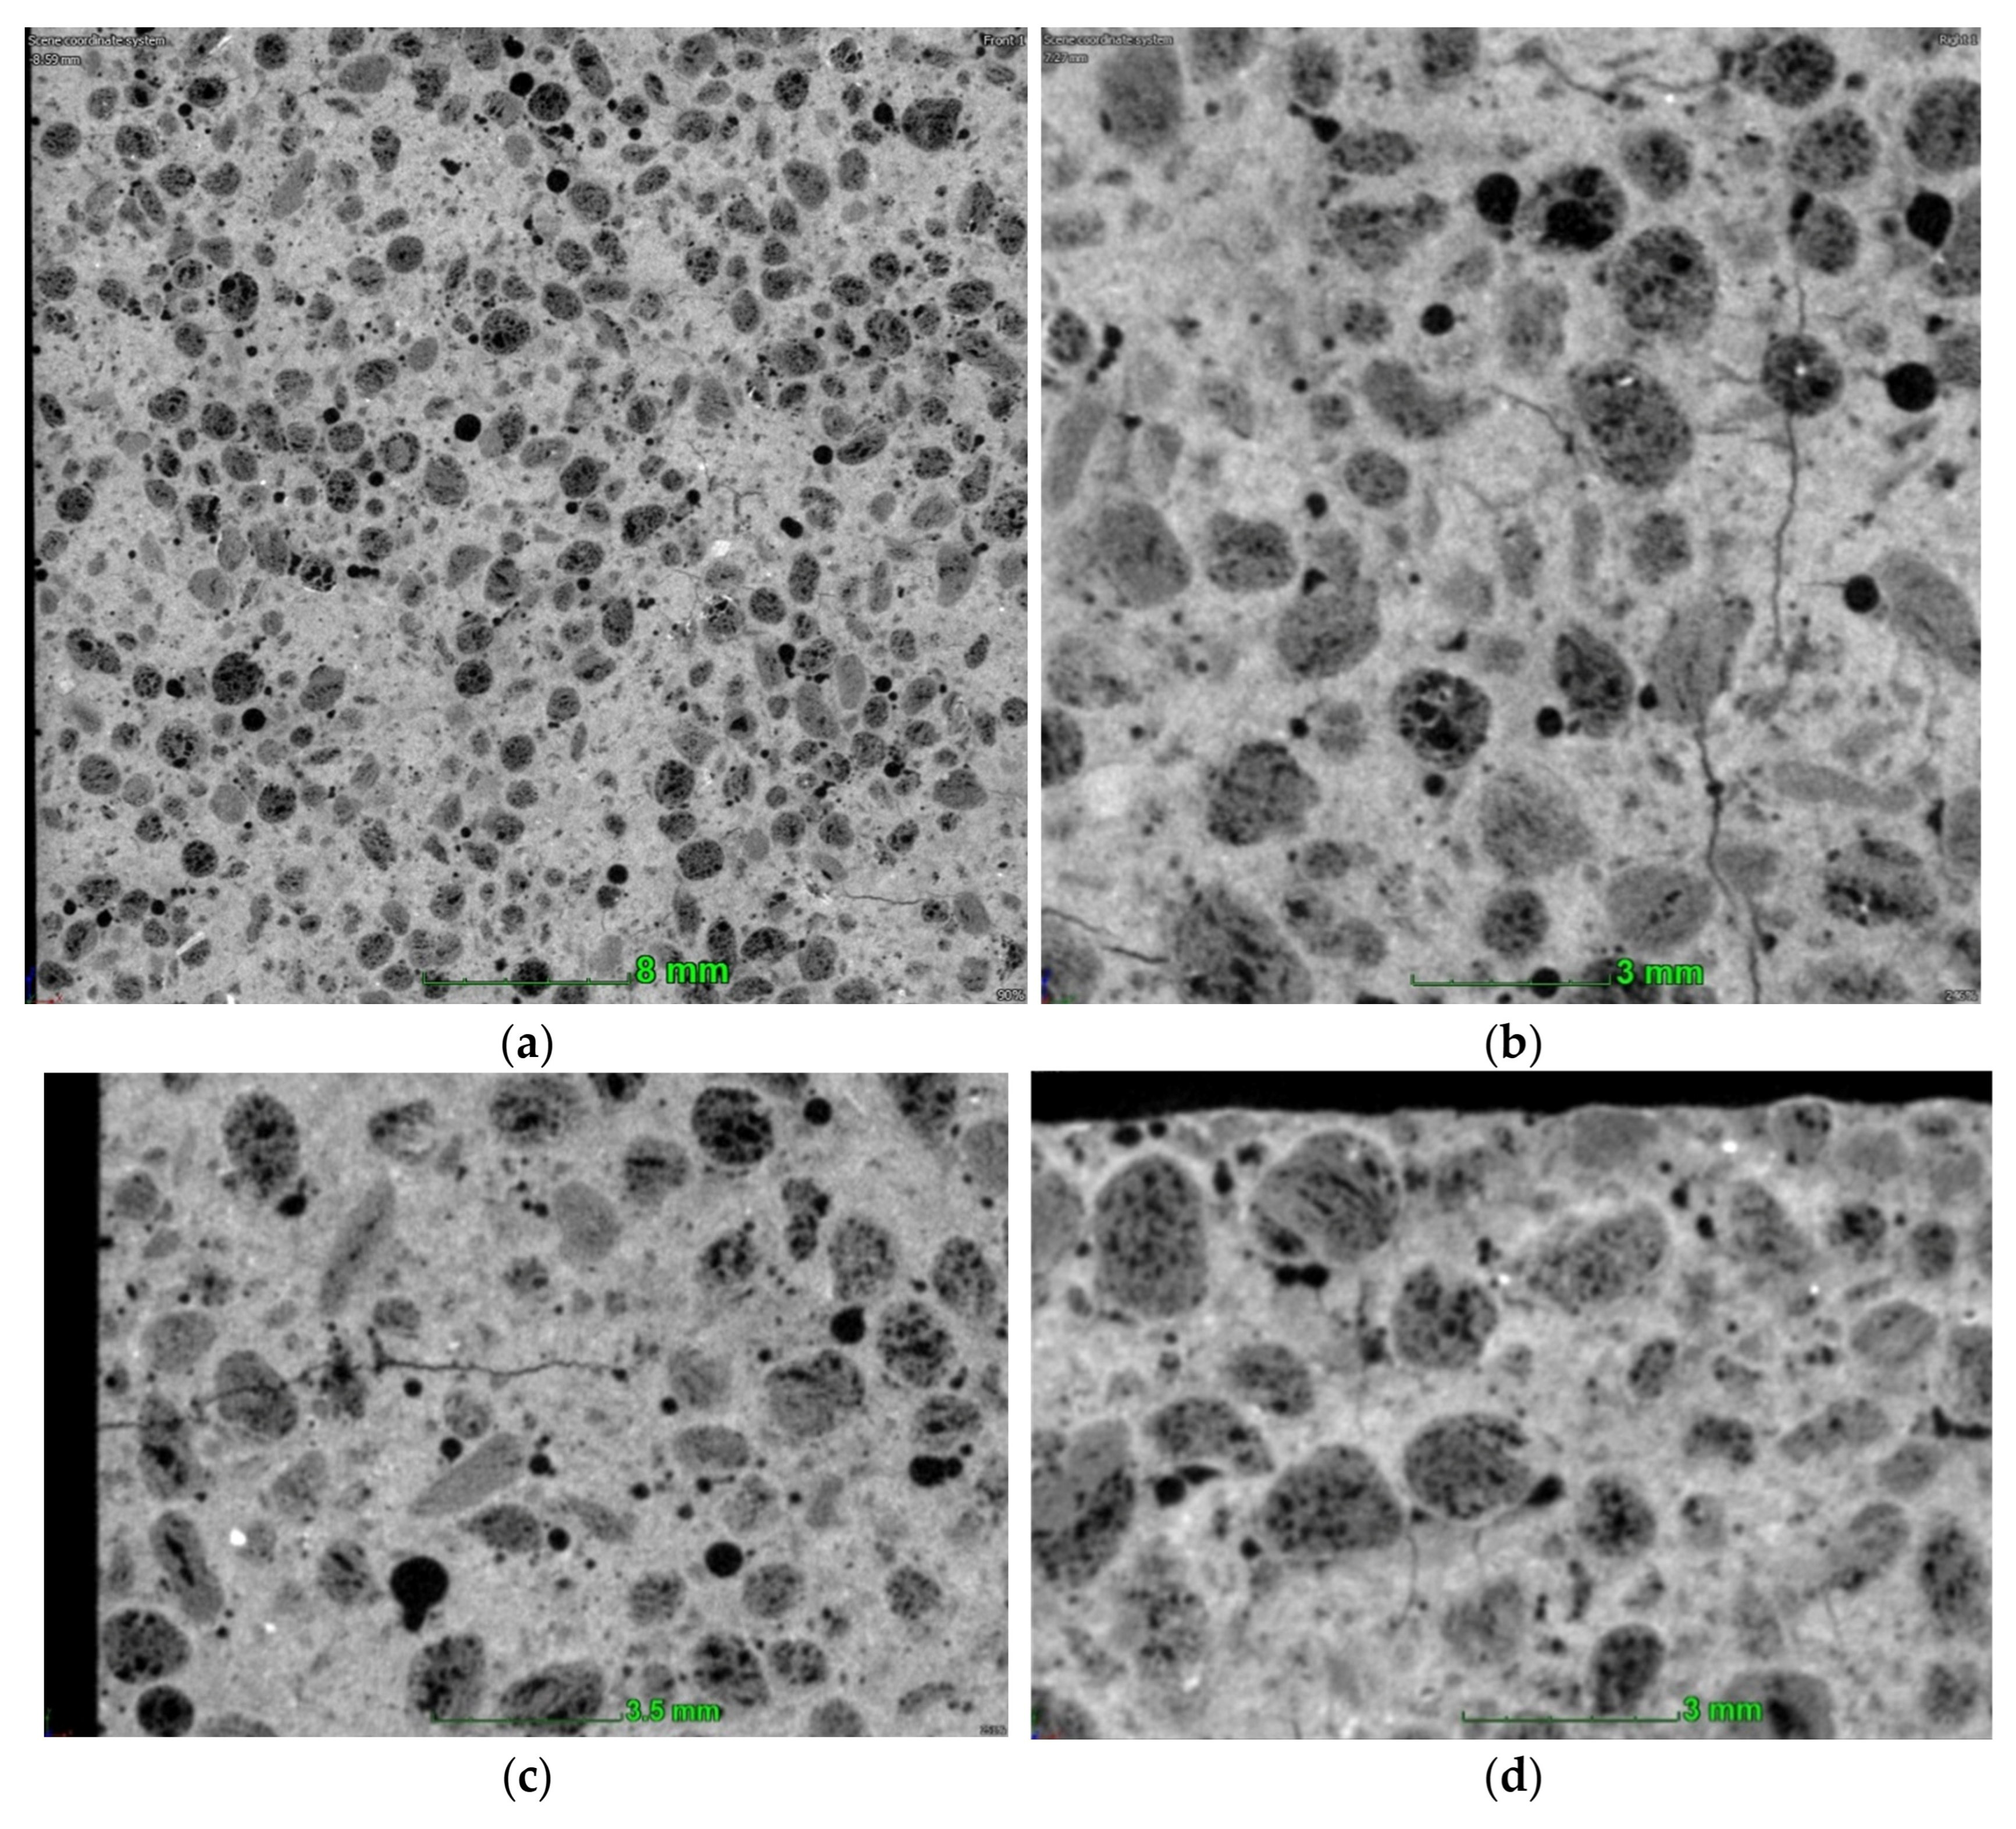
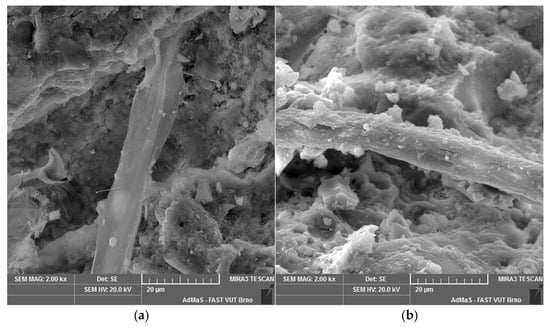
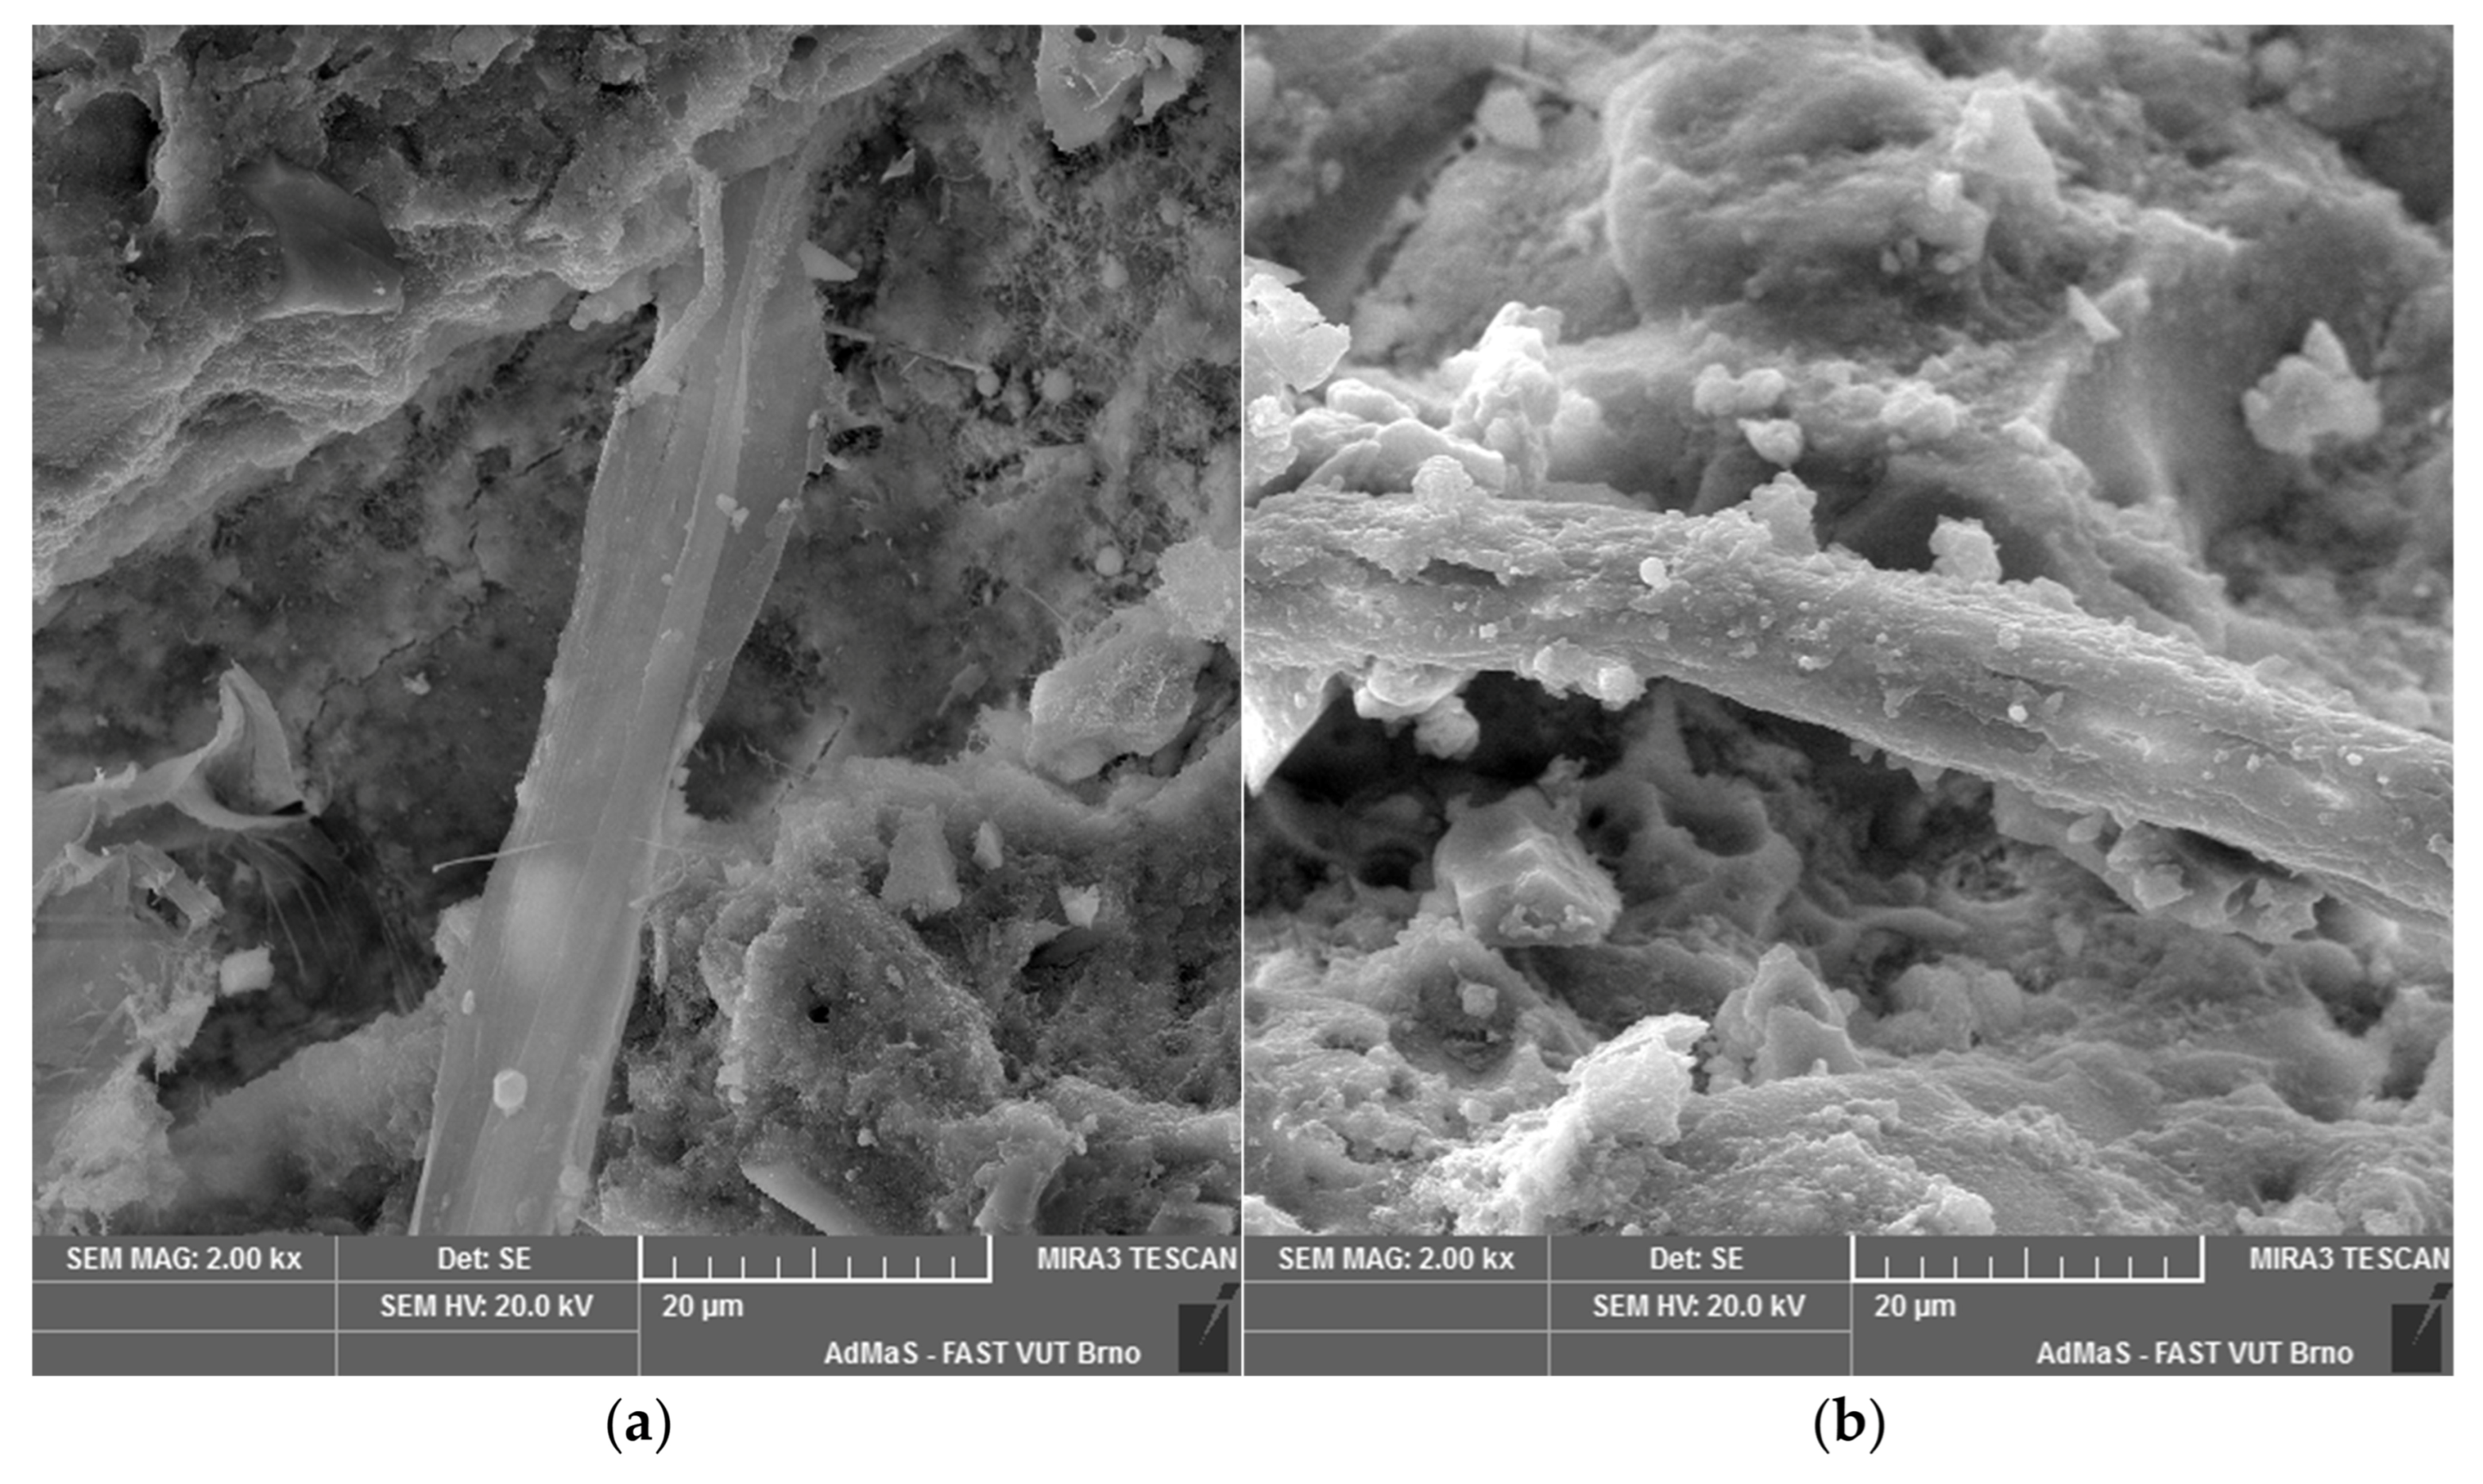
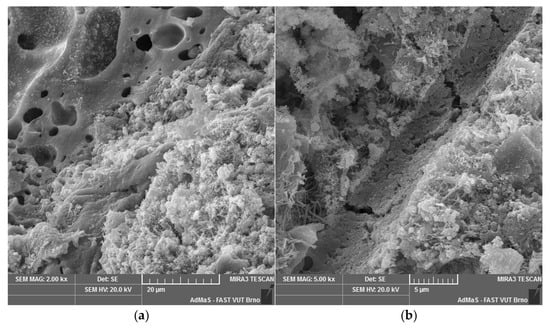
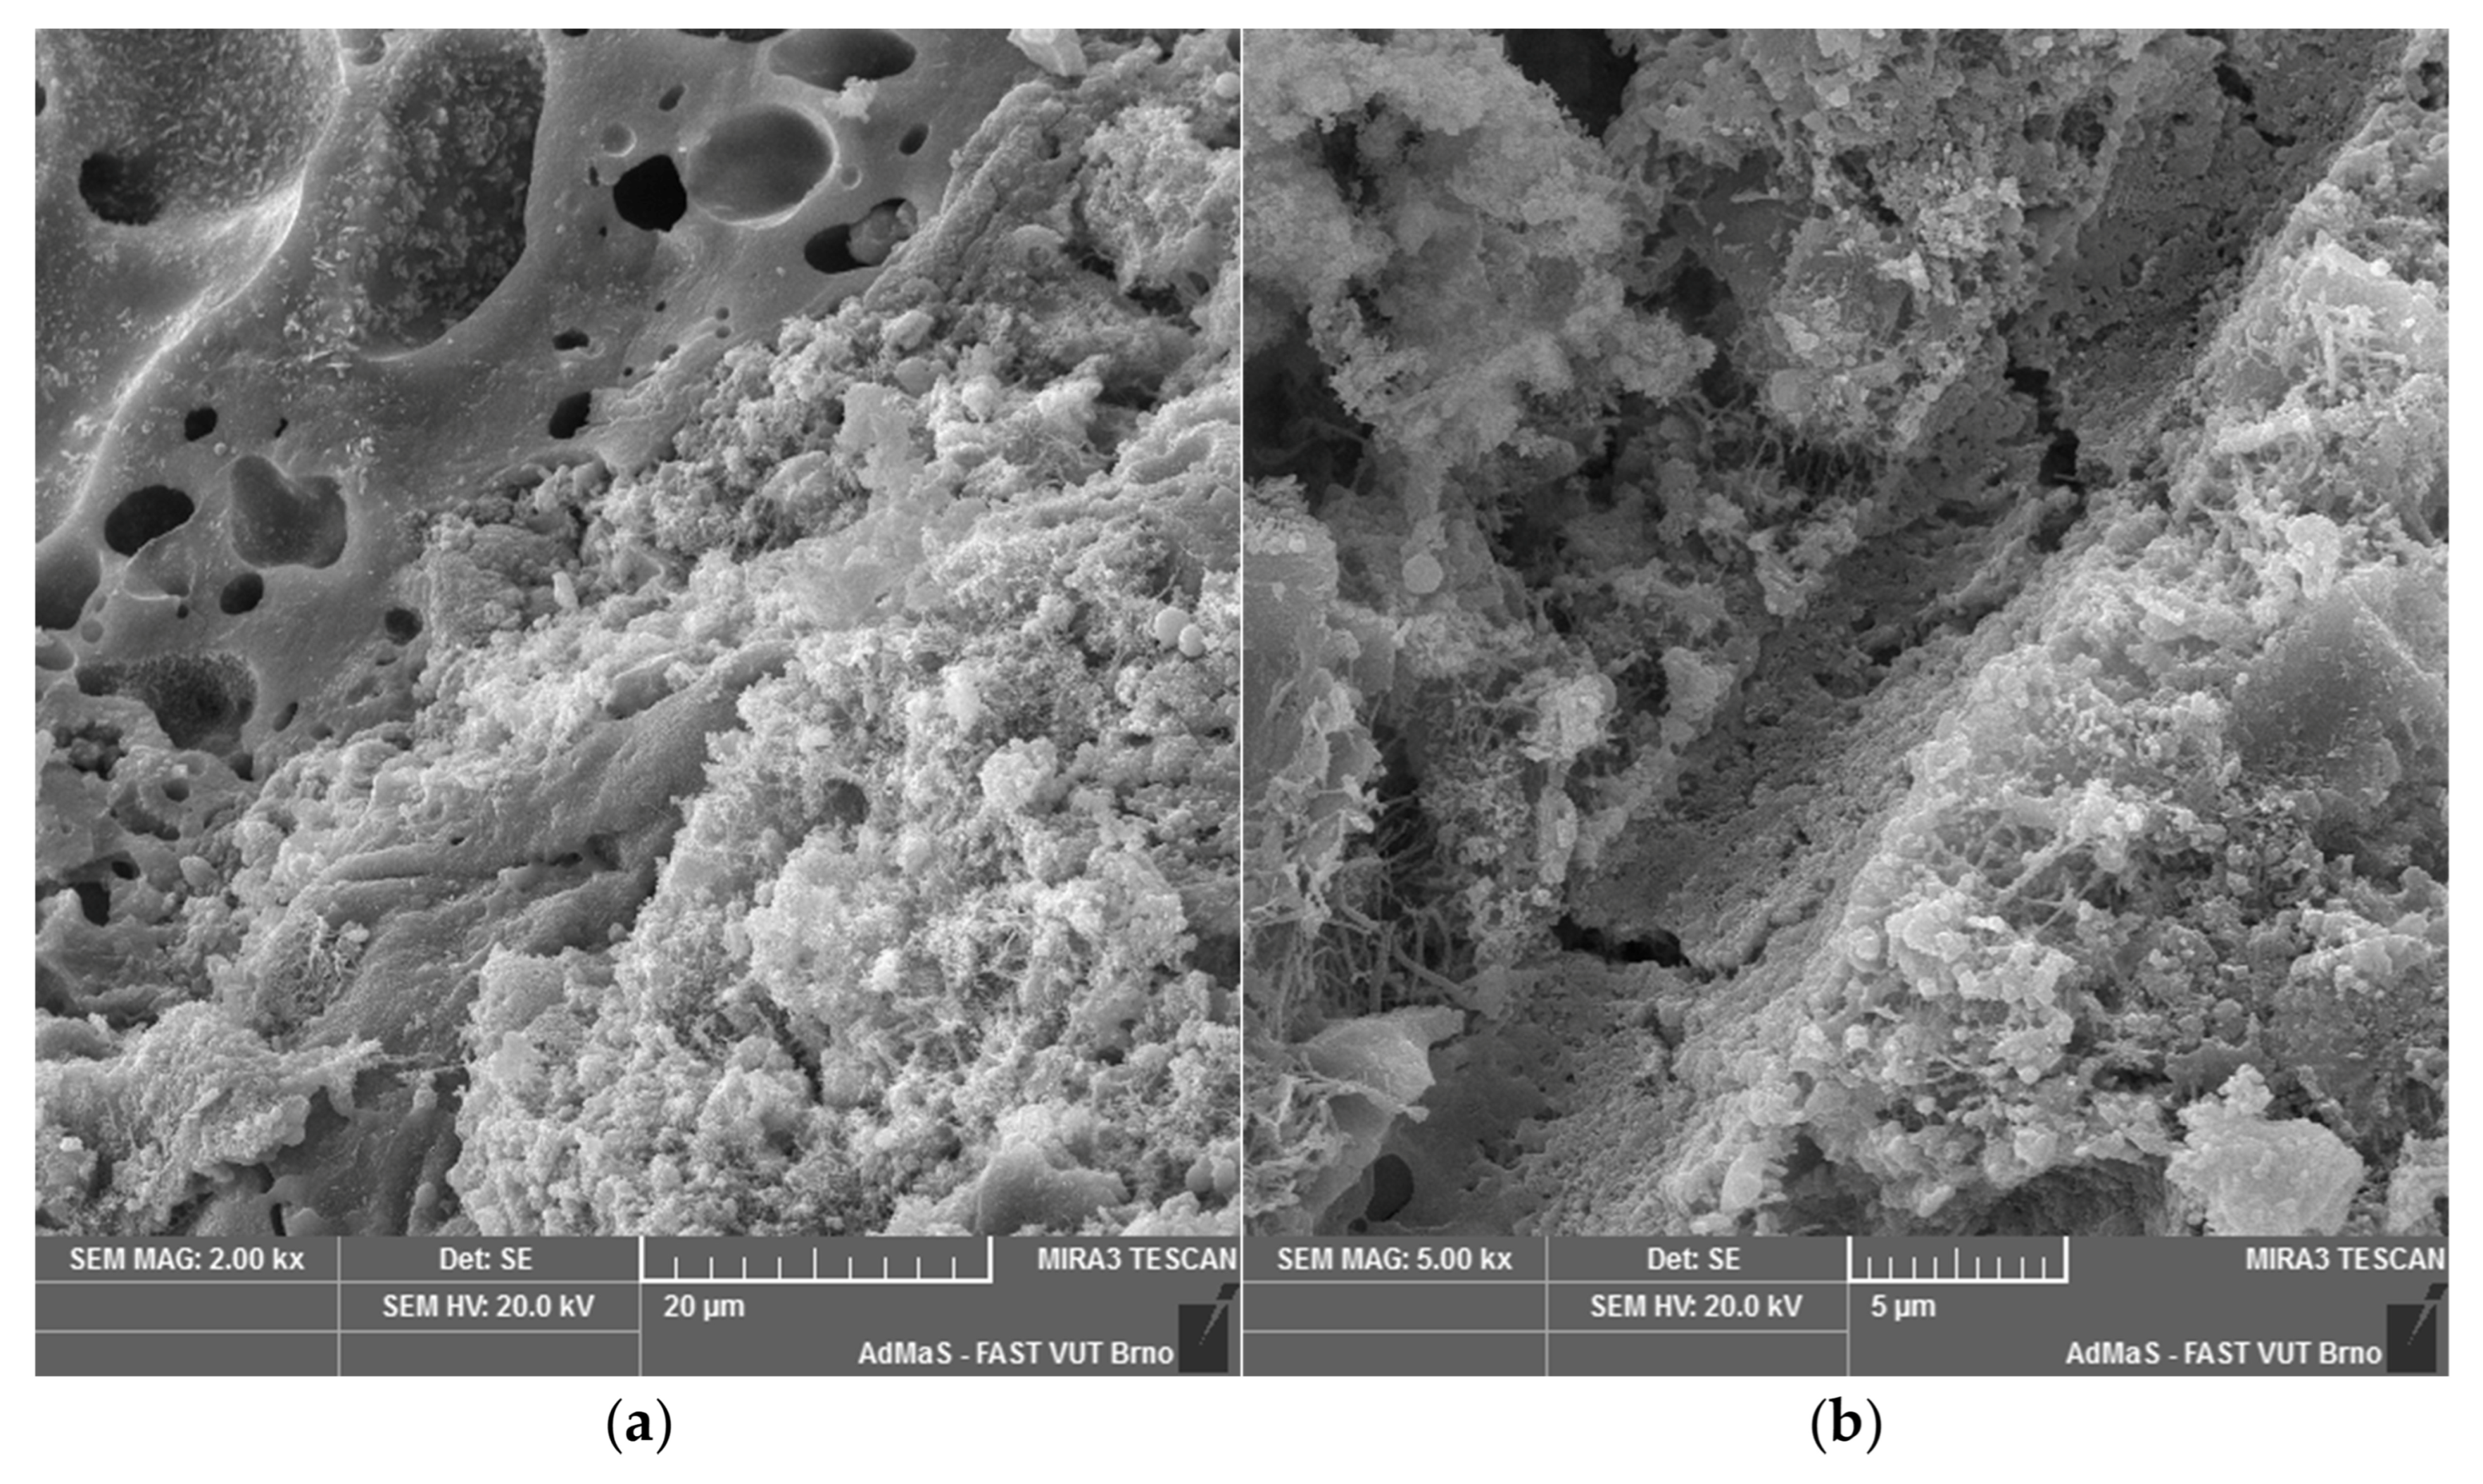
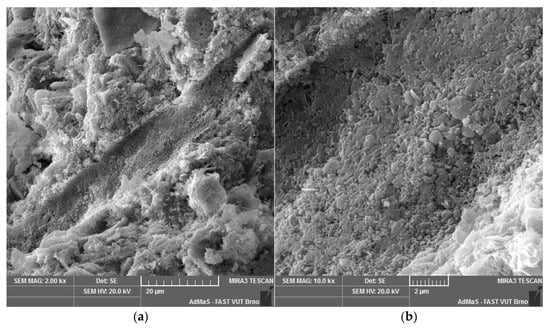
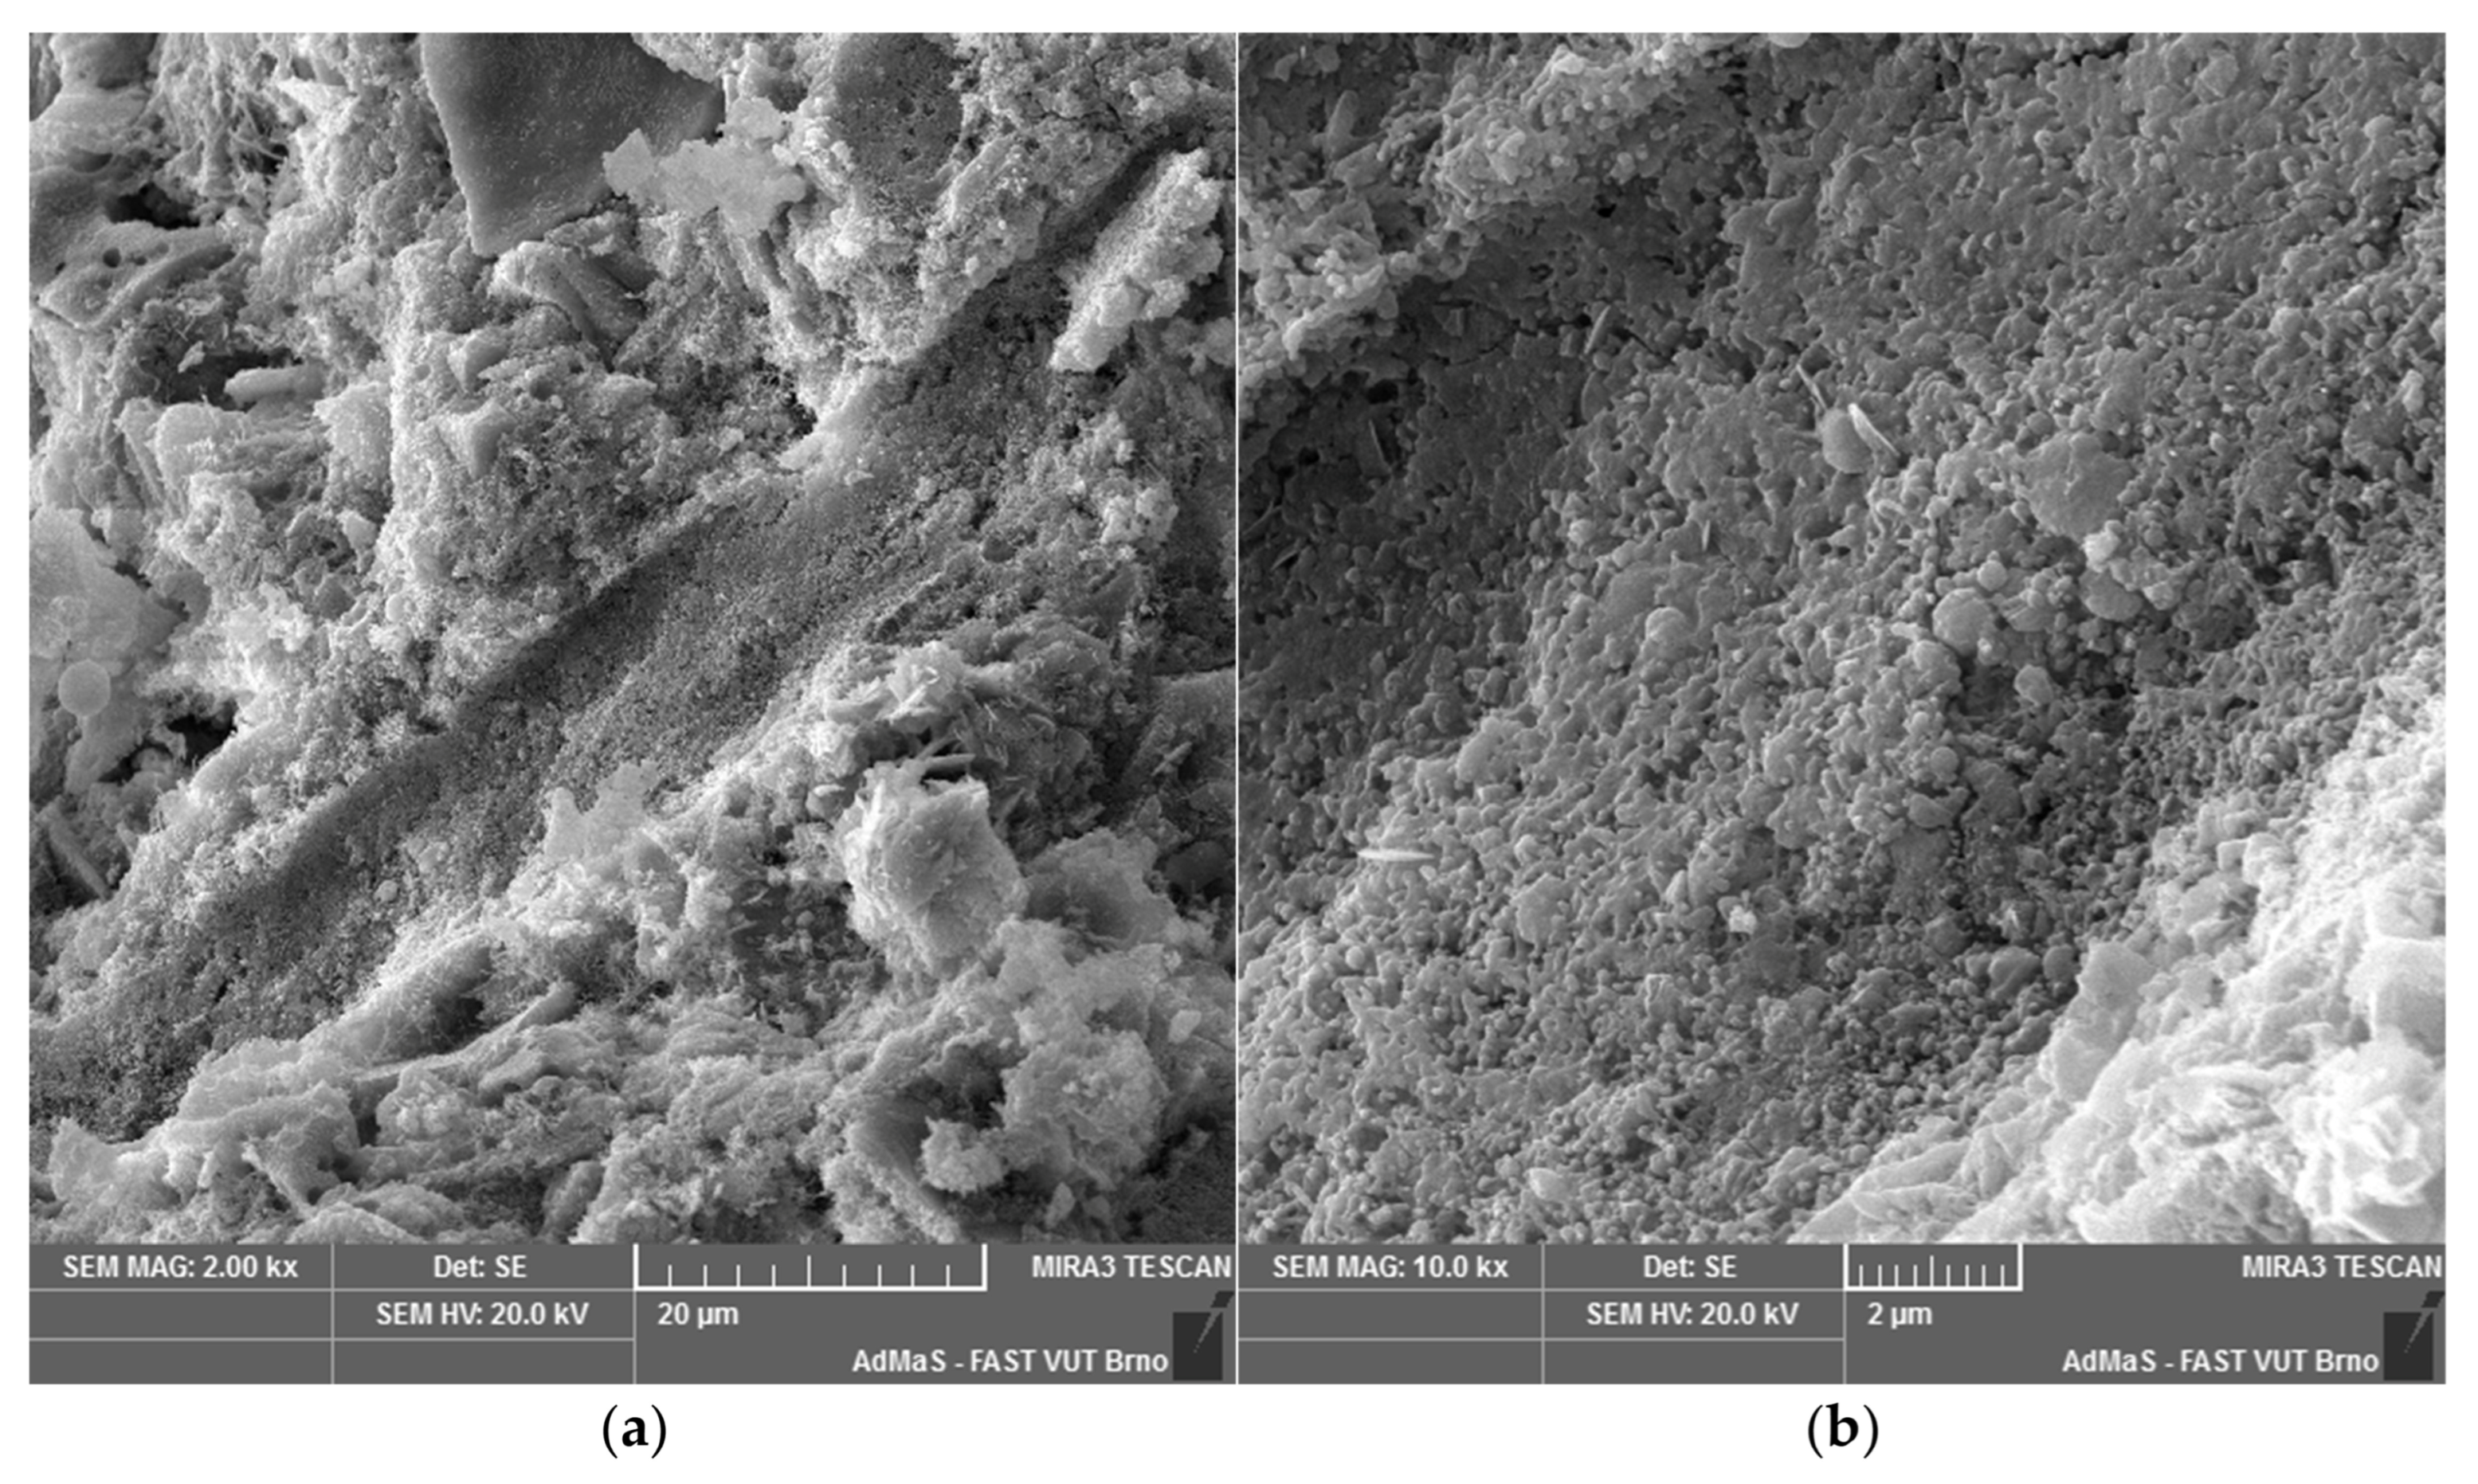
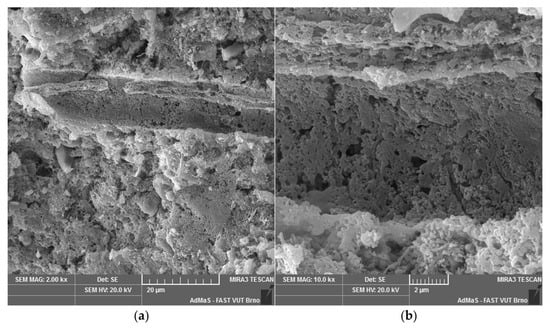
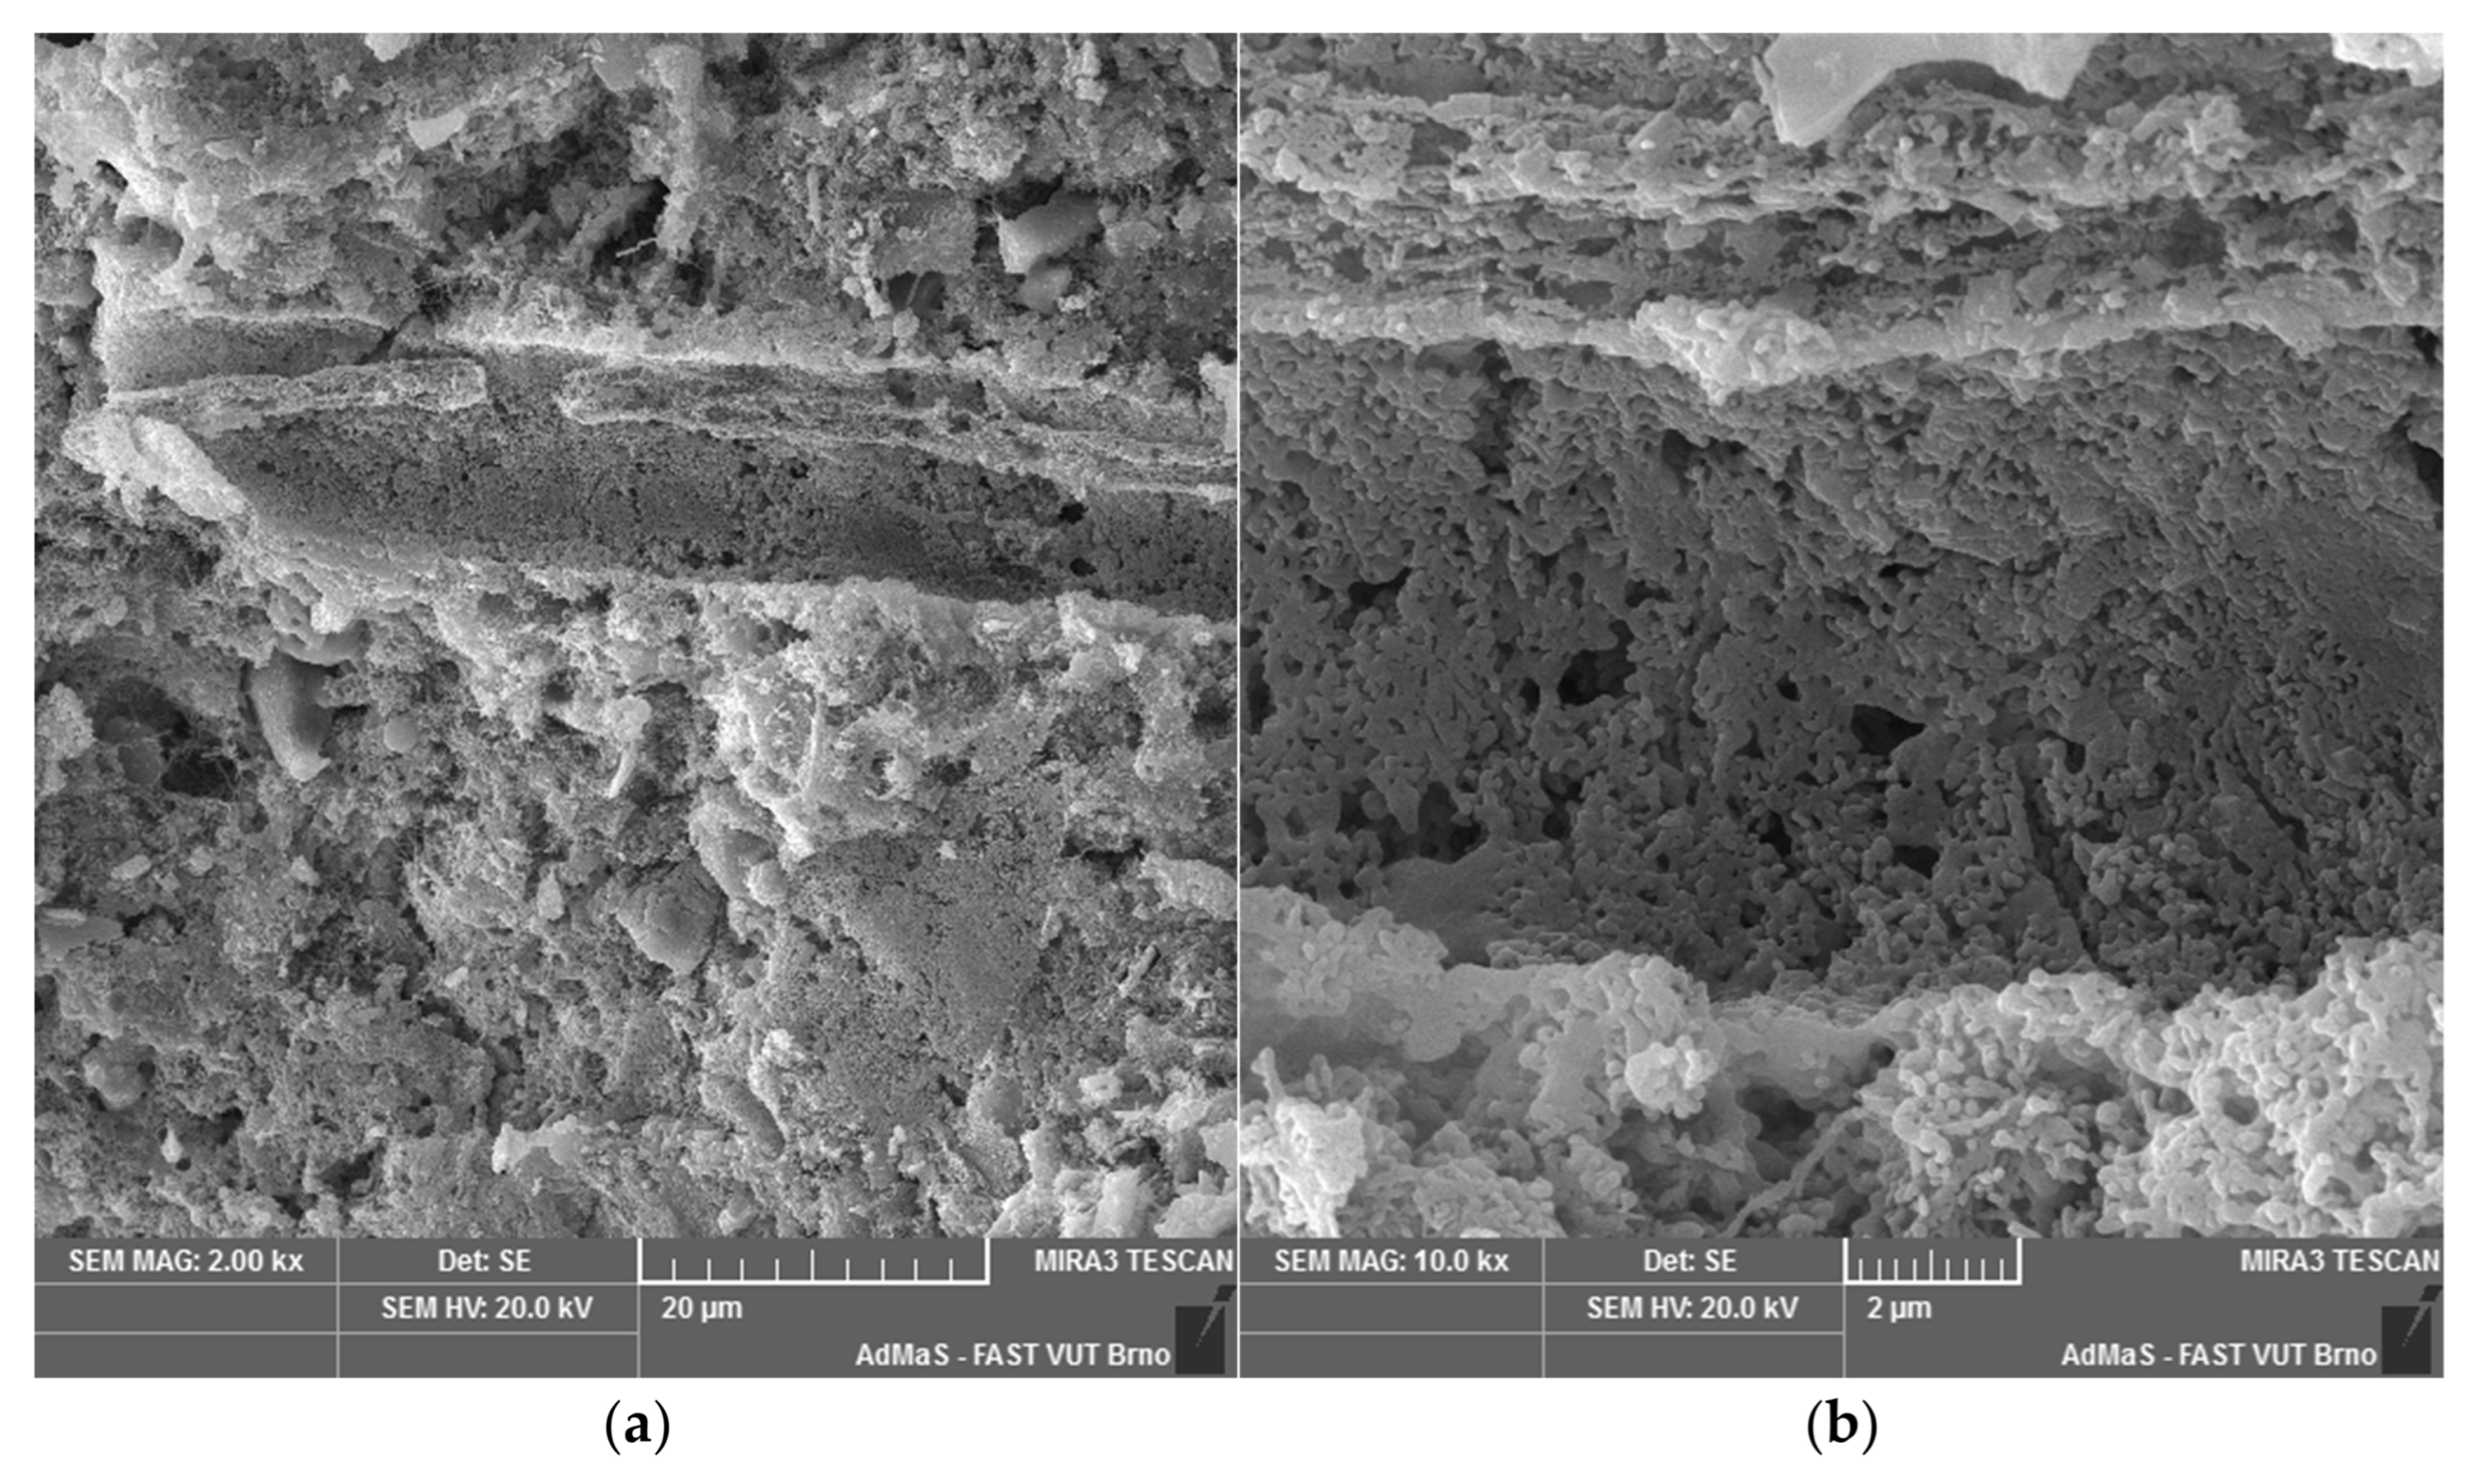
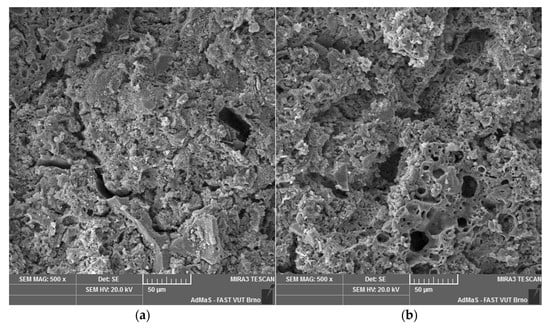
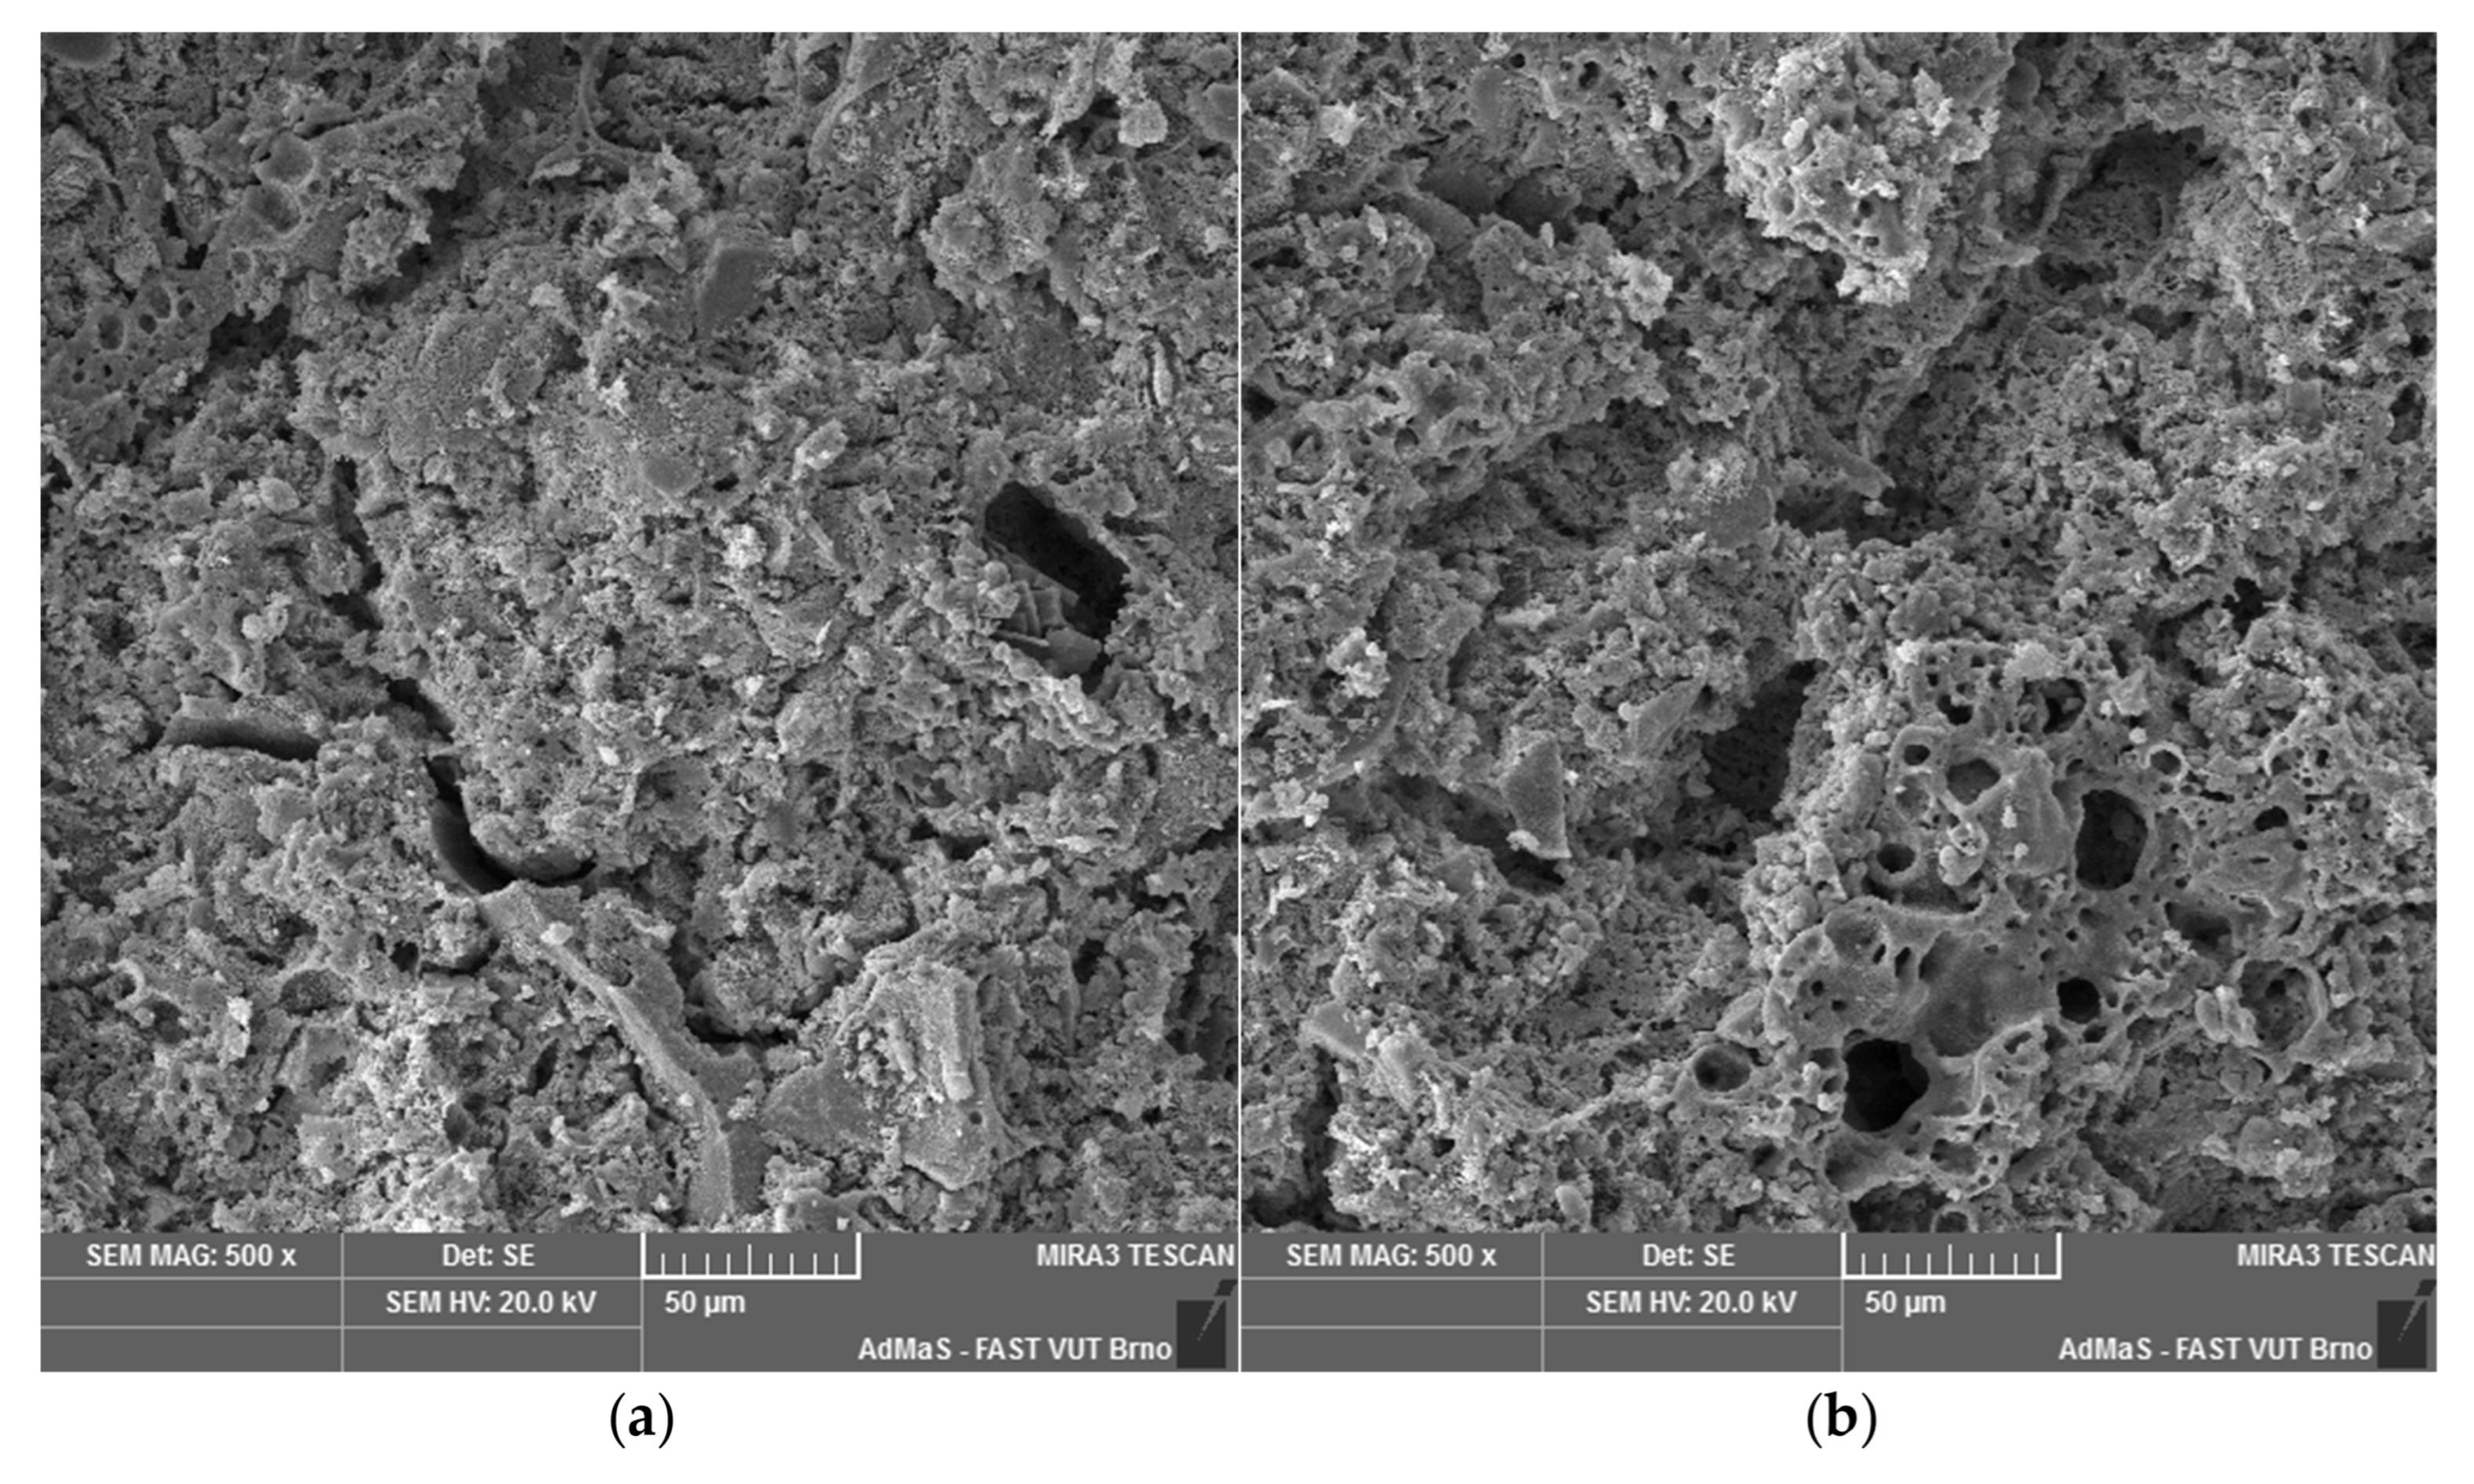
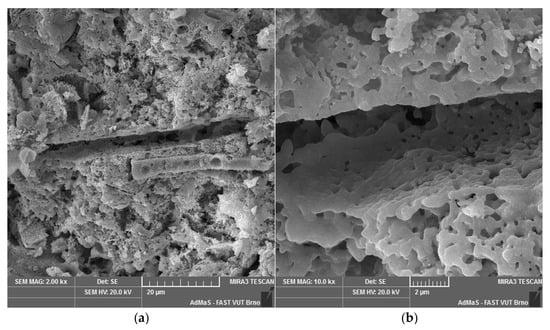
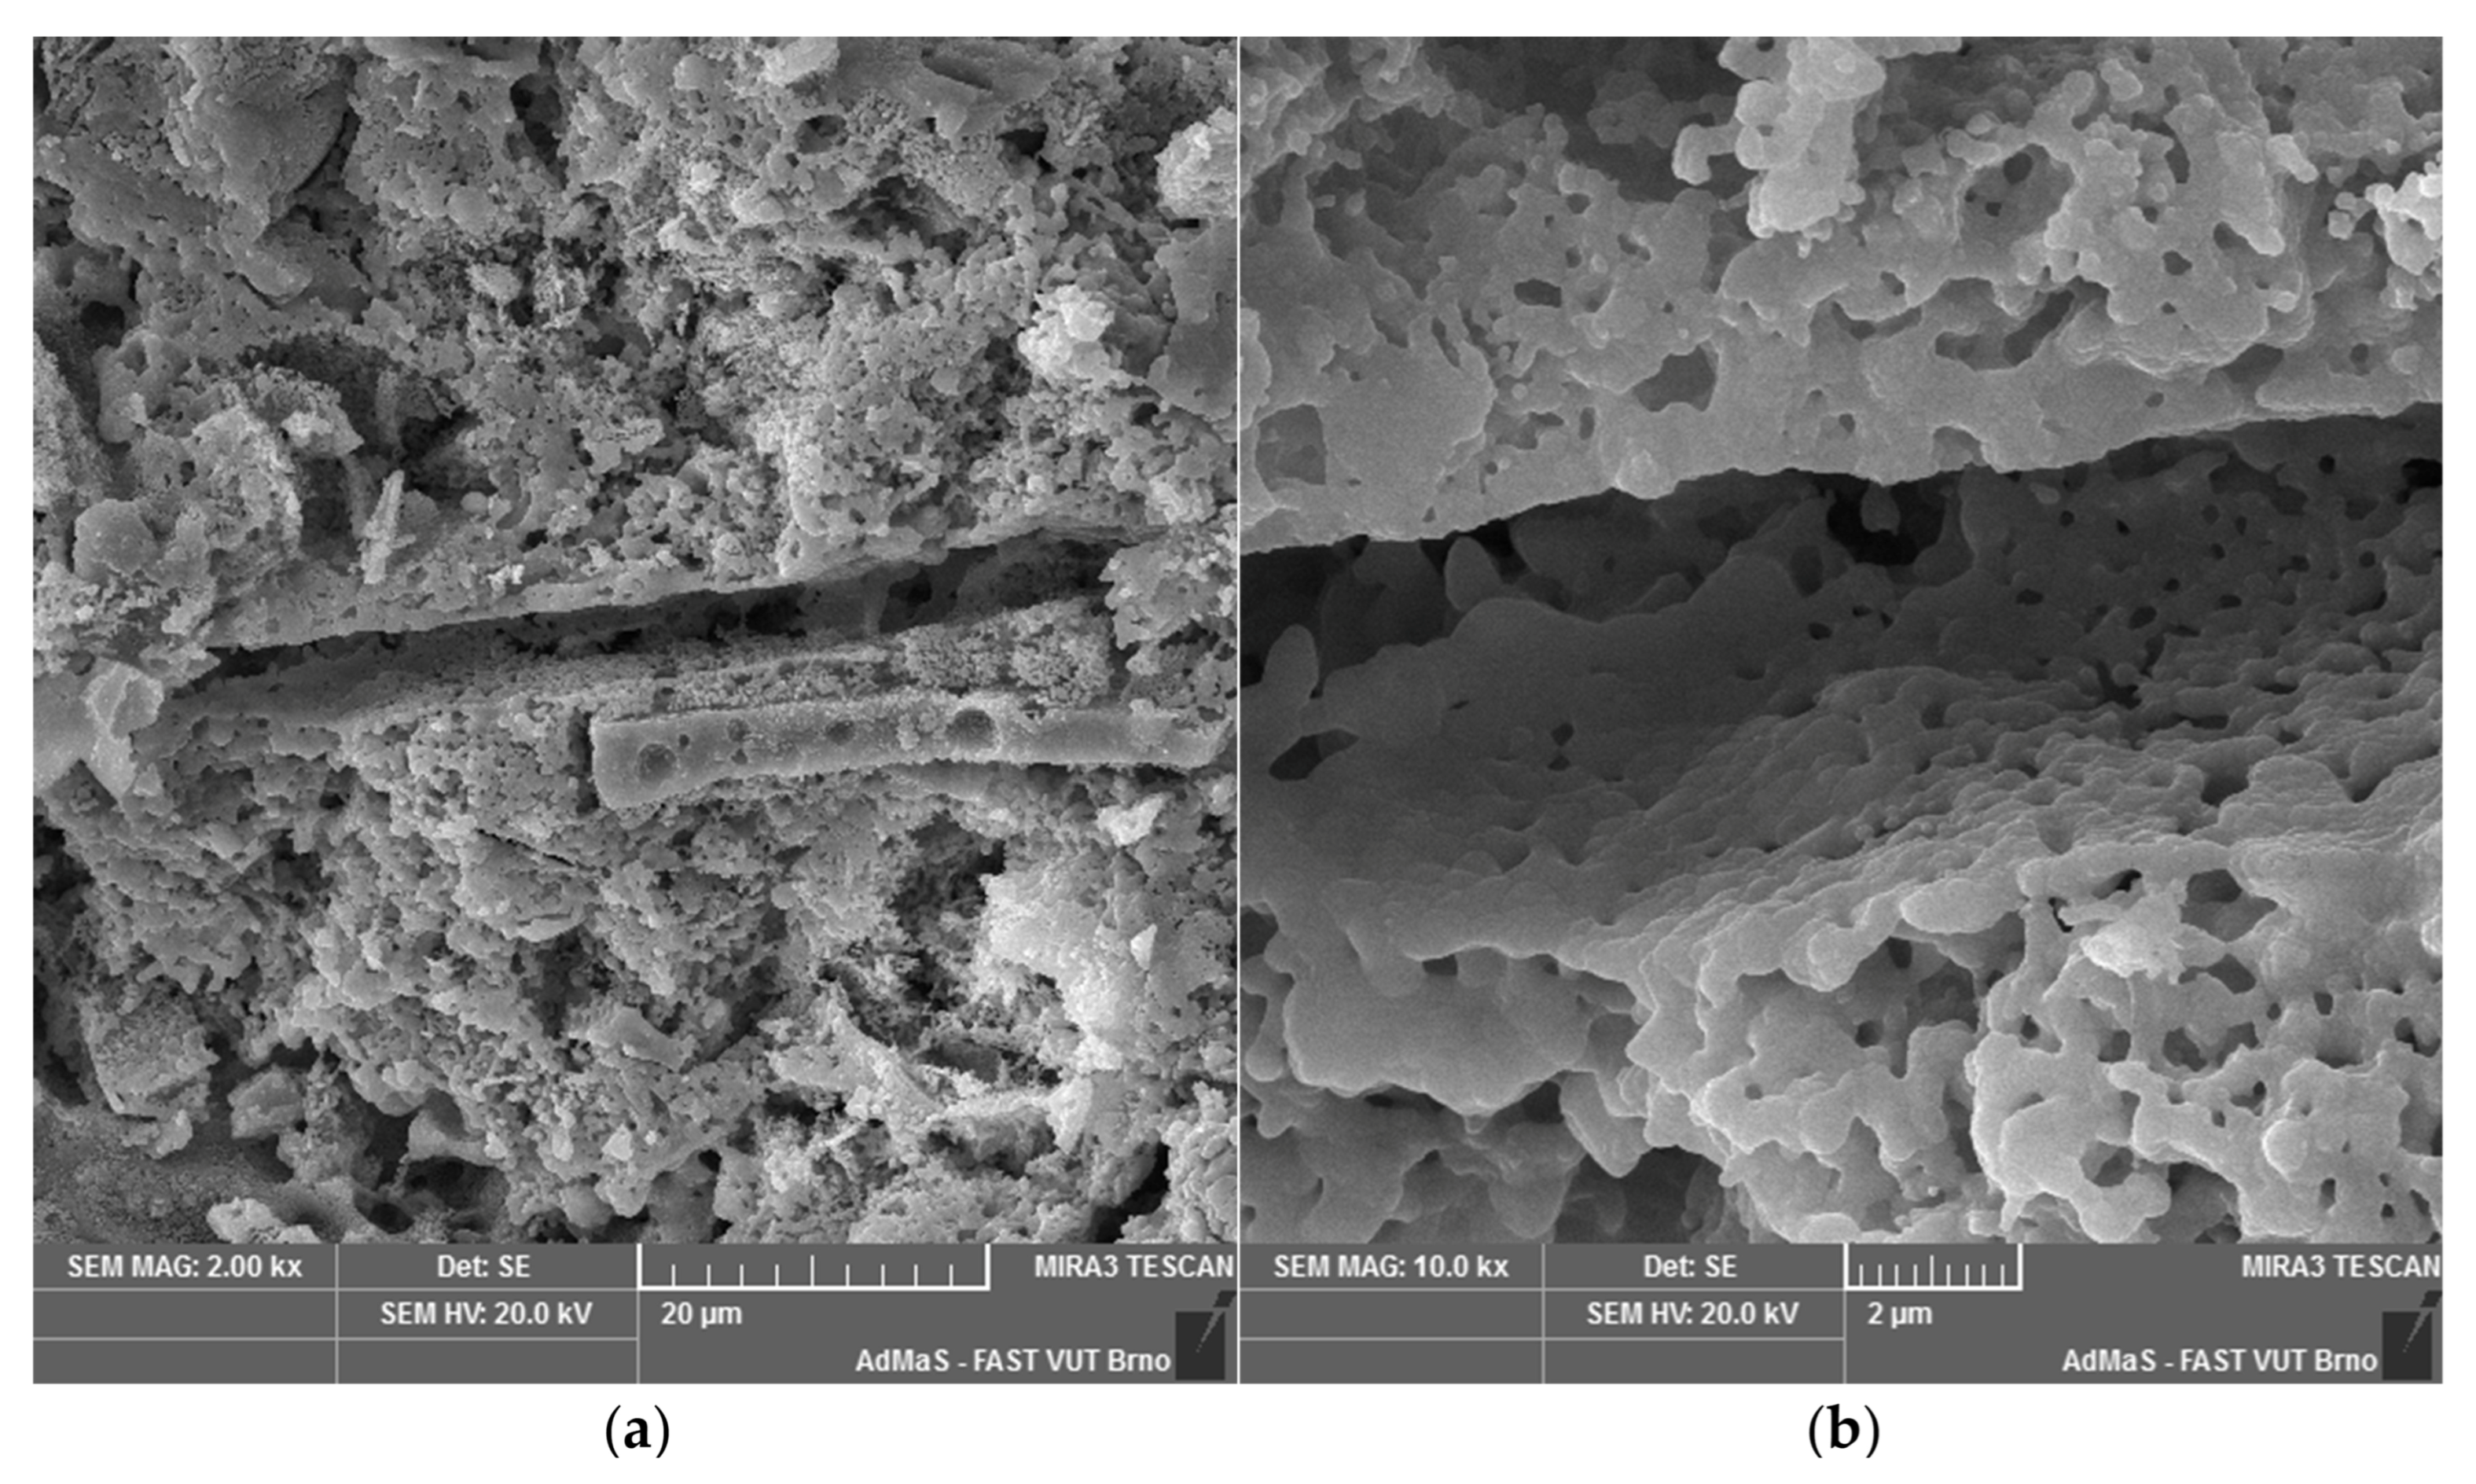
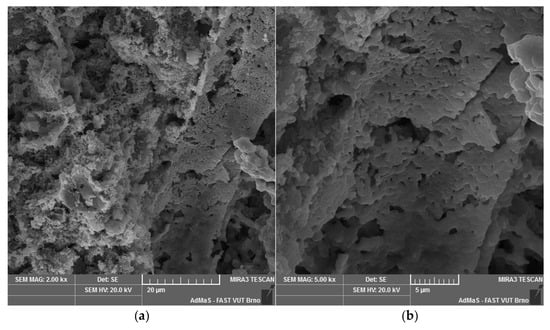
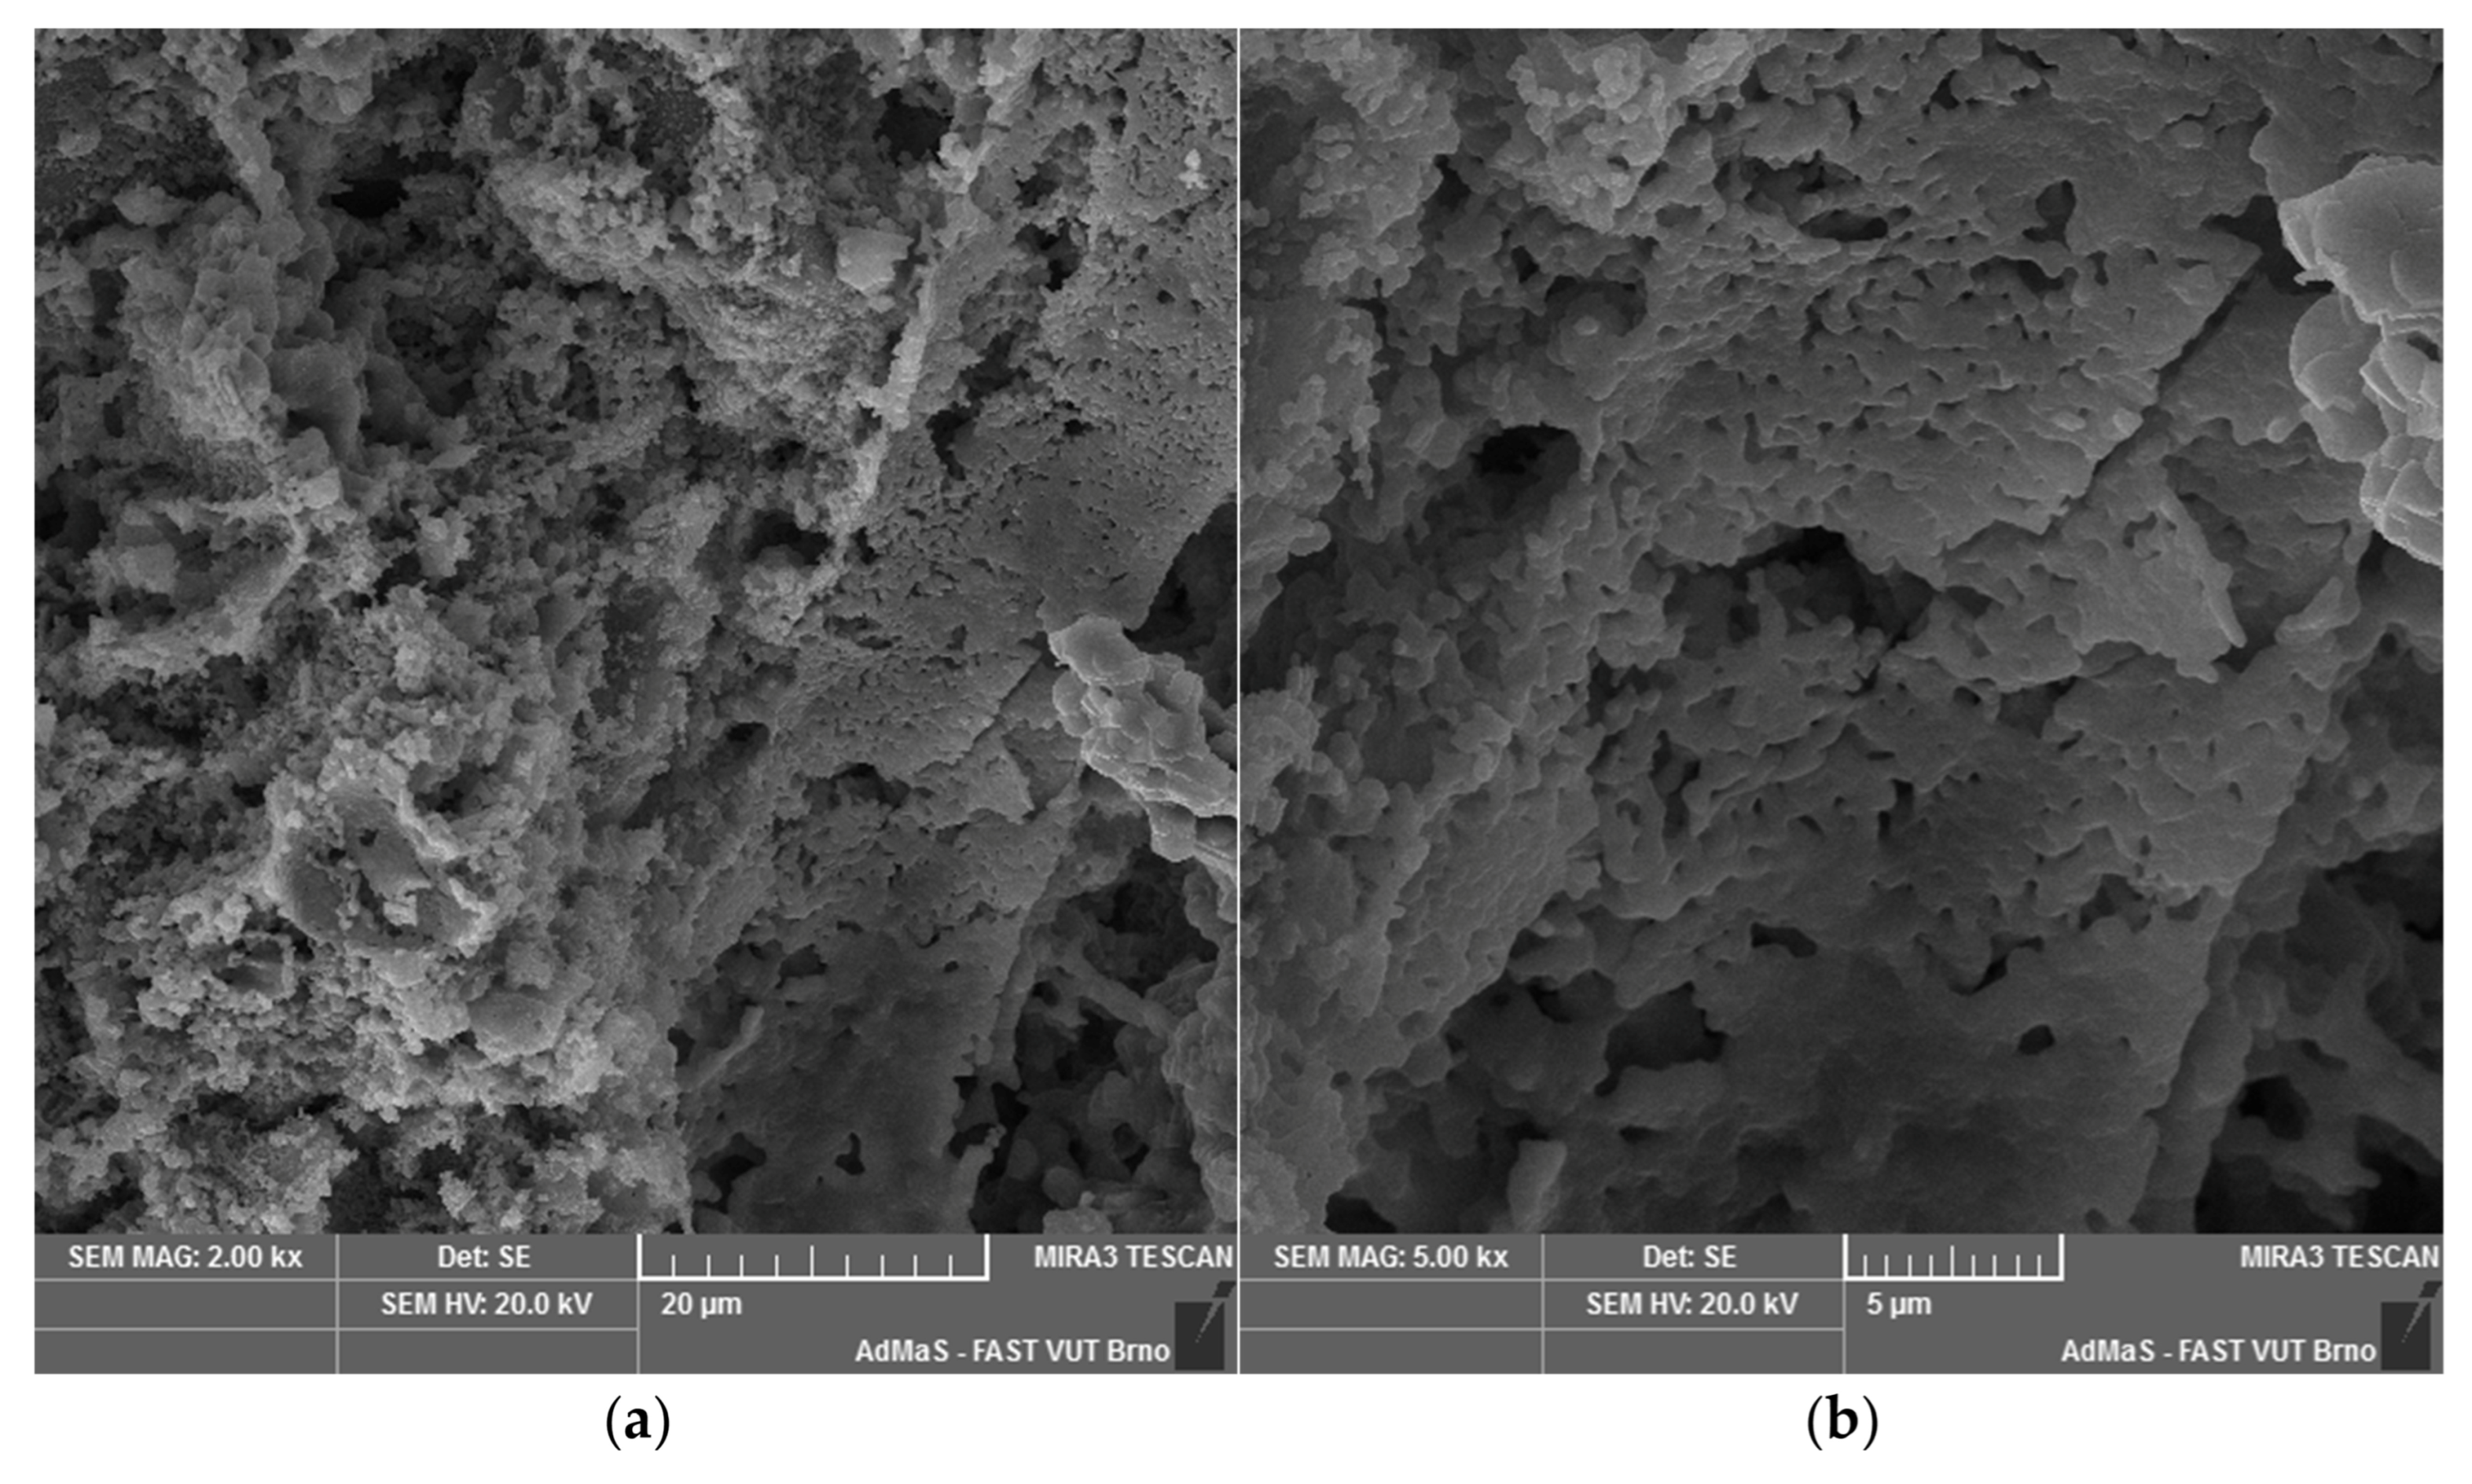

Disclaimer/Publisher’s Note: The statements, opinions and data contained in all publications are solely those of the individual author(s) and contributor(s) and not of MDPI and/or the editor(s). MDPI and/or the editor(s) disclaim responsibility for any injury to people or property resulting from any ideas, methods, instructions or products referred to in the content. |
© 2026 by the authors. Licensee MDPI, Basel, Switzerland. This article is an open access article distributed under the terms and conditions of the Creative Commons Attribution (CC BY) license.