


Abstract
With the advancement of industrial systems toward greater complexity and higher asset value, unexpected equipment failures now risk severe production interruptions, substantial economic costs, and critical safety hazards. Conventional maintenance strategies, which are primarily reactive or schedule-based, have proven inadequate in preventing unplanned downtime, underscoring a pressing demand for more intelligent monitoring solutions. In this context, intelligent spectral detection has arisen as a transformative methodology to bridge this gap. This review explores the integration of spectroscopic techniques with machine learning for equipment defect diagnosis and prognosis, with a particular focus on applications such as hydrogen leak detection and transformer oil aging assessment. Key aging indicators derived from spectral data are systematically evaluated to establish a robust basis for condition monitoring. The paper also identifies prevailing challenges in the field, including spectral data scarcity, limited model interpretability, and poor generalization across different operational scenarios. Future research directions emphasize the construction of large-scale, annotated spectral databases, the development of multimodal data fusion frameworks, and the optimization of lightweight algorithms for practical, real-time deployment. Ultimately, this work aims to provide a clear roadmap for implementing predictive maintenance paradigms, thereby contributing to safer, more reliable, and more efficient industrial operations.
1. Introduction
Modern industrial equipment is evolving toward high integration, precision, and complexity. Its systems are becoming increasingly sophisticated, and asset value has significantly increased, making it a core component of industrial production. Sudden failures in such equipment can easily trigger severe chain reactions, leading to unplanned production system shutdowns and causing substantial economic losses. They may even induce environmental pollution and production safety accidents, posing threats to socioeconomic stability and public safety.
Conventional maintenance strategies exhibit clear limitations in addressing these risks. Reactive maintenance operates as a passive response, intervening only after failures occur, making it impossible to prevent associated losses. While preventive maintenance, based on fixed intervals or operating hours, reduces unexpected failures to some extent, it still has significant drawbacks: On one hand, it may lead to premature replacement of components that have not reached their end-of-life, resulting in wasted labor and material resources. On the other hand, it struggles to effectively identify potential defects emerging between maintenance intervals, thus failing to completely prevent unexpected shutdowns. Both approaches face bottlenecks in maintenance costs, operational efficiency, and system reliability [1,2].
Given these limitations, the industrial sector urgently requires advanced technologies capable of real-time equipment condition monitoring and precise early-stage fault prediction. Intelligent spectral detection technology has emerged and rapidly developed in response to this demand, representing an inevitable trend in equipment fault diagnosis and health management. This technology captures physicochemical signals—most vibrational spectra (infrared absorption and Raman scattering spectra) and oil-related spectra—generated during equipment operation. It extracts state-specific information from scenarios like hydrogen leaks in storage cylinders, transformer oil degradation, and natural gas pipeline leaks. Combined with machine learning methods, it enables high-dimensional feature extraction, fault mode classification, and remaining life prediction.
However, despite the promising synergy between spectroscopy and machine learning, several critical research gaps remain unaddressed. Existing studies often focus on optimizing individual spectroscopic techniques under controlled laboratory settings, but lack an integrated framework that effectively combines multiple spectroscopic methods to enhance detection robustness in real-world, variable operating conditions. While machine learning models have been applied for spectral analysis, there is a significant gap in adapting these models to handle the high noise, environmental interference, and data scarcity commonly encountered in field applications. Issues such as model interpretability and generalization across different equipment types and operational scenarios are not sufficiently explored.
This paper reviews the current state of research on intelligent machine learning and spectral technologies in equipment defect and fault detection. It systematically explores how machine learning algorithms bridge raw spectral data with actionable insights—enabling enhanced prediction of aging parameters, optimized model design, and ultimately developing smarter, more efficient strategies for transformer oil condition monitoring and lifespan prediction. By critically examining the synergistic interactions among infrared spectroscopy, Raman spectroscopy, and machine learning, its application signifies a shift in equipment maintenance paradigms from traditional scheduled maintenance to condition-based predictive maintenance. This provides critical technological support for enhancing the safety, reliability, and economic efficiency of industrial system operations [3].
2. Lifespan Assessment
2.1. Key Indicator Determination
Hydrogen storage systems, as core equipment in the hydrogen energy industry chain, rely heavily on reliable monitoring and early warning of high-pressure hydrogen leaks for safety. Chauhan et al. [4] investigated hydrogen condensation-induced pipeline blockage under low-temperature conditions and storage efficiency degradation caused by adsorption/desorption reversibility imbalance at high pressures using a customized Sievert-type adsorption analysis apparatus. They also examined material interface failures, specifically how edge defects in GNP nanosheets disrupt hydrogen diffusion pathways. Identifying key leak indicators necessitates establishing a comprehensive multi-parameter, multi-physical field monitoring system. This system’s development stems from an in-depth understanding of leak mechanisms, failure modes, and safety risks. The primary direct monitoring indicator is the ambient hydrogen volume concentration, determined based on hydrogen’s flammable limit of 4% vol. By deploying sensors such as catalytic combustion, electrochemical, or TDLAS, hydrogen concentrations within storage tanks and critical connection points are monitored in real time. Primary and secondary alarm thresholds are set at 10% and 25% of the flammable limit, respectively, to provide a graded response time for risk mitigation.
Infrared spectroscopy technology can be applied to determine moisture, dissolved gases, and furfural content in transformer oil. Moisture in insulating oil is a critical monitoring indicator for oil-immersed electrical equipment. During operation, the degradation of polymer materials within transformers and the intrusion of external moisture can lead to increased water content in the oil [5]. When moisture levels exceed acceptable thresholds, the insulation performance of the equipment can be severely compromised, potentially leading to operational failures or even accidents. Abu-Siada et al. [6] developed a novel technique for detecting furfural concentration in transformer oil by measuring its spectral response. Using relatively inexpensive equipment, the ultraviolet-to-visible spectral response of the oil can be measured instantaneously. Their results demonstrated a strong correlation between the spectral characteristics of the oil and its furfural content. The study also introduced two expert-system-based approaches for estimating the relationship between spectral response and furfural concentration.
After years of operation, the internal insulating paper of the transformer will age and produce a certain amount of furfural. By analyzing the furfural content in the transformer oil, the aging degree of the internal insulation of the transformer can be diagnosed, and it can provide a scientific basis for the monitoring and residual life assessment of the transformer [7]. Feng et al. [8] provided a critical overview of important insights and advances in furfural analysis, including the production mechanism, measurement progress, production volume, stability, and distribution patterns of furfural in oil–paper systems. They also analyzed the relationship between furfural content in oil and the degree of polymerization (DP) of insulating paper. Furthermore, they proposed future research directions for furfural analysis. Oshima et al. [9] proposed a novel method for analyzing furfural content in insulating oil based on near-infrared spectral data acquired using a portable spectrometer specifically developed for this application. This approach enables on-site analysis at transformer installation sites. Wavenumbers exhibiting high correlation coefficients with furfural content were selected, and partial least squares regression was employed to construct the predictive model. The results demonstrated that furfural content can be accurately quantified within minutes using only a small volume of oil, thereby enabling rapid, in-field diagnostics with a compact portable device.
The analysis of dissolved gases in transformer oil is one of the most effective and reliable methods for identifying early latent faults in oil-immersed power transformers. Ethylene (C2H4) is one of the primary fault characteristic gases dissolved in transformer oil, and its high-precision, high-sensitivity detection—along with the detection of other fault gases such as methane (CH4), acetylene (C2H2), ethane (C2H6), carbon monoxide (CO), carbon dioxide (CO2), and hydrogen (H2)—is fundamental for dissolved gas analysis (DGA) and early fault diagnosis of transformers [10]. Tsuchie et al. [11] simulated partial discharge failures in transformer oil–paper insulation using a customized experimental system, primarily focusing on corona discharge generated by needle-plane electrode systems in mineral oil, accompanied by characteristic gases such as H2 and C2H2. Tian et al. [12] proposed an innovative method for detecting furfural in insulating oil by replacing traditional methanol extraction with a combined approach of simulation and experimentation. This method was applied to thermal aging tests involving various types of insulating paper. Experimental results demonstrated that the proposed technique exhibited good repeatability and enhanced the resolution of furfural detection, thereby offering a more efficient and practical solution for monitoring furfural content in transformer oil. Liu et al. [13] utilized the Gaussian 09W software, employing wave functions and dispersion functions based on the 6-311G basis set, to construct a robust molecular simulation model for furfural. Spectral data were preprocessed using polynomial least squares fitting. Leveraging the linear relationship between the area of the Raman characteristic peak and furfural concentration, a quantitative analytical model was developed for furfural detection in transformer oil. The model achieved an excellent goodness-of-fit (R2 = 0.997), confirming its high reliability and accuracy.
In summary, Fourier Transform Infrared Spectroscopy (FTIR) offers high sensitivity and rapid response in detecting transformer oil aging, making it well-suited for a wide range of analytical applications. However, its performance can be adversely affected by environmental factors such as humidity, potentially compromising accuracy and limiting applicability in uncontrolled conditions. Furthermore, FTIR instruments tend to be larger, more complex, and costly to maintain, requiring regular calibration and upkeep to avoid contamination. Despite these limitations, FTIR remains a highly effective solution for dissolved gas analysis in transformer oil when applied in controlled environments.
2.2. Performance Measurement
The closed-cup flash point serves as a critical indicator for assessing the fire hazard associated with electrical equipment, making its accurate detection essential for ensuring safe and stable operation. In transformer oil, a decrease in flash point typically indicates the presence of volatile combustible substances, which are often generated through thermal decomposition of the oil under high temperatures. Consequently, flash point testing serves as an effective method for detecting overheating faults in electrical apparatus. For both new equipment and oil that has undergone maintenance, this test can reveal the presence of light fractions that may have contaminated the oil. An abnormally low flash point may signify a potential fire risk or even lead to explosions. As a result, strict control standards for flash point are enforced for both in-service and unused transformer oils [14]. Unlike traditional testing methods—such as acidimetric titration or the Pensky-Martens closed cup test—infrared spectroscopy offers a non-destructive, rapid, and reagent-free alternative. Although flash point is a physical property related to volatility and cannot be directly measured via infrared spectra, studies on other hydrocarbon-based oils have demonstrated that infrared spectroscopy can be correlated with flash point using chemometric methods. For instance, An et al. [15] reported that mid-infrared spectroscopy, coupled with partial least squares regression, enabled the prediction of flash point in diesel fuel within approximately 2–3 °C of the ASTM reference value—while simultaneously estimating acidity. Similarly, near-infrared spectroscopy has been employed to model properties including flash point in heavy fuel oils with reasonable accuracy [16].
The acid value is another important chemical parameter that reflects the operational condition of transformer oil, as it is directly related to the concentration of acidic products—such as formic acid, acetic acid, and naphthenic acid—formed during the oil oxidation process. Therefore, the acid value is commonly used to characterize the aging condition of transformer oil. In fact, IR spectral features (such as carbonyl absorption bands from oil oxidation products) correlate with the oil’s acidity, enabling estimation of the total acid number via calibration models. Fang et al. [17] combined mid-IR spectroscopy with advanced algorithms (wavelet filtering, bootstrapping feature selection, and deep neural networks) to predict transformer oil acid value with high accuracy (validation R2 ≈ 0.95). Kohtoh et al. [18] collected insulating oil samples from 98 transformers and analyzed their electrical, physical, and chemical properties to evaluate the relationship between aging effects and material characteristics.
However, conventional laboratory testing methods are often constrained by limitations such as being time-consuming, requiring offline analysis, involving complex sample pretreatment, or relying on costly reagents. These limitations hinder their ability to meet the growing demand for real-time, online monitoring of power equipment. Infrared spectroscopy technology, with its advantages of rapid analysis, non-destructive testing, and potential for online implementation, presents a highly promising alternative. To date, we found no specific reports of IR-based flash point prediction in transformer oils, indicating this remains an open research area. Nonetheless, a focused review of IR methods highlights their promise for monitoring oil degradation: IR can detect chemical changes underlying acid build-up and potentially infer related changes affecting flash point, all without the need for slow or reagent-intensive standard tests. Further research and optimization of infrared spectroscopy—particularly its sensitivity and selectivity in detecting key aging indicators in complex oil matrices—are essential steps toward realizing intelligent diagnostics of transformer oil condition.
3. Infrared and Raman Spectroscopy
3.1. Infrared Spectroscopy
Infrared spectroscopy (IR) is considered the best method for green analytical chemistry [19]. It is a common method for on-line gas analysis and is widely used in many fields, such as gas logging [20], environmental protection [21,22], and mine safety [23]. Gases, such as CO, CO2, and organic gases (including CH4, C2H2, C2H4, C2H6, C3H8, C3H6, propargyl (C3H4), n-butane (n-C4H10), iso-butane (iso-C4H10), formaldehyde, and acetaldehyde can be accurately tracked within the infrared spectrum [24]. FTIR records interferograms and retrieves absorbance spectra via Fourier transformation. Figure 1 shows a schematic diagram of a typical FTIR spectrometer. Infrared radiation is split into two beams as it passes through the interferometer. These two beams propagate toward the moving mirror and the fixed mirror, respectively. As the moving mirror moves at a constant speed, the infrared radiation passing through the moving mirror accumulates a specific path difference relative to the radiation passing through the fixed mirror. Under the influence of the path difference, the two beams of radiation recombine at the beam splitter and combine to produce interference radiation. This interference radiation is then processed by the interferometer and interacts with the gas sample passing through the gas cell. Finally, the radiation is detected by the detector. However, the results of the testing equipment only meet the specified requirements in the laboratory, which does not mean that the field requirements can be met.
Figure 1.
The schematic diagram of FTIR experimental setup [25].
Currently, miniaturized spectrometers face limitations such as low detection accuracy and inadequate detection limits. Due to lower optical throughput, the SNR of pocket-size devices remain 1–2 orders inferior to bench-top FTIR. Additionally, extended operational durations can introduce variability in the detection results. Bec, K.B et al. [26] suggested that the performance discrepancies observed with mini-spectrometers may stem from increased spectral scattering, which leads to reduced stability in measurements. Consequently, precise and consistent spectral acquisition becomes particularly critical when employing miniaturized spectrometers [27]. However, in practical deployments, factors such as calibration drift, temperature/humidity fluctuations, optical contamination, sensor aging, and cross-interference can degrade detection accuracy and long-term stability; moreover, the achievable detection limits under field conditions are often worse than those obtained in controlled laboratory tests. Therefore, rigorous field validation and maintenance/compensation strategies are required before large-scale deployment.
During the long-term operation of equipment, the evolution of internal defects and the occurrence of failures are often accompanied by the generation of specific chemical substances or changes in the microstructure of critical materials. Taking transformers, a core component of power systems, as an example, when internal overheating faults occur, insulating oil undergoes thermal decomposition reactions, releasing characteristic gases such as methane and ethane. As the operational lifespan increases, the oil–paper insulation system gradually ages, during which characteristic compounds like furfural—which can indicate the extent of aging—are produced. It is worth noting that these substances directly related to equipment faults or aging possess unique molecular vibration modes, and their Raman spectra exhibit distinctive characteristic peaks. This characteristic makes them ideal indicators for online monitoring and offline diagnosis of equipment status.
3.1.1. Fourier Transform Infrared Spectroscopy
Fourier Transform Infrared Spectroscopy (FTIR) is a widely used analytical technique in both industrial and research and development (R&D) laboratories, providing valuable insights into the molecular structure of individual compounds and the composition of molecular mixtures. FTIR spectroscopy utilizes modulated mid-infrared energy to probe a sample, continuously measuring the infrared spectrum to generate reaction trend graphs. This method offers several advantages, including carrier gas-free operation, low maintenance requirements, high stability, and the ability to accurately track almost all organic gases. Georgiev et al. [28] developed an extraction method that can qualitatively and quantitatively identify oxidation products in the spectral range of 1800–1650 cm−1. This method significantly enhanced FTIR analysis, increasing sensitivity and accuracy while enabling the detection of trace amounts that would typically be beyond the scope of conventional techniques.
Qian et al. [29] proposed models based on FTIR analysis have typically relied on spectral peak identification and polynomial regression to correlate with physicochemical ageing indicators, such as interfacial tension or dielectric loss factor. In contrast, Das et al. [30] used a deep convolutional neural network (CNN) with five convolutional layers, enabling direct classification of ageing categories from preprocessed FTIR spectra. Although the total number of learnable parameters (~28.4 million) raises potential concerns of overfitting, the network structure was deliberately simplified compared to large-scale architectures, and performance was validated using cross-validation. However, that simpler modelling strategies—such as partial least squares regression (PLSR) or shallow networks—may offer more parsimonious alternatives under low-data conditions.
The proposed CNN model has inherent flexibility, allowing convolution and pooling layers to be added or removed as needed, making it highly adaptable. This contrasts sharply with existing benchmark CNN models, which lack this level of customization. Table 1 lists a comparison of all models.
Table 1.
Architectures of different CNN models [30].
Although the authors reported high accuracy, the model’s parameter scale raises valid concerns about overfitting, especially given the limited sample sizes common in spectroscopic studies. While Das et al. noted that their parameter count was lower than standard CNNs, no ablation studies were provided to justify the necessity of all layers or neurons. In comparable literature, models like 1D-CNNs for dissolved gas analysis use <50k parameters, achieving >95% accuracy without image conversion. This suggests potential redundancy in the 2D transformation approach, where simpler architectures might suffice.
Zandbaaf et al. [31] proposed a novel analytical method to calculate the breakdown voltage of transformer oil samples, a critical parameter for evaluating the safe operation of power industry equipment. In their approach, a backpropagation artificial neural network (BP-ANN) was employed as a nonlinear multivariate analysis tool, while partial least squares regression (PLS-R) was used for linear multivariate calibration. These methods were applied to determine the breakdown voltage of oil samples based on attenuated total reflectance (ATR)-FTIR spectra.
Although the application of imaging and neural network techniques has improved detection accuracy to some extent, FTIR monitoring typically requires oil samples to be removed from the transformer and analyzed under controlled laboratory conditions, thus preventing real-time monitoring. At the same time, due to the size of the equipment, the ability to detect early aging products is limited. Humidity and temperature can easily cause distortion in the long-wave region of the spectrum. Munajad et al. [32] employed Fourier Transform Infrared (FTIR) spectroscopy to investigate chemical structural changes in transformer paper aged in mineral oil. The analysis revealed that the absorbance intensity of the O–H functional group decreased with aging, while the intensities of the C–H and C=O functional groups increased over time. However, Attenuated Total Reflectance FTIR (ATR-FTIR), which has a penetration depth of approximately 0.5–3 μm, primarily captures surface chemical changes and is therefore insufficient for accurately reflecting alterations in the bulk phase structure of paper insulators. Since cellulose aging is a comprehensive degradation process, relying solely on surface data may lead to an underestimation of the actual degree of insulation deterioration. Furthermore, although FTIR can identify a range of aging products, its sensitivity to certain specific compounds remains insufficient. This is particularly evident in the detection of low-concentration aging products, especially during the early stages of oil aging [33].
3.1.2. Infrared Photoacoustic Spectroscopy
Infrared photoacoustic spectroscopy (IR-PAS) is a spectroscopic technique based on photoacoustic and photothermal effects, primarily used in gas analysis and material characterization. When a substance absorbs modulated radiation or energy, it generates a series of acoustic and thermal responses. These can be detected using devices such as microphones, thereby yielding spectral information related to the material. In the context of petroleum and natural gas analysis, if the objective is to detect a limited number of known compounds, the use of transmission wavelengths with specific optical filters offers an effective approach. Although molecular infrared absorption bands of fault gases may exhibit spectral overlap due to similarities in molecular characteristics, it is possible to select relatively distinct spectral regions to minimize interference between gases and ensure accurate detection.
Compared to traditional gas chromatography, the primary advantages of photoacoustic spectroscopy include its excellent stability, long lifespan, and the fact that it does not consume gas samples or require consumables such as carrier gases or standard gases. Additionally, it does not require preheating, offers rapid detection times, and allows for easy on-site measurements. IR-PAS can also detect dissolved gases and micro-water in oil. Dai et al. [25] demonstrated that Photoacoustic Spectroscopy (PAS) is not limited by wavelength and possesses a broad measurement range, making it particularly well-suited for the real-time detection of low-concentration gases. However, multi-gas sensing using PAS typically requires multiple lasers, each corresponding to the specific absorption characteristics of different target gases. This requirement can increase system complexity, cost, and maintenance demands. Nevertheless, PAS remains a highly promising technology for high-precision, multi-component gas detection in both laboratory settings and field applications. Infrared photoacoustic spectroscopy technology involves complex optical and acoustic components, including the design and fabrication of high-precision, resonant photoacoustic cells, which significantly increase the overall system complexity. However, achieving low-frequency resonance within constrained dimensions requires precise design and tuning. At the same time, it requires a precision resonance cavity and acoustic isolation design, which is difficult to miniaturize. Additionally, for certain gases, such as low concentrations of carbon dioxide (CO2), absorption in the mid-infrared region is weak, and the detection sensitivity may still be insufficient to fully replace conventional detection methods, such as gas chromatography [34].
During the long-term operation of equipment, the evolution of internal defects and the occurrence of failures are often accompanied by the generation of specific chemical substances or changes in the microstructure of critical materials. Taking transformers, a core component of power systems, as an example, when internal overheating faults occur, insulating oil undergoes thermal decomposition reactions, releasing characteristic gases such as methane (CH4) and ethane (C2H6); As the operational lifespan increases, the oil–paper insulation system gradually ages, during which characteristic compounds such as furfural, which indicate the degree of aging, are produced. It is worth noting that these substances directly related to equipment failures or aging possess unique molecular vibration modes, and their Raman spectra exhibit distinctive characteristic peaks. This characteristic makes them ideal indicators for online condition monitoring and offline diagnosis of equipment.
3.2. Raman Spectroscopy
Raman spectroscopy, as a sensitive and non-invasive analytical technique, relies on the interaction between light and molecular vibrational energy levels. By measuring the frequency shift of scattered light, it captures the vibrational fingerprint information of substances, enabling precise identification and characterization of molecular structures and material compositions. In the field of industrial equipment defect detection, Raman spectroscopy demonstrates significant potential due to its high specificity and non-destructive nature. Applications include quantitative analysis of aging markers in transformer oil and detection of fault-indicating gases. However, traditional Raman spectroscopy faces challenges of insufficient sensitivity in practical applications, particularly when detecting low-concentration substances. Weak signals and significant noise interference limit its reliability for online monitoring and early fault diagnosis.
To overcome these limitations, enhanced Raman spectroscopy techniques have emerged. Surface-enhanced Raman scattering utilizes the electromagnetic field localization effect of metallic nanostructure substrates to amplify signals by 104–107, significantly lowering detection limits. Cavity-enhanced Raman spectroscopy, meanwhile, employs the multiple-reflection structure of optical cavities to extend optical path lengths, achieving cumulative signal enhancement. These techniques not only compensate for the shortcomings of traditional methods but also, when combined with machine learning algorithms, further improve the accuracy and efficiency of data analysis, providing new solutions for equipment condition monitoring [35].
3.2.1. Surface-Enhanced Raman Scattering Technology
To overcome the sensitivity limitations of traditional Raman spectroscopy in identifying trace substances, academia and industry have developed and applied various Raman signal enhancement techniques to meet the demand for detecting low-concentration characteristic substances in equipment fault diagnosis. Among these, surface-enhanced Raman scattering technology is one of the current hot research and application directions. The core principle of this technology is to utilize the localized electromagnetic field enhancement effect on the surface of metal nanostructure substrates, such as nanoparticles and nanomembranes, to significantly amplify the Raman signal of target molecules adsorbed on the substrate surface. The signal enhancement factor of conventional SERS substrates can reach 104–106, significantly improving the detection limit of trace substances. Existing research has confirmed that SERS substrates prepared using gold-silver core-shell structures not only exhibit superior signal enhancement performance, with enhancement factors further increased to 107, and also address the issues of poor consistency and susceptibility to oxidation in single-metal substrates. This structure exhibits stable enhancement effects across different batches of preparation, and the core-shell structure effectively isolates the metal core from external environmental corrosion, demonstrating excellent antioxidant properties. Therefore, it shows great application potential in the quantitative detection of low-concentration aging markers such as furfural in transformer oil.
3.2.2. Cavity-Enhanced Raman Spectroscopy Technology
In addition to SERS technology, cavity-enhanced Raman spectroscopy is another important technical approach for enhancing Raman detection sensitivity. Its technical logic differs significantly from SERS, primarily by constructing a specific optical cavity structure to enable multiple reflections of the incident laser within the cavity, thereby effectively extending the interaction length between the laser and the sample, and ultimately achieving cumulative enhancement of the Raman signal. In studies targeting the detection of fault characteristic gases in transformers, the newly developed “Z-type multi-reflection cavity” design optimizes the arrangement and angles of the mirrors within the cavity, further reducing energy loss during reflection. This significantly increases the number of laser cycles and the optical path length within the cavity, achieving a breakthrough improvement in the detection sensitivity of trace characteristic gases such as methane and ethane. This provides a technical foundation for the precise identification of early-stage minor overheating faults within transformers. A comparative classification of infrared and Raman spectroscopy studies is shown in Table 2.
Table 2.
Comparative Classification of Infrared and Raman Spectroscopy Studies.
4. Data Driven
Infrared spectral data preprocessing, such as wavelet transforms implemented with digital intelligence techniques, enables the extraction of spectral features using artificial intelligence algorithms. This process involves identifying correlation patterns between spectral information and key oil characteristic parameters, followed by the development of calibration models. By employing a multivariate characterization approach based on infrared spectral analysis, an integrated framework—incorporating parameters such as furfural content, flash point, acid value, and dissolved gases—can be constructed to assess transformer oil condition. A real-time oil monitoring system that incorporates multiple characteristic parameters can enhance the fault fingerprint database and advance diagnostic technologies. Through an expert system module designed for transformer oil condition diagnosis, different oil types and conditions can be identified, thereby facilitating the construction of a fault diagnosis knowledge base. The integration of infrared spectral acquisition, extraction and mapping of spectral features, calculation of oil parameters, and oil sensing technology collectively contributes to the development of portable monitoring devices that are fully functional and intelligent in operation.
4.1. Acquisition and Organization of Data
Systematic data collecting and management form the foundation for training machine learning models, where the quality and quantity of the dataset directly affect the model’s prediction accuracy and generalization capability. By building a high-quality database, reliable data sources can be supplied for performance prediction and give scientific support for the intelligent design [36,37]. The complete and accurate data inside the database have a key role in accelerating the research and development process and decreasing experimental costs. Figure 2 shows the data-driven design process, covering important stages such as database establishment, model development, sample selection, and experimental validation.
Figure 2.
Data-driven spectral monitoring process: four steps including database establishment, model construction, sample recommendation and experimental validation.
Data sources are the basis for the construction of the database, which mainly includes experimental data and numerical simulation data [38]. Experimental data constitutes a vital component of the database, encompassing predictive results for key performance indicators of equipment inspections. These data are obtained through a standardized process with high reliability, while the performance of the machine learning model is further optimized by feature dimensionality reduction and combination. But it should be noted that, Chemical data obtained must be from the same sample population, which provides the multivariate spectral domain data to be analyzed. Numerical simulation data is an important supplement to experimental data. Optimizing the spectral database—for example by standardizing acquisition protocols (instrument type, spectral resolution, path length, temperature), recording rich metadata, performing quality control and outlier screening, concentration ranges, and maintaining consistent preprocessing pipelines—can reduce spurious correlations between spectra and confounding variables. Such curated datasets improve model robustness and generalization and facilitate fair benchmarking and transfer learning across instruments and sites.
4.2. Data Processing and Feature Optimization Strategies
4.2.1. Data Processing
Data preprocessing is a critical step in machine learning studies. It involves cleaning, transforming, and organizing raw data to make it more suitable for model training and prediction, thereby enhancing the efficiency and robustness of the algorithms. The data used for training often consist of multidimensional features, such as experimental inaccuracies, environmental effects, and cross-scale parameter variations. These factors impose stringent requirements on data handling and standardization. The preprocessing steps primarily include noise removal, baseline correction, and other procedures. Methods like moving average filters (MAF) and wavelet transform-based approaches (e.g., discrete wavelet transform with K-means clustering) detect and correct stochastic spikes without distorting genuine spectral features. For instance, wavelet methods achieve multi-scale decomposition, isolating noise while preserving critical vibrational bands [39]. Scattering effects from sample heterogeneity can introduce multiplicative and additive errors. MSC models scattering as a linear transform of a reference spectrum, while SNV normalizes each spectrum to zero mean and unit variance. These methods are effective in NIR spectroscopy for biomass analysis, achieving R2 values up to 0.944 for property prediction [40]. To address these challenges, filtering algorithms and wavelet transforms are employed to reduce noise in the raw data, improve the signal-to-noise ratio, and ensure data authenticity and stability.
To address the issue of missing data, methods like linear interpolation or K-nearest neighbor interpolation are used to effectively fill gaps, thereby minimizing model deviation caused by incomplete data. Furthermore, differences in the order of magnitude between performance indicators can cause large fluctuations in model convergence and robustness. By applying normalization or standardization techniques, the data scale can be unified, significantly improving the training efficiency and stability of the model.
Statistical analysis and machine learning-based anomaly detection algorithms can be employed to identify and correct outliers that may otherwise compromise the training process. This approach significantly enhances the reliability and consistency of the dataset. Systematic data preprocessing not only reduces noise and errors but also provides more trustworthy input for predictive models assessing transformer oil performance under variable conditions. As a result, this procedure establishes a robust foundation for subsequent intelligent system design, substantially improving the model’s generalization capability and predictive accuracy.
4.2.2. Feature Extraction
A critical phase in enhancing the performance and efficiency of machine learning models involves extracting salient features from large volumes of raw data and deriving meaningful information from them. In practical application scenarios, complex elements such as spectral reference peaks, compositional fractions, and environmental factors often influence performance-related data. Dimensionality reduction and feature extraction methods can be employed to significantly improve model performance. For instance, to capture core features reflecting oil condition, key information—such as characteristic spectral bands—can be extracted from the spectral data, while oil properties including flash point and acid value can be incorporated as essential indicators.
Following the process of selecting features, such as the model-based or correlation analysis, which are used to evaluate feature significance, can remove unnecessary variables and keep the most important features in the process. Data noise and computing difficulty are decreased by this procedure. Furthermore, there might be hazy data with high dimensions in an attempt to increase the likelihood of overfitting. Principal component or linear discriminant methods for reduction of dimension are two dimensionality reduction approaches; however, they may also be used to reduce data dimensionality; nevertheless, this information is kept important information. Moreover, the use of multimodal feature fusion approaches might integrate data from many different kinds of data in an attempt to increase the model’s capacity for prediction and generalization.
5. Machine Learning
The use of infrared spectroscopy for the study of transformer oils and detection in recent times, machine learning, has gotten more and more significance. Although it might be difficult to interpret complicated spectrum data, IR spectroscopy is very helpful in explaining the chemical components of transformer; nonetheless, it also gives us useful information about the chemical contents of transformer oils. The use of machine learning algorithms to solve this issue works well. The model can learn the spectral characteristics associated in different states by training a neural network and a large dataset of tagged infrared spectral data in a machine learning model.
Once trained, the machine learning model can quickly and accurately classify the state of new, unknown infrared spectra from transformer oil and predict key parameters, such as hydrogen concentration, moisture content, acid value, and other critical indicators. This not only enhances the efficiency of the detection process but also significantly improves its accuracy. As a result, machine learning helps identify potential issues in a timely manner, ensuring the safe and reliable operation of transformers and contributing to the overall stability of the power system. Figure 3 illustrates a data-fusion workflow that integrates spectroscopic signals (IR/Raman spectra) with auxiliary operational parameters as inputs to machine-learning models for condition monitoring and fault diagnosis.
Figure 3.
Data-fusion workflow integrating spectroscopic signals and auxiliary physical/operational parameters for ML-based condition monitoring [35].
The shift toward non-destructive testing of equipment, is transforming the support infrastructure with smart sensors and advanced technologies. This transition aims to eliminate the need for extensive maintenance and the labor-intensive tasks of traditional wiring and electrical equipment setups [41,42]. With the rapid development of the Internet of Things (IoT)and cloud networking systems, intelligent detection technology has become a global trend. The key advantage of this approach is its ability to offer value-added services through remote control, intelligent operations, and efficient diagnostic and maintenance methods [43,44].
On the basis of Fourier-transform mid-infrared (FT-MIR) spectra, Xiao et al. [45] applied various preprocessing methods (including Savitzky–Golay smoothing and automatic peak finding) to extract the sum of feature-peak areas. They then constructed quantitative aging-degree models for equipment using both partial least squares regression (PLSR) and particle-swarm-optimized support vector regression (PSO-SVR). The SG + PLSR model achieved R2 = 0.9913, MAE = 0.2880, and RMSE = 0.3790, while the SG + PSO-SVR model attained R2 ≈ 0.9814, MAE ≈ 0.3124, and RMSE ≈ 0.0977, demonstrating the effectiveness of IR spectra combined with simple ML models for aging assessment.
Sim et al. [46] integrated PLSR with FTIR spectroscopy to predict moisture content in locally accessible transformer oils and lubricants. Oil samples, spiked with known concentrations of moisture, were extracted using acetonitrile and analyzed with an FTIR spectrophotometer. The study also highlighted alternative methods for moisture determination: the coulometric Karl Fischer method, which is effective for moisture contents ranging from a few ppm to <1–2%, and the Kittiwake method, which is more suitable for concentrations below 1000 ppm, with a detection limit of 500 ppm. In contrast, the FTIR method, employing a solvent extraction strategy, is recommended for detecting moisture at concentrations above 700 ppm. This provides a reference for detecting varying extraction concentrations.
The AI-based HI model was compared against the traditional score-weighted HI method, which serves as a reference. The final Random Forest (RF) model showed the best performance, achieving an accuracy of 97.3%. As illustrated in Figure 4, the AI algorithms were evaluated, and the best performing model was selected. Additionally, the impact of missing data on the accuracy of the traditional SW method and the AI-based HI model was assessed by simulating 50 missing data scenarios. To improve the robustness of the AI model, a preprocessing method was proposed to enhance its ability to handle missing data and provide accurate HI values.
Figure 4.
Flowchart of the Artificial Intelligence-Driven Methodology for Assessing Equipment Health Index under Data Uncertainty Conditions [47].
As shown in Figure 4, the assessment data are used to calculate the equipment insulation system HI using the conventional Scoring-Weighting (SW) method. At the same time, data are used to establish the AI-based HI method. The performance of various AI algorithms is compared to identify the best performing AI algorithm through comparison with the SW method as a reference. The effect of unavailable data on the accuracy of both conventional SW and the identified best performing AI-based HI is evaluated by adjusting the complete data into 50 missing data scenarios. A preprocessing approach is then proposed to enhance the ability of the AI-based HI model to deal with such unavailable data and provide an accurate HI value [47].
Wan et al. [48] developed a two-step ML framework combining classification and regression models to analyze SERS spectra of furfural across concentrations ranging from 0.01 mg/L to 4.0 mg/L. The dataset comprised 450 spectra collected from 15 concentration levels, preprocessed using adaptive iteratively reweighted penalized least squares and smoothed to reduce noise. Feature extraction was performed via Competitive Adaptive Reweighted Sampling, which identified 55 critical spectral variables. The ML framework achieved 100% accuracy in classifying aging stages using Kernel-SVM and KNN algorithms. Regression models within each stage exhibited an average R2 of 0.9953 and RMSE below 10−2, outperforming traditional univariate calibration methods which struggled with overlapping spectral features in complex oil matrices. This approach highlights ML’s capacity to handle nonlinear relationships and enhance quantitative precision in real-time monitoring.
In hydrogen-system monitoring, Raman-based approaches enable non-contact quantification of hydrogen-related signals. Jeon et al. [49] investigated long-range hydrogen gas measurement for Raman lidar sensor development and evaluated measurements over meter-scale distances, demonstrating the feasibility of remote hydrogen monitoring in safety-relevant scenarios. In addition, Jander et al. [50] developed a Raman-spectroscopy calibration approach to determine dissolved hydrogen concentration in liquid organic hydrogen carrier systems across wide temperature/pressure ranges, reporting an average absolute deviation of 0.009 when transferring the calibration to another setup. These studies highlight that robust quantitative monitoring often relies on regression/calibration models and careful spectral preprocessing, especially when hydrogen-related features are weak or embedded in complex backgrounds. For multi-component mixtures with severe spectral overlap, chemometric/ML regression such as partial least-squares regression can improve calibration accuracy compared with conventional multilinear regression [51].
In summary, spectral detection is influenced by various interfering factors, such as scattering, reflection, and interference, highlighting the necessity for advanced data analysis methods, particularly artificial intelligence (AI)-based algorithms, to mitigate these interference contributions and convert spectral signals into meaningful information [52]. Accurate, rapid, and real-time monitoring is the most important development and demand for transformer oil aging assessment. By combining and thoroughly examining multi-sensor data, AI algorithms allow for the accurate identification of important characteristics associated with the aging of transformer oil. Machine learning models, which take into consideration the complicated interactions between different components, can precisely determine the mapping relationships between indicators and the extent of aging. Additionally, these algorithms are optimized for great computational efficiency by deep learning methods that can quickly process massive amounts of data, which greatly shortens the amount of time needed for analysis. AI may offer real-time feedback and quick alerts when combined with online monitoring systems, which can address the drawbacks of conventional detection techniques that require extended cycles. This method facilitates real-time data reception as well as dynamic assessment updates via IoT connectivity and enables continuous monitoring. Table 3 summarizes the overview of different scholars’ research on deep learning. Table 4 summarizes the specific applications of mixture analysis combining chemometrics and deep learning methods.
Table 3.
Overview of existing research on spectrum analysis based on deep learning.
Table 4.
Reported performance metrics of deep-learning-assisted spectroscopic analysis in representative studies.
6. Issues and Challenges
Although current spectroscopy technologies continue to face a number of challenges in practical applications, these issues primarily stem from both the intrinsic limitations of molecular vibrational absorption mechanisms and the physical constraints of the technology itself. Infrared spectroscopy operates based on the principle that molecular vibrations must be accompanied by a change in dipole moment to be detected. As a result, symmetric molecules that do not exhibit dipole moment changes during vibration are difficult to detect. Furthermore, infrared detectors are susceptible to ambient thermal radiation due to their reliance on thermal effects, introducing background noise—especially in the long-wave infrared region—where the signal-to-noise ratio is significantly reduced. Additionally, limitations such as inadequate lower detection limits persist. In response to these challenges, numerous studies have proposed solutions, including the integration of multiple spectroscopic techniques with mutual cross-validation to compensate for the respective weaknesses of individual spectral methods.
6.1. Near-Infrared (NIR) and Mid-Infrared (MIR)
The integration of NIR and MIR spectroscopy offers comprehensive detection capabilities, ranging from macroscopic to molecular-level analysis, by leveraging their complementary spectral ranges, penetration depths, and analytical strengths. NIR spectroscopy is particularly well-suited for the rapid screening of large-volume samples due to its high scanning speed and deep penetration ability, whereas MIR spectroscopy enables precise structural identification at the functional group level through fundamental frequency vibrational analysis.
Mo et al. [58] developed a photoacoustic (PA) C2H4 detection system based on a combination of mid-infrared thermal radiation sources and near-infrared lasers. Excitation radiation from the two wavelength bands is incident on a non-resonant PA unit. By switching between the thermal radiation source and the laser source, the interference level of SF6 on C2H4 detection was evaluated. The impact of SF6 on the detection of dissolved C2H4 gas in oil was clarified. Liu et al. [59] employed a combination of NIR and MIR spectroscopy to rapidly quantify the primary active constituents—Astragaloside IV and total astragalosides—in Astragalus membranous. A quantitative calibration model was established using partial least squares regression (PLSR), and the results demonstrated that the combined NIR-MIR model outperformed the individual NIR or MIR models in prediction accuracy. These studies underscore the complementary value of NIR and MIR techniques in chemical and biological analysis. Similarly, Nepper et al. constructed both PLS regression and PLS discriminant analysis models using NIR and MIR data. The NIR models generally outperformed the MIR models in terms of predictive accuracy and sensitivity to outliers. Specifically, the NIR-based regression model accurately predicted the levels of glucose, alginate, root bark tannins, and carbon content, while the discriminant model effectively identified the geographical origin of Wellington seaweed samples. These findings further highlight the potential of NIR and MIR spectroscopy as reliable tools for biomass grading and provenance determination in natural product analysis [60]. It can be seen that the combined use of near-infrared and mid-infrared in transformer testing is currently not very common, but there are still specific scenarios where it can be useful. Existing technologies have mature testing methods in the fields of medicine and chemistry. This provides engineering reference value for future technological breakthroughs in the combined use of mid-infrared and near-infrared.
6.2. Infrared and Raman Coupling
Raman scattering spectroscopy and infrared (IR) absorption spectroscopy are two fundamental vibrational spectroscopic techniques widely utilized for probing molecular and lattice vibrations, offering complementary information through their unique interaction mechanisms with matter [61]. Raman spectroscopy has several advantages over other techniques such as infrared spectroscopy. For example, the quality of the collected signal is almost unaffected by water, making it suitable for a wide range of applications where infrared analysis is unreliable [62]. A typical case study is the insitu monitoring of fermentation processes, where Raman technology outperforms any other spectroscopic method. Nevertheless, Raman analysis still presents some challenges, such as the development of quantitative, robust, and reliable data analysis methods [63].
Despite their broad applicability, both techniques exhibit certain limitations, particularly in detecting low concentrations of small molecules. Wang [64] systematically reviewed key optical design strategies to improve sensitivity, emphasizing the role of directional excitation and emission modes—especially those leveraging attenuated total reflection (ATR) from the visible to infrared regions. Additionally, recent progress in nanoscale vibrational spectroscopy using scanning probe microscopy was highlighted, with discussions on future development pathways.
Iliev et al. [65] conducted a comprehensive experimental study on the region-centered phonon modes and the frequency-dependent dielectric function of the brookite phase of TiO2 using polarized Raman and infrared spectroscopy. The Raman- and IR-active vibrational modes were clearly identified based on their symmetry properties. Their measured phonon mode frequencies demonstrated strong agreement with theoretical predictions obtained through density functional theory calculations of lattice dynamics, thereby validating the computational models with experimental data. In another study, Cheng et al. [66] constructed Fourier Transform Infrared and Raman spectroscopy datasets for oil–paper insulation systems by conducting accelerated thermal aging experiments at 130 °C. The two spectral datasets were then integrated using Important Factor Blocks to enhance data representation. The results demonstrated that the proposed method achieved a mean absolute error of only 12.66 for predicting the degree of polymerization, with a coefficient of determination (R2) of 99.09%, outperforming models based on individual spectra. The decision-making process of the model was further elucidated by visualizing the contribution of each spectral variable to the DP prediction. Overall, the proposed aging assessment method exhibited high accuracy and reliability.
6.3. Enhanced Raman Scattering
Enhanced Raman scattering is employed in scenarios where conventional Raman techniques lack sufficient sensitivity, particularly for low-concentration analytes. A key concept in this domain is the enhancement factor, which quantifies the amplification of Raman signals and is central to ongoing research in surface-enhanced spectroscopy [67]. Cong et al. [68] reported the development of non-stoichiometric tungsten oxide nanostructures—specifically sea urchin-like W18O49 nanowires—as a highly effective substrate for enhancing interactions between the substrate and analyte molecules. This structural configuration resulted in a significant amplification of the Raman spectral signal. The study suggests that the enrichment of surface oxygen vacancies within these nanowires contributes to the observed enhancement, likely by facilitating charge transfer interactions or increasing localized electromagnetic fields at the surface. The defect structure of W18O49 is illustrated in Figure 5, in comparison with the perfect structure of WO3, projected along the [010] direction. The crystal structure of WO3 consists of slabs of corner-sharing WO6 octahedra (ReO3-type), which have an infinite extension in two dimensions (ac plane) and a finite, characteristic width in the [010] direction. The slabs are mutually linked, forming channels between the octahedra. In contrast, the reduction of WO3 to W18O49 leads to structural changes of the ReO3-type structure and the formation of tungsten pentagonal columns causes the arising of additional hexagonal channels. The presence of oxygen defects may enrich the surface states of semiconductor and enhance the interaction affinity between the adsorbent and adsorbate, providing promises for enhancements in Raman signals. They reviewed the manufacturing/synthesis methods for preparing periodic nanostructures with nanogaps or pores to demonstrate how the space surrounded by metal nanostructures works in SERS. They also emphasized the influence of tips and pores on the performance of nanostructures.
Figure 5.
(a) The crystalline WO3 structure consists of stacking of infinite corner-sharing WO6 octahedra layers, while (b) the defects in W18O49 structure led to the formation of hexagonal channels [67].
Recent advances have expanded the mechanisms and materials used for Raman signal enhancement. Dandu et al. [69] introduced a novel Raman enhancement strategy based on non-radiative energy transfer (NRET), achieving a tenfold increase in Raman intensity within vertical van der Waals heterostructures (vdWHs). This structure consists of a monolayer of transition metal disulfide (1L-TMD) positioned atop multilayers of SnSe2. The approach leverages the benefits of uniform enhancement across a broad junction region, offering a new pathway for engineering Raman signal amplification through energy transfer mechanisms in 2D material systems.
6.4. Integration of Spectroscopic Techniques with Machine Learning
The integration of intelligent spectroscopic detection with machine learning for equipment defect diagnosis encounters several pivotal challenges in real-world deployment.
The performance of data-driven models is intrinsically linked to the volume and quality of the training dataset. A significant challenge in this domain is the scarcity of comprehensive, high-quality spectral data acquired under diverse and real-world operating conditions. Laboratory data, often obtained under controlled environments, may not fully capture the variability and noise present in field settings. Many advanced machine learning models, particularly deep neural networks, offering limited insight into the underlying decision-making process [70,71]. While these models can achieve high predictive accuracy, the lack of interpretability hinders their adoption in critical applications like power grid asset management, where understanding the reason for a fault diagnosis is as important as the diagnosis itself.
Poor cross-scenario generalization arises from the aforementioned data heterogeneity and the inherent bias in training datasets. Overcoming this limitation requires frameworks that are inherently more adaptable. Promising directions include transfer learning, where a model pre-trained on a large, general dataset is fine-tuned with a small amount of target-specific data, and domain adaptation techniques that explicitly minimize the discrepancy between feature distributions of source and target data.
7. Conclusions
Using IR spectroscopy, this work focuses on the use of intelligent machine learning approaches to evaluate the defects and failures of equipment. In the current area of research, the optimization and adaptability of different infrared spectroscopy methods for the assessment of the performance of equipment are taken into consideration. It is obvious that infrared spectroscopy is a very useful and noninvasive way of identifying the defects and failures of equipment. The accuracy and efficiency of aging assessments have greatly increased when machine learning algorithms are combined. Spectral line information obtained through infrared spectroscopy reveals the characteristic vibrations of different chemical bonds during equipment aging, thereby yielding relevant data on the complex chemical composition of the equipment. This robust data foundation provides strong support for subsequent analytical work.
However, this integrated approach still faces critical limitations, such as data scarcity and heterogeneity, model interpretability–black box dilemma, and cross-scenario generalization gaps. While there has been some improvement done to date, there is still a lot of opportunity that can be used for additional improvement. For example, increasing the resolution and precision of the spectral data used in the data collecting procedure might allow for the accurate identification of the aging of transformer oil in a larger amount of time. The use of new algorithms in deep learning (CNNs) in this area, and the use of machine learning technology, might further increase the accuracy and efficiency of prediction as it is developing. Furthermore, as the detection database continues to mature, integrating infrared spectral data to establish dedicated databases for each category of equipment will provide more comprehensive data support for training machine learning algorithms.
To bridge the gap between laboratory research and field application, future work should develop frameworks that leverage pre-trained models on large-scale spectral datasets and fine-tune them with limited target-specific data. Integrating complementary spectroscopic techniques with non-spectral data using advanced fusion algorithms. This can create a more holistic health monitoring system, improving robustness against environmental noise and heterogeneity and establishing open-access, standardized benchmark datasets that encompass spectral data under varied operating conditions. Research on intelligent machine learning-based spectroscopy for diagnosing equipment defects and failures must persistently advance to bridge existing translational gaps, thereby facilitating the transition from controlled laboratory validation to reliable real-world application.
Author Contributions
Conceptualization, C.Z. and L.F.; methodology, H.Z. (Hainan Zhu), C.Z. and S.Z.; software, L.F. and H.Z. (Hongbin Zhang).; validation, H.Z. (Hainan Zhu), C.Z., Y.S. and Y.T.; formal analysis, L.F.; investigation, H.Z. (Hongbin Zhang) and Y.S.; resources, C.Z., L.F. and Y.T.; data curation, H.Z. (Hainan Zhu), H.Z. (Hongbin Zhang) and S.Z.; writing—original draft preparation, H.Z. (Hainan Zhu) and S.Z.; writing—review and editing, H.Z. (Hainan Zhu), S.Z. and X.W.; visualization, Y.S., Y.T. and S.Z.; supervision, X.W.; project administration, L.F.; funding acquisition, C.Z. and X.W. All authors have read and agreed to the published version of the manuscript.
Funding
This research was funded by the Science and Technology Project of State Grid Shandong Electric Power Company (Research on Portable Transformer Oil Intelligent Monitoring and Fault Early Warning Technology Based on Multi-feature Parameter Sensing Technology), grant number 520604240007.
Data Availability Statement
No new data were created or analyzed in this study. Data sharing is not applicable to this article.
Acknowledgments
The authors would like to thank State Grid Shandong Electric Power Company for providing experimental samples and experimental data. The authors also thank Shandong University for technical assistance.
Conflicts of Interest
Authors Hainan Zhu, Chuanshuai Zong, Linjie Fang, Hongbin Zhang, Yandong Sun, Ye Tian are employed by the State Grid Shandong Electric Power Company. The remaining authors declare that the research was conducted in the absence of any commercial or financial relationships that could be construed as a potential conflict of interest. The authors declare that this study received funding from State Grid Shandong Electric Power Company. The funder had the following involvement with the study: provision of data and textual materials, formal analysis, investigation, writing—original draft preparation, and validation.
References
- Li, R.; Bao, L.; Chen, L.; Zha, C.; Dong, J.; Qi, N.; Wu, F. Accelerated aging of lithium-ion batteries: Bridging battery aging analysis and operational lifetime prediction. Sci. Bull. 2023, 68, 3055–3079. [Google Scholar] [CrossRef] [Scilit]
- Lelekakis, N.; Wijaya, J.; Martin, D.; Saha, T.; Susa, D.; Krause, C. Aging Rate of Grade 3 Presspaper Insulation used in Power Transformers. IEEE Trans. Dielectr. Electr. Insul. 2014, 21, 2355–2362. [Google Scholar] [CrossRef] [Scilit]
- Lyu, L.; Wang, J.; Yin, H.; Ji, Z.; Tan, J.; Hao, L.; Ge, Y. Accelerated aging for after-treatment devices of diesel engine: Method, emission characteristics, and equivalence. Appl. Energy 2024, 355, 122234. [Google Scholar] [CrossRef] [Scilit]
- Chauhan, P.K.; Vidhukiran, V.; Sujith, R.; Parameshwaran, R. Experimental investigation of multilayered graphene systems for hydrogen storage. Mater. Res. Express 2019, 10, 105617. [Google Scholar] [CrossRef] [Scilit]
- Wannapring, E.; Sirisithichote, T.; Pattanadech, N.; Leelajindakrairerk, M. Determination of Water in Transformer by Water Solubility and Percent Moisture by Dry Weight in Comparison with ppm Water Value for Justification Transformer Maintenance. In Proceedings of the 8th International Conference on Condition Monitoring and Diagnosis (CMD), Bangkok, Thailand, 25–28 October 2020; IEEE: New York, NY, USA, 2020; pp. 82–85. [Google Scholar] [CrossRef] [Scilit]
- Abu-Siada, A. Correlation of furan concentration and spectral response of transformer oil-using expert systems. IET Sci. Meas. Technol. 2011, 5, 183–188. [Google Scholar] [CrossRef] [Scilit]
- Oshima, S.; Suehara, K.; Hashimoto, A.; Nakamura, H. Novel Method for Estimating Furfural Content in Transformer Insulating Oil Using Spectroscopic Analysis and Pattern Recognition. IEEJ Trans. Electr. Electron. Eng. 2022, 17, 646–653. [Google Scholar] [CrossRef] [Scilit]
- Feng, D.W.; Chen, G.; Yan, X.Y.; Fu, X.Y.; Liao, R.J. Furfural Analysis on Aging State Assessment of Oil-Immersed Transformers: A Review. IEEE Trans. Dielectr. Electr. Insul. 2023, 30, 2758–2768. [Google Scholar] [CrossRef] [Scilit]
- Oshima, S.; Suehara, K.I.; Fushimi, F.; Nakamura, H.; Hashimoto, A. Development of portable deterioration diagnosis device for oil filled transformers based on near-infrared spectroscopic information. Electron. Commun. Jpn. 2024, 107, e12451. [Google Scholar] [CrossRef] [Scilit]
- Shao, J.W.; Wang, J.H.; Pan, X.; Wang, R.L.; Liu, S.X.; Jin, Z.X.; Wang, Z.Q. Probabilistic Modeling of Dissolved Gas Concentration for Predicting Operating Status of Oil-Immersed Transformers. IEEE Trans. Ind. Inform. 2025, 21, 1339–1348. [Google Scholar] [CrossRef] [Scilit]
- Tsuchie, M.; Kozako, M.; Hikita, M.; Sasaki, E. Modeling of Early Stage Partial Discharge and Overheating Degradation of Paper-oil Insulation. IEEE Trans. Dielectr. Electr. Insul. 2014, 21, 1342–1349. [Google Scholar] [CrossRef] [Scilit]
- Tian, Y.; Li, Z.W.; Wang, S.; Zhu, G.X.; Shi, H.N.; Wang, Y.R.; Niu, B.; Zhu, Y.C.; Huang, X.B. Research on infrared spectroscopy detection of furfural content in transformer oil based on acetonitrile extraction. Meas. Sci. Technol. 2024, 35, 095004. [Google Scholar] [CrossRef] [Scilit]
- Liu, C.; La, G.; Zhang, J.Q.; Zhao, W.T.; Duo, B.J.; Zhou, Q. Multi-Spectral Analysis for Accurate Furfural Quantification in Transformer Oil as a Diagnostic Indicator for Aging Oil-Paper Insulation. J. Nanoelectron. Optoelectron. 2023, 18, 1502–1510. [Google Scholar] [CrossRef] [Scilit]
- Singh, J.; Sood, Y.R.; Verma, P. The Influence of Service Aging on Transformer Insulating Oil Parameters. ITDEI 2012, 19, 421–426. [Google Scholar] [CrossRef] [Scilit]
- An, M.; Yang, X.Y.; He, L.N.; Zhang, J.Y.; Wang, Y.B. Fast Determination of Acidity and Other Properties of Diesel by Infrared Spectroscopy. Pet. Refin. Chem. Ind. 2020, 51, 87–92. Available online: https://qikan.cqvip.com/Qikan/Article/Detail?id=7100905951 (accessed on 1 January 2026).
- Rao, U.M.; Kumar, Y.N.; Jarial, R.K. Understanding the ageing behaviour of transformer oil-paper insulation with ester and mixed dielectric fluids. IET Sci. Meas. Technol. 2018, 12, 851–857. [Google Scholar] [CrossRef] [Scilit]
- Fang, L.; Zong, C.; Pang, Z.; Tian, Y.; Huang, X.; Zhang, Y.; Wang, X.; Zhang, S. Transformer Oil Acid Value Prediction Method Based on Infrared Spectroscopy and Deep Neural Network. Energies 2025, 18, 3345. [Google Scholar] [CrossRef] [Scilit]
- Kohtoh, M.; Kaneko, S.; Okabe, S.; Amimoto, T. Aging Effect on Electrical Characteristics of Insulating Oil in Field Transformer. IEEE Trans. Dielectr. Electr. Insul. 2009, 16, 1698–1706. [Google Scholar] [CrossRef] [Scilit]
- Kurouski, D.; Dazzi, A.; Zenobi, R.; Centrone, A. Infrared and Raman chemical imaging and spectroscopy at the nanoscale. Chem. Soc. Rev. 2020, 49, 3315–3347. [Google Scholar] [CrossRef] [Scilit] [PubMed]
- Tang, X.J.; Li, Y.J.; Zhu, L.J.; Zhao, A.X.; Liu, J.H. On-line multi-component alkane mixture quantitative analysis using Fourier transform infrared spectrometer. Chemom. Intellig. Lab. Syst. 2015, 146, 371–377. [Google Scholar] [CrossRef] [Scilit]
- Liang, Y.T.; Tang, X.J.; Zhang, X.L.; Tian, F.C.; Sun, Y.; Dong, H.Z. Portable Gas Analyzer Based on Fourier Transform Infrared Spectrometer for Patrolling and Examining Gas Exhaust. J. Spectrosc. 2015, 2015, 136516. [Google Scholar] [CrossRef] [Scilit]
- Sánchez, A.; Eddings, E.; Mondragón, F. Fourier Transform Infrared (FTIR) Online Monitoring of NO, N2O, and CO2 during Oxygen-Enriched Combustion of Carbonaceous Materials. Energy Fuels 2010, 24, 4849–4853. [Google Scholar] [CrossRef] [Scilit]
- Tang, X.J.; Liang, Y.T.; Dong, H.Z.; Sun, Y.; Luo, H.Z. Analysis of Index Gases of Coal Spontaneous Combustion Using Fourier Transform Infrared Spectrometer. J. Spectrosc. 2014, 2014, 414391. [Google Scholar] [CrossRef] [Scilit]
- Rothman, L.S.; Gordon, I.E.; Babikov, Y.; Barbe, A.; Benner, D.C.; Bernath, P.F.; Birk, M.; Bizzocchi, L.; Boudon, V.; Brown, L.R.; et al. The HITRAN2012 molecular spectroscopic database. J. Quant. Spectros. Radiat. Transfer 2013, 130, 4–50. [Google Scholar] [CrossRef] [Scilit]
- Dai, J.L.; Luo, B.; Shen, X.W.; Han, W.F.; Cui, R.Y.; Wu, J.T.; Zhang, H.F.; Xiao, W.; Zhong, Z.; Dong, L.; et al. A review of optical gas sensing technology for dissolved gas analysis in transformer oil. Front. Phys. 2025, 13, 1547563. [Google Scholar] [CrossRef] [Scilit]
- Bec, K.B.; Grabska, J.; Huck, C.W. Principles and Applications of Miniaturized Near-Infrared (NIR) Spectrometers. Chem. Eur. J. 2021, 27, 1514–1532. [Google Scholar] [CrossRef] [Scilit]
- Neubrech, F.; Huck, C.; Weber, K.; Pucci, A.; Giessen, H. Surface-Enhanced Infrared Spectroscopy Using Resonant Nanoantennas. Chem. Rev. 2017, 117, 5110–5145. [Google Scholar] [CrossRef] [Scilit]
- Georgiev, A.; Karamancheva, Y.; Topalova, L. Determination of oxidation products in transformer oils using FT-IR spectroscopy. J. Mol. Struct. 2008, 872, 18–23. [Google Scholar] [CrossRef] [Scilit]
- Qian, Y.H.; Li, Z.; Zhao, Y.H.; Wang, Q. Infrared spectroscopy for ageing assessment of insulating oils via dielectric loss factor and interfacial tension. Open Phys. 2023, 21, 14. [Google Scholar] [CrossRef] [Scilit]
- Das, S.; Paramane, A.; Chatterjee, S.; Maharana, M. Quantification of Aging State of Insulating Oils Using FTIR Spectra and Deep Learning. IEEE Trans. Dielectr. Electr. Insul. 2024, 31, 1936–1943. [Google Scholar] [CrossRef] [Scilit]
- Zandbaaf, S.; Khorrami, M.R.K.; Afshar, M.G. Genetic algorithm based artificial neural network and partial least squares regression methods to predict of breakdown voltage for transformer oils samples in power industry using ATR-FTIR spectroscopy. Spectroc. Acta Pt. A Molec. Biomolec. Spectr. 2022, 273, 120999. [Google Scholar] [CrossRef] [Scilit] [PubMed]
- Munajad, A.; Subroto, C.; Suwarno. Fourier Transform Infrared (FTIR) Spectroscopy Analysis of Transformer Paper in Mineral Oil-Paper Composite Insulation under Accelerated Thermal Aging. Energies 2018, 11, 364. [Google Scholar] [CrossRef] [Scilit]
- Elele, U.; Nekahi, A.; Arshad, A.; Fofana, I. Towards Online Ageing Detection in Transformer Oil: A Review. Sensors 2022, 22, 7923. [Google Scholar] [CrossRef] [Scilit]
- Bustamante, S.; Manana, M.; Arroyo, A.; Castro, P.; Laso, A.; Martinez, R. Dissolved Gas Analysis Equipment for Online Monitoring of Transformer Oil: A Review. Sensors 2019, 19, 4057. [Google Scholar] [CrossRef] [Scilit]
- Qi, Y.; Hu, D.; Jiang, Y.; Wu, Z.; Zheng, M.; Chen, E.X.; Liang, Y.; Sadi, M.A.; Zhang, K.; Chen, Y.P. Recent Progresses in Machine Learning Assisted Raman Spectroscopy. Adv. Opt. Mater. 2023, 11, 14. [Google Scholar] [CrossRef] [Scilit]
- Choudhary, K.; DeCost, B.; Chen, C.; Jain, A.; Tavazza, F.; Cohn, R.; Park, C.W.; Choudhary, A.; Agrawal, A.; Billinge, S.J.L.; et al. Recent advances and applications of deep learning methods in materials science. npj Comput. Mater. 2022, 8, 59. [Google Scholar] [CrossRef] [Scilit]
- Prischepa, V.V.; Skiba, V.E.; Vrazhnov, D.A.; Markelov, A.A. Application of laser absorption spectroscopy and machine learning for component analysis of multicomponent gas media. In Proceedings of the 4th International Conference on Terahertz and Microwave Radiation: Generation, Detection, and Applications, Tomsk, Russia, 24–26 August 2020. [Google Scholar] [CrossRef] [Scilit]
- Jha, A.; Chandrasekaran, A.; Kim, C.; Ramprasad, R. Impact of dataset uncertainties on machine learning model predictions: The example of polymer glass transition temperatures. Modell. Simul. Mater. Sci. Eng. 2019, 27, 024002. [Google Scholar] [CrossRef] [Scilit]
- Yan, C.S. A review on spectral data preprocessing techniques for machine learning and quantitative analysis. iScience 2025, 28, 112759. [Google Scholar] [CrossRef] [Scilit] [PubMed]
- Shrestha, B.; Posom, J.; Sirisomboon, P.; Shrestha, B.P. Comprehensive Assessment of Biomass Properties for Energy Usage Using Near-Infrared Spectroscopy and Spectral Multi-Preprocessing Techniques. Energies 2023, 16, 5351. [Google Scholar] [CrossRef] [Scilit]
- Sanchez-Garrido, J.; Jurado, A.; Medina, L.; Rodriguez, R.; Ros, E.; Diaz, J. Digital Electrical Substation Communications Based on Deterministic Time-Sensitive Networking Over Ethernet. IEEE Access 2020, 8, 93621–93634. [Google Scholar] [CrossRef] [Scilit]
- Fardanesh, B.; Shapiro, A.; Saglimbene, P.; DaSilva, R.; Stefopoulos, G.; Esmaeilian, A. A Digital Transformation at New York Power Authority: Using Innovative Technologies to Create a More Efficient Power System. IEEE Power Energy Mag. 2020, 18, 22–30. [Google Scholar] [CrossRef] [Scilit]
- Bedi, G.; Venayagamoorthy, G.K.; Singh, R.; Brooks, R.R.; Wang, K.C. Review of Internet of Things (IoT) in Electric Power and Energy Systems. IEEE Internet Things J. 2018, 5, 847–870. [Google Scholar] [CrossRef] [Scilit]
- Jiang, J.A.; Wang, J.C.; Wu, H.S.; Lee, C.H.; Chou, C.Y.; Wu, L.C.; Yang, Y.C. A Novel Sensor Placement Strategy for an IoT-Based Power Grid Monitoring System. IEEE Internet Things J. 2020, 7, 7773–7782. [Google Scholar] [CrossRef] [Scilit]
- Xiao, Z.L.; Yuan, R.Y.; Fu, Z.; Liu, C.; Yin, B.L.; Xiao, M.Z.; Zhao, T.T.; Kuang, Y.J.; Song, L.B. Study on the Aging Behavior of Transformer Oil Based on Machine Learning and Infrared Spectroscopy Technology. Spectrosc. Spectr. Anal. 2025, 45, 434–442. [Google Scholar]
- Sim, S.F.; Kimura, A.L.J. Partial Least Squares (PLS) Integrated Fourier Transform Infrared (FTIR) Approach for Prediction of Moisture in Transformer Oil and Lubricating Oil. J. Spectrosc. 2019, 2019, 5916506. [Google Scholar] [CrossRef] [Scilit]
- Rediansyah, D.; Prasojo, R.A.; Suwarno; Abu-Siada, A. Artificial Intelligence-Based Power Transformer Health Index for Handling Data Uncertainty. IEEE Access 2021, 9, 150637–150648. [Google Scholar] [CrossRef] [Scilit]
- Wan, F.; Li, S.; Lei, Y.; Wang, M.; Liu, R.; Hu, K.; Xia, Y.; Chen, W. Two-step machine learning-assisted label-free surface-enhanced Raman spectroscopy for reliable prediction of dissolved furfural in transformer oil. Spectrochim. Acta Part A-Mol. Biomol. Spectrosc. 2024, 321, 124571. [Google Scholar] [CrossRef] [Scilit]
- Jeon, K.S.; Sim, J.; Cho, W.B.; Park, B. Research on long-range hydrogen gas measurement for development of Raman lidar sensors. Int. J. Hydrogen Energy 2024, 67, 119–126. [Google Scholar] [CrossRef] [Scilit]
- Jander, J.H.; Chittem, P.K.; Kerscher, M.; Rausch, M.H.; Wasserscheid, P.; Fröba, A.P. Raman spectroscopy for the determination of hydrogen concentration in liquid organic hydrogen carrier systems. Int. J. Hydrogen Energy 2024, 73, 681–694. [Google Scholar] [CrossRef] [Scilit]
- Zifarelli, A.; Giglio, M.; Menduni, G.; Sampaolo, A.; Patimisco, P.; Passaro, V.M.N.; Wu, H.; Dong, L.; Spagnolo, V. Partial Least-Squares Regression as a Tool to Retrieve Gas Concentrations in Mixtures Detected Using Quartz-Enhanced Photoacoustic Spectroscopy. Anal. Chem. 2020, 92, 11035–11043. [Google Scholar] [CrossRef] [Scilit] [PubMed]
- Mokari, A.; Guo, S.X.; Bocklitz, T. Exploring the Steps of Infrared (IR) Spectral Analysis: Pre-Processing, (Classical) Data Modelling, and Deep Learning. Molecules 2023, 28, 6886. [Google Scholar] [CrossRef] [Scilit] [PubMed]
- Liu, J.; Osadchy, M.; Ashton, L.; Foster, M.; Solomon, C.J.; Gibson, S.J. Deep convolutional neural networks for Raman spectrum recognition: A unified solution. Analyst 2017, 142, 4067–4074. [Google Scholar] [CrossRef] [Scilit]
- Chen, Y.Y.; Wang, Z.B. Quantitative analysis modeling of infrared spectroscopy based on ensemble convolutional neural networks. Chemom. Intellig. Lab. Syst. 2018, 181, 1–10. [Google Scholar] [CrossRef] [Scilit]
- Wang, C.Y.; Ko, T.S.; Hsu, C.C. Interpreting convolutional neural network for real-time volatile organic compounds detection and classification using optical emission spectroscopy of plasma. Anal. Chim. Acta 2021, 1179, 338822. [Google Scholar] [CrossRef] [Scilit]
- Huang, T.Y.; Yu, J.C.C. Development of Crime Scene Intelligence Using a Hand-Held Raman Spectrometer and Transfer Learning. Anal. Chem. 2021, 93, 8889–8896. [Google Scholar] [CrossRef] [Scilit]
- Post, C.; Brülisauer, S.; Waldschläger, K.; Hug, W.; Grüneis, L.; Heyden, N.; Schmor, S.; Förderer, A.; Reid, R.; Reid, M.; et al. Application of Laser-Induced, Deep UV Raman Spectroscopy and Artificial Intelligence in Real-Time Environmental Monitoring-Solutions and First Results. Sensors 2021, 21, 3911. [Google Scholar] [CrossRef] [Scilit]
- Mo, B.Y.; Zhou, S.H.; He, Y.J.; Han, X.; Han, M.L.; Li, C.X.; Chen, K. Interference characteristics of leaking SF6 on photoacoustic detection of dissolved C2H4 in transformer oil. Microw. Opt. Technol. Lett. 2024, 66, e34215. [Google Scholar] [CrossRef] [Scilit]
- Liu, X.S.; Zhang, S.Y.; Si, L.T.; Lin, Z.L.; Wu, C.Y.; Luan, L.J.; Wu, Y.J. A combination of near infrared and mid-infrared spectroscopy to improve the determination efficiency of active components in Radix astragali. J. Near Infrared Spectrosc. 2020, 28, 10–17. [Google Scholar] [CrossRef] [Scilit]
- Nepper-Davidsen, J.; Magnusson, M.; Lawton, R.J.; Fletcher, D.; Holmes, G.; Glasson, C.R.K. Chemometric models for high-throughput biomass grading of the kelp Ecklonia radiata, using mid-infrared (MIR) and near-infrared (NIR) spectroscopy. Algal Res.-Biomass Biofuels Bioprod. 2024, 77, 103352. [Google Scholar] [CrossRef] [Scilit]
- Hadjiivanov, K.I.; Panayotov, D.A.; Mihaylov, M.Y.; Ivanova, E.Z.; Chakarova, K.K.; Andonova, S.M.; Drenchev, N.L. Power of Infrared and Raman Spectroscopies to Characterize Metal-Organic Frameworks and Investigate Their Interaction with Guest Molecules. Chem. Rev. 2021, 121, 1286–1424. [Google Scholar] [CrossRef] [Scilit]
- Wang, H.B.; Zhu, Y.Q.; Yang, Y.L.; Zhao, C.; Wu, Y.; Li, T.; Li, J.; Qi, J. Raman spectroscopy study on intergranular corrosion sensitivity of 304 austenitic stainless steel. Corros. Commun. 2025, 20, 88–92. [Google Scholar] [CrossRef] [Scilit]
- Orlando, A.; Franceschini, F.; Muscas, C.; Pidkova, S.; Bartoli, M.; Rovere, M.; Tagliaferro, A. A Comprehensive Review on Raman Spectroscopy Applications. Chemosensors 2021, 9, 262. [Google Scholar] [CrossRef] [Scilit]
- Wang, H.L.; You, E.M.; Panneerselvam, R.; Ding, S.Y.; Tian, Z.Q. Advances of surface-enhanced Raman and IR spectroscopies: From nano/microstructures to macro-optical design. Light-Sci. Appl. 2021, 10, 1–19. [Google Scholar] [CrossRef] [Scilit]
- Iliev, M.N.; Hadjiev, V.G.; Litvinchuk, A.P. Raman and infrared spectra of brookite (TiO2): Experiment and theory. Vib. Spectrosc. 2013, 64, 148–152. [Google Scholar] [CrossRef] [Scilit]
- Cheng, S.; Lin, Q.L.; Zhang, L.; Sun, W.; Chen, Q.G. Combined Spectral Evaluation Method for Aging State of Oil-Paper Insulation Based on Channel Attention Improved Variable-Weighted Convolutional Neural Network. IEEE Trans. Instrum. Meas. 2025, 74, 2519210. [Google Scholar] [CrossRef] [Scilit]
- Le Ru, E.C.; Auguié, B. Enhancement Factors: A Central Concept during 50 Years of Surface-Enhanced Raman Spectroscopy. Acs Nano 2024, 18, 9773–9783. [Google Scholar] [CrossRef] [Scilit] [PubMed]
- Cong, S.; Yuan, Y.Y.; Chen, Z.G.; Hou, J.Y.; Yang, M.; Su, Y.L.; Zhang, Y.Y.; Li, L.; Li, Q.W.; Geng, F.X.; et al. Noble metal-comparable SERS enhancement from semiconducting metal oxides by making oxygen vacancies. Nat. Commun. 2015, 6, 7800. [Google Scholar] [CrossRef] [Scilit] [PubMed]
- Dandu, M.; Watanabe, K.; Taniguchi, T.; Sood, A.K.; Majumdar, K. Spectrally Tunable, Large Raman Enhancement from Nonradiative Energy Transfer in the van der Waals Heterostructure. ACS Photonics 2020, 7, 519–527. [Google Scholar] [CrossRef] [Scilit]
- Qi, J.; Liu, Y.; Wang, D.; Liu, X.; Duan, J. Machine learning-enhanced Raman spectroscopy for rapid identification of aviation coating damage. Corros. Sci. 2026, 260, 113584. [Google Scholar] [CrossRef] [Scilit]
- Liu, Y.; Wu, Y.; Wang, J.; Qi, J.; Zhou, C.; Xue, Y. Recent Advances in Raman Spectral Classification with Machine Learning. Sensors 2026, 26, 341. [Google Scholar] [CrossRef] [Scilit]
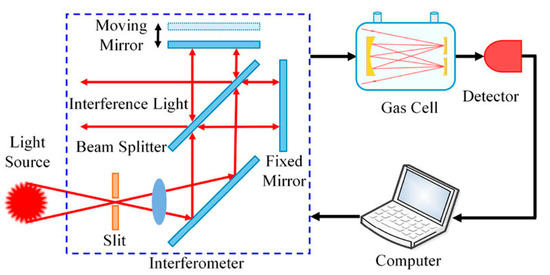
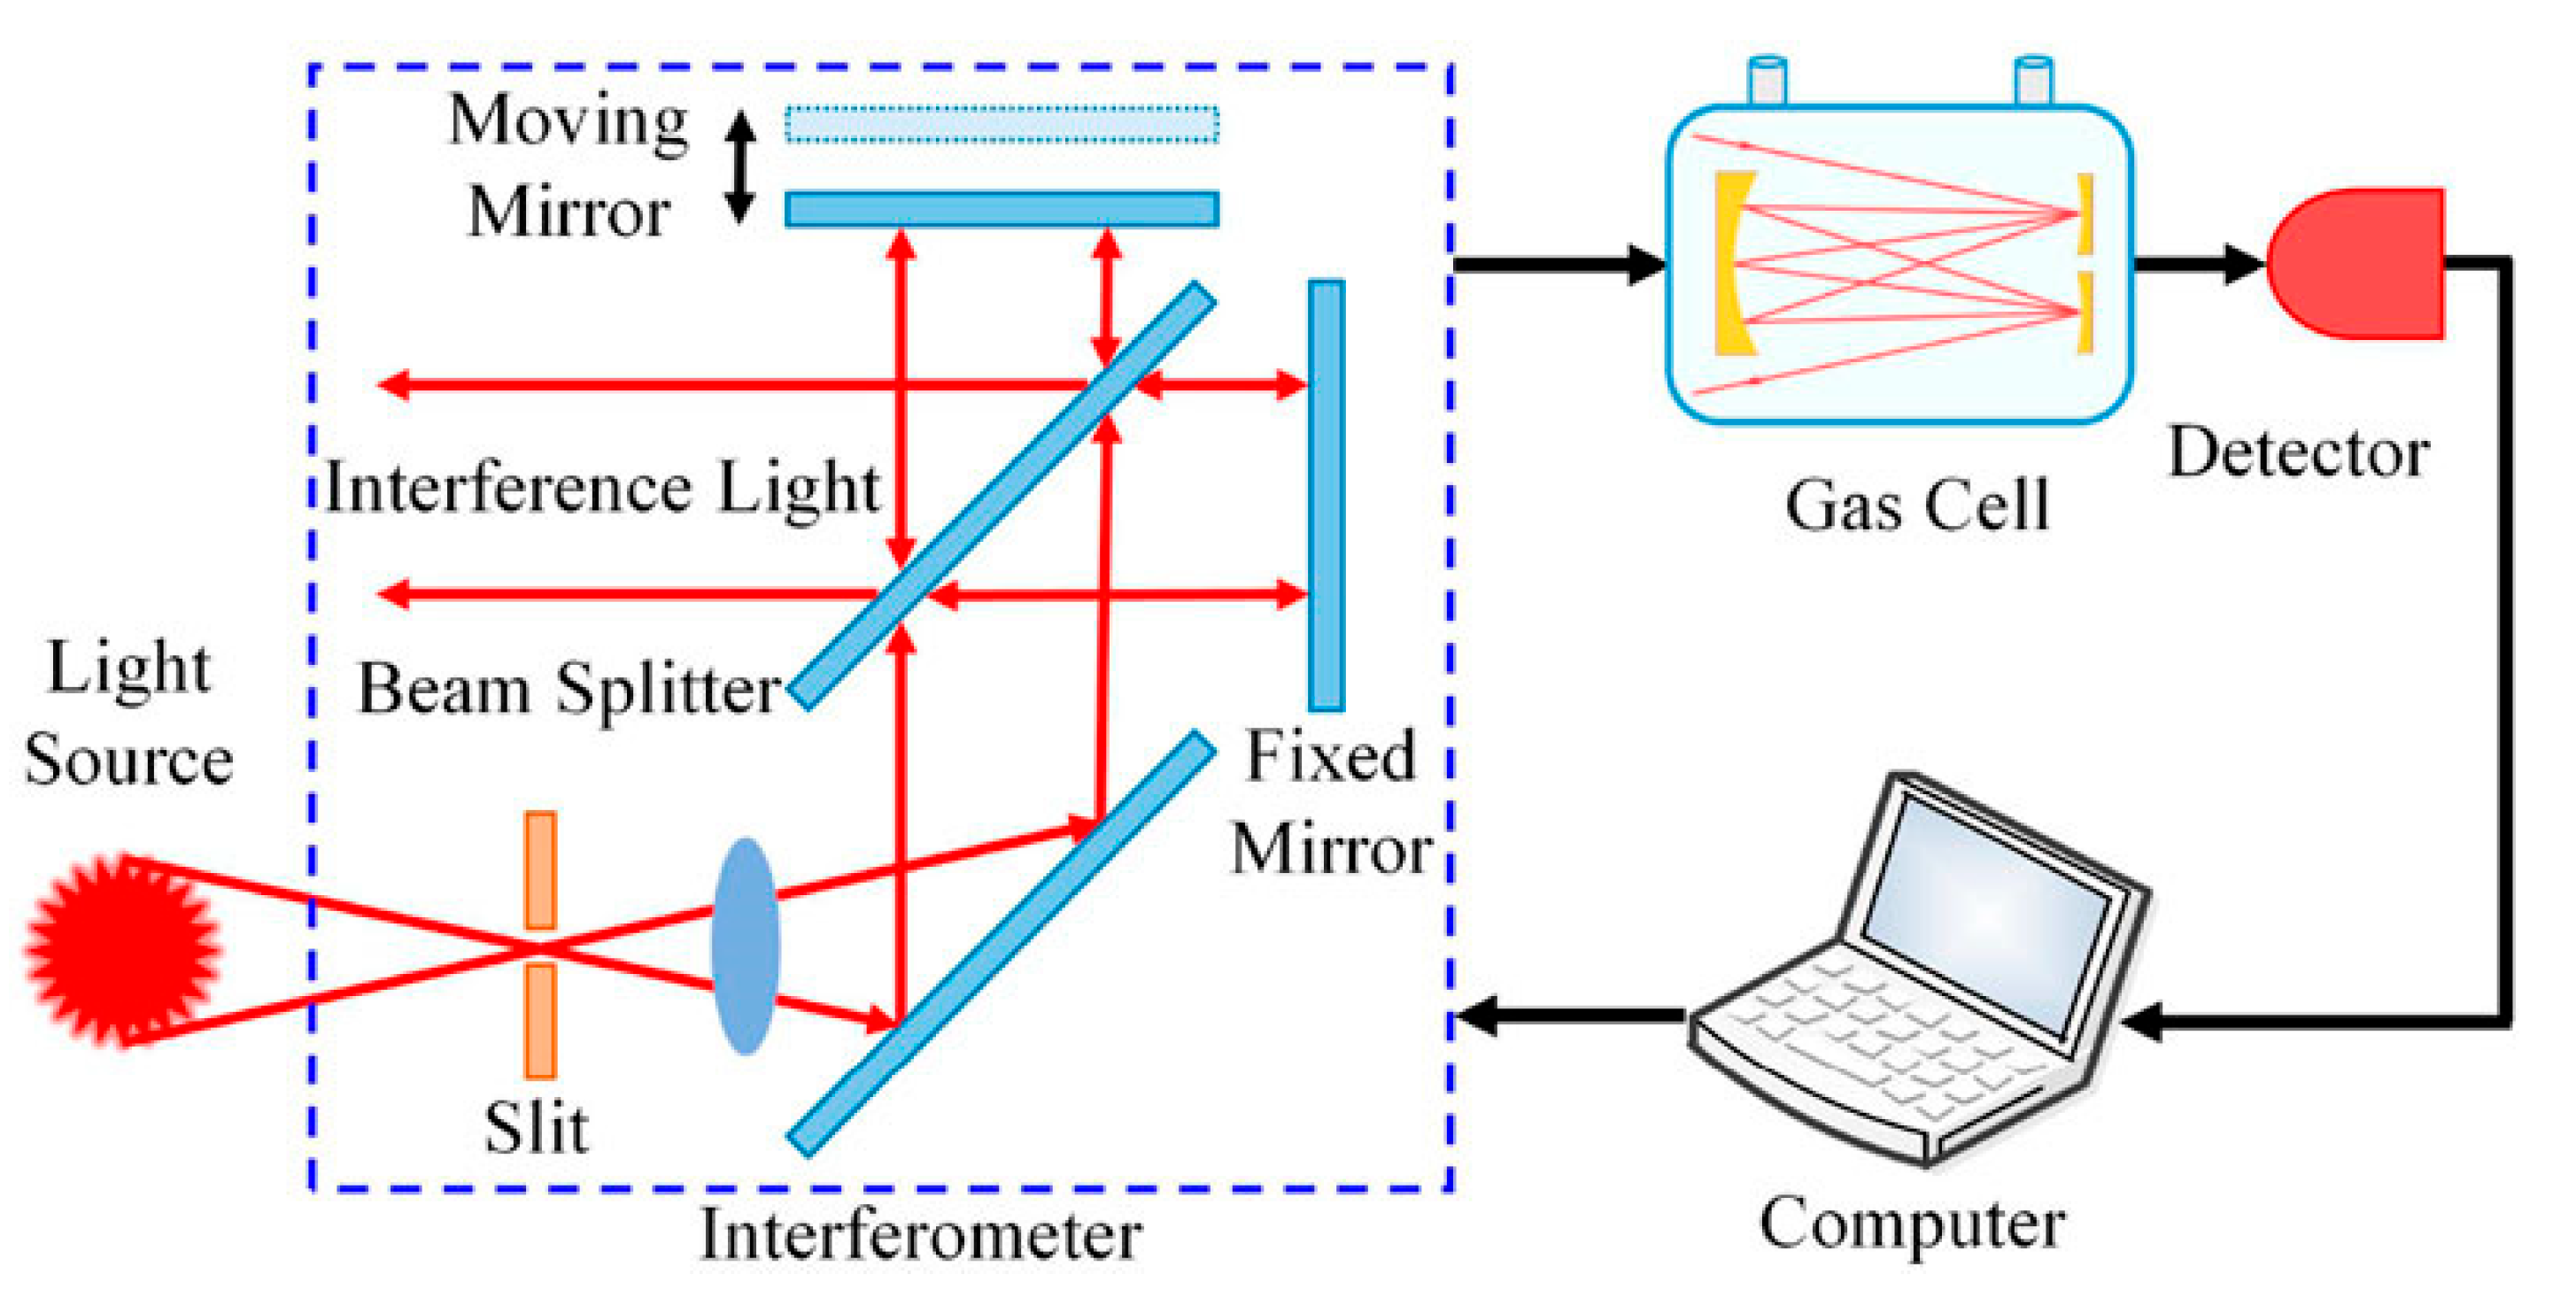
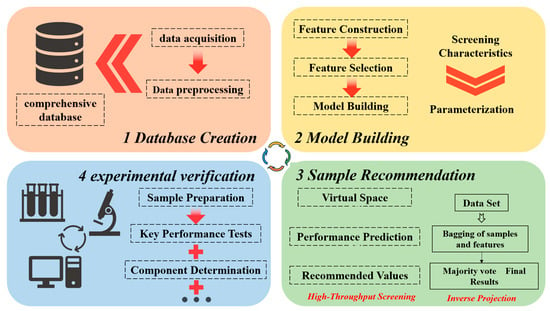
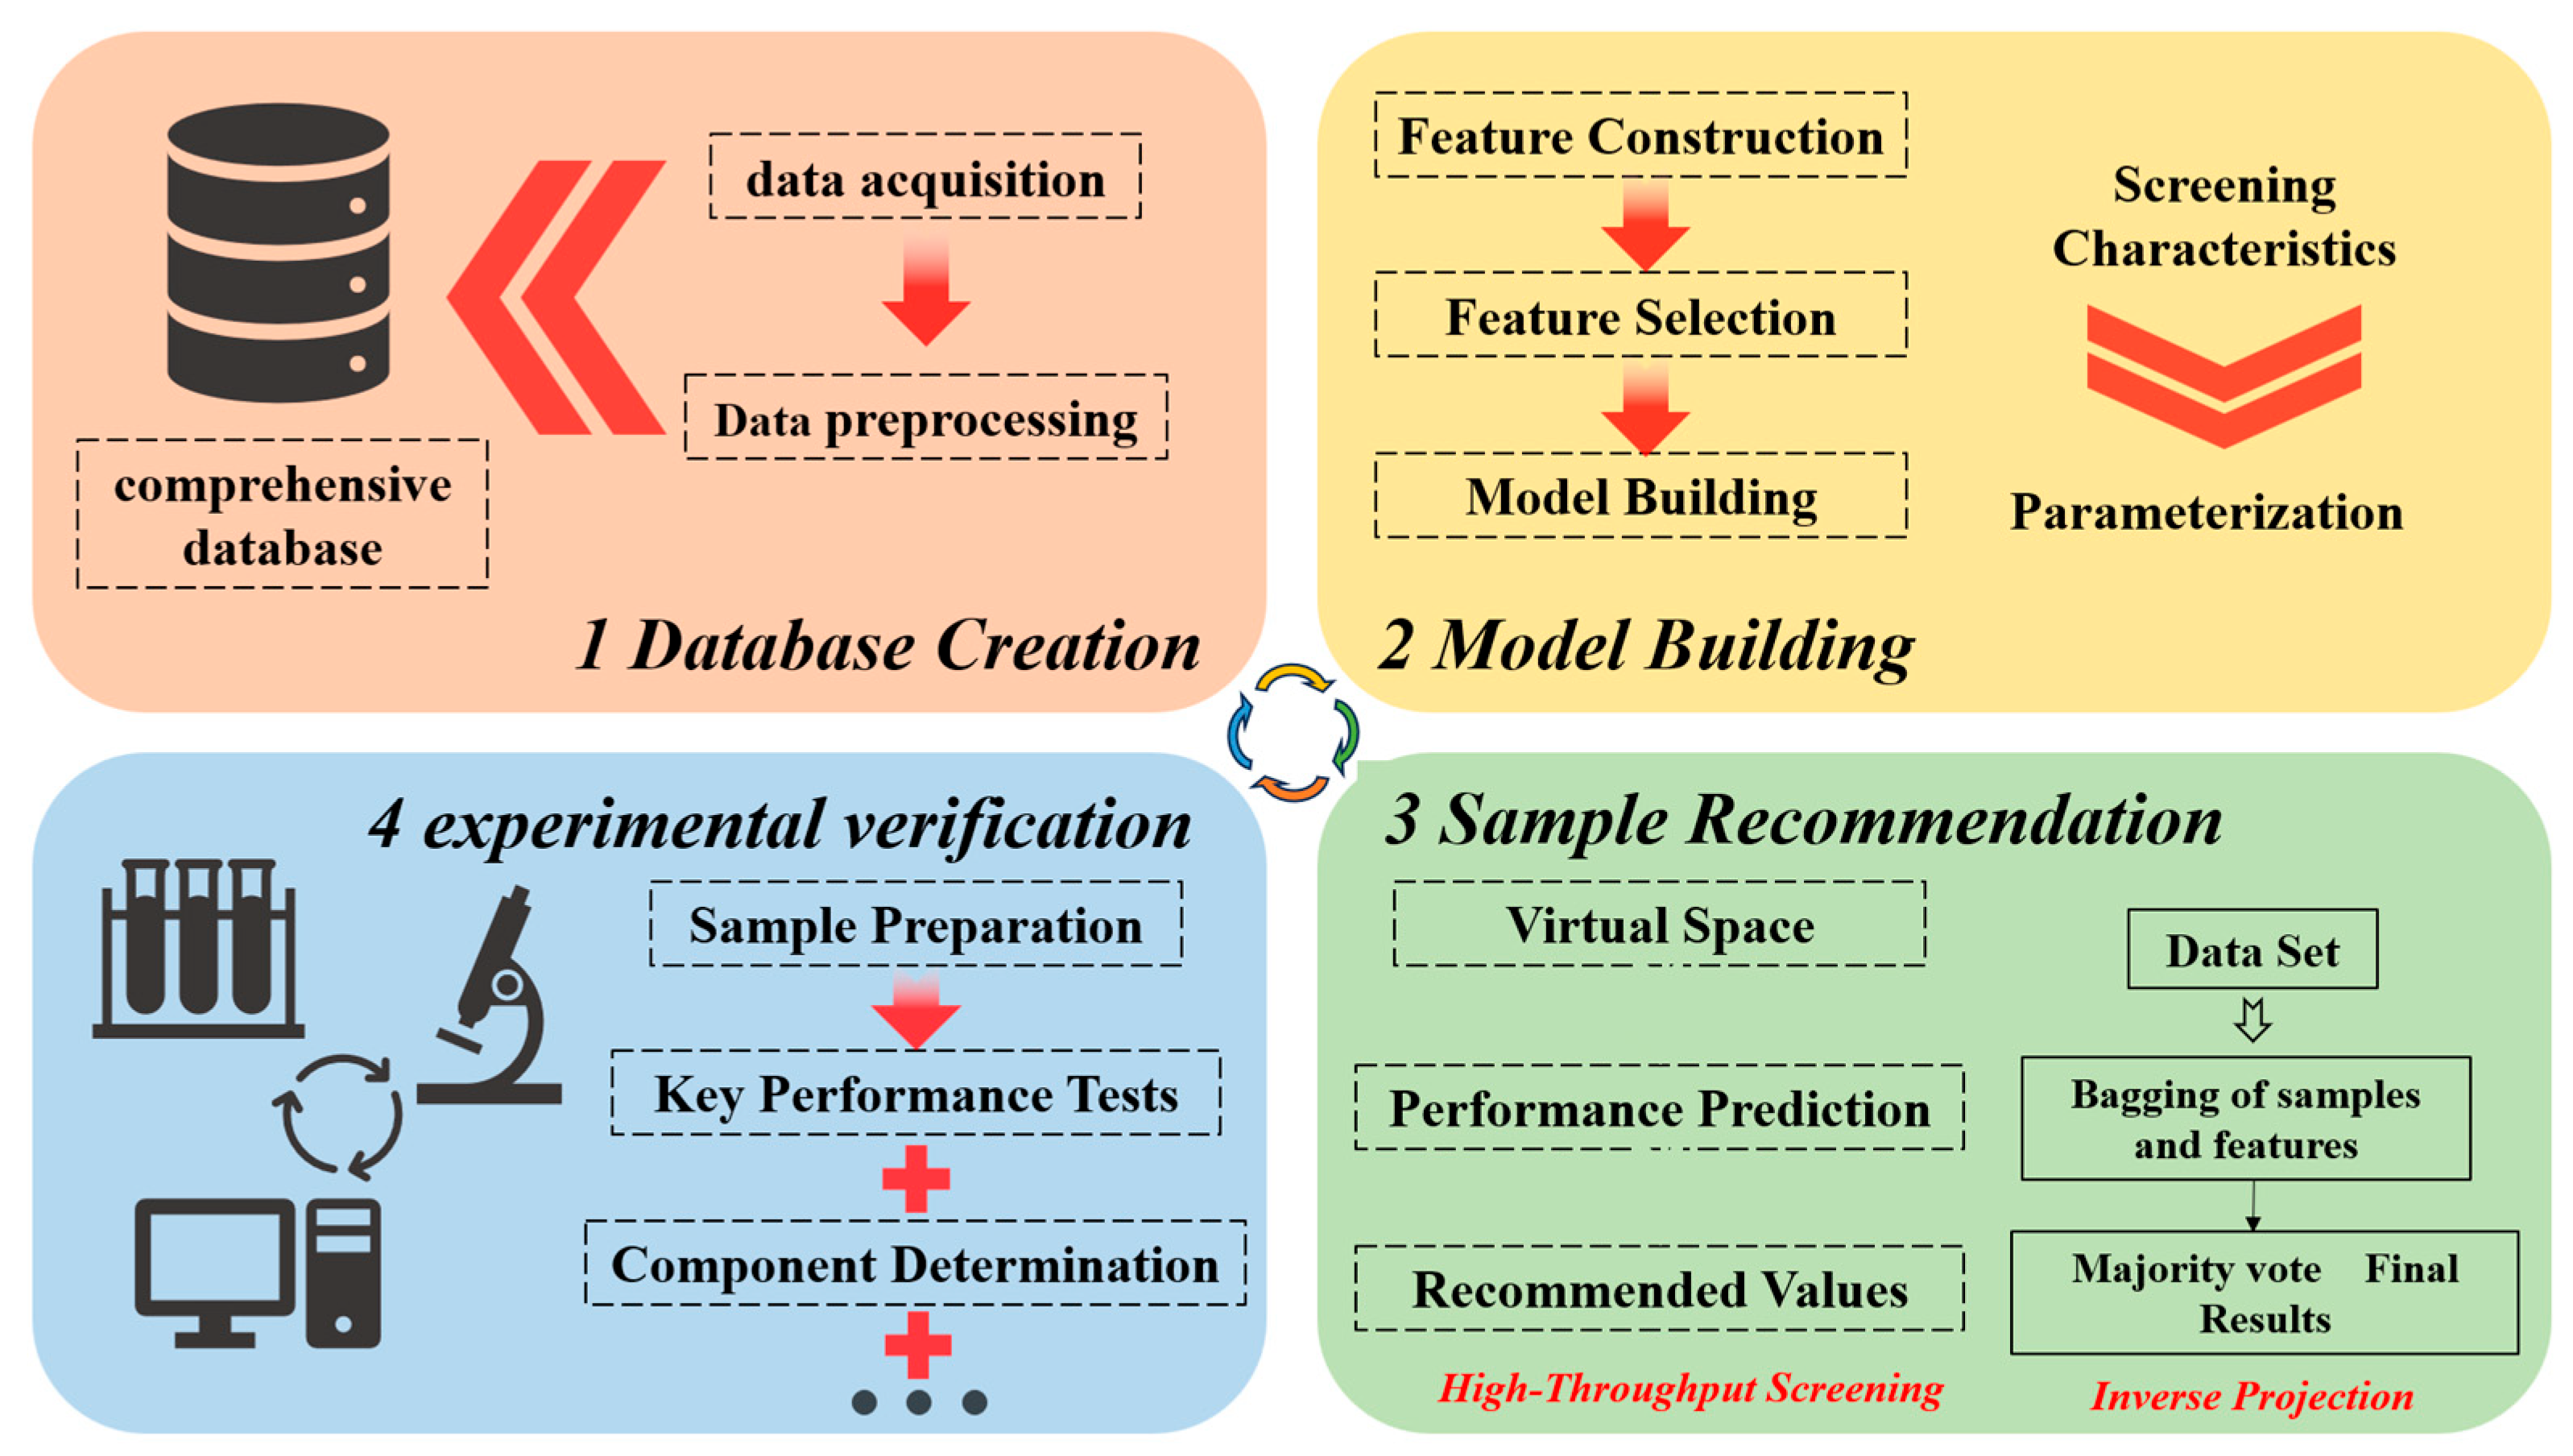
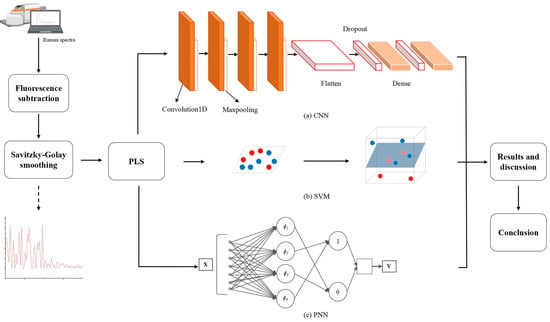
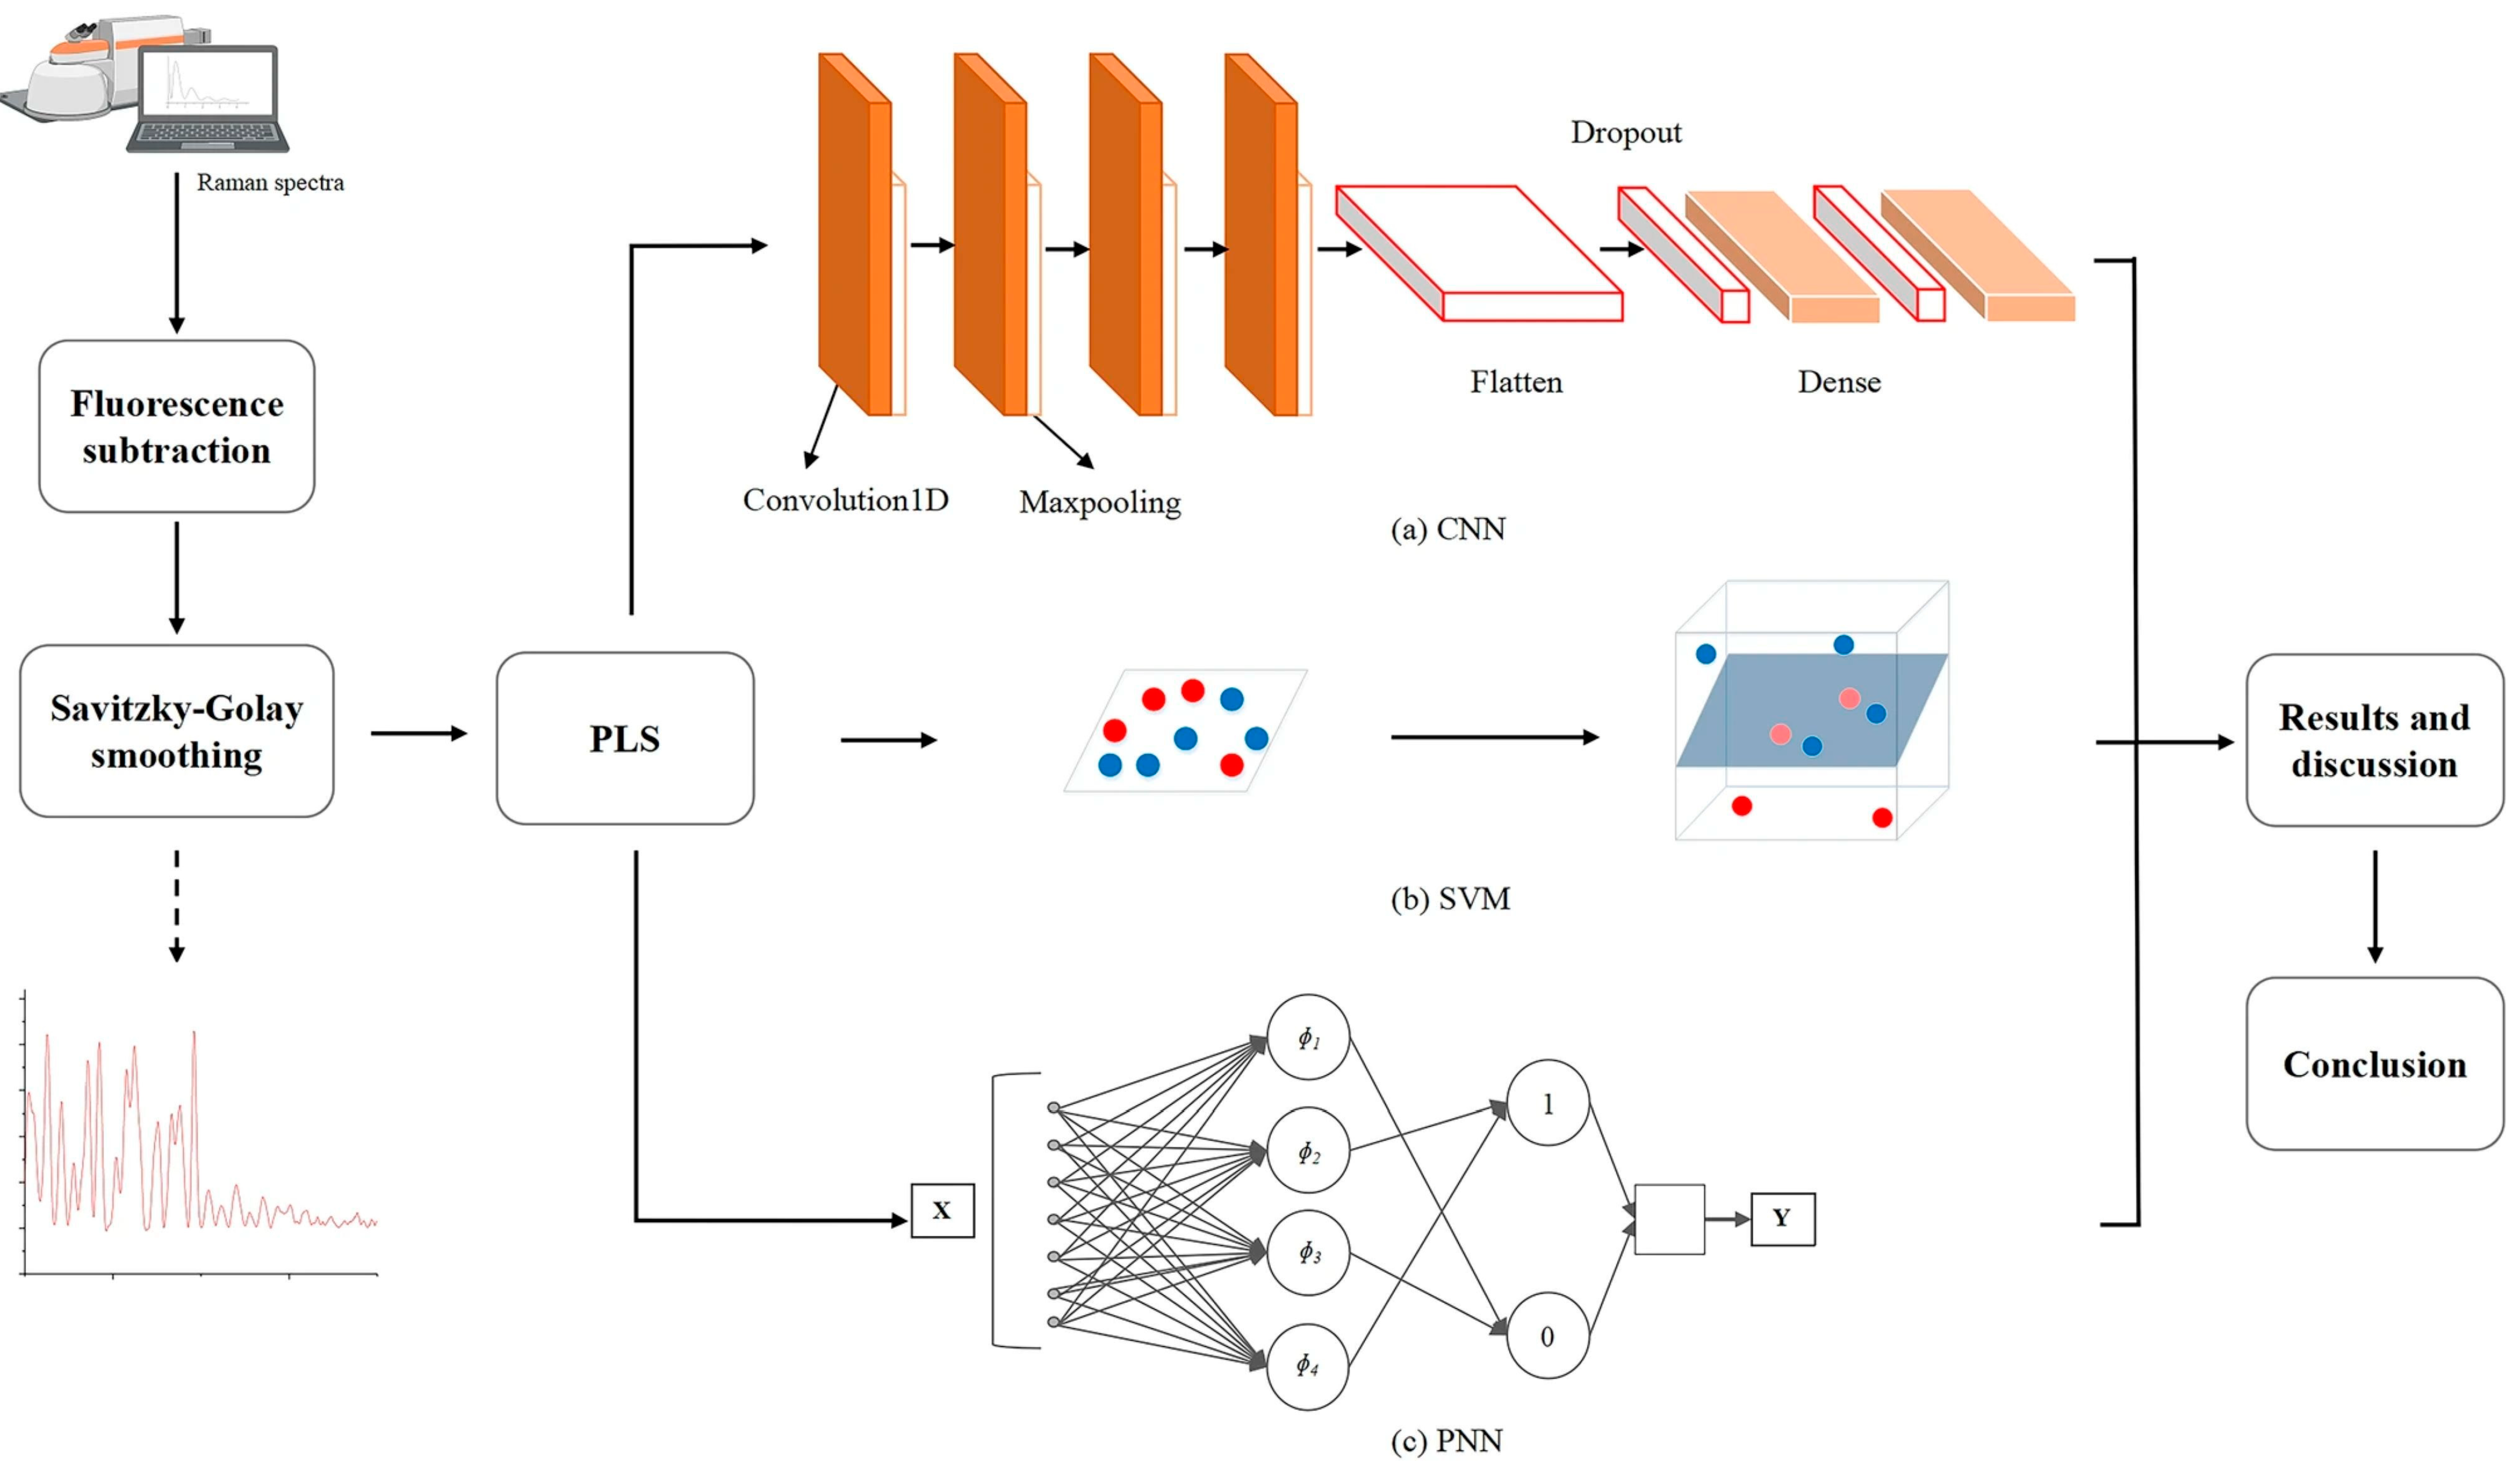
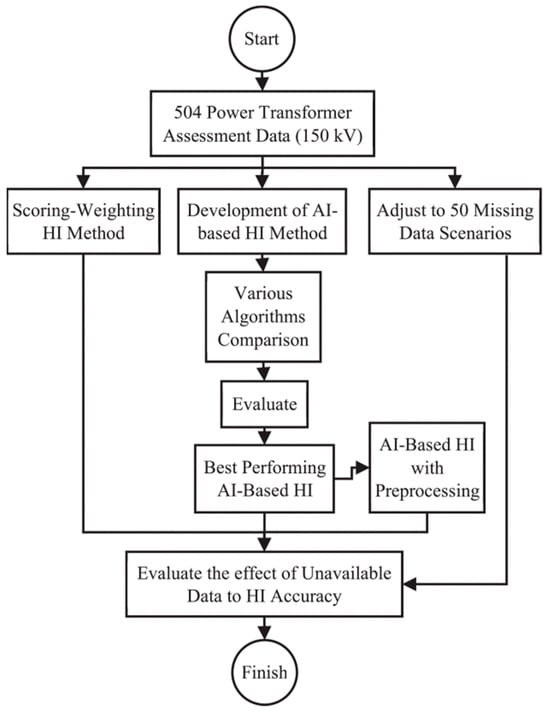
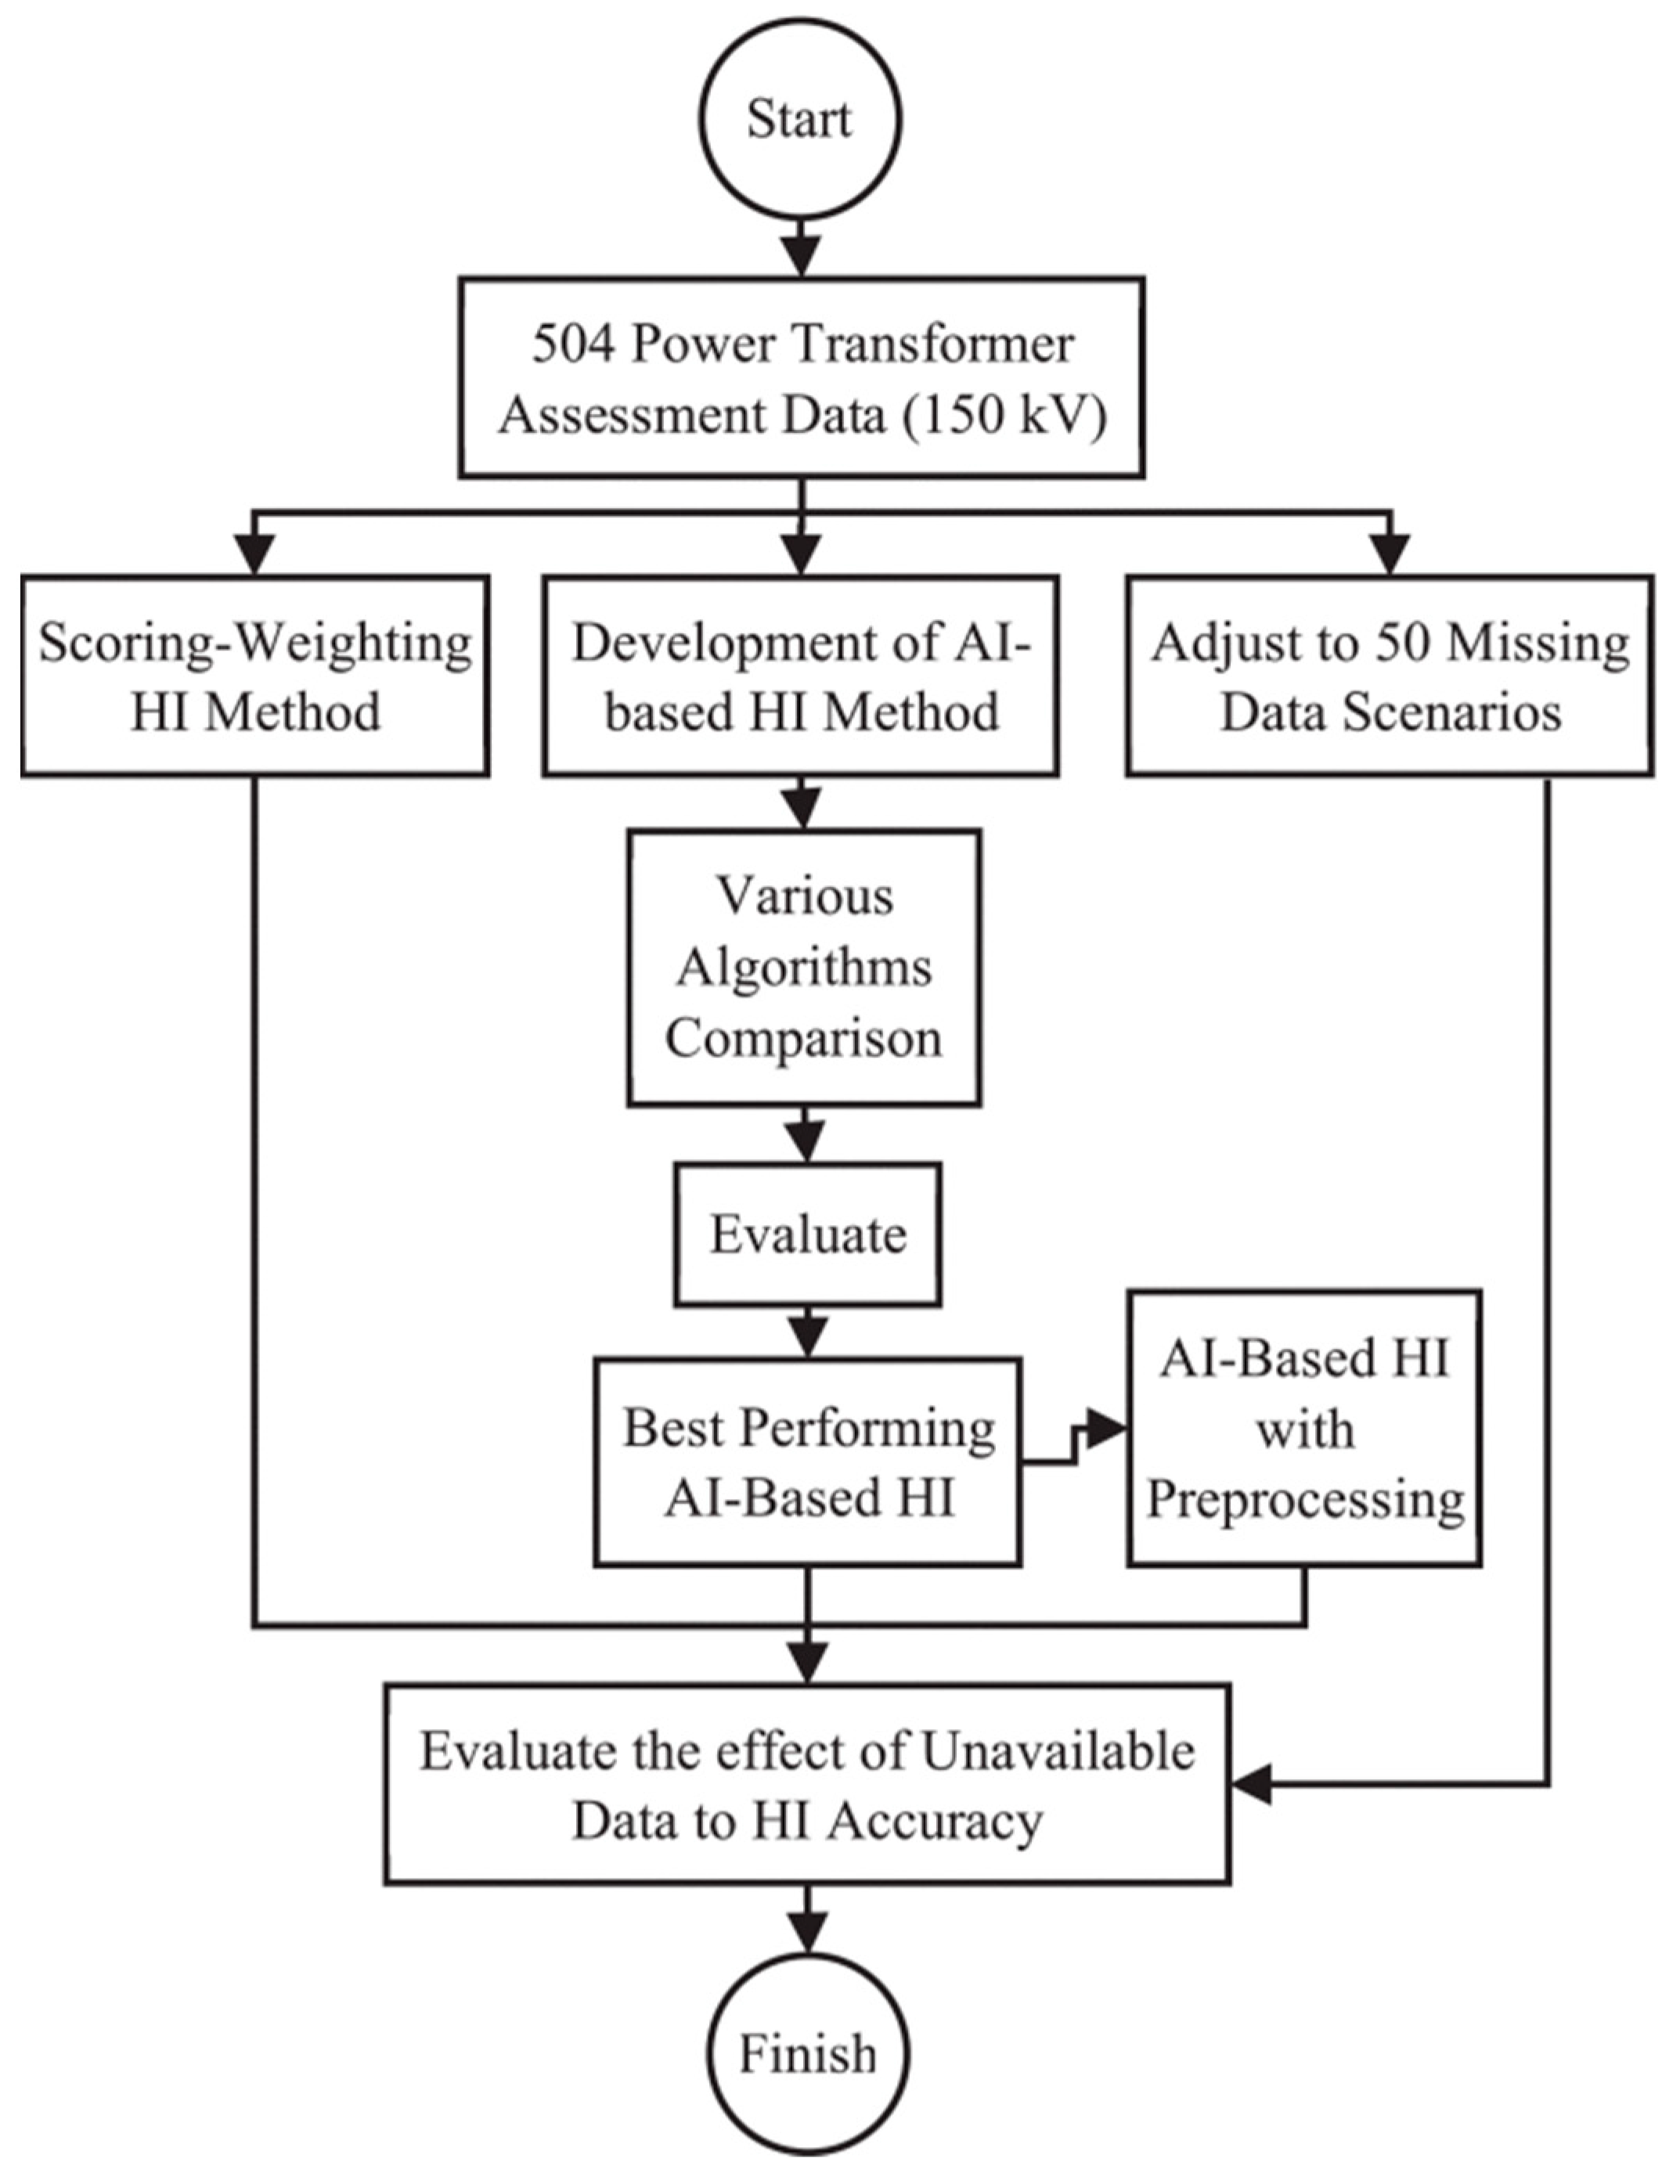
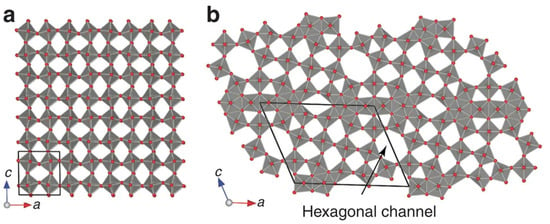
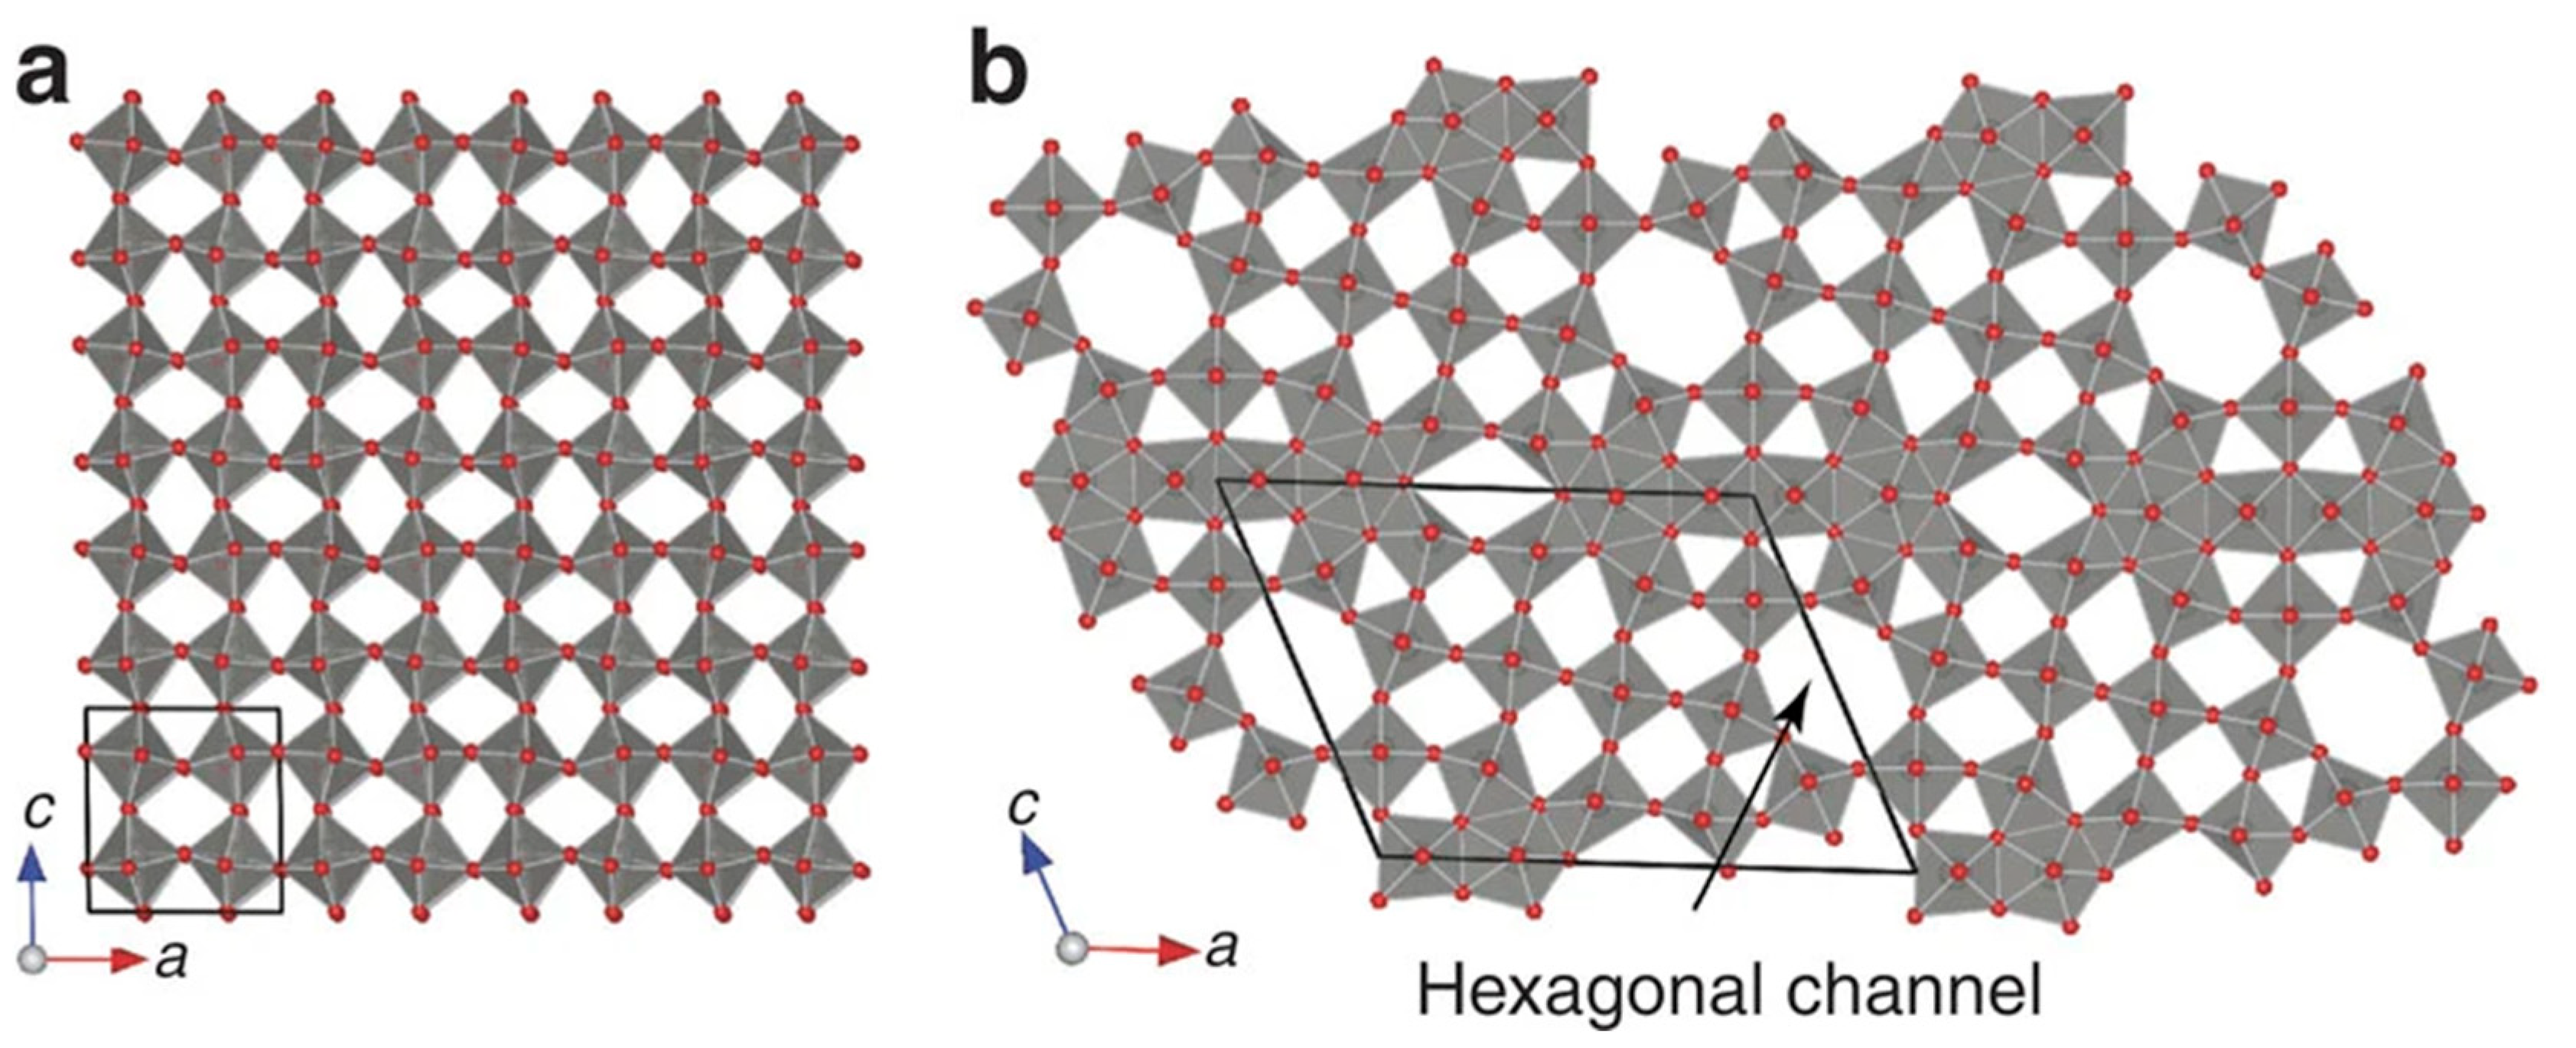

Disclaimer/Publisher’s Note: The statements, opinions and data contained in all publications are solely those of the individual author(s) and contributor(s) and not of MDPI and/or the editor(s). MDPI and/or the editor(s) disclaim responsibility for any injury to people or property resulting from any ideas, methods, instructions or products referred to in the content. |
© 2026 by the authors. Licensee MDPI, Basel, Switzerland. This article is an open access article distributed under the terms and conditions of the Creative Commons Attribution (CC BY) license.