


Abstract
Modern consumer technologies have become more intuitive and user-friendly. On the other hand, as automation levels rise in most factories and warehouses, it is becoming increasingly difficult to configure certain processes without a specialist’s involvement. Typically, these facilities employ staff without an engineering background in robotics, who can only perform their direct duties but are unable to create maps and routes for mobile robots. This article describes an alternative approach to creating a multi-purpose navigation map using mixed reality glasses, demonstrating the capabilities of Meta’s Meta Quest 3 glasses as a versatile mixed reality device for 3D room scanning and navigation mapping. In this paper, we demonstrate how a mixed reality approach can be applied to additional mapping evaluation for rooms of varying complexity and shape, including problematic areas for many similar solutions when the room contains mirrors and glass walls. Although environmental scanning in the Meta Quest 3 glasses is a standard integrated function of these glasses, it is used only for the collision avoidance system; this device can be successfully implemented in the Internet of Things system, and the collected data can be used for 3D scanning of the environment, creating navigation maps after additional data processing. This method expands the implementation of automated moving systems, including simplified map creation for mobile robots, in complex environmental and movement tasks.
1. Introduction
Technology and automation of various processes have long been part of our lives, and this is especially noticeable in manufacturing. Every day, we use high-tech devices such as smartphones with 3D facial recognition for unlocking, mixed-reality headsets with body-movement tracking for games, robot vacuum cleaners and lawn mowers with autonomous navigation, cars with autonomous driving and parking, and much more. All of these are quite complex devices with multiple sensors and high computing power, yet they do not require any special engineering or programming skills to use. Modern smart devices are designed to be as comfortable to use as possible, even for inexperienced users. The device itself provides interactive training and prepares the user for the first use. All programs are designed to ensure customer comfort. For example, smartphones use interactive animations to teach users how to use new features; the Meta Quest 3 headset shows an introductory video that explains what to press and how to use the device.
Robotic equipment used in factory workshops or warehouses, in most cases, requires special skills: spatial thinking, knowledge of documentation for preparing robotic devices for tasks, or for handling task changes. Conventional programming of robotic devices does not require more complex equipment than a tablet or PC software. Therefore, the most complicated task, as usual, is creating a navigation map, drawing a route, and setting traffic rules.
Modern mobile robots often operate autonomously after configuration, using an integrated sensor [1,2,3]. Typically, these are LiDAR or cameras that generate navigation maps with the simultaneous localization and mapping (SLAM) method, and it can be used with a ToF, ultrasonic rangefinder/ultrasonic distance meter [4].
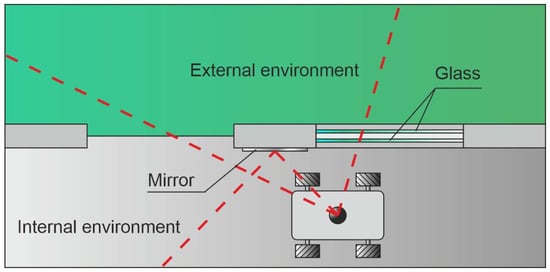
The current mapping process has serious shortcomings in detecting glass, mirrors, and the boundary between the external and internal environments using sensors, as shown in Figure 1. One possible solution is presented in P. Foster’s [5] article, which presents reflectance field mapping, a reliable real-time method to detect shiny surfaces such as glass, metal, and mirrors using LiDAR.
Figure 1.
Visualization of obstacles (glass, mirror), invisible to the moving robot, and borders of external and internal environments. Red dashed lines represents laser beam line.
To correctly edit navigation maps, set restrictions, and plot a route, the operator must have a good understanding of the created map, how it corresponds to reality, and spatial thinking, without which errors in robot movement are possible [6].
For example, if robot sensors did not detect glass obstacles during map creation, and if the operator does not modify the navigation configuration later, the robot can hit these glass obstacles at speed, creating dangerous situations [7,8].
To prevent this, operators must select a restricted area where robots will have limited ways to move or reduce speed. Additionally, scanning with robot sensors requires physical presence and movement around the room. Therefore, it is sometimes necessary to stop other robots and production processes and restrict access to workers. This negatively affects the production processes. In manual mode, scanning and safety depend on the operator’s skills, but in automatic mode, errors and accidents can occur due to transparent, reflective objects or other physical features of the room [9,10,11,12].
Mixed reality (MR) devices have advanced significantly in recent years, and there are already affordable standalone devices on the market, such as the Meta Quest 3, with a variety of built-in sensors, including room scanning and hand-tracking systems.
Practical challenges, space-to-technology constraints, and similar requirements limit MR adoption, although the industry is making progress in developing more user-friendly devices with convenient navigation and movement techniques. At the same time, insufficient widespread adoption limits the social appeal. However, wider use of MR in enterprises could pave the way for consumer markets, and workplace use could help promote technological efficiency.
Tracking systems are a key differentiator for MR devices. Inside–out tracking uses sensors and cameras built into the headset to track user movements relative to the environment, is ready to use and portable, and is the de facto standard for standard VR headsets but can be less accurate in complex environments [13].
Currently available MR methods are primarily applied to stationary manipulators or for visualizing information in a pre-rendered environment. Some papers describe creating a motion trajectory for a robot using an MR headset. Still, these data are either not tied to the real environment at all or require pre-prepared environmental data. The proposed method allows the headset to be used as a scanner to create a preliminary navigation map, which can subsequently be used to generate a plan and trajectory for a mobile robot, as well as for simulation using the same headset, which can solve the problem of integrating the real world and virtual visualization for positioning and mapping in many existing works related to MR and mobile robots.
Optically transparent MR head-mounted displays enabled the creation of world-locked holograms for hybrid physical–virtual workspaces but have some limitations, including a limited field of view [14].
The work of G. Manfredi demonstrated an MR app for navigation in high-rise buildings using the Meta Quest 3 headset, although current MR headsets are not specifically designed for rescue teams, exploring the utilitarian potential of indoor applications without considering the suitability of the hardware for outdoor deployment [15].
The virtual learning environment was created using the Meta Quest 3 headset in S. Lang’s work to create a highly immersive and engaging user experience on a wearable device. Using the integrated hand-tracking feature, users interact directly with the virtual environment [16].
A significant advance in the application of the Meta Quest headset is evident in the work of Cantarelli, who presents the development and functional evaluation of an MR lab designed to simulate industrial assembly and disassembly processes, in which a digitization workflow that combines laser scanning with hybrid mesh generation simplifies the creation of 3D environments [17].
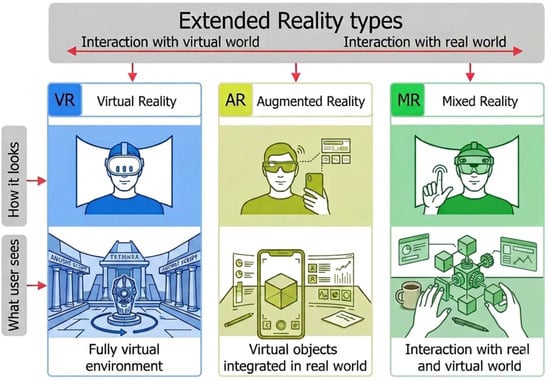
The types of extended reality (XR), represented in Figure 2, included: virtual reality (VR), where users interact with a headset with a fully virtual world and do not see the real one; augmented reality (AR)—the user sees virtual objects on a smartphone or table, which are overlayed on the real world; and mixed reality (MR), where the user sees virtual objects that are overlayed on the real world using technology, allowing the user to interact with both worlds. MR in particular is emerging as a transformative platform for medical education. Traditional methods do not convey complex spatial relationships. MR technology addresses these limitations by providing an immersive environment where virtual elements merge with real-world contexts. As an example, MR is emerging as a transformative platform for medical education. Wei’s hierarchical information design supports incremental learning, guiding users from basic anatomical labels to detailed structural insights [18].
Figure 2.
Illustration of the different types of Extended Reality.
Some modern MR headsets can overlay augmented images of interfaces and simulations onto reality in real time, as well as scan and navigate space without additional markers. In various industries, including robotics, MR headsets are used not only to visualize graphics superimposed on reality, but also for training, simulations, or remote control [19,20,21].
Technically, some headsets have full room scanning capabilities but are only used to ensure user safety in VR mode by switching the headset to passthrough mode to reveal the real world. However, this technology has greater potential for use in creating navigation maps and training in various specialties, including medicine [20,22,23,24].
To improve human–robot interaction, S. Gupta [25] presents a speech-based mobile robot wireless control system that uses an ESP32 microcontroller (Nan-Ke North Rd., Southern Taiwan Science Park, Tainan, Taiwan) to control the motors and facilitate Bluetooth communication, and an Android application to implement real-time speech recognition logic. Since the Android device processes speech and the motor commands are handled by the ESP32, the study achieves significant performance gains through the distributed architecture while maintaining low feedback control latency. Ch. Wang [26] proposed a multi-perception fusion method for shared control systems to address adaptability issues in complex environments within human–robot collaboration. The development and implementation of augmented reality simulation for mobile robots using ROS2 and Unity3D (New York, NY, USA) was demonstrated in P. The work of Aryan [27] can simulate robotic scenarios in both VR and MR modes, supporting different use cases. The modular architecture of the system and the use of standard ROS2 communication protocols facilitate integration with existing robotics tools. The system supports simulation of LiDAR and IMU sensors, enabling testing of SLAM and navigation algorithms. Communicating robot intentions is crucial for ensuring safety in shared robotic environments. Still, it is currently difficult to clearly and timely communicate the robot’s intended movement or internal state, especially when users are busy with other tasks. Augmented reality (AR) offers an effective means to provide visual cues that convey such information. This study evaluates a smartphone-based AR interface designed to convey robot navigation intentions and improve user situational awareness (SA) in shared human–robot environments, as discussed in S. Chacko [28].
This article proposes a method for creating preliminary navigation maps for mobile robots, using an MR headset as both a scanner and a simple, intuitive interactive visual interface for editing navigation maps, setting limits, and defining restricted areas. Additionally, it is possible to simulate a digital twin to verify the operation of navigation algorithms and the constructed route. Finally, it is possible to upload the finished map to the mobile robot, and it will be ready for operation immediately. As it moves, the robot will improve the map using built-in sensors. Thus, even someone with no experience can configure a mobile robot without stopping production or endangering other people or equipment.
The main goal of this work is to assess the feasibility of using a mixed reality headset as a 3D scanner and to use the resulting 3D model to create a mobile robot map. In future work, it is planned to test the generated map using a mixed-reality headset with a real mobile robot and compare it with existing robot motion algorithms for creating navigation maps, evaluating both quality and user-friendliness.
2. Materials and Methods
This section will describe the possibilities and methods for using a selected mixed-reality device to scan a room and generate a navigation map for the mobile robot from that 3D model. Also, a software hierarchy, experimental problems, and hardware specifications will be described.
2.1. Equipment and Software
The Meta Quest 3 headset, produced by Meta Platforms, Inc. (Menlo Park, CA, USA), was used as a mixed-reality device. Nowadays, there are different mixed reality headsets available that can make a 3D scan of the room, such as Meta Quest 3, Pico 4 Ultra (PICO Interactive (ByteDance), Beijing, China), Apple Vision Pro (Apple Inc., Cupertino, CA, USA), Magic Leap 2 (Magic Leap, Inc., Plantation, FL, USA), and Microsoft HoloLens 2 (Microsoft Corporation, Redmond, WA, USA). All of them are popular in development fields but have very different prices. Apple Vision Pro, Magic Leap 2, and HoloLens 2 fall into the higher-priced equipment segment, costing more than EUR 3000, and are usually used for development and enterprise solutions. They have precise sensors, and some of them can scan a room in real time. Meta Quest 3 and Pico 4 Ultra are more budget devices, priced under EUR 800, designed for gaming, and they also have sensors for 3D scanning, but with lower resolution. Those headsets provide the necessary functionality to test the proposed method at a significantly lower cost.
The Meta Quest 3 was selected as the hardware platform for conducting the experiments because it met all the study’s technical requirements and was already available to the research team, allowing testing without incurring additional equipment purchase costs. The device has integrated sensors for room 3D scanning, movement, and hand tracking, with and without spatial controllers, which informed the choice of this equipment. This device has two color displays with 120 Hz and 2064 × 2208-pixel resolution, which is 21 PPD (Pixels Per Degree) or 1218 PPI (Pixels Per Inch) for comfortable extended-reality viewing [29]. Additionally, there are two integrated color cameras for passthrough view to the user, four monochrome cameras with IR (Infrared) spectrum, an IR line projector for room 3D scanning and positioning, and an IMU (Inertial Measurement Unit) accelerometer and gyroscope module for correct orientation in the environment. The headset uses 3D scanning as a safety feature to prevent the user from bumping into real-world obstacles, such as walls or furniture. The headset creates a 3D model of a room and establishes a safe zone within which the user can be in the VR world without seeing the real world. If the user steps out of this zone, the headset will display the real world to prevent collisions. Compared to some other popular headsets, such as HTC Vive (HTC Corporation, Taoyuan, Taiwan) [30] and Valve Index (Valve Corporation, Bellevue, WA, USA) [31], it requires a connection to a computer. Thus, the Meta Quest 3 headset can operate autonomously with an integrated Qualcomm Snapdragon XR2 Gen 2 CPU, 8 GB of RAM, and 128 GB of storage [32,33]. Meta Quest 3 can work in all XR modes: Virtual Reality, Augmented Reality, and Mixed Reality. Microsoft HoloLens also has integrated hardware and sensors for room scanning. Still, the price is much higher because it uses more expensive visualization technology, using a projector and a special prism that optically combines real-world vision with a virtual image.
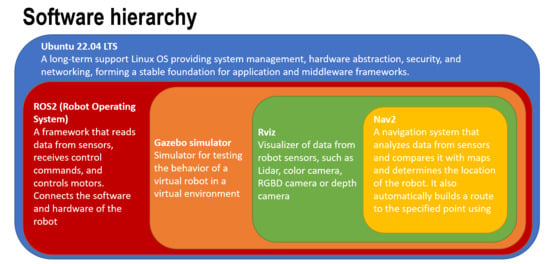
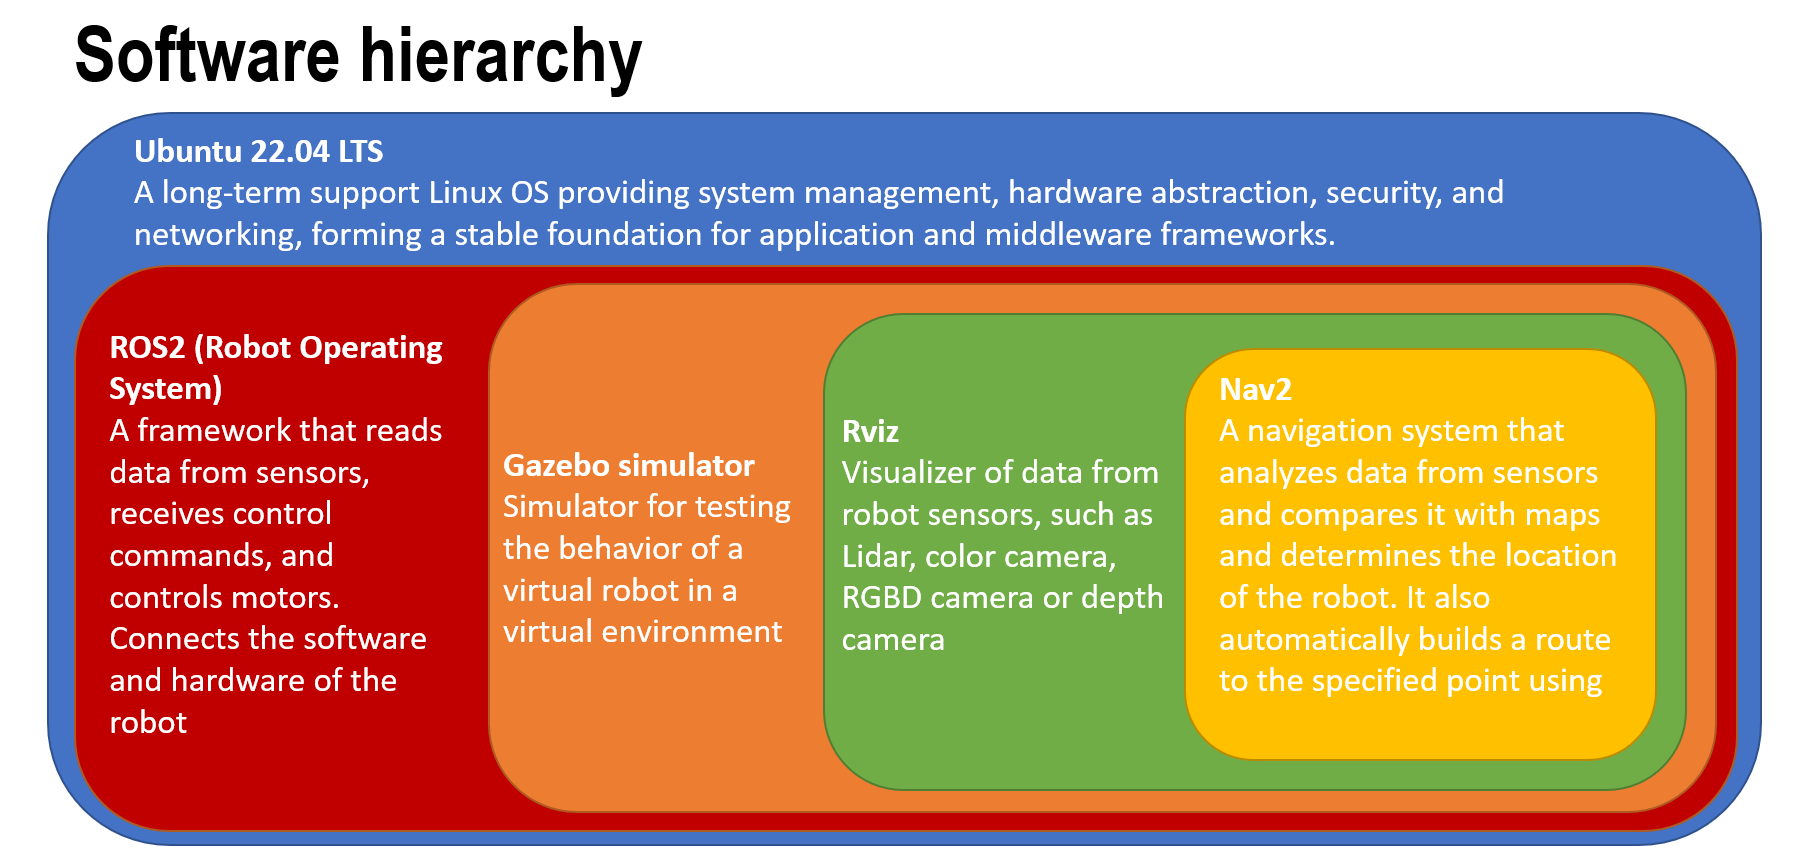
For the experiment and simulation, a personal desktop computer was used with the following specifications: Intel Core i5 8400 CPU, 16 GB of RAM, Nvidia GT1030 2 GB, and a 240 GB SSD, running Ubuntu 22.04 LTS. Software for experiment testing includes ROS2 Humble (https://docs.ros.org/en/humble/index.html, accessed on 28 August 2025), Gazebo Ignition Fortress simulator (https://docs.ros.org/en/humble/index.html, https://gazebosim.org/docs/fortress/ros2_integration/, accessed on 28 August 2025), and RViz for sensor data visualization. Additionally, the Nav2 module was installed for path planning and to run the TurtleBot 4 simulator. The software hierarchy is shown in Figure 3.
Figure 3.
Software hierarchy for the experiment.
Such a software hierarchy, implemented in the current research, is not fixed but is organized according to common practice in the field of mobile robotics.
2.2. Environment Setup
To test a method, rooms with different shape configurations were selected: an office cabinet, a corridor, and a factory workshop. To compare the 3D scans of the rooms, the precise 3D models were manually recreated by measuring the real rooms and transferring these parameters to the 3D models, which were then used as reference models.
All selected rooms with different shapes and functions in the university building were scanned using a Meta Quest 3 Mixed Reality headset.
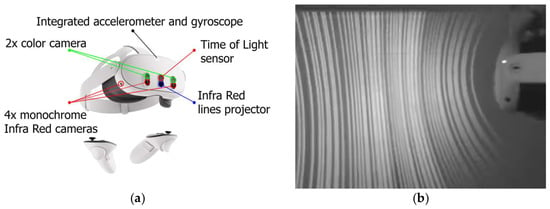
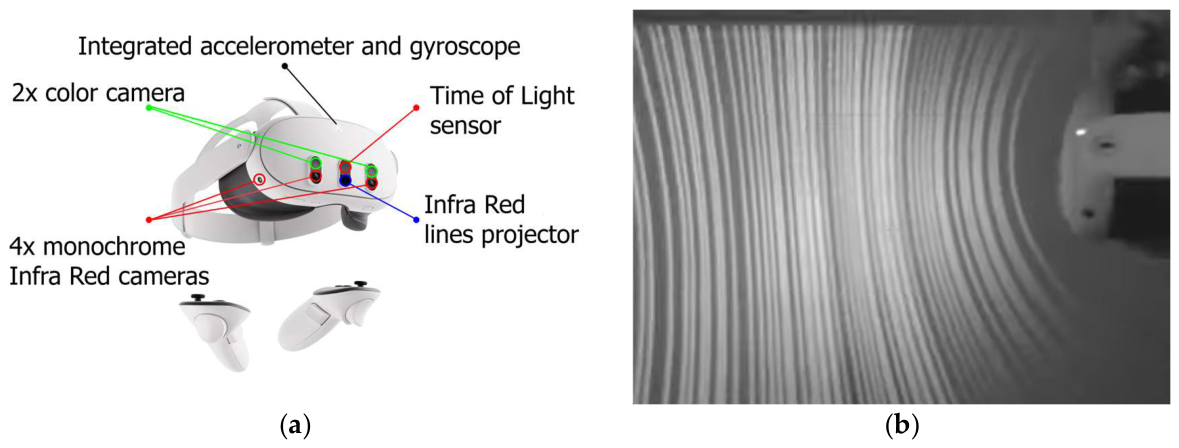
Scanning was performed using a simple method: the user put on the glasses, started the program, and began scanning by moving their head along the vertical and horizontal axes while walking around the room, receiving a visual representation of the room. The scanning tests were performed differently: scanning time, distance to walls and objects, lighting conditions, horizontal, vertical, and tilting movements of the headset, and its reaction to glass obstacles. These methods were chosen because of the specialized work required for the headset sensors. An integrated IR projector projects lines onto the front of the user, and four monochrome cameras detect IR light and those lines; the sensors are shown in Figure 4. Using these lines, the headset recreates the room and obstacles, employing a structured light scanning method that works up to 2 m from the user. The headset also uses data from all cameras and a photogrammetry algorithm to improve the quality of the 3D model of a room, either in addition to or when the IR projector does not work. One of the tests was to scan using a blocked IR projector, and the photogrammetry algorithms worked well but produced slightly worse scanning quality.
Figure 4.
Sensors of Meta Quest 3: (a) Locations of the sensors; (b) Line projector pattern for the 3D scanning system [10].
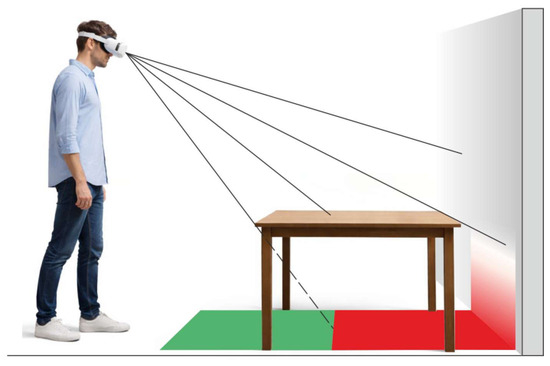
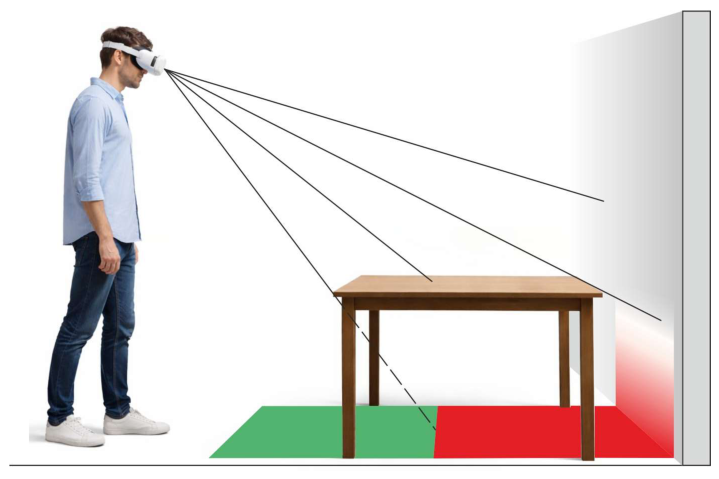
The equipment used for this study has certain limitations. The 3D model of the room has inaccuracies due to low resolution and possible scanning errors specific to this equipment, but positioning is quite good. The sensors and software of the Meta Quest 3 headset are primarily designed to create a safe zone for the user, preventing collisions with objects or walls in the room. The scanning system of the Meta Quest 3 device is of sufficient quality for indoor scanning and for use as a collision-avoidance system and extended-reality media, which are typically displayed at human head height. This method has some disadvantages when applied to mobile robotics mapping because it is more suitable for sensors located at the same height as the robot sensors, since a high viewing angle creates blind spots for mapping, as shown in Figure 5.
Figure 5.
Visual representation of the “blind zones” of room scanning using a mixed reality headset, where the green marked zone represents a scan performed properly, and the red zone represents the areas undetected for visibility. It will generate wrong information about the area geometry.
The area of the blind spots may differ from the information obtained using the robot’s cameras, usually because this method is based on an assessment of the space from a human eye-level perspective.
The headset used can improve the map with additional information about the topography of the area, including hard-to-reach areas, for example, under some furniture or other structures, by changing viewing height and viewing angle. To avoid collisions, most moving robot models use LIDAR, and some industrial models are placed as close to the floor as possible. Although modern robots also have a movable bumper with a contact sensor, used as a last resort to avoid collisions, and additional sensors may be included to prevent collisions and falls from ledges, mapping with devices built into the robot structure is not always effective. Our proposed method for mapping can be economically beneficial, especially when solving trajectory planning for transportation robots.
2.3. Data Transformation
The most important part of this research is the proper transformation of data and its adaptation to create maps for various equipment capable of autonomous movement. Using the headset, we obtained a 3D scan of the room. Still, for navigation, the mobile robot requires a navigation map, in most cases, in the form of an occupancy map, to be compatible with already existing mobile robot models and their software. This map consists of a matrix of pixels, with each pixel representing the occupancy of a given space. Since the pixel size determines the resolution of the received image, additional solutions can be applied when using a different type of headset. It may also be necessary to convert the information according to the software of mobile robots that will use it, thereby producing a map for general use. Therefore, to avoid overloading the robot controller with 3D map processing and to ensure greater compatibility with a mobile robot, it is necessary to convert this 3D model into a 2D map.
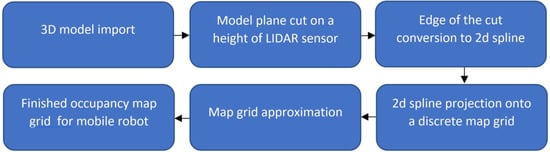
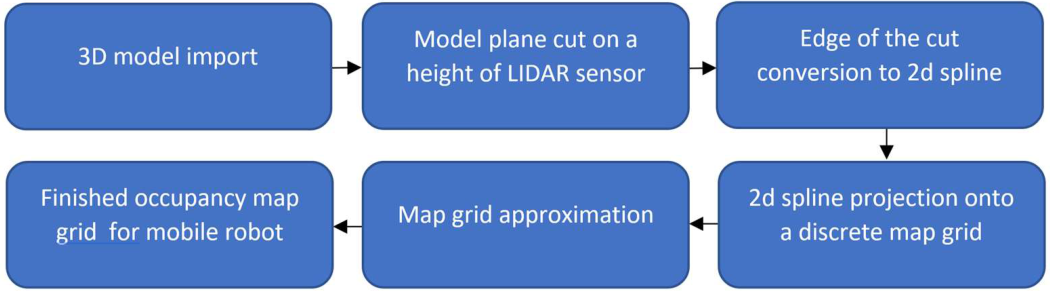
To solve this problem, a conversion method was devised that highlights obstacles on the map that are comparable in height to the mobile robot’s sensors. The 3D model is subjected to a cutting operation along a plane at the height of the LIDAR sensor’s scanning line relative to the floor level of the scanned room using the procedure described in Figure 6. The resulting cut contour is projected onto a plane, which allows it to be represented as a 2D vector spline. In the final stage, the two-dimensional vector representation of the contour was superimposed onto the discrete grid of the ROS 2 navigation occupancy map. Processing and converting a 3D model into a 2D occupancy map takes just a few seconds on a typical 2018 computer, so these conversion steps have virtually no impact on the total time required to create the map.
Figure 6.
Simplified model transformation.
A map slice at the level of the mobile robot’s LIDAR sensor is necessary to create an occupancy map compatible with the mobile robot. This is needed so that the robot can subsequently correctly combine data from the built-in sensors and the created navigation map.
A more detailed workflow of model transformation will be described in this section. A mixed reality headset completely performs the task of transforming experimentally collected data. The device takes sensor data and calculates the voxel positions of the point cloud in real time. The MR device, Meta Quest 3 in our case, provides a set of synchronized depth images , using a structured light scanning method with known or estimated camera poses . We define a truncated signed distance. over a volumetric grid . For voxel center x, the per-frame signed distance is:
where is the voxel in camera k’s frame, is the measured depth at the pixel onto which x projects, extracts the z component, μ is the truncation band, and clip truncates to [−1,1]. The VR frames are fused by weighted averaging:
with weights typically chosen from the angle of incidence or range confidence. This classical volumetric integration (Curless–Levoy) yields a smooth TSDF (Truncated Signed Distance Field); the zero-level set. is the least-squares optimal surface under standard assumptions [34,35].
Alternative (Poisson) meshing is used if the MR system exposes oriented points. , the watertight surface can be recovered by solving a Poisson equation for an indicator :
where is a smoothed vector field formed from the oriented normals. The isometric surface of gives the mesh; screened variants add soft pointwise constraints for better detail retention [36].
When the user moves, the camera captures the view from different poses; is partially unknown, point clouds (or partial meshes) are aligned by minimizing point–to–plane or point–to–point residuals:
with correspondences found iteratively to the Closest Point (ICP). Closed-form updates via Singular Value Decomposition (SVD) and proven monotone convergence to a local minimum are standard; robust and feature-assisted ICP variants widen convergence basins [37].
To use this data for further actions with the mobile robot, it needs to convert the 3D grid into a 2D occupancy map. This requires a cutting operation along a plane at the lidar sensor’s height. Let be the reconstructed surface (mesh or implicit). Choose a horizontal slicing band capturing traversable structures (e.g., ≈ lidar height). The 2D footprint set is:
Discretize the plane into grid cells with resolution r (m/cell). The ROS2 Gazebo simulator uses 50 mm × 50 mm size grid cells for an occupancy map. A binary prior map can be produced by z buffer rasterization of onto the grid; however, to remain probabilistic and sensor consistent, further regenerate the occupancy using a beam-based inverse model (below).
2.4. Map Generation and Comparison
After converting the mesh into an occupancy map, the scanned map may differ slightly from what the robot sees using its sensors. Still, the main part of the geometry matches, allowing SLAM algorithms to compare the two maps and navigate unknown spaces using the generated map. The generated occupancy map is a three-color PGM image, where each pixel represents a 50 mm × 50 mm square in the real world. Upon loading to the ROS 2 Nav2 map server, use a YAML file that contains environment data and parameters such as resolution, origin, occupied thresh, free thresh, negate, and generated PGM file. The server publishes a nav_msgs/OccupancyGrid on the map topic; the same format is used by AMCL and global costmaps [38,39,40,41].
Next, let us look at the algorithm for matching two maps. Let denote “cell i is occupied.” Given known robot path and range measurements , we factor the posterior approximately as independent cell posteriors and apply a binary Bayes update per cell. In logarithmic odds form:
with prior . The inverse model assigns positive evidence to the end point cell and negative evidence to cells traversed by the beam (ray casting via DDA/Bresenham), typically saturating to avoid numerical lock-in; probabilities are recovered by . This formulation is the standard in probabilistic mapping and is consistent with Moravec–Elfes and its later log odds derivation.
System understanding of how to change a map using sensor data involved a method of a practical inverse model. For a range beam at bearing , all cells iii along the ray up to the measured endpoint , the endpoint (if ) receives , and cells beyond are unchanged. Multi-modal or multi-target sensor models extend this to wide FOV sensors [42,43].
In this study, the experimental environment consisted of a simulation based on both a manually recreated 3D model and a 3D scan of the same environment. Since the virtual environment and the robot’s sensors were identical, the maps generated by different methods were identical, except for the experiment that used the 3D scan model. Therefore, it was decided to compare the time required to create maps using different scanning algorithms, including a 3D scan of the environment acquired with an MR headset. To compare the proposed 3D scan-based map creation method with another method that uses different robot movement algorithms, a computer simulation was used. The ROS2 platform was selected for this purpose, with the Gazebo simulator installed with an add-on. A navigation map can be generated by using a virtual robot that moves through and scans a reference virtual room with a LiDAR sensor, as if in real life. To create this type of map, various movement algorithms are typically used, such as manual, wall-following, and frontier exploration.
Manual mapping: requires the user to control the robot to create a navigation map, which requires specialized skills.
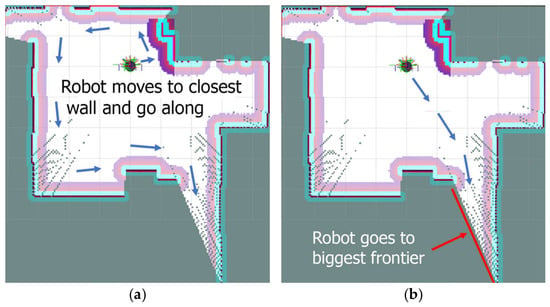
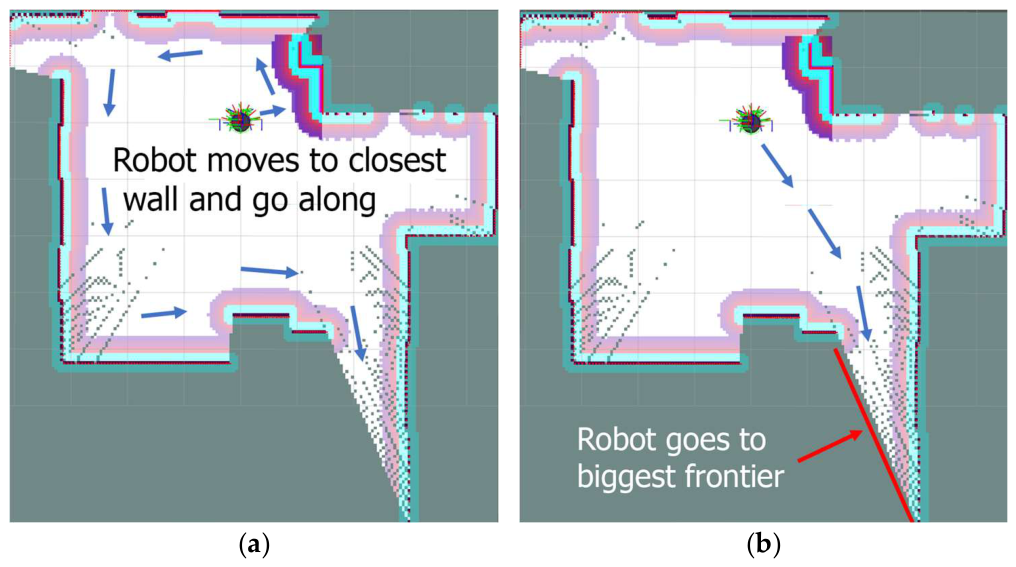
Wall following: The robot scans a room, searches for the closest wall, and then follows along the wall (Figure 7a).
Figure 7.
Visualization of robot moving algorithms: (a) wall following, (b) frontier exploration. Red colour: detected border of the room by scanning; purple: deadly obstacle; cyan: the inscribed collision boundary; Dots—the spectral gradient of the inflation layer surrounding static obstacle; Blue colour: initially defined walls (before scanning); Arrows: defined by navigation system robot trajectory.
Frontier exploration: The robot scans the room and searches for the biggest frontier. After that, the robot plans the path to this frontier and scans until all perimeters are closed (Figure 7b). This is generated from a 3D scan, and the imported navigation map is given below in the text.
During testing, the time taken by the virtual robot to travel around the room and create its navigation map was recorded for comparison.
The maps obtained from the simulations were as close as possible to the reference 3D model and were used to compare with the map from the 3D scan. To compare the navigation maps in the obtained files, measurements were taken at identical points in each room.
3. Results
During the research, the time required to scan a room was recorded, and 3D room models were created for analysis. To compare the 3D scans with reality, we manually recreated room models with accurate dimensions as a reference.
3.1. Map Quality Evaluation
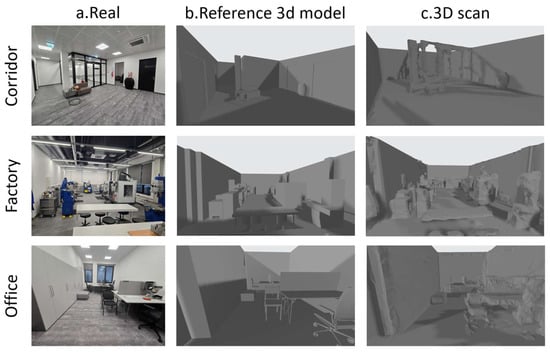
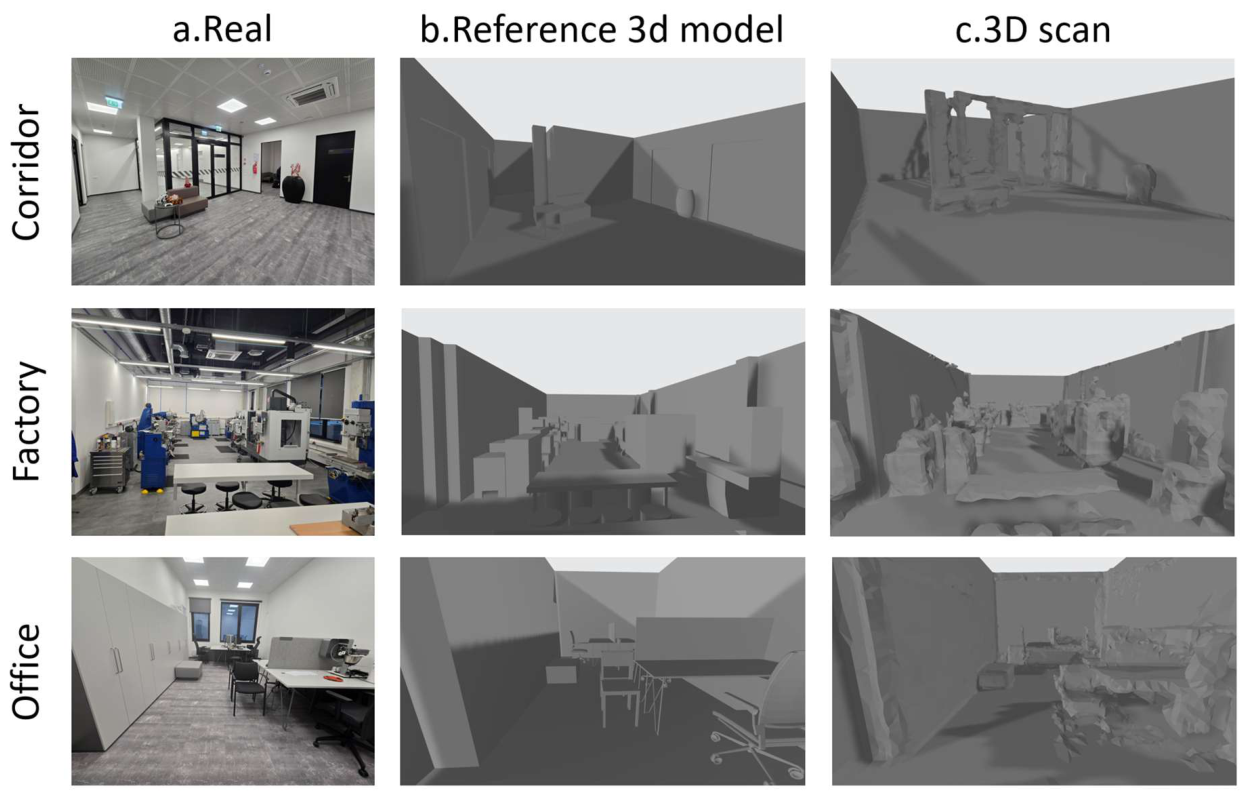
The visualization of all types of models and a photo of real rooms is shown in Figure 8. All this is necessary for the subsequent conversion of 3D models into navigation maps for a mobile robot, as well as for simulating robot movement using different algorithms to compare the proposed method with commonly used ones.
Figure 8.
Visualization of the factory environment: (a) (real) reference real factory room; (b) (Reference 3D model) manually recreated room; (c) (3D scan) 3D scan of the room.
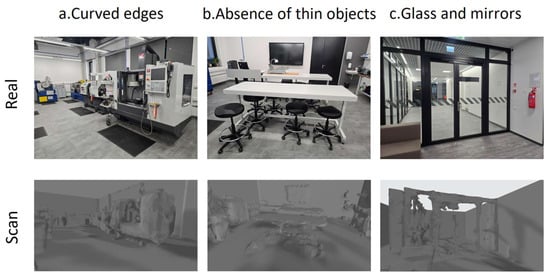
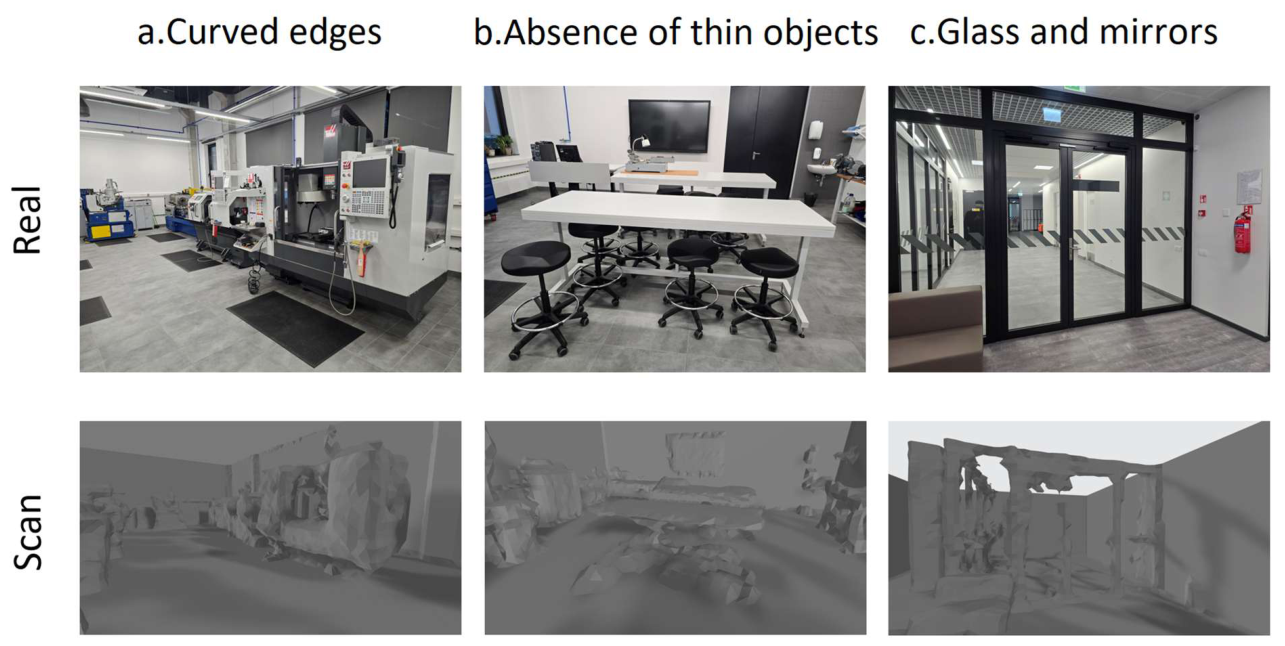
The research data are presented in the following order: Figure 9 shows a real photo of several rooms (Figure 8a), a 3D model (Figure 8b), and a 3D scan (Figure 8c). The resulting 3D models were analyzed, and the main scanning inaccuracies that could affect the quality of the map were identified, namely:
Figure 9.
Scanning errors: (a) (Curved edges) of right angles; (b) (Absence of thin objects) Low scanning resolution cannot capture small objects such as chairs and table legs. (c) (Glass and mirrors) are not visible as obstacles.
- •
- Rounded edges of some objects
- •
- Absence of geometry with thin elements or hidden elements
- •
- Glass and mirrors
These issues were identified during the processing and conversion of 3D scan models.
The rounded edges of some objects have a minor but noticeable impact on the accuracy of object boundaries on the map.
The absence of geometry for thin or hidden elements, such as chair and table legs, can make furniture appear to float in the air, which can affect the navigation map. But for a draft map used only for initial training, the robot will complete it using built-in sensors.
Glass and mirrors are still the biggest problem for navigation, as the robot’s optical sensors and MR headset are not always able to detect such obstacles. It is also planned to use the MR headset to interactively add virtual restricted areas or artificial obstacles to prevent the robot from colliding with them.
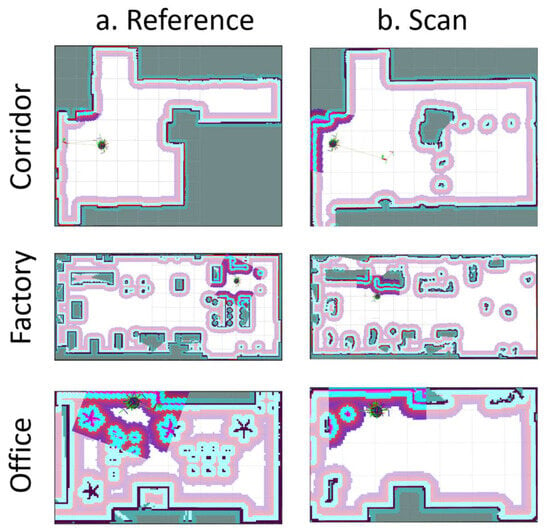
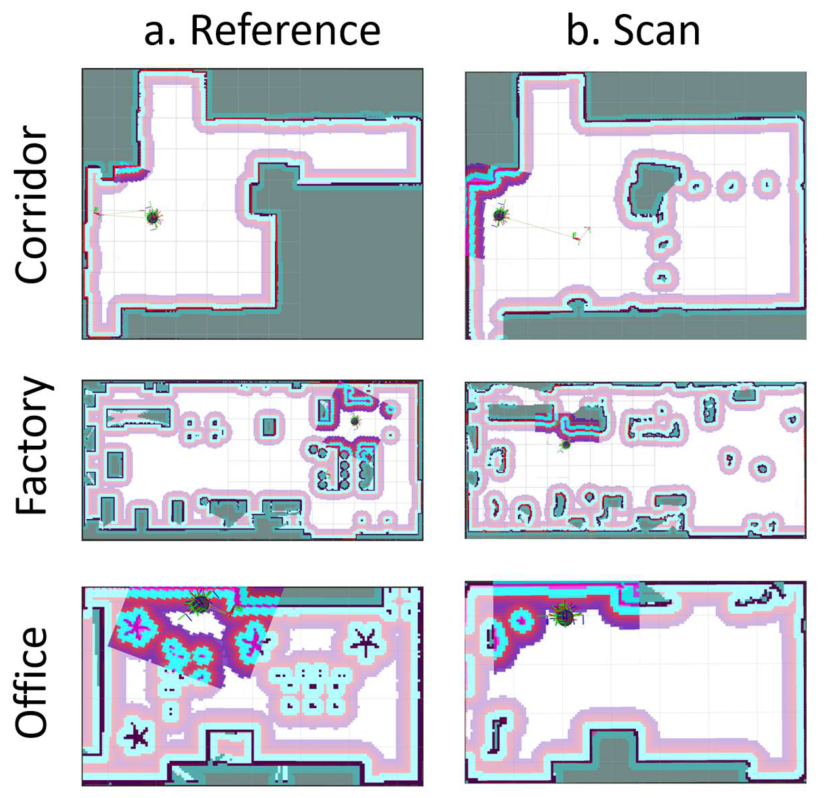
Figure 10 shows a simulation of area mapping with the proposed method using a cost map, which exhibits lower quality for small objects such as chairs and table legs because the system cannot detect them due to sensor resolution. However, the shape, size, and approximate location of obstacles in the room are correct.
Figure 10.
Visualization of mobile robot cost map with algorithm simulation: (a) Reference map; (b) map generated from 3D scan, with glass passage. Red colour: detected border of the room by scanning; purple: deadly obstacle; cyan: the inscribed collision boundary; spectral gradient of the inflation layer surrounding static obstacle; Blue colour: initially defined walls (before scanning).
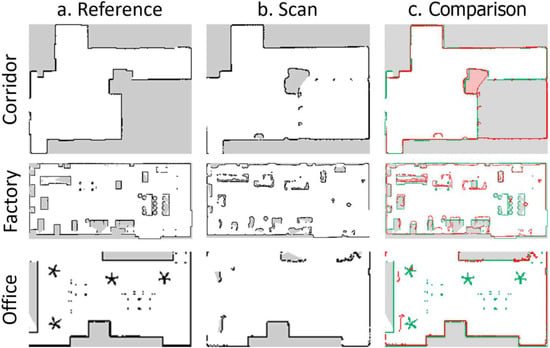
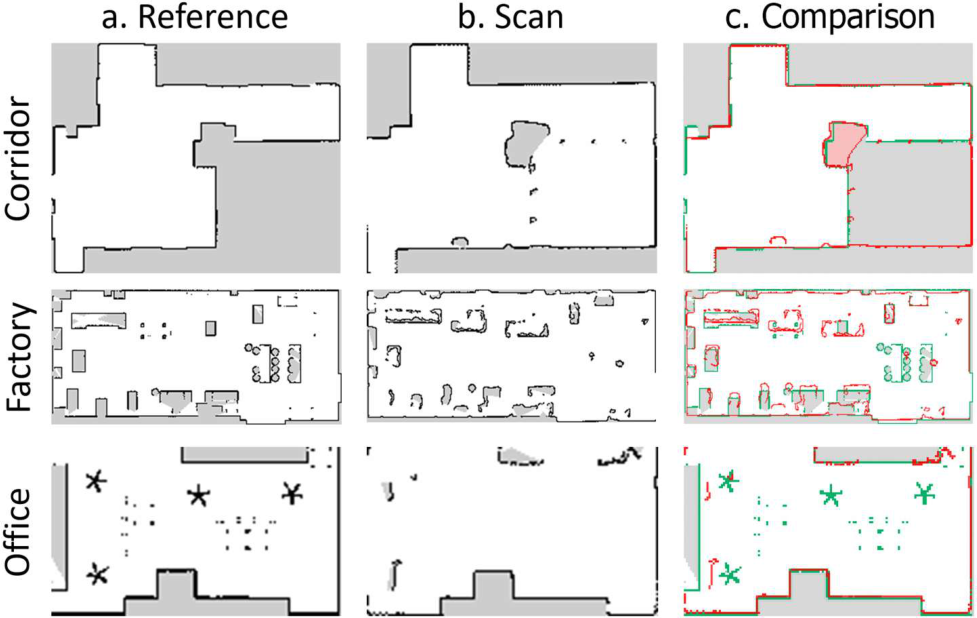
After simulation, the generated navigation occupancy maps were exported from RViz and compared between the reference and the scan. The final map visualization is shown in Figure 11.
Figure 11.
Visualization of generated mobile robot occupancy map for upload to the robot as navigation: (a) Reference map; (b) map generated from 3D scan as a preliminary map; (c) comparison of maps (green—reference, red—scan).
Measurements were divided into two groups: walls and obstacles (objects, furniture), as shown in Table 1, which shows calculated data. The table shows the maximum and minimum received errors when comparing the scanned model with the reference, as well as the calculated error percentage by size. The data were measured from 3D mesh, but after converting it to a 2d map, where each pixel on the map is a square section of the room corresponding to a 50 mm × 50 mm area, and by calculating the difference in pixels, we concluded that the headset scans walls with an error of no more than 0.7% of their size.
Table 1.
Calculated measurements and percentage errors.
For example, in a factory room measuring 15.9 m in length, the error was no more than 15 cm. In shorter sections, it was less than 5 cm, and the difference was almost negligible. However, when examining obstacles, the error is higher due to insufficient viewing angle and sensor resolution. Therefore, the proposed method is recommended for use as a template map.
3.2. Navigation Performance
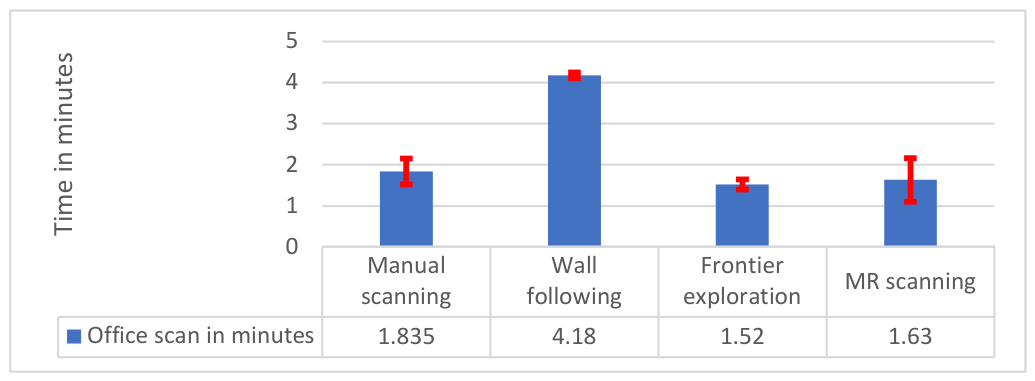
After processing the 3D models, they were imported into the ROS2 Gazebo simulator to test and compare the performance of the robot motion algorithms used to build navigation maps. The results obtained were the time required to scan the room and a comparison of the quality of the navigation map construction. Conventional methods were tested using different algorithms, such as manual control, wall following, and frontier exploration, which use the mobile robot’s built-in sensors and require the operator’s skills and spatial thinking to construct a map. Compared to the mixed reality method, it takes about the same time but offers a more intuitive interface and better visualization of the process. After testing those algorithms, the scanning time is used as a quantitative criterion for the scan. The quality and precision of the created map are assessed by comparing its dimensions with those of objects and walls, with relative quality expressed as the percentage of used pixels in the reference space.
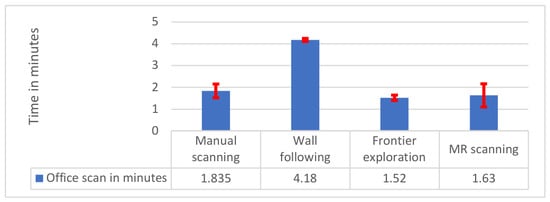
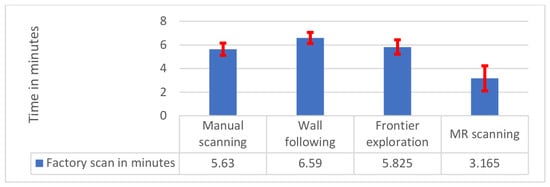
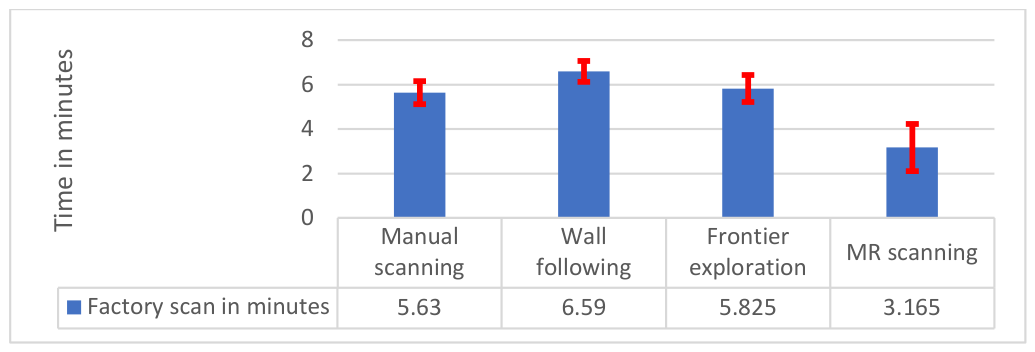
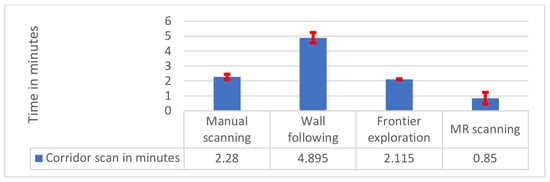
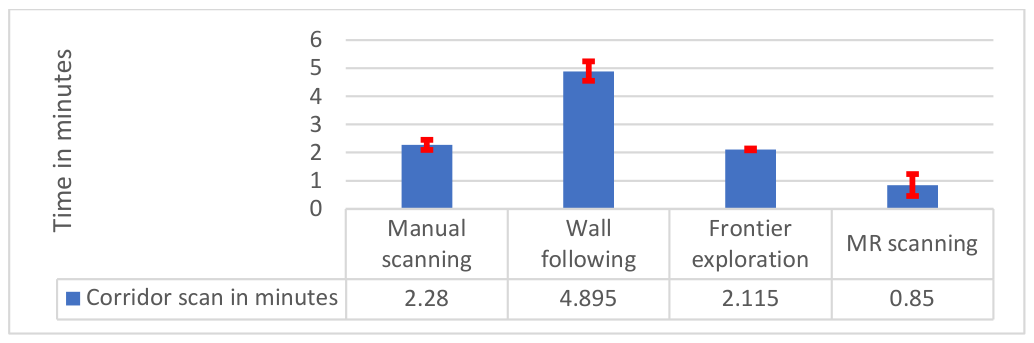
The results of the study are presented as the minimum and maximum times spent creating a map using the methods listed above, including the proposed method. The results obtained are presented in Figure 12, Figure 13 and Figure 14.
Figure 12.
The time required for office scans using different robot movement algorithms and mixed reality headset scans.
Figure 13.
The time required for factory scanning using different robot movement algorithms and mixed reality headset scans.
Figure 14.
The time required for corridor scans using different robot movement algorithms and mixed reality headset scans.
These graphs visually show the average time spent creating a room map (Figure 13), as well as the minimum and maximum values due to errors in the movement of the robot or person wearing the MR headset.
The information provided proves the applicability of this method in robotics as one of the options for creating a navigation map for a mobile robot.
4. Discussion
The quality of the navigation maps obtained using the 3D scanning method with an MR headset is sufficient to construct rough navigation maps for a mobile robot, because the dimensions and shape of the rooms are measured with an error of no more than 0.7% relative to the measured room length. However, not all objects in the room could be scanned accurately enough due to insufficient resolution in the headset’s sensors. But their approximate outlines can be used to mark obstacles on the map. The proposed method allows you to create rough navigation maps, considering that the mobile robot, using SLAM algorithms, will navigate using the created map in a new area and will improve its detail as it moves.
The time spent scanning with an MR headset is on par with other methods and algorithms for robot movement-based mapping, and in some room configurations, it can even be a faster alternative.
As with most optical sensors, there is a problem with identifying mirrors and glass, transparent obstacles; during scanning, they were marked as a continuation of space, which is subsequently interpreted as additional space on the map. This problem applies to both the proposed scanning method and existing methods for creating navigation maps using a robot. However, since an MR headset is planned for use as a visual map editor and route planner for the robot in the future, this method allows the user to specify areas with mirrors and other obstacles during editing.
In the future, experiments are planned to integrate the headset-generated map into a robot that has never been in this room before and compare it with alternative methods in real-world work rather than in simulation.
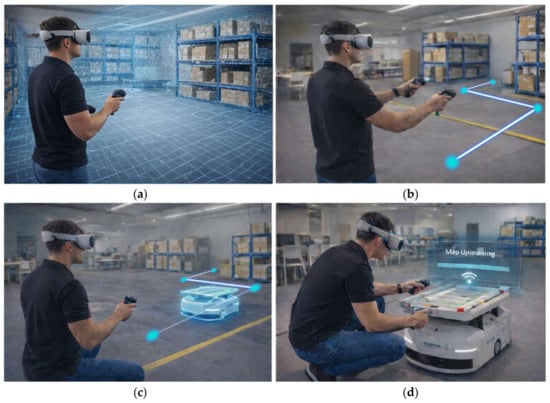
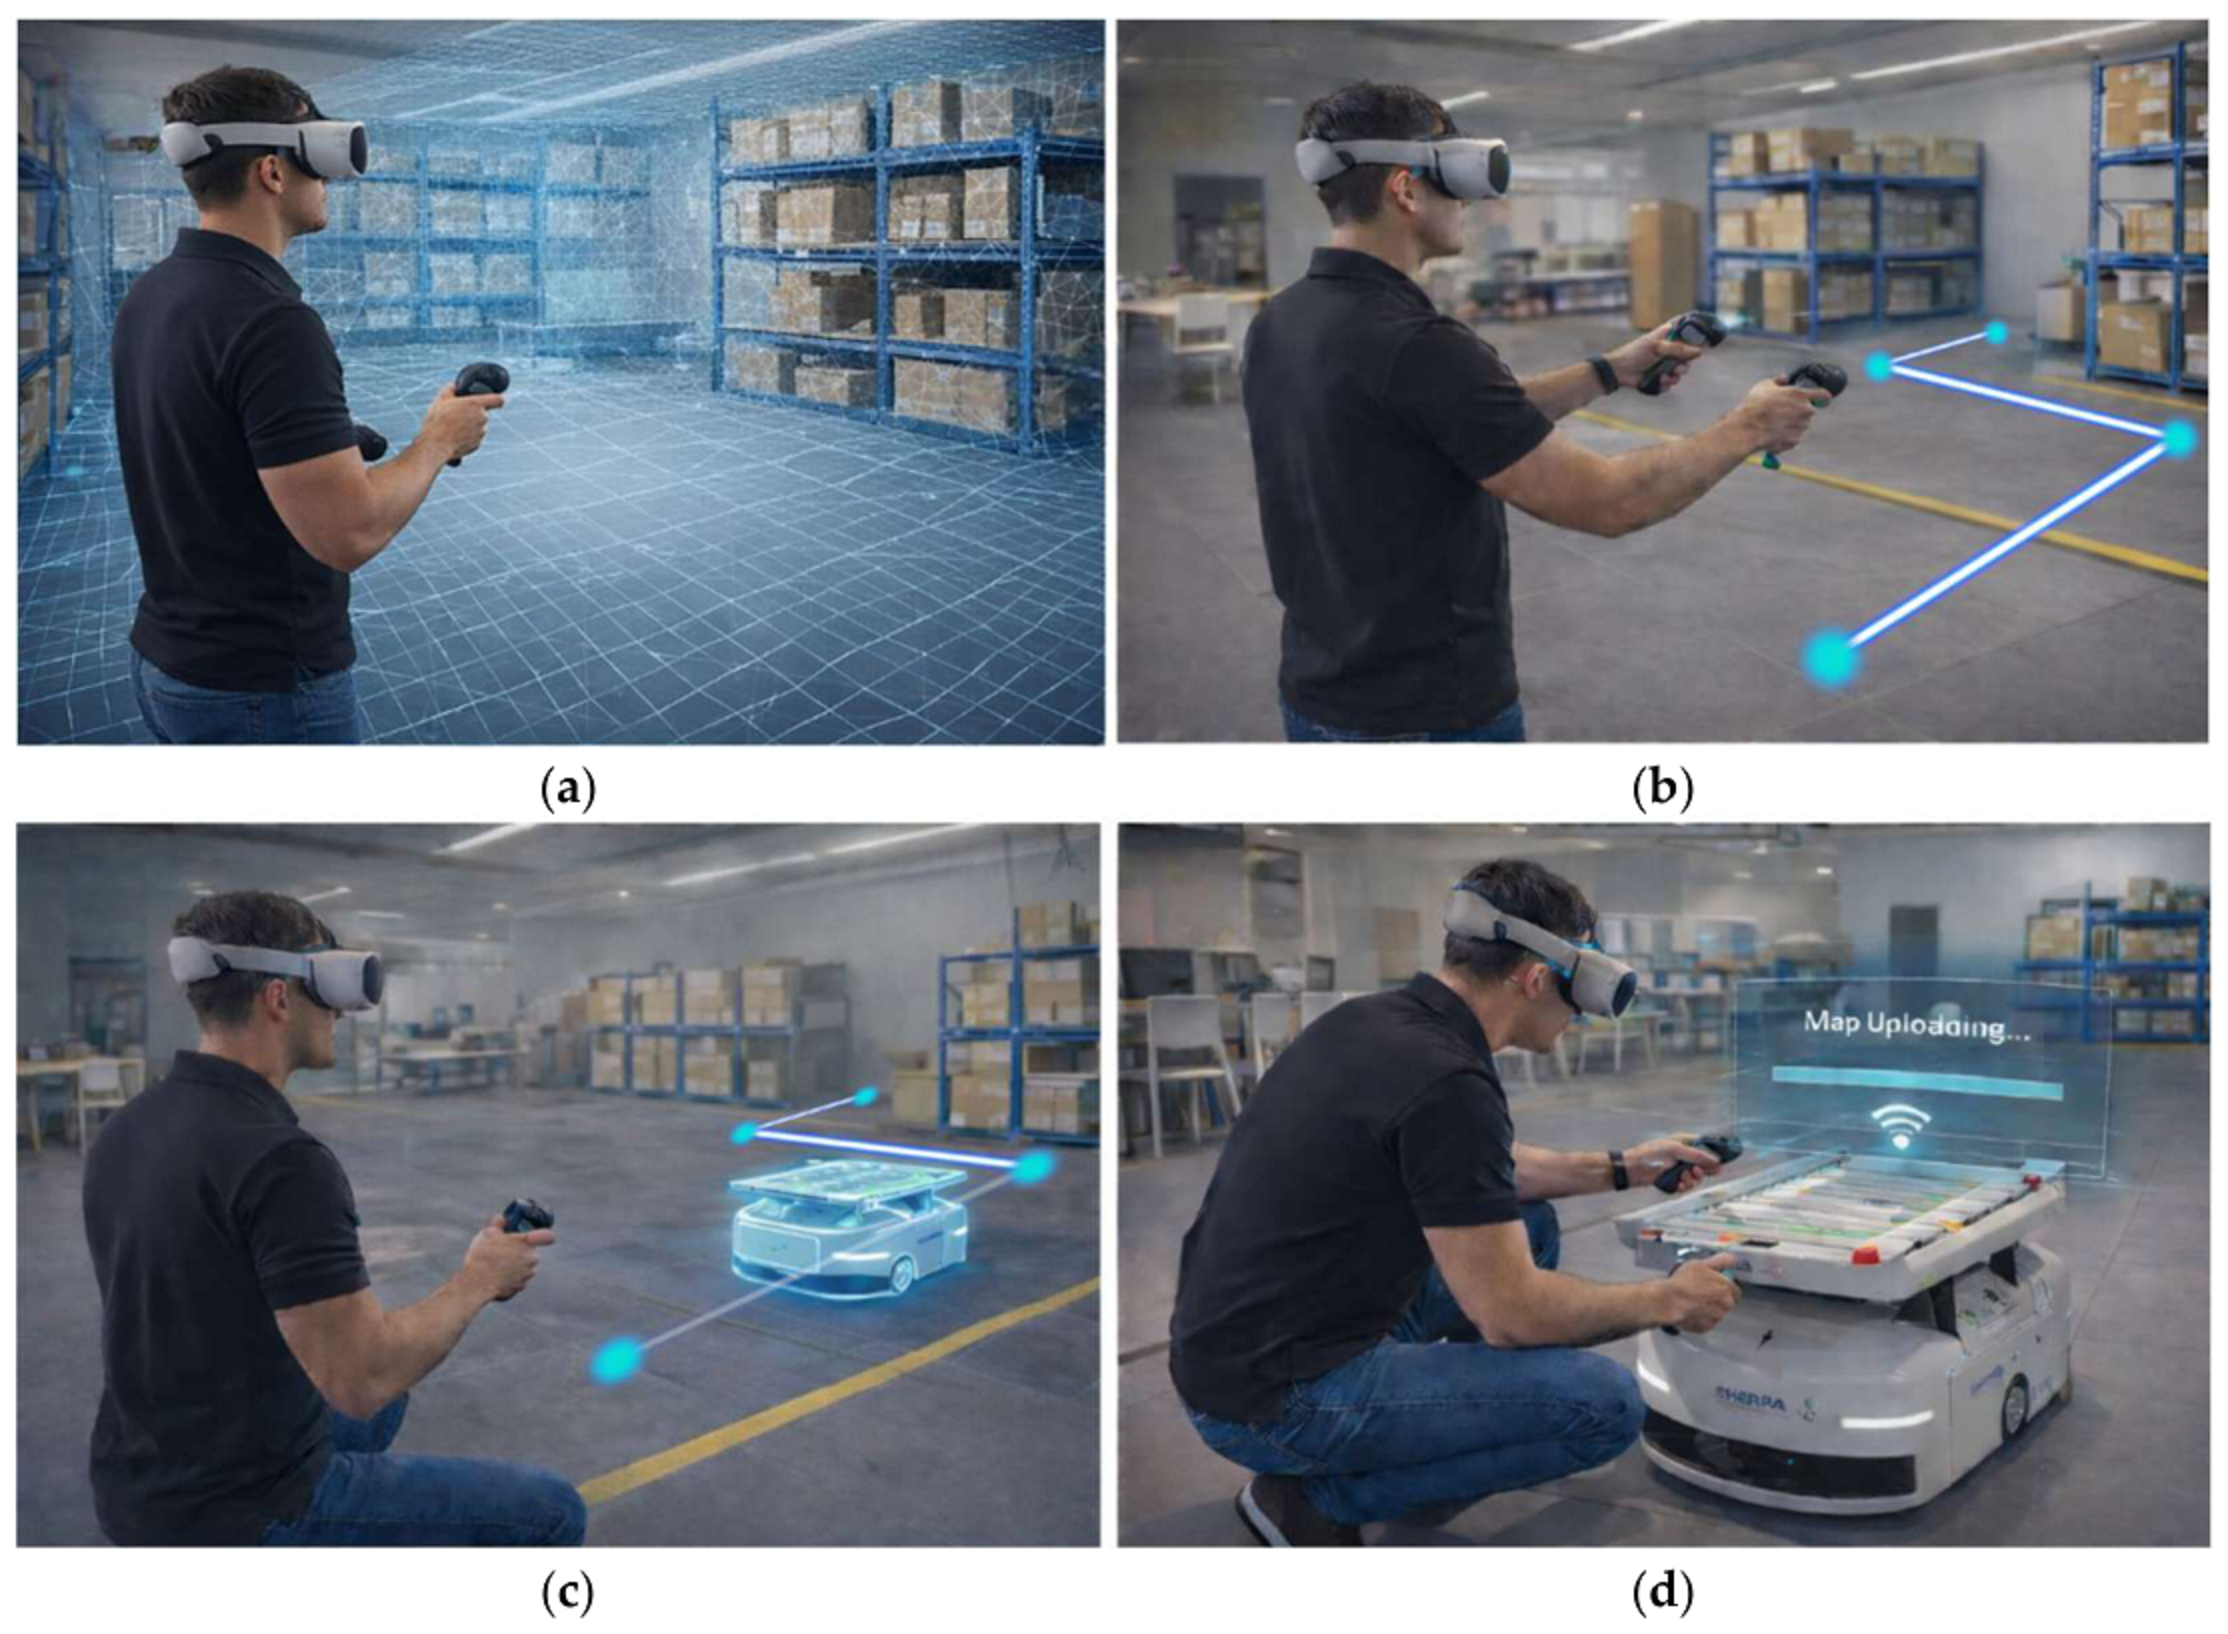
This article describes a method that demonstrates the possibilities of using a single device to perform several tasks in mobile robot setups and is intuitive for most people. It is possible to scan a room and generate a draft of a navigation map, set a path, and test this path with Digital Twin virtual robot movement simulation, which the user can see as an augmented object. It is also possible to adjust the path and, if everything is correct, directly from a headset upload a map to the mobile robot, which can start work immediately, represented in Figure 15.
Figure 15.
Steps of use of the proposed method of Mixed Reality headsets, generated by AI: (a) Scanning of the environment; (b) Path planning using Mixed Reality; (c) Virtual digital twin simulation in augmented reality; (d) Navigation map and path upload to a mobile robot.
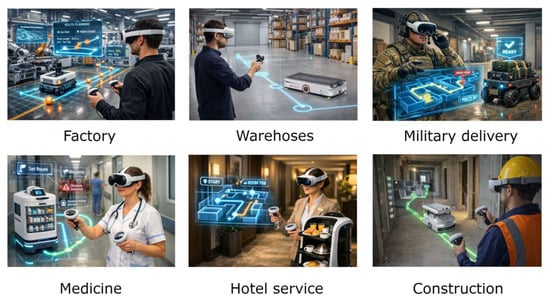
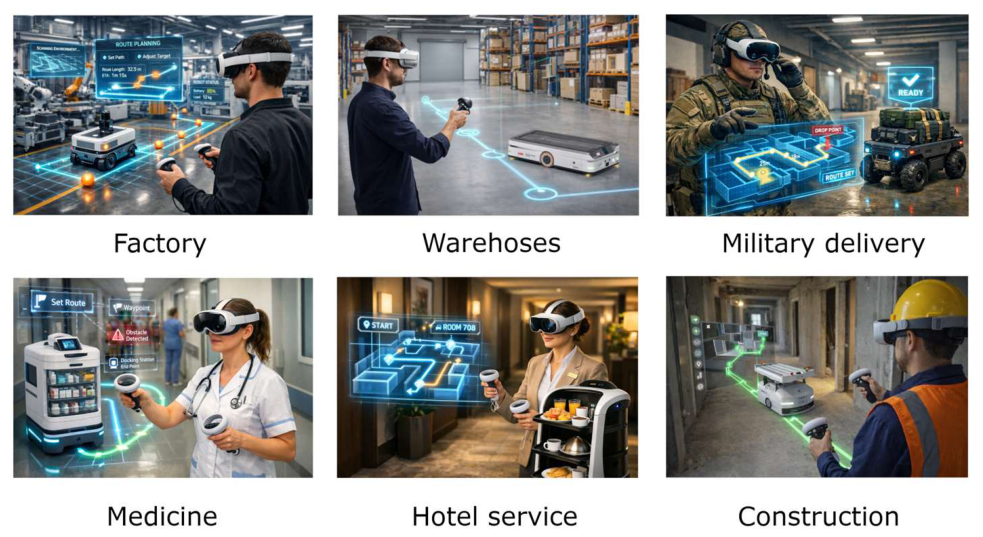
There can be many use cases, such as navigation map generation and path planning for the delivery of goods in factories or warehouses, military equipment, medical supplies in hospitals, breakfast in hotels, and construction materials.
The most useful application may be to change locations or room configurations, such as in construction. The visualizations of the examples are shown in Figure 16.
Figure 16.
Visual representation of use case examples; images are AI-generated.
5. Conclusions
Although several publications and extensive studies have made progress in integrating VR technologies with robotics, several gaps remain. The results obtained demonstrate that the proposed method for creating draft navigation maps for mobile robots using MR headsets can be applied, is sufficiently accurate, is comparable in time to other methods, and is more visually intuitive. Devices such as the Meta Quest 3 can allow users to see digital content superimposed on their physical environment while providing a full MR experience. The presented method can be used to create preliminary maps for various applications, including autonomous cargo transportation for robots and emergency response. MR systems achieve lower cognitive workload and a positive user experience, and they can be used for real-time navigation in multi-story buildings. MR technology still has challenges that may disappear as more mature hardware and software are developed. Feedback from the manufacturer and research that reveal opportunities for improvement are currently a very important direction of such research, as the possibilities and practical applications in production, learning platforms, rescue operations, and everyday life are obvious. In cases where guidance on working with operators at different locations along the trajectory is needed, the possibilities for managing real-time interactions will be considered, addressing standard challenges such as transparent obstacle recognition, collision avoidance, priority planning, and collective task optimization. Another possible step in the development of the manufacturer’s equipment would be the use of machine learning to predict the operator’s next actions, allowing the collaborative robot to adapt its trajectory or task in advance to reduce interaction delays.
Future work will explore scenarios involving multiple collaborative robots and operators, leveraging a headset-based map and conventional IoT methods, with modifications to data transmission. The possibilities of performing tasks under the control of multiple operators will be explored. The possibility of transferring the acquired experience to a newer generation of Mixed Reality equipment will also be explored.
Author Contributions
Conceptualization, V.B. and O.S.; methodology, A.D.; software, O.S. and A.Č.; validation, I.I., A.D. and J.J.P.; formal analysis, V.B.; investigation, O.S.; resources, A.Č. and V.B.; data curation, A.D. and A.Č.; writing—original draft preparation, O.S.; writing—review and editing, J.J.P. and A.D.; visualization, I.I.; supervision, V.B.; project administration, A.D.; funding acquisition, O.S. All authors have read and agreed to the published version of the manuscript.
Funding
This research received no external funding.
Data Availability Statement
The raw data supporting the conclusions of this article will be made available by the authors on request.
Acknowledgments
During the preparation of this manuscript, authors used ChatGPT (OpenAI, version GPT-5.1 2025) for the following purposes: generating visualizations of workflow, and possible use cases. The authors have reviewed and edited the output and take full responsibility for the content of this publication.
Conflicts of Interest
The authors declare no conflicts of interest.
Abbreviations
The following abbreviations are used in this manuscript:
| SLAM | Simultaneous Localization and Mapping |
| ToF | Time of Flight |
| XR | Extended Reality |
| VR | Virtual Reality |
| AR | Augmented Reality |
| MR | Mixed Reality |
| 3D | Three-Dimensional |
| ROS 2 | Robot Operating System 2 |
| Nav2 | Navigation 2 Framework |
| RViz | ROS Visualization Tool |
| LiDAR | Light Detection and Ranging |
| SA | Situational Awareness |
| AI | Artificial Intelligence |
| Hz | Hertz |
| PPD | Pixels per Degree |
| PPI | Pixels per Inch |
| IR | Infrared |
| IMU | Inertial Measurement Unit |
| CPU | Central Processing Unit |
| RAM | Random Access Memory |
| GB | Gigabyte |
| SSD | Solid-State Drive |
| TSDF | Truncated Signed Distance Field |
| ICP | Iterative Closest Point |
| SVD | Singular Value Decomposition |
| AMCL | Adaptive Monte Carlo Localization |
References
- Lobo, J.; Marques, L.; Dias, J.; Nunes, U.; de Almeida, A.T. Sensors for Mobile Robot Navigation. In Autonomous Robotic Systems; Springer: London, UK, 1998; pp. 50–81. [Google Scholar] [CrossRef] [Scilit]
- Kam, M.; Zhu, X.; Kalata, P. Sensor Fusion for Mobile Robot Navigation. Proc. IEEE 1997, 85, 108–119. [Google Scholar] [CrossRef] [Scilit]
- Li, J.; Guo, K.; Wang, J.; Li, J. Towards Optimal Dynamic Localization for Autonomous Mobile Robot via Integrating Sensors Fusion. Int. J. Control. Autom. Syst. 2023, 21, 2648–2663. [Google Scholar] [CrossRef] [Scilit]
- Ru, H.; Sheng, M.; Gao, F.; Li, Z.; Qi, J.; Cheng, L.; Su, K.; Zhang, J.; Xiao, J. Research on Motion Trajectory Correction Method for Wall-Climbing Robots Based on External Visual Localization System. Sensors 2026, 26, 773. [Google Scholar] [CrossRef] [Scilit] [PubMed]
- Foster, P.; Johnson, C.; Kuipers, B. The Reflectance Field Map: Mapping Glass and Specular Surfaces in Dynamic Environments. In Proceedings of the 2023 IEEE International Conference on Robotics and Automation (ICRA), London, UK, 29 May–2 June 2023; pp. 8393–8399. [Google Scholar] [CrossRef] [Scilit]
- Damodaran, D.; Mozaffari, S.; Alirezaee, S.; Ahamed, M.J. Experimental Analysis of the Behavior of Mirror-like Objects in LiDAR-Based Robot Navigation. Appl. Sci. 2023, 13, 2908. [Google Scholar] [CrossRef] [Scilit]
- Mei, H.; Yang, X.; Wang, Y.; Liu, Y.; He, S.; Zhang, Q.; Wei, X.; Lau, R.W.H. Don’t Hit Me! Glass Detection in Real-World Scenes. In Proceedings of the 2020 IEEE/CVF Conference on Computer Vision and Pattern Recognition (CVPR), Seattle, WA, USA, 13–19 June 2020; pp. 3684–3693. [Google Scholar] [CrossRef] [Scilit]
- Tao, Y.; Gao, H.; Wen, Y.; Duan, L.; Lan, J. Glass Recognition and Map Optimization Method for Mobile Robot Based on Boundary Guidance. Chin. J. Mech. Eng. 2023, 36, 74. [Google Scholar] [CrossRef] [Scilit]
- Yarovoi, A.; Cho, Y.K. Review of Simultaneous Localization and Mapping (SLAM) for Construction Robotics Applications. Autom. Constr. 2024, 162, 105344. [Google Scholar] [CrossRef] [Scilit]
- Placed, J.A.; Strader, J.; Carrillo, H.; Atanasov, N.; Indelman, V.; Carlone, L.; Castellanos, J.A. A Survey on Active Simultaneous Localization and Mapping: State of the Art and New Frontiers. IEEE Trans. Robot. 2023, 39, 1686–1705. [Google Scholar] [CrossRef] [Scilit]
- Tsintotas, K.A.; Bampis, L.; Gasteratos, A. The Revisiting Problem in Simultaneous Localization and Mapping: A Survey on Visual Loop Closure Detection. IEEE Trans. Intell. Transp. Syst. 2022, 23, 19929–19953. [Google Scholar] [CrossRef] [Scilit]
- Fang, X.; Zhou, Z.H.; Xian, Y.; Zhang, T.; Zhang, R. Design of Intelligent Spray Disinfection Robot Based on Laser SLAM Guidance Technology. In Proceedings of the International Conference on Advanced Electronics, Intelligent Technology and Computing (AEITC 2025), Wuhan, China, 10–12 October 2025; SPIE: Bellingham, WA, USA, 2025; Volume 14010, pp. 313–319. [Google Scholar] [CrossRef] [Scilit]
- von Bosse, A.; Hirschberg, D.O.W.; Rauschnabel, P.A. Virtual Reality and Its Relevance for Businesses. In International Encyclopedia of Business Management; Academic Press: Cambridge, MA, USA, 2026; Volume 10, pp. 329–333. [Google Scholar] [CrossRef] [Scilit]
- Arif, S.M.U.; Khan, K. The Future of Mixed Reality: Impact of Holographic Stimulus Positioning on User Experience and Performance in Mixed Reality. Multimed. Tools Appl. 2026, 85, 146. [Google Scholar] [CrossRef] [Scilit]
- Manfredi, G.; Capece, N.; Erra, U. MRescue: A Mixed Reality System for Real-Time Navigation and Rescue in Complex Multi-Floor Buildings. Comput. Graph. 2026, 134, 104527. [Google Scholar] [CrossRef] [Scilit]
- Lang, S.; Pfister, T.; Kaupp, T. Training-Effectiveness of a Mixed Reality System for Human–Robot Collaboration in Industrial Settings. Comput. Educ. X Real. 2026, 8, 100135. [Google Scholar] [CrossRef] [Scilit]
- Cantarelli, S.; Francia, D.; Santi, G.M.; Liverani, A.; Fiori, M. Mixed Reality Lab for Assembly and Disassembly of Industrial Products. J. Ind. Inf. Integr. 2025, 46, 100873. [Google Scholar] [CrossRef] [Scilit]
- Wei, Y.; Wang, Y.; Zhao, J.; Liu, Y.; Gao, H.; Lai, J. Unlocking Mixed Reality for Medical Education: A See-Through Perspective on Head Anatomy. Procedia Comput. Sci. 2025, 271, 442–448. [Google Scholar] [CrossRef] [Scilit]
- Jungmann, D. Developing a VR Solution to Enhance Physical Learning. In Herman Hollerith Conference 2024 Informatik Aktuell; Springer Vieweg: Wiesbaden, Germany, 2025; pp. 74–86. [Google Scholar] [CrossRef] [Scilit]
- Clini, P.; Angeloni, R.; D’Alessio, M.; Mauro, O. From Digital Representation to Virtual Reality: An Interactive Experience of Industrial Heritage. In Representation Across Boundaries; Springer: Cham, Switzerland, 2026; pp. 269–285. [Google Scholar] [CrossRef] [Scilit]
- Batistute, A.; Santos, E.; Takieddine, K.; Lazari, P.M.; Da Rocha, L.G.; Vivaldini, K.C.T. Extended Reality for Teleoperated Mobile Robots. In Proceedings of the 2021 Latin American Robotics Symposium, 2021 Brazilian Symposium on Robotics, and 2021 Workshop on Robotics in Education, LARS-SBR-WRE, Natal, Brazil, 11–15 October 2021; pp. 19–24. [Google Scholar] [CrossRef] [Scilit]
- Carrozzino, M.A.; Caponi, M.; Pisani, S.; Papaleo, B.; Mazzei, A.; Foddis, R.; Bergamasco, M.; Potel, M. An Immersive Virtual Reality Platform for First Aid and Emergency Training. IEEE Comput. Graph. Appl. 2026, 46, 107–115. [Google Scholar] [CrossRef] [Scilit] [PubMed]
- Zabbah, S.; Alexander, N.A.; Mohammadi, Y.; Mariola, A.; Seymour, R.A.; Puvvada, S.; Barnes, G.R.; Bach, D.R. An Integrated Virtual Reality Platform for Naturalistic Neuroimaging with Magnetoencephalography. bioRxiv 2026. [Google Scholar] [CrossRef] [Scilit]
- Baur, S.; Rudolph, B.; Ribeiro, J.; Burken, J. VR in Architecture and Architectural Engineering Education: The Future of Creative Learning. AEI 2025, 2026, 175–187. [Google Scholar] [CrossRef] [Scilit]
- Gupta, S.; Mamodiya, U.; Al-Gburi, A.J.A. Speech Recognition-Based Wireless Control System for Mobile Robotics: Design, Implementation, and Analysis. Automation 2025, 6, 25. [Google Scholar] [CrossRef] [Scilit]
- Wang, C.; Li, M.; Zhang, P.; Zhang, Z.; Wang, F.; Kang, F. A Multi-Perception Fusion Using Shared-Control Method for Brain-Mobile Robot. Biomed. Eng. Lett. 2026, 16, 781–798. [Google Scholar] [CrossRef] [Scilit] [PubMed]
- Kim, P.; Long, Z.; Nesti, F.; Aryan, P.; Prakash, A.; Deepak Shetty, S.; Kalaichelvi, V.; Karthikeyan, R. SimNav-XR: An Extended Reality Platform for Mobile Robot Simulation Using ROS2 and Unity3D. Front. Robot. AI 2026, 13, 1708161. [Google Scholar] [CrossRef] [Scilit] [PubMed]
- Valve Index: Full Specification—VRcompare. Available online: https://vr-compare.com/headset/valveindex (accessed on 27 December 2025).
- Lee, A.; Chiu, H.Y.; Xiang, J.; Klement, A.; Park, Y.; Varel, C.; Lin, W.Y.; Sulem, F.; Huh, B.; Malecki, N.; et al. 90-1: Invited Paper: Quest 3 Immersive Display with High PPI and Hybrid Backplane Technology. SID Symp. Dig. Tech. Pap. 2024, 55, 1258–1261. [Google Scholar] [CrossRef] [Scilit]
- HTC Vive Pro 2: Full Specification—VRcompare. Available online: https://vr-compare.com/headset/htcvivepro2 (accessed on 27 December 2025).
- Meta Quest 3 Depth Sensor Is Actually Just an IR Line Projector. #Quest3—YouTube. Available online: https://www.youtube.com/watch?v=YCgZZHUS_L0 (accessed on 27 December 2025).
- Meta Quest 3: Full Specification—VRcompare. Available online: https://vr-compare.com/headset/metaquest3 (accessed on 25 December 2025).
- Laghari, M.K.; Shaikh, A.A.; Khan, F.; Siddiqui, A.G. Native Mixed Reality Compositing on Meta Quest 3: A Quantitative Feasibility Study of ARM-Based SoCs and Thermal Headroom. arXiv 2025, arXiv:2509.18929. [Google Scholar]
- Chen, J.; Bautembach, D.; Izadi, S. Scalable Real-Time Volumetric Surface Reconstruction. ACM Trans. Graph. 2013, 32, 113. [Google Scholar] [CrossRef] [Scilit]
- Curless, B.; Levoy, M. A Volumetric Method for Building Complex Models from Range Images. In Proceedings of the 23rd Annual Conference on Computer Graphics and Interactive Techniques, SIGGRAPH, New Orleans, LA, USA, 4–9 August 1996; pp. 303–312. [Google Scholar] [CrossRef] [Scilit]
- Kazhdan, M.; Hoppe, H. Screened Poisson Surface Reconstruction. ACM Trans. Graph. 2013, 32, 29. [Google Scholar] [CrossRef] [Scilit]
- He, Y.; Liang, B.; Yang, J.; Li, S.; He, J. An Iterative Closest Points Algorithm for Registration of 3D Laser Scanner Point Clouds with Geometric Features. Sensors 2017, 17, 1862. [Google Scholar] [CrossRef] [Scilit] [PubMed]
- README—Nav2_map_server 1.1.20 Documentation. Available online: https://docs.ros.org/en/humble/p/nav2_map_server/__README.html (accessed on 3 March 2026).
- Maps and Occupancy Grids—Software for Robotics Tutorials Documentation. Available online: https://uommscrobotics.github.io/SFR_Tutorials_2023_2025/week09_tut_maps.html (accessed on 3 March 2026).
- Map_Server—ROS Wiki. Available online: https://wiki.ros.org/map_server (accessed on 3 March 2026).
- Costmap 2D—Nav2 1.0.0 Documentation. Available online: https://docs.nav2.org/configuration/packages/configuring-costmaps.html (accessed on 3 March 2026).
- Occupancy Grid Mapping—Engineering AI Agents. Available online: https://pantelis.github.io/aiml-common/lectures/rse/occupancy-mapping/ (accessed on 3 March 2026).
- Mapping and Localization—Nav2 1.0.0 Documentation. Available online: https://docs.nav2.org/setup_guides/sensors/mapping_localization.html (accessed on 3 March 2026).

Disclaimer/Publisher’s Note: The statements, opinions and data contained in all publications are solely those of the individual author(s) and contributor(s) and not of MDPI and/or the editor(s). MDPI and/or the editor(s) disclaim responsibility for any injury to people or property resulting from any ideas, methods, instructions or products referred to in the content. |
© 2026 by the authors. Licensee MDPI, Basel, Switzerland. This article is an open access article distributed under the terms and conditions of the Creative Commons Attribution (CC BY) license.