


Abstract
Natural gas hydrates are characterized by abundant reserves, wide distribution, and high energy density, while geothermal energy also holds significant development potential. Conventional hydrate dissociation methods face challenges in the later stages of production, such as insufficient driving force for dissociation and secondary hydrate formation. This study explores the approach of utilizing deep-sea geothermal energy to assist in the extraction of hydrate. The aim is to achieve efficient exploitation of hydrate while expanding the applications of geothermal energy. A field-scale coupled thermo–hydro–mechanical–chemical (THMC) injection-production numerical model is established, taking a typical hydrate reservoir in the South China Sea as the study area. The engineering feasibility of geothermal-assisted hydrate extraction is evaluated through numerical simulations. Injection temperature, extraction rate, and well layout are systematically analyzed to optimize production performance, with particular focus on the evolution of physical fields, hydrate dissociation, and geothermal formation temperature stability. The novelty of this study lies in the proposal of a closed-loop ‘in-situ geothermal extraction and reinjection’ system, and the systematic optimization of its coupled THMC responses, which has received limited quantitative investigation. The results indicate that an injection temperature of 50 °C and an injection rate of 500 m3/d provide the most favorable production performance under the investigated conditions. Compared with conventional depressurization, the optimized geothermal-assisted scheme increases cumulative gas production by approximately 40% after 600 days. Horizontal well configurations outperform vertical wells, whereas excessively close well spacing reduces thermal stimulation efficiency because of hydraulic interference. Temperature variations in the geothermal layer during the simulated extraction period are minimal, indicating favorable operational stability under the investigated conditions. In summary, geothermal-assisted depressurization enhances hydrate extraction efficiency and expands geothermal applications, offering a promising approach for future development.
1. Introduction
Hydrates are cage-like crystalline compounds formed from water and natural gas (primarily composed of methane) under low-temperature, high-pressure conditions [1]. They have attracted considerable attention because of their abundant reserves and broad distribution [2]. However, hydrates currently remain at the theoretical research stage, and large-scale commercial extraction has not yet been achieved [2]. Geothermal energy also possesses significant development potential [3,4]. In the Shenhu area of the South China Sea, hydrate reservoirs coexist with geothermal formations [5,6], making a geothermal-assisted extraction scheme feasible. Compared to nearshore areas such as the East China Sea and the southern South Yellow Sea, the deep-water regions of the northern South China Sea possess a higher geothermal gradient, making them more conducive to the implementation of this approach [7]. This approach provides an alternative heat source for hydrate dissociation during the later stages of depressurization and may reduce the energy demand associated with conventional thermal stimulation methods [8].
Researchers have investigated the feasibility of exploiting methane hydrates using geothermal-assisted depressurization through theoretical analyses [9,10,11], laboratory experiments [12,13,14,15,16,17] and numerical simulations [18,19,20,21,22,23,24,25,26,27,28,29,30].
Studies by Konno et al. [31] indicate that during well shutdown (well capping), geothermal flow can sustainably drive the dissociation of methane hydrates and restore reservoir energy. On this basis, the proposed cyclic depressurization method is a potential enhanced recovery technique that requires no external heat source. Sasaki et al. [32] propose a thermal recovery system based on a dual-well configuration for hot water injection to enhance methane hydrate production. By injecting heat through a lower well and producing gas from an upper well, the system utilizes the coupling of thermal convection and gas buoyancy. However, it still faces issues regarding energy consumption and cost. Shi et al. [15] experimentally demonstrate that extending the lateral migration distance of gas within the hydrate layer enhances heat absorption and improves energy utilization efficiency. Lei et al. [17] find through experiments that as the pressure drop rate increases, the heat transfer efficiency between the hot water and the reservoir also increases. Zhang et al. [27] propose a heating method utilizing bottom-layer seawater for thermal injection and analyze the mechanism of action of the injection parameters through numerical simulation. Zhang et al. [24] find that radial wells have a significant production-enhancing effect on hydrate extraction. The specific mechanisms involve an expansion of the drainage area, depressurization propagation, and increased geothermal flow. Suárez et al. [33] suggest that with advances in offshore drilling technology, subsea geothermal energy offers higher temperature gradients and greater sustainability potential. The average geothermal gradient in offshore regions is nearly four times that of continental crust.
However, several key issues remain insufficiently understood. First, hydraulic interference between adjacent injection and production wells may significantly affect pressure propagation and production efficiency in multi-well systems [34]. Second, secondary hydrate formation induced by coupled thermal and hydraulic variations may impede fluid flow and reduce production performance [35]. Third, the thermal sustainability of geothermal formations under continuous heat extraction remains uncertain, which may limit the practical feasibility of geothermal-assisted production [25]. Systematic investigations of optimized production schemes for geothermal-assisted depressurization and comprehensive parameter optimization remain limited.
This study proposes a dual-well production concept that combines geothermal energy utilization with depressurization. The concept integrates in situ geothermal extraction and heat reinjection into the hydrate reservoir to enhance production performance. Based on the characteristics of a typical hydrate reservoir in the South China Sea, a coupled thermo–hydro–mechanical–chemical (THMC) numerical model is established to investigate the effects of injection parameters and well configurations on gas production efficiency, while also evaluating the thermal response of the geothermal formation.
2. Model Development
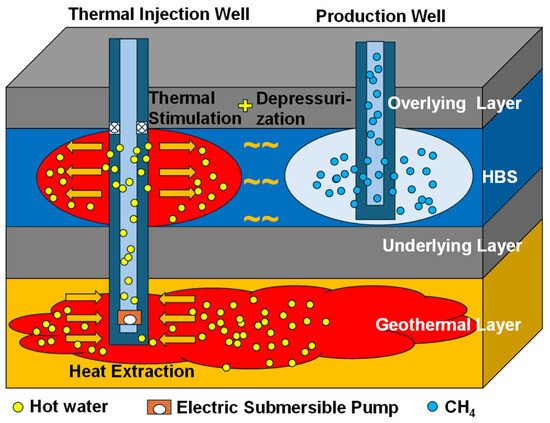
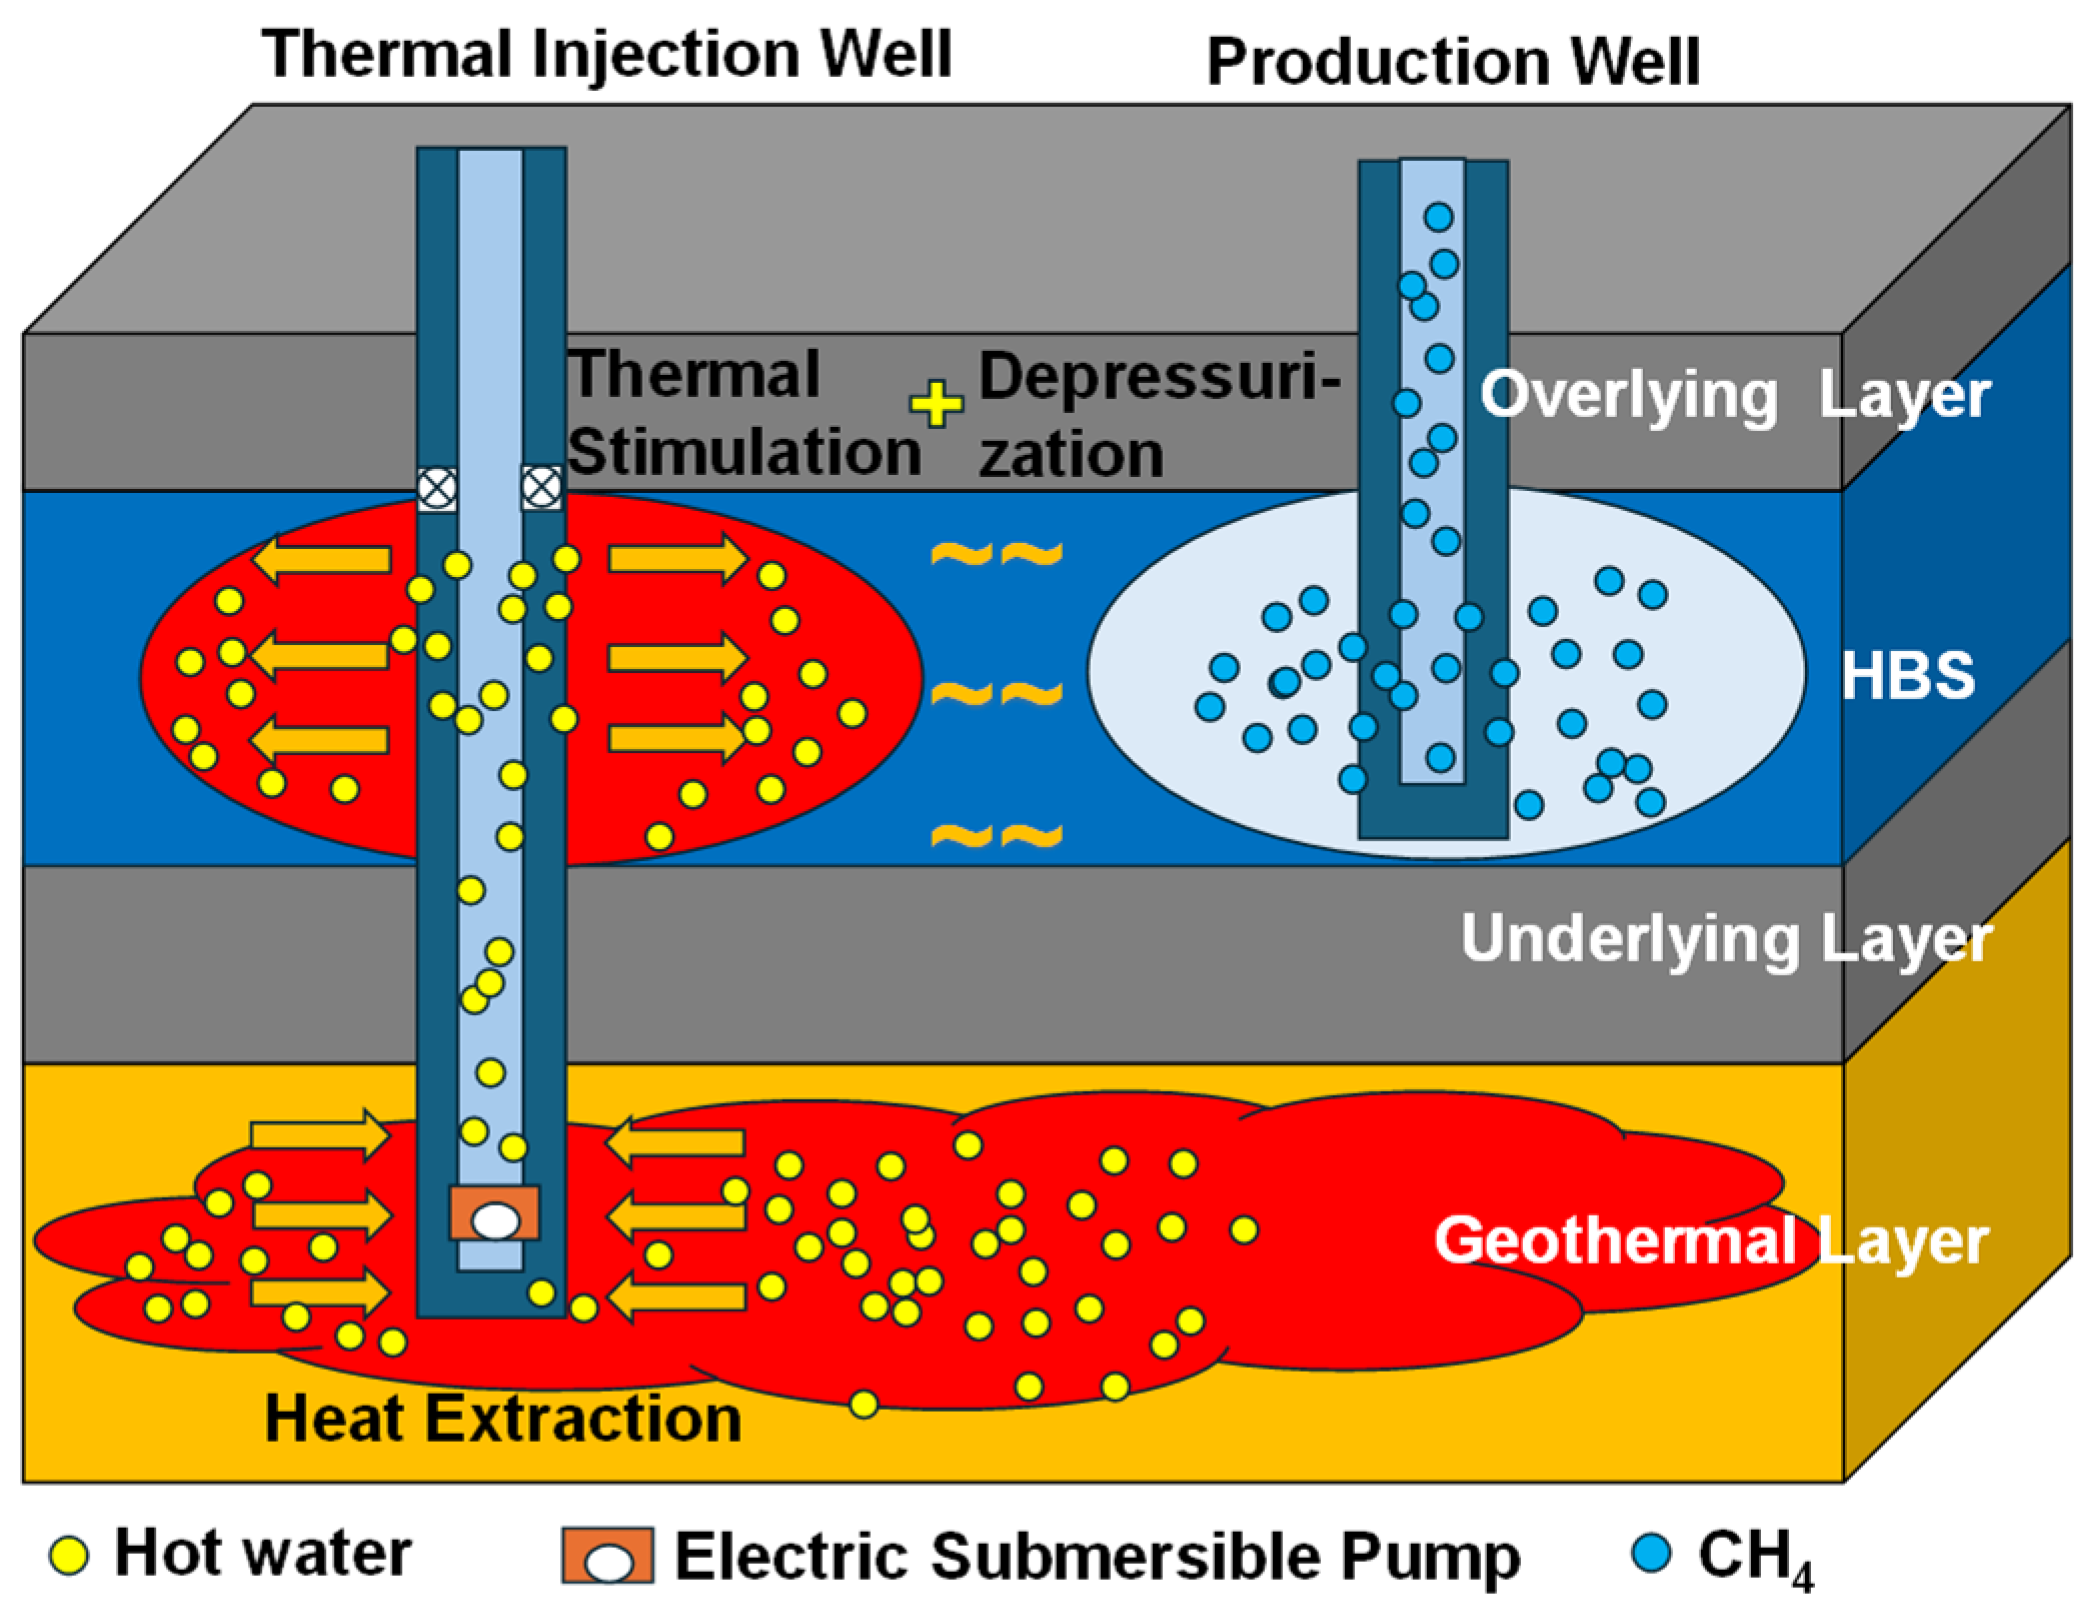
The numerical simulations in this study are conducted using the CMG-STARS simulator. This solver is widely used in the field of hydrate extraction simulation. Figure 1 illustrates the concept of geothermal-assisted depressurization extraction of hydrate proposed in this paper.
Figure 1.
Schematic diagram of the principle of geothermal-assisted depressurization extraction of hydrate.
2.1. Phase Equilibrium Model
The three-dimensional reservoir model comprises three substances: H2O, methane and methane hydrate, existing primarily in the gaseous, liquid and solid phases. The process is represented by the following kinetic equations [36]:
The above reaction is reversible. The hydrate dissociation or formation depends on phase equilibrium conditions. Pressure decrease or temperature increase can drive the reaction in the forward direction, i.e., the hydrate dissociation. This model considers Type III hydrate and assumes that the reservoir initially contains no free gas, that hydrates occupy the pore space as a solid phase, and that water and gas flow through the porous medium according to Darcy’s law. Hydrate saturation is defined as the ratio of the volume of hydrate to the pore volume. Hydrate dissociation increases porosity and absolute permeability but weakens the mechanical strength of the formation.
In multiphase flow within hydrate reservoirs, water and gas saturations are defined as the fractions of water and gas volumes in the total pore fluid volume and satisfy the constraint SW + SG = 1. The relative permeability of the fluid is modeled as independent of hydrate saturation, varying only with fluid saturation. The porosity-permeability relationship is described by the Carman–Kozeny model [32]:
where K and K0 denote the current absolute permeability and initial absolute permeability, respectively, mD; φf and φf0 denote the current fluid porosity and initial fluid porosity, respectively; and ε denotes a dimensionless empirical parameter, set to 3.5 [37]. The relationship between fluid porosity and solid hydrate saturation is given by:
where φ denotes the porosity of the hydrate reservoir; SH is the current hydrate saturation; and SHi is the initial hydrate saturation.
The calculation of relative permeability and capillary forces employs the Aziz model [38] and the Van Genuchten model [39], respectively.
In the equation, KrA and KrG are the relative permeabilities of the liquid and gas phases. SA and SG represent the liquid and gas phase saturations, respectively. SirA and SirG are the saturation of bound water and residual gas. pcap represents the capillary force, Pa. S* is the effective water saturation. The empirical parameters used in the relative permeability and capillary pressure models are adopted from previous numerical studies on hydrate reservoirs in the Shenhu area of the South China Sea. Due to the lack of site-specific laboratory measurements, these parameters are selected as representative values that have been widely validated in previous hydrate-production simulations. The relationship between hydrate saturation and formation mechanical properties is described using a linear model [40,41]:
where x denotes a mechanical property parameter; xsh0 is the value of x when hydrate saturation is 0; and c is an empirical coefficient.
This study employs a linear volume-weighted mixing rule to calculate the equivalent thermal conductivity of a porous medium. The effective thermal conductivity is calculated from the volume fractions and thermal conductivities of the rock matrix, fluid phases, and solid hydrate phase.
The formula for the effective thermal conductivity is [42]
where Kmix is the effective thermal conductivity of the porous medium, J/m·day·°C; φf is the fluid porosity; φv is the total porosity; Sw, Sg, and So denote the saturations of the water, gas, and oil phases, respectively; kw, kg, and ko are the thermal conductivities of the respective phases, J/m·day·°C; kr is the thermal conductivity of the reservoir rock matrix; ks is the thermal conductivity of the solid phase. The thermal conductivity parameters adopted in this study are summarized in Table 1.
Table 1.
Thermal conductivities in the model.
In this paper, based on the Kim–Bishnoi [43] method, the general form of the kinetic model for the formation and dissociation of hydrate has been derived:
where cH is the hydrate concentration per unit volume, mol/m3; A is the dissociation rate constant of hydrate, m3/(mol·kPa·d); B is the formation rate constant of hydrate, 1/(kPa·d); E is the reaction activation energy, J/mol; ρA and ρH are the molar densities of water and methane hydrate, respectively, mol/m3; peq denotes the phase equilibrium pressure of the hydrate corresponding to temperature T, kPa; K(p,T) is the dimensionless phase-equilibrium criterion; and R is the universal gas constant, J/(mol·K). The kinetic parameters governing hydrate formation and dissociation are listed in Table 2.
Table 2.
Kinetic parameters and their roles in hydrate phase transition modeling.
2.2. Multi-Field Coupled Physical Models and Model Validation
2.2.1. Four-Field Coupled Model
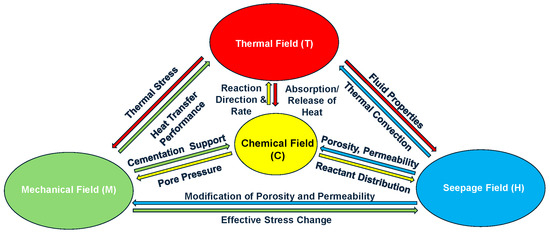
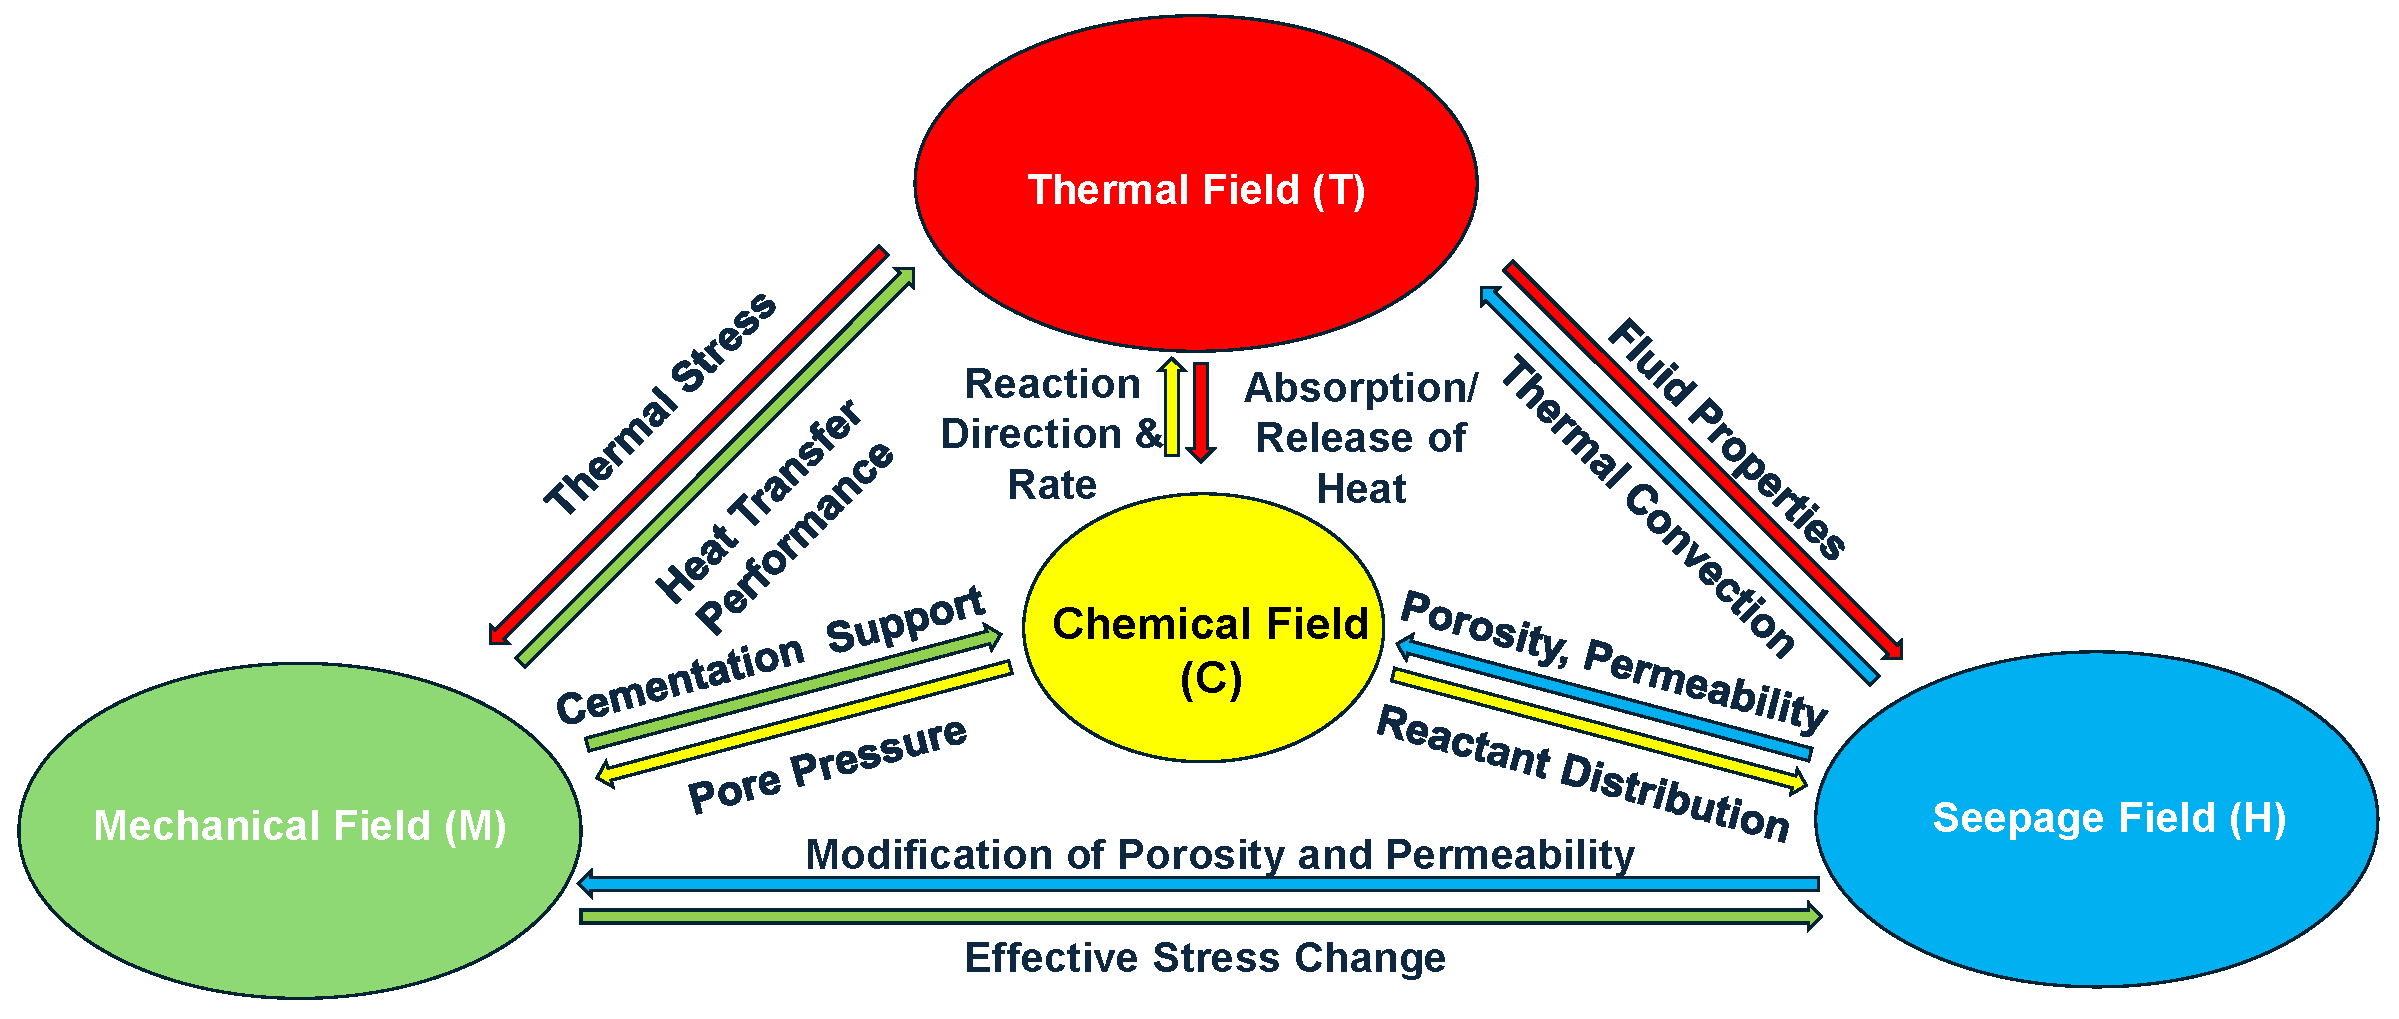
Hydrate extraction is a typical strongly coupled multiphysics process involving thermal, hydraulic, mechanical, and chemical fields. Its core physical fields include the chemical field, which governs hydrate phase transitions; the thermal field, which describes heat transfer processes; the hydraulic field, which governs multiphase flow; and the mechanical field, which characterizes formation deformation. These four fields are strongly coupled in both space and time, forming a highly nonlinear system. Figure 2 illustrates the coupling mechanisms during hydrate extraction.
Figure 2.
THMC four-field coupling.
A strong energy coupling exists between the chemical and thermal fields (C-T). Hydrate dissociation is an endothermic process, where latent heat absorption leads to a local temperature reduction in the reservoir. Conversely, hydrate formation is exothermic and alters the thermal distribution within the formation. Meanwhile, temperature plays a critical role in controlling hydrate phase equilibrium, thereby directly influencing reaction rates and directions.
The coupling between the chemical and hydraulic fields (C-H) is reflected in the interaction between phase change and mass transport. Hydrate formation and dissociation modify the saturation of solid, liquid, and gas phases in the pore space, thereby affecting pore structure, relative permeability, and capillary pressure, and ultimately reshaping flow pathways. In turn, the hydraulic field controls the transport and production of methane and water, while pressure variations directly influence hydrate stability through phase equilibrium conditions, forming a hydro-chemo feedback mechanism.
The coupling between the chemical and mechanical fields (C-M) is primarily manifested in the evolution of reservoir mechanical properties. As part of the sedimentary matrix, hydrate formation enhances intergranular cementation, increasing formation stiffness and strength. Conversely, hydrate dissociation weakens cementation, reduces cohesion, and may induce deformation or mechanical failure. Changes in mechanical conditions, such as subsidence or variations in effective stress, further modify pore pressure and stress distribution, thereby affecting hydrate phase stability and establishing a chemo-mechanical feedback loop.
In addition to the chemical-centered couplings described above, significant interactions also exist among the other fields. The thermal and hydraulic fields (T-H) interact through temperature-dependent fluid properties and convective heat transfer. The thermal and mechanical fields (T-M) are coupled via thermal stress and thermal damage. The hydraulic and mechanical fields (H-M) are strongly linked through pore pressure evolution and the effective stress principle, jointly controlling deformation and fracture behavior of the formation.
2.2.2. Model Validation
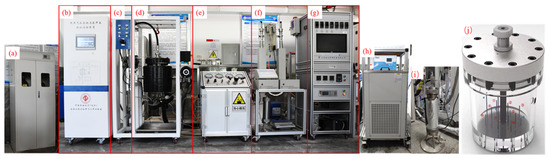
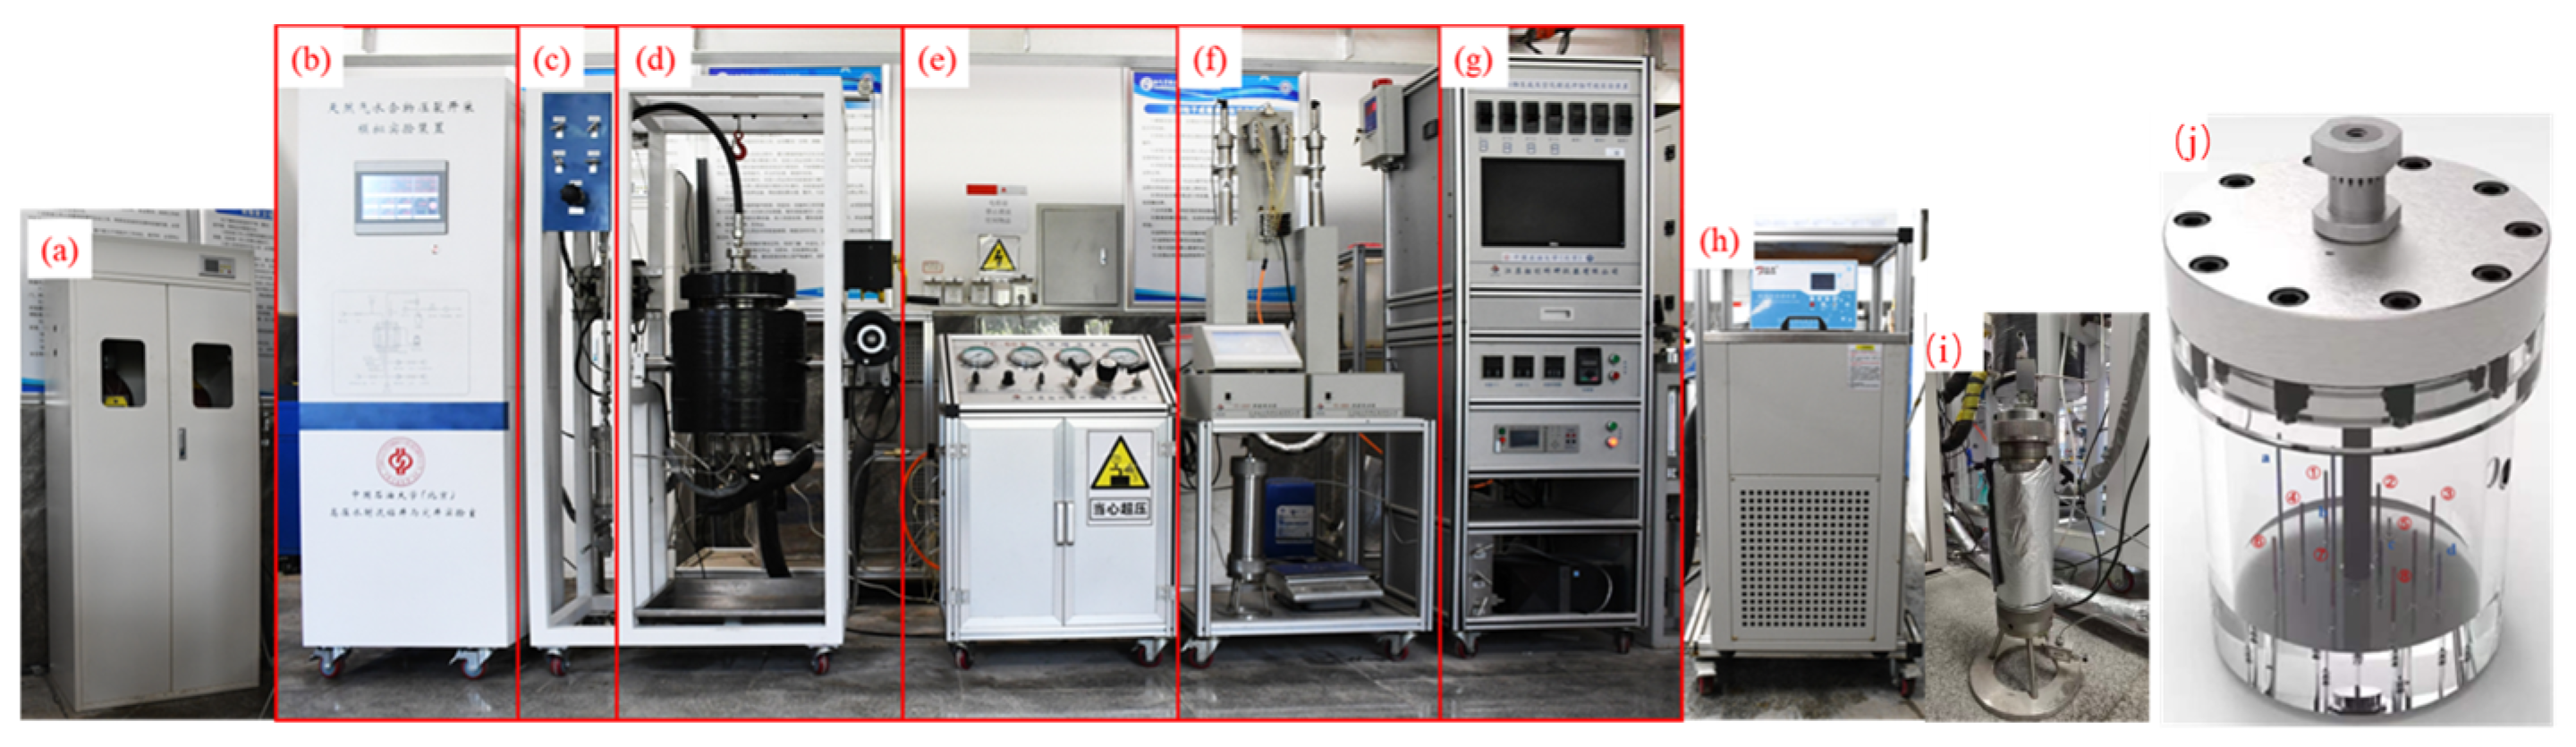
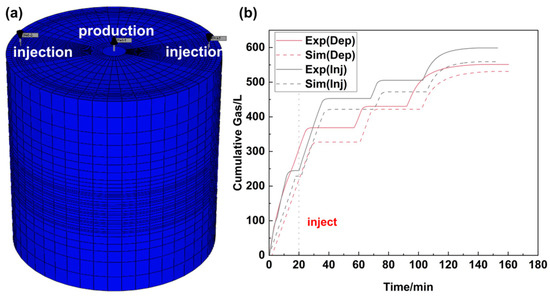
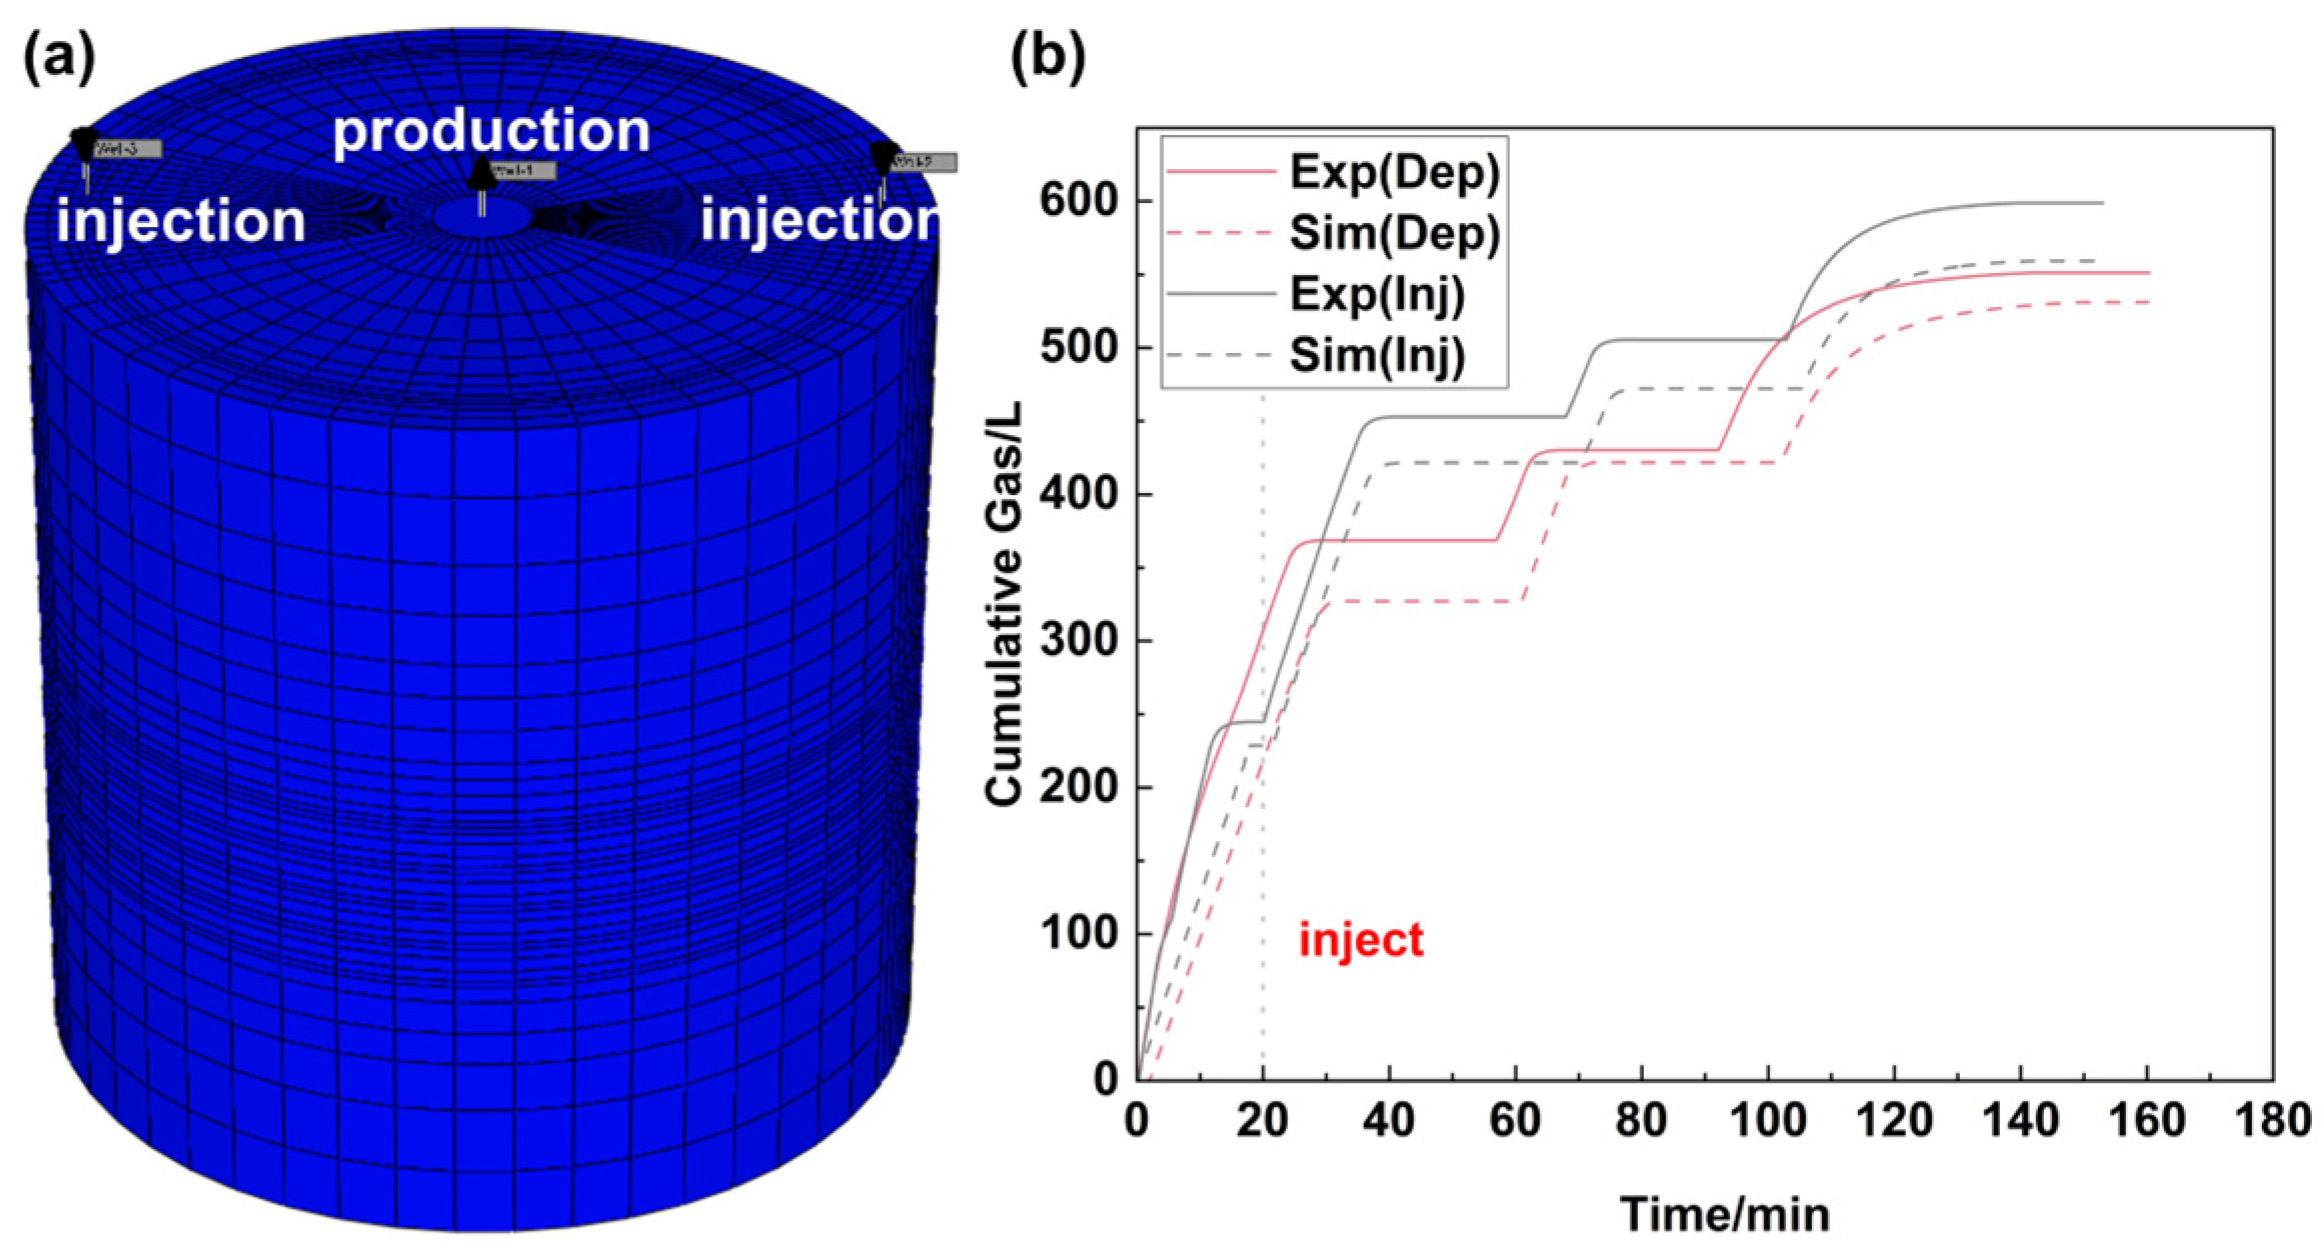
A laboratory-scale experimental system for thermal-assisted natural gas hydrate production is developed to validate the numerical model. Based on the coupled thermo–hydro–mechanical–chemical (THMC) model described above, numerical simulations are conducted under the same operating conditions as the experiments, and the injection–production data are compared to evaluate model accuracy. The experimental system comprises core modules including a high-pressure reactor, a fluid injection system, an extraction system, a temperature control system, and a data acquisition and measurement system. Figure 3 shows a panoramic view of the experimental setup, specifically comprising: (a) a methane cylinder cabinet, (b) a data acquisition system, (c) a gas–liquid separation system, (d) a high-pressure reactor, (e) a gas booster pump, (f) an injection system, (g) a data storage system, (h) a water bath temperature control system, and (i) a hot water tank. Figure 3j illustrates the arrangement of temperature and pressure sensors within the reactor. The high-pressure reactor is fabricated from 316 L stainless steel, with an internal diameter of 250 mm, a height of 250 mm, and a maximum operating pressure of 25 MPa. To monitor the evolution of temperature and pressure during hydrate formation and dissociation, four pressure sensors and eight temperature sensors are uniformly installed around the production well. To simulate thermal stimulation, an external hot-water storage vessel is added to the system. During production, hot water is injected into the reactor when the internal pressure decreases to 3 MPa. Figure 4a presents the three-dimensional numerical model of the experimental reactor. The model geometry is consistent with that of the physical reactor, and the reservoir properties are determined from the corresponding experimental measurements.
Figure 3.
Experimental apparatus; (a) a methane cylinder cabinet, (b) a data acquisition system, (c) a gas–liquid separation system, (d) a high-pressure reactor, (e) a gas booster pump, (f) an injection system, (g) a data storage system, (h) a water bath temperature control system, (i) a hot water tank, (j) the arrangement of temperature and pressure sensors within the reactor.
Figure 4.
(a) Three-dimensional grid model of the experimental reactor; (b) comparison between experimental data and numerical simulation results for gas production (validation).
The experiments comprise two sets: depressurization alone and depressurization with heat injection. For the validation experiments, quartz sand (60–100, 100–140, 160–200, and 200–240 mesh fractions, 4.5 kg each) is mixed with deionized water (2 kg) and compacted into a high-pressure reactor with a vertical well installed. Methane gas is injected at 12.5 MPa to initiate hydrate formation, followed by a second injection at 7.5 MPa to enhance hydrate saturation. The extraction process uses 2.5 MPa depressurization, when the reactor pressure reaches 2 MPa, and the well is shut in for 30 min, allowing the pressure to rise again. After two cycles, continuous depressurization extraction is conducted until all the hydrate dissociates and is recovered. For heat injection experiments, injection starts when the reactor pressure reaches 3 MPa. Water injection lasts 4 min (approx. 500 mL), then production resumes under the depressurization protocol. The full operation spans approximately 3 h.
A model is established using CMG to replicate the experimental conditions with a simulation time step set to 1 min. There is a slight time-matching error compared to the experimental data. The final validation results are shown in Figure 4b. The experimental and numerical results show good agreement, with the error within 10%, verifying the model’s reliability.
2.3. Geometric Model
2.3.1. Geological Background
The Shenhu area is located on the middle northern continental slope of the South China Sea, within the Zhu II Sag of the Pearl River Mouth Basin, between the Xisha Trough and the Dongsha Islands. The seabed is characterized by complex geomorphology, including submarine canyons, slope ridges, and erosional channels. Sediment thickness ranges from 1000 to 7000 m, providing favorable conditions for gas hydrate formation and accumulation. The region has a high heat flux background (75–101 mW·m−2) and active geothermal activity. The low-temperature, high-pressure environment (seabed water: 3.3–3.7 °C; geothermal gradient: 43.0–67.7 °C/km) is conducive to hydrate stability. Heat flux values range from 62.02 to 98.9 mW/m2 [44]. The high geothermal background, combined with faulting, diapiric structures, and magmatic intrusions, enhances upward heat flux, offering geothermal development potential.
Core porosity ranges from 33% to 48%, initial water saturation is 0.562, and pore water salinity is 29.0–31.5 ppt. Hydrates occur 155–229 m below the seabed, in a 10–43 m thick interval with local saturation up to 53.14%. This is a Type III hydrate system (hydrate-bearing layer only, with permeable layers above and below) [45,46].
2.3.2. Formation Condition
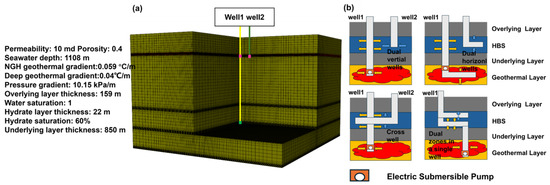
A numerical model based on Station SH7 hydrate data is established and shown in Figure 5a. The model dimensions are 900 m × 900 m × 1031 m, with 488,376 grid cells (84 × 57 × 102). The maximum grid size is 25 m × 25 m × 25 m, and the minimum is 4 m × 4 m × 0.5 m. The model top is located at 1108 m below sea level. The overlying layer is 159 m thick, the hydrate layer 22 m thick, and the underlying geothermal layer extends to 850 m depth. The remaining flow, thermal, and reservoir properties are presented in Table 3.
Figure 5.
(a) Full-scale 3D geometric model of the hydrate reservoir (dimensions: 900 m × 900 m × 1031 m); (b) schematic diagram of the four different well configurations evaluated in this study: dual vertical wells, dual horizontal wells, cross wells, and dual zones in a single well.
Table 3.
Model heat flux parameters.
This model utilizes an injection-production well layout for hydrate extraction, with a well spacing of 60 m. At the location of Well 1, two wells (comprising one water production well and one water injection well) extract hot water from the geothermal layer and inject it into the hydrate layer. Operations start at day 101 and vary by scenario. Well 2 serves as a production well for depressurization extraction of hydrate. To minimize heat loss during fluid transport, thermal insulation is incorporated into the production well design to maintain a relatively stable fluid temperature within the wellbore [47,48]. The geothermal gradients of the hydrate layer and the deep geothermal formation are treated separately [47,48,49].
Figure 5b shows the extraction schemes for different well types established in this study. The hydrate extraction system includes four schemes: dual vertical wells, dual horizontal wells, cross wells, and dual zones in a single well.
In the reservoir model established in this paper, the initial water saturation of the formation is set to 1, and the hydrate saturation to 0.6. The geomechanical parameters used in the coupled THMC model are summarized in Table 4. The assumptions in this research model are as follows:
Table 4.
Mechanical parameters of rock formations.
- (1)
- The surrounding areas are defined as closed boundaries; the top and bottom are set as constant pressure boundaries to represent the replenishment of external fluids.
- (2)
- The normal displacements at the bottom and periphery are fixed, while the top surface is treated as a free boundary to simulate the subsidence behavior of the formation [36].
- (3)
- The model considers only gas and liquid phases. The solid hydrate phase is assumed immobile. Darcy’s law applies to fluid flow in the porous medium.
- (4)
- Heat exchange between the hydrate layer and the injected water occurs primarily through thermal conduction. Convective heat transfer is neglected [19].
- (5)
- The thermal properties of the geothermal formation remain constant during extraction. Heat loss in the vertical section of the well, where the injection water returns from the geothermal formation to the hydrate layer, is neglected [47,48].
2.3.3. Parameter Settings for Mining Case Studies
Field tests in the South China Sea show that depressurization is key to hydrate extraction. As reservoir pressure drops, methane hydrate becomes thermodynamically unstable and dissociates using the reservoir’s sensible heat. Once the sensible heat is exhausted, gas production declines, and additional heat is needed to improve recovery. Thermal stimulation methods (e.g., hot water injection, wellbore heating) and other gas injection (e.g., CO2) have been proposed to enhance hydrate dissociation [40,41,43]. This study uses a thermal stimulation method that extracts heat from the formation and reinjects it into the hydrate layer.
The selection of operational parameters and simulation cases is based on typical ranges reported in previous numerical and field studies of gas hydrate exploitation in the Shenhu area of the South China Sea. The objective of this case design is to systematically isolate the effects of key operational variables, including thermal conditions, injection rate, and well configuration, on hydrate dissociation performance.
A baseline case (Case 0) is first defined using pure depressurization to serve as a reference for evaluating the effectiveness of geothermal-assisted methods. Cases 1–3 are designed to investigate the influence of injection temperature, representing variations in thermal driving force. Cases 4–5 examine the effect of injection/production rate, reflecting hydraulic transport capacity. Cases 6–8 are used to evaluate the impact of well configurations, focusing on differences in heat transfer efficiency and hydraulic interference under various spatial arrangements.
The simulation duration of 600 days and the selected well spacing of 60 m are consistent with typical scales adopted in previous hydrate reservoir modeling studies, ensuring that both early-stage production behavior and mid-term thermal evolution can be captured. In addition, the selection of 100 days as the onset time for thermal injection is consistent with the transition of the system from rapid dissociation to a slower depletion-controlled stage in the baseline case. Detailed settings are listed in Table 5.
Table 5.
Model case settings.
3. Results and Discussion
3.1. Effect of Injection Temperature on Hydrate Extraction
To investigate the effect of different injection temperatures on the dissociation of methane hydrates, an extraction scheme is designed involving constant-rate heat extraction from formations at various depths, coupled with the injection of hot water into the methane hydrate layer. The production characteristics and changes in formation temperature under different operating conditions are compared. All cases have an extraction duration of 600 days, with heat extraction and injection commencing 100 days after the start of depressurization extraction in the heat-injection cases.
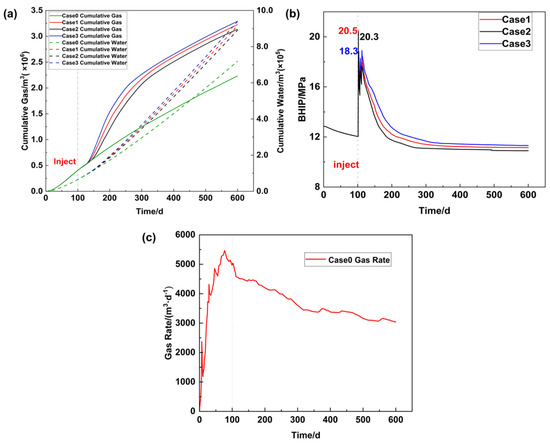
Figure 6a illustrates cumulative gas and water production for Cases 0–3. After 600 days, Case 0 produces 2.23 × 10⁶ m3 of gas. For Cases 1–3, following 100 days of depressurization, heat is extracted from geothermal layers at 40, 50 and 60 °C and reinjected into the hydrate layer. Compared to Case 0, gas production increases by 40.4%, 44.5%, and 47.4%, respectively. The combination of heat injection and depressurization significantly enhances production. Water production also increases in Cases 1–3, but at a lower rate than gas. Analysis suggests that during depressurization extraction, hydrate dissociation absorbs heat, causing a significant temperature drop. Localized gas saturation increases can block flow channels if not extracted in time. Rapid temperature drops may also cause free methane to reform into hydrate, limiting pressure propagation and further dissociation [23]. In this study, hot water extracted from geothermal layers is injected into the hydrate layer via injection wells. The external heat provides the driving force for dissociation, expanding the dissociation zone, while proper well spacing suppresses secondary hydrate formation. Higher injection temperatures enhance gas production. Increased water production is mainly due to large-volume hot water injection, as production wells discharge more water to maintain pressure balance.
Figure 6.
Production performance under different injection temperatures: (a) cumulative gas and water production (Cases 0–3); (b) bottom-hole pressure of injection wells (Cases 1, 2 and 3); (c) gas rate (Case 0).
Figure 7 plots the bottom-hole pressure of injection wells in the reservoir. It can be seen that, while the overall trends in wellhead pressure are similar across different injection temperatures, the maximum wellhead pressures vary. The maximum value is 20.5 MPa for Case 1, while the maximum wellhead pressure for Case 2 is 20.3 MPa. In contrast, the bottom-hole pressure for Case 3 is only 18.3 MPa. In the subsequent process, the wellhead pressure for Case 3 remains the lowest, followed by Case 1. Higher injection temperatures promote the dissociation of hydrate while effectively suppressing its secondary formation, thereby preventing pore blockage and a decline in permeability. This maintains unobstructed flow pathways and helps to sustain lower injection pressures.
Figure 7.
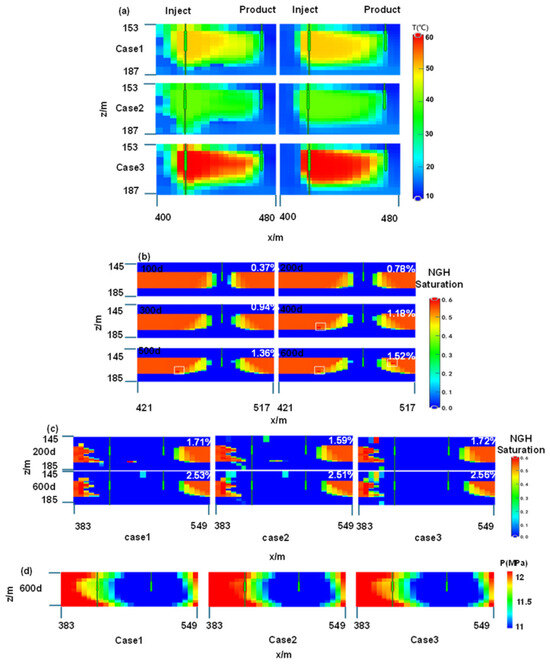
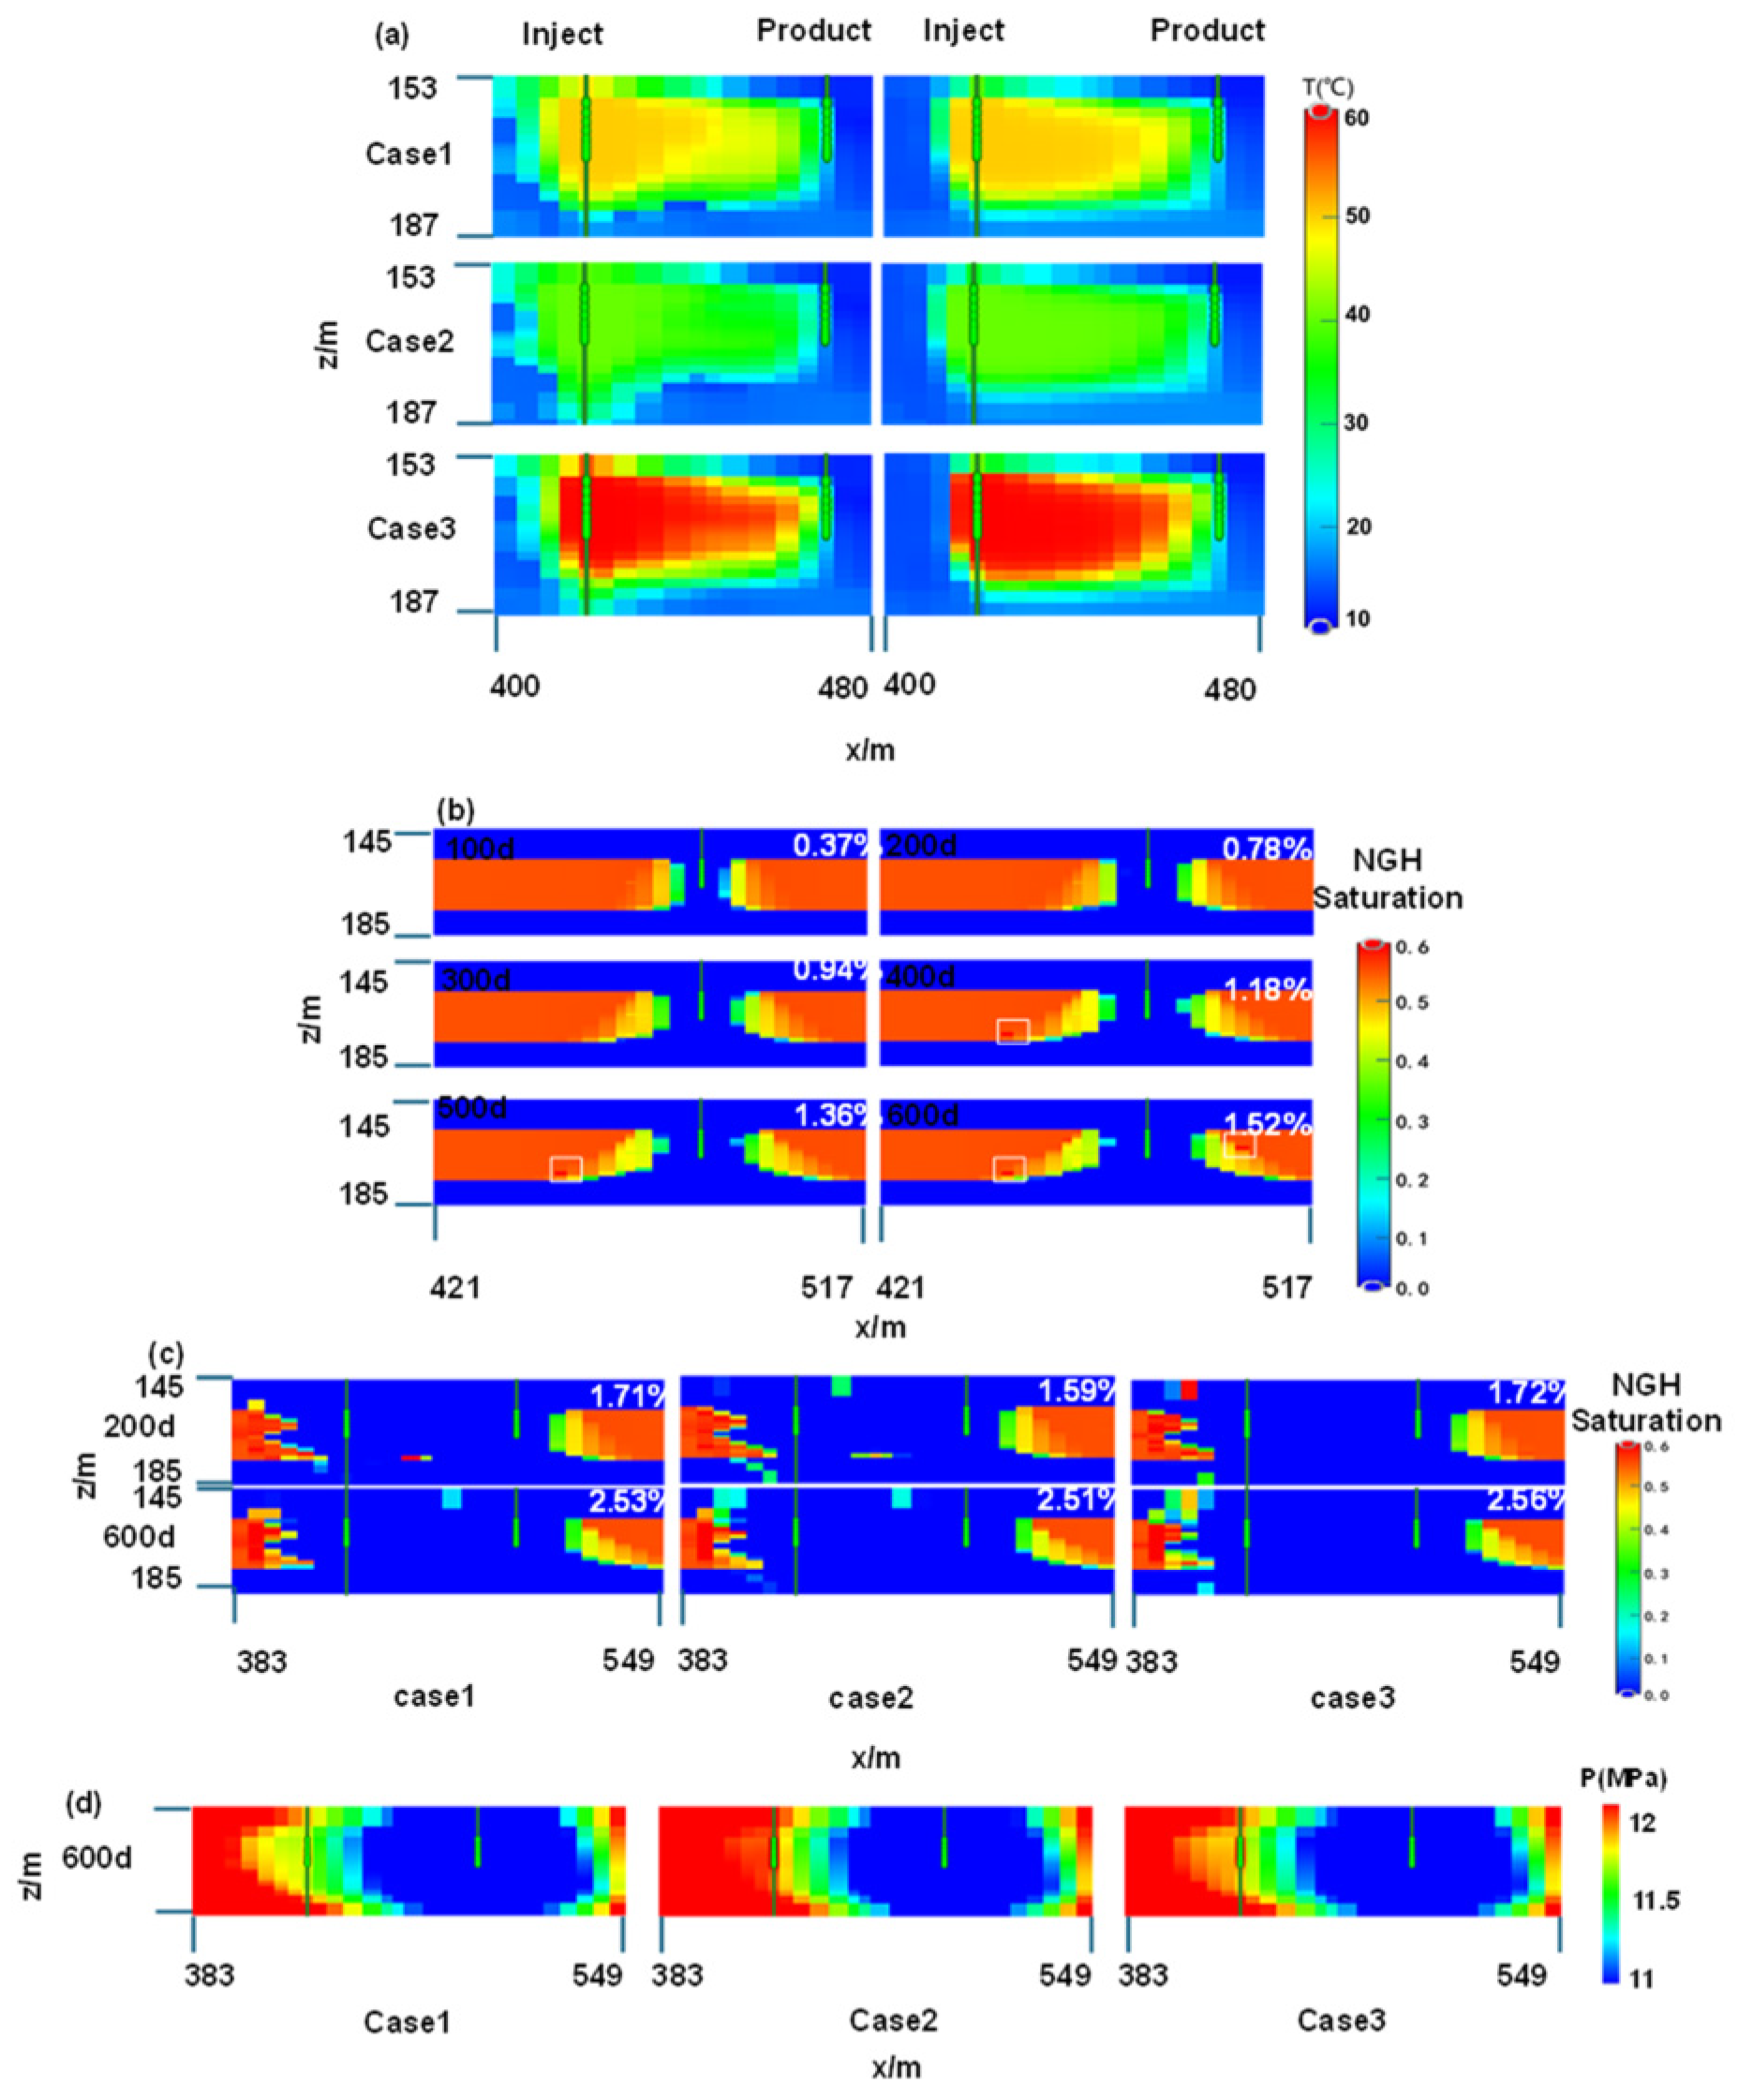
Hydrate layer response under different production methods: (a) temperature distribution (Case 1–3); (b) hydrate saturation during depressurization (Case 0); (c) hydrate saturation during heat injection (Case 1–3); (d) pressure distribution (Case 1–3).
In conventional depressurization production, as saturation in the reservoir decreases and the sensible heat in the reservoir is consumed, the secondary formation of hydrate severely hinders the extension of the depressurization funnel in production wells. The newly formed hydrate blocks the reservoir pores [50]. When production relies solely on the depressurization method, the thermal energy throughout the entire production process derives from the sensible heat of the formation and the inflow of hot water from the underlying layers into the reservoir, driven by pressure following the formation of a low-pressure zone around the wellbore [51]. As in Figure 6b, as production proceeds, the upward flow of water from the underlying layer becomes increasingly pronounced, but this is largely confined to the low-pressure zone around the production well.
As shown in Figure 6c, the gas production rate for the depressurization-only case drops sharply shortly after 100 days, followed by a progressively slower decline. This trend supports the selection of 100 days as the starting point for heat injection.
Geothermal energy can effectively address this issue. In geothermal-assisted depressurization production, geothermal energy plays the primary role during the heat injection phase. Comparison of Cases 1–3 reveals that higher injection temperatures mainly raise the reservoir temperature, with little effect on the heating range. At a fixed injection rate, higher temperatures boost gas production rates, but the rate of increase diminishes as the temperature rises, indicating that energy utilization efficiency gradually decreases at higher heat injection temperatures [27]. However, higher injection temperatures require deeper wells, leading to a rise in costs. Excessively low temperatures have a limited effect on dissociation, which is detrimental to production capacity optimization. The increase in gas production between 50 °C and 60 °C is only approximately 2%. Therefore, considering both production enhancement and cost, the optimal injection temperature should be around 50 °C. Figure 7a shows the temperature contour of the hydrate layer at production days 200 and 600 for Cases 1, 2 and 3.
Figure 7b shows the hydrate dissociation degree at different stages of depressurization production. Dissociation is greater in the lower reservoir, due to a larger pressure differential with the wellbore. In later stages, minor hydrate formation occurs within the reservoir itself (white box). This is because the simple pressure-reduction method limits the dissociation rate. Methane released from hydrate dissociation is rapidly produced through the wellbore, while part of the migrating gas within the reservoir may locally re-form hydrate under suitable thermodynamic conditions. Compared with pressure-reduction alone, heat injection significantly enhances hydrate dissociation, as shown in Figure 7c. In Cases 1–3, hot water at 40–60 °C is injected and reinjected within the system. The hydrate-bearing zone near the injection well undergoes intensive dissociation due to thermal stimulation. Part of the released methane migrates toward the production well, while another portion moves upward into the overlying layer or laterally within the reservoir, where secondary hydrate formation may occur under local pressure–temperature conditions. Over a 600-day simulation period, the overall dissociation degree under heat injection is approximately 1% higher than that under pure pressure reduction. At 200 days, Case 2 exhibits a lower dissociation degree than Cases 1 and 3, which show similar behavior. By 600 days, the dissociation degrees converge across all three cases, indicating that higher injection temperature primarily accelerates early-stage dissociation but has limited influence on the final extent of hydrate dissociation under the conditions investigated.
Secondary hydrate formation is more pronounced in the upper overburden, where initial hydrate saturation is lower, and gas migration is less constrained. The maximum secondary hydrate saturation (0.34) is observed in Case 3.
The formation of secondary hydrates is governed by the coupled evolution of pressure, temperature, and gas transport. As shown in Figure 7d, increasing injection temperature intensifies pressure drawdown in the overburden, with Case 3 exhibiting the largest decline, followed by Case 1 and Case 2. This enhanced pressure gradient, together with gas buoyancy, promotes upward migration of dissociated methane into the overburden. Meanwhile, heat propagation is progressively attenuated due to the low thermal conductivity of overlying sediments, leading to localized cooling in regions away from the injection zone. When the temperature falls below hydrate phase equilibrium conditions, secondary hydrate formation is triggered. A parametric analysis indicates that gas saturation, temperature reduction, and pressure-driven migration jointly control the occurrence of secondary hydrates. Among these, gas accumulation near the thermal front plays a dominant role, as secondary hydrates preferentially form in regions where sufficient gas supply coincides with thermodynamically favorable conditions.
3.2. Effect of Injection Rate on Hydrate Extraction
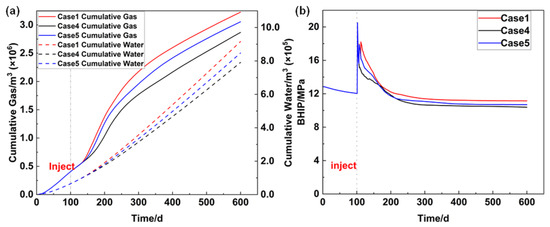
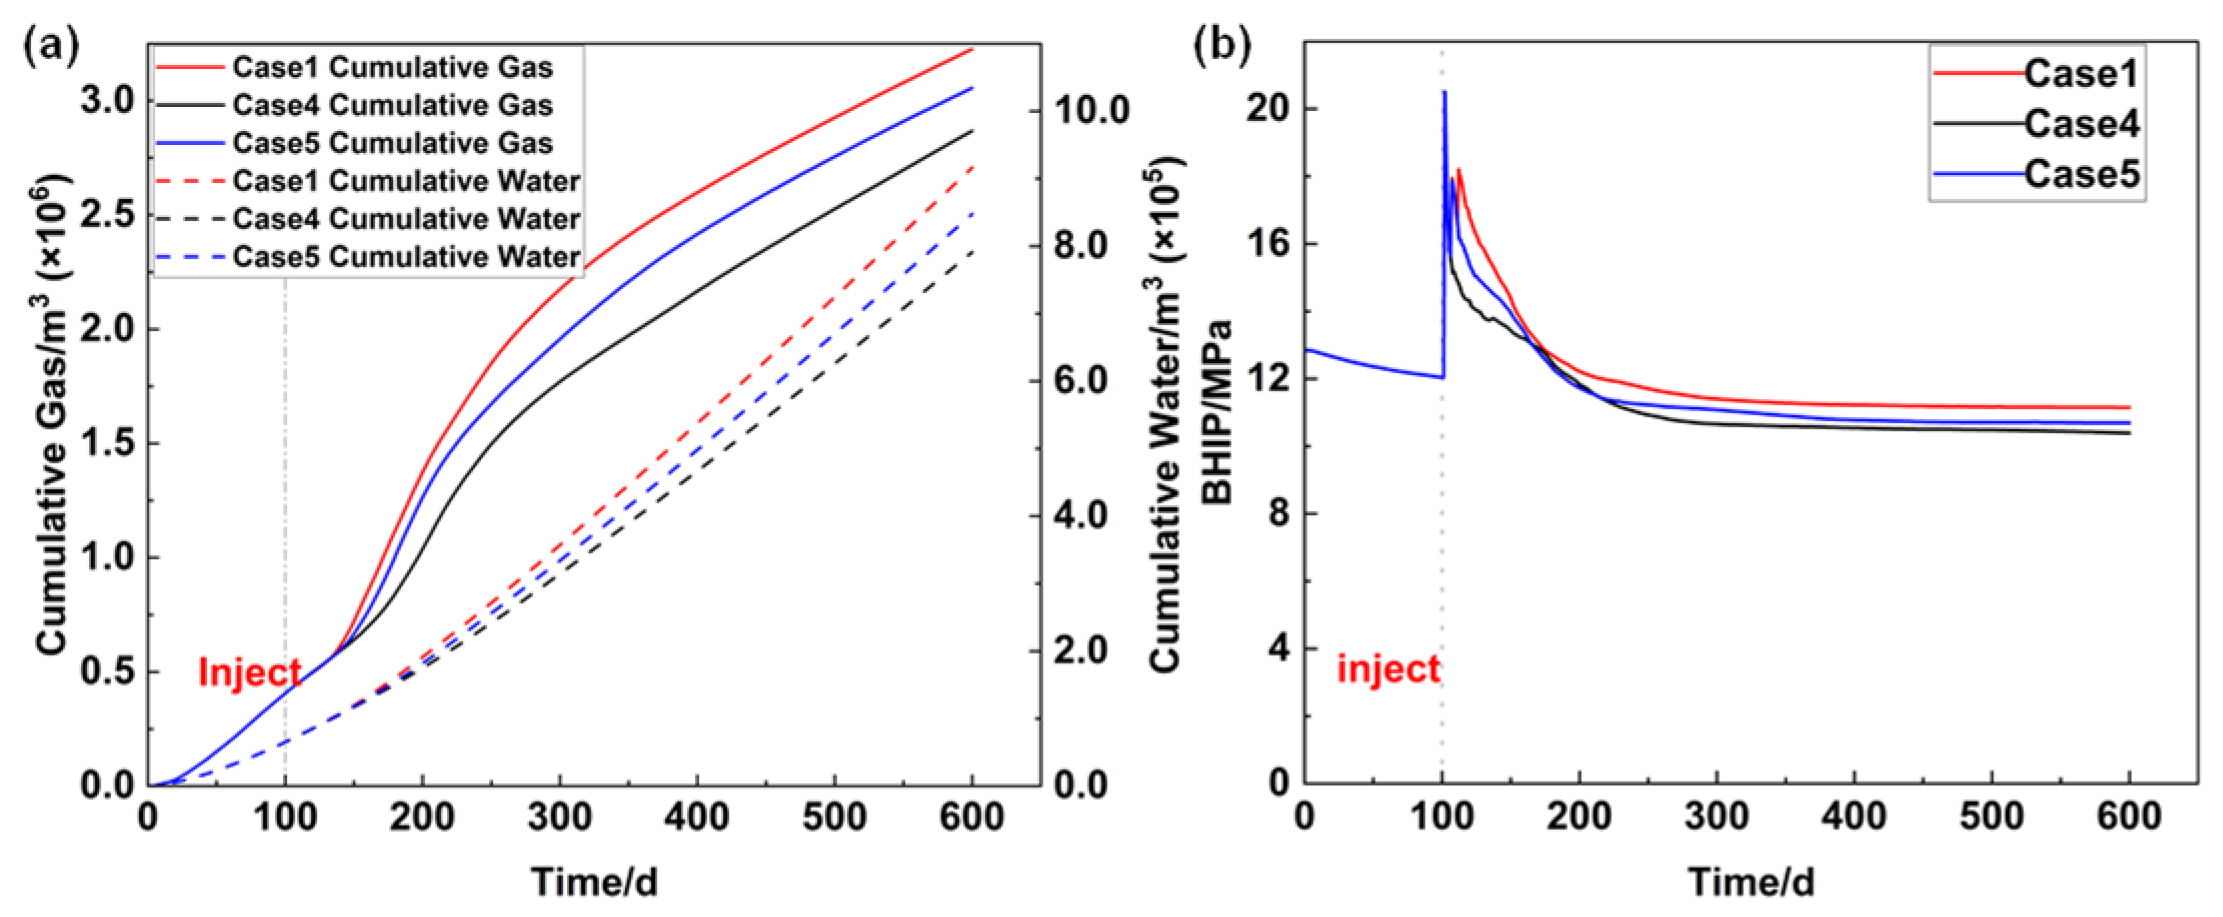
Figure 8a compares gas and water production at different injection rates (150/300/500 m3/d). Case 1 (highest rate) yields the highest cumulative gas production (3.23 × 10⁶ m3), while gas production in Cases 4 and 5 is lower by 5.28% and 11.12%, respectively. Higher injection rates increase both gas and water production. More hot water enters the reservoir per cycle, expanding hydrate dissociation. However, more water is also produced, wasting thermal energy. Excessively high rates may raise formation pressure, posing safety risks. Thus, while increasing the injection rate boosts gas production, it also causes thermal energy waste and higher water production. Economically, a lower injection rate may be more reasonable than pure depressurization.
Figure 8.
Production performance under different heat injection rates (Cases 1, 4 and 5): (a) cumulative gas and water production; (b) injection well bottom-hole pressure.
Figure 8b compares injection well bottom-hole pressures for Cases 1, 4, and 5. Pressures peak at day 101, then decline at rates that vary with injection rate: lower injection rates lead to lower bottom-hole pressures. As suggested earlier, the opening of the injection well causes the initial pressure rise, and the relationship here confirms that lower injection rates result in faster pressure decline and lower stabilization values.
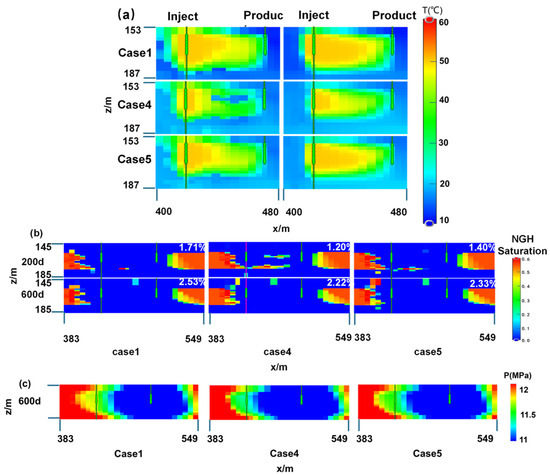
Increasing the heat injection rate expands the heated zone, especially early on. A higher rate heats the inter-well region faster, promoting hydrate dissociation around the injector. However, later-stage differences in heated zone size are minor. The injection rate must balance cost and production. Excessively high rates increase costs and formation pressure, hindering dissociation. In practice, early production seeks high rates to quickly reach peak gas output. Later, as hydrate saturation declines, lower rates maintain production and dissociate remaining hydrate. In Figure 9a, the overlying formation temperature rises significantly during early heat injection but later decreases. This is because initial hot water injection rapidly increases near-wellbore pressure, driving hot water from high- pressure to low-pressure areas, which inevitably heats the overlying formation and causes heat loss. Higher temperatures and injection rates exacerbate this loss. Since this occurs only in early stages and the loss is limited and hard to avoid, it is generally not considered when optimizing injection parameters.
Figure 9.
Hydrate layer response under different injection rates (Case1,4 and 5): (a) temperature distribution; (b) hydrate saturation distribution; (c) pressure distribution.
Figure 9b shows the hydrate saturation distribution at different injection rates. Hydrate dissociation differs significantly between 200 days and 600 days. Lower injection rates reduce hot water volume and wellhead pressure, hindering hot water diffusion and leading to lower dissociation over the same period. Given sufficient time for full diffusion, the dissociation difference would eventually diminish.
At lower injection rates, the spatial extent of secondary hydrate formation is significantly reduced, decreasing from approximately 10 m to less than 4 m. This behavior is attributed to two coupled mechanisms. First, reduced injection rates decrease water influx into the reservoir, resulting in lower water saturation and allowing more free gas to remain within the hydrate layer rather than being displaced upward. Second, and more importantly, reduced injection rates weaken the pressure gradient between injection and production wells, thereby limiting the driving force for upward gas migration into the overburden. These results indicate that injection rate is a key operational parameter for controlling secondary hydrate development, and moderate to low rates are effective in mitigating its occurrence while maintaining production efficiency.
3.3. The Impact of Different Well Types on Hydrate Extraction
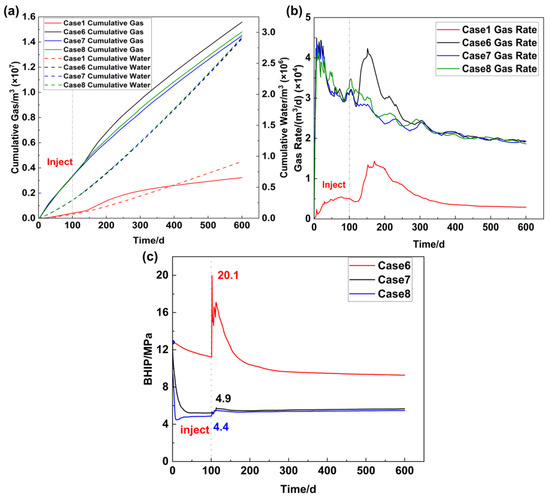
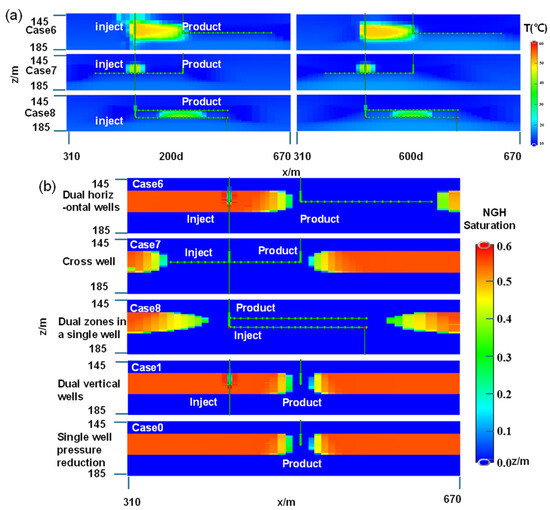
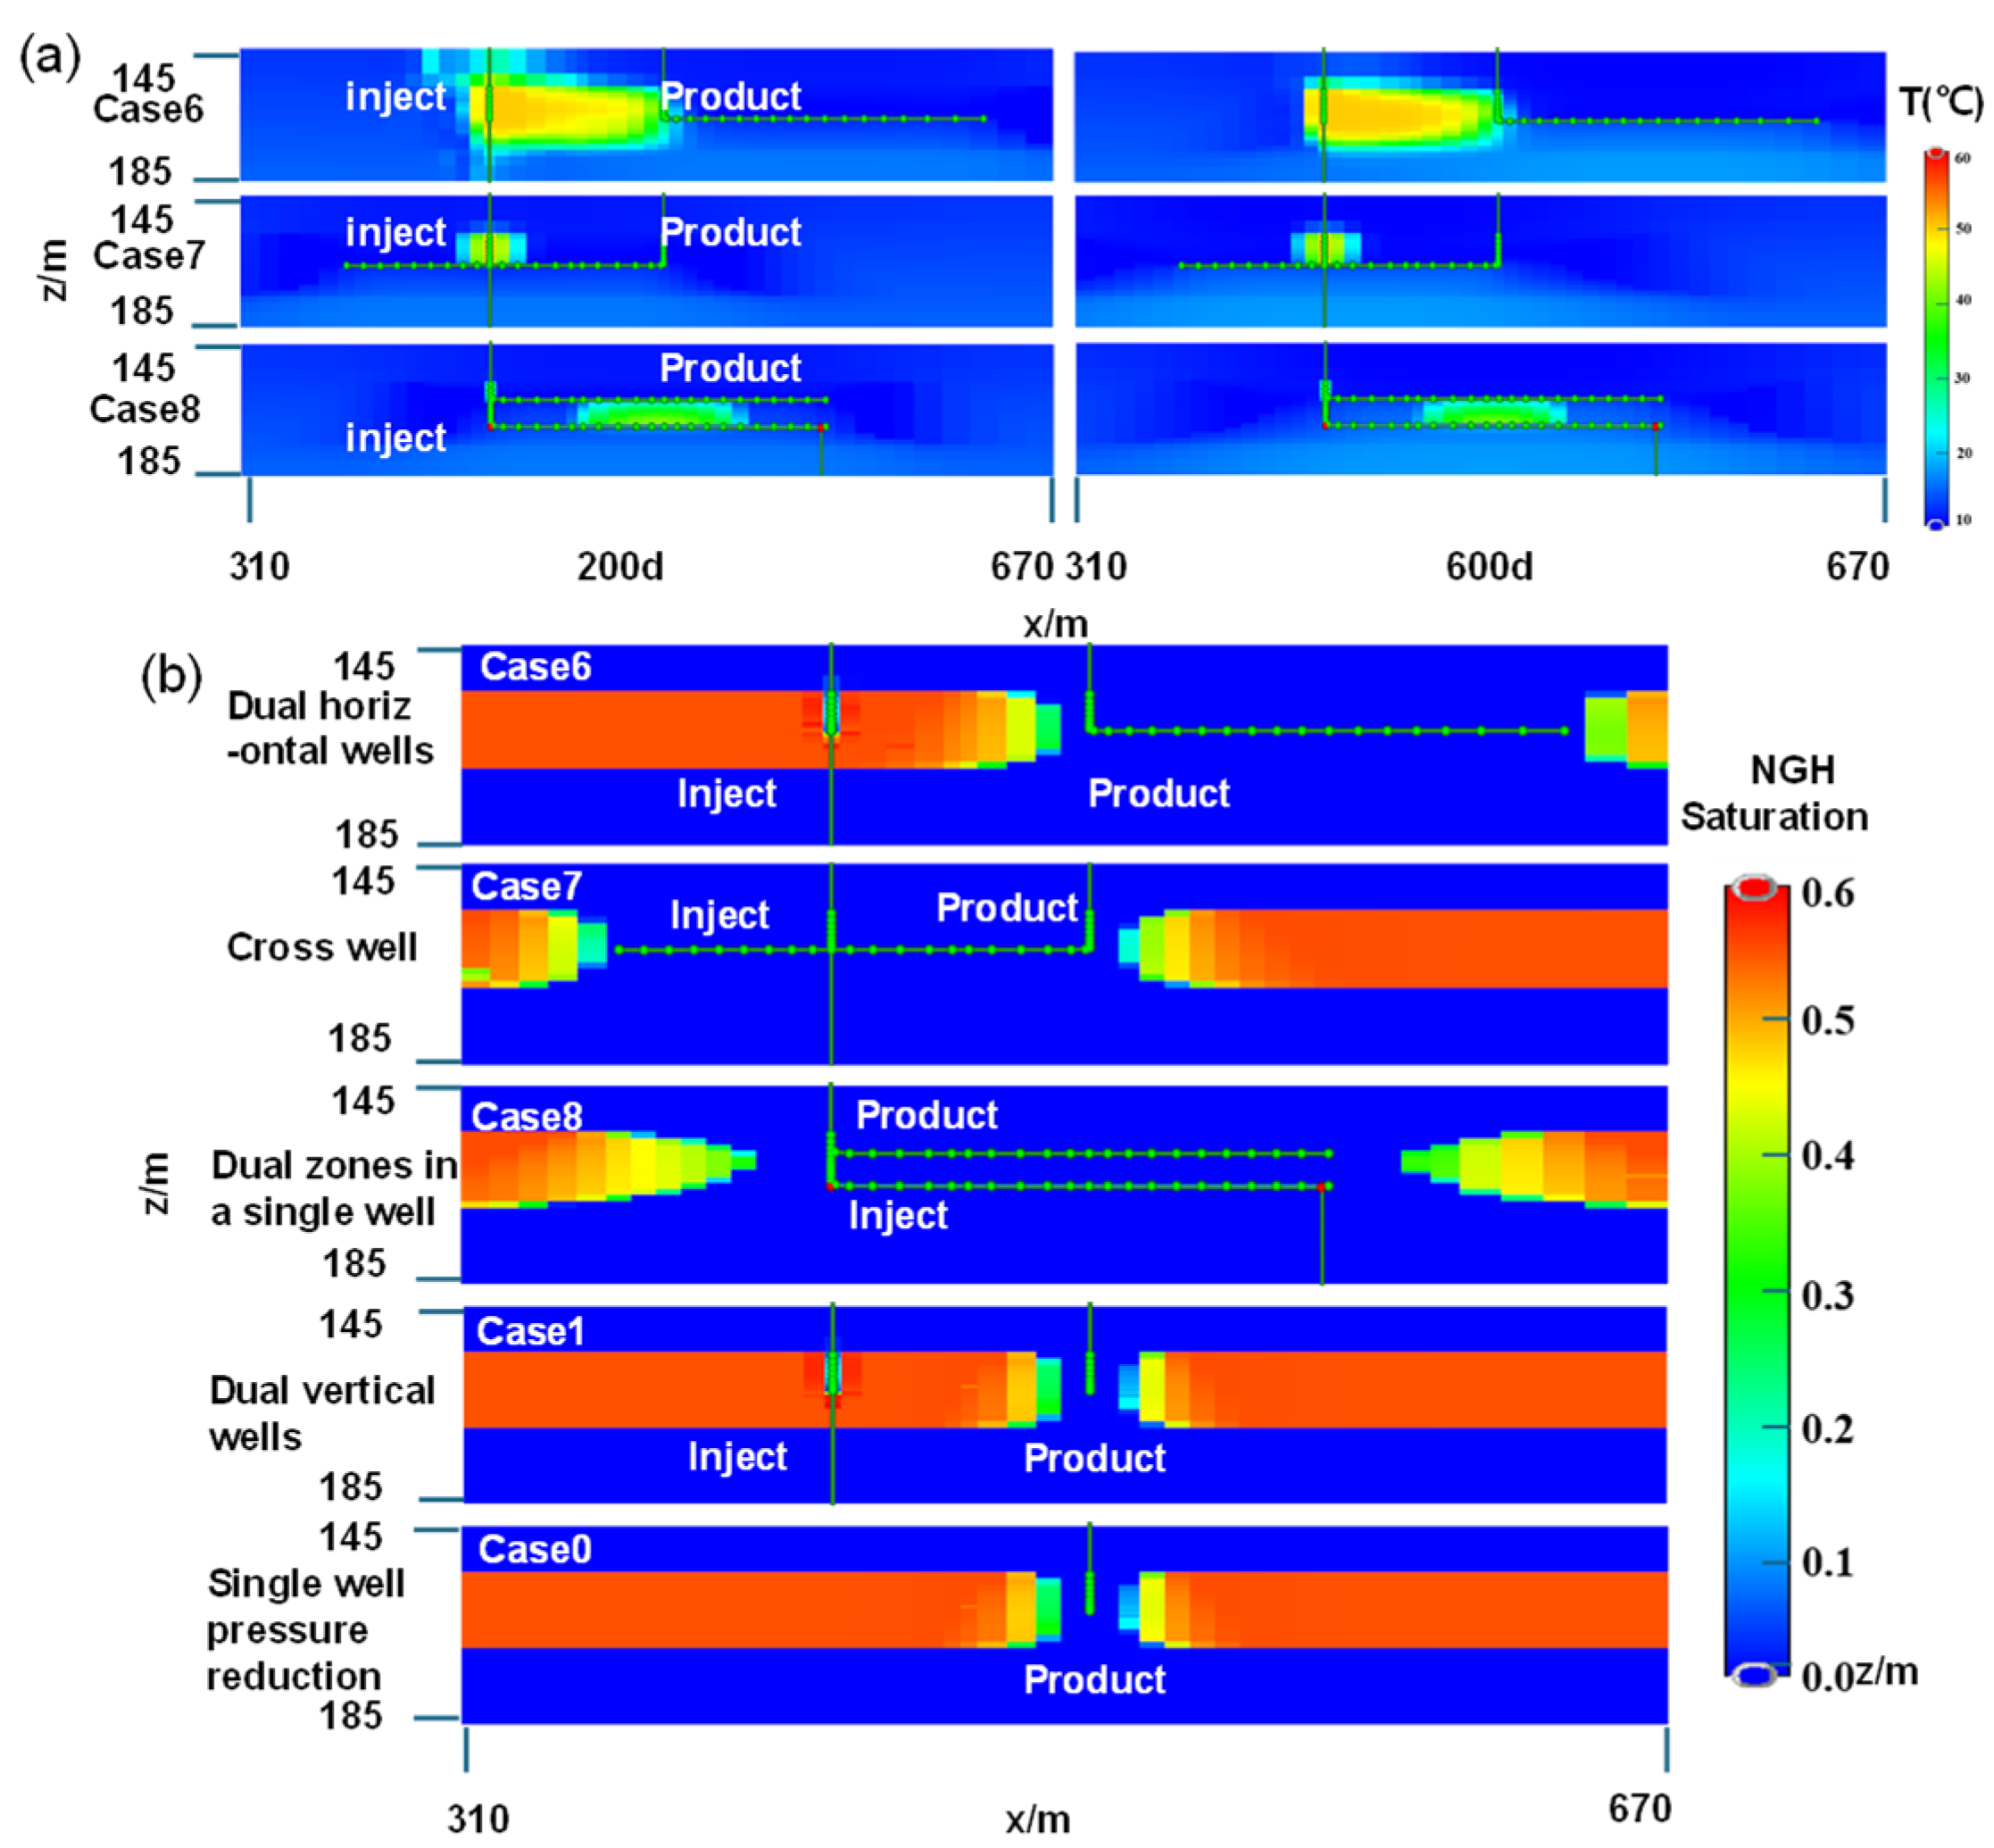
Based on the preferred vertical-well injection parameters, this section examines the production performance of different well types. Figure 10a,b show that dual-vertical wells perform significantly worse in both gas and water production than wells with horizontal sections. During depressurization, other well types already show a marked production gap from dual-vertical wells. Cases 6/7/8 (dual horizontal, cross, and dual-zone single well) yield five times the gas production of Case 1, with outputs close to each other. Compared to Case 6, gas production in Cases 7 and 8 is lower by 6.89% and 4.99%, respectively. Cases 6–8 also face rising water production. However, while Case 6 has a higher gas production rate, its water production remains nearly identical to Cases 7 and 8. The gas production rate graph shows that Case 6 has a significantly higher rate after heat injection. This is because the excessively close spacing between production and injection wells in Cases 7 and 8 hinders hot water diffusion and limits thermal stimulation of the hydrate layer.
Figure 10.
Production performance of different well layouts: (a) cumulative gas and water production (Cases 1 and 6–8); (b) gas production rate (Cases 1 and 6–8); (c) injection well bottom-hole pressure (Cases 6–8).
Unlike Cases 1–5, horizontal wells have longer perforated sections and typically achieve substantially higher production rates under depressurization than vertical wells [24,25]. They also benefit from better permeability, and the depressurization funnel extends over a wider area, keeping near-wellbore pressure lower. This reduces diffusion resistance during hot water injection, allowing bottom-hole pressure to stabilize quickly with only a slight increase. Figure 10c shows that in Case 6, the injection well bottom-hole pressure rises rapidly to 20.1 MPa at the start of injection, while in Cases 7 and 8, it is much lower both during injection and after stabilization. This occurs because in Cases 7 and 8, the injection wells are too close to the production well, and the hydrate saturation around them is lower, limiting the effect of thermal injection on gas production. Thus, well spacing and relative positioning are crucial for effective heat injection. Excessively close spacing or overlapping positions weaken the thermal effect. Ideally, the heat injection well should be placed at the edge of the production well’s pressure drop influence zone. For thicker hydrate reservoirs, the dual-zone single-well structure in Case 8 could promote dissociation both vertically and horizontally, potentially yielding better results.
In Cases 6–8, heat injection raises hydrate layer temperatures less effectively than in previous cases, especially in Cases 7 and 8. Because the injection well overlaps the production well’s extraction zone, pressure around the production well is lower than in the surrounding formation, inhibiting hot water diffusion. As shown in Figure 11a, Case 7 uses a vertical injection well with a small horizontal pressure gradient, allowing only very limited horizontal heating. In Case 8, the horizontal injection well faces high pressure below (due to depressurization from the overlying production well), preventing downward diffusion and causing noticeable heating only above the horizontal section. Overall, thermal injection performance in Cases 7 and 8 is poor due to inappropriate well spacing. Although Case 6 performs better than the vertical well scheme, its improvement is still limited and also affected by well placement. Thus, careful control of the distance between thermal injection and production wells is essential for achieving the desired production enhancement.
Figure 11.
(a) Temperature contours of the hydrate layer during production (Cases 6–8); (b) Hydrate saturation contours at the end of production for different well types (Cases 0, 1, and 6–8).
Figure 11b compares the methane hydrate saturation levels after extraction for each well type. In Case 6, the perforated section of the thermal injection well consists solely of the vertical section. Consequently, the area of the methane hydrate reservoir stimulated by hot water is smaller than the area affected by depressurization, resulting in a peak gas production rate following thermal injection that is lower than the maximum value observed during the depressurization phase. Subsequently, under the effect of hot water, the hydrate in the distant zones dissociated rapidly. However, as the perforated section of the horizontal well is longer, the gas production rate during the heat injection phase remains higher than that of the vertical well scheme, while the decline in bottom-hole pressure is also faster.
Table 6 shows the hydrate dissociation degree for Cases 6–8. The horizontal section significantly impacts dissociation, and no obvious secondary hydrate formation occurs in any of the three cases. This is because the longer perforation allows prompt gas extraction, preventing methane from migrating upward and reforming hydrate. In contrast, vertical well cases allow methane escape and secondary hydrate formation. Vertically, due to the thin hydrate reservoir, most of the hydrate dissociates early, so no secondary formation occurs. Within the first 100 days of depressurization, dissociation in Cases 6–8 already nears the final levels of vertical wells. By day 100, Case 6 shows slightly higher dissociation, but differences among the three are negligible (<0.1%). After heat injection, dissociation rises in all cases, but the rate of increase varies. In Cases 7 and 8, injection wells are too close to the production well’s horizontal section, where substantial dissociation already occurred during depressurization, so subsequent injection adds little. Case 6, however, achieves a higher final dissociation degree by placing injection wells rationally, promoting dissociation in distant areas. Overall, horizontal sections significantly enhance dissociation. Case 6’s well layout maximizes the thermal stimulation effect and achieves the best dissociation among all cases.
Table 6.
Degree of dissociation of water and hydrate reservoirs in Cases 6, 7 and 8.
3.4. Temperature Evolution Characteristics of the Geothermal Layer
Medium-to-deep geothermal extraction typically requires high heat extraction rates, so the principle of ‘heat extraction without water extraction’ must be followed to ensure sustainability [52]. This study adopts a ‘bottom extraction, top injection’ model with equal extraction and injection rates, adhering to this principle. Numerical simulations for Cases 1–8 follow this model. All cases undergo depressurization for the first 100 days. From day 101 to 600, heat injection proceeds with case-specific parameters. In Cases 2 and 3, water is extracted from 40 °C and 60 °C formations, respectively, with corresponding extraction depths. Because the geothermal layer temperatures in Cases 2 and 3 differ significantly from the others, and heat extraction well locations and depths in Cases 7 and 8 match Case 1, this section compares temperature variation characteristics of geothermal layers in Cases 1, 4, 5, and 6 after different extraction periods.
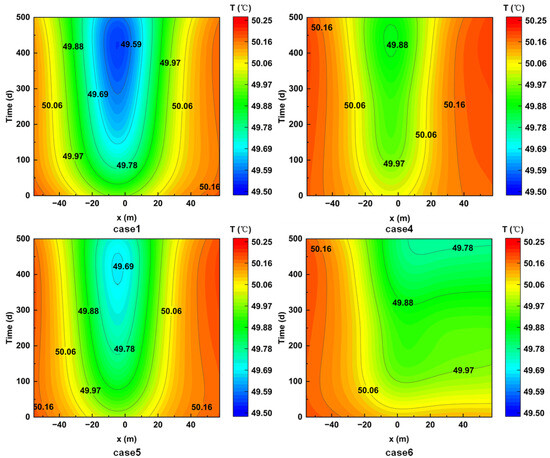
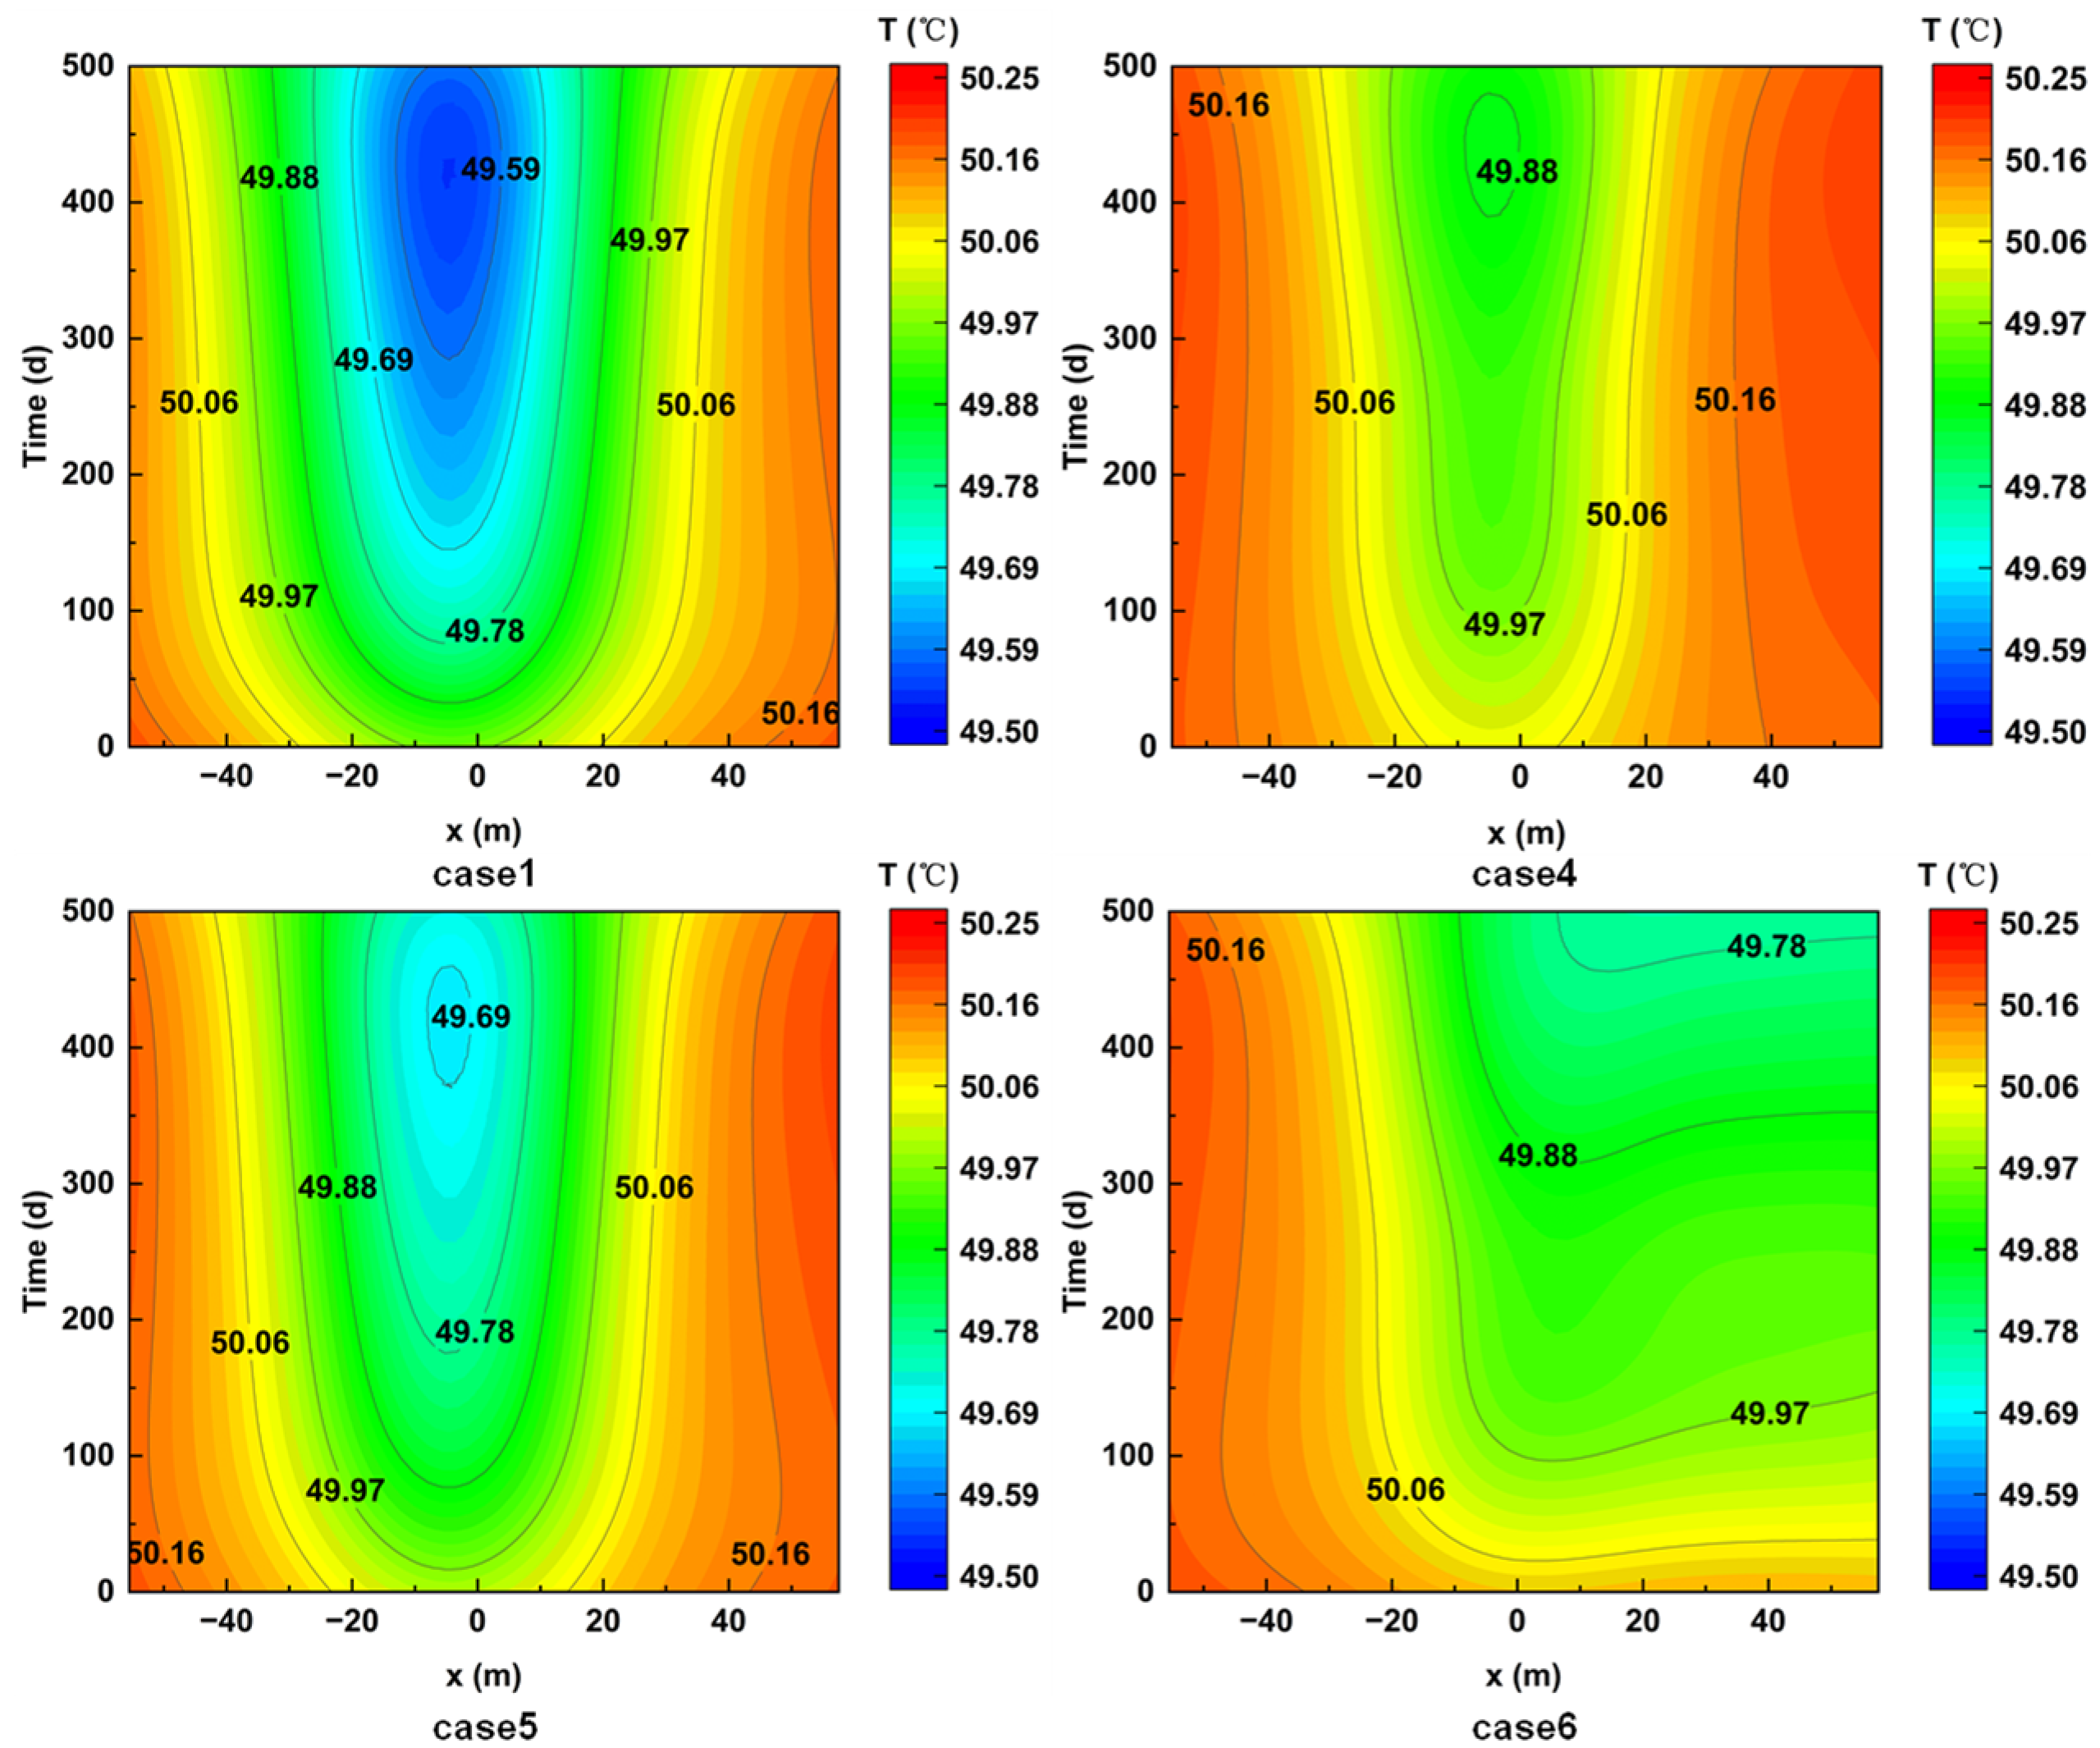
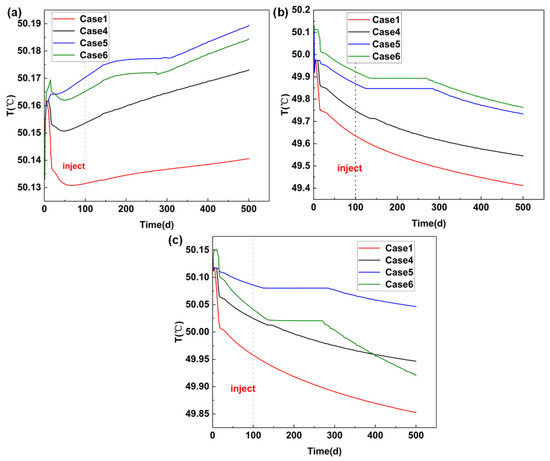
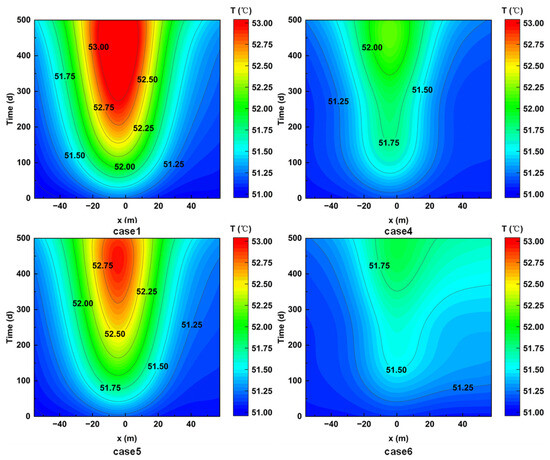
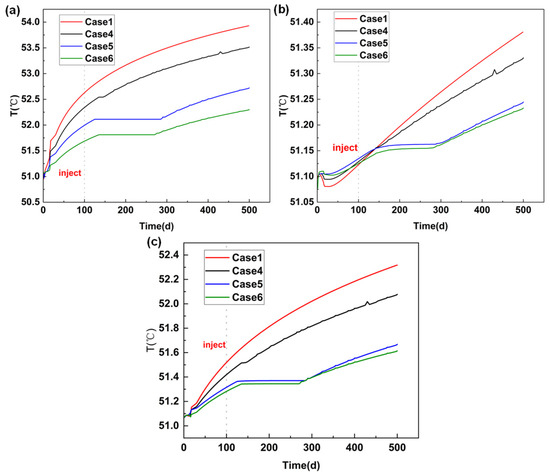
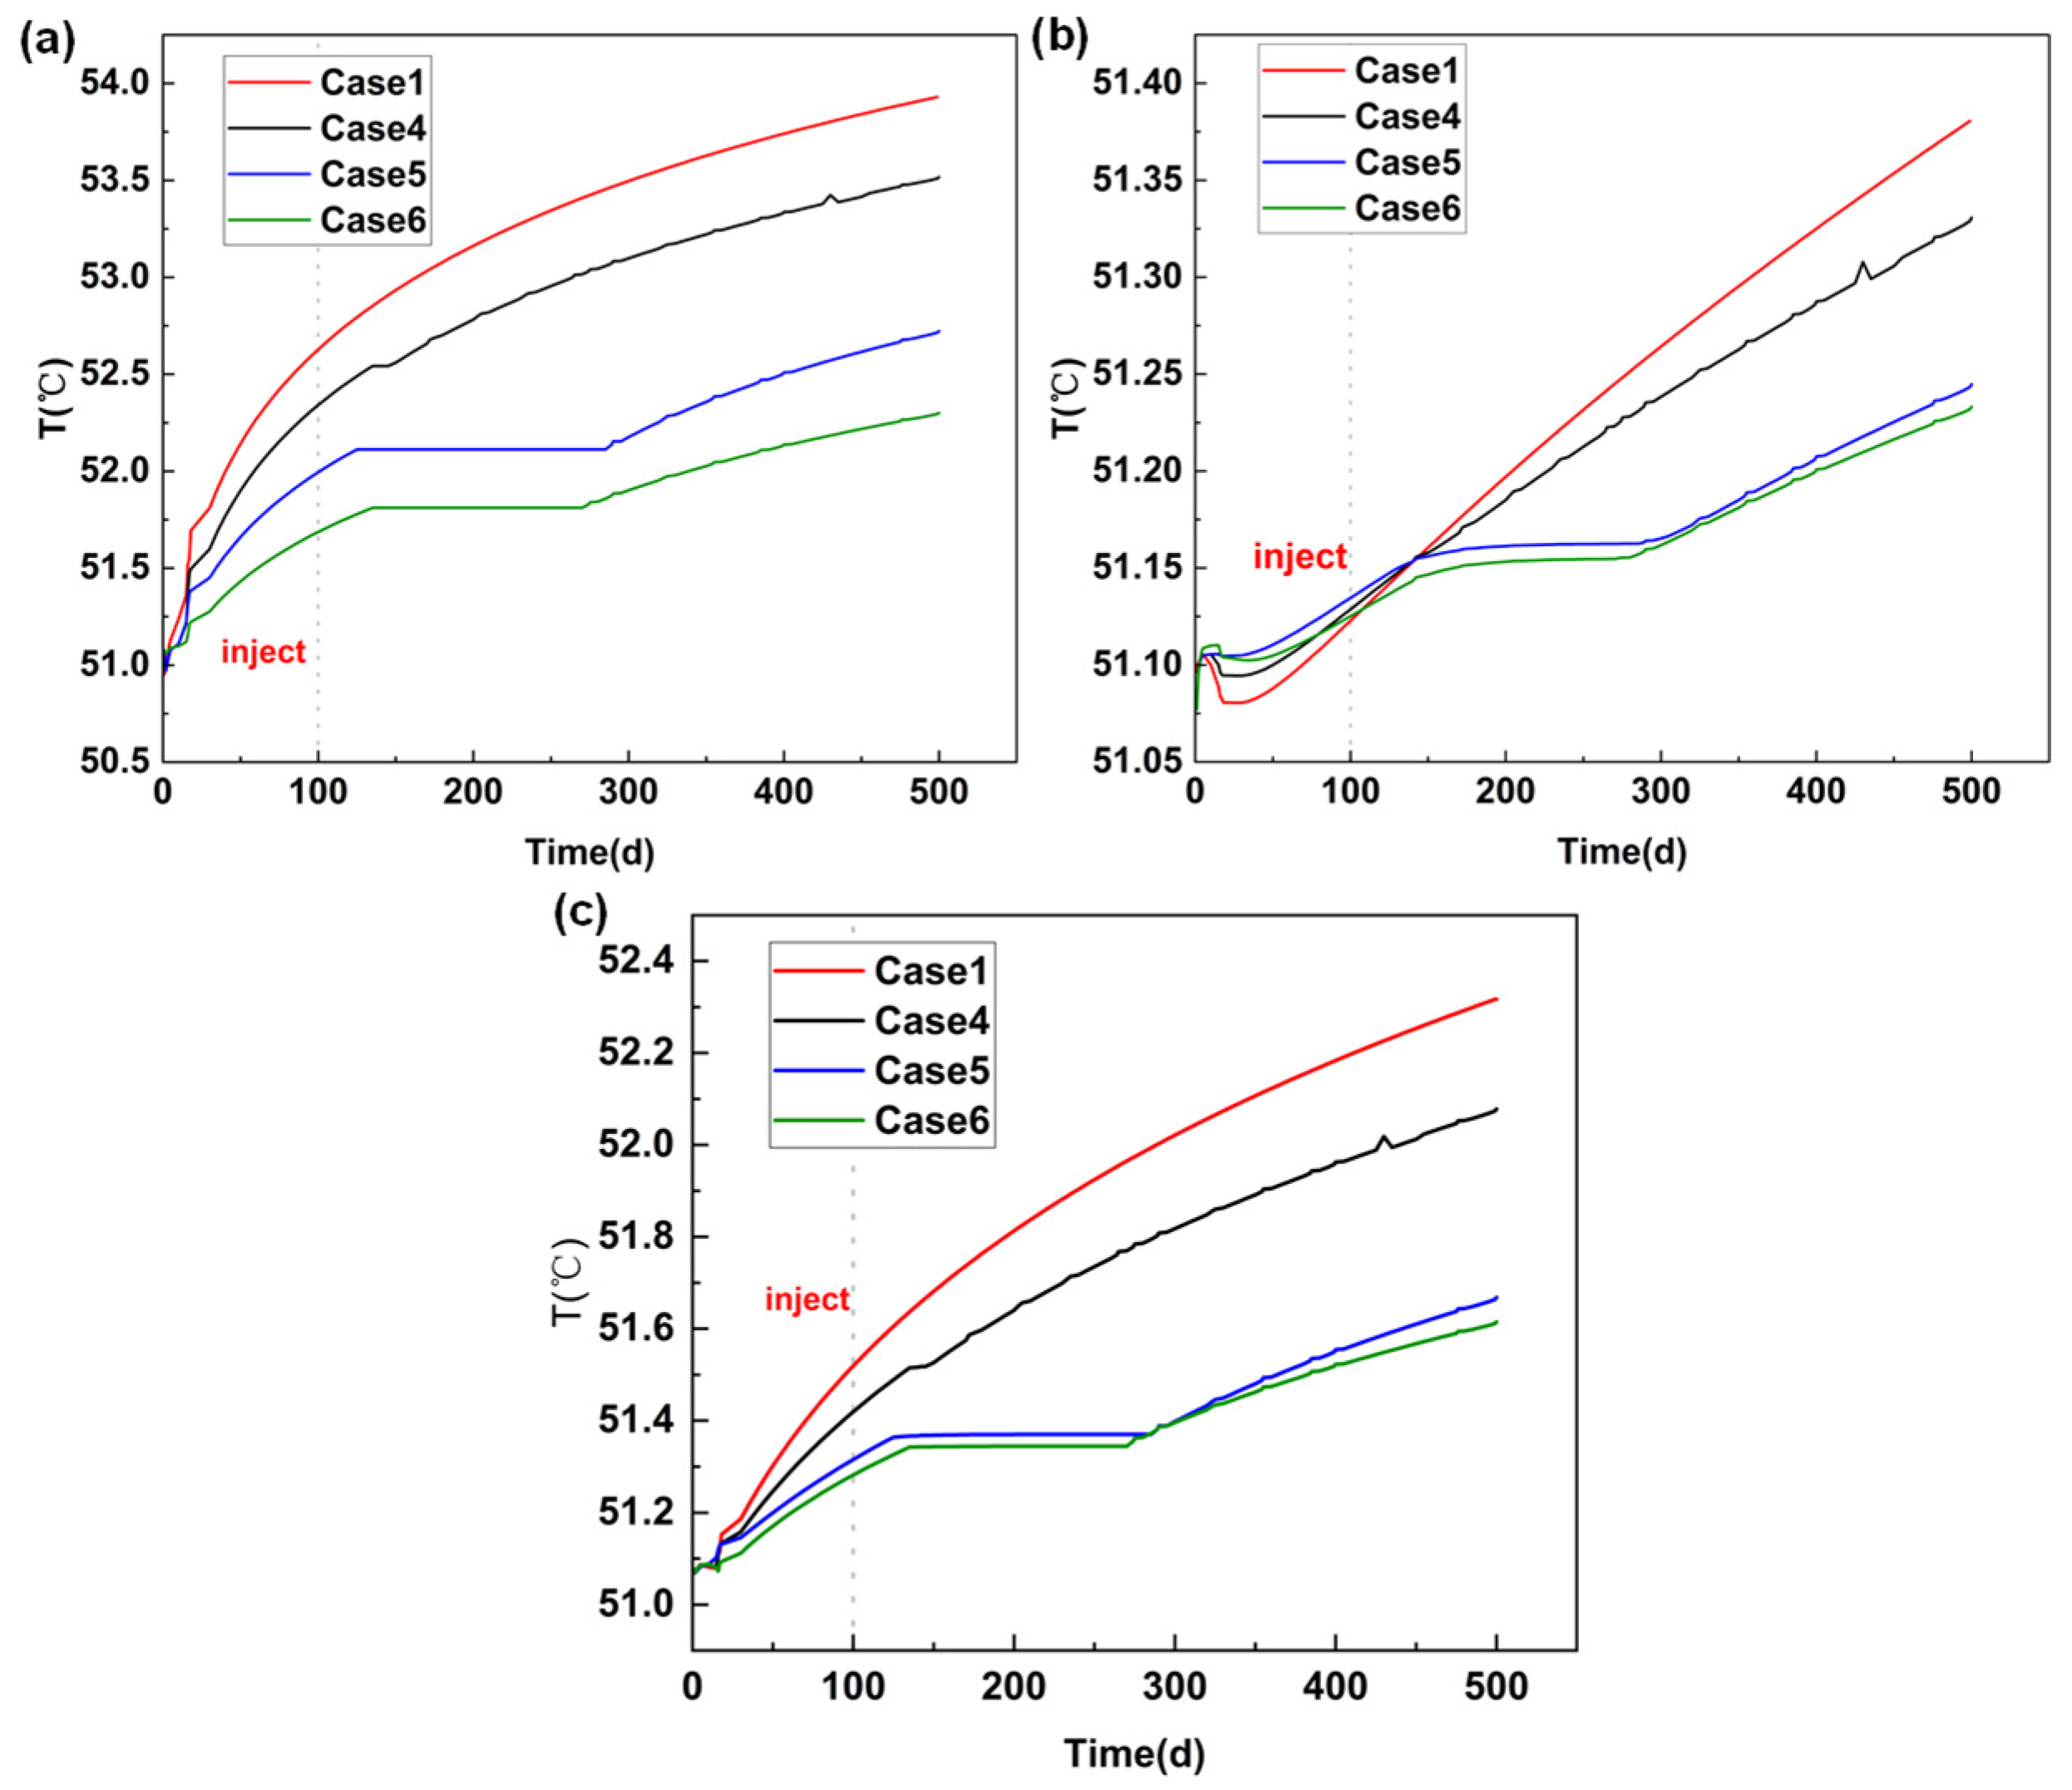
Within the geothermal formation (near the production well perforations), temperature varies slightly by location. Extracting hot water sharply drops local pressure, drawing hot water from surrounding areas. As extraction continues, pressure near perforations may fall below overlying strata pressure, allowing replenishment from multiple directions, creating two distinct temperature trends. Figure 12 shows temperature contours over time at the upper geothermal layer for different cases. In the upper layer, overall temperature declines due to cooler water from above. In Case 1, temperature gradually decreases near the wellbore, with cooling intensifying closer to the center. After 500 days, the wellbore center temperature drops from 50 °C to 49.5 °C. Cases 4 and 5 show similar patterns: near-wellbore temperatures decrease, with cooling rates increasing near the center. Higher injection rates further lower the center temperature: Case 1 (500 m3/d) reaches 49.3 °C, while Cases 4 (150 m3/d) and 5 (300 m3/d) reach 49.7 °C and 49.5 °C, respectively. Case 6 (horizontal well, section extending in +x direction) shows a significant temperature drop on the perforated side (minimum 49.6 °C after 500 days), but the opposite side remains near the initial temperature. All four figures show slight temperature rises on both sides away from perforations, due to replenishment from higher-temperature lower strata. Lower extraction rates slow pressure drop at the top, enhancing upward flow of hot water. Figure 13 compares maximum, minimum, and average temperatures at the top of the geothermal layer for different cases. Temperatures in Cases 1, 4, and 5 are negatively correlated with the extraction rate, while Case 6’s average temperature falls between these and decreases gradually, consistent with earlier analysis.
Figure 12.
Contour plots of the upper surface temperature within the geothermal layer over time for different cases (Case 1, 4, 5 and 6).
Figure 13.
Temperature evolution at the upper boundary of the geothermal layer (Case 1, 4, 5 and 6): (a) maximum temperature; (b) minimum temperature; (c) average temperature.
In Figure 14, the lower strata in Case 1 show the opposite trend: temperature rises more at the wellbore center. After 500 days, it increases from 51 °C to 53.5 °C. Temperature variation is greater in the lower part due to higher formation pressure, which makes hot water extraction easier and causes larger pressure changes, drawing more water from lower strata. Cases 4 and 5 support this: with a lower extraction rate, Case 4 reaches only 52 °C (about 1 °C rise). The lower end sees a 2.5 °C change, versus 0.75 °C at the upper end. In Case 6, the temperature difference between upper and lower ends is very small, likely because the horizontal well extracts replenished hot water before it fully heats the formation, resulting in only a 0.9 °C rise. At the lower end, the right side (influenced by the horizontal section) is cooler and closer to the initial temperature, indicating that the right-side well drives hot water toward the wellbore center, causing opposite temperature trends on the right side at the upper and lower ends. In Figure 15, temperature variation in Cases 1, 4, and 5 is positively correlated with extraction rate, with the highest temperature nearest the right side and the lowest farthest left. Case 6 (horizontal perforation) has the same extraction rate as Case 1 and similar average temperature variation, but its larger perforation area prevents timely heating, resulting in the lowest average temperature. Overall, temperature variations remain relatively small, indicating that using extracted hot water for hydrate depressurization may provide a certain degree of operational stability under the investigated conditions. However, the actual service life of the geothermal system requires further investigation due to the limited simulation period. Nevertheless, higher water extraction rates enhance hydrate recovery while potentially reducing system lifetime, indicating a trade-off between production performance and sustained operational duration that warrants further study. Additionally, the impact of large pressure fluctuations from high extraction/injection rates on formation stability must not be overlooked.
Figure 14.
Contour plots of the lower boundary temperature within the geothermal formation over time for different cases (Case 1, 4, 5 and 6).
Figure 15.
Temperature evolution at the lower boundary of the geothermal formation (Case 1, 4, 5 and 6): (a) maximum temperature; (b) minimum temperature; (c) average temperature.
4. Discussion
The simulation results are generally consistent with previous studies while providing additional insights into the mechanisms governing geothermal-assisted hydrate production.
With respect to injection temperature, higher temperatures enhance early-stage hydrate dissociation and gas production. However, the marginal benefit decreases when the injection temperature exceeds 50 °C. This trend is consistent with Zhang et al. [27], who attributed the reduced efficiency to increased thermal dissipation and a weakened thermal driving force. Compared with Shi et al. [15], the present field-scale results further indicate that thermal conduction remains the dominant heat-transfer mechanism in low-permeability clayey-silt reservoirs, while large-scale convective transport is relatively limited.
Regarding injection rate, higher rates enlarge the thermal influence zone and accelerate hydrate dissociation near the injector, consistent with Lei et al. [17]. However, excessive injection rates increase bottom-hole pressure and reduce pressure propagation efficiency. Therefore, the identified optimal rate (500 m3/d) reflects a balance between thermal enhancement and hydraulic stability.
For well configuration, horizontal wells outperform vertical wells due to improved drainage efficiency and enhanced depressurization, consistent with previous studies [24,25]. In addition, excessive proximity between injection and production wells may reduce thermal efficiency due to hydraulic interference. In this case, pressure depletion around the production well limits hot-water migration from the injector, thereby reducing thermal sweep efficiency. The dual-zone single-well configuration (Case 8) may provide additional advantages for thicker reservoirs by enabling coupled vertical and lateral dissociation.
Secondary hydrate formation represents another important factor affecting production efficiency. The results indicate that its occurrence is controlled by the coupled effects of gas migration, pressure redistribution, and local temperature evolution. Although secondary hydrate formation remains spatially limited under the investigated conditions, it may partially reduce gas recovery by trapping dissociated methane in regions outside the primary dissociation zone. Based on the mechanistic analysis, several mitigation strategies can be identified. A staged thermal injection scheme may help avoid excessive early-stage gas release while maintaining long-term thermal stimulation. In addition, moderate injection rates can reduce pressure-driven gas migration toward the overburden, thereby suppressing secondary hydrate formation. Optimized well configurations may further improve methane capture efficiency and limit gas accumulation in low-temperature regions. Among these approaches, staged thermal injection appears particularly attractive because it can be implemented without additional infrastructure and can be flexibly adjusted according to reservoir performance.
Beyond short-term production behavior, the geothermal system exhibits strong thermal stability over the 600-day simulation period. Only minor temperature variation is observed within the geothermal layer, which can be attributed to its large thermal capacity, continuous deep heat recharge, and the closed-loop injection–production scheme. These coupled effects maintain a near-balanced thermal state during operation, suggesting favorable conditions for sustained production under controlled extraction rates.
From an environmental perspective, methane migration into overlying sediments is limited under the investigated conditions. The simulated methane plume remains localized, with a maximum gas saturation of approximately 0.02 extending about 12 m above the hydrate layer after 600 days, indicating efficient capture of most dissociated methane by the production well.
Several limitations should be noted. First, although insulated tubing is assumed, minor heat loss during fluid transport may slightly reduce effective injection temperature [47,48]. Second, the relative permeability and capillary pressure parameters are derived from the literature values rather than site-specific measurements, introducing uncertainty in absolute production predictions. Third, the 600-day simulation period is sufficient for short- to mid-term analysis but does not capture long-term reservoir evolution. Future work should incorporate extended simulations and field validation to further assess the practical feasibility of geothermal-assisted hydrate production.
5. Conclusions
This study demonstrates that geothermal-assisted depressurization significantly outperforms conventional depressurization for hydrate extraction. With optimized parameters (50 °C, 500 m3/d, dual horizontal wells), the system achieves a 40% increase in cumulative gas production while maintaining geothermal layer temperature stability within 1 °C over 600 days. Key findings are summarized as follows:
- (1)
- Higher injection temperatures accelerate early-stage dissociation, but the marginal benefit diminishes beyond 50 °C.
- (2)
- The optimal injection rate of 500 m3/d balances production enhancement with operational safety. Excessive rates elevate bottom-hole pressure and hinder pressure propagation.
- (3)
- Horizontal wells significantly enhance dissociation, but excessively close well spacing weakens thermal stimulation due to well interference. The dual-zone single well configuration (Case 8) is better suited for thicker hydrate layers.
- (4)
- The geothermal layer remains thermally stable over 600 days, suggesting favorable conditions for sustained operation.
In summary, geothermal-assisted depressurization is a technically feasible and sustainable method for hydrate extraction. The findings provide a theoretical basis for future pilot-scale tests in the South China Sea.
Author Contributions
Y.W.: Writing—original draft, Visualization, Validation, Methodology, Formal analysis, Data curation, Conceptualization. X.G.: Writing—review & editing, Supervision, Resources, Conceptualization. J.L.: Writing—review & editing, Software, Formal analysis. H.L.: Writing—review & editing, Methodology, Data curation. J.Z.: Writing—review & editing, Methodology. Y.Z.: Writing—review & editing, Supervision, Resources, Conceptualization. All authors have read and agreed to the published version of the manuscript.
Funding
This work was financially supported by the Open Fund of the State Key Laboratory of Deep Geothermal Resources under Grant No. 30130255-25-FW2313-0001, Postdoctoral Fellowship Program and China Postdoctoral Science Foundation (Grant No. BX20250031), National Natural Science Foundation of China (Grant No. 52504010), and Science Foundation of China University of Petroleum, Beijing (Grant No. 2462025XKBH013).
Data Availability Statement
The data presented in this study are available from the corresponding author upon reasonable request.
Conflicts of Interest
Yanxing Wang, Xinfeng Guo, Jinxia Liu, and Hao Li are employed by Sinopec (Beijing) New Energy Technology Research Institute Co., Ltd. The remaining authors declare that the research was conducted in the absence of any commercial or financial relationships that could be construed as a potential conflict of interest.
References
- Wei, N.; Pei, J.; Li, H.; Zhou, S.; Zhao, J.; Kvamme, B.; Coffin, R.B.; Zhang, L.; Zhang, Y.; Xue, J. Classification of natural gas hydrate resources: Review, application and prospect. Gas Sci. Eng. 2024, 124, 205269. [Google Scholar] [CrossRef] [Scilit]
- Zhu, Y.; Wang, P.; Pang, S.; Zhang, S.; Xiao, R. A Review of the Resource and Test Production of Natural Gas Hydrates in China. Energy Fuels 2021, 35, 9137–9150. [Google Scholar] [CrossRef] [Scilit]
- Liu, Z.; Zheng, J.; Wang, Z.; Gao, Y.; Sun, B.; Liao, Y.; Linga, P. Effect of clay on methane hydrate formation and dissociation in sediment: Implications for energy recovery from clayey-sandy hydrate reservoirs. Appl. Energy 2023, 341, 121064. [Google Scholar] [CrossRef] [Scilit]
- Zhang, J. The fast-growing geothermal industry in China. Nat. Gas Ind. B 2024, 11, 1–5. [Google Scholar] [CrossRef] [Scilit]
- Wu, N.; Zhang, H.; Yang, S.; Zhang, G.; Liang, J.; Lu, J.A.; Su, X.; Schultheiss, P.; Holland, M.; Zhu, Y. Gas hydrate system of Shenhu area, northern South China Sea: Geochemical results. J. Geol. Res. 2011, 2011, 370298. [Google Scholar] [CrossRef] [Scilit]
- Dong, M.; Zhang, J.; Xu, X.; Wu, S.-G. The differences between the measured heat flow and BSR heat flow in the Shenhu gas hydrate drilling area, northern South China Sea. Energy Explor. Exploit. 2019, 37, 756–769. [Google Scholar]
- Mi, L.; Yuan, Y.; Zhang, G. Characteristics and genesis of geothermal field in deep-water areaof the northern South China Sea. Acta Pet. Sin. 2009, 30, 27–32. [Google Scholar] [CrossRef]
- Yamamoto, K.; Nagakubo, S. Review of Energy Efficiency of the Gas Production Technologies from Gas Hydrate-Bearing Sediments. Front. Energy Res. 2021, 9, 741715. [Google Scholar] [CrossRef] [Scilit]
- Hsieh, P.-Y.; Sean, W.-Y.; Sato, T.; Seo, Y.-W. Mesoscale Modeling of Exploiting Methane Hydrate by CO2 Replacement in Homogeneous Porous Media. Int. J. Heat Mass Transf. 2020, 158, 119741. [Google Scholar] [CrossRef] [Scilit]
- Lin, K.; Zhao, Y.-P. Entropy and enthalpy changes during adsorption and displacement of shale gas. Energy 2021, 221, 119854. [Google Scholar] [CrossRef] [Scilit]
- Liang, S.; Liang, D.; Wu, N.; Yi, L.; Hu, G. Molecular Mechanisms of Gas Diffusion in CO2 Hydrates. J. Phys. Chem. C 2016, 120, 16298–16304. [Google Scholar] [CrossRef] [Scilit]
- Mao, P.; Nengyou, W.; Ning, F. Behaviors of gas and water production from hydrate induced bydepressurization with different types of wells. Nat. Gas Ind. 2020, 40, 168–176. [Google Scholar] [CrossRef]
- Zhang, W.; Li, S. Experimental Study of Natural Gas Hydrate Dissociation in Porous Media with a 2D Experimental System by Continuous Thermal Stimulation and Depressurization. Mar. Geol. Front. 2012, 28, 66–70. [Google Scholar] [CrossRef]
- Zhao, G.; Zheng, J.-N.; Gong, G.; Yang, M.; Song, Y. Production characteristics and visualization insight of top/bottom depressurization exploitation of natural gas hydrate with overpressure gas. Fuel 2025, 379, 133030. [Google Scholar] [CrossRef] [Scilit]
- Shi, K.; Wei, K.; Jiang, Z.; Fan, Q.; Li, Q.; Leng, S.; Zhou, Y.; Zhang, L.; Liu, Y.; Zhao, J.; et al. Optimization of energy efficiency in gas production from hydrates assisted by geothermal energy enriched in the deep gas. Int. J. Heat Mass Transf. 2024, 234, 126122. [Google Scholar] [CrossRef] [Scilit]
- Shi, K.; Xue, K.; Gao, P.; Wei, K.; Fan, Q.; Li, Q.; Leng, S.; Zhou, Y.; Zhang, L.; Liu, Y.; et al. Experimental analysis of the hydrate dissociation assisted by the deep gas heat transported through the circulating water. Geoenergy Sci. Eng. 2024, 242, 213205. [Google Scholar] [CrossRef] [Scilit]
- Yang, L.; Wei, K.; Xing, H.; Guo, X.; Lv, X.; Li, Q.; Leng, S.; Zhou, Y.; Zhao, J.; Song, Y. Promoted hydrate decomposition behavior assisted by enhancing heat exchange with the geothermal energy. Chem. Eng. J. 2025, 512, 162662. [Google Scholar] [CrossRef] [Scilit]
- Sun, Z.; ZHU, X.; Liu, L. Feasibility Study on Joint Exploitation of Methane Hydrate with Deep Geothermal Energy. Mar. Geol. Quat. Geol. 2019, 39, 146–156. [Google Scholar] [CrossRef]
- Zheng, S.; Yuncheng, C.; Rui, Y.; Keni, Z.; Nengyou, W. Feasibility of Gas Production from Hydrate Reservoir Considering Heat Conduction: Taking Shenhu Area in the South China Sea as an Example. Geoscience 2011, 25, 608–616. [Google Scholar] [CrossRef] [Scilit]
- He, J. Numerical Simulation of a Class I Gas Hydrate Reservoir Depressurized by a Fishbone Well. Processes 2023, 11, 771. [Google Scholar] [CrossRef] [Scilit]
- Shao, Z.; He, G.; Liu, H.; Lin, Q.; Sun, L.; Zhao, Y.; Huang, L. Numerical study on heat and mass transfer characteristics of hot water-induced hydrate dissociation. Int. J. Heat Mass Transf. 2025, 241, 126776. [Google Scholar] [CrossRef] [Scilit]
- Shen, K.; Wang, Y.; Yan, X.; Zhou, J.; Zhang, K.; Jiang, Y. Numerical Study of Hydrate Dissociation and Heat Stimulation by Hot Water Injection in Gas Hydrate Reservoirs. Energy Sci. Eng. 2025, 13, 551–561. [Google Scholar] [CrossRef] [Scilit]
- Ye, H.; Chen, J.; Yao, Y.; Chen, D.; Wu, X.; Li, D.; Zi, M. Gas recovery from low-permeability muddy silt gas hydrate reservoirs by depressurization coupled with hot water injection: Impact of hydro-lock effect. Energy 2025, 316, 134413. [Google Scholar] [CrossRef] [Scilit]
- Zhang, P.; Tian, S.; Zhang, Y.; Li, G.; Zhang, W.; Khan, W.A.; Ma, L. Numerical simulation of gas recovery from natural gas hydrate using multi-branch wells: A three-dimensional model. Energy 2021, 220, 119549. [Google Scholar] [CrossRef] [Scilit]
- Liu, Y.; Hou, J.; Zhao, H.; Liu, X.; Xia, Z. Numerical simulation of simultaneous exploitation of geothermal energy and natural gas hydrates by water injection into a geothermal heat exchange well. Renew. Sustain. Energy Rev. 2019, 109, 467–481. [Google Scholar] [CrossRef] [Scilit]
- Lin, D.; Lu, J.; Liu, J.; Liang, D.; Li, D.; Jin, G.; Xia, Z.; Li, X. Numerical study on natural gas hydrate production by hot water injection combined with depressurization. Energy 2023, 282, 128862. [Google Scholar] [CrossRef] [Scilit]
- Zhang, Z.; Li, Y.; Li, S.; He, J.; Li, X.; Xu, T.; Lu, C.; Qin, X. Optimization of the natural gas hydrate hot water injection production method: Insights from numerical and phase equilibrium analysis. Appl. Energy 2024, 361, 122963. [Google Scholar] [CrossRef] [Scilit]
- Zhang, Z.; Xu, T.; Li, S.; Guo, P.; Li, X.; Lu, C.; Sun, Y.; Wang, P.; Qin, X. Comparative analysis of three heating methods for natural gas hydrate production: Electric heating, steam injection, and hot water injection. Appl. Therm. Eng. 2025, 269, 126131. [Google Scholar] [CrossRef] [Scilit]
- Shan, Z.; Zhou, B.; Kong, Q.; Wang, X.; Liao, Y.; Wang, Z.; Zhang, J. Analysis of Production Laws of Hydrate Reservoirs via Combined Heat Injection and Depressurization Based on Local Thermal Non-Equilibrium. J. Mar. Sci. Eng. 2024, 12, 1408. [Google Scholar] [CrossRef] [Scilit]
- Wan, T.; Li, Z.; Wen, M.; Chen, Z.; Tian, L.; Li, Q.; Qu, J.; Wang, J. Numerical Simulation of Production Behavior with Different Complex Structure Well Types in Class 1-Type Hydrate Reservoir. J. Mar. Sci. Eng. 2024, 12, 508. [Google Scholar] [CrossRef] [Scilit]
- Konno, Y.; Masuda, Y.; Akamine, K.; Naiki, M.; Nagao, J. Sustainable gas production from methane hydrate reservoirs by the cyclic depressurization method. Energy Convers. Manag. 2016, 108, 439–445. [Google Scholar] [CrossRef] [Scilit]
- Sasaki, K.; Ono, S.; Sugai, Y.; Ebinuma, T.; Narita, H.; Yamaguchi, T. Gas Production System From Methane Hydrate Layers by Hot Water Injection Using Dual Horizontal Wells. J. Can. Pet. Technol. 2009, 48, 21–26. [Google Scholar] [CrossRef] [Scilit]
- Suárez-Arriaga, M.-C.; Bundschuh, J.; Samaniego, F. Assessment of submarine geothermal resources and development of tools to quantify their energy potentials for environmentally sustainable development. J. Clean. Prod. 2014, 83, 21–32. [Google Scholar] [CrossRef] [Scilit]
- Gu, Y.; Li, S.; Song, Z.; Xu, C.; Lu, H.; Yin, Z. Effects of multi-well pattern on gas production enhancement from South China Sea clayey-silty natural gas hydrate deposits. Ocean Eng. 2025, 341, 122726. [Google Scholar] [CrossRef] [Scilit]
- Qin, X.; Liang, Q.; Ye, J.; Yang, L.; Qiu, H.; Xie, W.; Liang, J.; Lu, J.A.; Lu, C.; Lu, H.; et al. The response of temperature and pressure of hydrate reservoirs in the first gas hydrate production test in South China Sea. Appl. Energy 2020, 278, 115649. [Google Scholar] [CrossRef] [Scilit]
- Ota, M.; Morohashi, K.; Abe, Y.; Watanabe, M.; Smith, J.R.L.; Inomata, H. Replacement of CH4 in the hydrate by use of liquid CO2. Energy Convers. Manag. 2005, 46, 1680–1691. [Google Scholar] [CrossRef] [Scilit]
- Bai, Y.; Hou, J.; Liu, Y.; Lu, N.; Zhao, E.; Ji, Y. Interbed patterns division and its effect on production performance for class I hydrate deposit with mudstone interbed. Energy 2020, 211, 118666. [Google Scholar] [CrossRef] [Scilit]
- Aziz, K.; Settari, A. Petroleum Reservoir Simulation; Society of Petroleum Engineers: Richardson, TX, USA, 2020. [Google Scholar] [CrossRef] [Scilit]
- van Genuchten, M.T. A Closed-form Equation for Predicting the Hydraulic Conductivity of Unsaturated Soils. Soil Sci. Soc. Am. J. 1980, 44, 892–898. [Google Scholar] [CrossRef] [Scilit]
- Zhao, X.; Wang, Z.; Zhao, Y. Coupled thermal-hydrodynamic-mechanical numerical simulation of natural gas hydratehorizontal well depressurization production: Method and application in South China Sea. Nat. Gas Ind. 2022, 42, 138–149. [Google Scholar]
- Rutqvist, J.; Moridis, G.J.; Grover, T.; Silpngarmlert, S.; Collett, T.S.; Holdich, S.A. Coupled multiphase fluid flow and wellbore stability analysis associated with gas production from oceanic hydrate-bearing sediments. J. Pet. Sci. Eng. 2012, 92–93, 65–81. [Google Scholar] [CrossRef] [Scilit]
- STARS User’s Guide: Advanced Process and Thermal Reservoir Simulator, version 2021.10. Software for Thermal Reservoir Simulation. Computer Modelling Group Ltd.: Calgary, AB, Canada, 2022.
- Uddin, M.; Coombe, D.; Law, D.; Gunter, B. Numerical Studies of Gas Hydrate Formation and Decomposition in a Geological Reservoir. J. Energy Resour. Technol. 2008, 130, 032501. [Google Scholar] [CrossRef] [Scilit]
- Li, Y.; Luo, X.; Xu, X. Seafloor In-Situ Heat Flow Measurements in the Deep-Water Area of the Northern Slope, South China Sea. Chin. J. Geophys. 2010, 53, 2161–2170. [Google Scholar]
- Li, G.; Moridis, G.J.; Zhang, K.; Li, X.-S. The use of huff and puff method in a single horizontal well in gas production from marine gas hydrate deposits in the Shenhu Area of South China Sea. J. Pet. Sci. Eng. 2011, 77, 49–68. [Google Scholar] [CrossRef] [Scilit]
- Yang, W.; Wang, T.; Wang, J.; Xie, W.; Liu, B.; Ning, B.; Kuang, Z.; Mohammadian, E.; Xu, C. Gas Hydrate Accumulation Mechanism of the Clayey Silt Reservoir in the Shenhu Area, South China Sea. Energy Fuels 2024, 38, 16258–16271. [Google Scholar] [CrossRef] [Scilit]
- Guo, B.; Zhang, H. Mathematical Modeling of the Dynamic Temperature Profile in Geothermal-Energy-Heated Natural Gas Hydrate Reservoirs. Sustainability 2022, 14, 2767. [Google Scholar] [CrossRef] [Scilit]
- Fu, C.; Guo, B.; Shan, L.; Lee, J. Mathematical modeling of heat transfer in y-shaped well couples for developing gas hydrate reservoirs using geothermal energy. J. Nat. Gas Sci. Eng. 2021, 96, 104325. [Google Scholar] [CrossRef] [Scilit]
- Zhang, Y.; Du, H.; Wang, H.; Li, G. Dual-well cyclic CO2 injection assisted gas hydrate depressurization production. Nat. Gas Ind. 2024, 44, 199–213. [Google Scholar] [CrossRef]
- Wu, C.; Xin, X.; Xu, T.; Li, Y.; Yuan, Y.; Zhu, H. Numerical Simulation of Natural Gas Hydrates Production o, doi: N the Alaska North Slope under Depressurization Combined with Thermal Stimulation. Energy Fuels 2024, 38, 23519–23534. [Google Scholar] [CrossRef] [Scilit]
- Feng, Y.; Chen, L.; Suzuki, A.; Kogawa, T.; Okajima, J.; Komiya, A.; Maruyama, S. Enhancement of gas production from methane hydrate reservoirs by the combination of hydraulic fracturing and depressurization method. Energy Convers. Manag. 2019, 184, 194–204. [Google Scholar] [CrossRef] [Scilit]
- Lund, J.W.; Boyd, T.L. Direct utilization of geothermal energy 2015 worldwide review. Geothermics 2016, 60, 66–93. [Google Scholar] [CrossRef] [Scilit]

Disclaimer/Publisher’s Note: The statements, opinions and data contained in all publications are solely those of the individual author(s) and contributor(s) and not of MDPI and/or the editor(s). MDPI and/or the editor(s) disclaim responsibility for any injury to people or property resulting from any ideas, methods, instructions or products referred to in the content. |
© 2026 by the authors. Licensee MDPI, Basel, Switzerland. This article is an open access article distributed under the terms and conditions of the Creative Commons Attribution (CC BY) license.