


Abstract
Goaf gas drainage and residual-coal spontaneous-combustion prevention are often designed independently, even though both are controlled by the same leakage-flow, oxygen-transport and heat-release fields in a longwall goaf. This decoupled design may reduce methane accumulation while unintentionally enlarging the oxidation zone. Taking the No. 1217 fully mechanized working face of Zhongxing Coal Mine, Shanxi Province, China, as an engineering prototype, this study develops an integrated laboratory-field numerical framework to quantify the drainage-induced evolution of the three zones of spontaneous combustion. Programmed temperature-rise experiments on the No. 2 coal seam were used to determine the oxygen-consumption rate, heat-release intensity and apparent activation energy under oxygen concentrations of 3–21%, yielding a critical oxygen concentration of 5.9%. Bundle-tube monitoring and distributed optical-fiber temperature sensing delineated the in situ three-zone boundaries, and a three-dimensional CFD model coupling porous-media seepage, species transport and Arrhenius-type heat generation was validated against the field data, with most relative errors below 5%. Parametric simulations for buried-pipe depths of 20, 30 and 50 m and negative pressures of 15 and 20 kPa reveal a pronounced asymmetric response: drainage compresses and advances the return-side oxidation zone toward the working face, but drives the inlet-side oxidation zone deeper into the goaf by enhancing oxygen-bearing leakage. Within the investigated parameter space, a buried depth of 30 m and a negative pressure of 20 kPa provide the best compromise, reducing the return-side oxidation-zone width from 32 to 21 m and the upper-corner methane concentration from 6.80% to 0.58%. The results demonstrate that drainage design should be constrained simultaneously by methane dilution and oxidation-zone control, and provide a quantitative basis for coordinating gas extraction with fire prevention in gas-rich, oxidation-prone longwall panels.
1. Introduction
Residual-coal spontaneous combustion in goafs remains one of the most persistent thermal hazards in underground coal mining. The difficulty of extinguishing coal-fire hazards in the field demonstrates the practical significance of effective fire prevention and control [1], while low-temperature oxidation studies show that the tendency toward self-heating is strongly linked to coal structure and reaction kinetics [2]. Recent reviews further indicate that spontaneous combustion remains difficult to predict because coal oxidation, heat transfer and gas migration evolve concurrently in the goaf [3]. At the microscale, the oxidation activity of functional groups governs the intrinsic reactivity of coal [4], whereas air leakage controls whether oxygen can be continuously supplied to the reactive residual coal [5].
Self-heating requires three concurrent conditions: reactive residual coal, a sustained oxygen supply and a thermal environment in which oxidation heat cannot be dissipated rapidly enough [6,7]. These conditions, through their spatial variation, define the conventional heat-dissipation, oxidation and asphyxiation zones. Among them, the oxidation zone is the decisive hazard zone because it combines sufficient oxygen with a residence time long enough for low-temperature oxidation to develop. Accurate identification of this zone is therefore a prerequisite for estimating the shortest spontaneous-combustion period under low-temperature oxidation conditions [8] and for evaluating oxygen-concentration effects in goaf environments [9]. Reliable prediction indices are also required to translate laboratory oxidation behavior into field warning criteria [10]. Crucially, the same leakage-flow field that supplies oxygen to the oxidation zone also governs methane migration and accumulation in the goaf, so spontaneous combustion and gas transport cannot be treated as independent processes [11]. Because methane–air mixture transport in the goaf is strongly affected by fractured medium flow, coupled flow models are essential for linking fire-prevention analysis with gas-control design [12].
Gas drainage is indispensable for gassy and outburst-prone seams, and previous work has shown that drainage parameters can directly modify the distribution of the three zones of spontaneous combustion [13]. In parallel, nitrogen-based suppression and liquid-nitrogen cooling have been investigated as fire-control measures for complex goaf or large-area fire scenarios [14,15]. These studies are important, but drainage introduces an additional coupling because the suction field simultaneously affects methane removal, oxygen consumption and leakage redistribution [16]. Laboratory evidence further confirms that oxygen supply controls low-temperature oxidation intensity [17], and buried-pipe drainage can alter the three-zone structure by changing the goaf seepage field [18]. This risk is amplified by the dynamic advance and progressive compaction of the goaf, which continuously changes the leakage pathway and heat-source distribution [19].
The literature has also established several material-level foundations for the present study. Mineral components such as FeS2 can significantly affect spontaneous-combustion characteristics [20], while goaf gas-distribution prediction models provide a basis for evaluating methane migration under mining conditions [21]. Foam-supported suppression has improved direct fire-control practice [22], and heat-release-based methods have strengthened estimates of the shortest spontaneous-combustion period [23]. Early-warning studies based on ethylene enrichment and auto-ignition temperature provide complementary criteria for identifying hazardous heating stages [24,25]. Thermal-analysis research has refined apparent-activation-energy evaluation [26], and index-range studies have helped define usable low-temperature oxidation warning intervals [27]. Methane explosion propagation experiments clarify the consequence of methane accumulation once ignition conditions are present [28], whereas water-soaked coal tests reveal how moisture history changes spontaneous-combustion risk [29]. Low-oxygen gas-analysis studies and comparisons between raw and oxidized coal further demonstrate that warning indices depend on oxygen availability and pre-oxidation state [30,31].
For drainage design, U-type goaf gas-extraction optimization provides a direct precedent for parameter selection [32,33], and oxygen-concentration experiments help constrain the oxidation boundary [34]. Numerical heating models of coal piles clarify heat accumulation in porous coal systems [35], while inhibitor/inert-gas simulations and multi-stage fire-control studies inform engineering prevention strategies [36,37]. Drainage-affected spontaneous-combustion-zone formation has recently been analyzed numerically [38], and studies of methane-interfered index gases and chemically altered coal emphasized that early-warning indices are sensitive to both gas composition and coal surface chemistry [39,40]. Despite these advances, three specific gaps limit the use of the surveyed literature as a design basis for drainage in oxidation-prone goafs. First, although drainage-induced changes in the three-zone structure have been widely acknowledged, the predictions are typically inferred from CFD outputs alone and are seldom constrained by synchronous in situ O2 and temperature monitoring, leaving the predicted drainage benefit unverified at the panel scale. Second, buried depth and negative pressure are commonly treated as independent variables in parametric sweeps, even though they jointly determine the position and intensity of the suction field; their interaction—and the resulting non-additive effect on oxidation-zone width—has not been quantified, so single-parameter recommendations cannot be safely extrapolated. Third, optimization criteria have remained focused on upper-corner methane reduction, while oxidation-zone control is usually addressed by a separate fire-prevention workflow; consequently the two objectives can pull the drainage design in opposite directions without a formal trade-off being made explicit. The present study addresses these three gaps in a single workflow: laboratory kinetics constrain the source term, synchronous bundle-tube and optical-fiber measurements anchor the field three-zone structure, validated CFD resolves the depth–pressure interaction, and a dual-objective criterion makes the methane/oxidation trade-off operational rather than implicit.
Accordingly, this study establishes an experimental-field numerical workflow for the No. 1217 working face in the Zhongxing Coal Mine. The specific objectives are to (i) determine the critical oxygen concentration and temperature-dependent oxidation parameters of the No. 2 coal; (ii) identify the field three-zone boundaries using both oxygen concentration and temperature-gradient criteria; (iii) validate a three-dimensional CFD model capable of reproducing the measured oxygen and temperature fields; and (iv) clarify how buried depth and negative pressure jointly regulate the oxidation-zone morphology and upper-corner methane concentration. The central focus of this work is a dual-objective drainage criterion that links gas-control performance to fire-prevention safety, rather than a site-specific parameter recommendation.
2. Engineering Background and Methodology
2.1. Overview of the No. 1217 Working Face
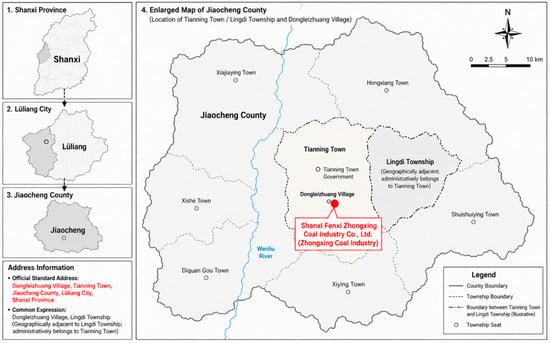
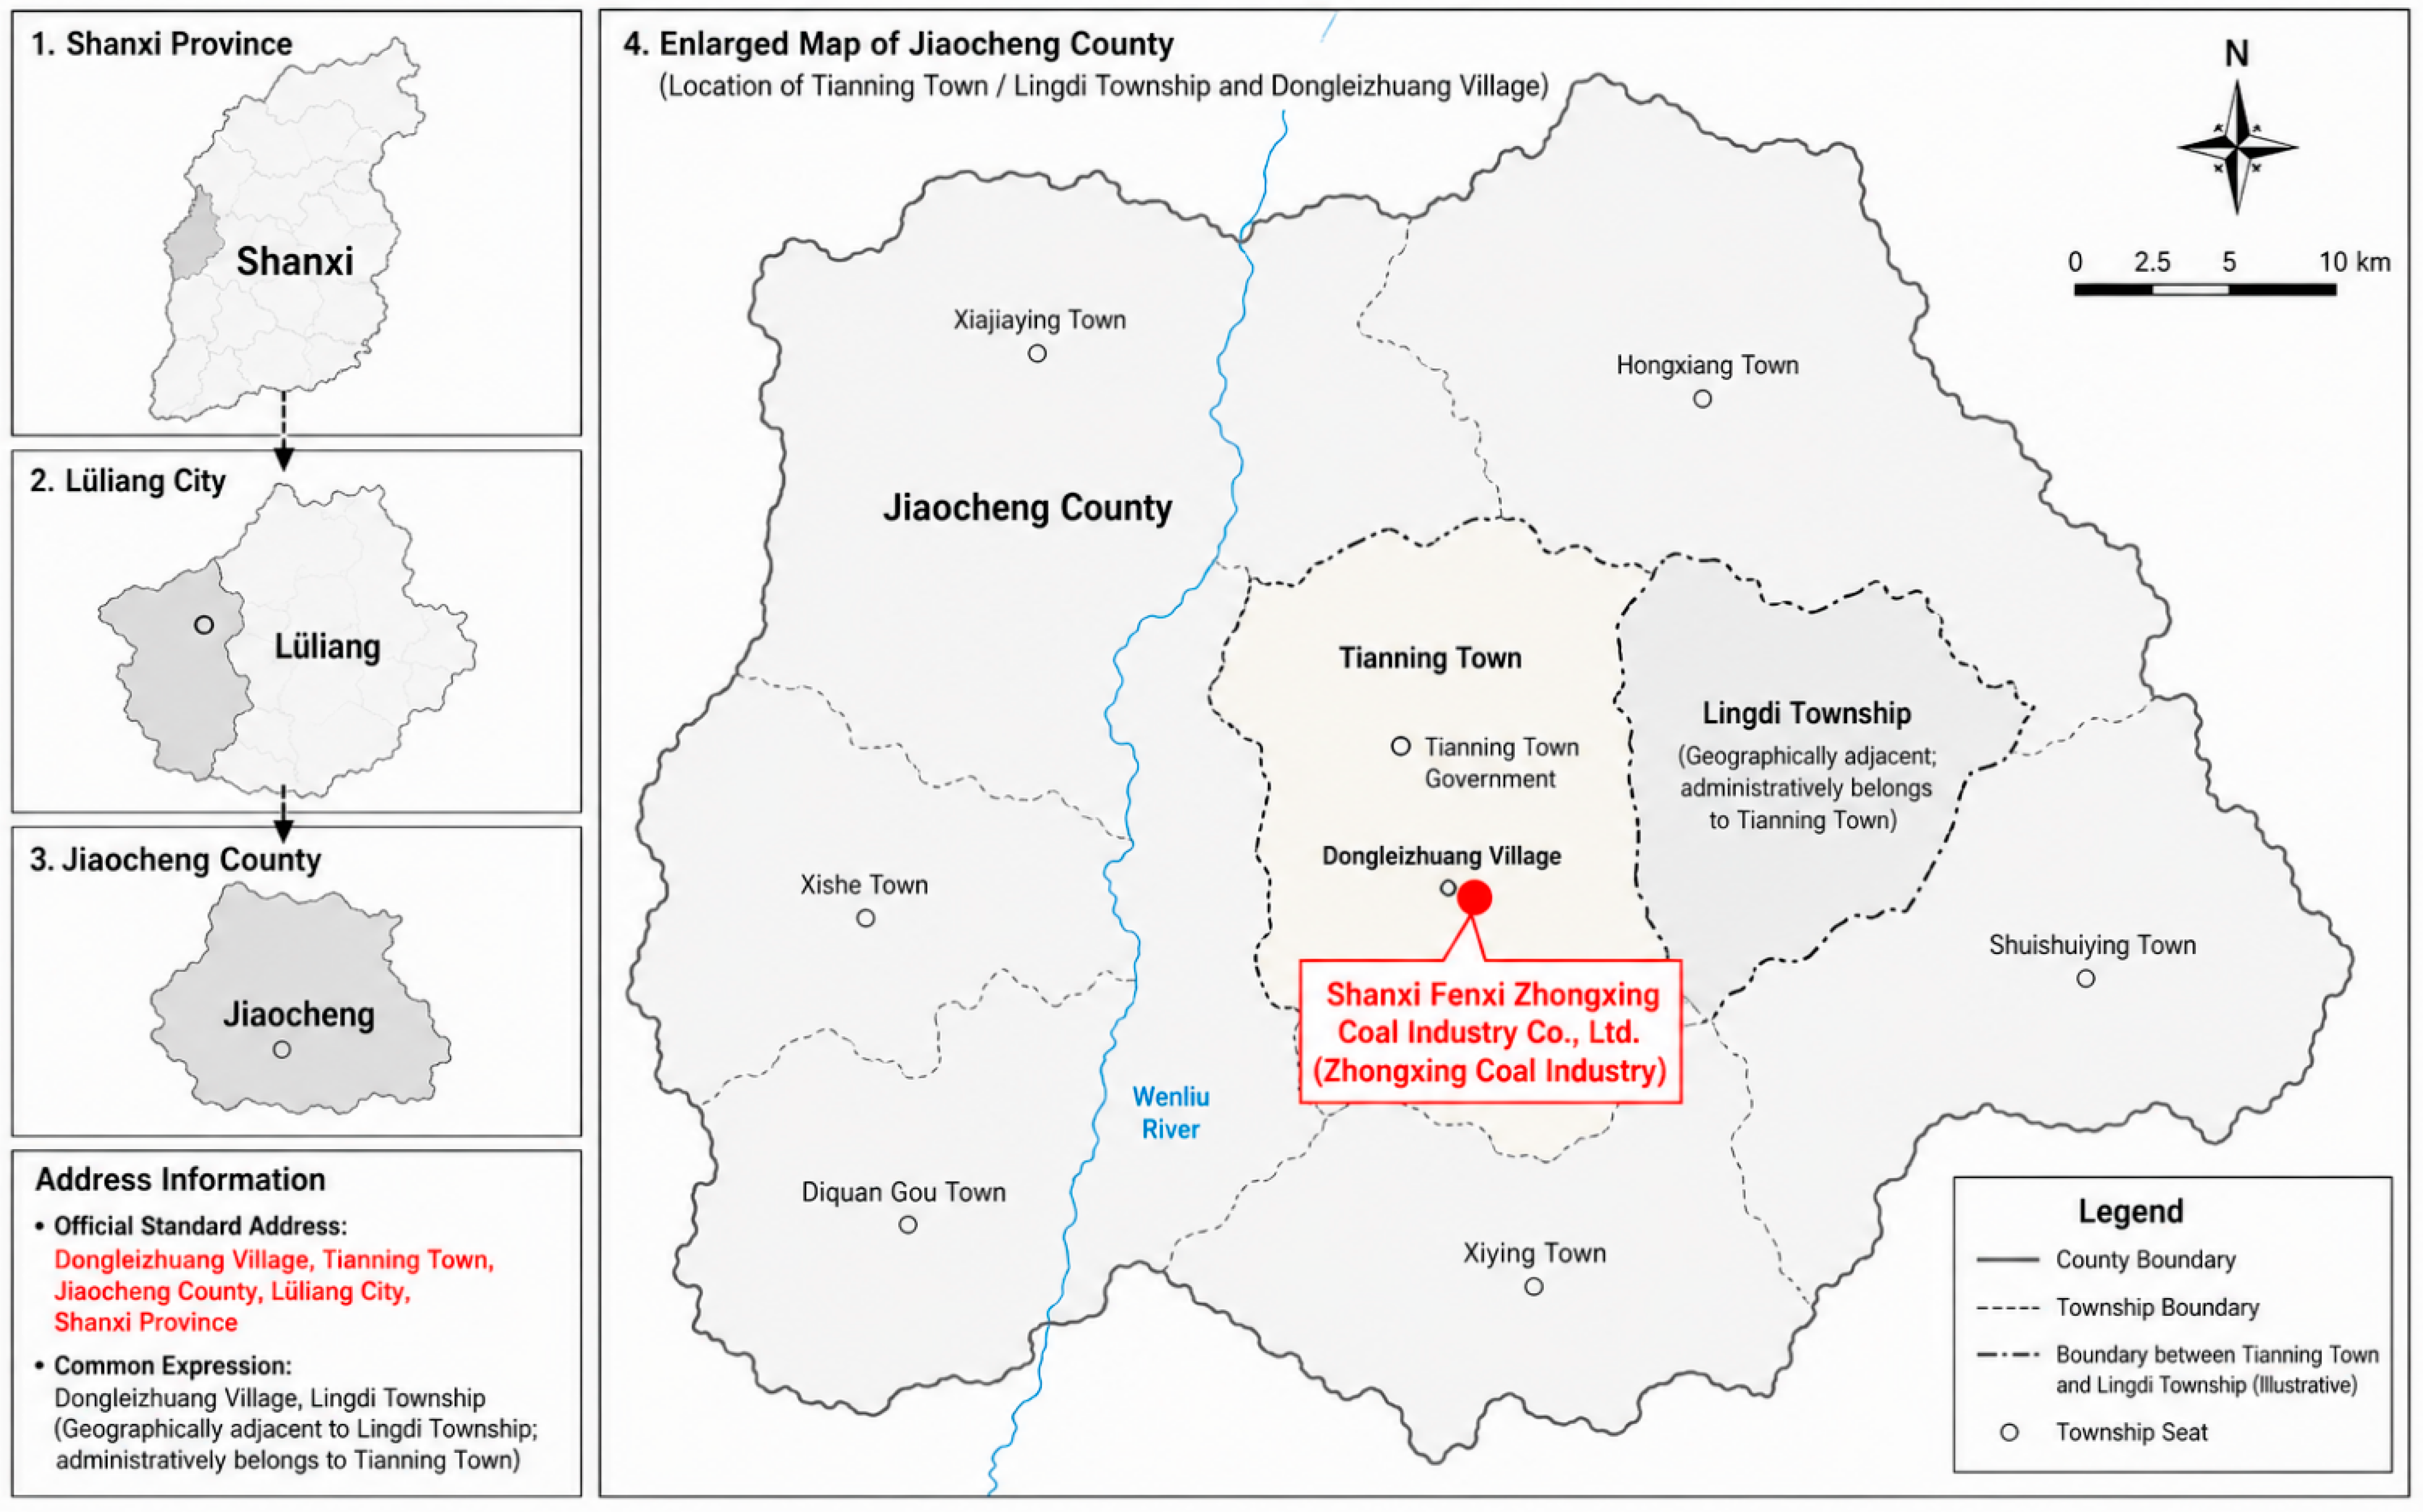
The No. 1217 fully mechanized working face is located in the northern wing of the first mining district of Zhongxing Coal Mine and extracts the No. 2 coal seam in the lower Permian Shanxi Formation, with the mine location and study-area context illustrated in Figure 1. The seam has an effective thickness of 2.0–2.9 m, with an average of 2.4 m, and a gentle dip of approximately 2–10 degrees. The working face is 1873 m long along strike and 150 m wide along dip, and the goaf depth considered in the model is 200 m, sufficient to cover the heat-dissipation, oxidation and asphyxiation zones. The panel is a retreating longwall, advancing from the opening cut toward the stop line under U-type ventilation. As the face retreats, fixed bundle-tube probes installed near the face are progressively left behind in the goaf, so the spatial profile reported in Section 4 corresponds to the steady three-zone structure that develops behind a continuously retreating face rather than to a moving boundary at a single instant. The low Protodyakonov coefficient of 0.8 indicates a relatively broken coal structure, which favors heterogeneous leakage flow after caving.
Figure 1.
Location of Zhongxing Coal Mine.
The proximate analysis indicates a moisture content of 0.71%, ash content of 17.15%, volatile matter of 18.36%, fixed carbon of approximately 66% and sulfur content of 0.75%. Although the coal is formally classified as Grade III in terms of spontaneous-ignition propensity, the mine is gas-rich: the absolute methane emission of the mine reached 68.31 m3 min−1 in 2022, and the projected emission of the No. 1217 face is approximately 10.17 m3 min−1. The combination of moderate oxidation propensity and high methane emission makes this panel a representative case for studying the compatibility between gas drainage and spontaneous-combustion prevention.
2.2. Methodological Framework
The research framework consists of three mutually constrained modules. The laboratory module provides the kinetic parameters and critical oxygen threshold required to describe coal oxidation. The field-monitoring module supplies the in situ oxygen and temperature profiles needed to identify the actual three-zone boundaries. The numerical module, calibrated against these measurements, resolves the pressure, oxygen, methane and temperature fields under alternative drainage configurations. This structure ensures that the parametric simulations are grounded in both material-scale oxidation behaviour and field-scale transport evidence.
3. Experimental Characterization of the Spontaneous Combustion Behavior
3.1. Apparatus and Procedure
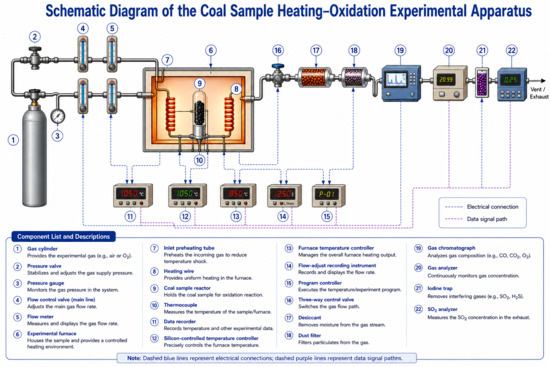
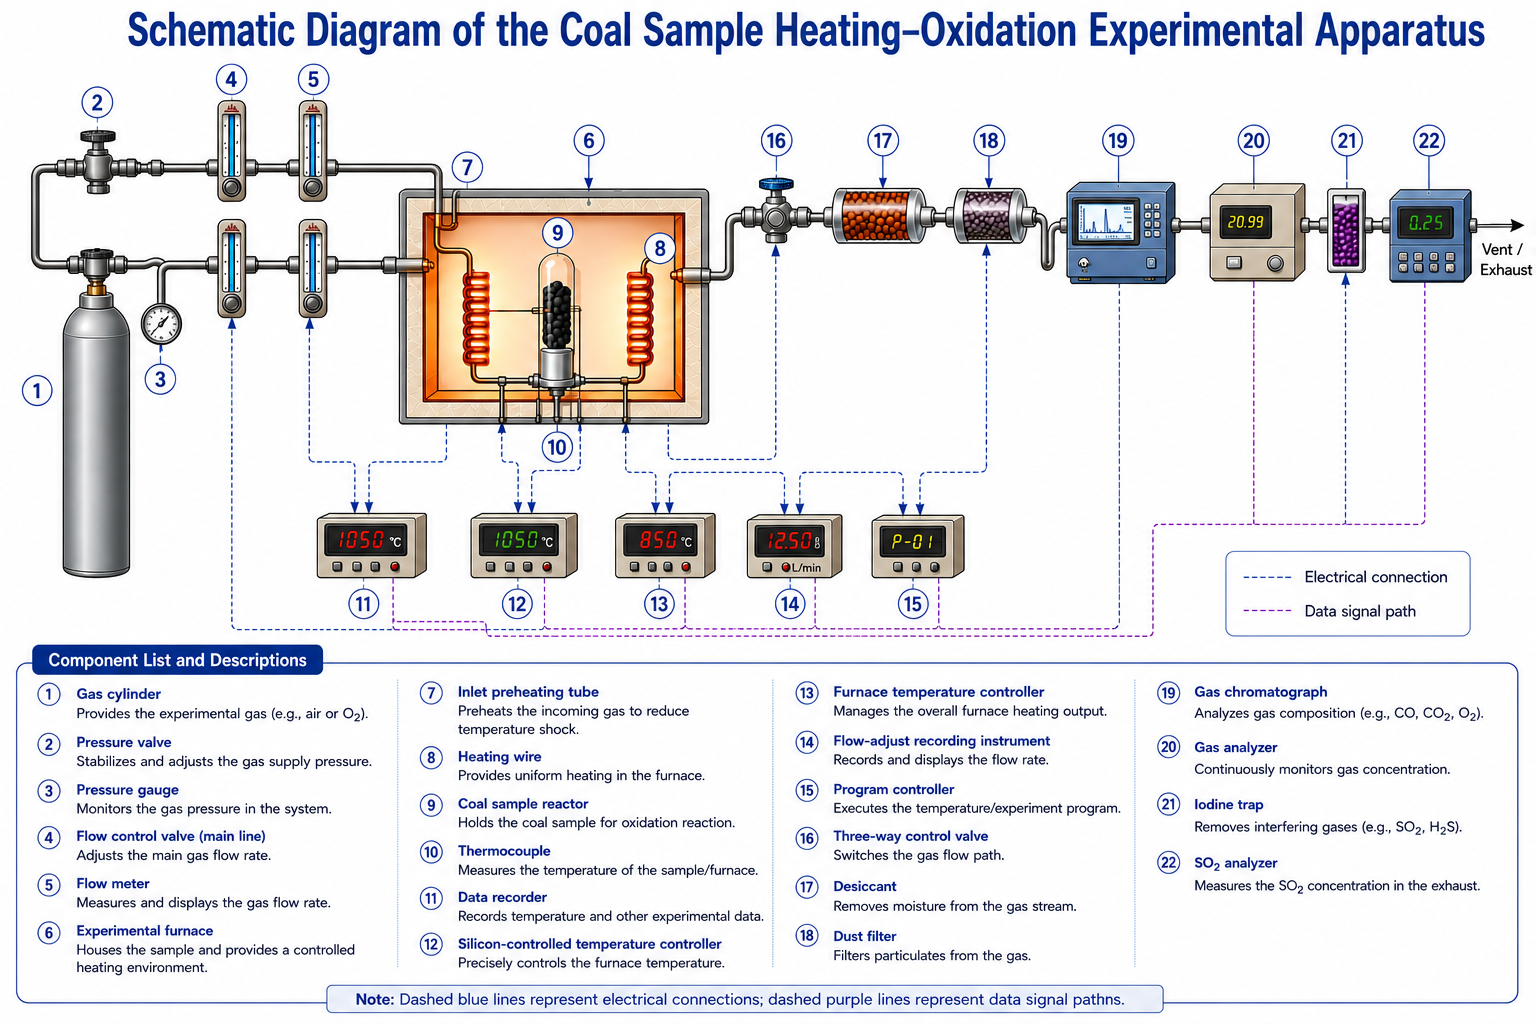
Programmed temperature-rise experiments (Figure 2) were conducted on crushed coal samples (particle size 0.18–0.25 mm) under six inlet oxygen concentrations—3%, 5%, 7%, 10%, 12% and 21%—covering the range from oxygen-deficient goaf conditions to those in atmospheric air. The gas flow was held at 100 mL min−1 and the sample was heated from 30 to 300 °C at 0.3 °C min−1, a slow rate chosen to resolve the low-temperature oxidation stages. Outlet gases were sampled at 10 °C intervals and analyzed by gas chromatography (SP-3420A, Beijing Bei fen-Ruili, Beijing, China; ±0.5% relative accuracy for O2, CO and CO2), and each condition was tested in triplicate.
Figure 2.
Schematic of the programmed temperature-rise apparatus.
3.2. Indicator-Gas Evolution
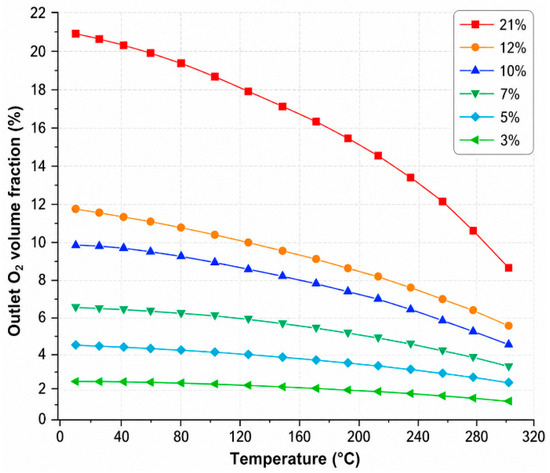
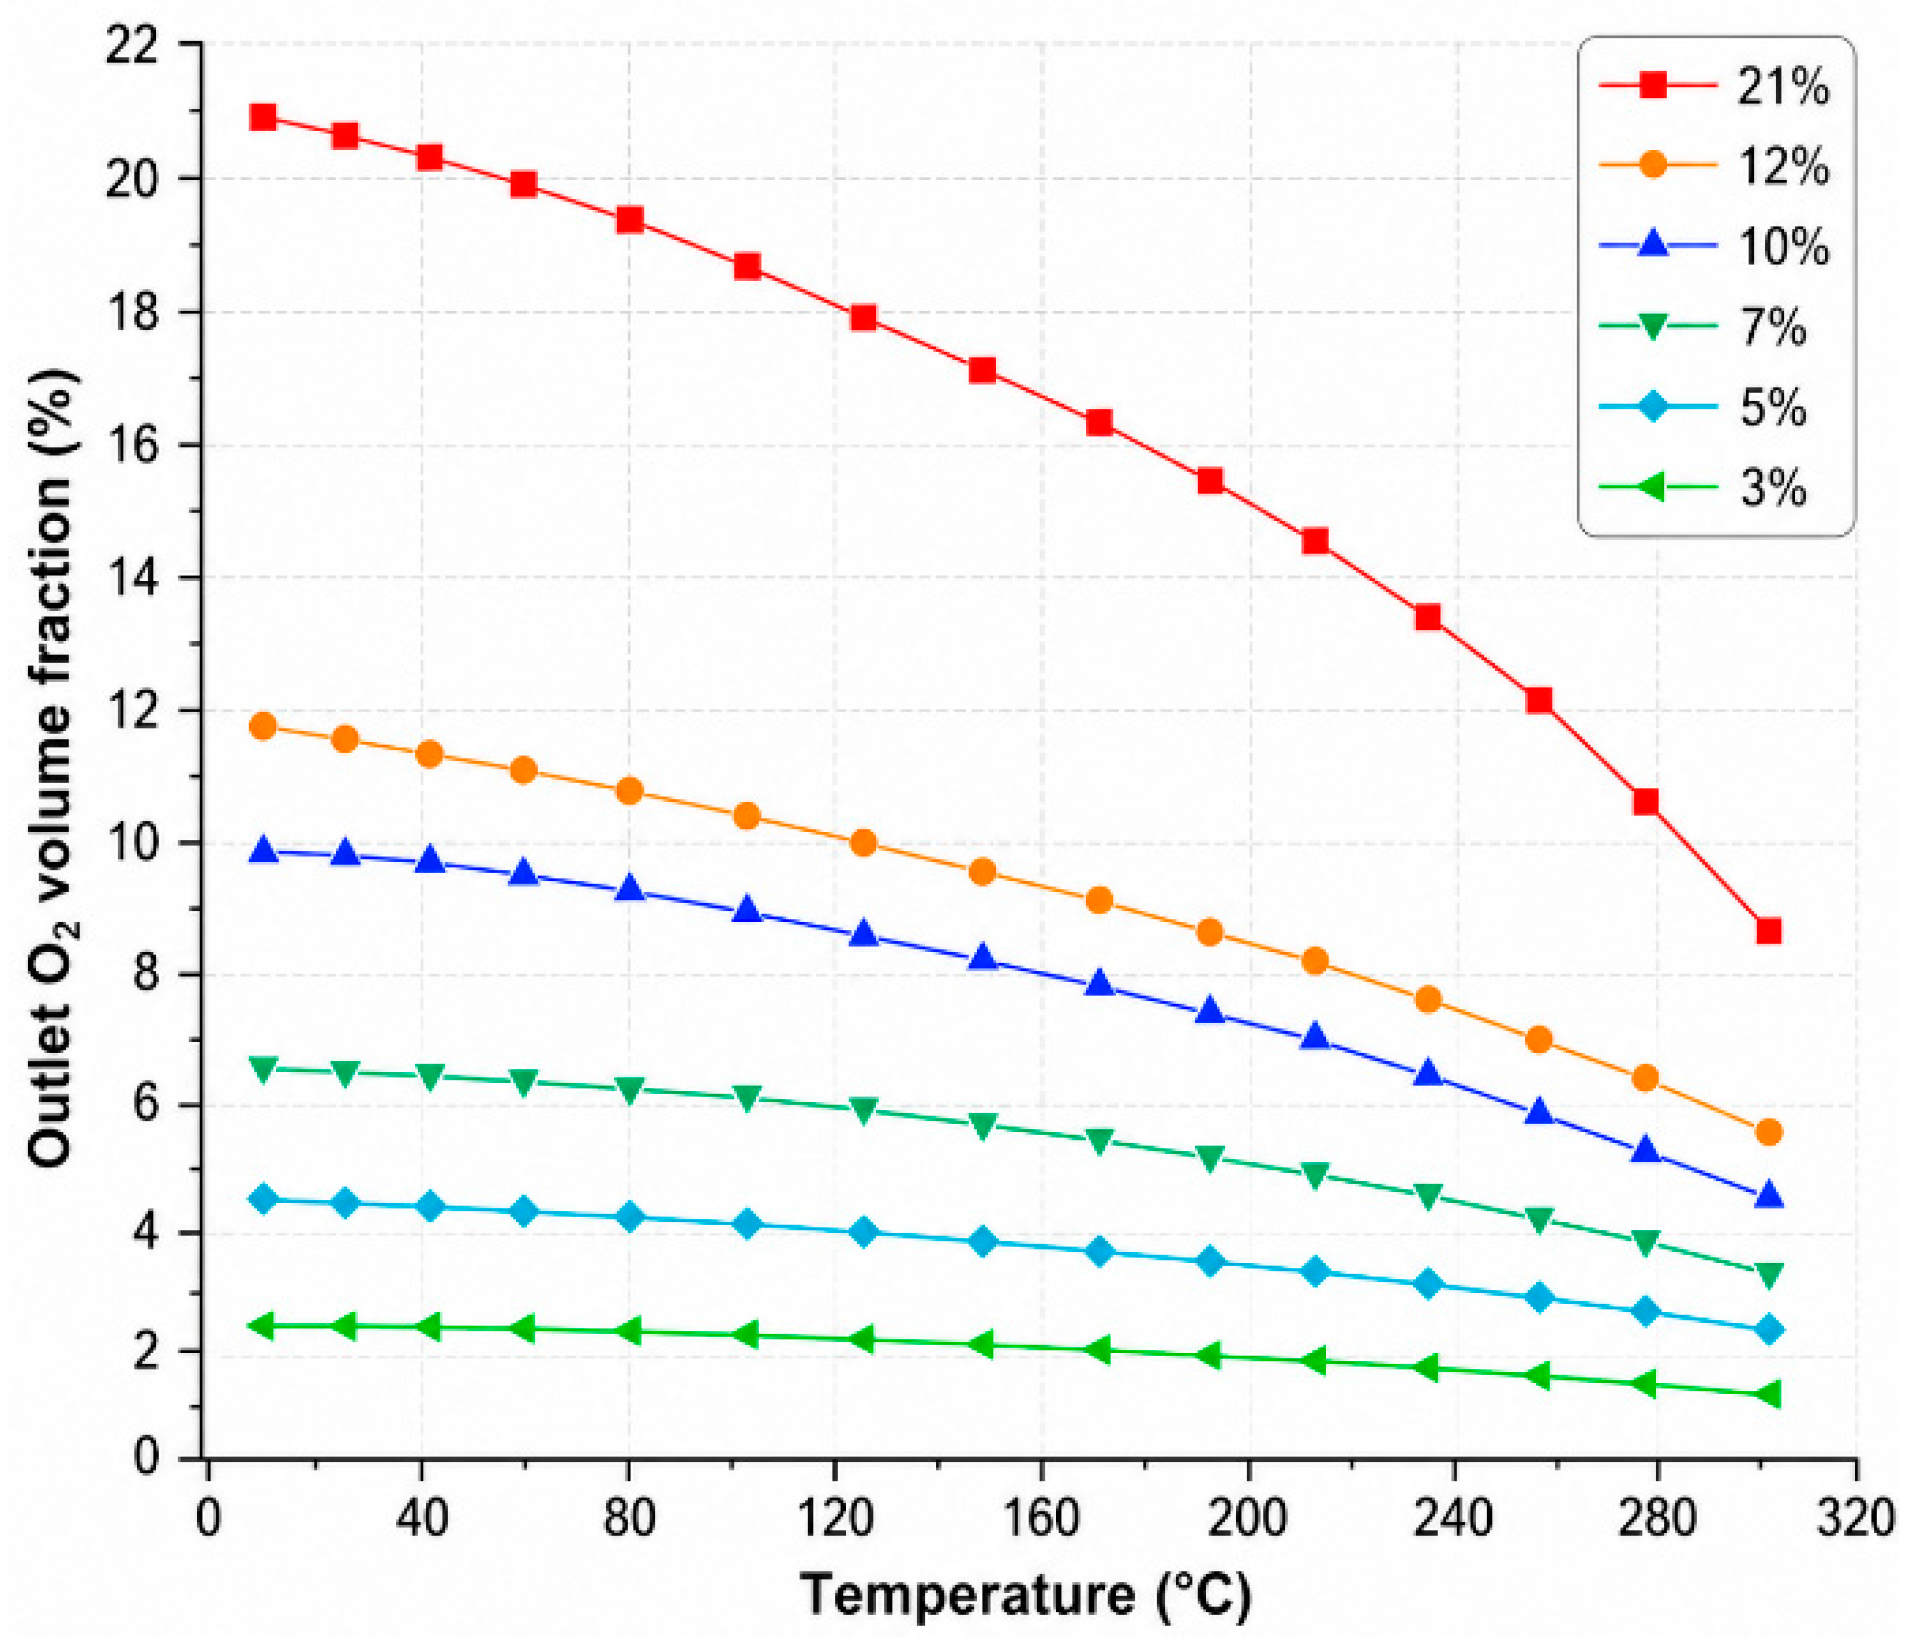
The outlet O2 profiles in Figure 3 indicate limited oxygen consumption below approximately 80 °C, followed by a rapid increase at higher temperatures. This transition marks the shift from adsorption-dominated oxygen uptake to chemically controlled oxidation. The increasing sensitivity of oxygen consumption to inlet oxygen concentration at an elevated temperature supports the use of an Arrhenius-type source term in the numerical model.
Figure 3.
Outlet O2 volume fraction as a function of temperature.
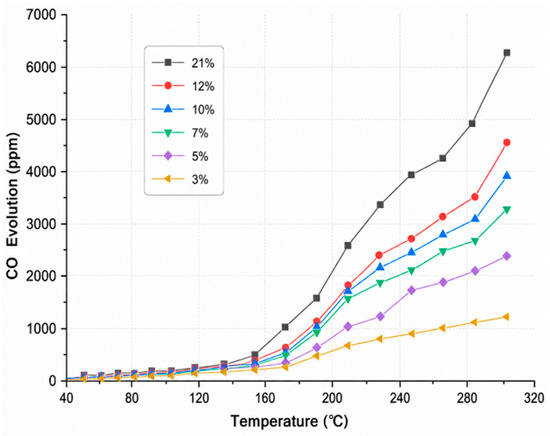
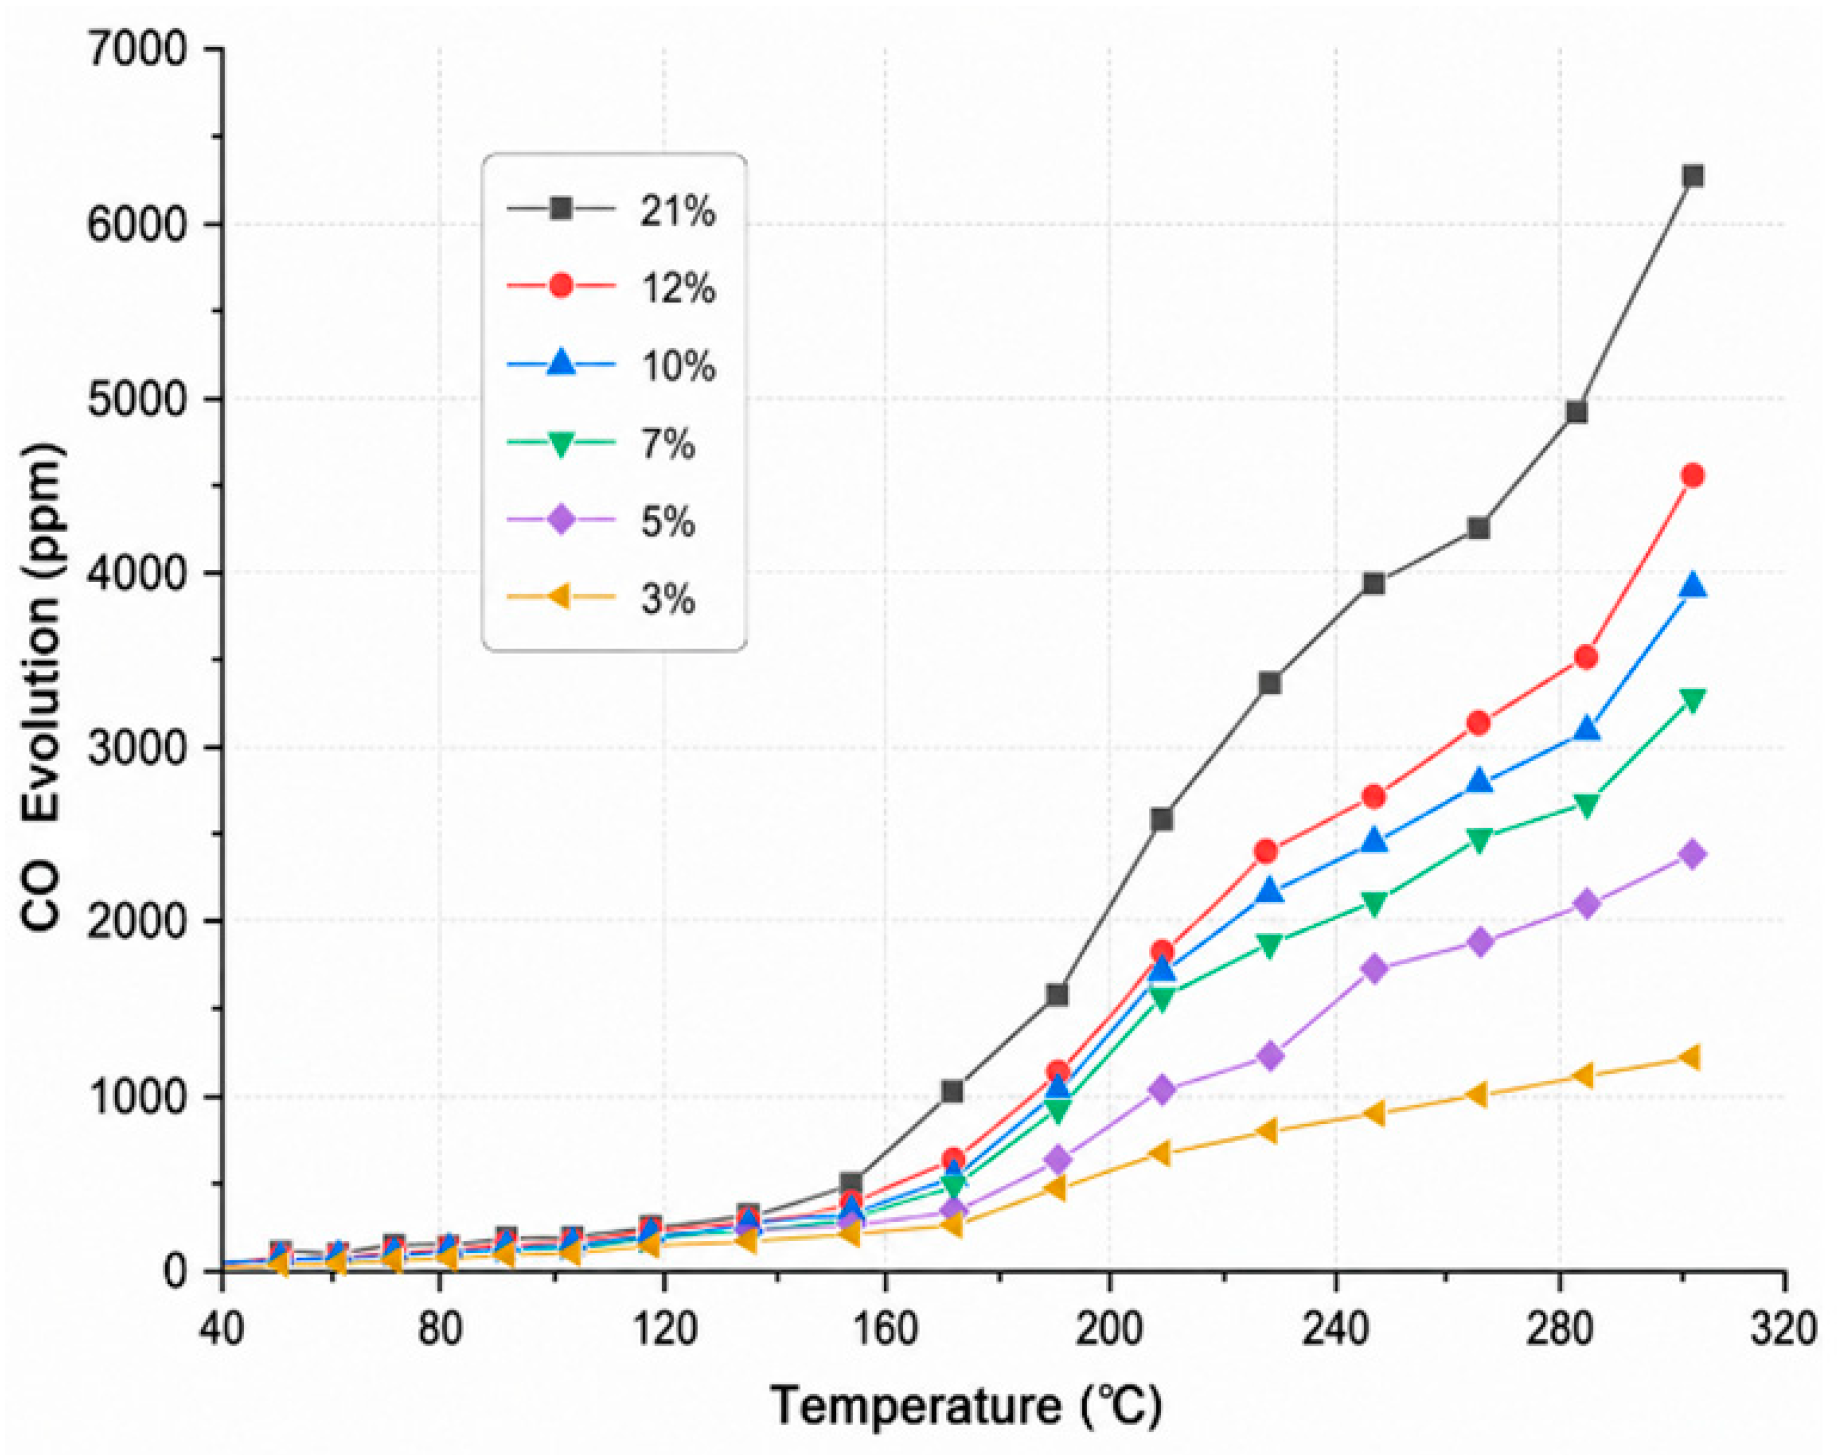
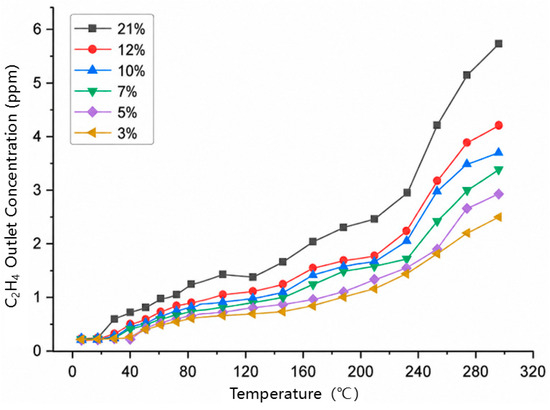
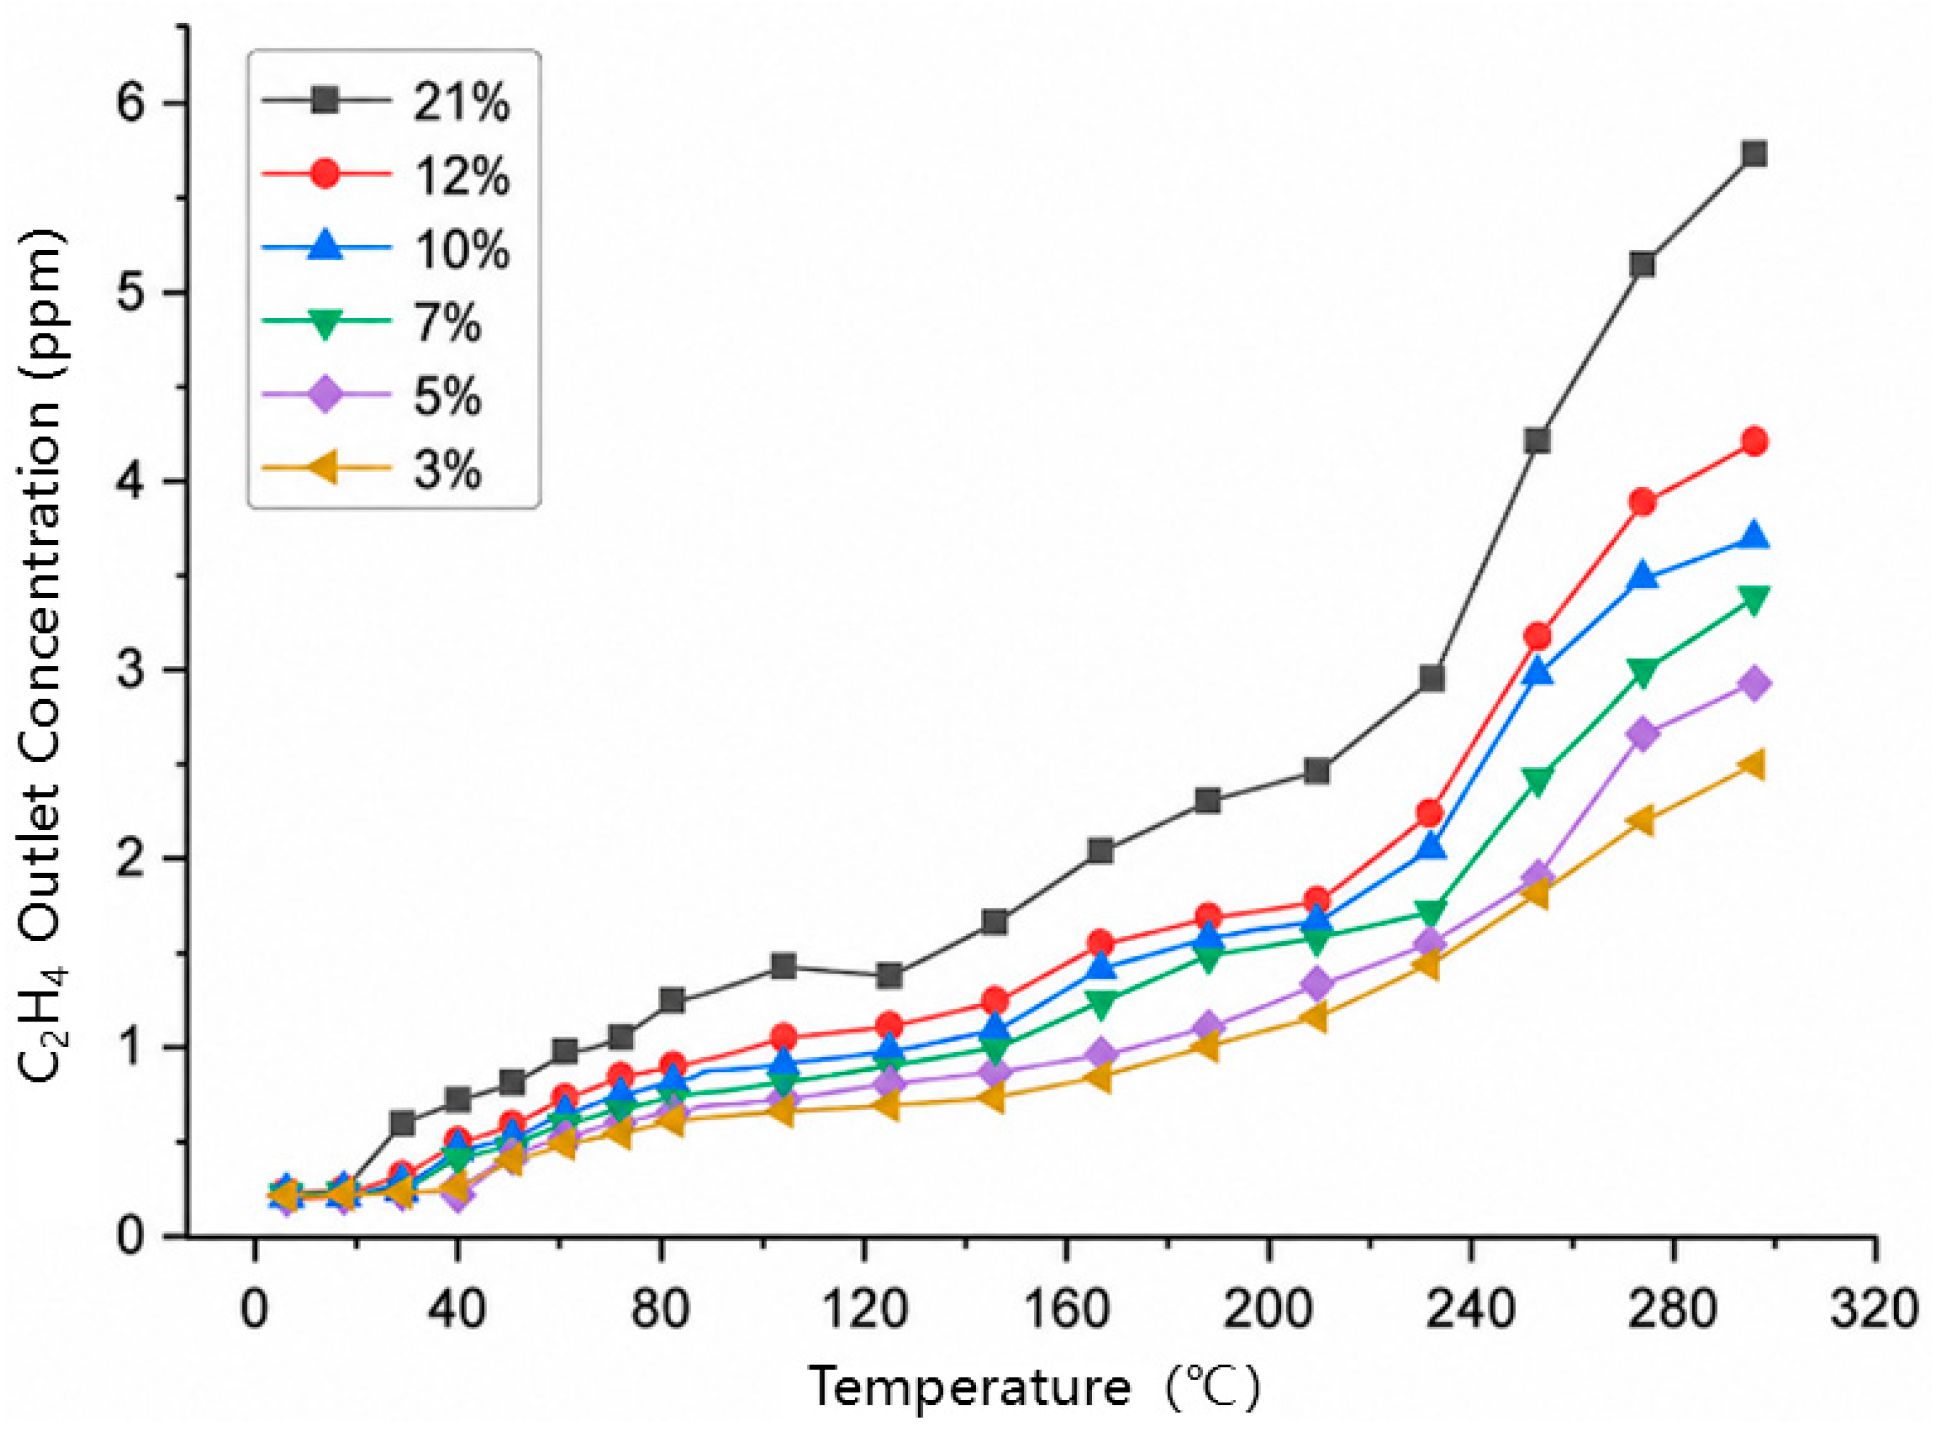
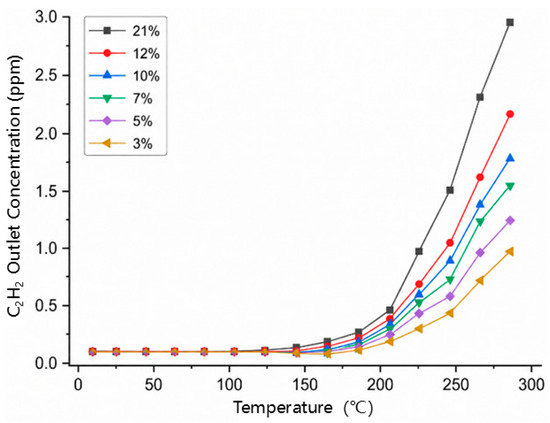
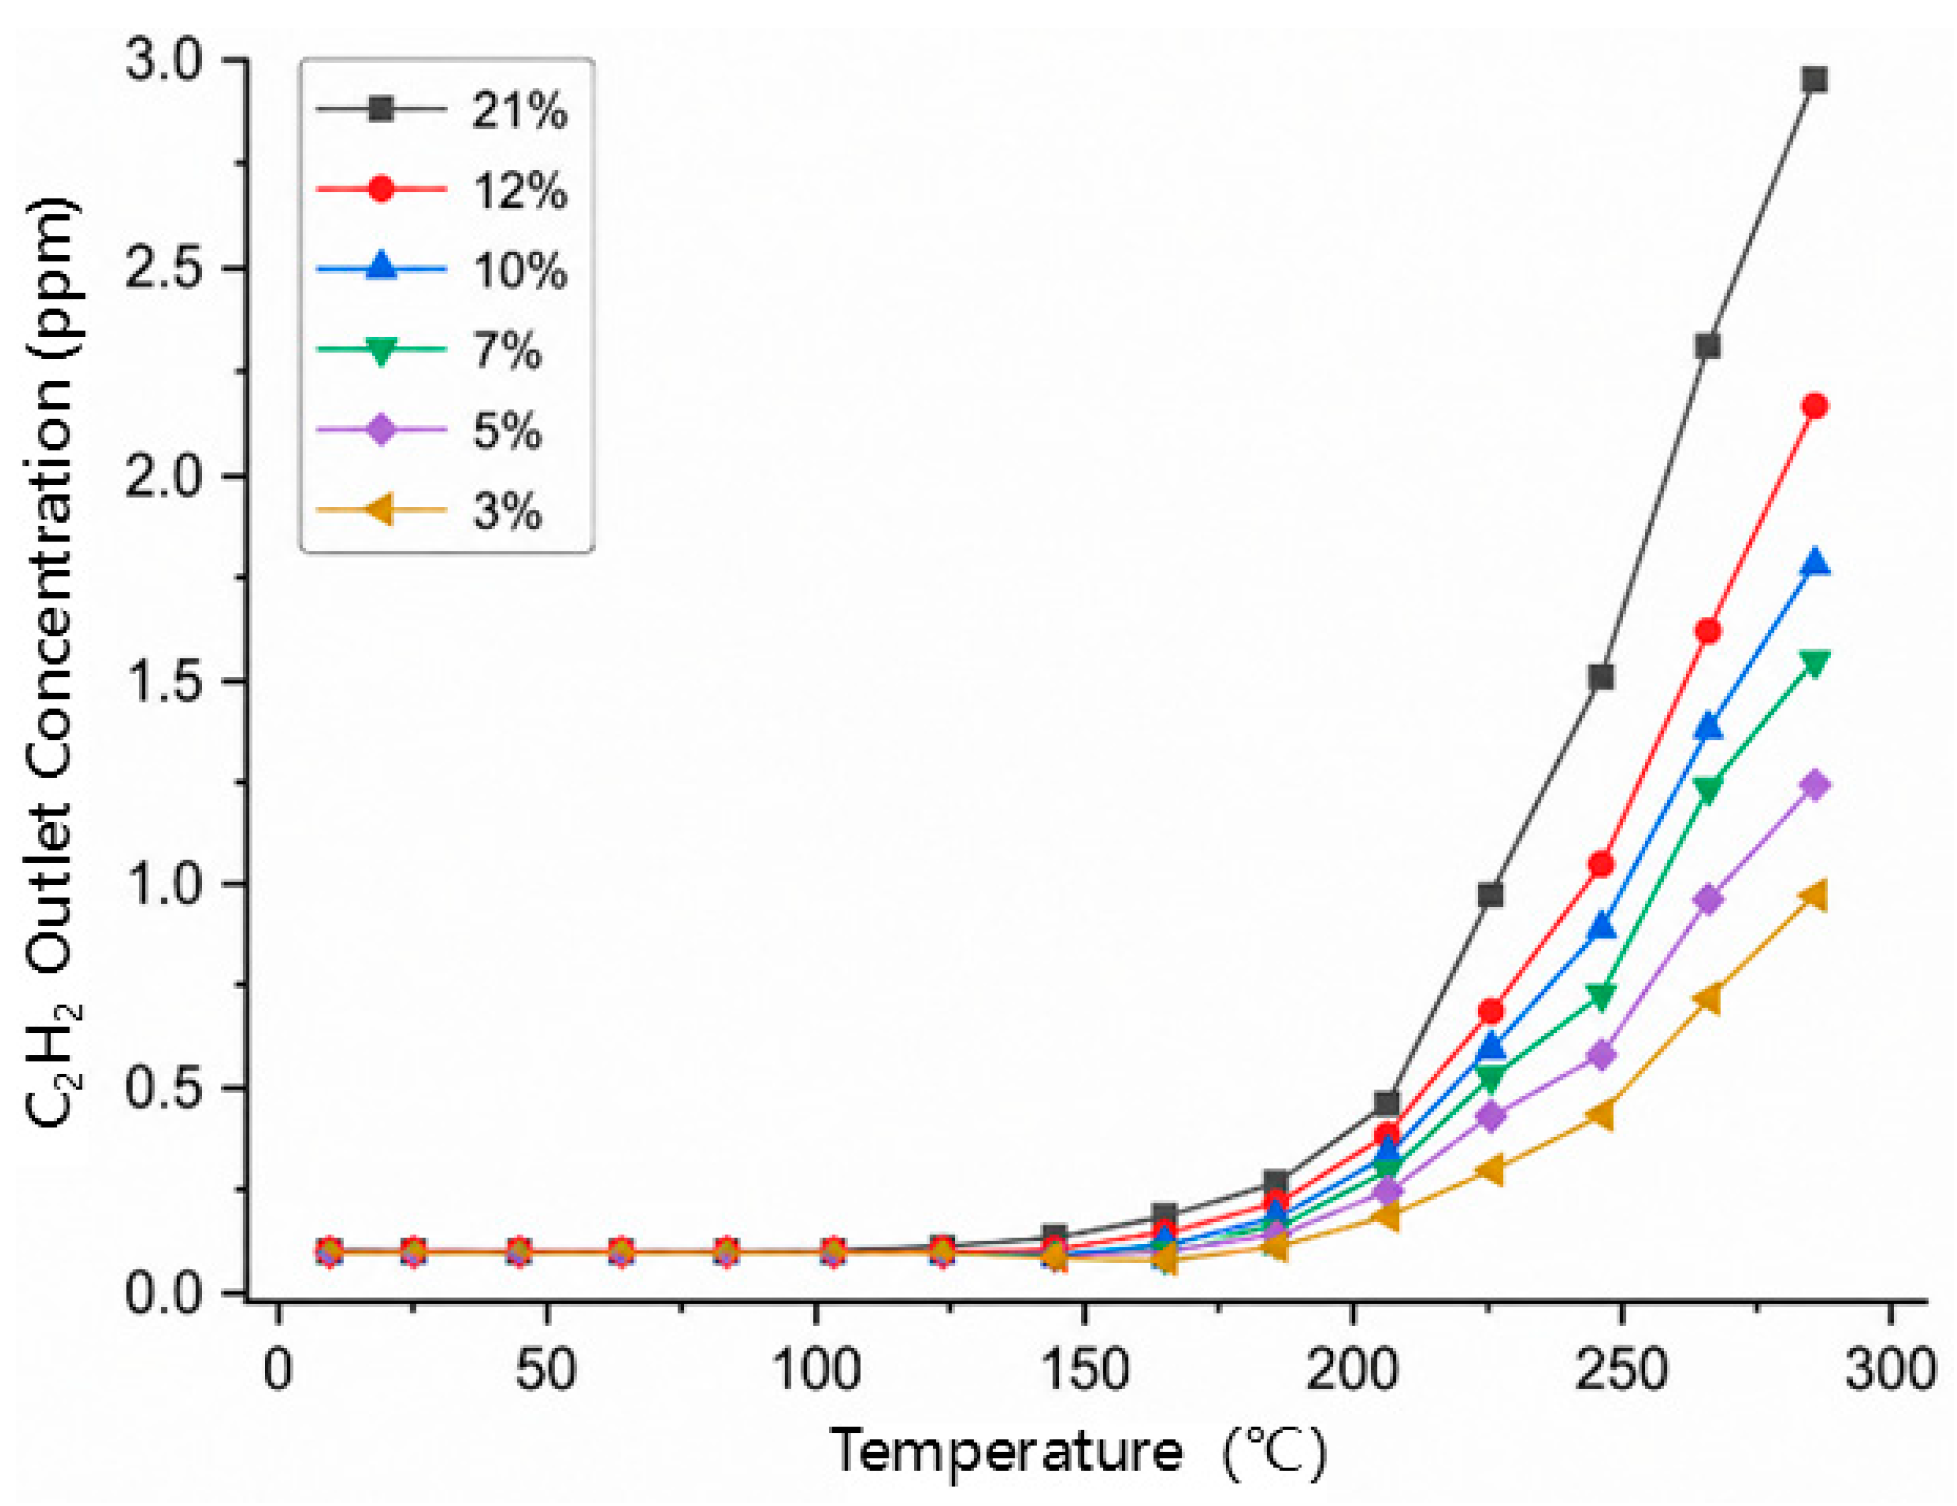
As shown in Figure 4, CO is detected at the earliest stage of heating and increases monotonically with temperature, supporting its use as the primary early-warning gas. Two acceleration intervals are evident, near 80 °C and 120 °C, corresponding, respectively, to the onset of sustained oxidation and the enhanced decomposition of oxygen-containing functional groups. By contrast, the C2H4 and C2H2 responses in Figure 5 and Figure 6 appear only after higher temperature thresholds, making them more appropriate as secondary and advanced indicators of self-heating development.
Figure 4.
Outlet CO volume fraction as a function of temperature.
Figure 5.
Outlet C2H4 volume fraction as a function of temperature.
Figure 6.
Outlet C2H2 volume fraction as a function of temperature.
3.3. Oxygen-Consumption Rate, Heat-Release Intensity and Apparent Activation Energy
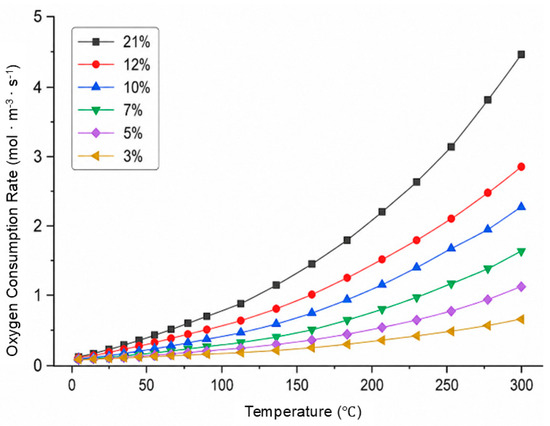
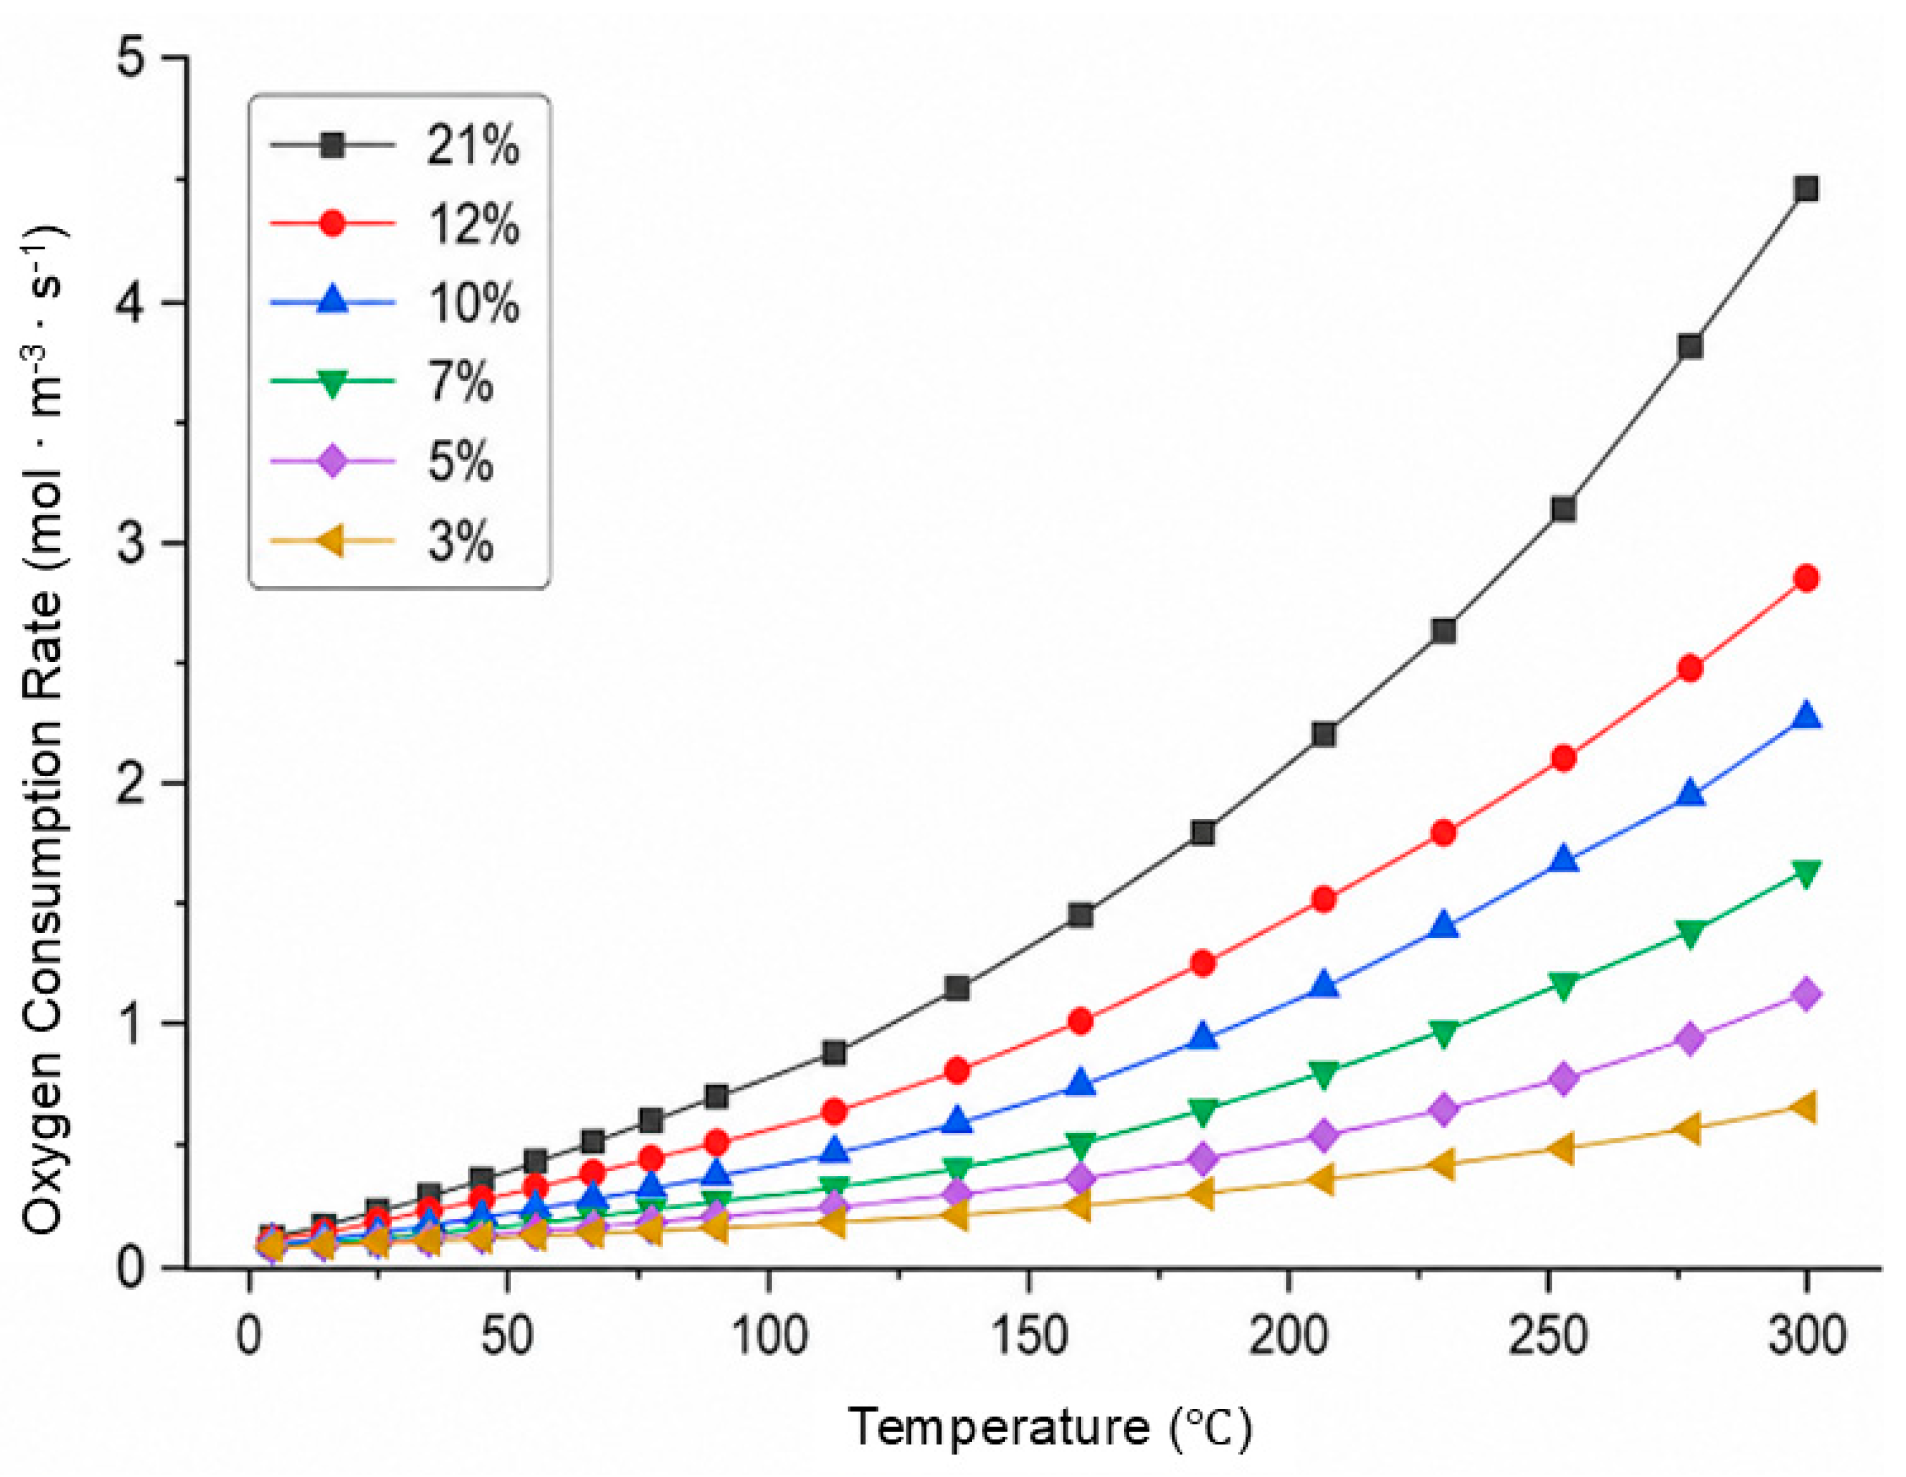
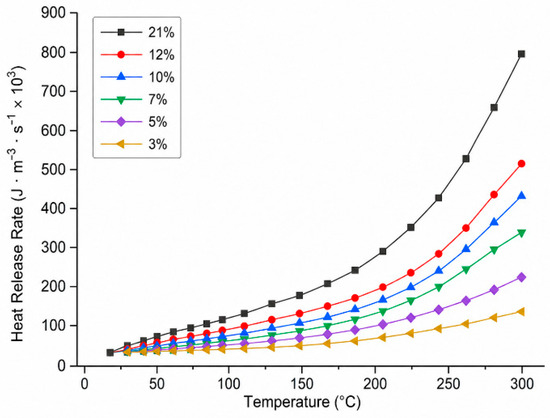
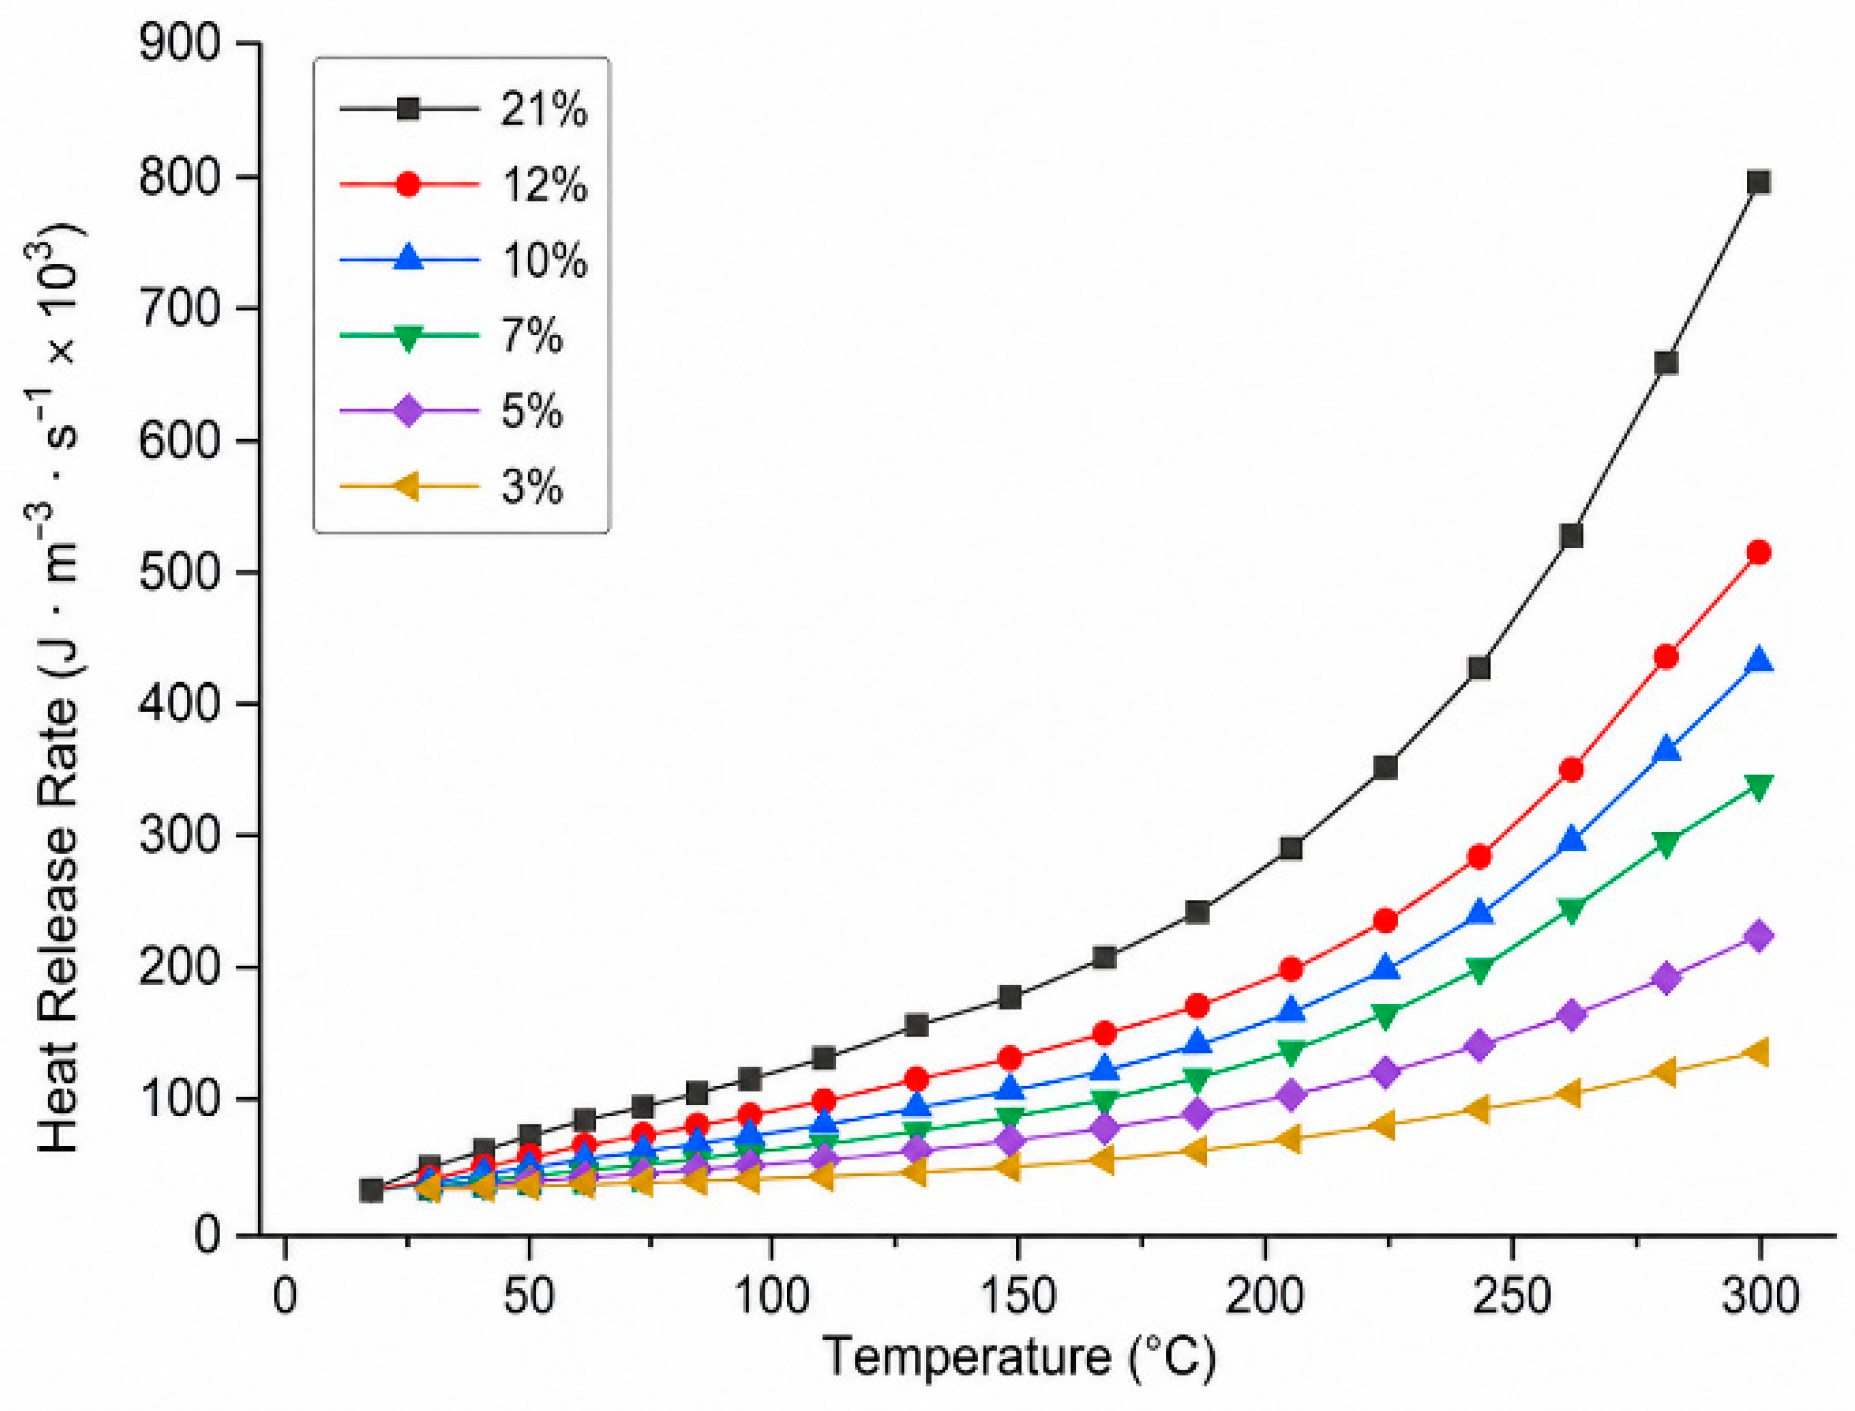
The volumetric oxygen-consumption rate calculated from the inlet–outlet oxygen concentration difference and the gas-flow balance is plotted in Figure 7. It increases with both temperature and inlet oxygen concentration, and the fitted exponential trends exhibit high coefficients of determination, indicating that oxygen availability is a first-order control on oxidation intensity. The heat-release intensity in Figure 8 follows the same trend, confirming that oxygen consumption provides a reliable proxy for the thermal source strength used in the CFD model.
Figure 7.
Oxygen-consumption rate as a function of temperature.
Figure 8.
Heat-release intensity as a function of temperature.
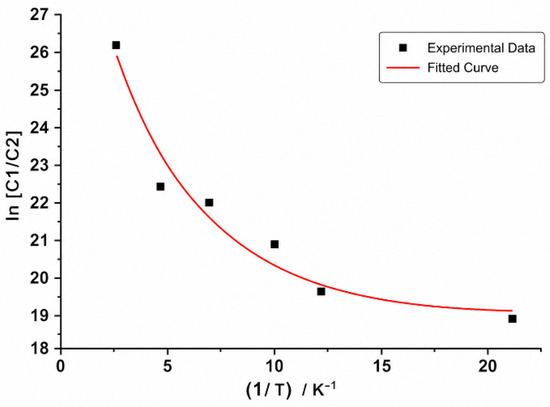
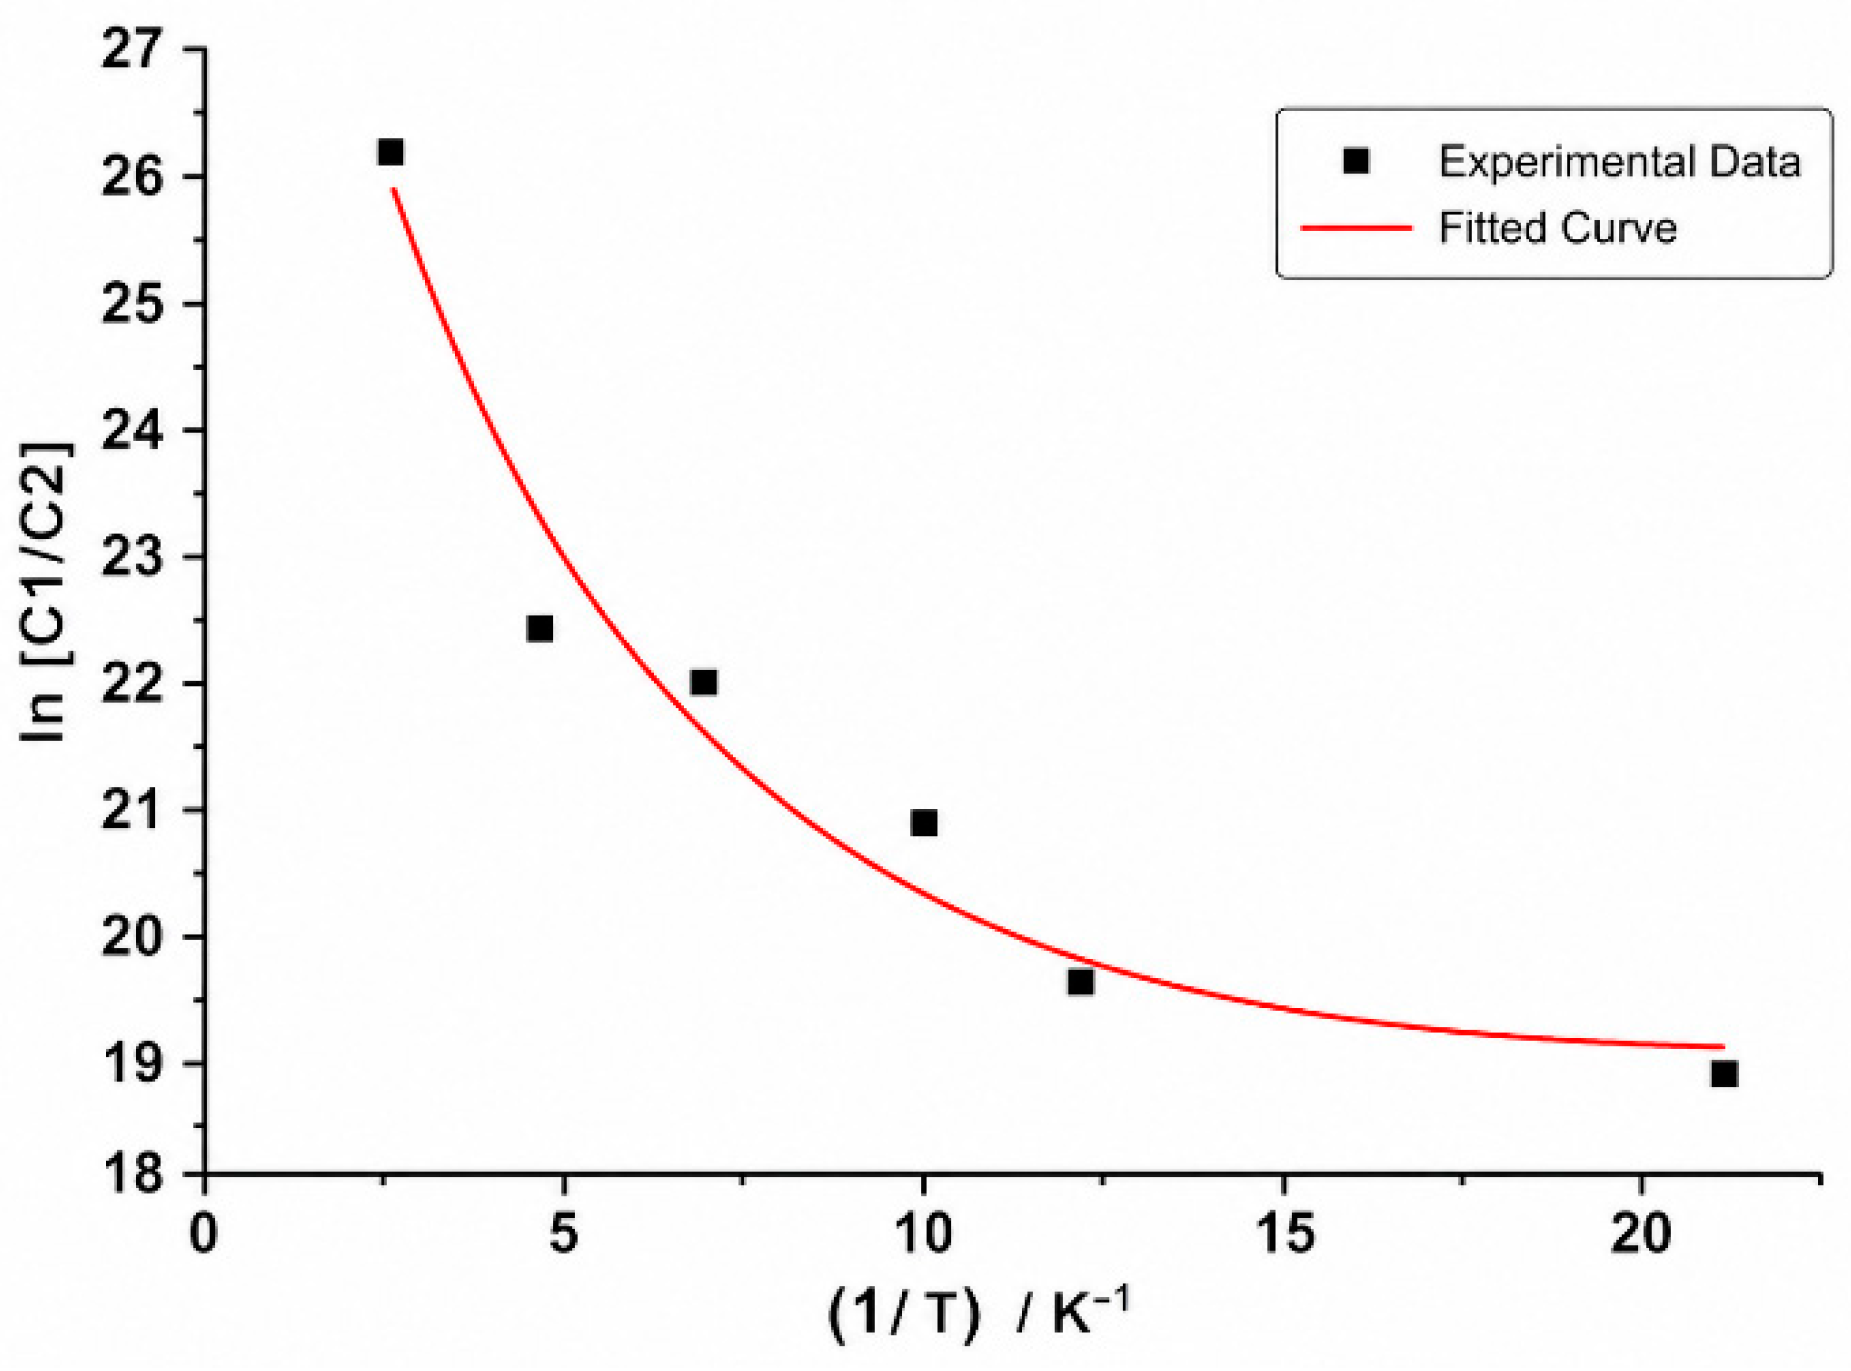
The apparent activation energy was obtained from the regression of ln[ln(C0/C)] against 1/T, where C0 and C are the inlet and outlet oxygen concentrations; the resulting oxygen-dependence is shown in Figure 9. The activation energy decreases from 65.4 kJ mol−1 at 3% O2 to 41.2 kJ mol−1 at 21% O2, demonstrating that oxygen-deficient conditions substantially suppress coal oxidation. Extrapolation of this relationship gives a critical oxygen concentration of 5.9%, below which oxidation is kinetically inhibited. This threshold is used as the lower boundary of the oxidation zone and as the cut-off for the oxidation source term in the numerical model.
Figure 9.
Apparent activation energy as a function of oxygen volume fraction.
4. Field Monitoring of the Three Zones of Spontaneous Combustion
4.1. Layout of the Bundle-Tube and Optical-Fiber System
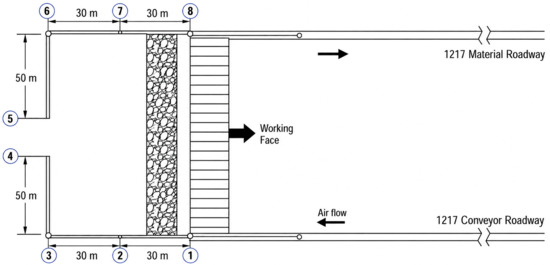
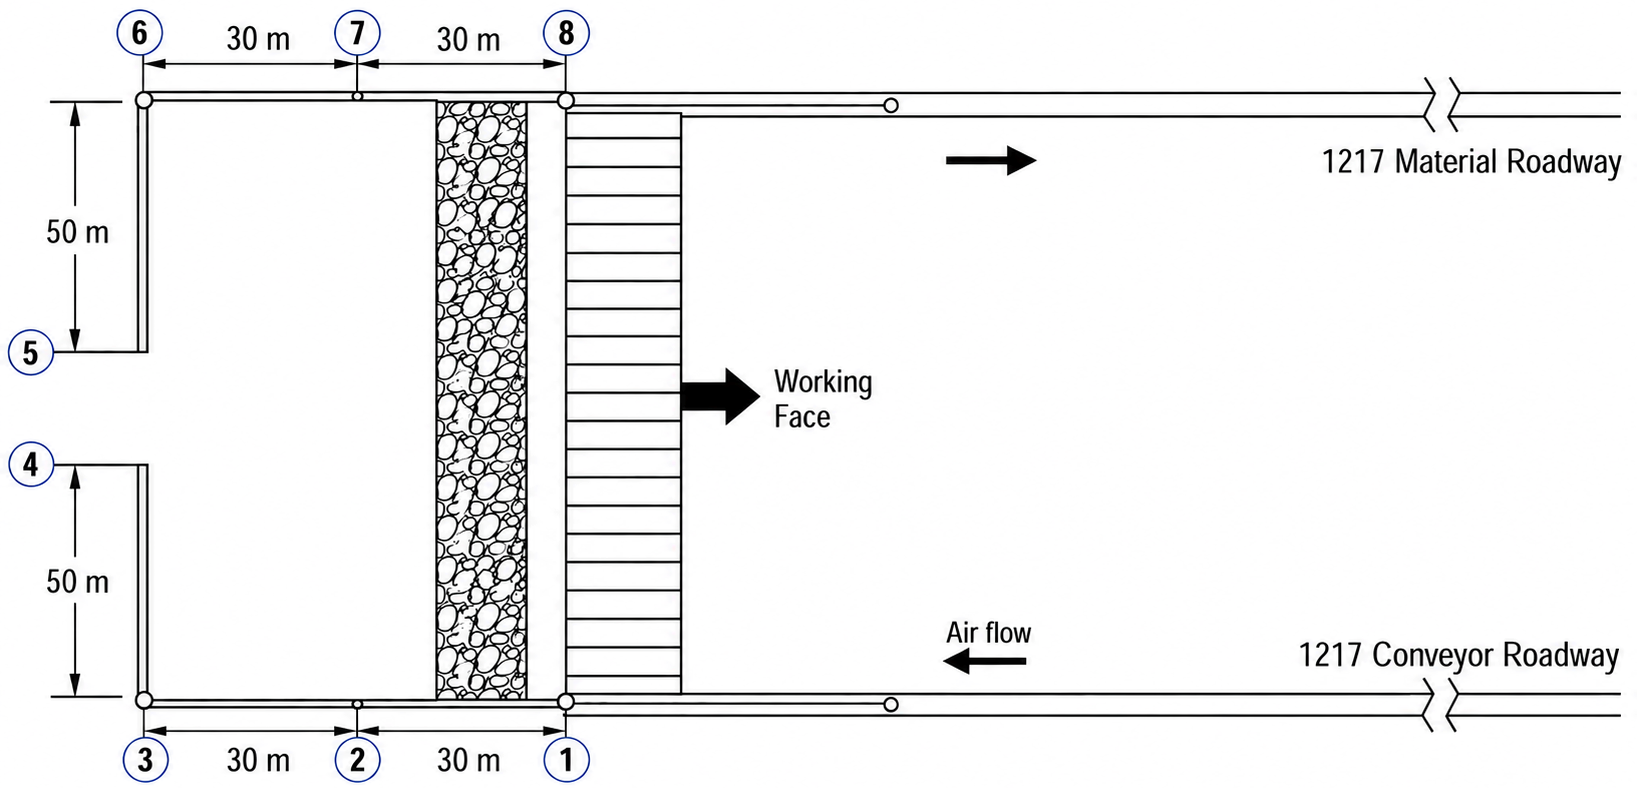
The bundle-tube monitoring layout is shown in Figure 10. Eight monitoring lines were installed across the working face, each equipped with protected bundle-tube probes for gas sampling. The probes were gradually buried as the face advanced, enabling oxygen concentration to be mapped as a function of distance behind the face. A distributed optical-fiber temperature sensor was arranged along the same path to obtain continuous temperature information. The synchronized gas and temperature datasets provide two independent criteria for identifying the three-zone boundaries.
Figure 10.
Layout of the bundle-tube monitoring system in the No. 1217 working face. Nos.1–8 denote seven measuring points. The main objective is to monitor the composition of gaseous products generated by coal oxidation and the variation law of temperature at these positions during different advancing stages of the working face.
4.2. Oxygen-Concentration Profile
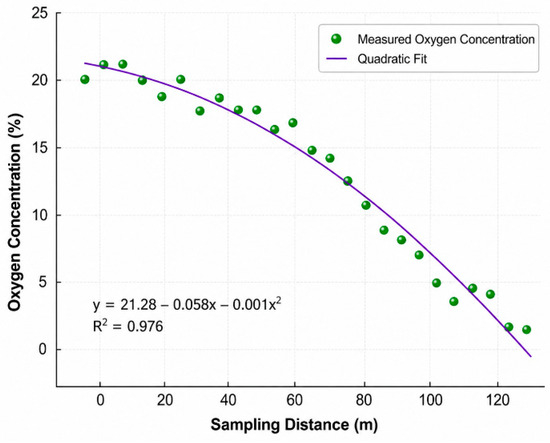
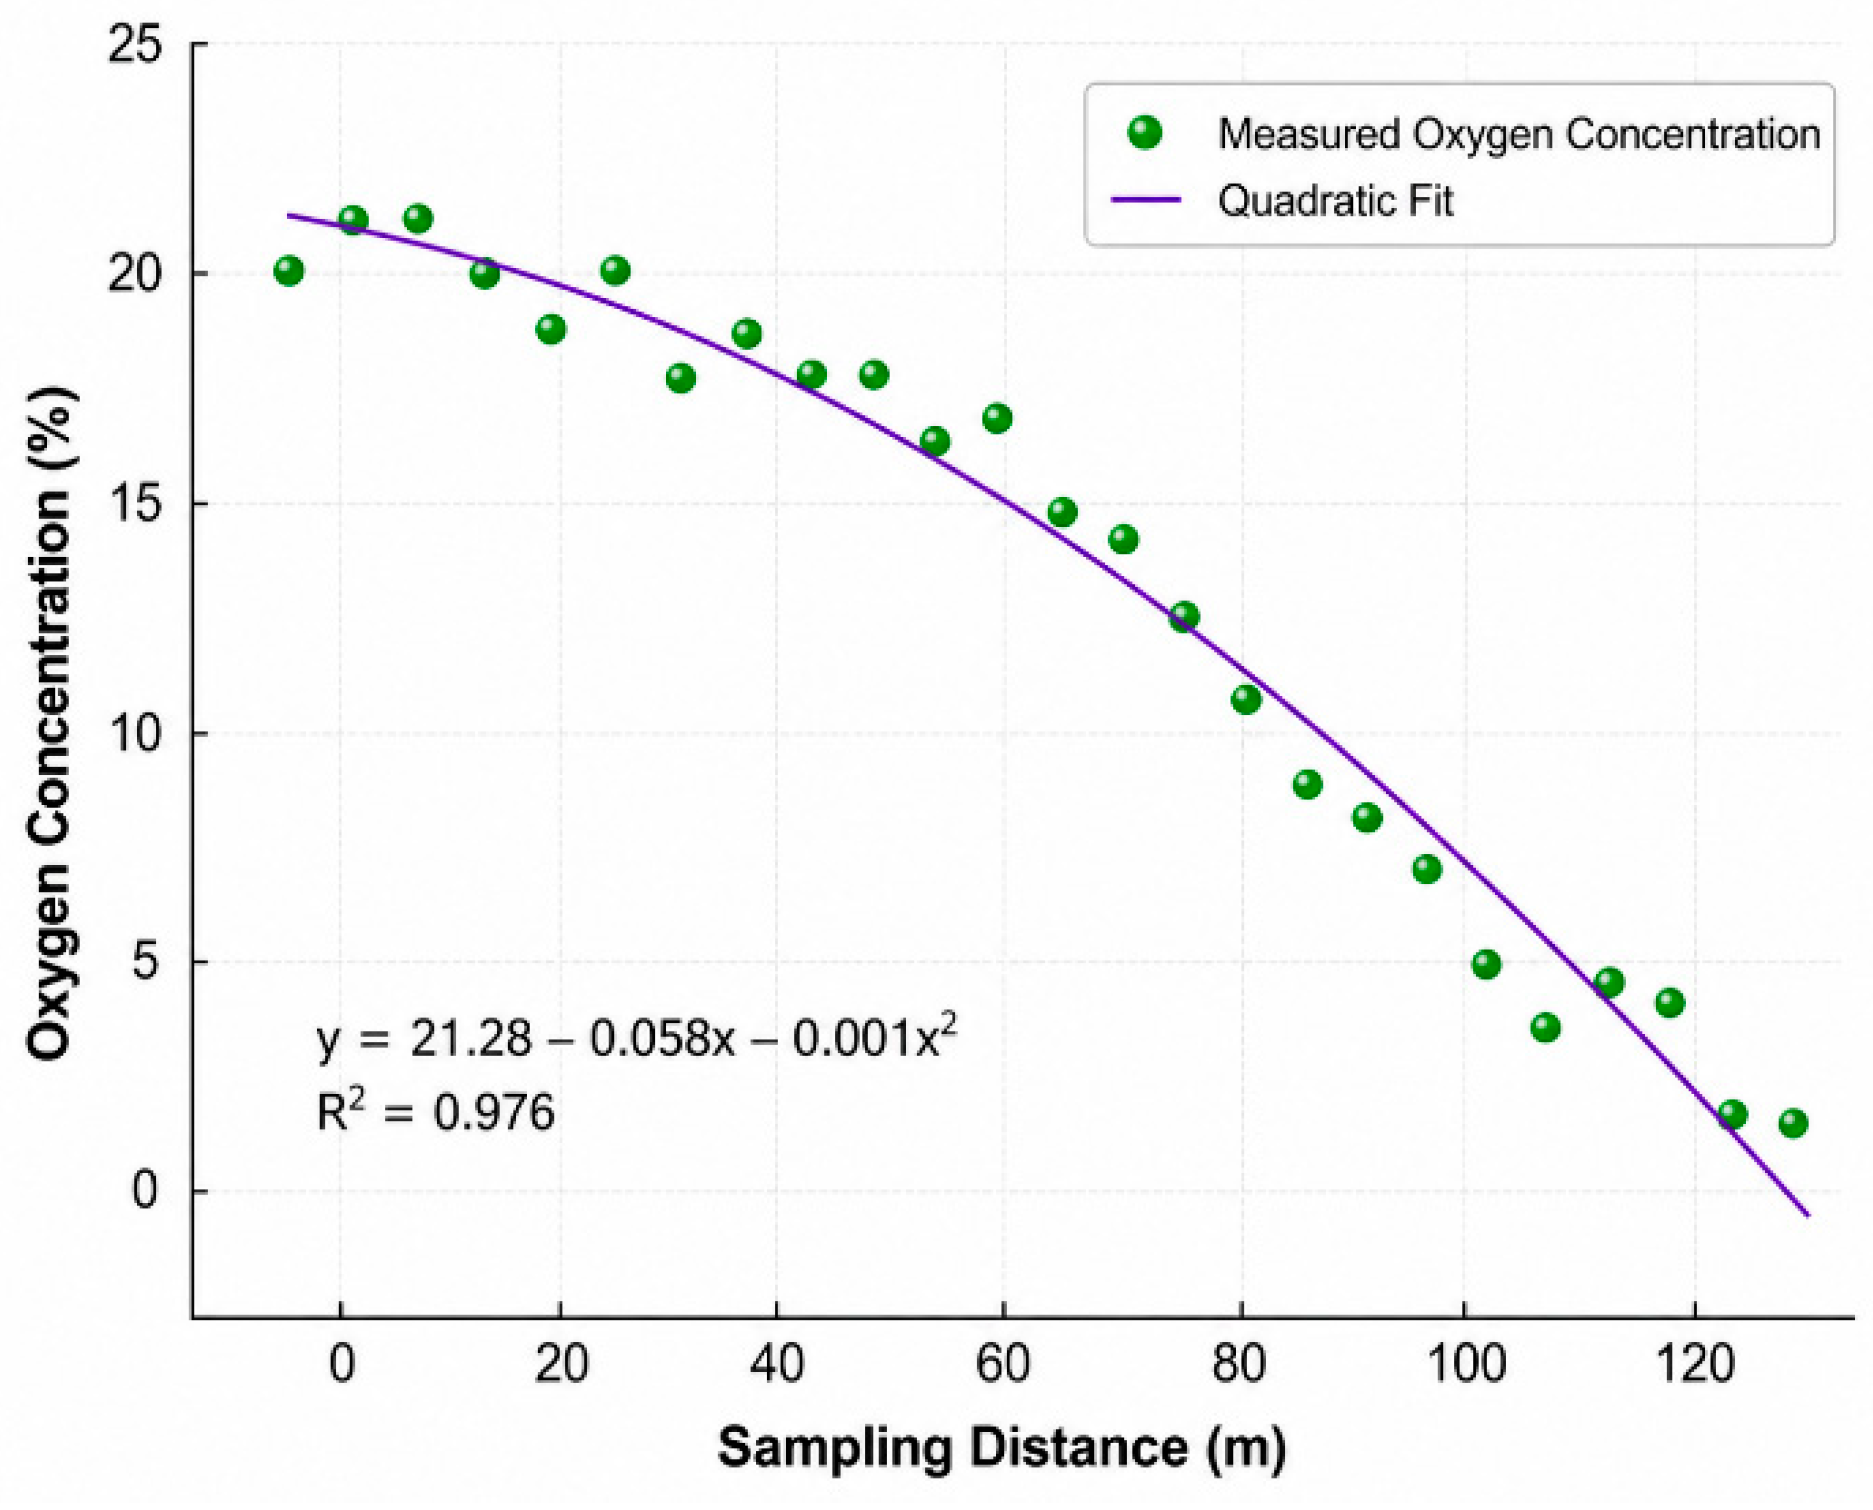
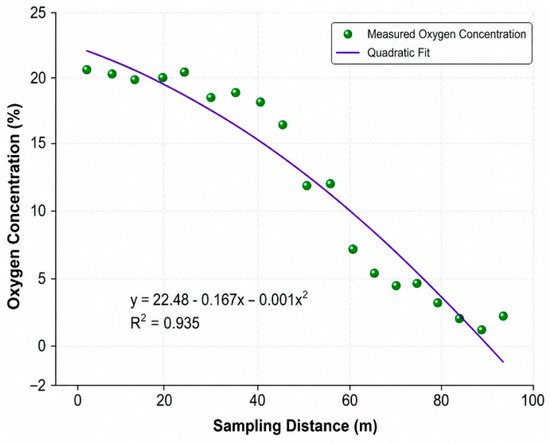
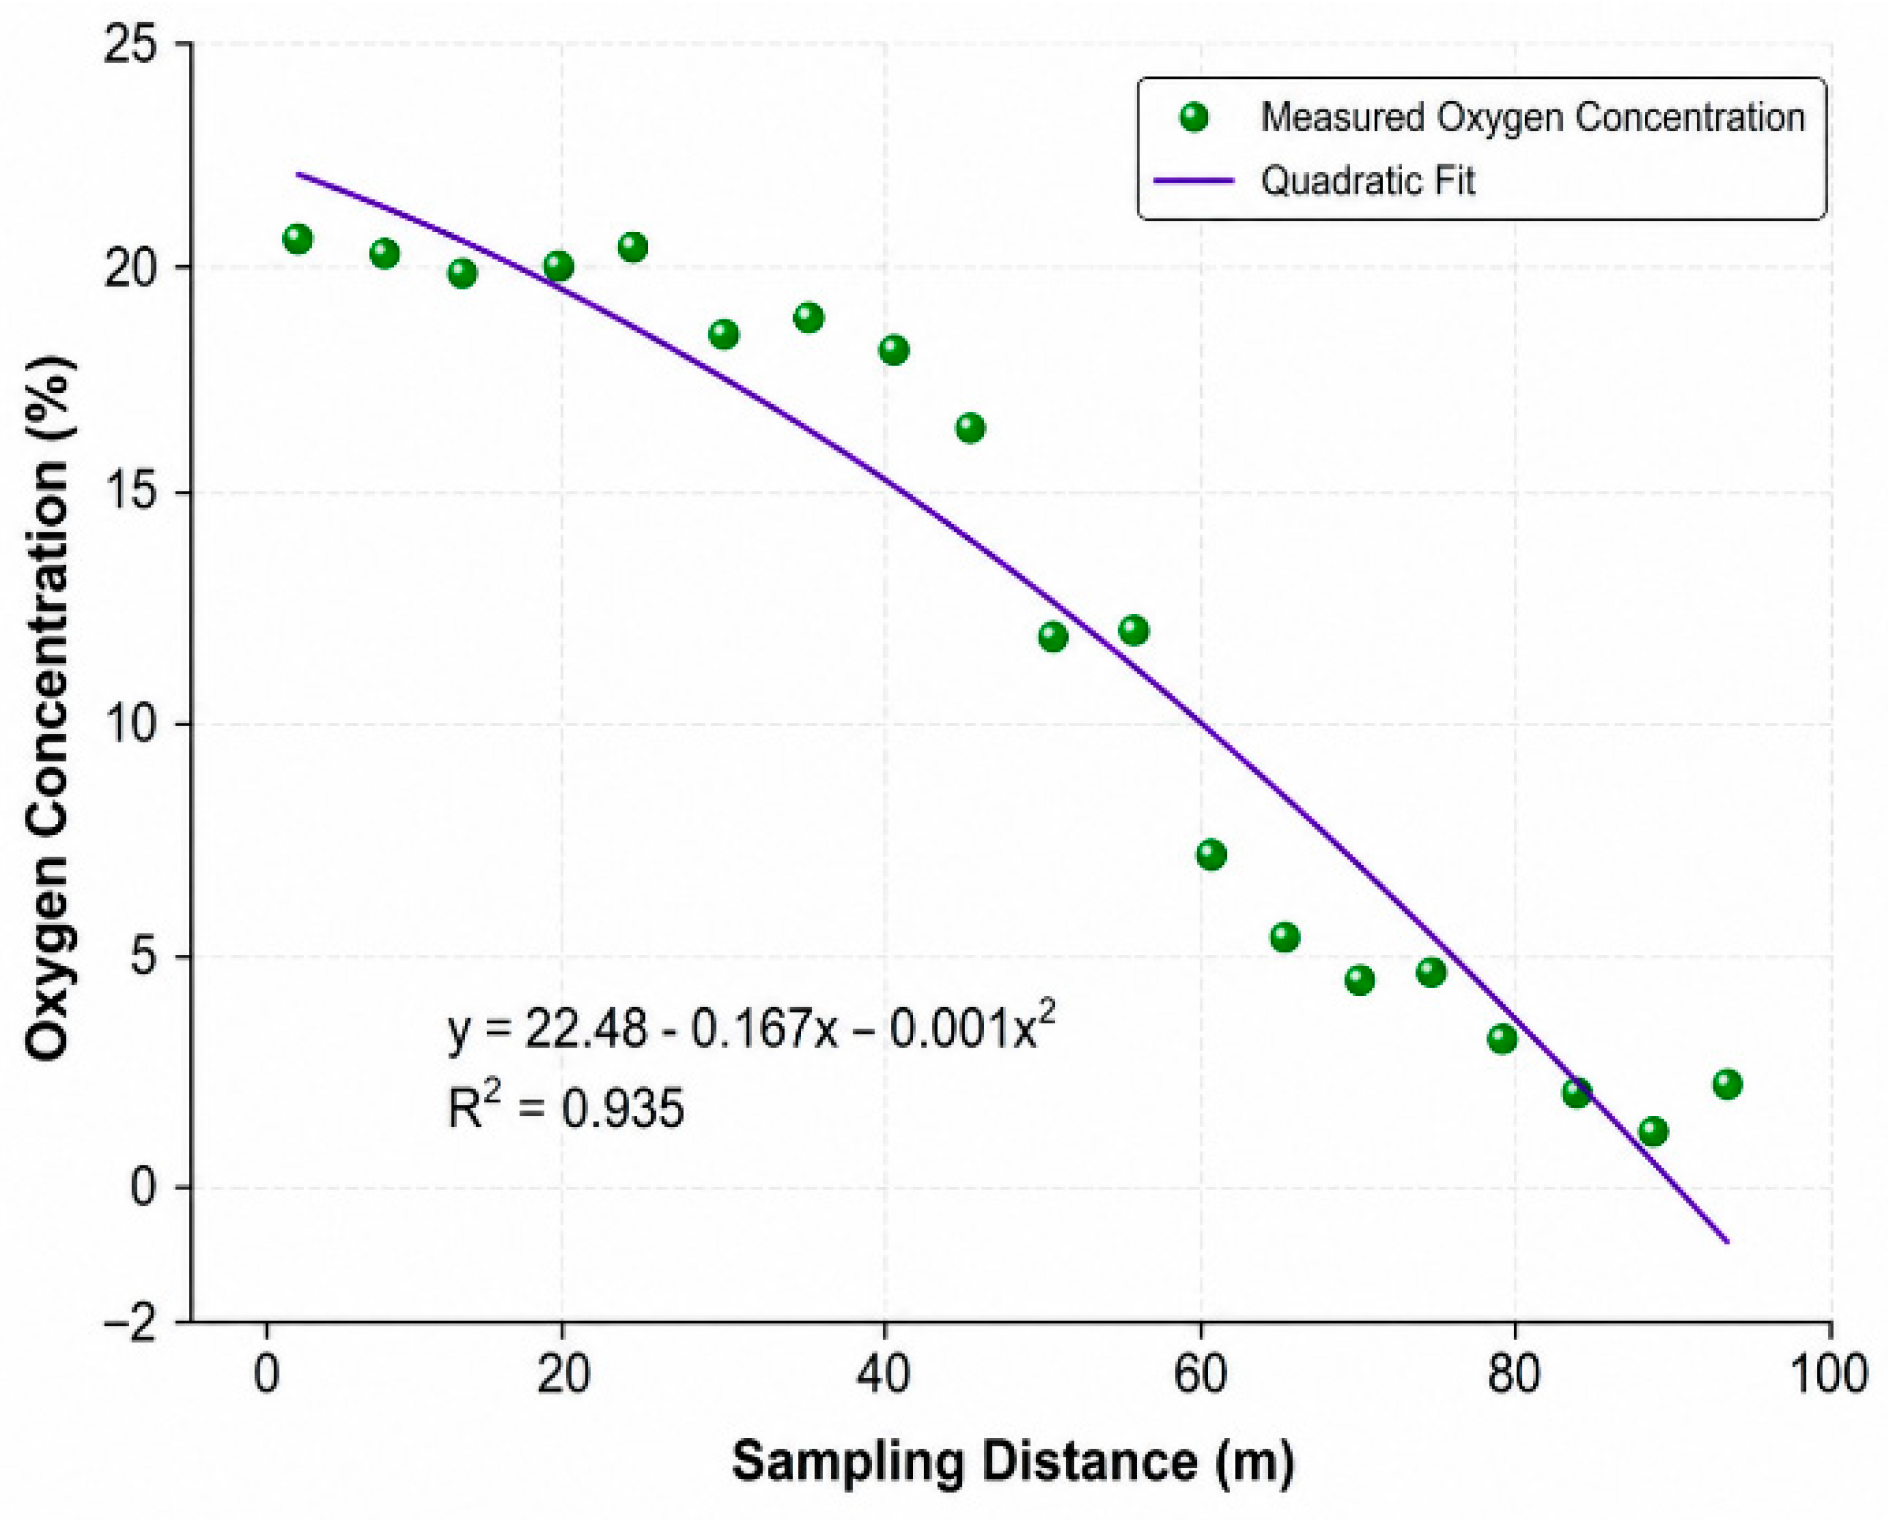
The measured O2 concentration profiles in Figure 11 and Figure 12 and Table 1 decrease with distance behind the working face on both sides of the goaf, but the attenuation rates differ markedly. On the inlet side, oxygen-rich leakage penetrates deeper into the goaf, whereas on the return side, oxygen decays more rapidly because of the smaller leakage cross-section and stronger consumption along the return pathway. Using 18% O2 as the heat-dissipation/oxidation boundary and 8% O2 as the oxidation/asphyxiation boundary, the inlet-side oxidation zone is broader and extends farther into the goaf than the return-side oxidation zone. This asymmetry is a key baseline against which the drainage-induced disturbance is evaluated.
Figure 11.
Measured O2 concentration on the inlet side of the goaf.
Figure 12.
Measured O2 concentration on the return side of the goaf.
Table 1.
Measured O2 volume fraction along the inlet and return sides of the goaf at the No. 1217 working face.
The 8% field threshold is a conservative regulatory criterion that incorporates a safety margin above the 5.9% kinetic threshold determined in the laboratory, accounting for in situ sampling uncertainty and the spatial heterogeneity of the goaf oxygen field. The 5.9% value is retained as the kinetic cut-off in the CFD source term, while 8% is used only for an engineering classification of the three field-measured zones.
The fitted curves superimposed on Figure 11 and Figure 12 provide a compact representation of the measured oxygen profiles, with R2 values of 0.976 for the inlet side and 0.935 for the return side. These high goodness-of-fit values support interpolation of the 18% and 8% oxygen thresholds and provide quantitative benchmarks for subsequent CFD validation. Several inlet-side readings in the shallow region (0–35 m), including the 21.21% value at 10 m, marginally exceed the atmospheric oxygen fraction. This scatter is attributed to two combined effects: (i) local re-circulation of fresh leakage air in the heat-dissipation zone, where the bundle-tube sampling point can be drawn from a leakage channel rather than a representative goaf volume; and (ii) the amplified relative uncertainty of in situ oxygen sensors when measuring near the atmospheric reference. The scatter is confined to the heat-dissipation zone, where the local O2 is far from the partitioning thresholds (18% and 8%) and the oxidation source term in Equation (3) is effectively zero. The polynomial fit (R2 = 0.976) remains within the field-monitoring uncertainty band, and the inferred oxidation-zone boundary at 44 m on the inlet side lies well outside the scattered region, so the three-zone identification is not affected by these points.
4.3. Temperature Profile and Three-Zone Partitioning by Temperature Gradient
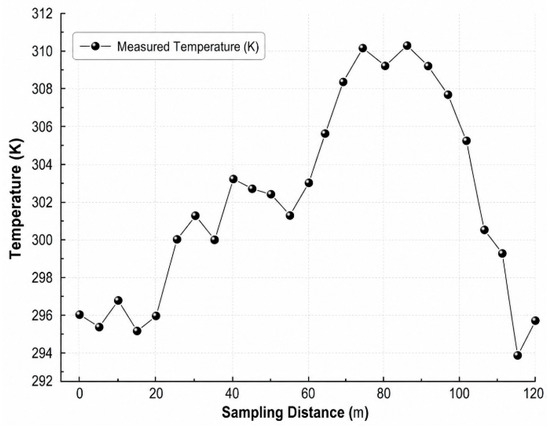
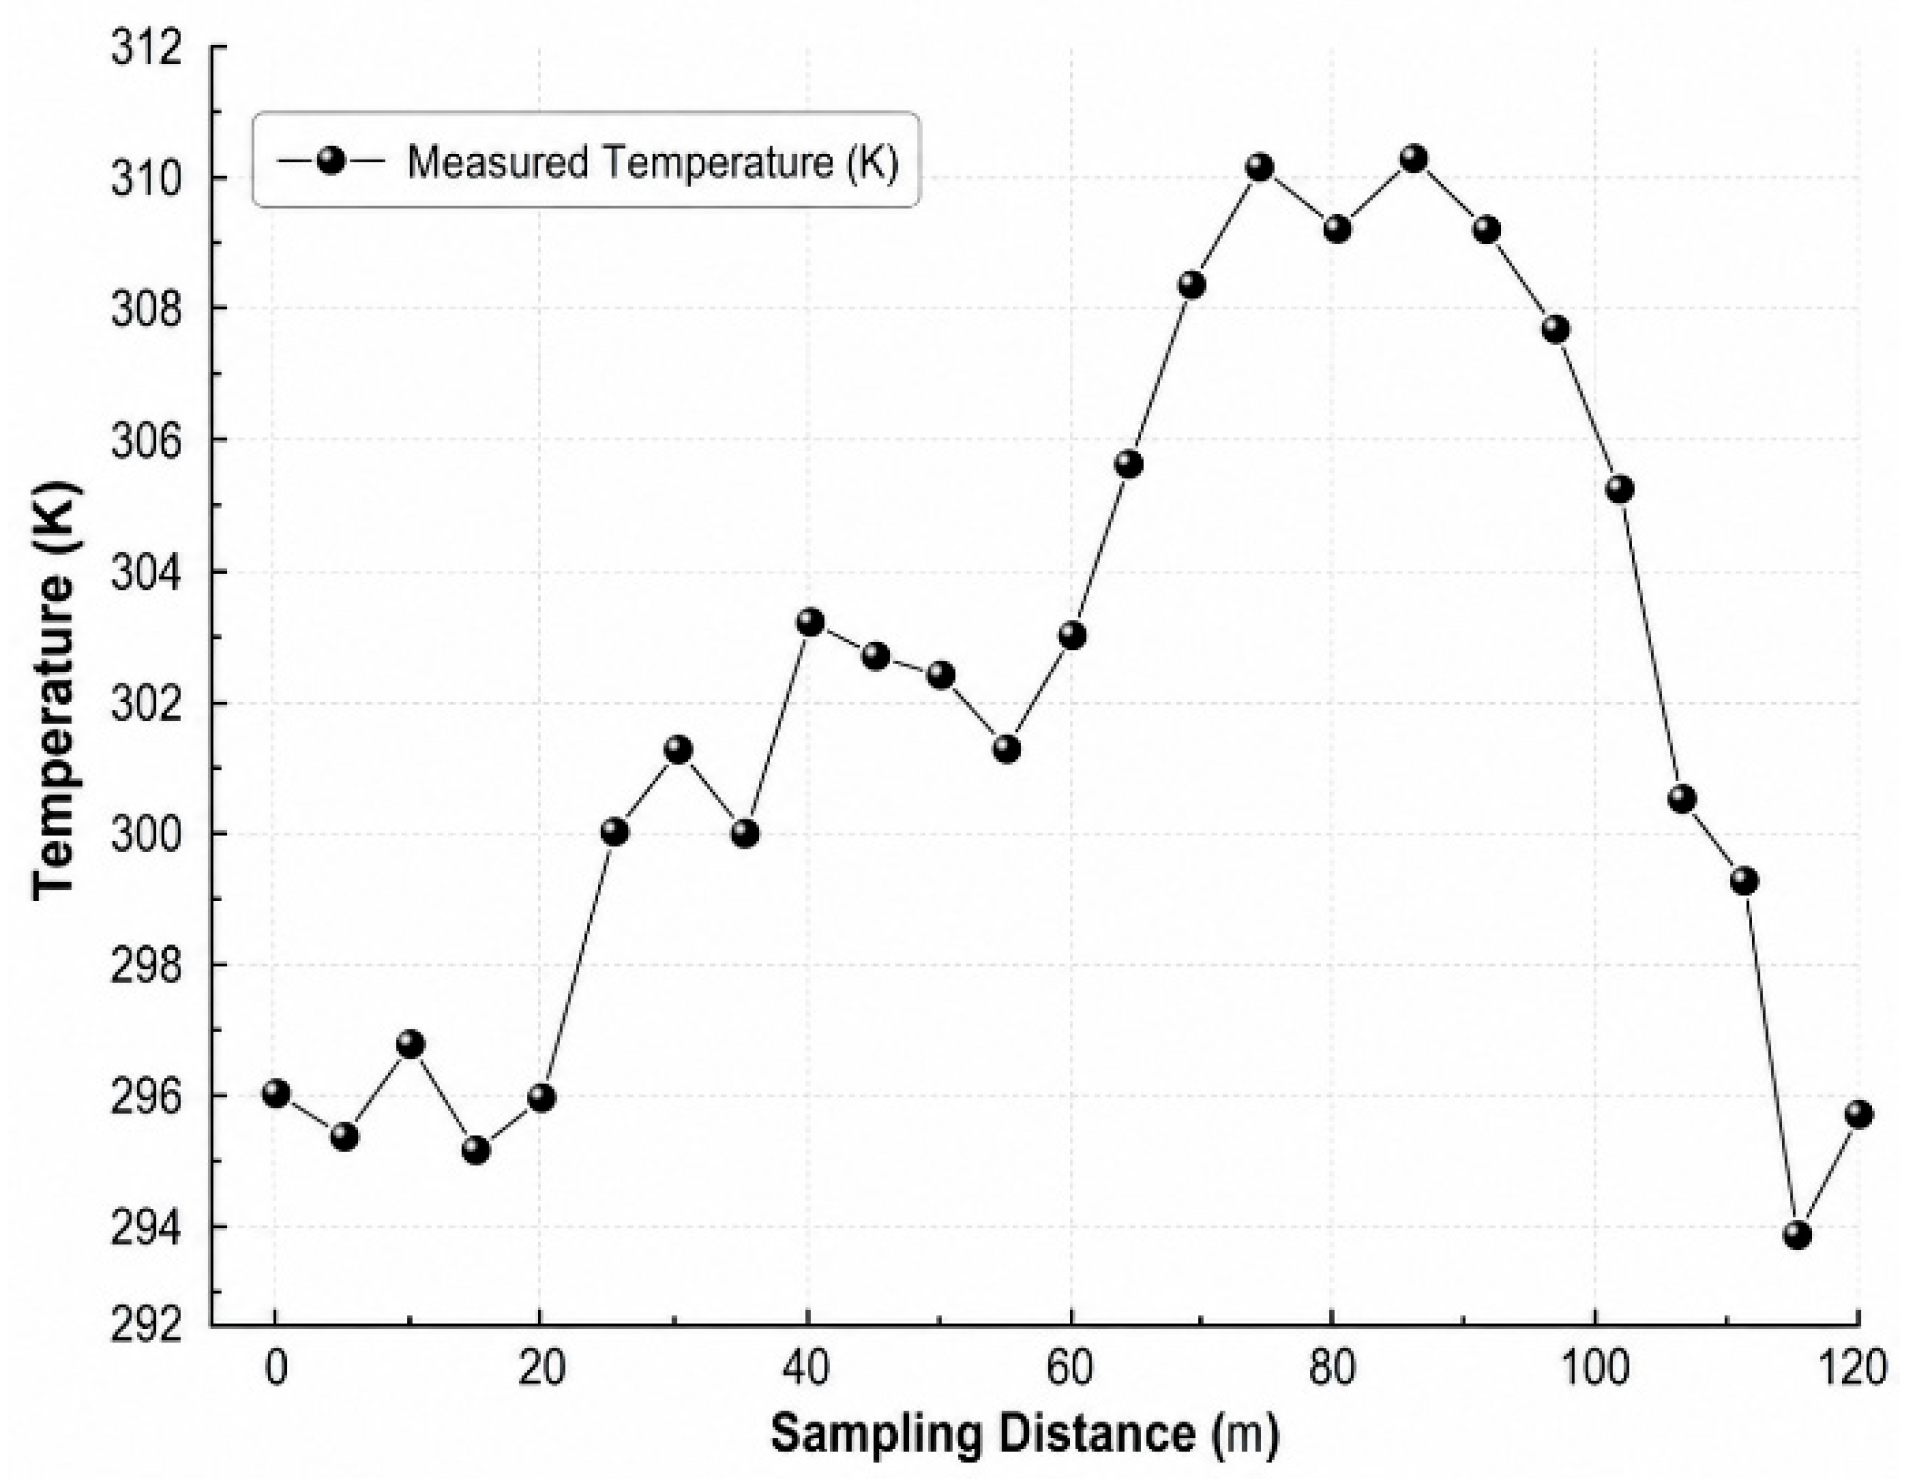
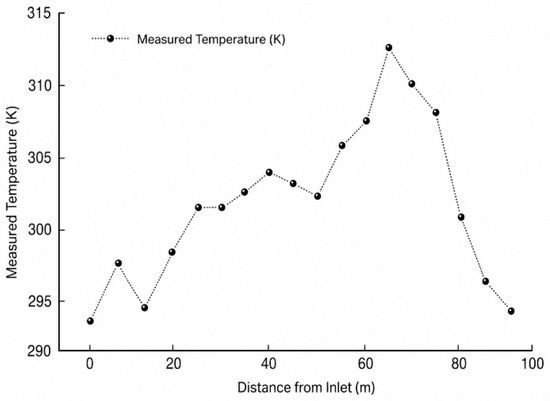
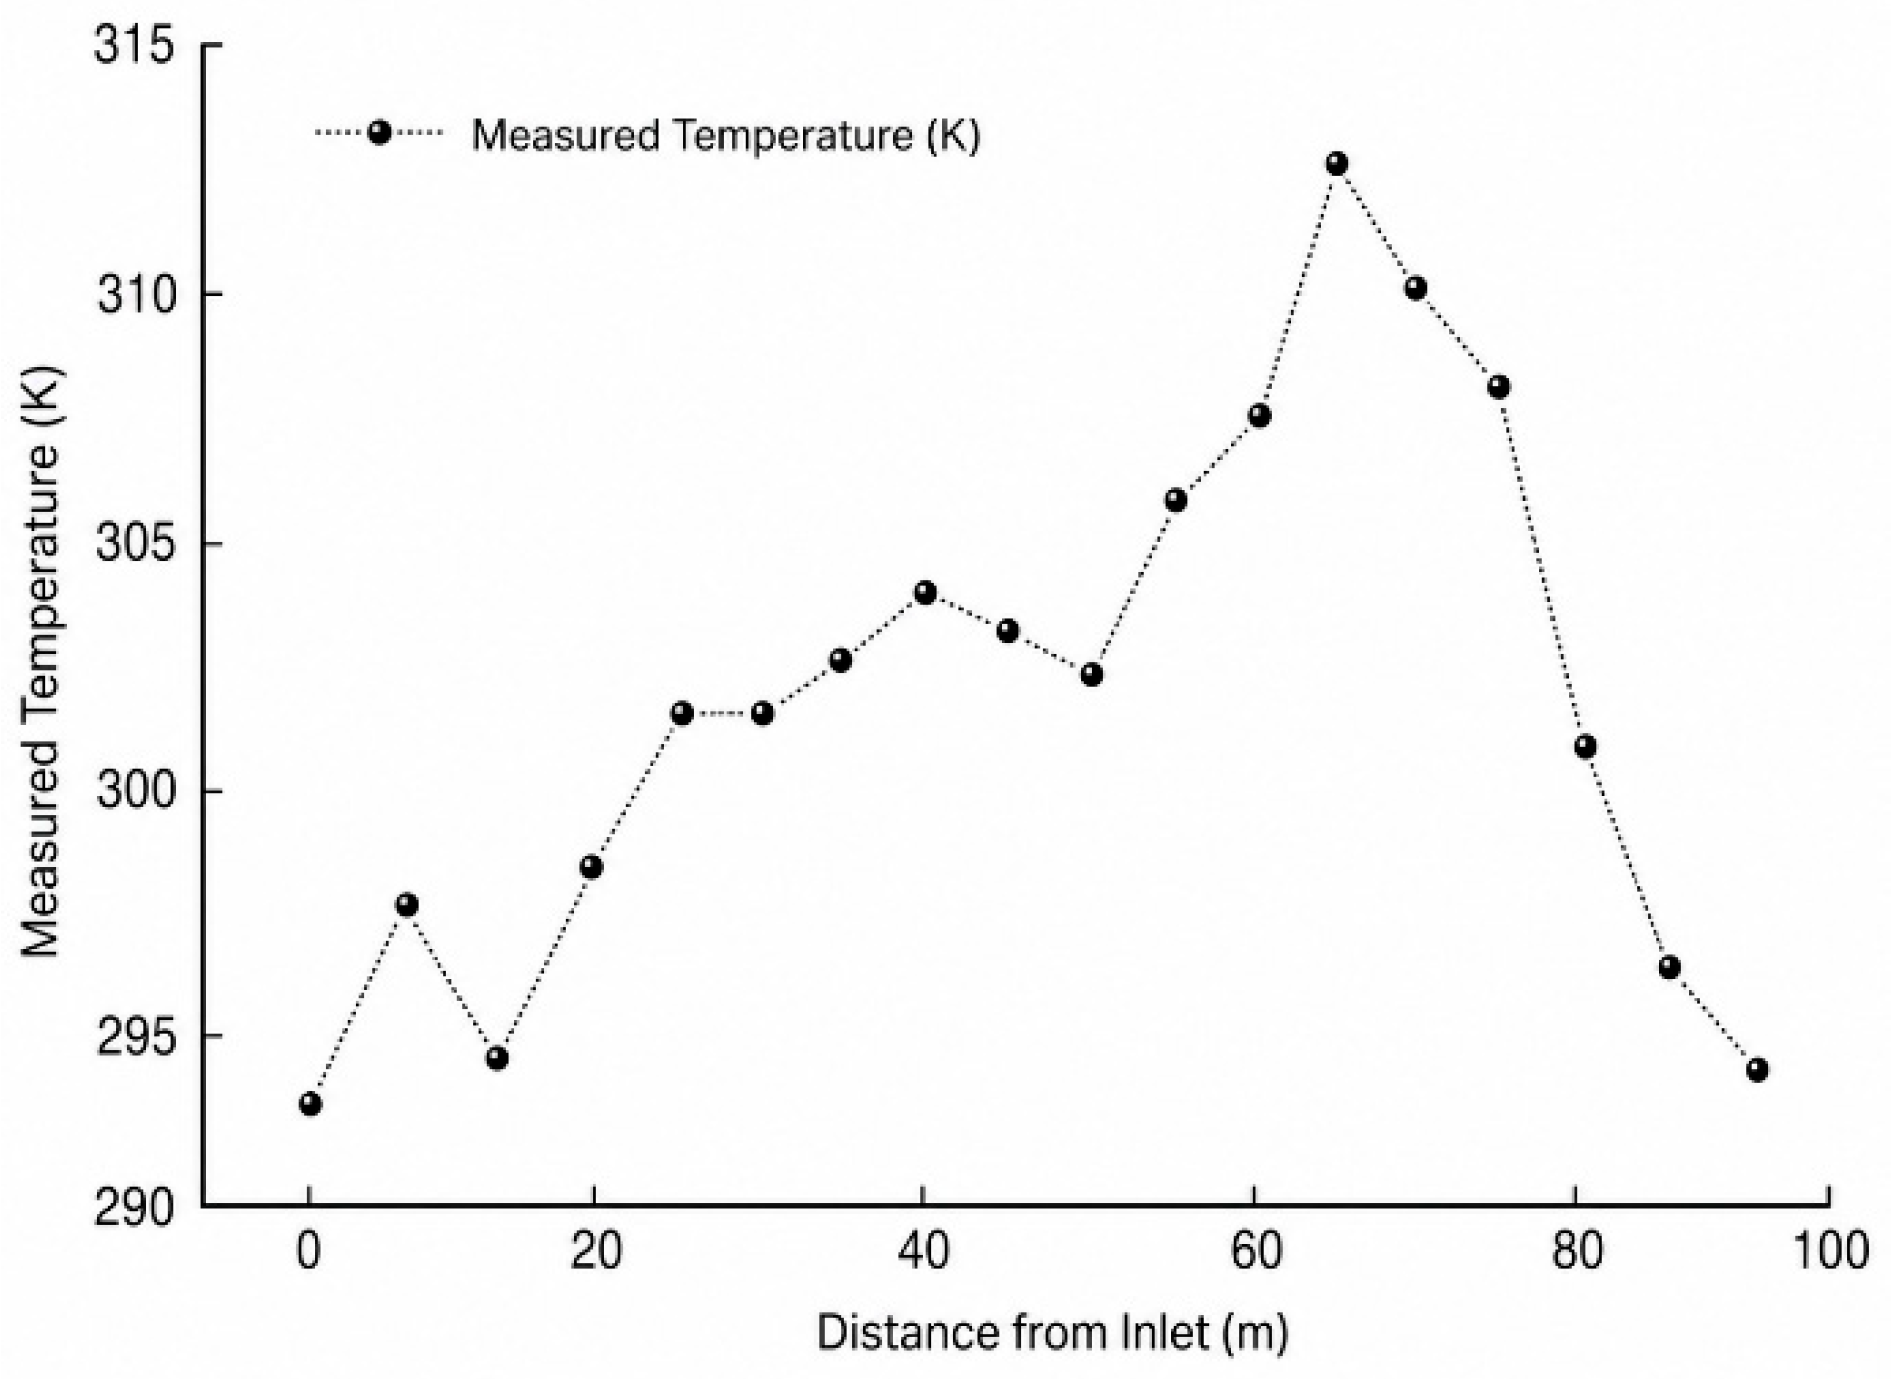
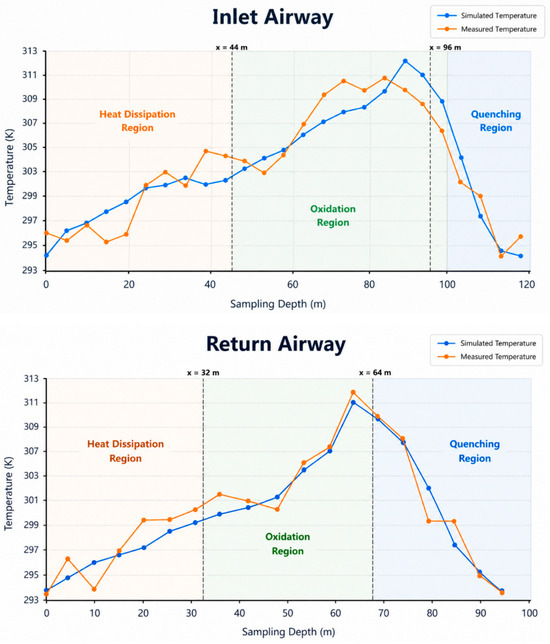
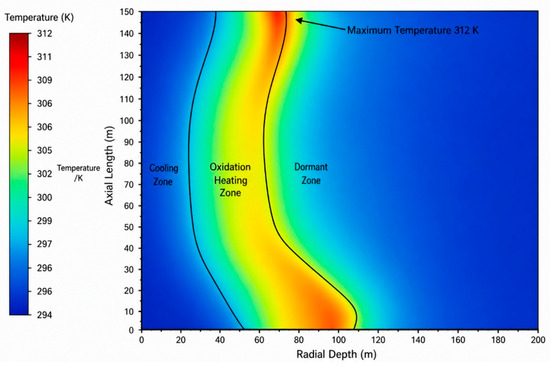
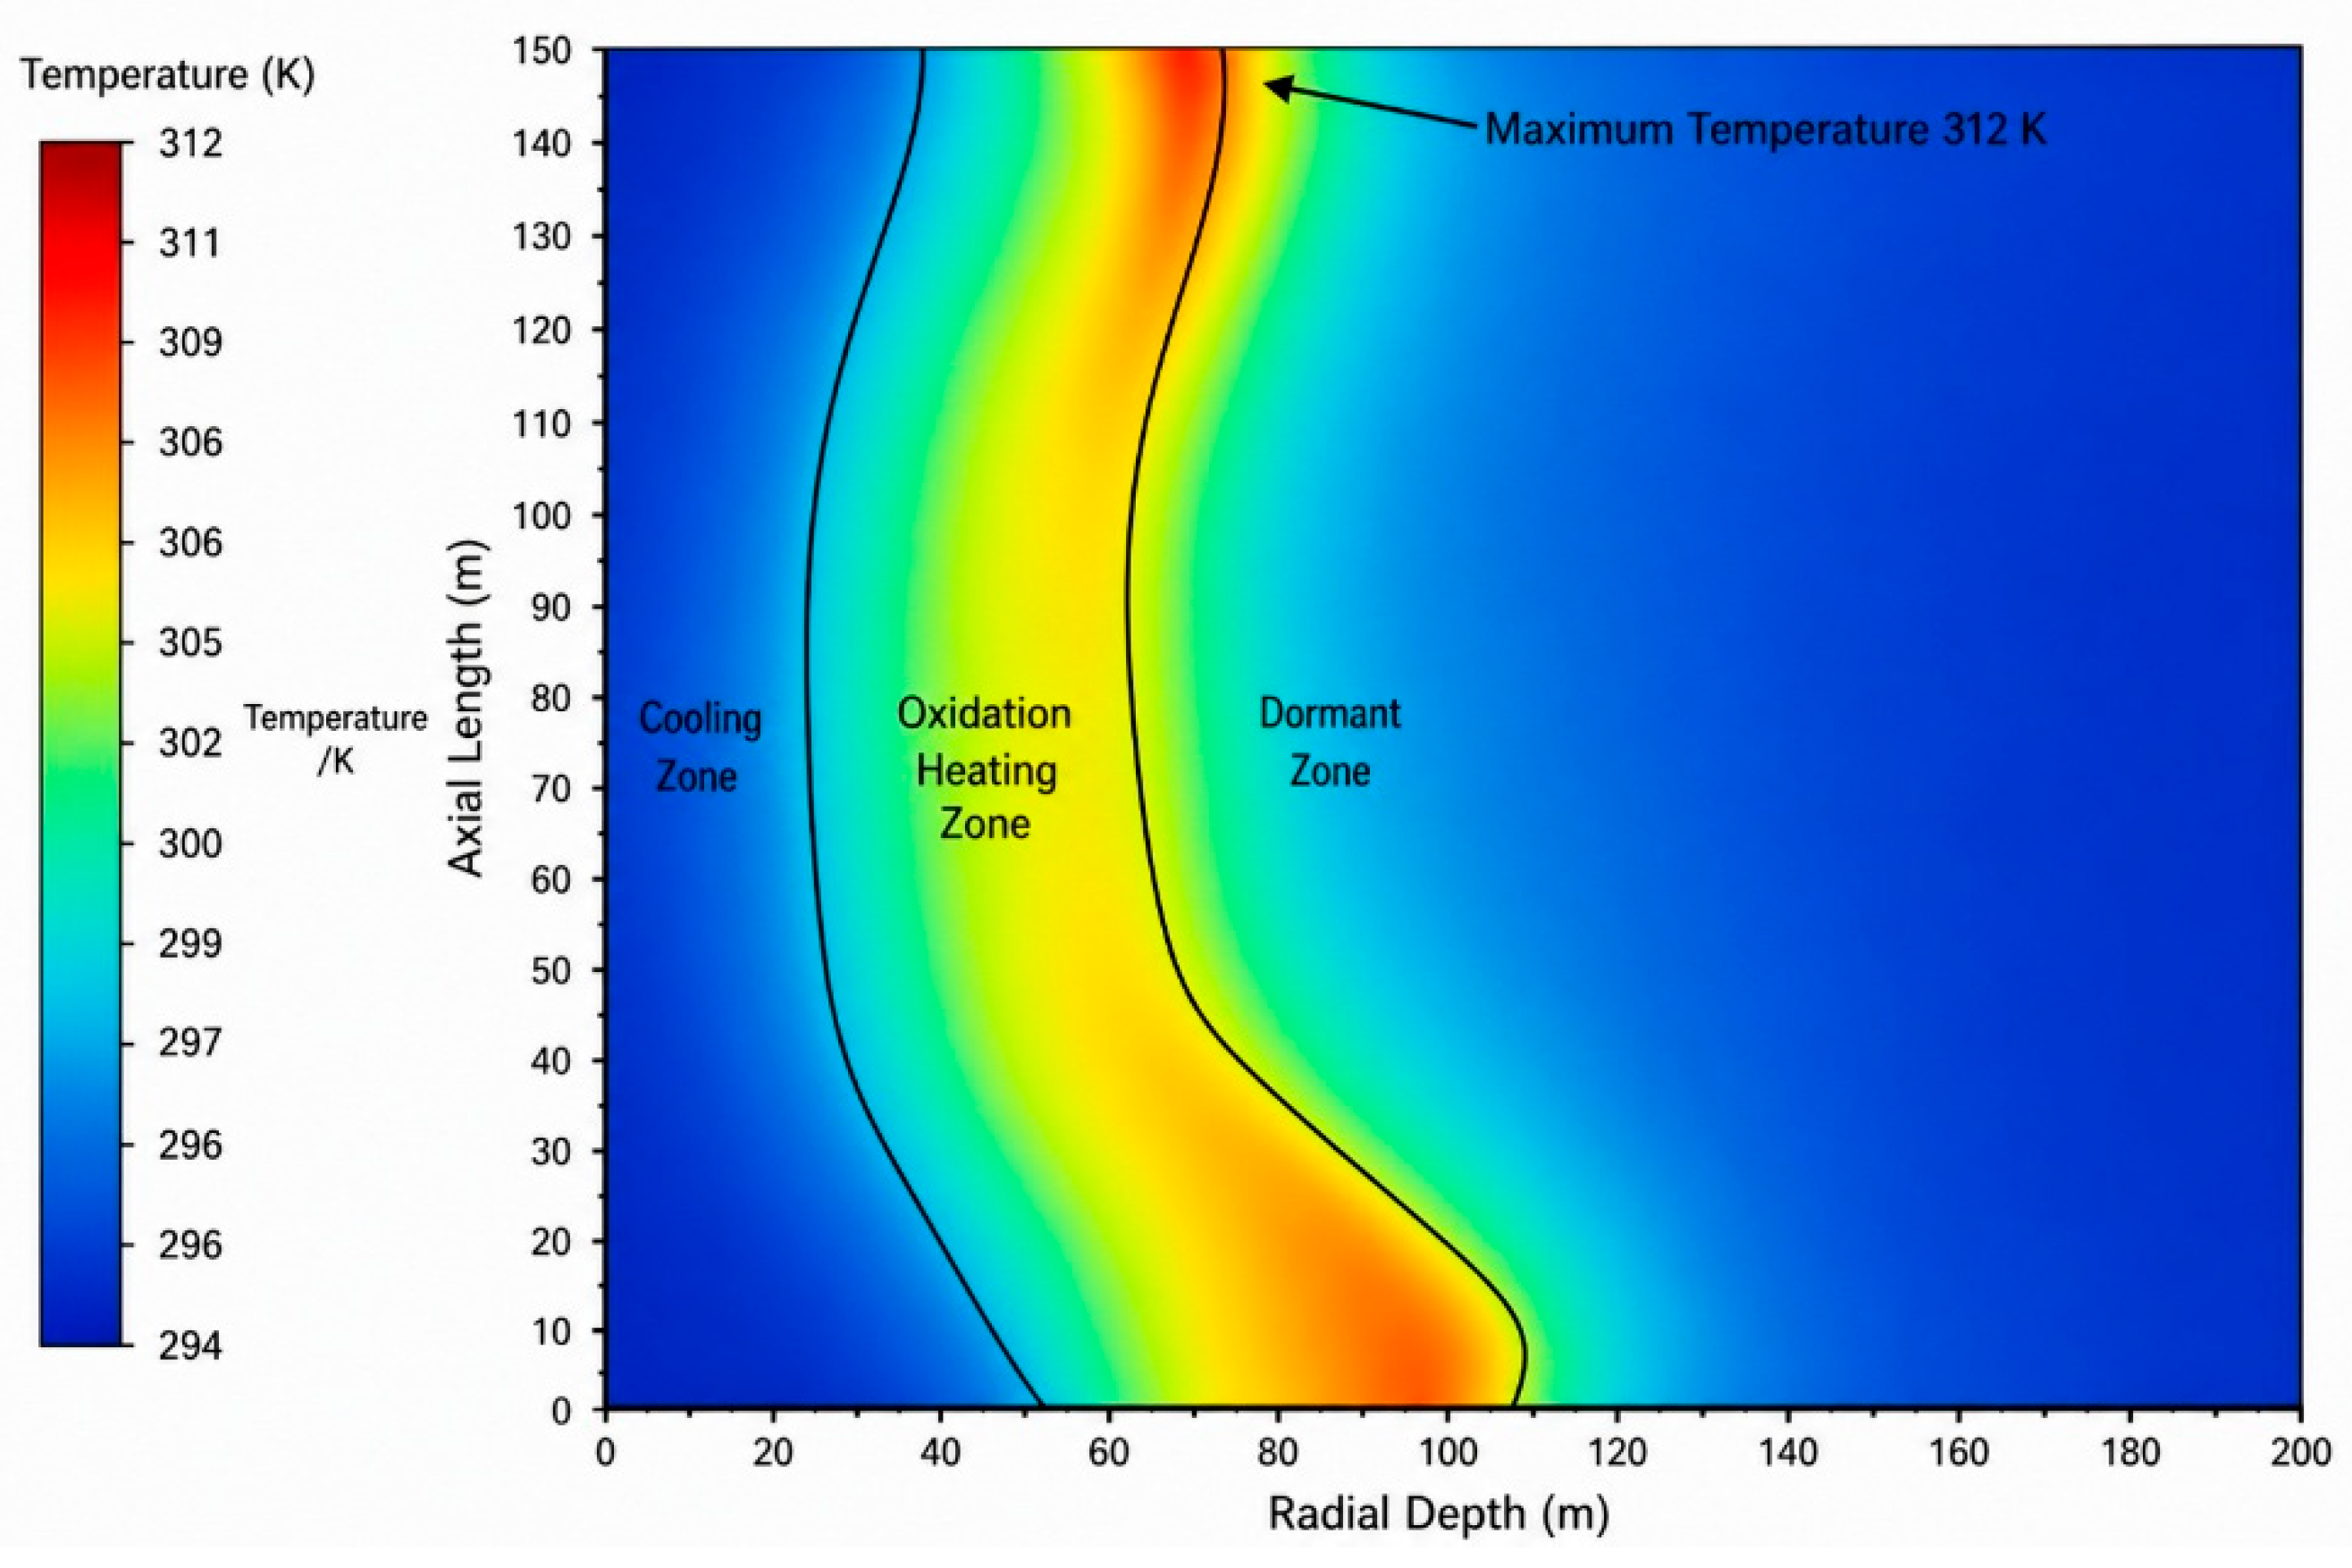
Optical-fiber temperature profiles for the inlet and return sides are shown in Figure 13 and Figure 14. Inlet-side temperature rises from 16 °C at the face to a peak of 17.5 °C at 60–80 m before decaying to 15.5 °C beyond 100 m; return-side temperature peaks earlier at 17.4 °C around 50 m and falls below 16 °C by 70 m. The deeper peak on the inlet side mirrors the O2-based asymmetry of Section 4.2.
Figure 13.
Measured temperature profile on the inlet side of the goaf.
Figure 14.
Measured temperature profile on the return side of the goaf.
Applying the 1 °C/24 h temperature-rise criterion delineates an oxidation zone of 38–92 m (width 54 m) on the inlet side and 32–62 m (width 30 m) on the return side. The O2-based partition of Section 4.2 (44–96 m and 32–64 m) agrees with the thermal partition within 6 m on both sides, providing cross-validation by two physically independent indicators. The inlet/return width ratio of 1.8 reflects the enhanced leakage flux on the inlet side, which sustains low-temperature oxidation deeper into the goaf.
5. Numerical Model and Validation
5.1. Geometry, Mesh and Governing Equations
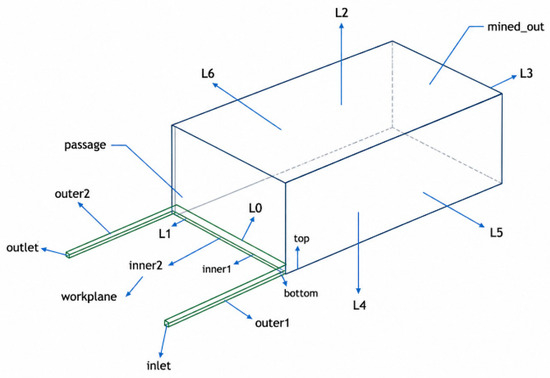
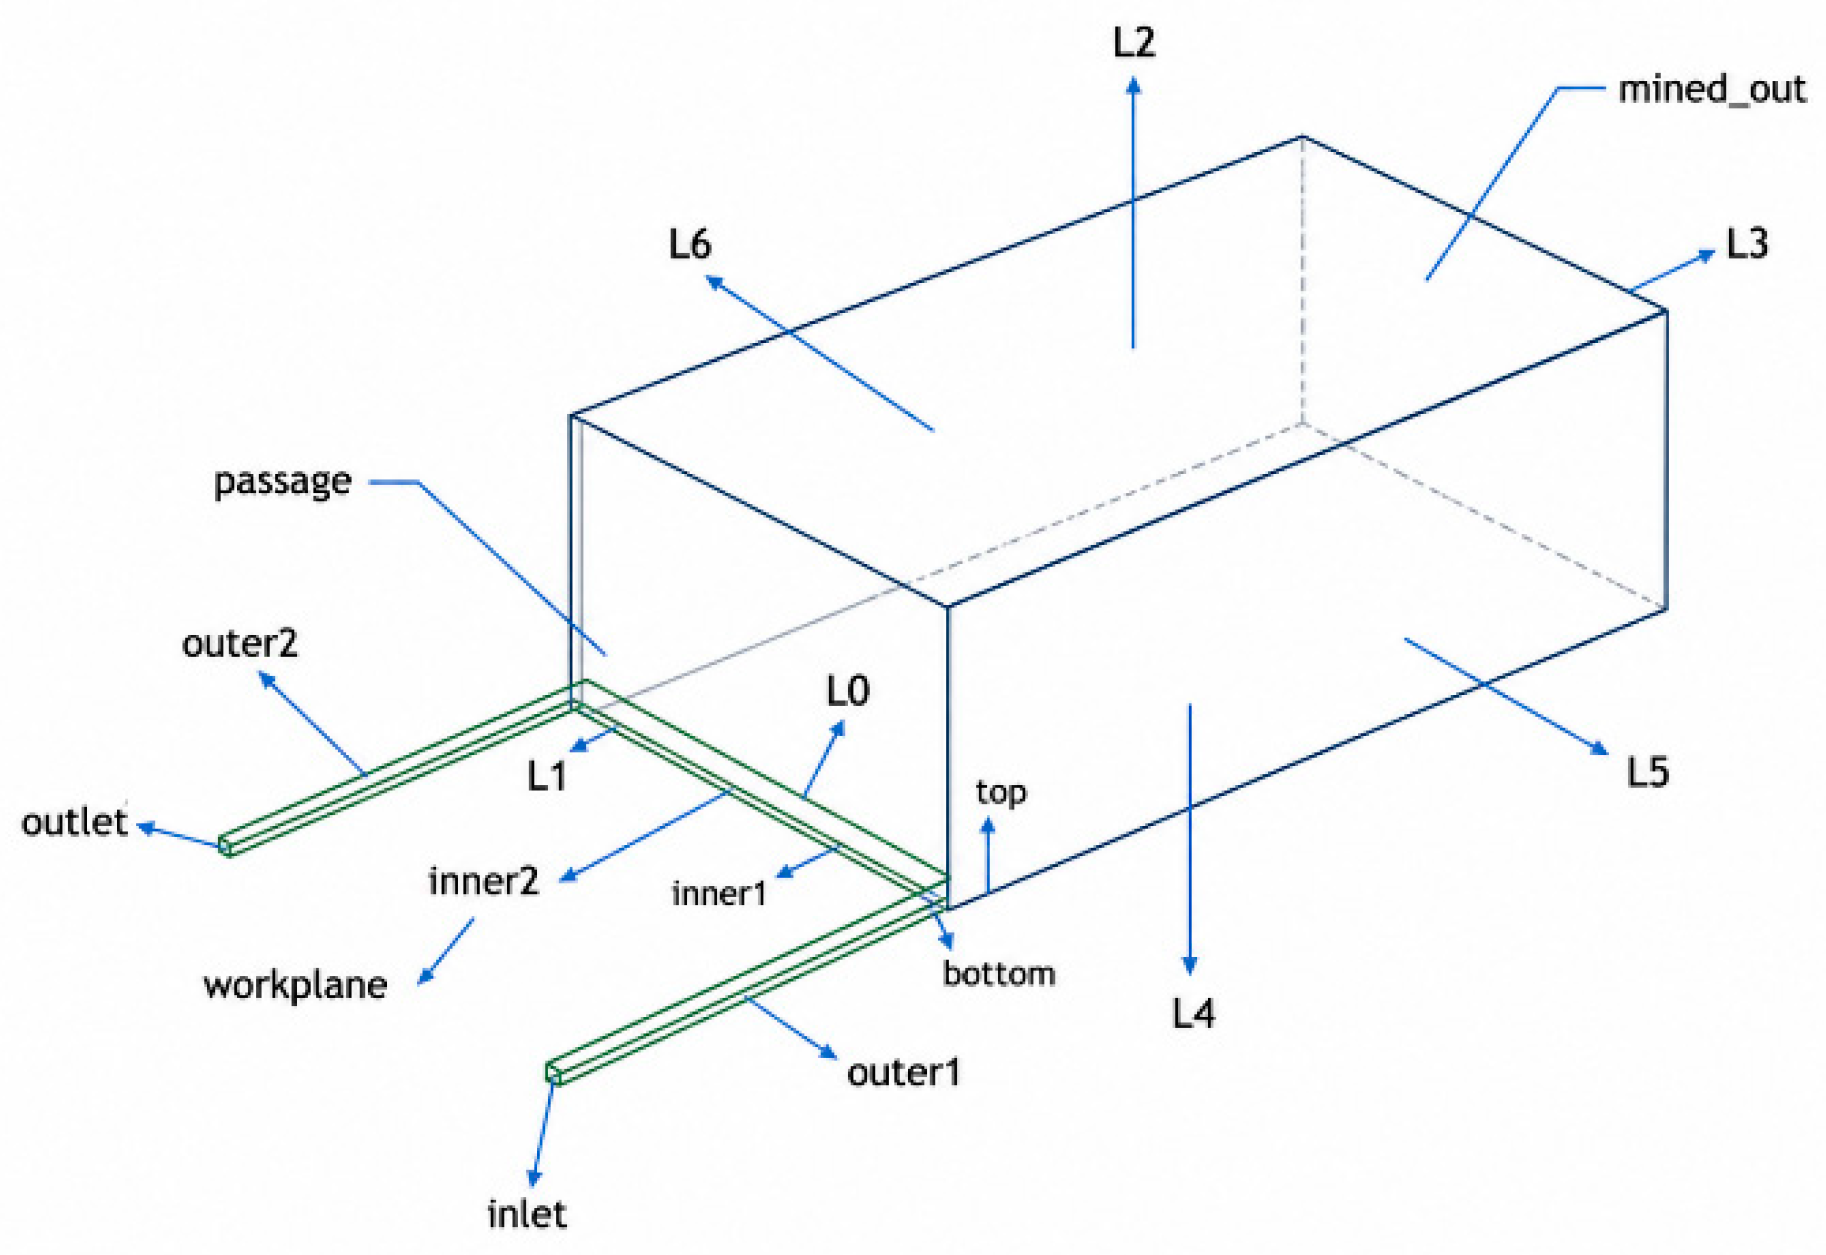
A full-scale three-dimensional model was constructed to represent the inlet airway, working face, return airway and 200 m deep goaf, as shown in Figure 15. The airway region was treated as a conventional fluid domain, whereas the goaf was modeled as a porous medium with spatially varying porosity and permeability. A mesh-independence check confirmed that the selected resolution changed the predicted oxidation-zone width by less than 1.5%.
Figure 15.
Geometric model of the No. 1217 goaf.
5.2. Governing Equations and Oxidation Source Term
The model solves the steady-state mass, momentum, energy and species-transport equations. The airway is solved with the standard k-ε turbulence model; the goaf is treated as a porous medium with laminar flow, with the momentum equation augmented by a Darcy–Forchheimer resistance term
where r is the viscous resistance coefficient (1/m2), C2 is the inertial resistance coefficient (1/m), μ is the dynamic viscosity, ρ is the gas density and u is the superficial velocity.
Low-temperature oxidation of residual coal is introduced through an effective single-step Arrhenius volumetric heat source linked to the local oxygen concentration:
where q is the volumetric heat-source intensity, ΔH is the molar reaction enthalpy, A is the pre-exponential factor and Ea is the apparent activation energy taken from the programmed temperature-rise experiments in Section 3. The oxygen-consumption source term used in the species-transport equation is fitted from the laboratory data as
with kb = 0.25 (particle-size factor), kh = 0.31 (coal-thickness factor) and C0 = 21% (reference oxygen concentration). The methane source term is taken as a uniform volumetric mass source of 7.2458 × 10⁻⁹ kg/(m3·s), corresponding to the measured goaf gas emission of 1.35 m3/min and a methane density of 0.7168 kg/m3. The oxidation source is deactivated wherever the local O2 concentration falls below the 5.9% kinetic threshold determined in Section 3.
The single-step Arrhenius form is preferred over multi-step oxidation kinetics because the kinetic parameters for individual elementary reactions (physical adsorption, chemical adsorption, functional-group decomposition, secondary oxidation) cannot be independently calibrated from field-feasible measurements at the engineering scale considered here. Comparison of the validated O2 and temperature fields with the bundle-tube and optical-fiber data (Section 5.5) shows that the effective single-step formulation reproduces the field profiles with relative errors below 5%, confirming that the simplification is adequate for predicting the three-zone morphology at the panel scale.
5.3. Porosity and Permeability of the Goaf
The goaf is represented as a heterogeneous porous medium through a three-dimensional extension of the “O-ring” caving model that resolves the variation of the bulking factor in both horizontal and vertical directions. The bulking factor Kp at an arbitrary point (x, y, z) is
and the local porosity is obtained from
The viscous and inertial resistance coefficients are then computed from a Carman–Kozeny/Ergun-type relation using the local porosity:
where α is the permeability (m2) and Dp = 0.015 m is the harmonic mean diameter of the caved rock fragments. The parameter values are listed in Table 2. Equations (4)–(6) are implemented as a Fluent UDF written in C and applied cell-by-cell to the goaf domain.
Table 2.
Parameters of the 3-D “O-ring” porosity/permeability model.
Although the goaf is geometrically represented as a cuboid computational domain rather than as an explicit caved-rock topology, the spatial heterogeneity of the goaf is not lost. Equation (4) introduces direction-dependent decay rates (a0 = 0.268 m−1 from the face, a1 = 0.0368 m−1 from the lateral boundaries and a2 = 0.15 m−1 from the roof), so the porosity, permeability and inertial resistance vary continuously in all three directions inside the cuboid. The resulting field reproduces the canonical “O-ring” caving pattern—high porosity along the rib-side perimeter and progressive compaction toward the deep goaf and the floor—within a regular computational domain. The cuboid simplification therefore refers to the boundary shape only; the internal flow- and reaction-relevant heterogeneity are carried entirely by the porosity and resistance fields.
5.4. Boundary Conditions and Physical Properties
Boundary conditions are summarized in Table 3. A velocity inlet of 2 m/s at 21 °C with a composition of 21% O2 and 78% N2 is imposed at the intake-airway entrance, and an outflow condition is applied at the return-airway exit. The face-to-return-airway pressure gradient is therefore not prescribed explicitly but emerges from the velocity-inlet/outflow combination, which reproduces the measured face ventilation rate of approximately 1116 m3/min. All six external boundaries of the goaf (L1–L6) are no-flux slip walls; the airway side walls and the roof/floor are no-slip walls with no diffusive species flux. The goaf–airway interface is treated as an internal coupling boundary. When drainage is activated, the buried-pipe outlet is added inside the return-side goaf at the prescribed depth (20, 30 or 50 m), with a pipe diameter of 326 mm, its center 2.1 m above the airway roof, and an outflow boundary condition imposing the prescribed negative pressure of 15 or 20 kPa.
Table 3.
Boundary conditions of the CFD model.
The thermal boundary at the goaf roof, floor and lateral edges is treated as adiabatic. This is the conventional treatment for engineering-scale goaf simulations, justified by the fact that the modeled 200 m goaf depth places the conductive heat-loss surfaces well outside the oxidation zone of interest, where the heat-transfer time scale through compacted caved material substantially exceeds the residence time of leakage flow. Residual coal is assigned a thermal conductivity of 0.9 W/(m·K), a density of 1410 kg/m3 and a specific heat capacity of 1200 J/(kg·K). The gas-phase properties used for O2, N2 and CH4 are listed in Table 4; the mixture is treated as an incompressible ideal gas with mass-weighted mixing rules for thermal conductivity and viscosity, and binary diffusion is evaluated through kinetic theory.
Table 4.
Gas-phase properties.
5.5. Validation Against Field Measurements
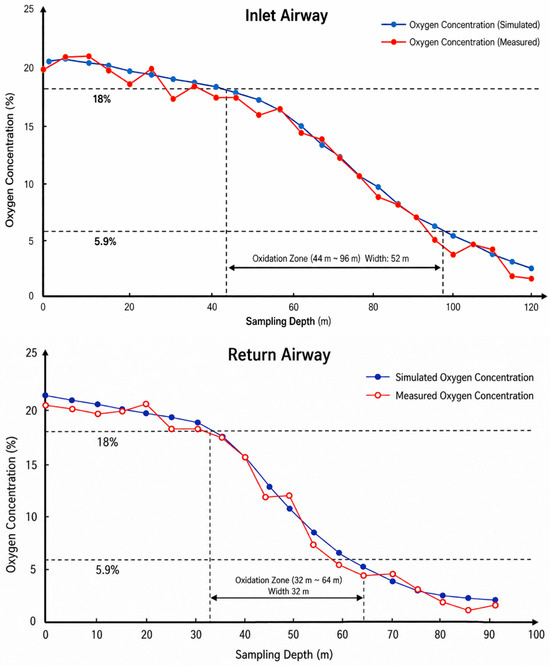
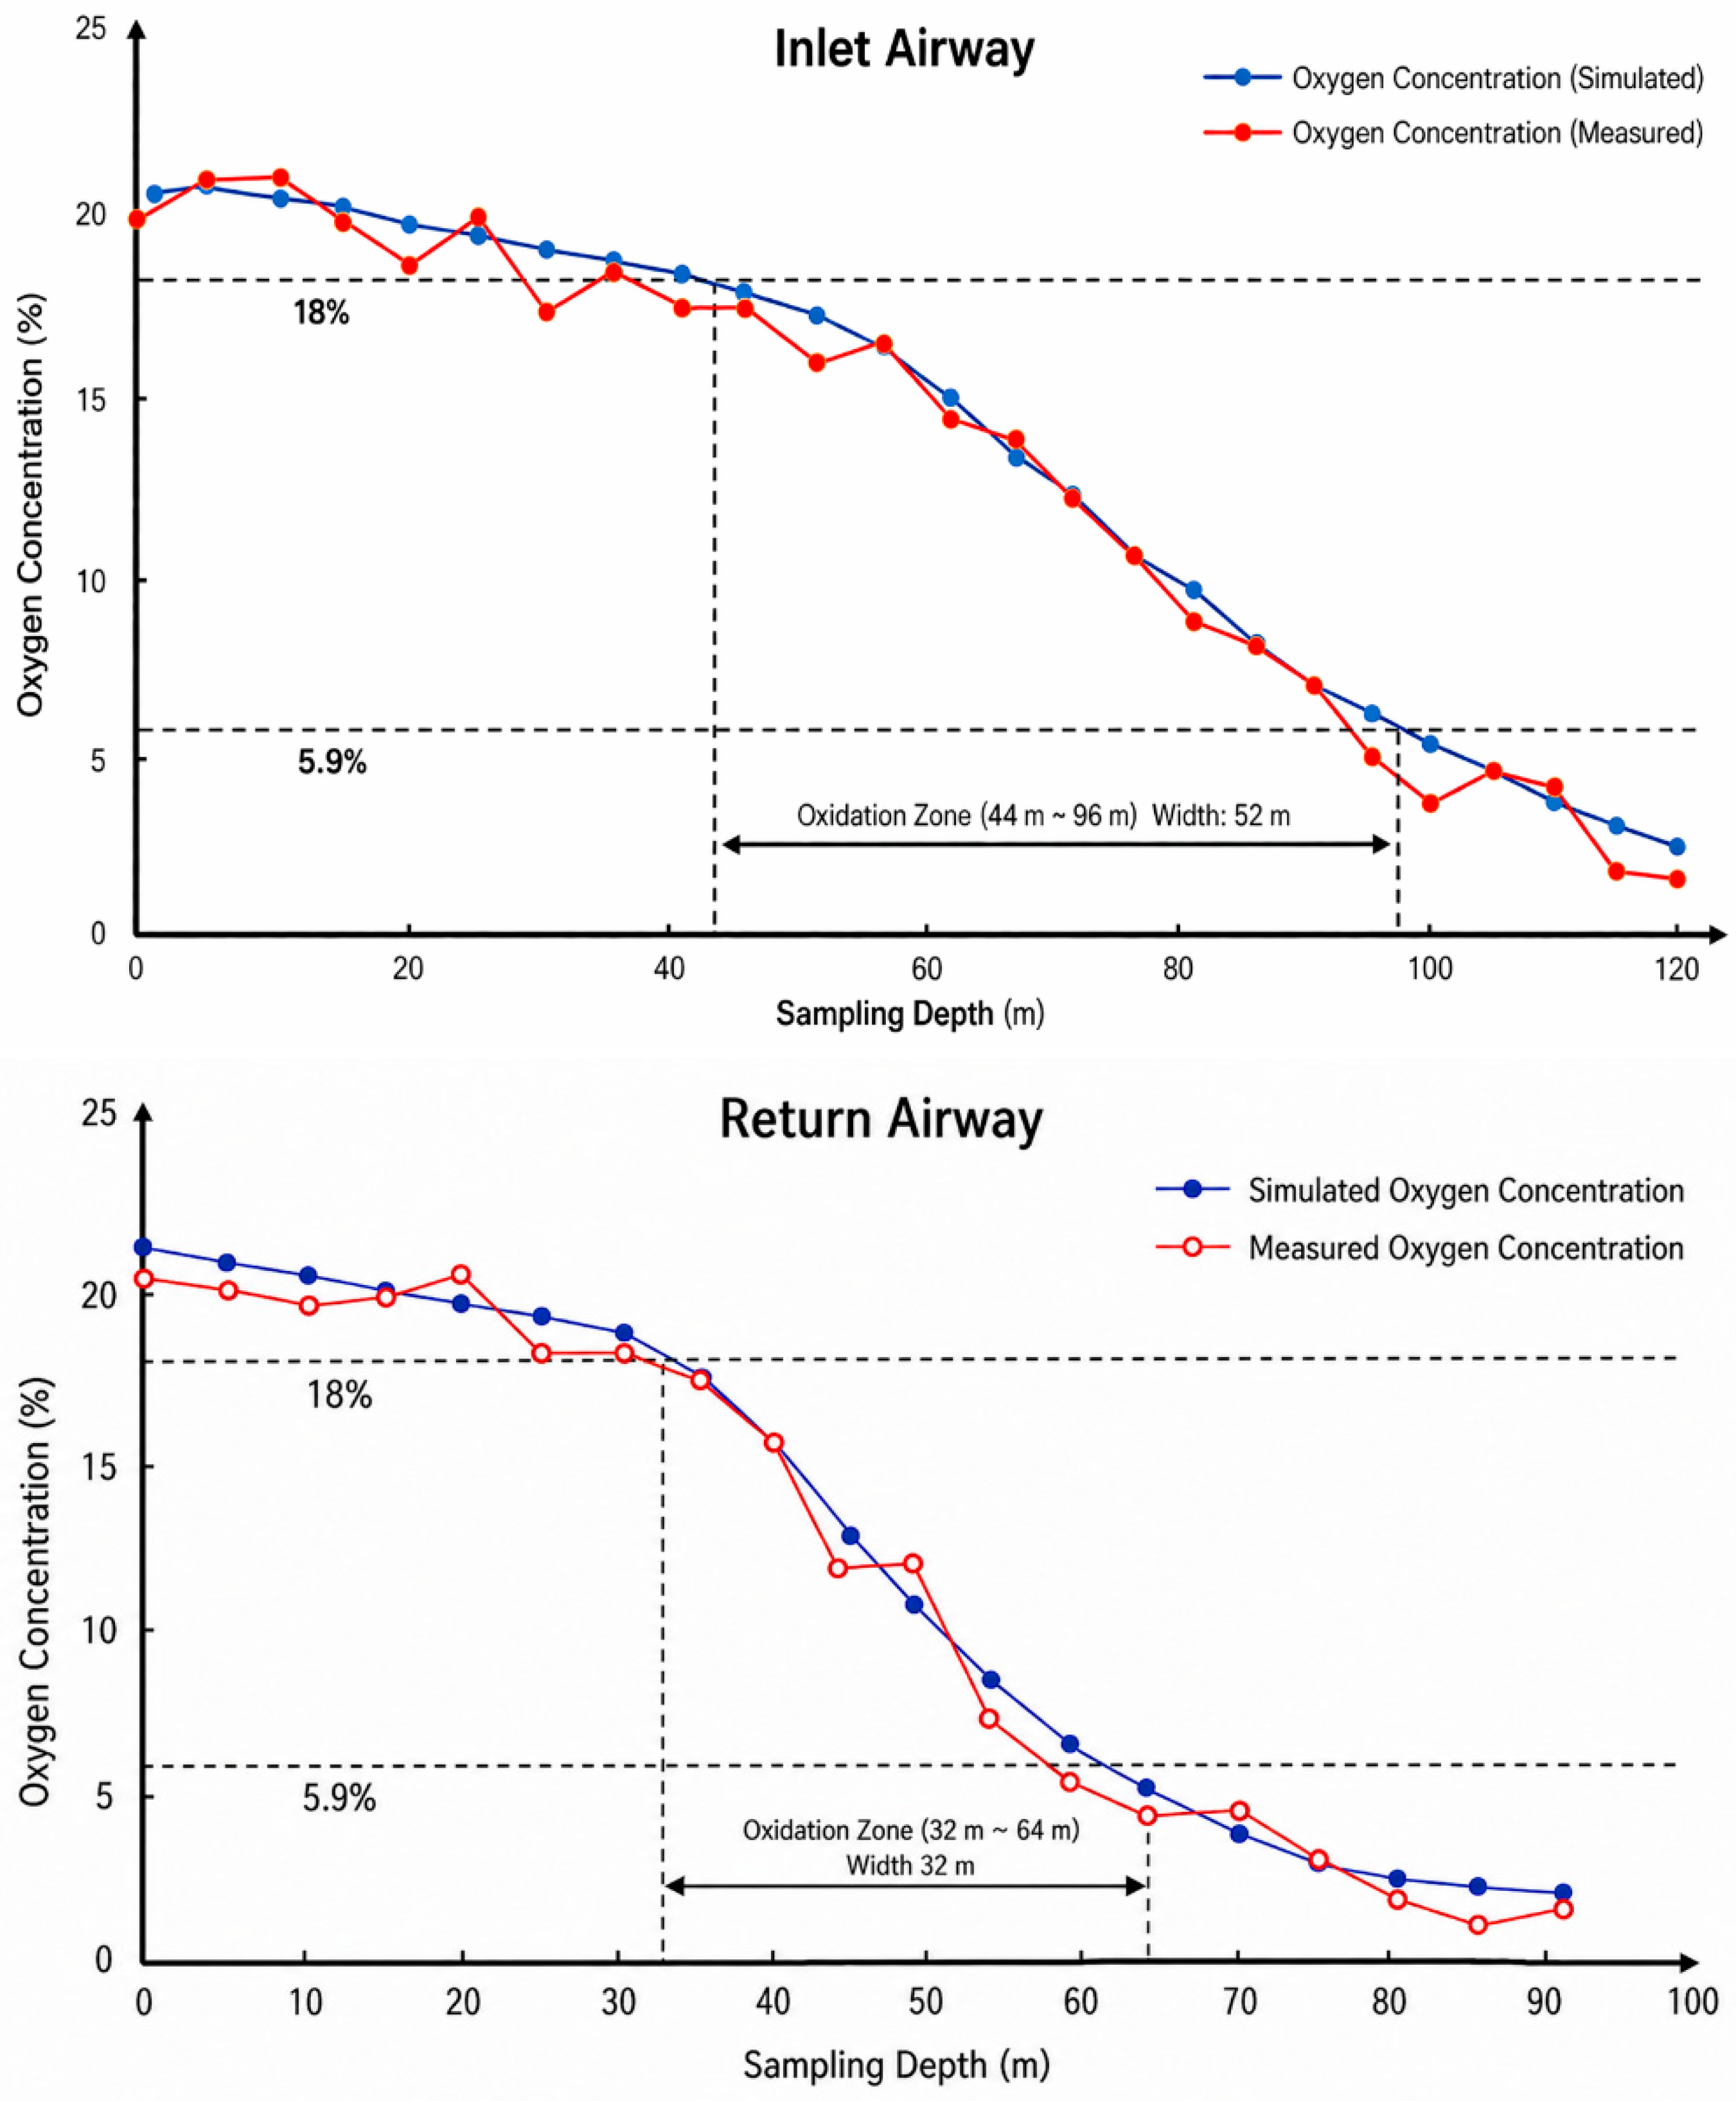
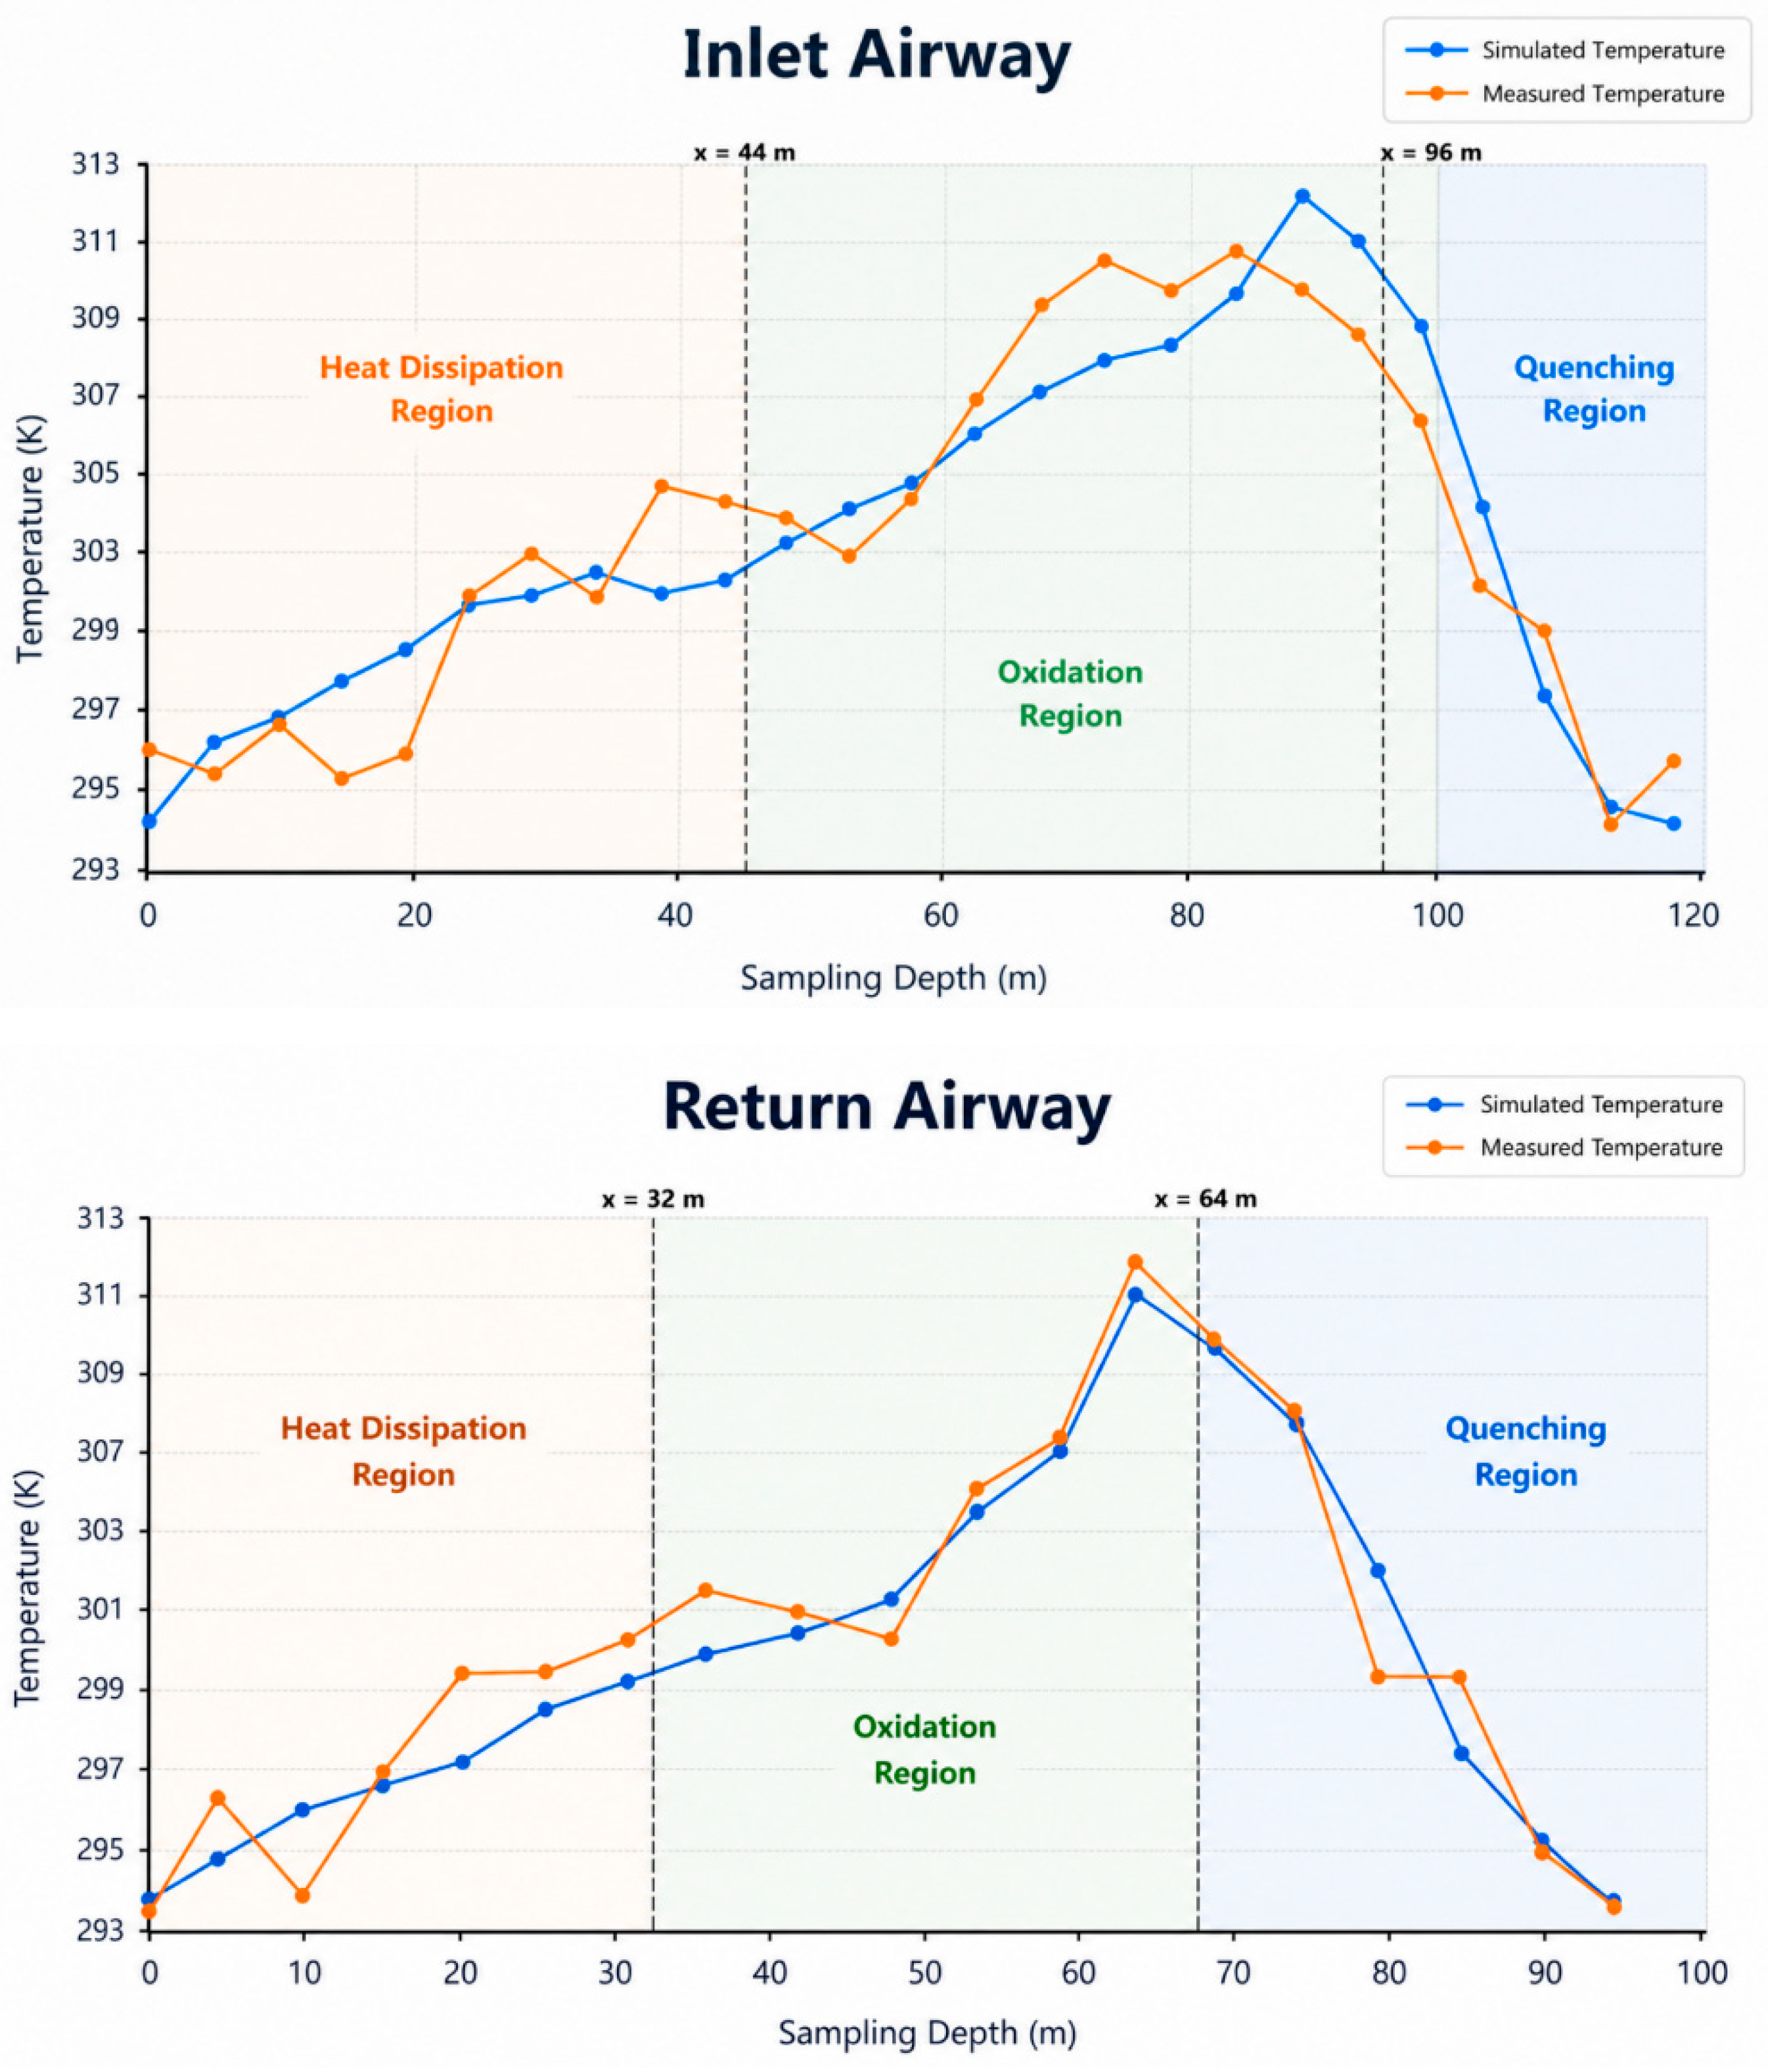
Simulated O2 and temperature profiles are compared with field measurements in Figure 16 and Figure 17, with zone-resolved errors summarized in Table 5. In the oxidation zone—the controlling region for drainage design—relative errors of simulated O2 remain below 4% on both sides. In the heat-dissipation zone, errors rise to 5–7% on the return side, attributable to operational heat sources not represented in the steady-state model and to the inlet-side leakage scatter discussed in Section 4.2. In the asphyxiation zone, errors fall below 2% as diffusive transport dominates.
Figure 16.
Comparison of simulated and measured O2 concentrations on both sides of the goaf.
Figure 17.
Comparison of simulated and measured temperatures on both sides of the goaf.
Table 5.
Comparison of measured and simulated three-zone boundaries for the No. 1217 working face.
The simulated three-zone boundaries reproduce the measured asymmetry quantitatively: the inlet-side oxidation zone (44–96 m, width 52 m) is 6 m deeper than the measured zone (38–92 m, width 54 m) but matches its width within 4%; the return-side simulation (32–64 m, width 32 m) lies within 2 m of the measurement. The baseline upper-corner CH4 of 6.80% matches the field value within 0.3 percentage points. Three independent comparisons—profile shape, zone boundary and upper-corner CH4—thus confirm the model’s predictive validity.
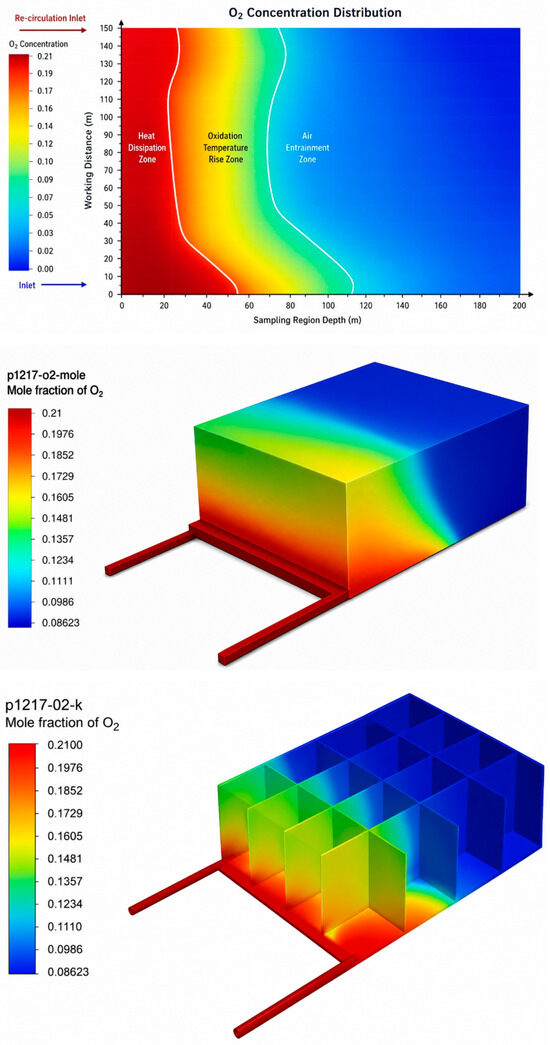
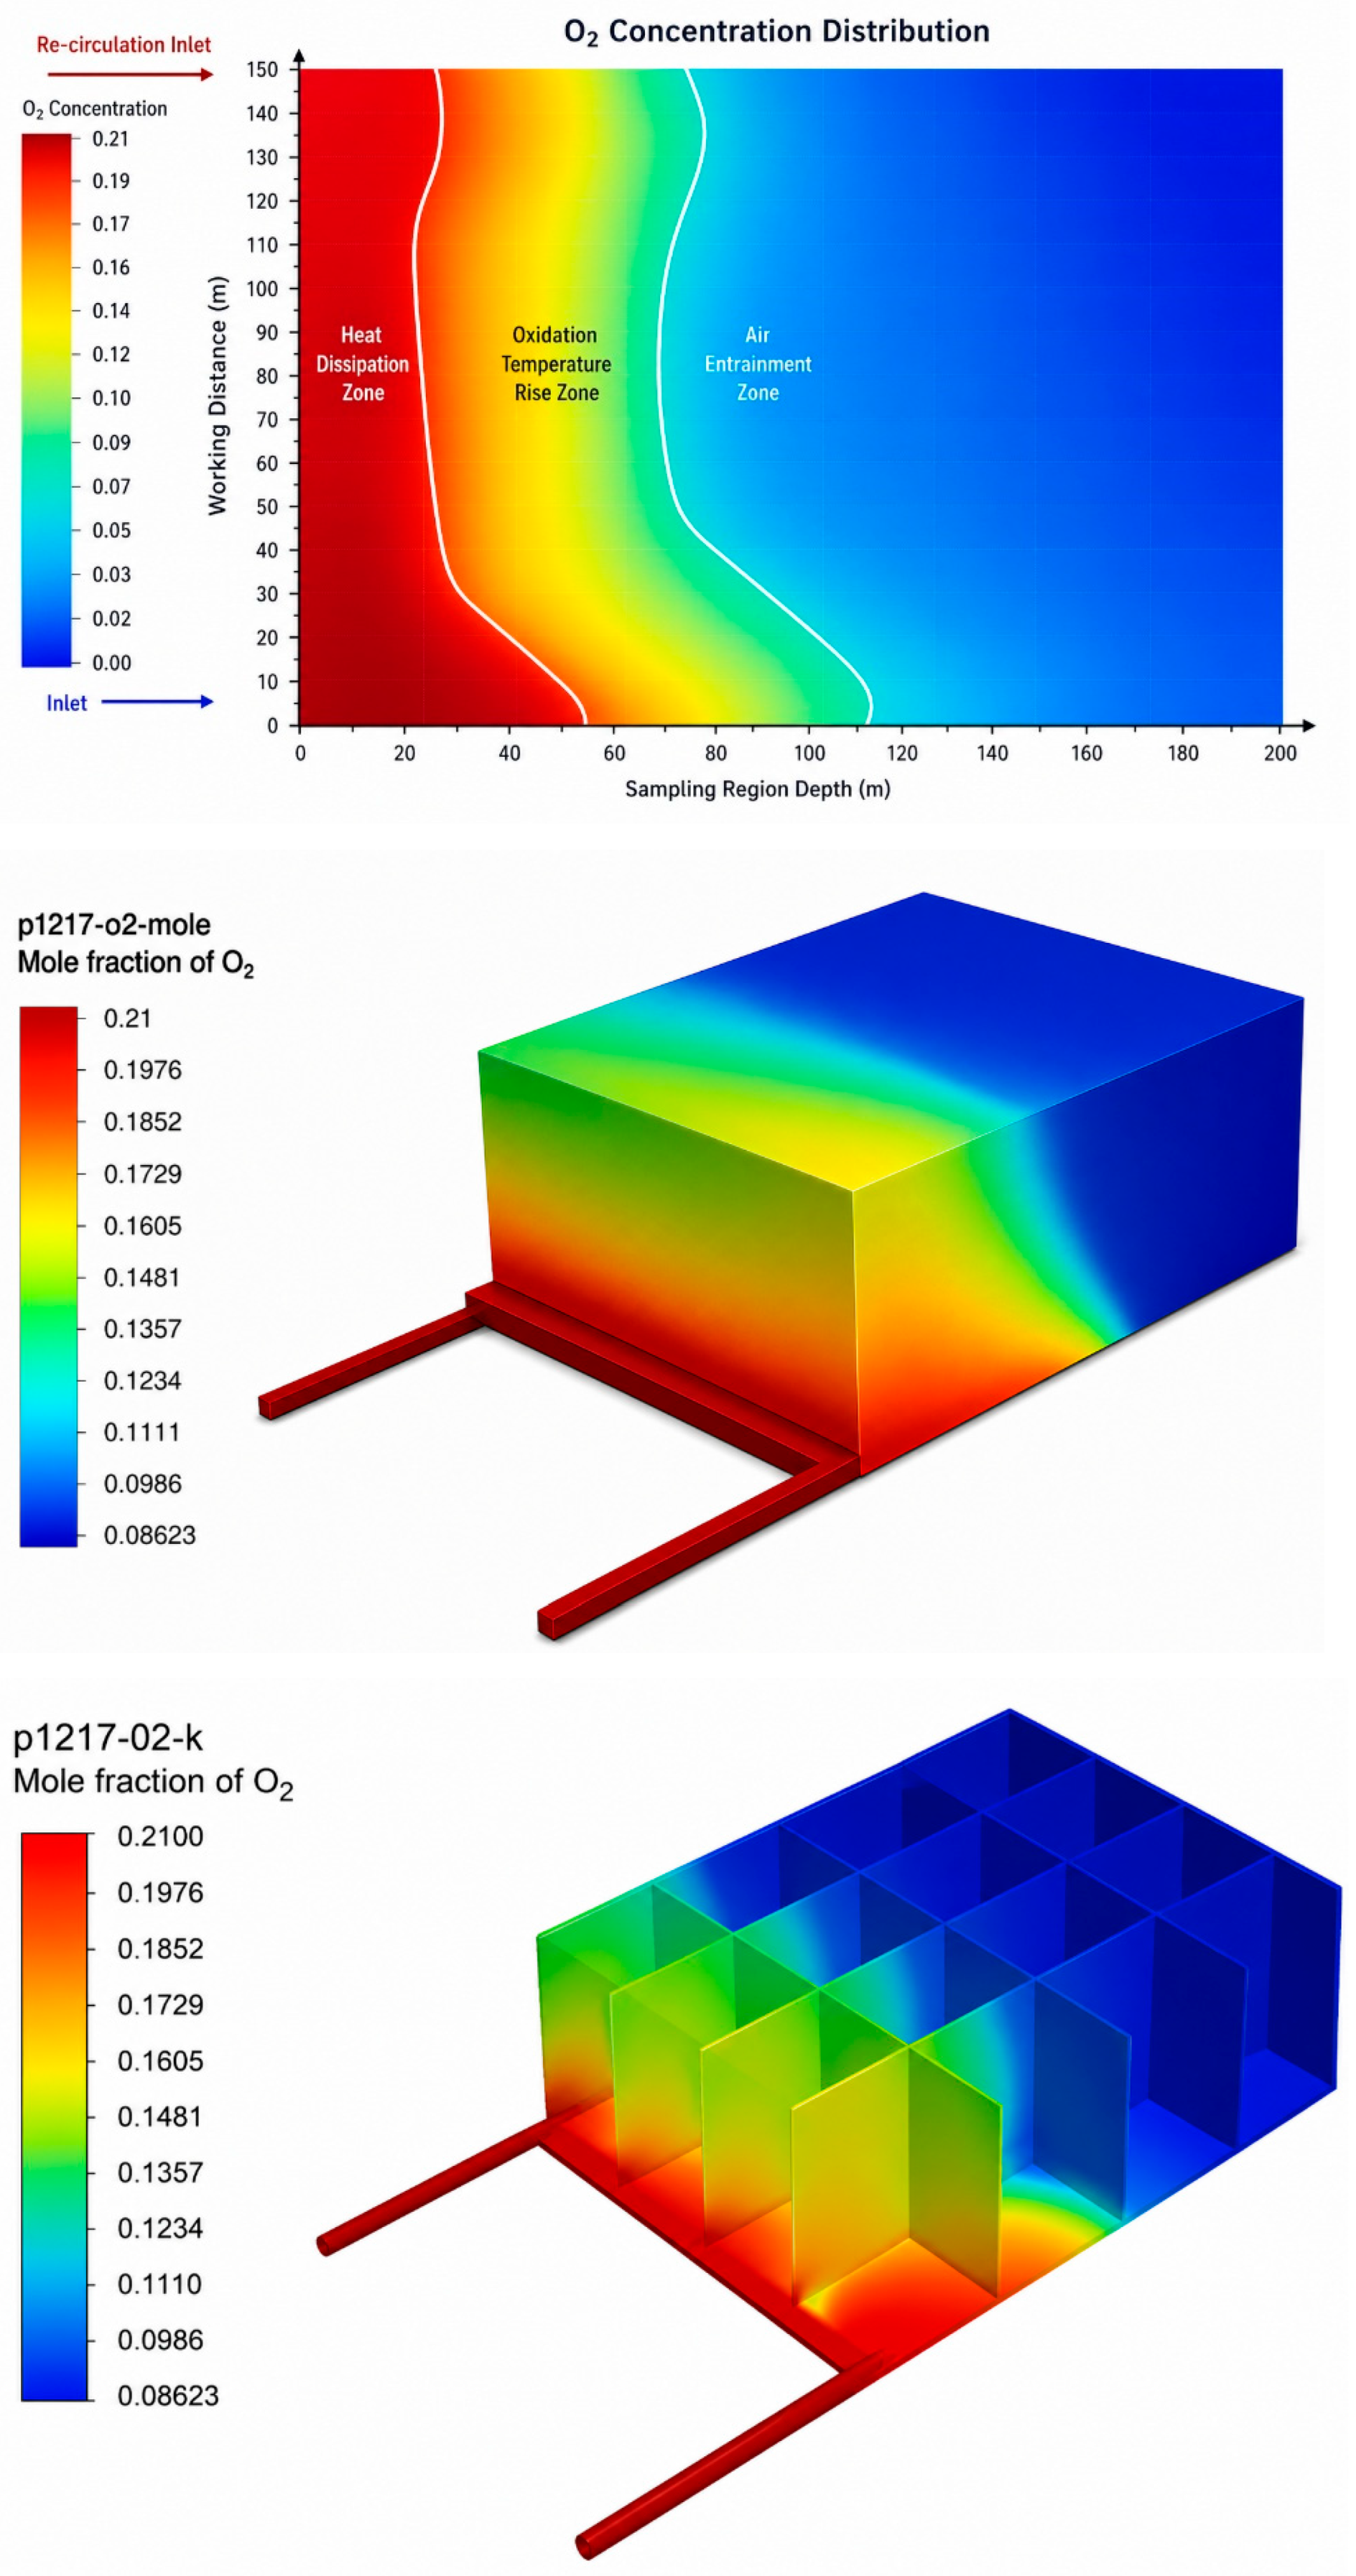
The O2 and temperature contours in Figure 18 and Figure 19 reveal the canonical “O-ring” pattern: a rib-side high-O2 band decaying toward the compacted deep goaf, with an inlet-biased oxidation ring surrounding a low-temperature asphyxiation core—consistent with the porosity field of Equation (4) and serving as the basis for the response-surface analysis of Section 6.5.
Figure 18.
Simulated O2 concentration distribution and three-zone delineation.
Figure 19.
Simulated temperature distribution in the goaf.
The sensitivity of three-zone predictions to the cuboid geometric assumption can be bounded by the present validation results. The simulated O2 and temperature profiles agree with the bundle-tube and optical-fiber measurements with most relative errors below 5%, including in the near-face region (0–35 m from the face) where drainage effects are most pronounced. This level of agreement is achieved without resolving an explicit caved-rock topology, indicating that for the three-zone-scale quantities of interest—oxidation-zone width and upper-corner CH4—the boundary geometry contributes substantially less than the internal heterogeneity field. A fully explicit caved-rock geometry would refine local features but is unlikely to change the panel-scale three-zone partitioning that drives the proposed drainage criterion.
6. Mechanism of Buried-Pipe Gas Drainage in the Three Zones
6.1. Drainage Scenarios
The drainage cases listed in Table 6 were designed by combining three buried-pipe depths of 20, 30 and 50 m (measured from the return-airway end into the goaf) with two negative pressures of 15 and 20 kPa. A no-drainage case was retained as the baseline. All other material, kinetic and ventilation parameters were kept identical to the validated model so that the resulting differences could be attributed directly to the drainage configuration.
Table 6.
Buried-pipe drainage scenarios for the No. 1217 working face.
The parameter window of 20–50 m buried depth and 15–20 kPa negative pressure was selected on engineering rather than statistical grounds. The lower bound of 20 m corresponds to the minimum standard length of the buried drainage pipe used at the site. Depths below this value would place the inlet too close to the working face, where the suction would draw fresh ventilation air directly into the pipe (leakage short-circuit) rather than CH4-rich goaf gas, eliminating the drainage benefit. The upper depth of 50 m approaches the oxidation/asphyxiation transition; beyond this depth, the drainage point disturbs the previously stable seepage in the compacted deep goaf and can paradoxically enlarge the oxidation zone. The pressure range of 15–20 kPa is bounded above by the rated capacity of the existing surface drainage station and below by the minimum suction needed to overcome airway-to-pipe resistance under the 1116 m3/min face ventilation rate. Scenarios outside this window were therefore considered neither operationally accessible nor physically informative for the present design problem.
6.2. Influence of Drainage Activation on Three-Zone Distribution
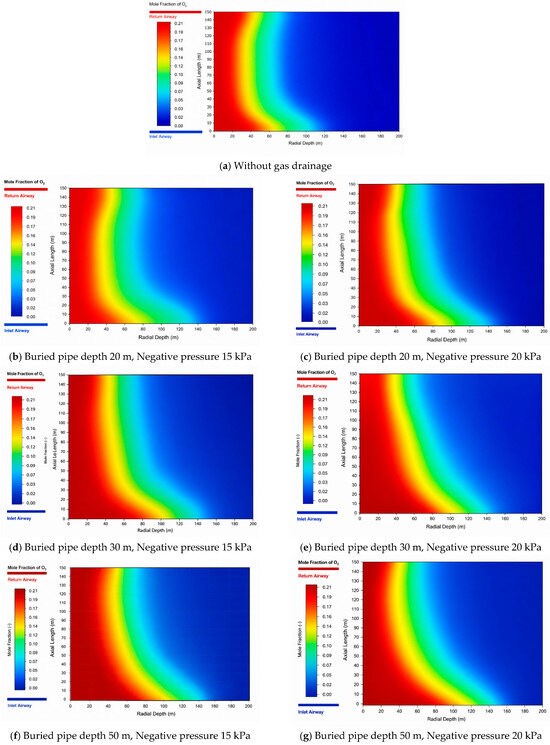
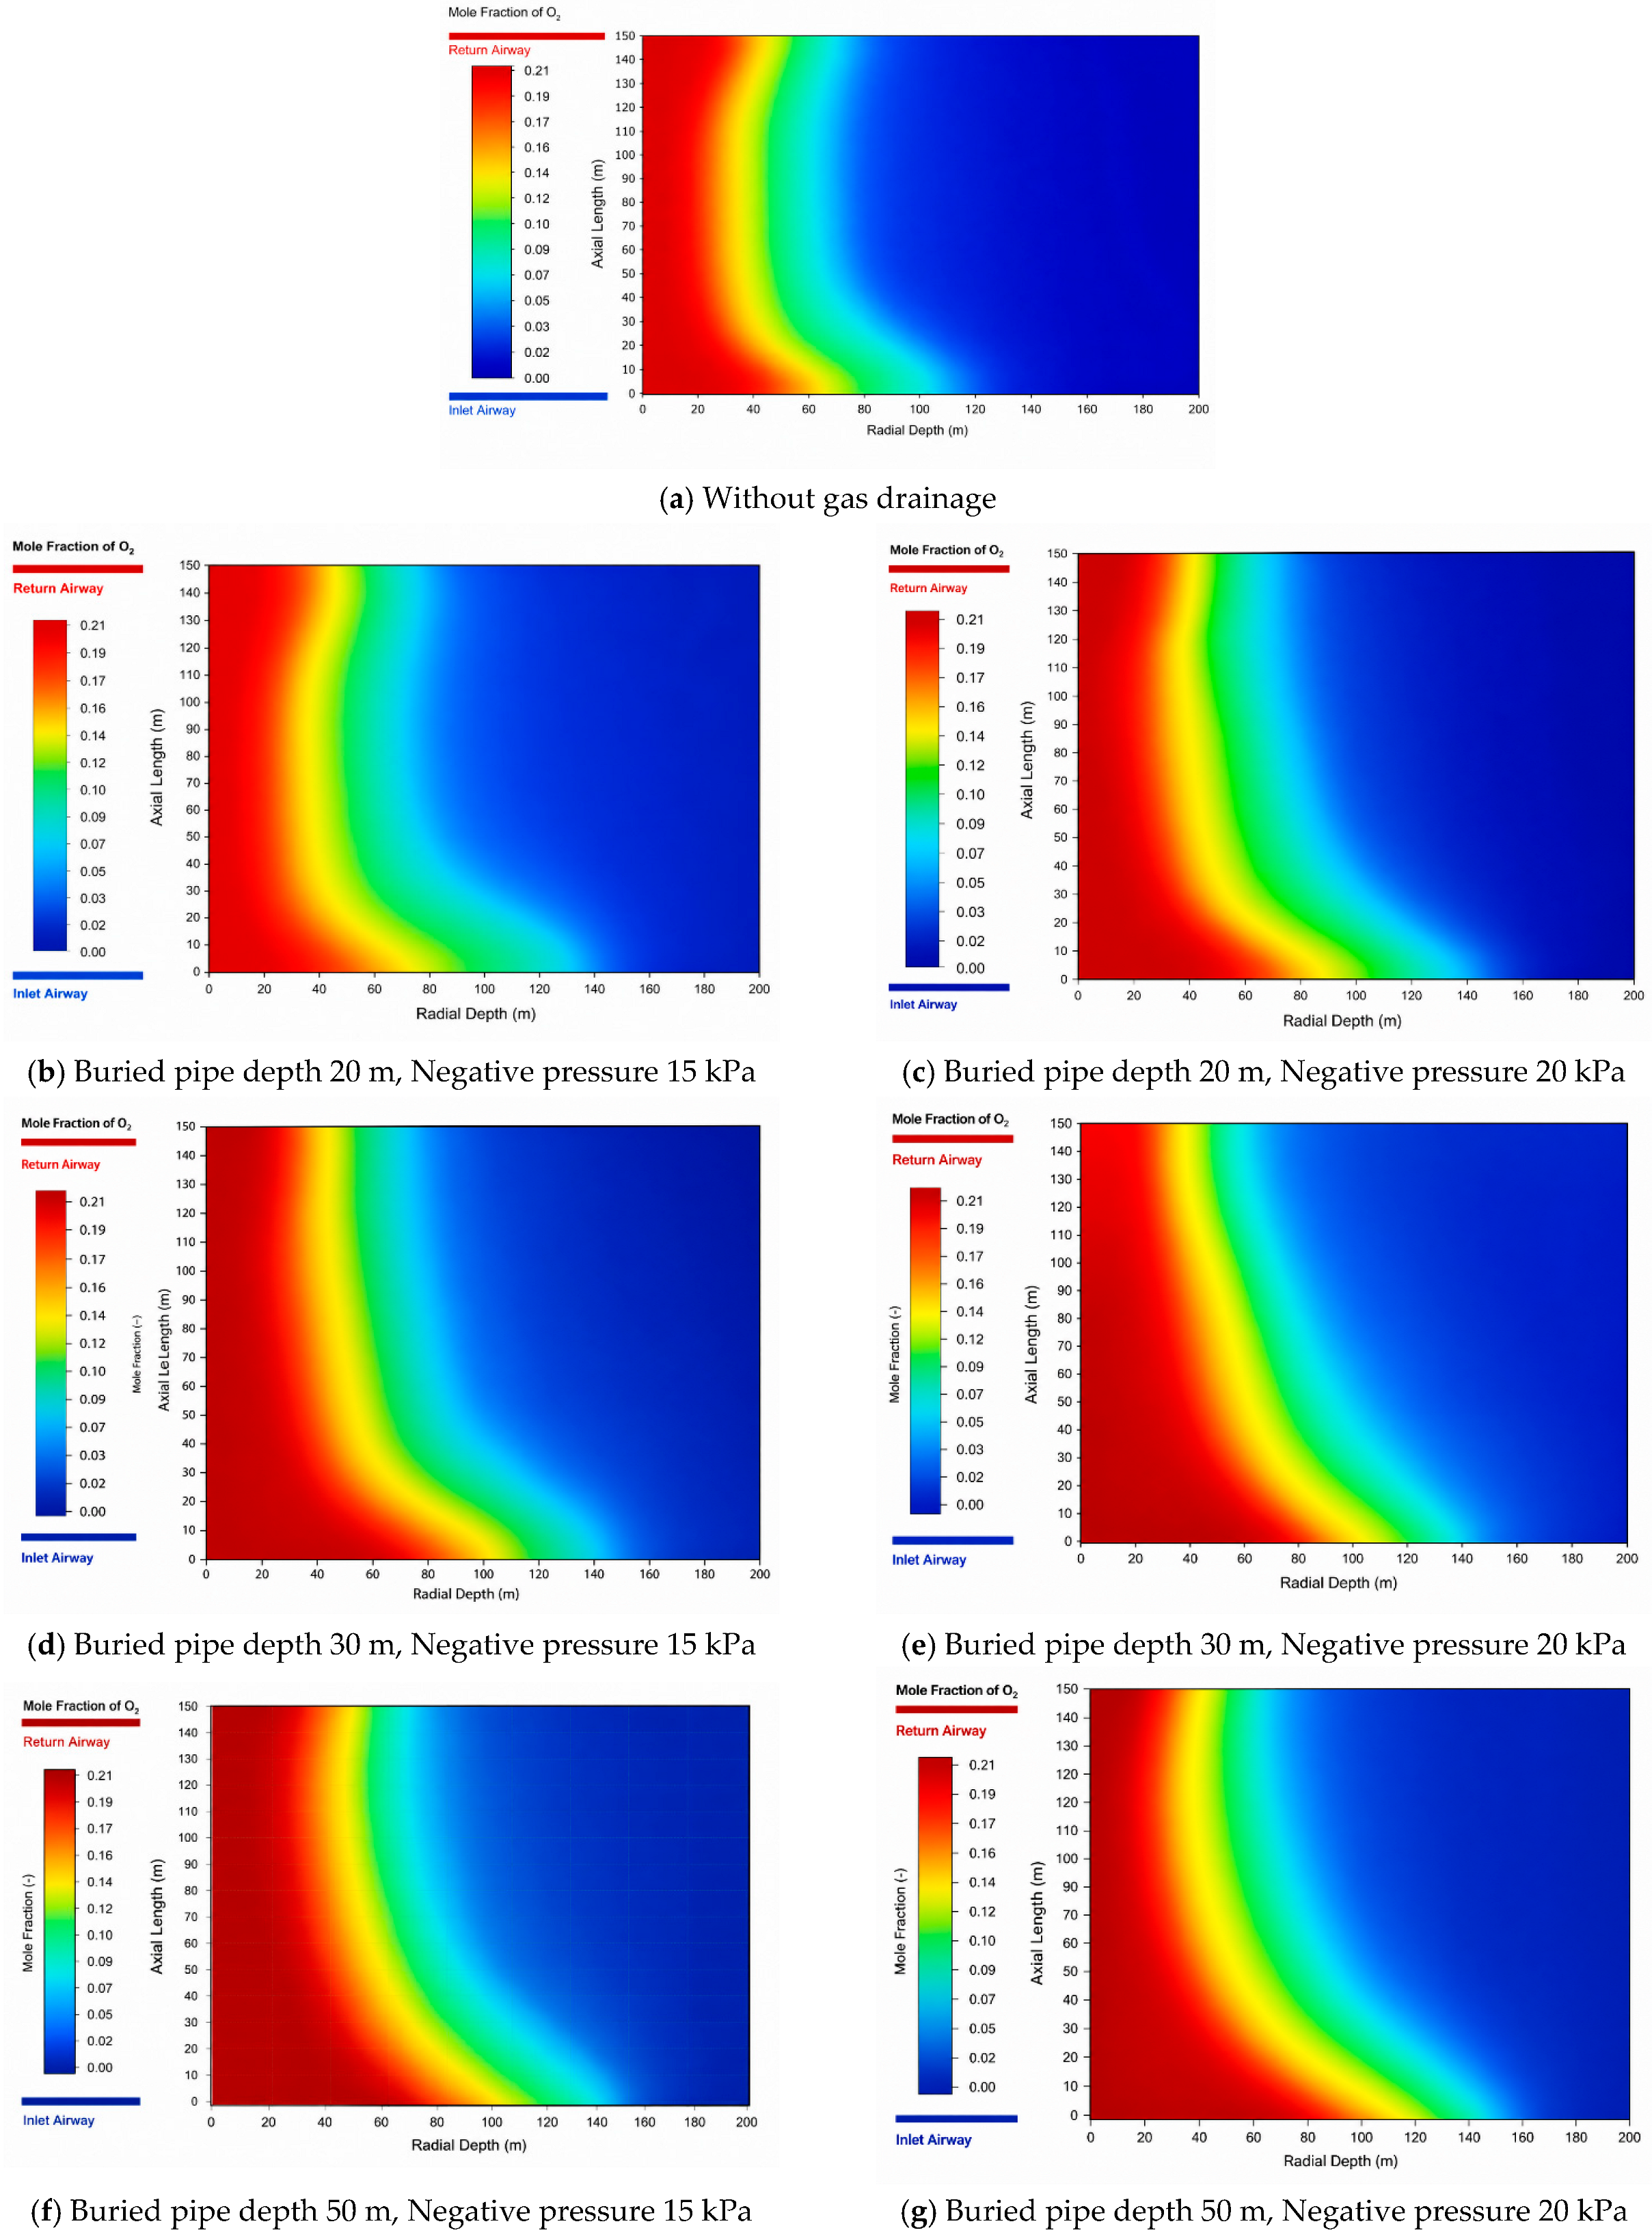
Activating buried-pipe drainage reorganizes the three-zone distribution in an asymmetric manner, as shown by Figure 20 and Table 7. In the no-drainage baseline, the inlet-side oxidation zone extends over 44–96 m (width: 52 m), the return-side oxidation zone extends over 32–64 m (width: 32 m), and the upper-corner CH4 concentration reaches 6.80%. Once drainage is activated, the return-side oxidation zone is compressed in all six cases, with widths ranging from 21 to 31 m, and the upper-corner CH4 concentration decreases to 0.58–3.14%. The response on the inlet side is opposite: the oxidation-zone start migrates from 44 m in the baseline to 55–62 m under drainage, and the inlet-side width increases to 57–63 m. These data demonstrate that drainage improves methane control and reduces return-side oxidation-zone exposure, but it also strengthens oxygen-bearing leakage toward the inlet side. This asymmetric trade-off is the core mechanism that must be considered in drainage design.
Figure 20.
Simulated O2 concentration contours under different drainage scenarios for the No. 1217 working face.
Table 7.
Simulated three-zone parameters and upper-corner methane concentration for the No. 1217 working face under different drainage scenarios.
6.3. Effect of Buried Depth
The effect of buried depth is supported quantitatively by the scenario results in Table 7. At a negative pressure of 15 kPa, increasing the buried depth from 20 to 30 m shifts the return-side oxidation zone from 30–60 m to 25–49 m and reduces its width from 30 to 24 m; the upper-corner CH4 concentration simultaneously decreases from 3.14% to 0.75%. However, when the depth is further increased to 50 m, the return-side oxidation zone expands again to the range of 25–56 m, with a width of 31 m and an upper-corner CH4 concentration of 1.55%. The same non-monotonic pattern is observed at 20 kPa: the return-side width decreases from 28 m at 20 m depth to 21 m at 30 m depth, but rebounds to 29 m at 50 m depth. These data indicate that buried depth does not produce a simple monotonic improvement. Instead, the drainage inlet is most effective when it is positioned near the oxidation/asphyxiation transition, where suction can both extract accumulated methane and cut off the inward oxygen flux before the flow enters a compacted, low-permeability region.
6.4. Effect of Negative Pressure
Negative pressure mainly controls the intensity of the suction field, and its influence is also evident from Table 7. At a buried depth of 20 m, increasing the negative pressure from 15 to 20 kPa reduces the return-side oxidation-zone width from 30 to 28 m and lowers the upper-corner CH4 concentration from 3.14% to 2.33%. At 30 m depth, the same pressure increase compresses the return-side oxidation zone from 25–49 m to 22–43 m, reducing its width from 24 to 21 m, while CH4 decreases from 0.75% to 0.58%. At 50 m depth, the return-side width decreases from 31 to 29 m and CH4 from 1.55% to 1.22%. Thus, stronger negative pressure consistently improves methane removal and compresses the return-side oxidation zone. The cost is that the inlet-side oxidation zone also moves deeper and widens, for example from 58–116 m to 60–121 m at 30 m depth, confirming that negative pressure is an effective but non-neutral control variable.
6.5. Joint Response of Buried Depth and Negative Pressure
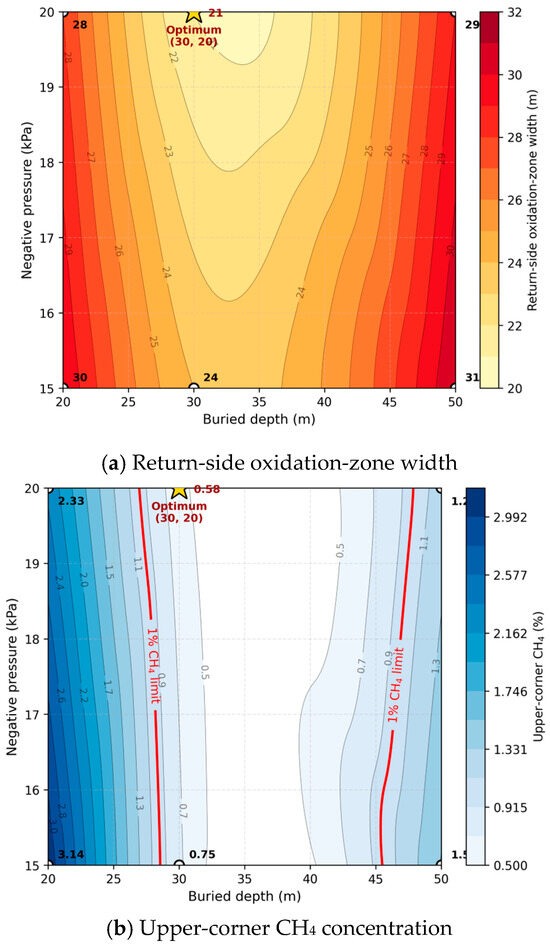
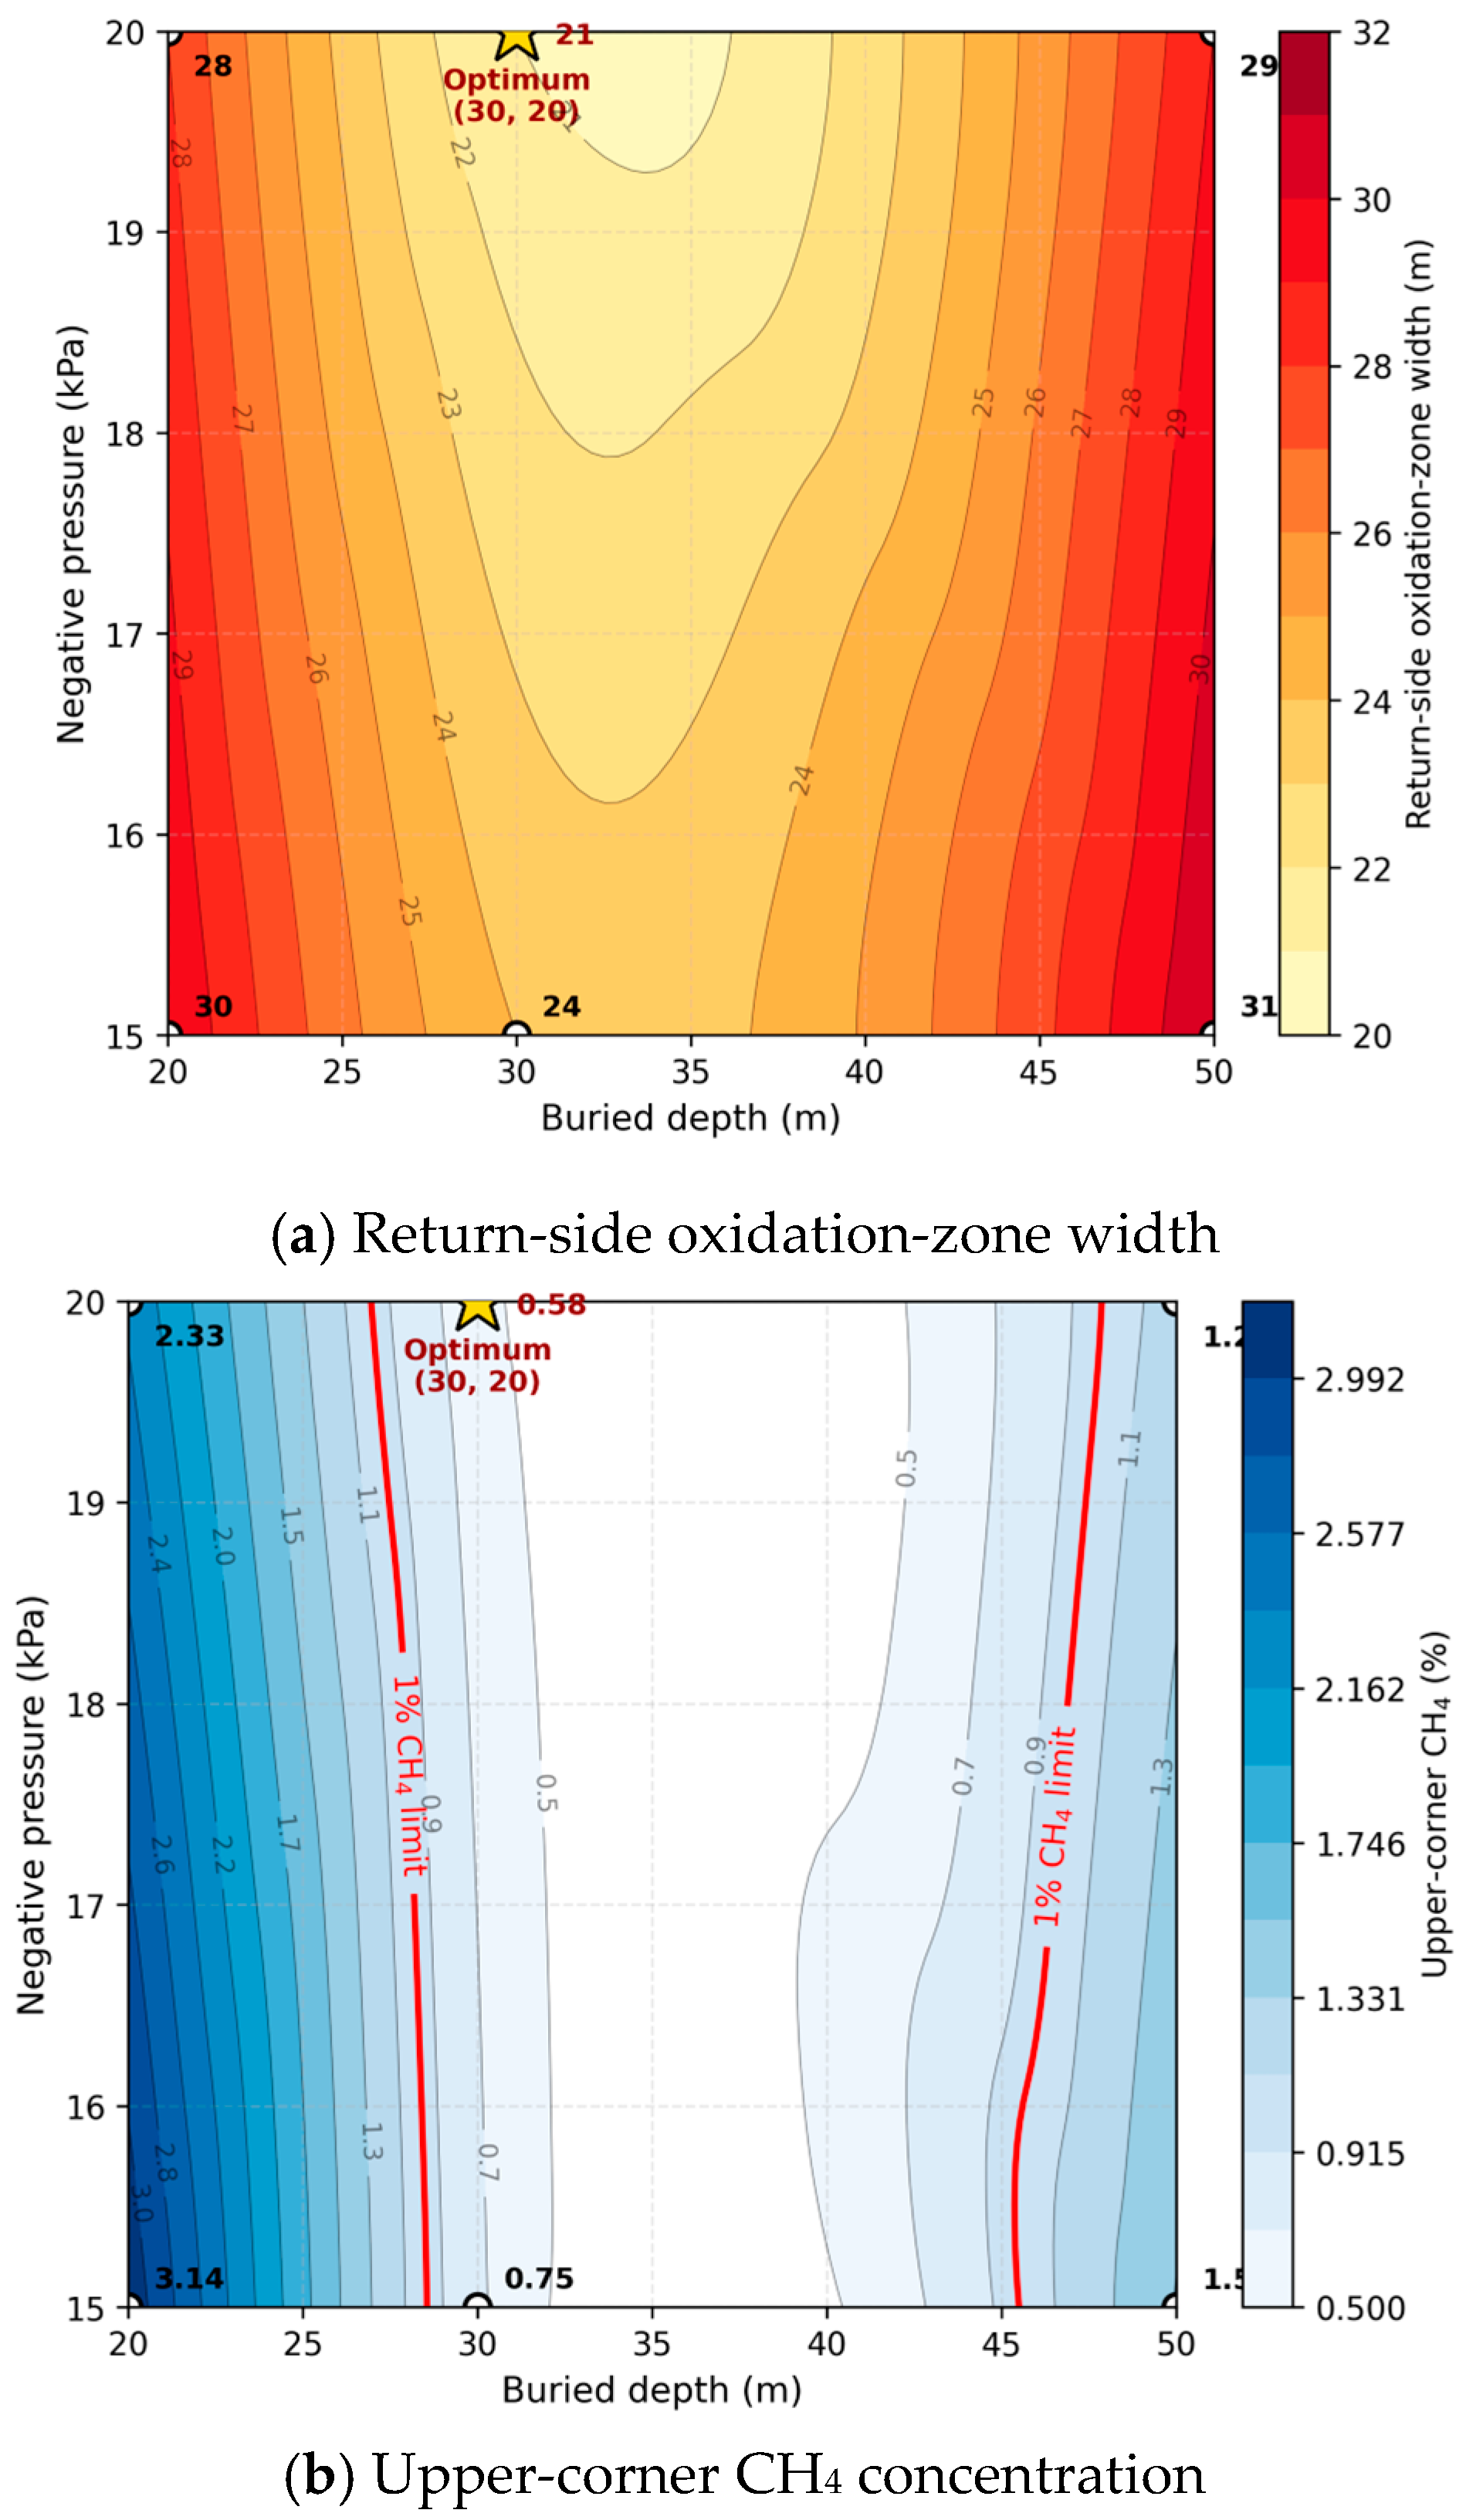
To complement the single-parameter analyses in Section 6.3 and Section 6.4, the six scenario results in Table 7 are presented as response surfaces in Figure 21, showing the return-side oxidation-zone width and the upper-corner CH4 concentration as joint functions of buried depth and negative pressure.
Figure 21.
Response surfaces of oxidation-zone width and upper-corner CH4 versus buried depth and negative pressure.
The surfaces reveal a clear depth–pressure interaction. The oxidation-zone width is non-monotonic in depth, tracing a V-shape with a minimum near 30 m, but monotonic in pressure. Moreover, the pressure effect is amplified at the optimal depth: raising the pressure from 15 to 20 kPa reduces the width by 12.5% at 30 m, but only by 6.7% and 6.5% at 20 m and 50 m, respectively—the two parameters are therefore not additive. In Figure 21b, the 1% CH4 feasible region spans approximately 28–45 m at 20 kPa but narrows to 30–40 m at 15 kPa. The preferred configuration (30 m, 20 kPa) thus occupies the unique location where the oxidation-zone valley and the methane-feasible region intersect, which is the visual expression of the dual-objective drainage criterion.
6.6. Identification of the Optimal Drainage Parameter Pair
The preferred configuration was identified using two explicit criteria: the return-side oxidation-zone width should be minimized, and the upper-corner CH4 concentration should remain below 1%. According to Table 7, only Scenarios 3 and 4 satisfy the methane criterion, with CH4 concentrations of 0.75% and 0.58%, respectively. Among them, Scenario 4, corresponding to a buried depth of 30 m and a negative pressure of 20 kPa, gives the narrowest return-side oxidation zone, 22–43 m, with a width of 21 m. Although the buried-pipe inlet at 30 m lies within this oxidation zone, the local suction reduces the O2 flux into the deep goaf and shortens the residence time, which together produce the smallest return-side oxidation footprint among the six scenarios. Compared with the no-drainage baseline, this configuration reduces the return-side width from 32 to 21 m, a decrease of 34.4%, and lowers CH4 from 6.80% to 0.58%. Although the inlet-side oxidation zone widens from 52 to 61 m, the return-side fire-risk reduction and methane-control effect are jointly superior to the other tested cases. The optimum therefore follows from the tabulated scenario comparison rather than from a qualitative judgement alone.
7. Discussion
The results show that drainage control is not a single-objective methane-removal problem, but a coupled regulation problem involving leakage flow, oxygen residence time and heat release. The observed asymmetry can be interpreted as the superposition of the natural ventilation leakage field and the drainage-induced suction field within a heterogeneous porous medium. On the inlet side, the two fields are broadly aligned; therefore, drainage strengthens oxygen transport into the goaf and pushes the oxidation zone deeper. On the return side, the suction field shortens the oxygen residence time near the pipe inlet and increases evacuation efficiency, thereby compressing the oxidation zone. This explains why the same drainage parameter can simultaneously reduce upper-corner methane and redistribute the spontaneous-combustion hazard. Consequently, methane concentration alone is not a sufficient optimization target; the oxidation-zone width and its migration direction must be evaluated together with gas-control performance.
For field implementation, the most important implication is that the buried-pipe inlet should be positioned according to the three-zone structure rather than according to installation convenience alone. The scenario comparison indicates that an intermediate depth of 30 m provides better coordination than either 20 m or 50 m, because it places the suction action near the oxidation/asphyxiation transition while avoiding excessive disturbance in the compacted deep goaf. Negative pressure should also be treated as a bounded control variable. Increasing pressure from 15 to 20 kPa improves methane control in all tested cases, but it also expands the inlet-side oxidation zone; therefore, further pressure increases should be accompanied by field verification rather than assumed to be beneficial. In practice, drainage optimization should combine upper-corner CH4 monitoring with CO, C2H4 and C2H2 tracking, so that the gas-control benefit and the spontaneous-combustion risk can be assessed in the same operational framework.
The widening of the inlet-side oxidation zone is a genuine consequence of the drainage criterion and must be addressed by complementary controls. The most direct measure is co-deployment with goaf nitrogen injection, which the No. 1217 panel already operates under a four-stage program covering normal advance, slow-advance preventive injection, active injection upon detection of CO/C2H2/C2H4, and end-of-panel sealing. The design targets an inert oxygen concentration below 7% using a nitrogen flow of 486 m3/h at 97% purity, delivered by a QTD2000/97 system.
Because nitrogen acts on the oxygen-supply term of Equation (3) rather than on the leakage geometry, it suppresses inlet-side oxidation even when drainage has widened the inlet-side oxidation zone, effectively decoupling the dual-objective drainage optimization from the inlet-side fire-prevention requirement. This is reinforced by densified CO/C2H4 monitoring and optical-fiber sensing extended to 55–62 m on the inlet side, together with rib-side spray sealants that reduce the oxygen flux feeding the leakage band described by Equation (4).
The interpretation should nevertheless be bounded by the assumptions of the present model. The goaf is represented as a quasi-steady porous medium, so the transient advance of the working face, time-dependent compaction and local collapse-induced permeability changes are not fully resolved. The oxidation kinetics are also expressed through an effective single-step Arrhenius formulation, which is appropriate for engineering-scale simulation but cannot distinguish physical adsorption, chemical adsorption and functional-group decomposition. In addition, the parameter space is limited to field-feasible buried depths and negative pressures; the response beyond this range may not remain linear.
Beyond the six tested scenarios, the robustness of the 30 m/20 kPa recommendation can be bounded by physical reasoning rather than additional simulations. The V-shaped depth dependence and the monotonic pressure dependence shown in Figure 21 are structural features of the underlying mechanism—the spatial alignment between the suction inlet and the oxidation/asphyxiation transition, and the magnitude of the superposed suction field—rather than artefacts of the specific operating values, so the qualitative shape of the response surfaces is expected to persist across moderate variations in the face advance rate and ventilation supply. The position of the oxidation-zone width minimum, however, is tied to the depth of the oxidation/asphyxiation transition, which migrates with the advance rate (a faster advance shortens the residence time and shifts the transition deeper) and with ventilation supply (higher airflow shifts it deeper through enhanced leakage). For a panel operating substantially away from the present 1116 m3/min ventilation rate or the 60 m/month preventive-injection threshold, the optimum depth should therefore be re-located along the 18%/8% O2 boundaries identified by in situ monitoring before the 30 m value is adopted directly. The 20 kPa pressure recommendation is more transferable because it sits at the rated capacity of the surface drainage station and exerts a monotonic effect across the depth range.
Validation status and planned post-implementation verification. The 30 m/20 kPa recommendation is a model-based prediction. The CFD model is validated against the no-drainage baseline three-zone structure with zone-resolved relative errors below 5% on both sides (Section 5.5, Figure 16 and Figure 17), and the additional physics introduced by buried-pipe drainage—a localized outflow sink superimposed on an already-validated porous-medium seepage field—is a standard CFD construction that introduces no new fitting parameters. The drainage predictions therefore inherit the validation of the baseline model rather than relying on free assumptions. Direct verification by bundle-tube and optical-fiber re-survey of the No. 1217 panel under the proposed configuration is scheduled for the next mining cycle and constitutes the natural next step.
Applicability to other coal types and geological settings. The 30 m/20 kPa recommendation is specific to the No. 1217 panel. Three factors limit direct transfer: the kinetic parameters (Ea = 41.2–65.4 kJ mol−1, critical O2 = 5.9%) reflect the No. 2 Shanxi-Formation coal and shift with coal rank; the goaf porosity field depends on the immediate-roof bulking factor; and the 1116 m3 min−1 U-type ventilation fixes the leakage-flow magnitude. What transfers across mines is the design logic rather than the numerical optimum: the buried-pipe inlet should be positioned at the in situ oxidation/asphyxiation transition identified by the workflow proposed here (programmed temperature-rise testing, bundle-tube/optical-fiber mapping, CFD response-surface analysis bounded by the 18%/8% O2 thresholds), not at a fixed depth.
Future work should therefore couple moving-boundary goaf evolution with multi-step oxidation kinetics and apply multi-objective optimization to a broader parameter space, ideally supported by continuous field monitoring after drainage-parameter adjustment.
8. Conclusions
This study developed a coupled laboratory-field numerical framework to clarify how buried-pipe gas drainage reshapes the three zones of spontaneous combustion in a longwall goaf. The main conclusions are as follows.
- (1)
- Programmed temperature-rise experiments show that the apparent activation energy of the No. 2 coal decreases from 65.4 kJ mol−1 at 3% O2 to 41.2 kJ mol−1 at 21% O2. A critical oxygen concentration of 5.9% was identified, and CO, C2H4 and C2H2 were confirmed as staged indicator gases for early, intermediate and advanced self-heating.
- (2)
- Field monitoring delineated asymmetric three-zone boundaries in the goaf. The inlet-side oxidation zone is wider and extends farther behind the working face than the return-side oxidation zone, reflecting stronger oxygen-bearing leakage on the inlet side. The validated CFD model reproduced the measured oxygen and temperature fields with most errors below 5%.
- (3)
- Buried-pipe drainage produces a dual effect: it compresses the return-side oxidation zone and reduces upper-corner methane concentration, but simultaneously drives oxygen deeper along the inlet side and enlarges the inlet-side oxidation zone. This asymmetric response is controlled by the superposition of the ventilation leakage field and the drainage suction field.
- (4)
- Buried depth and negative pressure regulate different aspects of the response. Depth determines the spatial alignment between the pipe inlet and the oxidation/asphyxiation transition, whereas negative pressure determines the strength of the suction field. Their combined action, rather than either parameter alone, controls the compatibility between methane control and spontaneous-combustion prevention.
- (5)
- The preferred configuration in the investigated parameter space is a buried depth of 30 m and a negative pressure of 20 kPa. This scheme reduces the return-side oxidation-zone width from 32 to 21 m and lowers the upper-corner methane concentration to 0.58%, providing a practical parameter set for the No. 1217 working face and a transferable optimization criterion for similar gas-rich longwall panels.
Author Contributions
J.W.: Conceptualization, Methodology, Investigation. S.Z.: Supervision, Writing—review and editing. X.Y.: Review and editing, Software, Validation, Data curation. Y.H.: Data curation. C.H.: Funding acquisition; L.C.: Field work. All authors have read and agreed to the published version of the manuscript.
Funding
This research was funded by National Natural Science Foundation of China: Mechanism of Continuous Synergistic Effect of Combined Oxygen Shielding for Coal Spontaneous Combustion Prevention Based on Gastric Acid Resistance Bionics (No. 52474243).
Data Availability Statement
The original contributions presented in this study are included in the article. Further inquiries can be directed to the corresponding author.
Conflicts of Interest
Author Junqi Wang was employed by the company Shanxi Fenxi Mining Industry Group Co., Ltd. The remaining authors declare that the research was conducted in the absence of any commercial or financial relationships that could be construed as a potential conflict of interest.
References
- Deng, J.; Xiao, Y.; Lu, J.H.; Wen, H.; Jin, Y.F. Application of composite fly ash gel to extinguish outcrop coal fires in China. Nat. Hazards 2021, 106, 2387–2408. [Google Scholar] [CrossRef] [Scilit]
- Fan, L.; Meng, X.; Zhao, J.; Zhou, Y.; Chu, R. Reaction site evolution during low-temperature oxidation of low-rank coal. Fuel 2022, 310, 122363. [Google Scholar] [CrossRef] [Scilit]
- Onifade, M.; Genc, B. A review of research on spontaneous combustion of coal. Int. J. Min. Sci. Technol. 2020, 30, 303–311. [Google Scholar] [CrossRef] [Scilit]
- Wang, K.; Ding, J.Y.; Shi, J.L.; Deng, J.; Huang, H. Multi-Scale Characteristics of Coal Secondary Spontaneous Combustion Under Different Pre-Heating Oxygen Concentrations by TG and FTIR Analysis. Combust. Sci. Technol. 2023, 196, 4982–4997. [Google Scholar] [CrossRef] [Scilit]
- Li, L.; Qin, B.T.; Liu, J.S.; Leong, Y.K.; Li, W. Numerical study on effects of air leakage and the limit airflow rate on coal spontaneous combustion in a deep goaf. Process Saf. Environ. Prot. 2021, 1526, 405–416. [Google Scholar] [CrossRef] [Scilit]
- Qiao, M.; Ren, D.; Roberts, J.; Liu, H.W.; Yang, X.H.; Tan, L.H.; Wu, J.M. Improved computational fluid dynamics modelling of coal spontaneous combustion control and gas management. Fuel 2022, 324, 124456. [Google Scholar] [CrossRef] [Scilit]
- Yang, S.Q.; Hu, X.C.; Liu, W.V.; Cai, J.W.; Zhou, X.H. Spontaneous combustion influenced by surface methane drainage and its prediction by rescaled range analysis. Int. J. Min. Sci. Technol. 2018, 28, 215–221. [Google Scholar] [CrossRef] [Scilit]
- Vikram, M.; Bhattacharjee, R.M.; Paul, P.S. Determination of spontaneous combustion propensity and ignition time of Indian coal using adiabatic oxidation method. Fuel 2025, 388, 134569. [Google Scholar] [CrossRef] [Scilit]
- Li, L.; Ren, T.; Zhong, X.X.; Wang, J.T. Study of ambient temperature oxidation in low metamorphic coal and the oxidation mechanism. Energy 2022, 252, 124039. [Google Scholar] [CrossRef] [Scilit]
- Zheng, Y.N.; Li, S.S.; Xue, S.; Jiang, B.Y.; Ren, B.; Zhao, Y. Study on the evolution characteristics of coal spontaneous combustion and gas coupling disaster region in goaf. Fuel 2023, 349, 128505. [Google Scholar] [CrossRef] [Scilit]
- Ma, L.Y.; Zou, L.; Ren, L.F.; Chung, Y.H.; Zhang, P.N.; Shu, C.M. Prediction indices and limit parameters of coal spontaneous combustion in long-flame coal: A case study. Fuel 2020, 264, 116883. [Google Scholar] [CrossRef] [Scilit]
- Fan, J.Y.; Liu, P.; Li, J.J.; Jiang, D.Y. A coupled methane/air flow model for coal gas drainage: Model development and finite-difference solution. Process Saf. Environ. Prot. 2020, 141, 288–304. [Google Scholar] [CrossRef] [Scilit]
- Song, Y.; Yang, S.Q.; Hu , X.C.; Song , W.X.; Sang, N.W.; Cai , J.W.; Xu, Q. Prediction of gas and coal spontaneous combustion coexisting disaster through the chaotic characteristic analysis of gas indexes in goaf gas extraction. Process Saf. Environ. Prot. 2019, 129, 8–16. [Google Scholar] [CrossRef] [Scilit]
- Liu, Y.; Wen, H.; Guo, J.; Jin, Y.F.; Wei, G.M.; Yang, Z. Coal spontaneous combustion and N2 suppression in triple goafs: A numerical simulation and experimental study. Fuel 2020, 271, 117625. [Google Scholar] [CrossRef] [Scilit]
- Qin, B.T.; Wang, H.T.; Yang, J.; Liu, L.Z. Large-area goaf fires: A numerical method for locating high-temperature zones and assessing the effect of liquid nitrogen fire control. Environ. Earth Sci. 2016, 75, 1396. [Google Scholar] [CrossRef] [Scilit]
- Liu, S.C.; Yang, Y.Z.; Wu, L.Y.; Zhai, X.W.; Yang, W.L.; Li, L.; Lei, J.Q. Coupled thermal–oxygen–methane field evolution and coordinated prevention strategy in goaf under surface borehole drainage. Process Saf. Environ. Prot. 2025, 203, 107897. [Google Scholar] [CrossRef] [Scilit]
- Su, H.T.; Zhou, F.B.; Li, J.H.; Qi, H.N. Effects of oxygen supply on low-temperature oxidation of coal: A case study of Jurassic coal in Yima, China. Fuel 2017, 202, 446–454. [Google Scholar] [CrossRef] [Scilit]
- Deng, Q.W.; Liu, X.H.; Lu, C.; Lin, Q.Z.; Yu, M.G. Numerical Simulation of Spontaneous Oxidation Zone Distribution in Goaf under Gas Stereo Drainage. Procedia Eng. 2013, 52, 72–78. [Google Scholar] [CrossRef] [Scilit]
- Liu, W.; Qin, Y. Multi-physics coupling model of coal spontaneous combustion in longwall gob area based on moving coordinates. Fuel 2017, 188, 553–566. [Google Scholar] [CrossRef] [Scilit]
- Wang, H.Y.; Tan, B.; Shao, Z.L.; Guo, Y.; Zhang, Z.Y.; Xu, C. Influence of different content of FeS2 on spontaneous combustion characteristics of coal. Fuel 2021, 288, 119582. [Google Scholar] [CrossRef] [Scilit]
- Hao, M.; Wei, C.M.; Nie, Y. Influence of combustible gases from coal spontaneous combustion on CH4 adsorption in the goaf. Chem. Phys. Lett. 2022, 803, 139806. [Google Scholar] [CrossRef] [Scilit]
- Qin, B.T.; Lu, Y.; Li, Y.; Wang, D.M. Aqueous three-phase foam supported by fly ash for coal spontaneous combustion prevention and control. Adv. Powder Technol. 2014, 25, 1527–1533. [Google Scholar] [CrossRef] [Scilit]
- Yang, Y.L.; Li, Z.H.; Hou, S.S.; Gu, F.J.; Gao, S.Y.; Tang, Y.B. The shortest period of coal spontaneous combustion on the basis of oxidative heat release intensity. Int. J. Coal Sci. Technol. 2014, 24, 99–103. [Google Scholar] [CrossRef] [Scilit]
- Xie, J.; Xue, S.; Cheng, W.M.; Wang, G. Early detection of spontaneous combustion of coal in underground coal mines with development of an ethylene enriching system. Int. J. Coal Geol. 2011, 85, 123–127. [Google Scholar] [CrossRef] [Scilit]
- Zhang, Y.T.; Liu, Y.R.; Shi, X.Q.; Yang, C.P.; Wang, W.F.; Li, Y.Q. Risk evaluation of coal spontaneous combustion on the basis of auto-ignition temperature. Fuel 2018, 233, 68–76. [Google Scholar] [CrossRef] [Scilit]
- Chu, T.X.; Wu, C.X.; Jiang, B.N.; Zhu, T.R.; Zhang, X.; Chen, Y.X.; Li, L. Low-Temperature Oxidation Characteristics and Apparent Activation Energy of Pressurized Crushed Coal Under Stress Loading. Nat. Resour. Res. 2025, 34, 885–897. [Google Scholar] [CrossRef] [Scilit]
- Song, S.; Qin, B.T.; Xin, H.H.; Qin, X.W.; Chen, K. Exploring effect of water immersion on the structure and low-temperature oxidation of coal: A case study of Shendong long flame coal, China. Fuel 2018, 234, 732–737. [Google Scholar] [CrossRef] [Scilit]
- Su, D.K.; Tang, Y.B.; Ma, D.J.; Chen, J.T.; Li, S.Y.; Jia, B.B. Experimental investigation of the effect of ventilation rate on the vertical forward smoldering propagation of Yunnan lignite. Process Saf. Environ. Prot. 2025, 201, 107534. [Google Scholar] [CrossRef] [Scilit]
- Zhao, J.Y.; Wang, W.F.; Fu, P.; Pei, J.J.; Li, Y.Q. Evaluation of the spontaneous combustion of soaked coal based on a temperature-programmed test system and in-situ FTIR. Fuel 2021, 294, 120583. [Google Scholar] [CrossRef] [Scilit]
- Zhang, Y.T.; Zhang, Y.B.; Li, Y.Q.; Li, Q.P.; Zhang, J.; Yang, C.P. Study on the characteristics of coal spontaneous combustion during the development and decaying processes. Process Saf. Environ. Prot. 2020, 138, 9–17. [Google Scholar] [CrossRef] [Scilit]
- Ma, D.; Zhang, L.L.; Yang, Y.X.; Zhou, Q.G. A Lab-Scale Experiment on the Spontaneous Combustion Behavior of Chronic Naturally–Oxidized Coal in Re-Mining Coal Mine. Combust. Sci. Technol. 2024, 4626–4643. [Google Scholar] [CrossRef] [Scilit]
- Zhang, L.L.; Yang, M.D.; Luo, H.G. Parameter Optimization and Application of Gas Extraction Technology by Buried Pipes in Goaf of Multi-roadway U-type Working Face. Combust. Sci. Technol. 2022, 820–837. [Google Scholar] [CrossRef] [Scilit]
- Zhang, M.H.; Wu, S.Y.; Wang, Y.W. Research and application of drainage parameters for gas accumulation zone in overlying strata of goaf area. Saf. Sci. 2012, 50, 778–782. [Google Scholar] [CrossRef] [Scilit]
- Wen, H.; Guo, J.; Jin, Y.F.; Wang, K.; Zhang, Y.T.; Zheng, X.Z. Experimental study on the influence of different oxygen concentrations on coal spontaneous combustion characteristic parameters. Int. J. Oil Gas Coal Technol. 2017, 16, 187–202. [Google Scholar] [CrossRef] [Scilit]
- Zhang, J.; Choi, W.; Ito, T.; Takahashi, K.; Fujita, M. Modelling and parametric investigations on spontaneous heating in coal pile. Fuel 2016, 176, 181–189. [Google Scholar] [CrossRef] [Scilit]
- Gao, F.; Bai, Q.H.; Jia, Z.; Zhang, X.; Li, Y.D. Influence and inerting mechanism of inert gas atmospheres on the characteristics of oxidative spontaneous combustion in coal. Energy 2024, 293, 130470. [Google Scholar] [CrossRef] [Scilit]
- Kong, B.; Li, J.H.; Lu, W.; Song, H.Z.; Liu, J.F.; Han, S.S. Research on a Spontaneous Combustion Prevention System in Deep Mine: A Case Study of Dongtan Coal Mine. Combust. Sci. Technol. 2024, 196, 1855–1874. [Google Scholar] [CrossRef] [Scilit]
- Lu, Y.; Gu, W.X.; Wang, G.; Li, H.; Shi, S.L.; Niu, H.Y. Numerical Assessment of the Influences of the Coal Spontaneous Combustion on Gas Drainage Methods Optimization and Its Application. Combust. Sci. Technol. 2021, 193, 2158–2174. [Google Scholar] [CrossRef] [Scilit]
- Liu, H.Q.; Wang, F.B.; Ren, T.Y.; Qiao, M.; Yan, J.W. Influence of methane on the prediction index gases of coal spontaneous combustion: A case study in Xishan coalfield, China. Fuel 2021, 289, 119852. [Google Scholar] [CrossRef] [Scilit]
- Pan, R.K.; Zhang, T.; Chao, J.K.; Hu, D.M.; Liu, W.; Wang, L. Study on thermal effects and gases derivation of spontaneous combustion of gas-containing coal. Fuel 2023, 354, 129336. [Google Scholar] [CrossRef] [Scilit]

Disclaimer/Publisher’s Note: The statements, opinions and data contained in all publications are solely those of the individual author(s) and contributor(s) and not of MDPI and/or the editor(s). MDPI and/or the editor(s) disclaim responsibility for any injury to people or property resulting from any ideas, methods, instructions or products referred to in the content. |
© 2026 by the authors. Licensee MDPI, Basel, Switzerland. This article is an open access article distributed under the terms and conditions of the Creative Commons Attribution (CC BY) license.