


Abstract
The fluctuating nature of renewable energy sources such as wind and solar power poses significant challenges to the stability of power grids, while pumped-storage hydropower, with its advantages in peak regulation and frequency control, has become an essential component of modern energy strategies. However, sediment in rivers adversely affects the operational efficiency and stability of PSH units, leading to accelerated wear and shortened service life. In this study, the low-pressure stage of a two-stage pump turbine was selected as the research object, and the Euler–Euler numerical method was employed to investigate the solid–liquid two-phase flow characteristics of the pump turbine in pump mode. The results show that, compared with the clear-water condition, the head and efficiency decrease by up to 7.9% and 15%, respectively, after the addition of sand particles. The average pressure within the flow-passage components increases, while the streamlines become more non-uniform, accompanied by the formation of vortices and backflow in the guide and return vanes. The total entropy generation increases with rising particle concentration but decreases with larger particle size. Among the components, the high-entropy regions are mainly located on the suction surface and trailing edges of the impeller blades, the inlet and blade surfaces of the guide vanes, and the inlet and trailing edges of the return vanes. Moreover, the pressure pulsation amplitudes at monitoring points in the vaneless region, guide vane–return vane interaction region, and leading edge of the return vane increase progressively with both particle size and concentration. The dominant and secondary frequencies at all monitoring points correspond to the blade-passing frequency (BPF) and its harmonics, indicating that rotor–stator interaction is the principal cause of pressure pulsations under pump operating conditions.
1. Introduction
1.1. Background
With the continuous consumption of conventional energy resources, environmental pollution and climate change have become increasingly severe [1]. Consequently, optimizing the current energy structure and accelerating the transition toward low-carbon and clean energy has become an inevitable global trend. Among renewable sources, wind and solar energy are abundant and sustainable; however, their inherent intermittency and fluctuation characteristics, combined with the growing diversity of grid load demands, pose significant challenges to the stable operation of power systems [2].
Pumped-storage hydropower (PSH), with its advantages in peak shaving, valley filling, and frequency regulation, has rapidly developed into a crucial component of national energy strategies [3]. China, endowed with extensive river networks and abundant water resources, possesses favorable natural conditions for the large-scale deployment of PSH. By the end of August 2025, the country’s total installed capacity of operational pumped-storage units had exceeded 62 GW, representing a 7.5% increase within eight months and demonstrating a sustained and robust growth trend.
However, sediment carried by rivers remains one of the major factors affecting the operation and reliability of hydraulic units. During PSH operation, the water flow frequently cycles between the upper and lower reservoirs, and the presence of sediment influences both pumping and turbine modes. Sediment not only alters the internal and external hydraulic performance of the units but also causes severe erosion and wear on flow-passage components, significantly shortening their service life [4].
Statistical analyses indicate that sediment erosion problems are widespread among China’s medium and large hydropower stations, with affected installed capacity exceeding 12 million kW (excluding the Three Gorges Project). Moreover, approximately 30% of small hydropower stations in China also suffer from varying degrees of sediment-related damage. In particular, rivers in northwestern China contain high sediment concentrations, while those in southern regions, though generally clearer, experience sharp increases in sediment content during the rainy season. Therefore, the impact of sediment on the operational stability and longevity of hydraulic units cannot be neglected.
1.2. Literature Review
The internal flow characteristics of solid–liquid two-phase flow differ significantly from those of a single-phase clear-water flow. In two-phase conditions, the flow becomes much more complex due to the interactions among particles, wall surfaces, and the carrier fluid, all of which can influence both the external performance and the internal flow structure of hydraulic machinery. Numerous scholars have conducted extensive research in this field.
Chandel et al. [5] investigated the performance of centrifugal and screw pumps under solid–liquid two-phase flow and found contrasting trends: the performance of the centrifugal pump declined with increasing solid-phase concentration, accompanied by a rise in input power, while the screw pump exhibited improvements in both head and efficiency. Huang et al. [6] examined the impact of solid particles on head and efficiency and found that the external characteristics of the pump degraded relative to the clear-water condition, while also identifying significant changes in velocity and concentration fields. Liu et al. [7] conducted numerical and experimental comparisons of pressure and relative velocity distributions in a centrifugal pump and obtained good agreement.
Choi et al. [8] numerically studied an ultra-low specific-speed micro-turbine and demonstrated that guide vane angle design plays a crucial role in improving turbine performance. Sentyabov et al. [9] studied the draft tube of a pump turbine and found that vortex structures in this region led to strong, non-periodic pressure pulsations and high instability. Qian et al. [10] analyzed energy losses in turbines and proposed a new calculation method linking mechanical friction loss power with rotational speed under various heads. Wang et al. [11] analyzed solid–liquid two-phase flow in turbines and found that severe collisions within the runner could trigger cavitation, and as particle density and concentration increased, the inlet–outlet pressure difference rose, leading to efficiency losses. Wang et al. [12] simulated solid–liquid flow in a mixed-flow turbine and reported a uniform pressure distribution along the impeller spiral, with high-pressure zones near the base and low-pressure zones at the outlet, where particle accumulation was greatest at both the base and upper surfaces.
1.3. Motivations and Contributions
Extensive numerical investigations have been conducted both domestically and internationally to explore the flow characteristics of pumps and turbines under solid–liquid two-phase conditions. These studies have covered aspects such as external performance, internal flow structures, and pressure pulsations. The findings consistently show that the addition of solid particles—depending on their size and concentration—can significantly alter the flow characteristics, causing either performance degradation or, in some cases, enhancement. Pressure pulsations across different flow-passage components may increase or decrease under varying conditions, and additional influences such as entropy generation further characterize the flow losses.
In this study, the Euler–Euler numerical simulation method is employed to investigate the solid–liquid two-phase flow characteristics of a pump turbine operating in pump mode. The analysis focuses on examining how the addition of sand particles with different diameters and concentrations affects the hydraulic performance, internal flow structure, energy loss, and pressure pulsation of the pump under clear-water operating conditions.
2. Methodology
2.1. Computational Model
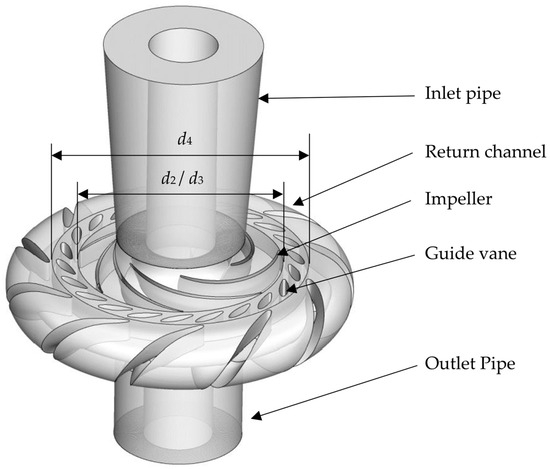
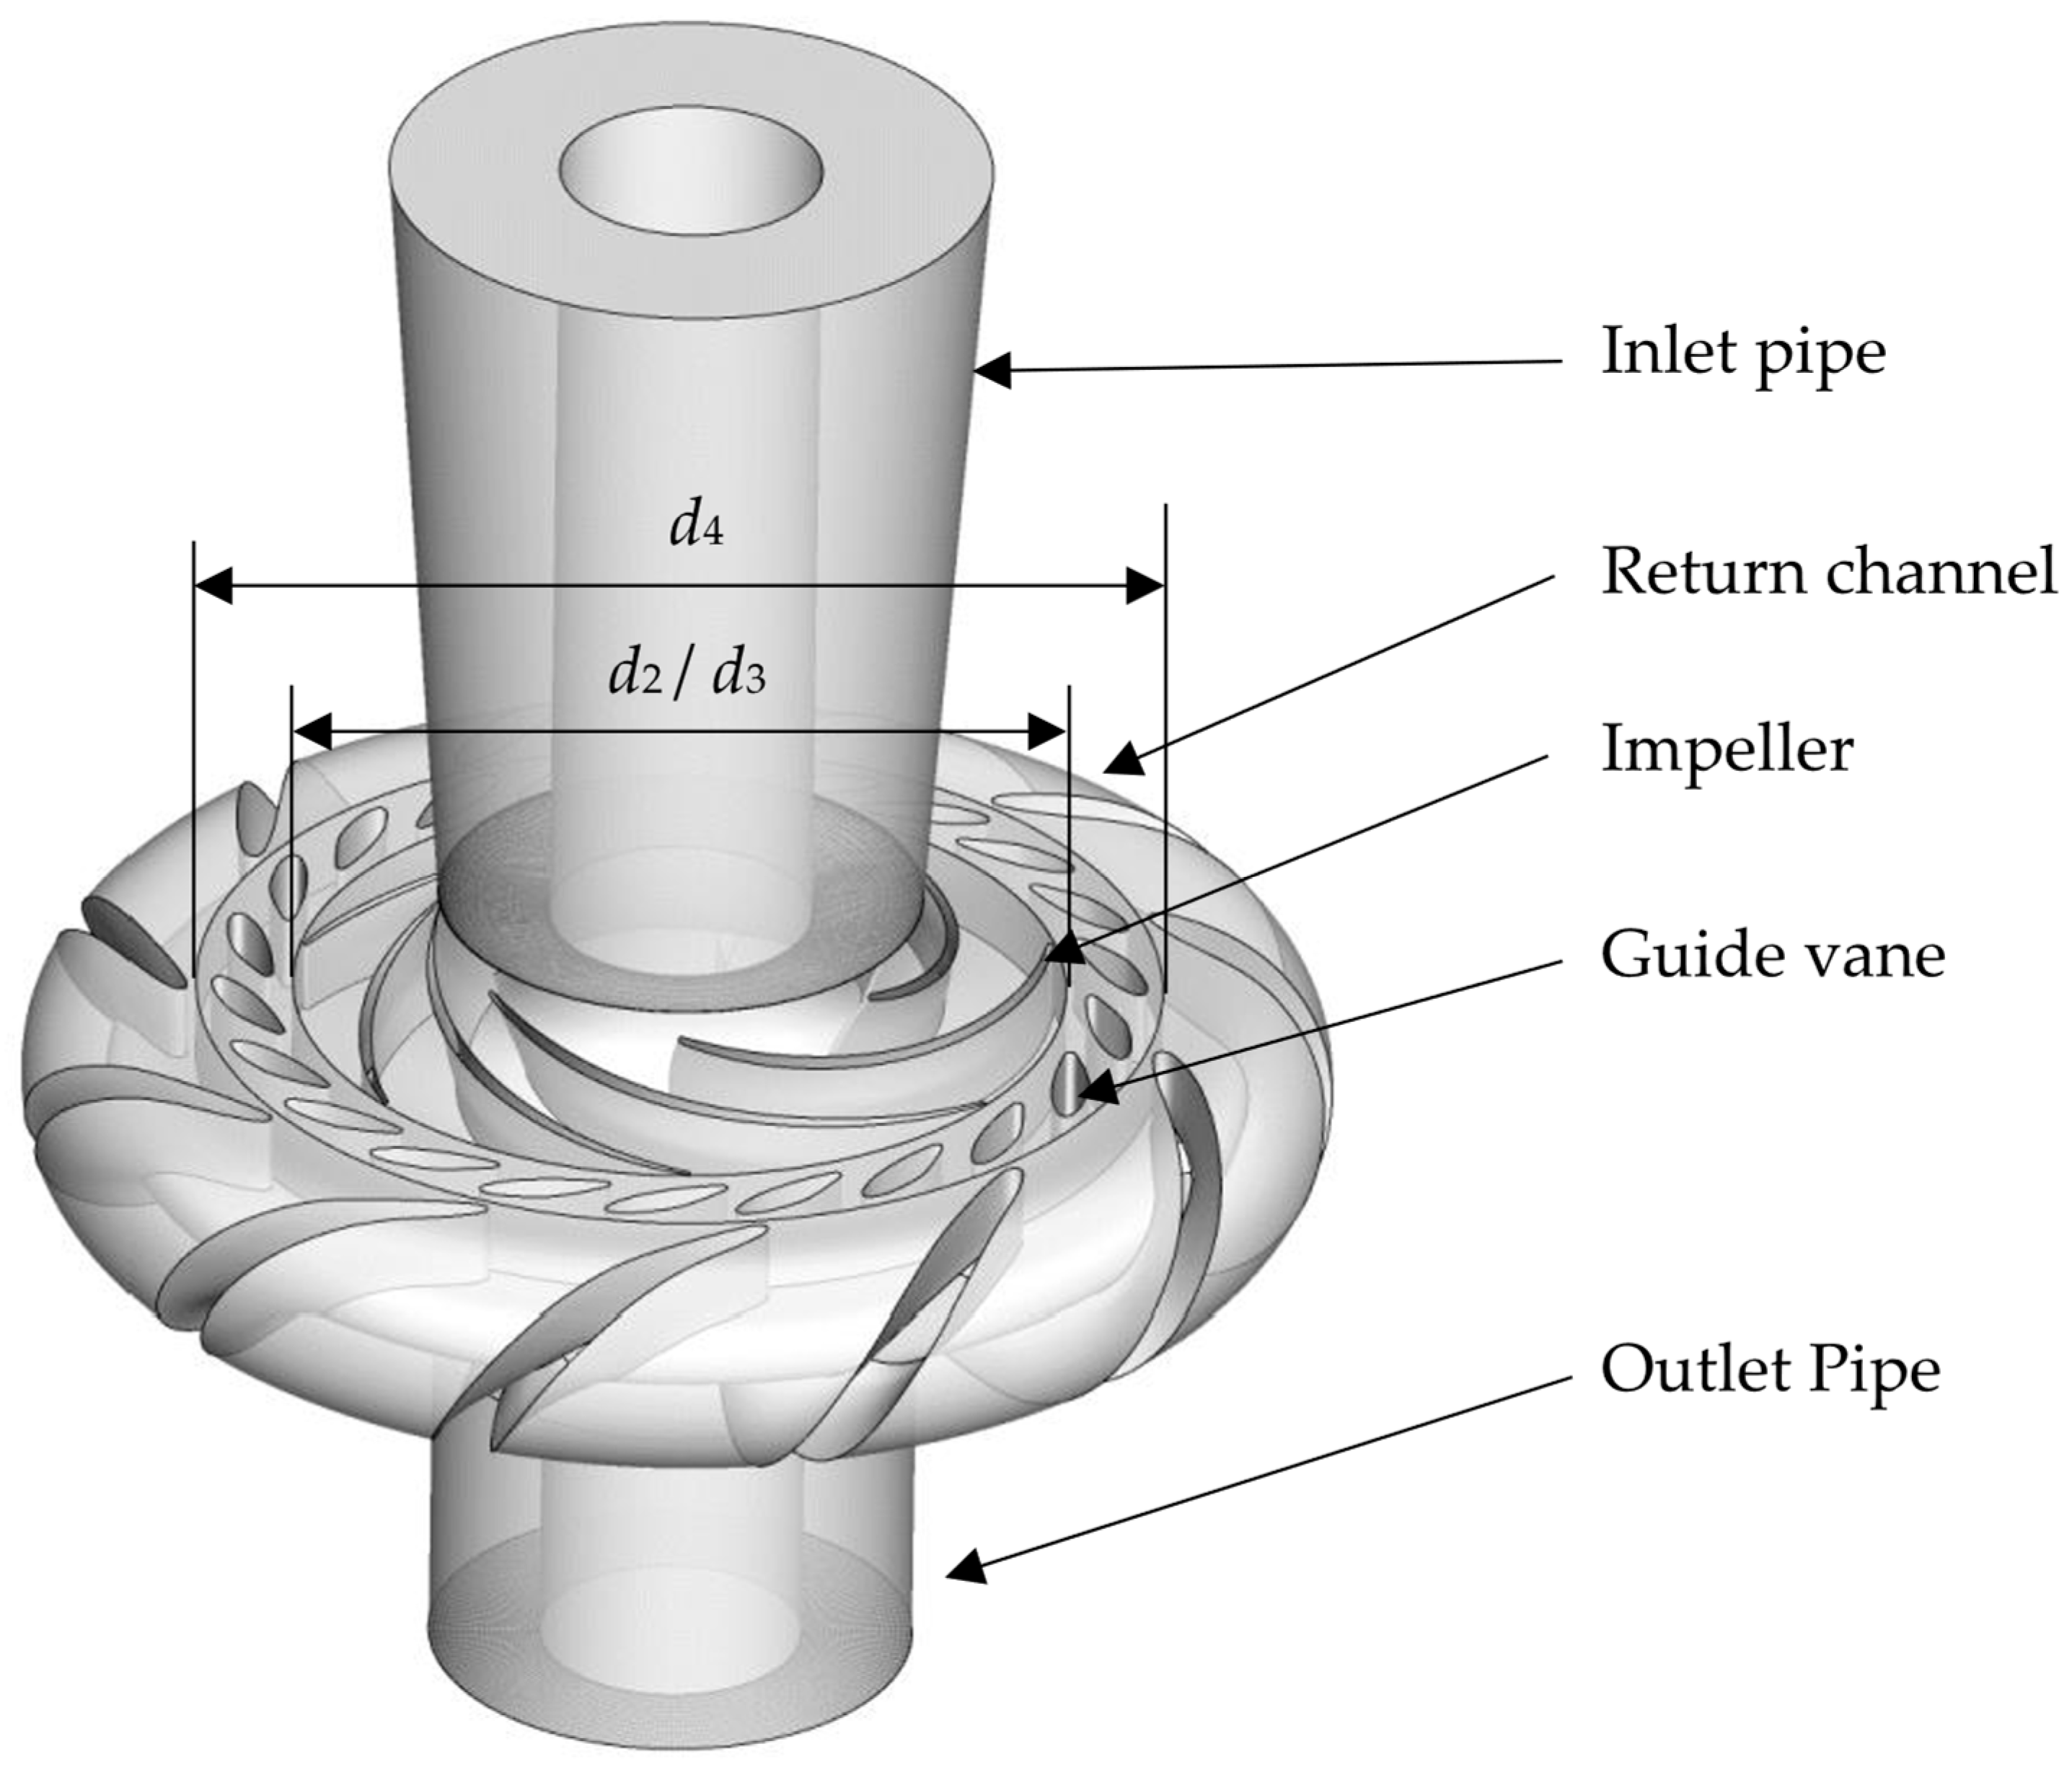
In this study, the low-pressure stage of a two-stage pump turbine is selected as the research object, operating at a rotational speed of 600 rpm. The flow passage components consist of the inlet section, impeller, adjustable guide vanes (moving guide vanes), U-shaped return vanes (stationary guide vanes), and the outlet section. The detailed geometrical and hydraulic parameters are listed in Table 1. Based on the original design parameters of this model, the impeller, moving guide vanes, and return vanes were parametrically modeled using the BladeGen module in ANSYS Workbench 2020, followed by the construction of a complete three-dimensional model in UG (Unigraphics) 12. The resulting 3D configuration is illustrated in Figure 1.
Table 1.
Main specifications of the computational model.
Figure 1.
Schematic diagram of the computational model.
2.2. Computational Grids
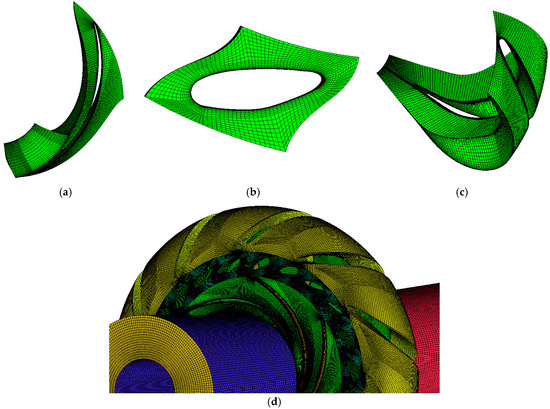
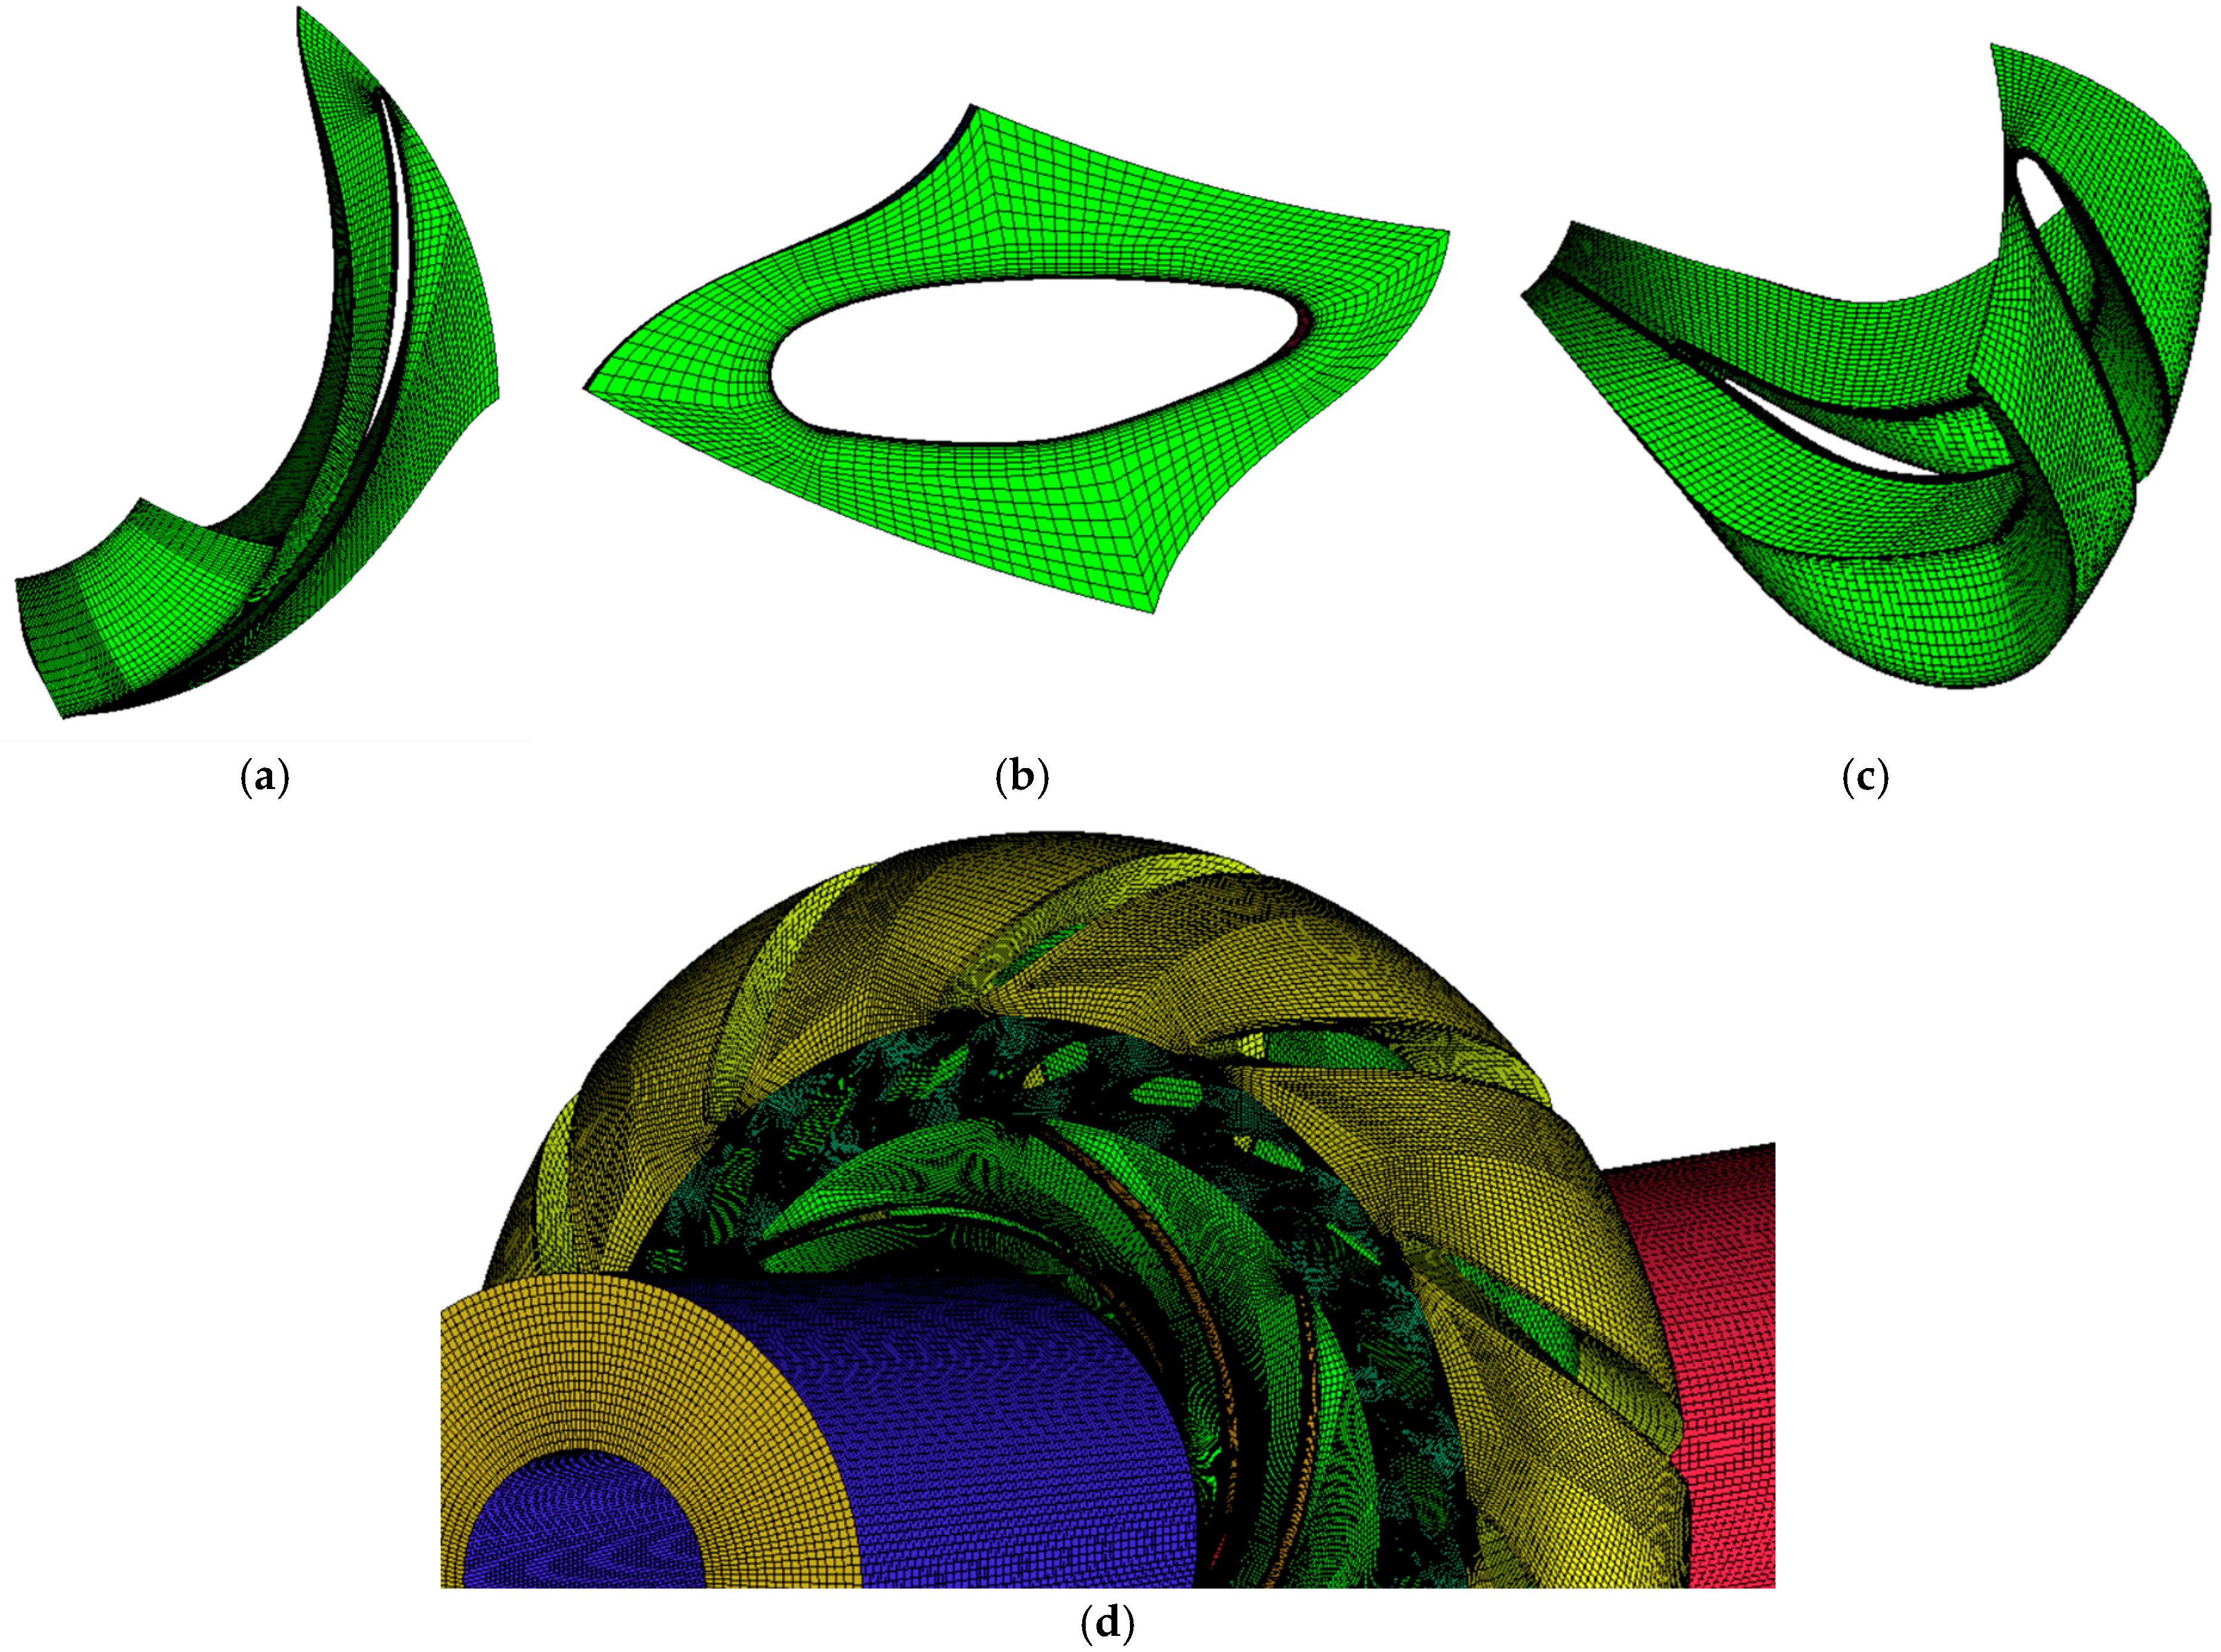
The computational grids of the original model were generated using the commercial meshing software ANSYS ICEM CFD 2020. A structured mesh was established through a multi-block strategy to enhance the overall grid quality and maintain smooth transitions between adjacent domains. Local mesh refinement was applied to critical regions, such as near-wall areas and flow transition sections, to accurately resolve boundary-layer characteristics and capture detailed flow behavior.
Since variations in mesh density may cause deviations in numerical results, particularly when the grid scale differs significantly. A mesh independence analysis was performed to ensure that the influence of grid resolution on simulation outcomes remained within an acceptable range. The pump head was selected as the primary evaluation parameter, as it effectively reflects mesh sensitivity while minimizing the influence of other numerical factors.
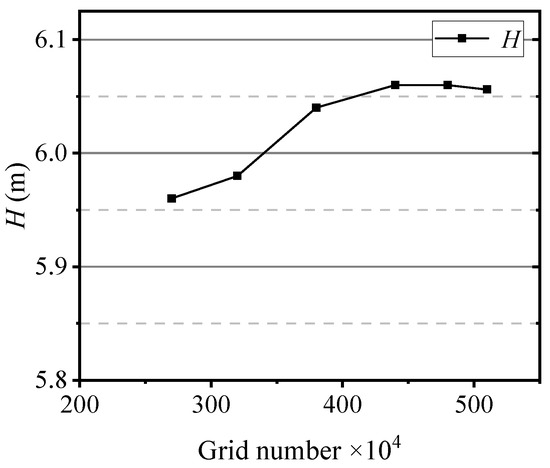
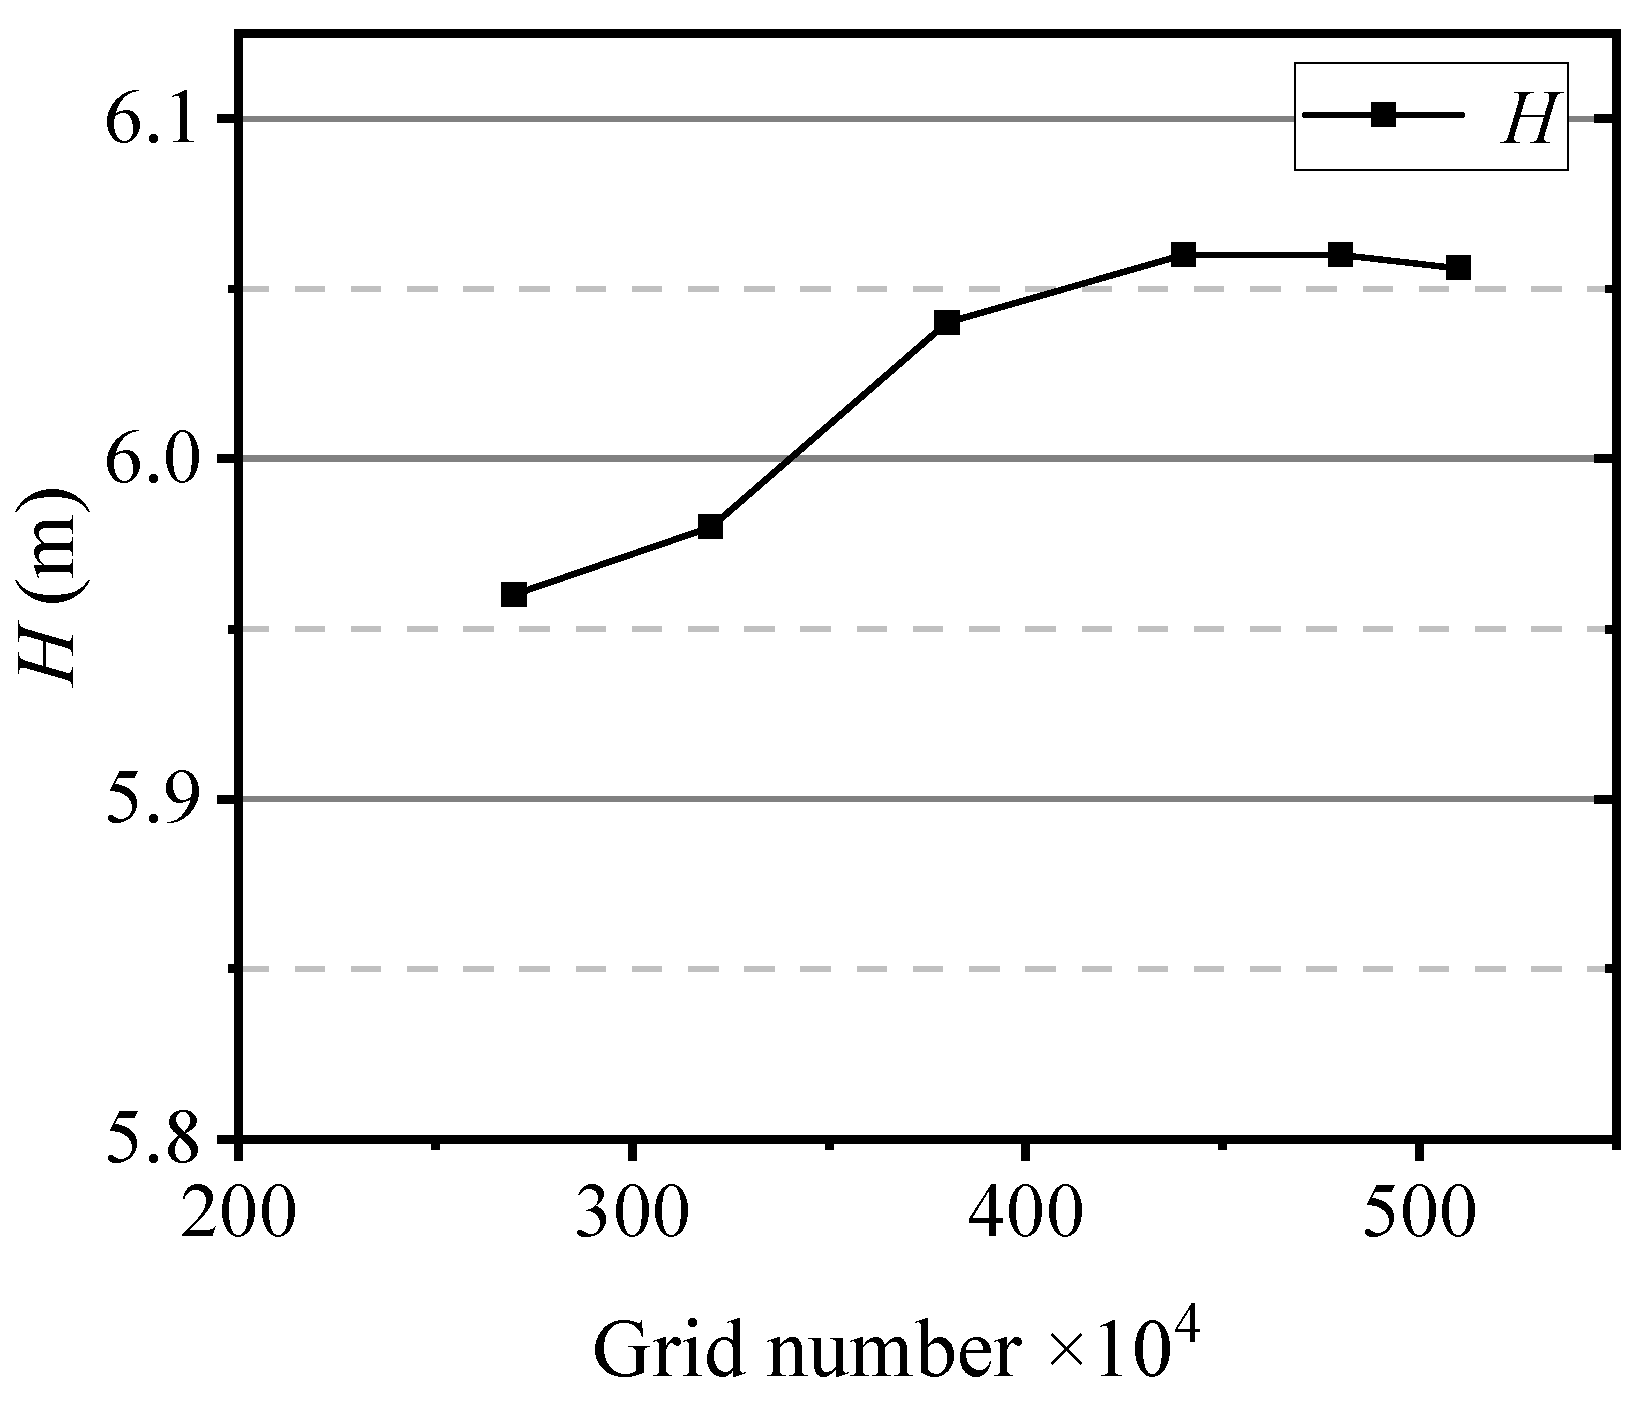
Several sets of structured meshes were generated for the model operating at a rotational speed of 600 rpm, and a mesh independence test was conducted accordingly. Figure 2 presents the variation in pump head with different total grid numbers. As the mesh density increased, the predicted head values gradually converged and stabilized, confirming that the mesh resolution satisfied the independence requirement. Meanwhile, to further strengthen the grid-independence assessment, several derivative quantities that are sensitive to mesh resolution were additionally evaluated. In addition to comparing the global parameter of pump head, local flow-field characteristics including the pressure-gradient distribution, wall-static-pressure profiles, and velocity components at selected circumferential and meridional sections were examined for all mesh levels. The variations in these quantities between the two finest grids were found to be within 1–2%, indicating that further refinement produced no appreciable improvement in either global or local flow predictions. To achieve an optimal balance between computational accuracy and efficiency, especially for subsequent solid–liquid two-phase flow simulations, the final grid size was set to approximately 4.8 million cells. The detailed grid topology is illustrated in Figure 3.
Figure 2.
Grid independence verification.
Figure 3.
Details of the computational grids: (a) impeller passage; (b) moving guide vane passage; (c) return vane passage; (d) overall view.
2.3. Solid–Liquid Two-Phase Flow Model
At present, the commonly used models for solid–liquid two-phase flow research include the Volume of Fluid (VOF) model, the Eulerian model, and the Mixture model. In this study, since the solid-phase volume concentration ranges between 3% and 10%, the Mixture model is adopted for the simulation of the solid–liquid two-phase flow in the pump turbine.
The Mixture model is a simplified two-phase flow model based on the macroscopic Euler–Euler approach. It assumes strong interphase coupling within a short spatial scale and is capable of simulating multiphase flow fields under various flow conditions. In this model, each phase is treated as an interpenetrating continuum, and the interaction between phases is realized through the exchange of mass and momentum.
The governing equation for the continuity of the mixture phase is expressed as follows:
where represents the mass-averaged velocity:
where ρm represents the density of the mixture:
In the equation, denotes the volume fraction of phase k (%), and represents the density of phase k (kg/m3).
The momentum conservation equation for the mixture phase is given as
where is the number of phases, represents the body force, and denotes the mixture viscosity:
represents the drift velocity of phase k:
2.4. Flow Loss Visualization Method
During the operation of a pump turbine, the mechanical energy of the fluid inevitably converts into internal energy due to the inherent viscosity of the medium and the influence of Reynolds stresses, resulting in irreversible energy dissipation. The entropy generation directly reflects the locations and spatial distribution of such irreversible losses, manifested as an increase in the system’s entropy. In numerical simulations, by analyzing the internal flow characteristics of the pump turbine, the spatial distribution of entropy generation within various flow regions can be obtained, thereby revealing the specific sources and evolution of mechanical energy loss. This provides a scientific basis for understanding the causes of performance degradation in pump turbines.
When analyzing the mixture of water and sand particles, the specific heat capacity of water is relatively high, and the operating temperature of the pump turbine remains nearly constant. Therefore, the energy loss due to temperature variations can be neglected.
The total entropy generation of the pump turbine consists of three components: the entropy generated by the time-averaged velocity field, the turbulent velocity fluctuations, and the wall effects. The total entropy generation within the computational domain can thus be expressed as
where Spro,V represents the entropy production due to kinetic energy loss caused by viscous forces in the boundary layer, Spro,T denotes the entropy production due to turbulent dissipation, and Spro,W stands for wall effects. The definitions of these components are provided in Equation (8).
where is the dynamic viscosity, ; T is the temperature, K; and u, v, w are the flow velocity components along the X, Y, and Z axes, respectively; τ represents wall shear stress; and c stands for the velocity of the first-layer grid.
It is straightforward to calculate Spro,V, as it is a time-averaged component that can be directly obtained from numerical simulations based on RANS. However, calculating Spro,T is more challenging. Kock et al. [13] proposed a solution using a turbulence model, as shown in Equation (9).
where α = 0.09, ω and k represent the turbulent dissipation frequency and the turbulent kinetic energy, respectively.
By integrating the local entropy generation rate over the computational domain, the total entropy generation caused by both the mean velocity and the fluctuating velocity can be obtained.
2.5. Numerical Setup
The numerical simulations in this study were conducted using ANSYS Fluent 2020. The temperature was set to 25 °C, and the reference pressure was 1 atm. A velocity inlet boundary condition was applied, where water and sand particles entered the domain as a uniformly mixed flow. The inlet velocity varied according to the operating conditions, while the outlet boundary was defined as a pressure outlet with free outflow. The no-slip condition was imposed on all solid walls. During the computation, the impeller was defined as a rotating domain, whereas the inlet and outlet pipes, guide vanes, and return vanes were set as stationary domains. The SST k–ω model was adopted to simulate turbulence, and the interfaces between adjacent components were defined as “Interface”. Under steady-state conditions, the impeller domain was set to “Frame Motion”.
For the unsteady simulations, the same SST k–ω turbulence model was employed, with the steady-state results used as the initial conditions. The time step was set to 8.83 × 10⁻⁴ s, corresponding to an impeller rotation of 3° per time step. The total simulation time was 0.996 s, equivalent to ten full impeller revolutions, and the maximum number of iterations per time step was set to 10. The impeller was defined as a rotating mesh region (“Mesh Motion”). The impeller speed was 600 rpm, corresponding to a shaft frequency of 10 Hz and a blade-passing frequency of 70 Hz.
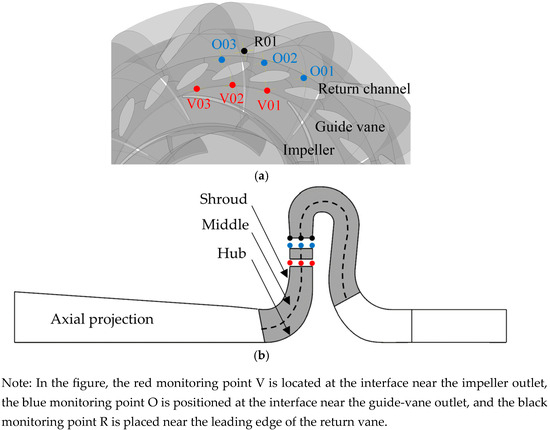
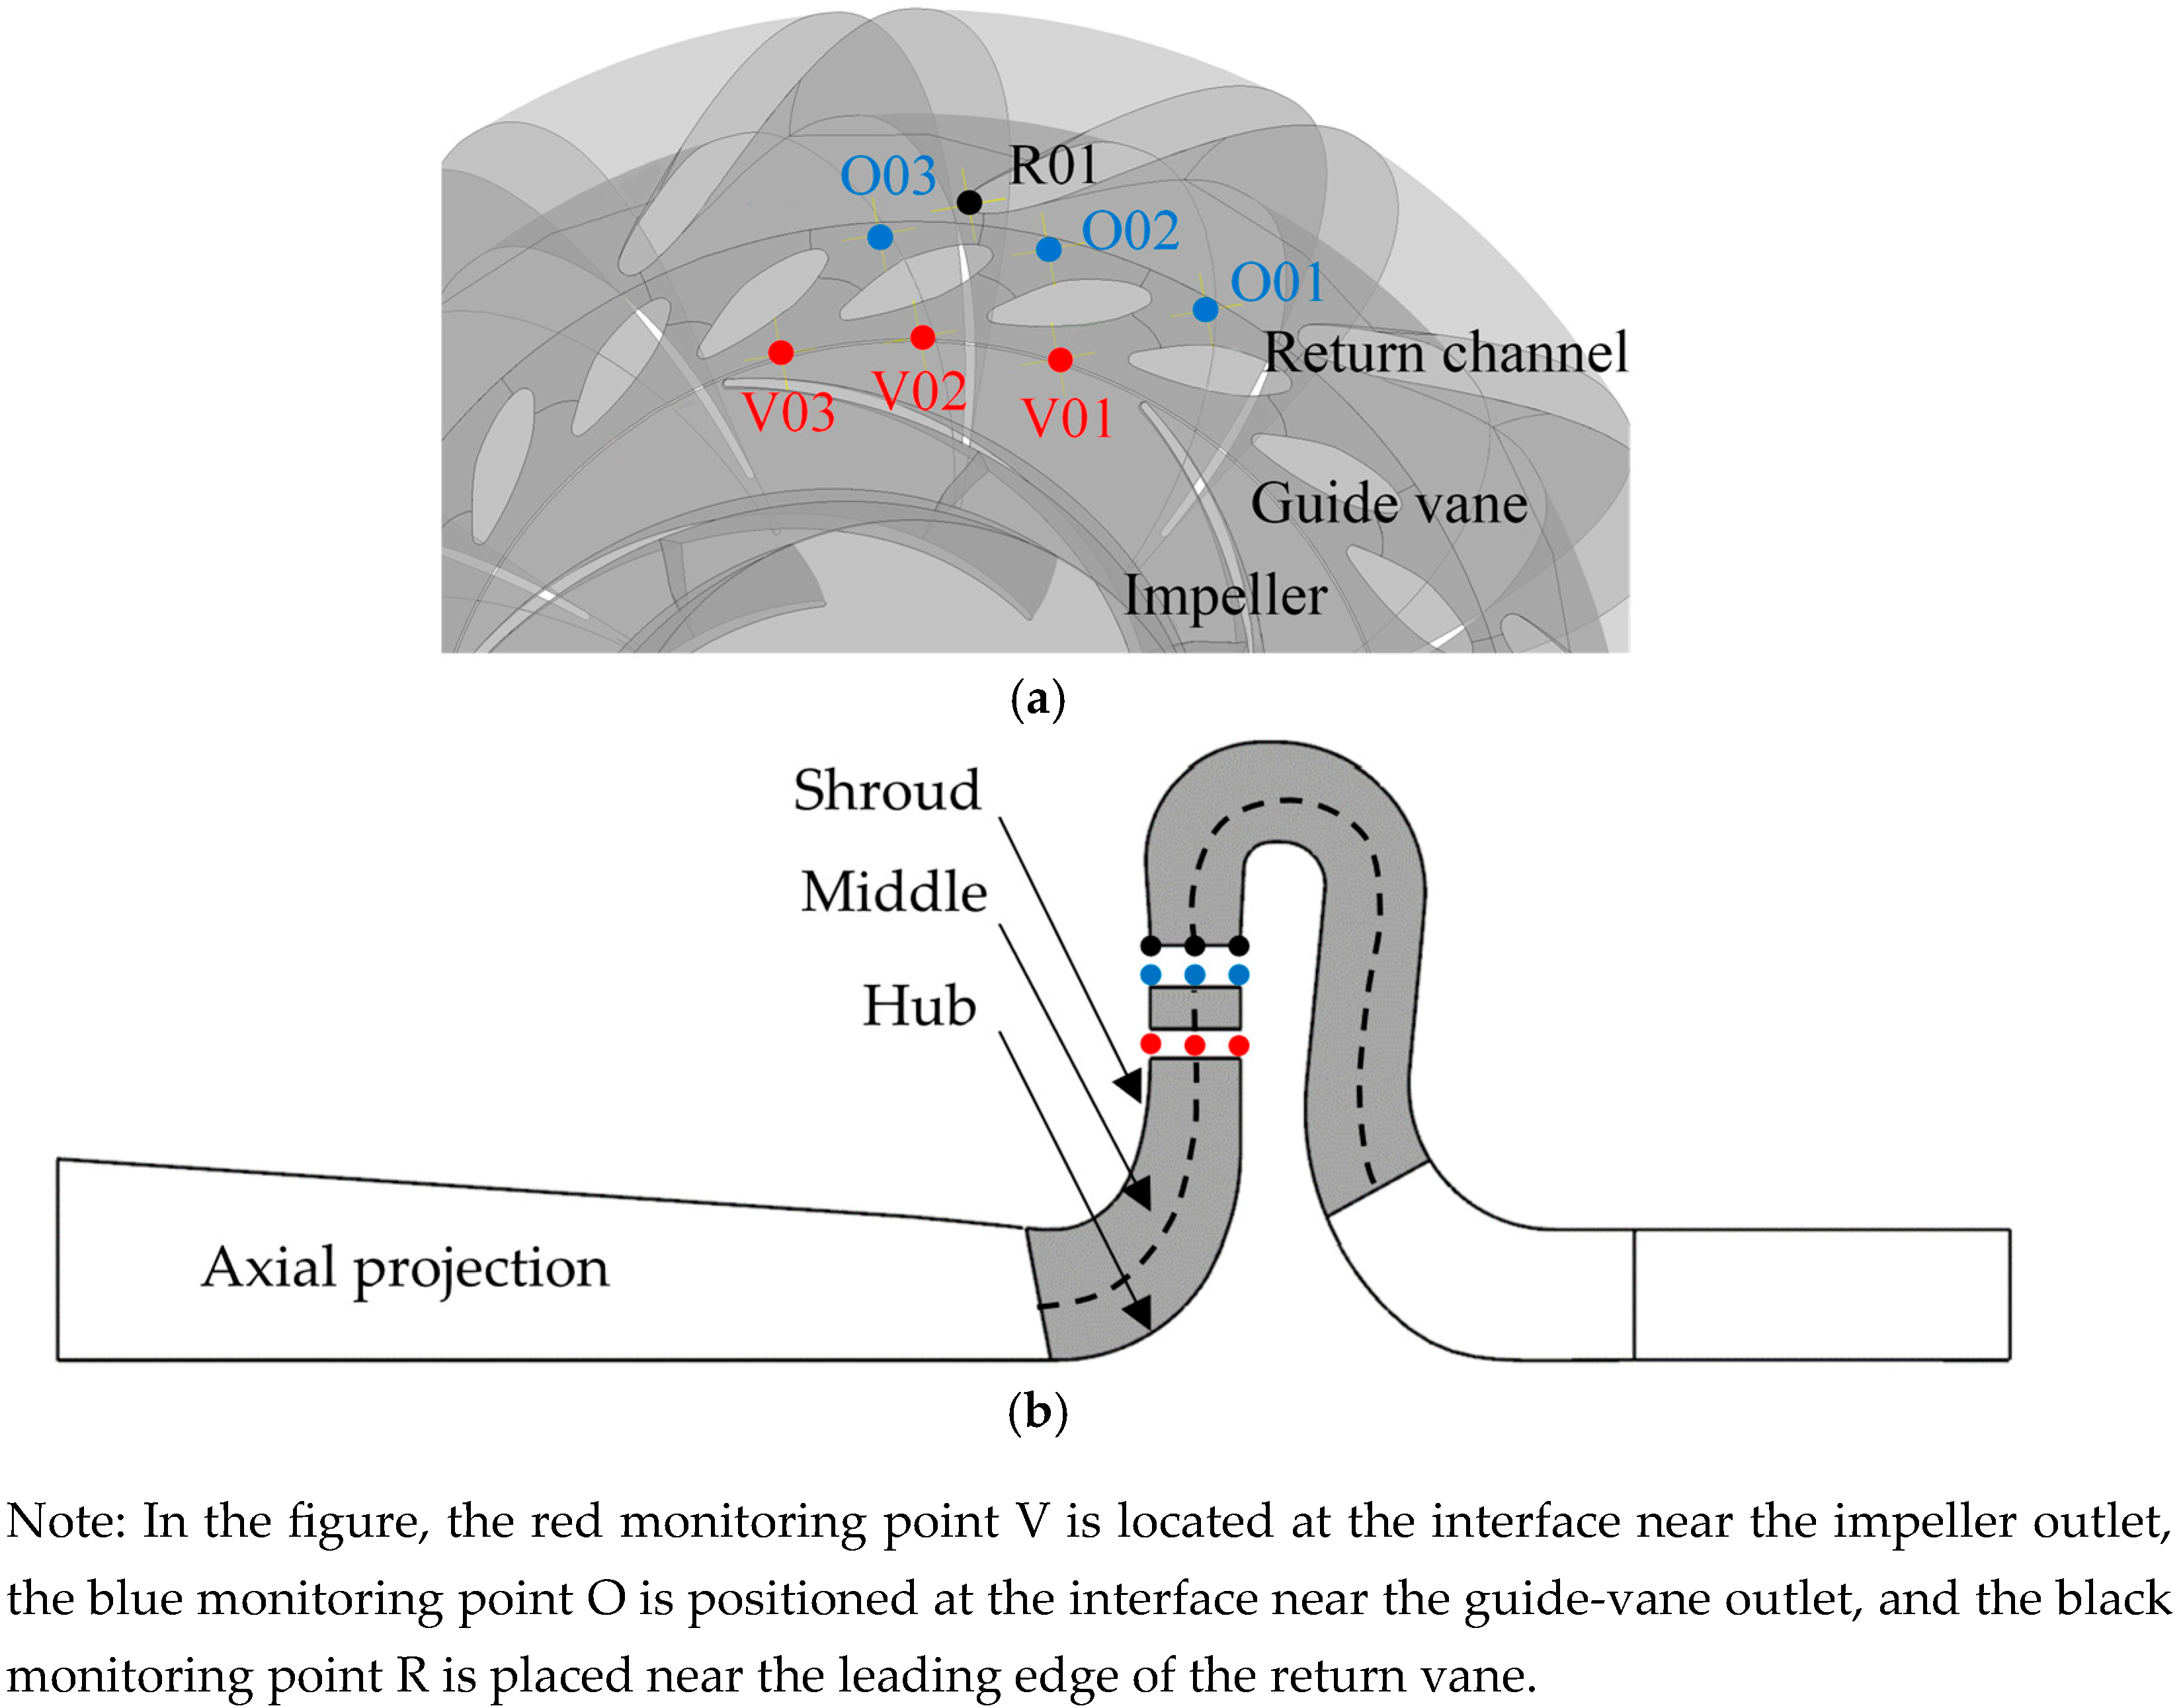
To investigate pressure pulsations, a total of 21 monitoring points were arranged in three circumferential layers—front shroud, mid-plane, and rear shroud—covering the vaneless region, the rotor–stator interaction region (between guide and return vanes), and the leading edge of the return vane, as shown in Figure 4. Specifically, the red monitoring points (V01, V02, V03) represent pressure pulsation locations in the vaneless region; the blue points (O01, O02, O03) are located in the guide vane–return vane interaction region; and the black point (R01) is positioned near the leading edge of the return vane.
Figure 4.
Positions of the monitor points: (a) Circumferential view; (b) Axial view.
In addition, numerical simulations were conducted under various sand concentration conditions to investigate the internal flow characteristics and wear mechanisms of the pump turbine unit. The mass flow rate of the pump turbine was set to 283.5 m3/h, and the sand particle density was defined as 2450 kg/m3. Simulations were performed for different particle sizes and concentrations, with specific settings as follows:
(1) When the sand particle diameter , the sand volume concentrations were set to , , and .
(2) When the sand volume concentration , the sand particle diameters were set to , , and .
3. Experimental Validation
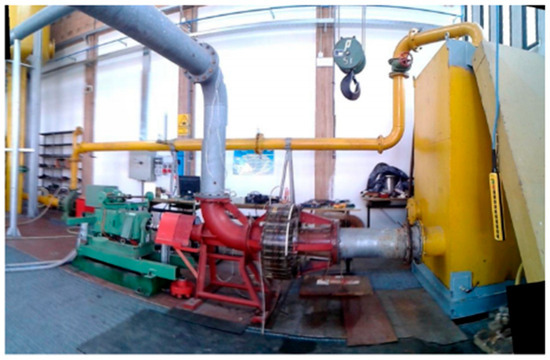
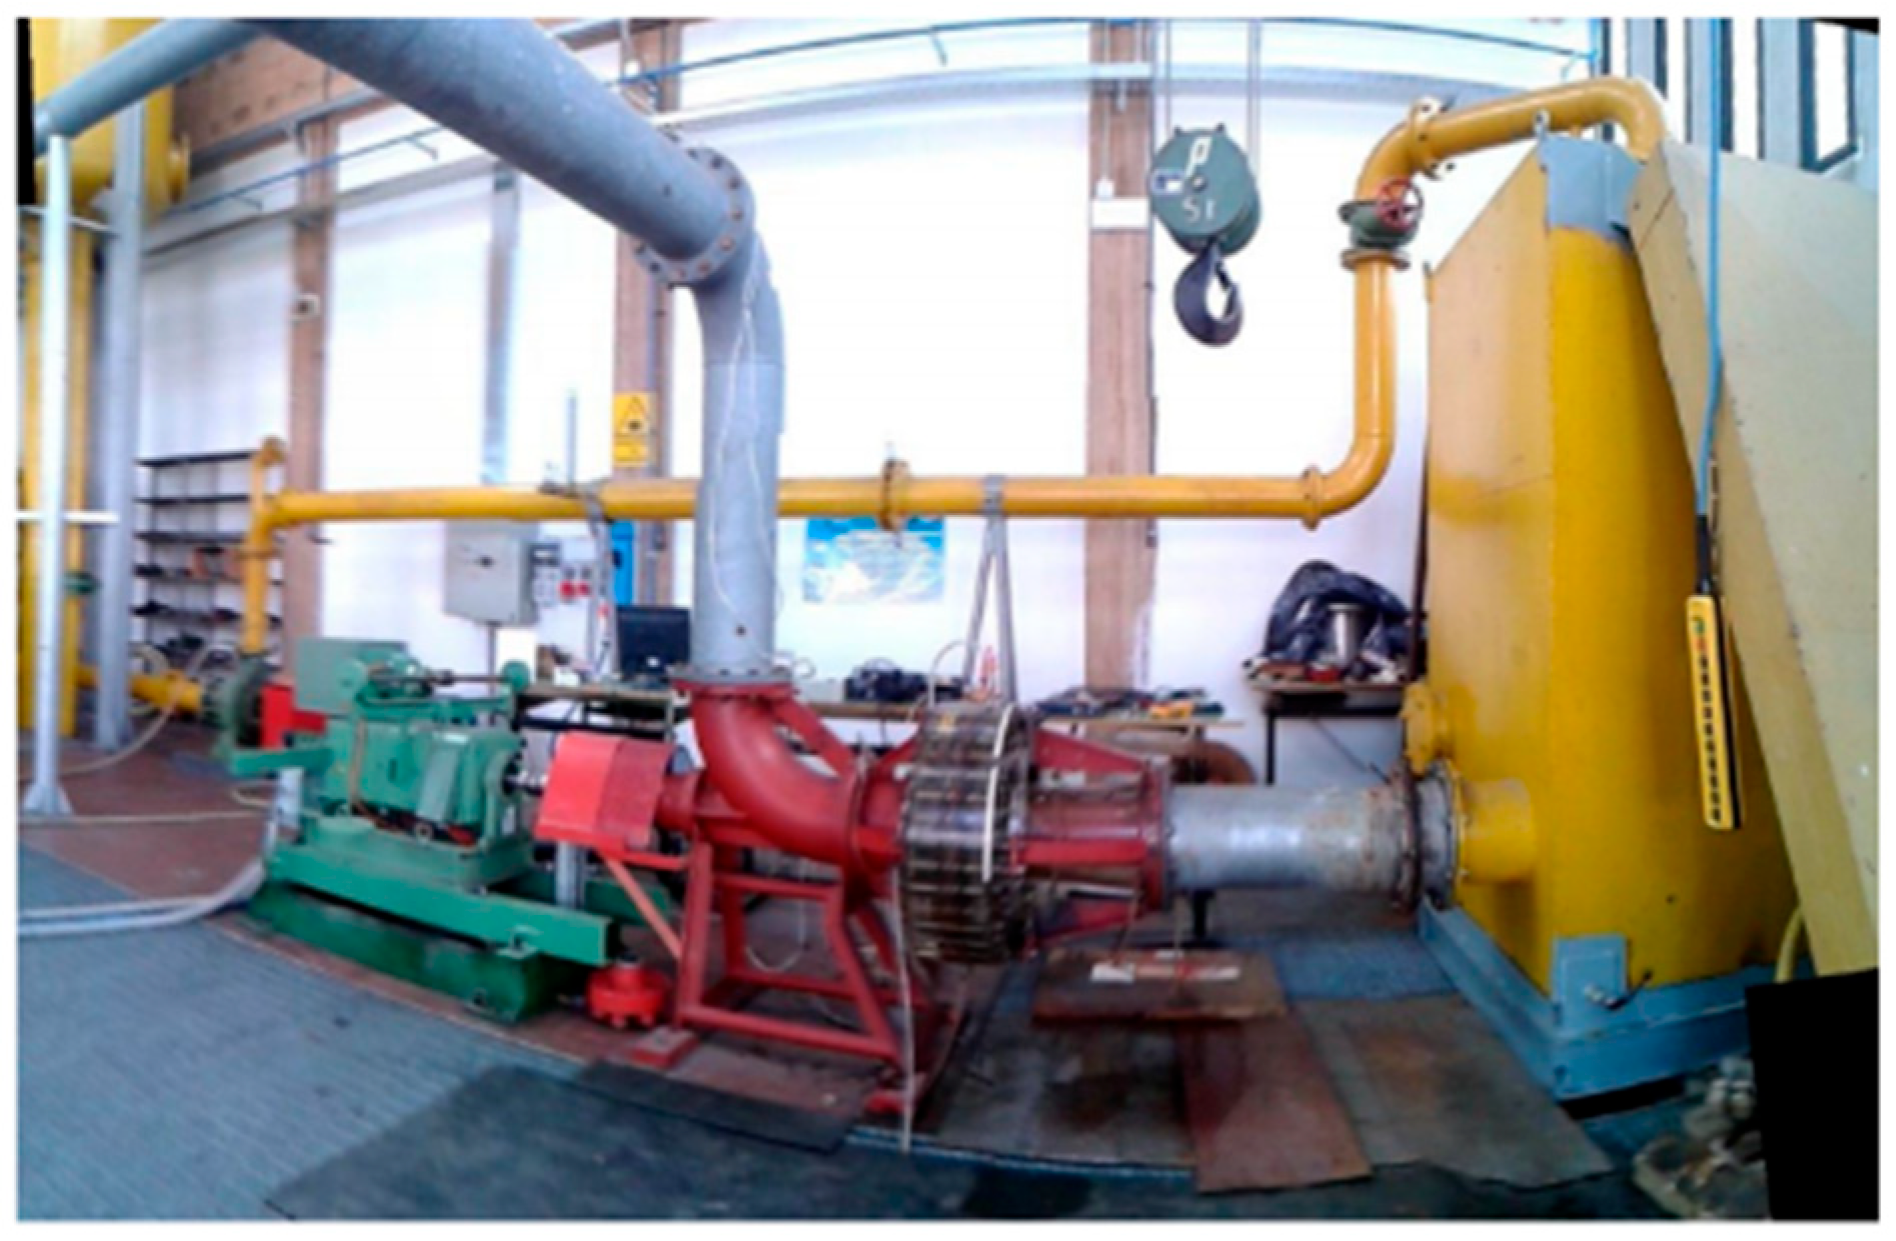
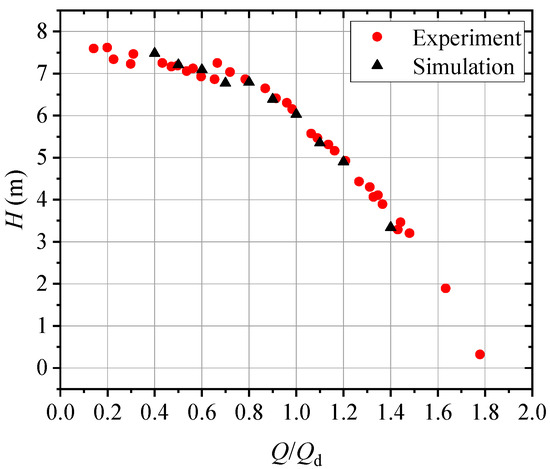
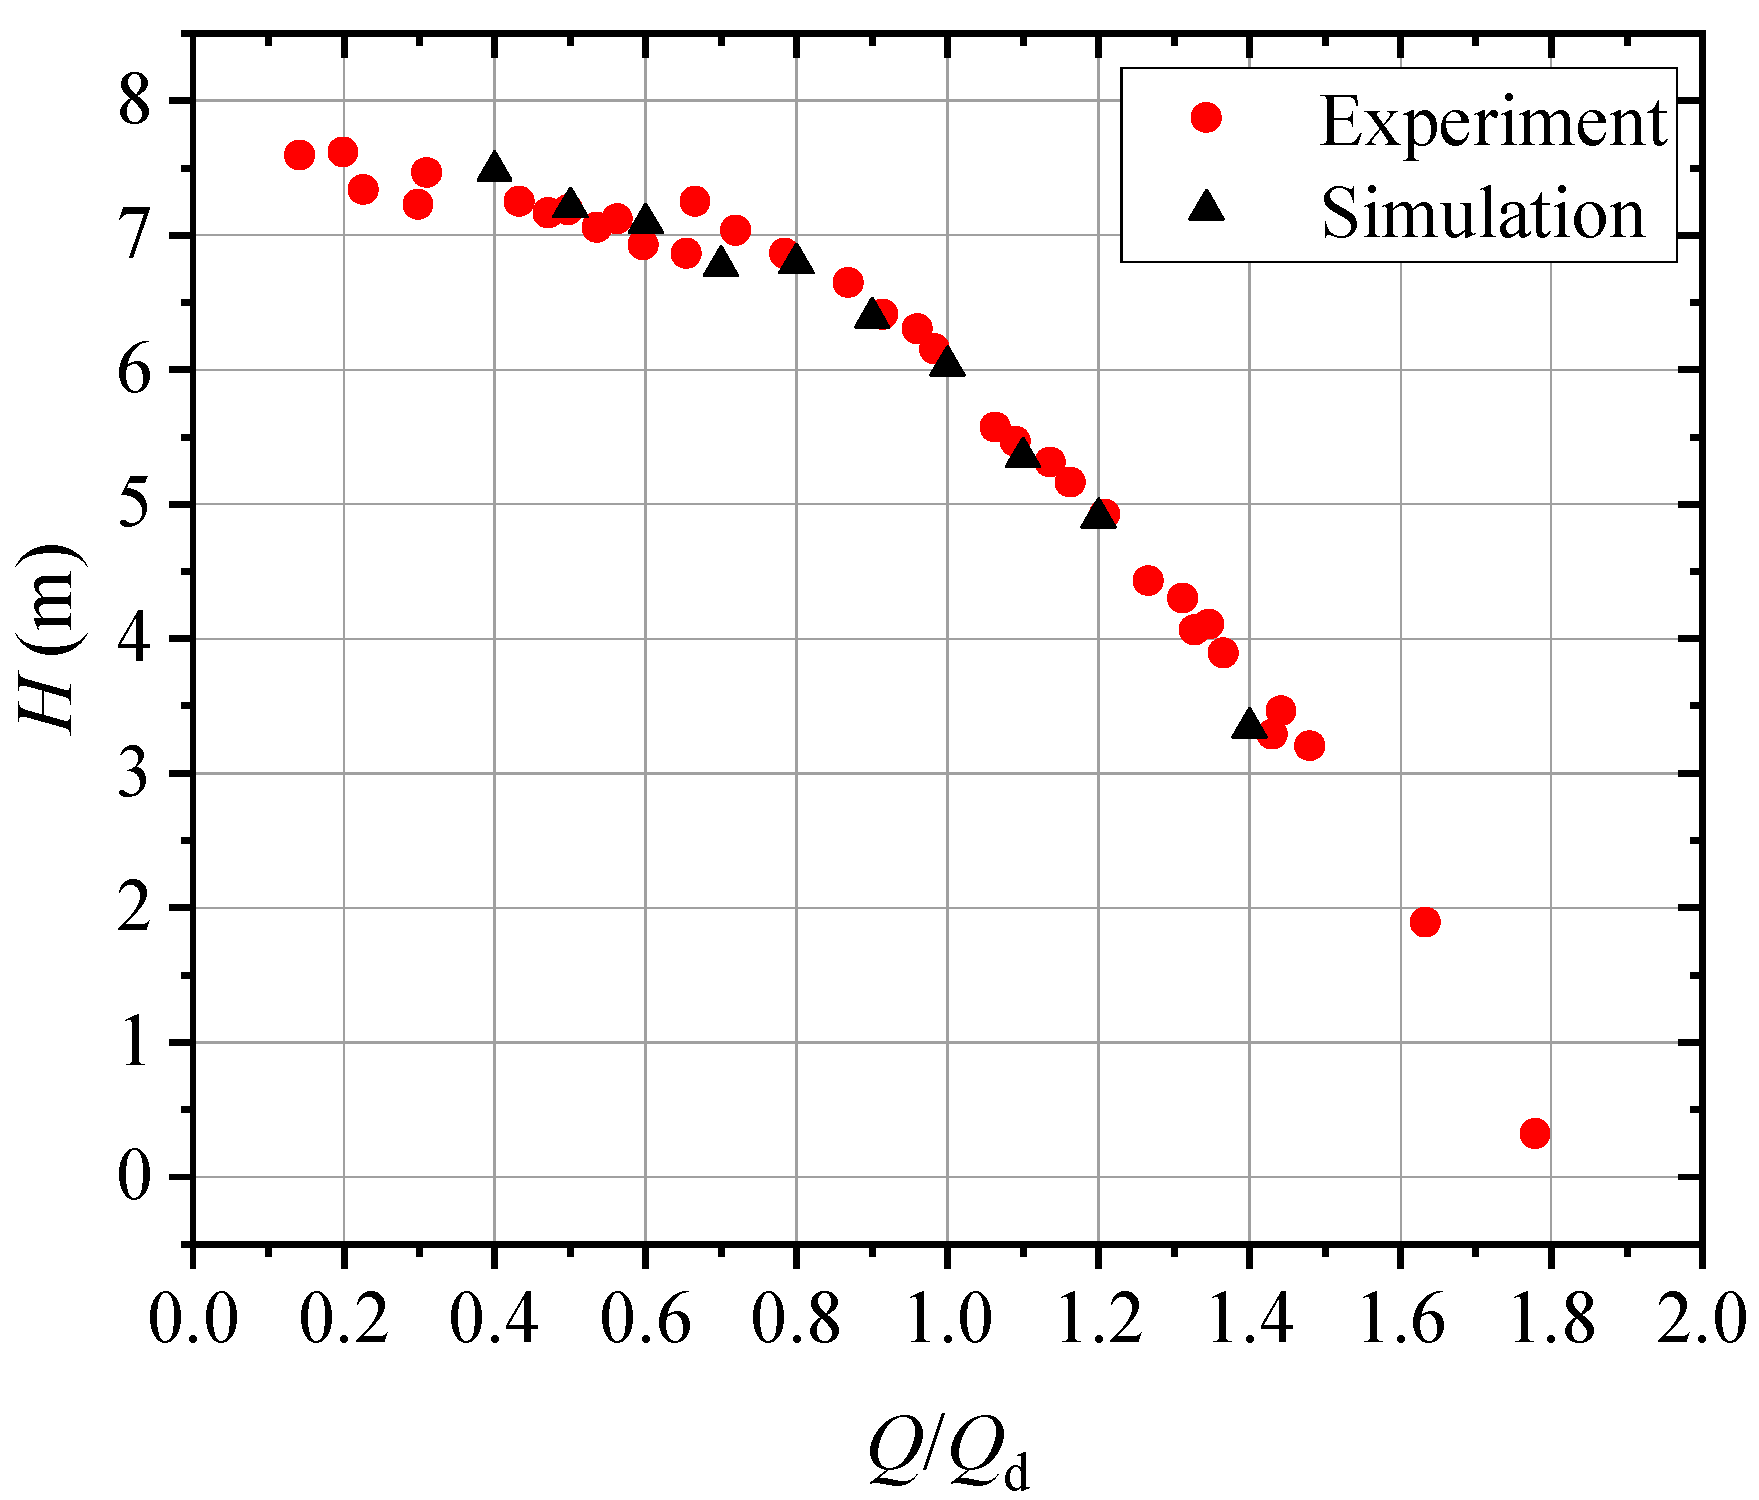
To further validate the reliability of the numerical simulations, an external characteristic performance test of the pump turbine operating in pump mode was conducted on the open-loop hydraulic test rig (as shown in Figure 5) at the Department of Industrial Engineering, University of Padova, Italy [14]. The simulation results were compared with experimental data, as shown in Figure 6. The analysis indicates that the deviation between the experimental and numerical results does not exceed 3%, which falls within an acceptable range. Therefore, the subsequent investigations on both single-phase and solid–liquid two-phase flows can be confidently carried out using numerical simulation methods with high reliability and feasibility.
Figure 5.
Test rig.
Figure 6.
Comparison of hydraulic performance between computation and experiment.
4. Results and Discussions
4.1. Effect of Sand Parameters on the Hydraulic Performance of the Pump
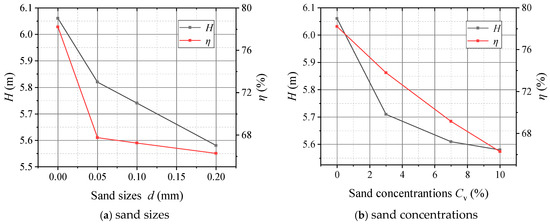
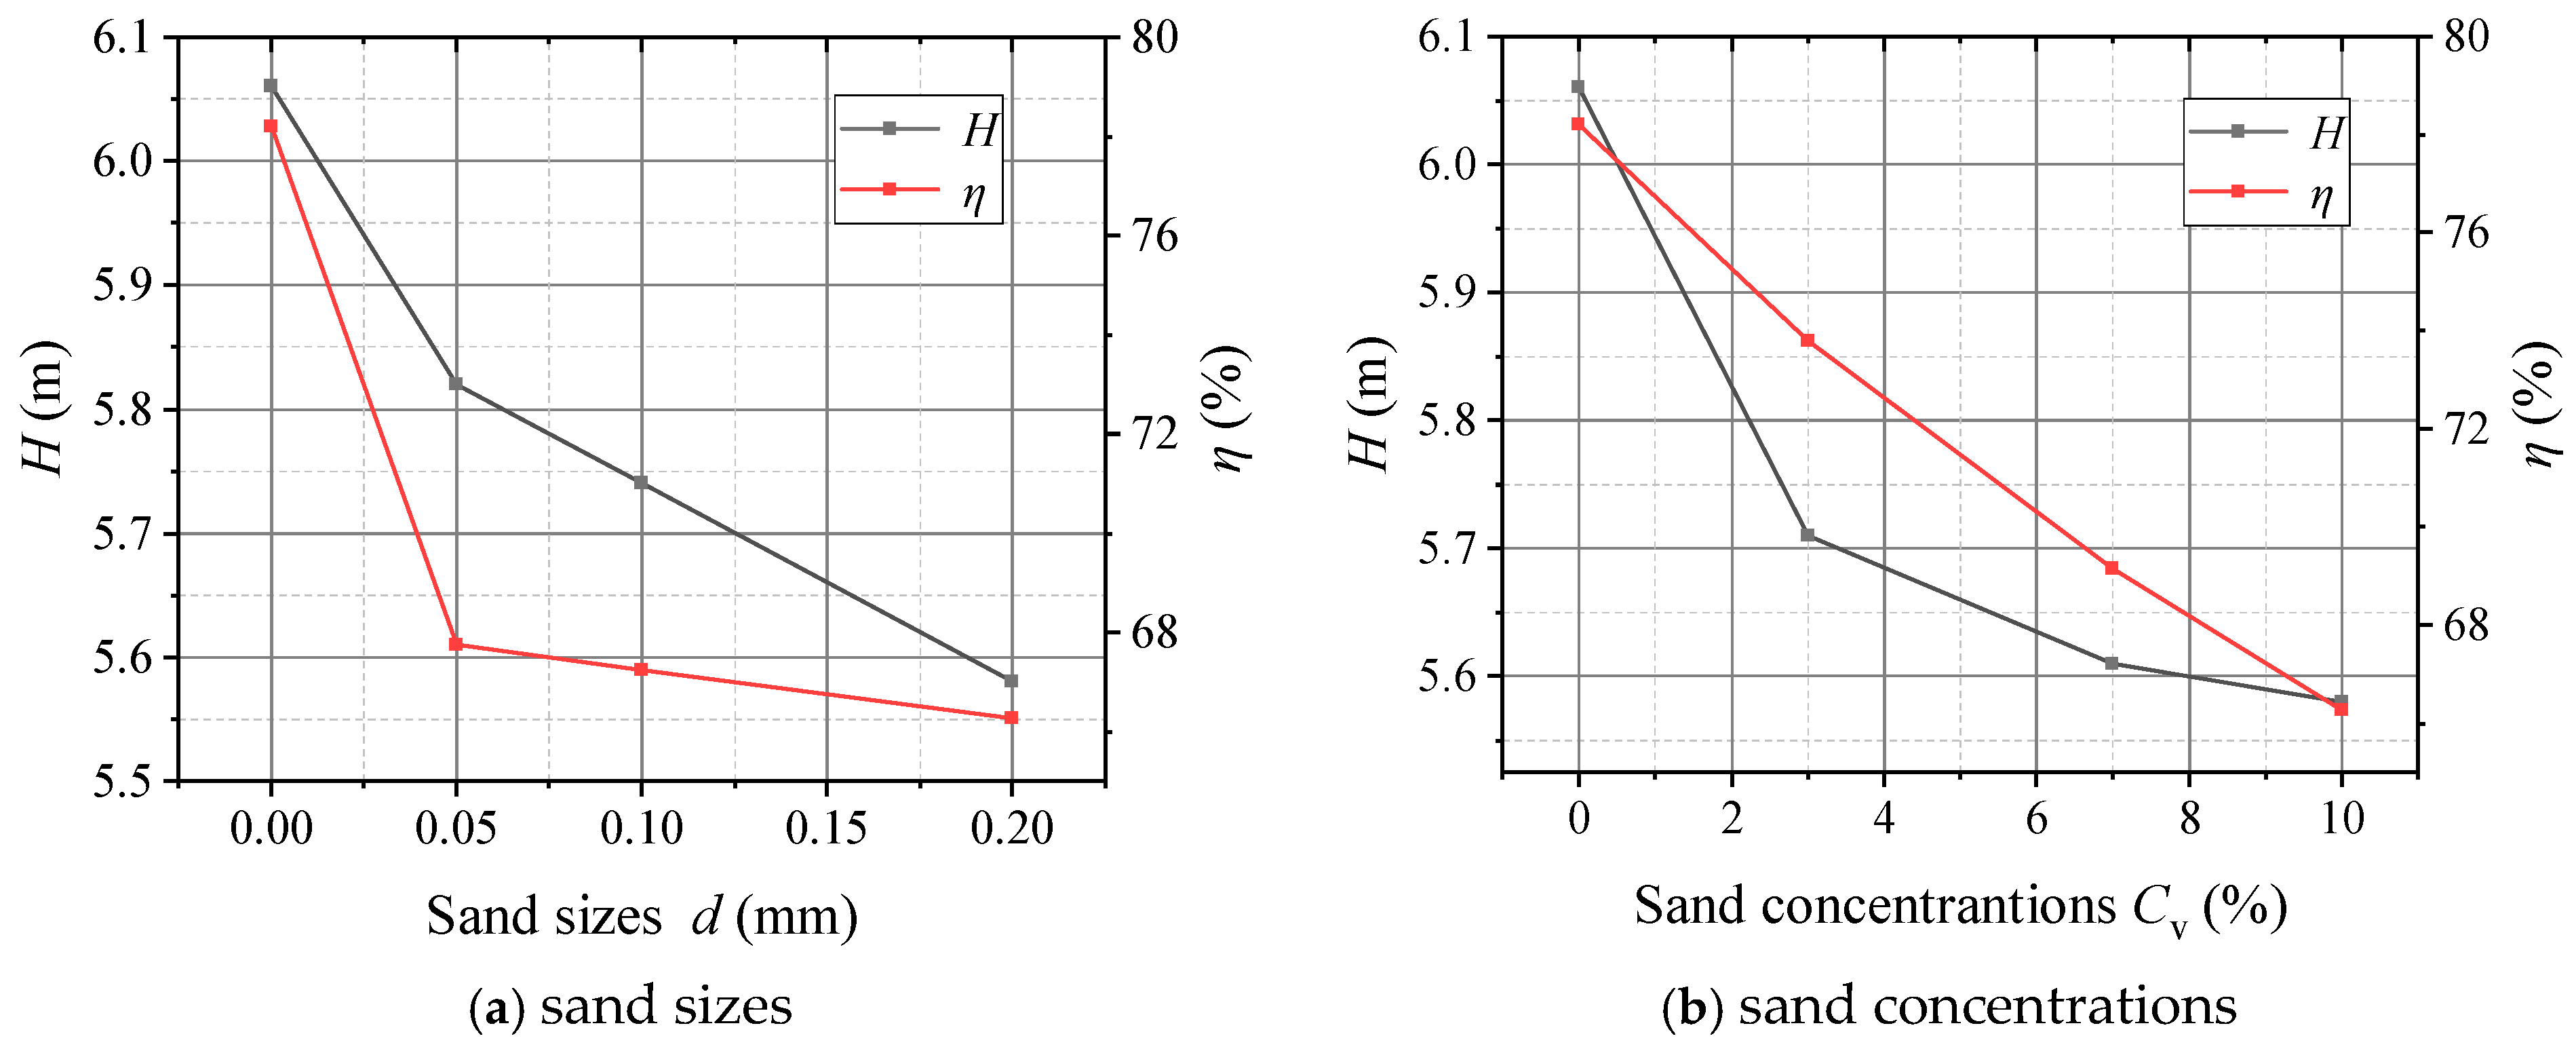
Figure 7 illustrates the variation in the pump’s hydraulic performance with increasing sand particle size and concentration. As shown in Figure 7a,b, both the head and efficiency exhibit a significant decrease. When the sand concentration remains constant and the particle diameters are d = 0.05 mm, 0.1 mm, and 0.2 mm, the pump head decreases by 4%, 5.2%, and 7.9%, respectively, while the efficiency decreases by 12.7%, 14%, and 15%, respectively. Conversely, when the particle size is constant and the sand volume concentrations are Cv = 3%, 5%, and 10%, the head decreases by 5.7%, 7.4%, and 7.9%, and the efficiency decreases by 5.6%, 11.5%, and 15%, respectively.
Figure 7.
Effect of different sand parameters on the hydraulic performance of the pump.
These results indicate that both increasing particle size and concentration cause a noticeable decline in head and efficiency, with the effect of concentration being more pronounced. Specifically, when the particle size is fixed, increasing sand concentration leads to a clear reduction in both head and efficiency. However, when particle size increases at a fixed concentration, the efficiency degradation becomes less severe. This can be attributed to the fact that larger sand particles correspond to a smaller number of particles per unit volume, thereby reducing the collision frequency among them.
During pump operation, the addition of solid particles alters the internal flow characteristics compared to the clear-water condition. The overall density of the working medium increases, and the solid particles are subjected to both gravitational and centrifugal forces from the impeller. Moreover, the presence of sand increases the effective viscosity of the mixture, resulting in higher flow resistance. The interaction between the particles and the liquid induces irregular motion and turbulence, leading to unstable flow conditions. The additional friction among particles and between particles and the fluid consumes more energy, ultimately causing a reduction in both pump head and efficiency.
4.2. Effect of Sand Parameters on the Flow Characteristics of the Pump
4.2.1. Effect of Sand Size on the Flow Characteristics
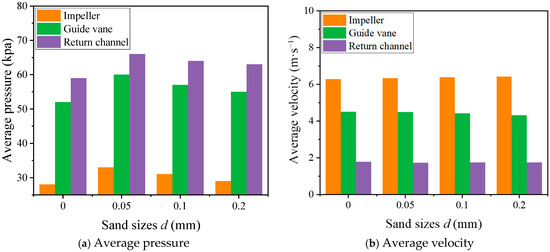
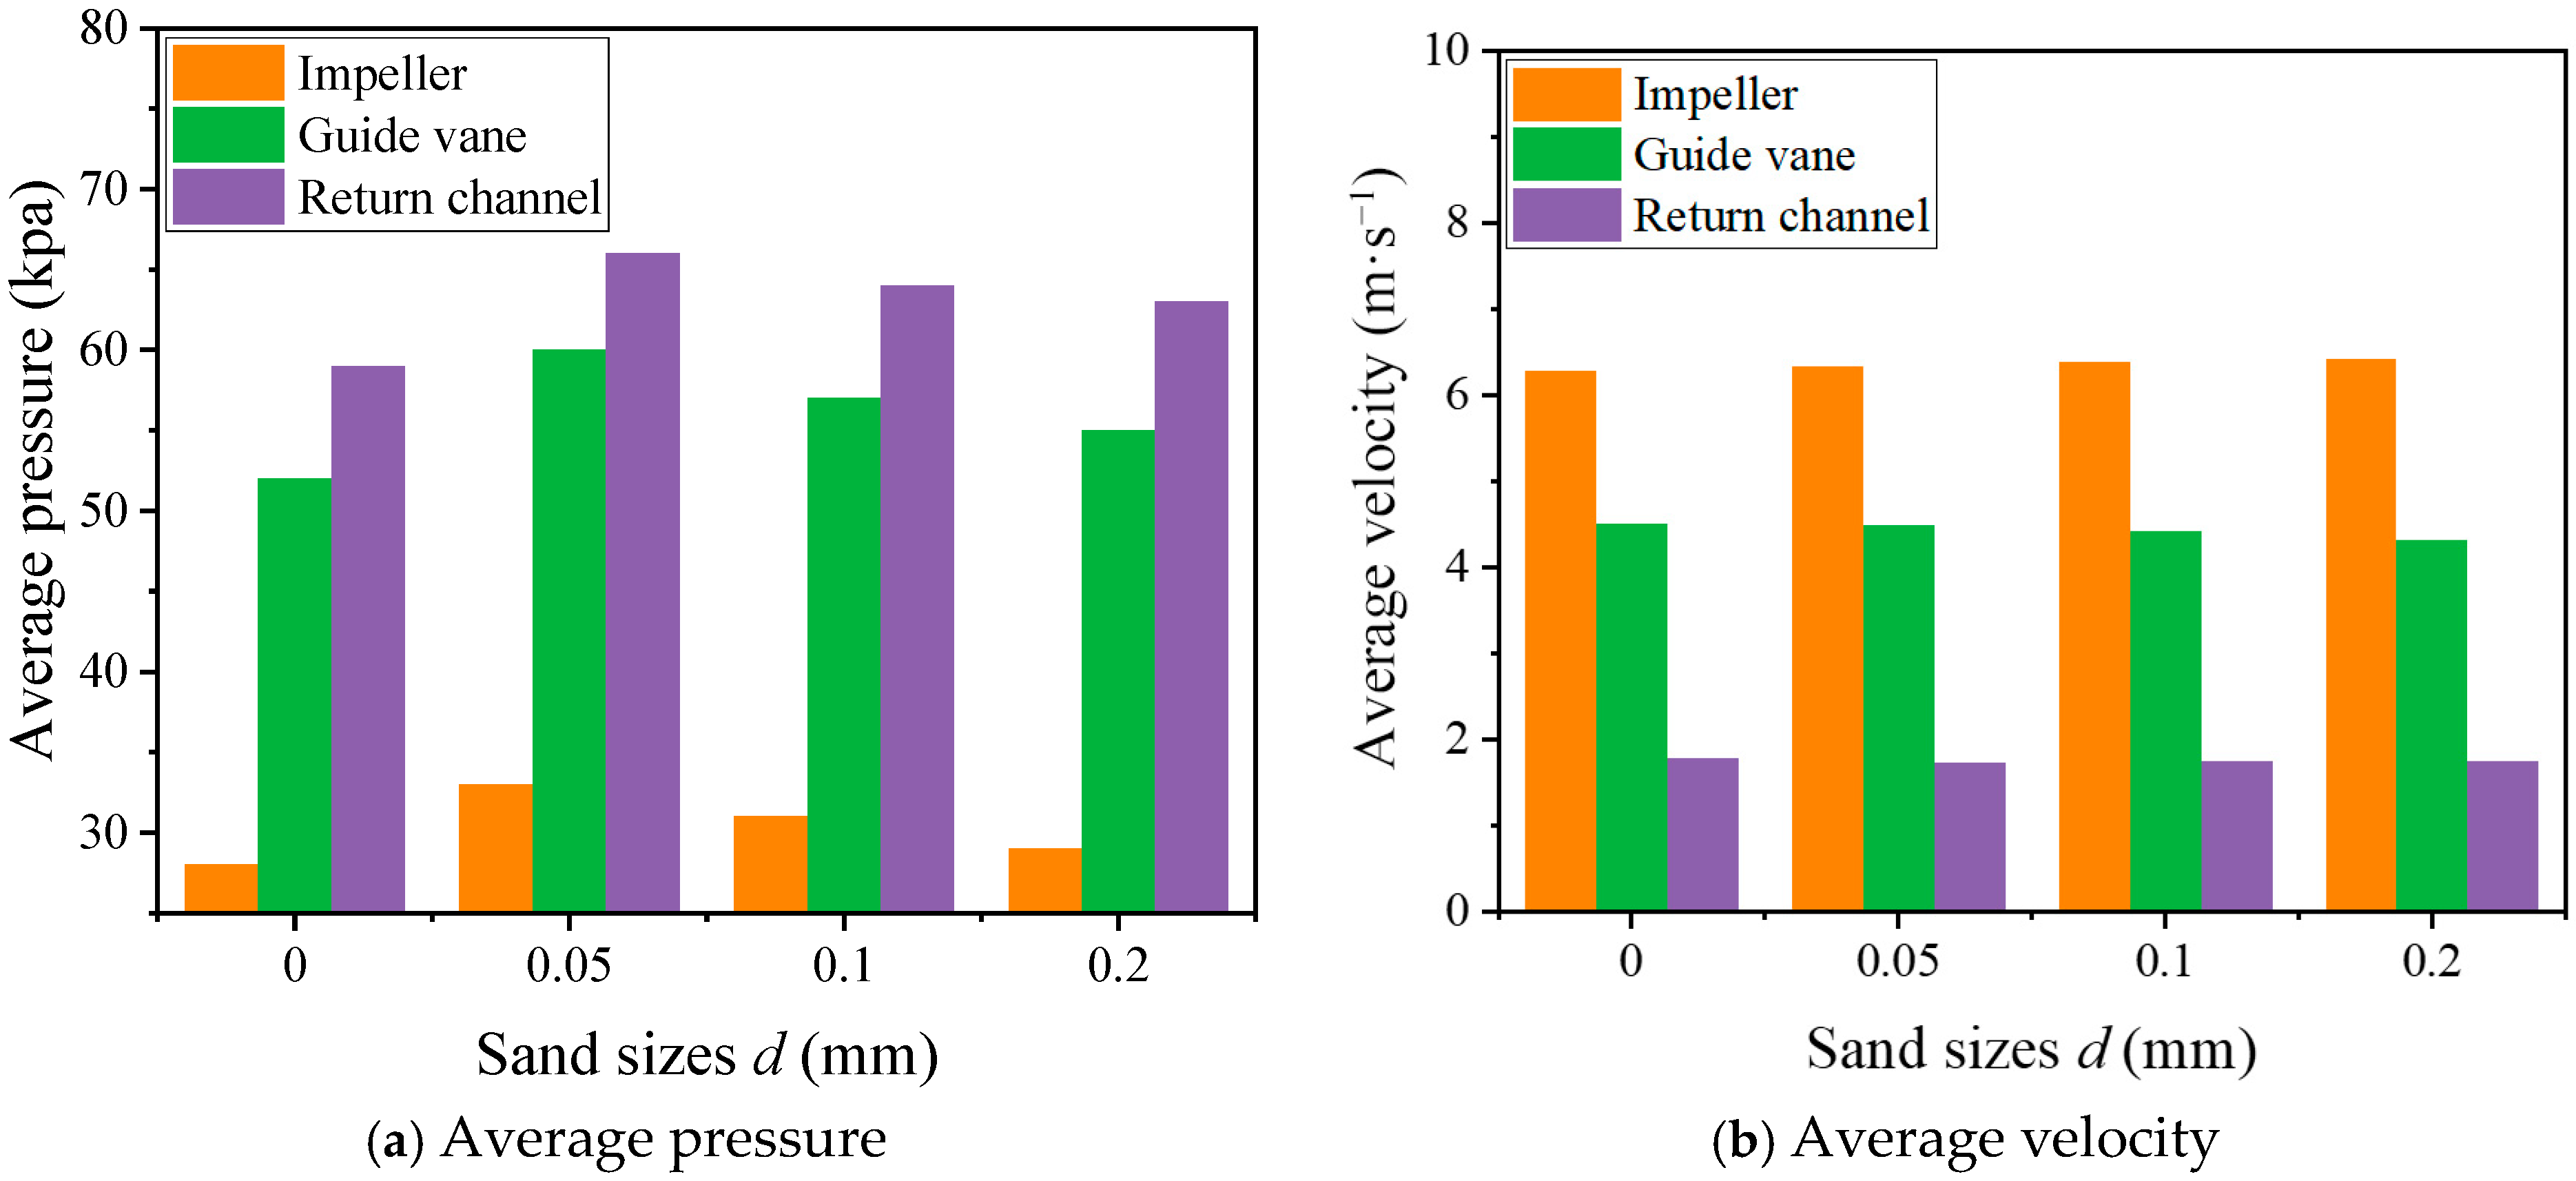
Figure 8a presents the variation in the average pressure of the flow-passage components under different particle sizes. It can be observed that the highest pressure occurs in the return vanes, while the lowest pressure is found in the impeller. The overall pressure in the sand-laden flow conditions is higher than that in the clear-water condition, which is attributed to the increase in both density and viscosity of the fluid after adding sand particles. Under sand-laden conditions, as the particle size increases, the total pressure gradually decreases. This is because, at the same sand concentration, smaller particles correspond to a larger particle count and more intense interparticle collisions, resulting in higher pressure.
Figure 8.
Average pressure and velocity of different flow components under different sand sizes.
Figure 8b shows the variation in the average velocity of the flow-passage components. Due to the high rotational speed of the impeller, it acquires greater kinetic energy, and its average velocity is higher than that of the guide vanes and return vanes. As the fluid flows from the impeller to the guide and return vanes, it experiences deceleration and pressurization, leading to a gradual reduction in velocity. The influence of particle size on the velocity of each flow-passage component is not significant; however, a slight increase in the average velocity is observed in the impeller region. This is because larger particles, having greater mass, gain more kinetic energy at the same rotational speed, while the opposite trend is seen in the downstream components. Overall, the effect of increasing particle size on flow velocity is relatively limited, without causing pronounced fluctuations or noticeable trends.
- (1)
- Effect of Sand Size on the Flow in the Impeller
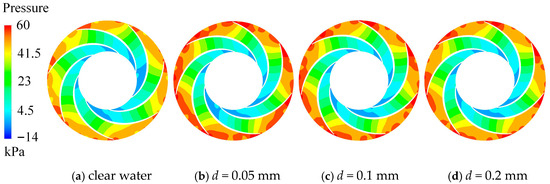
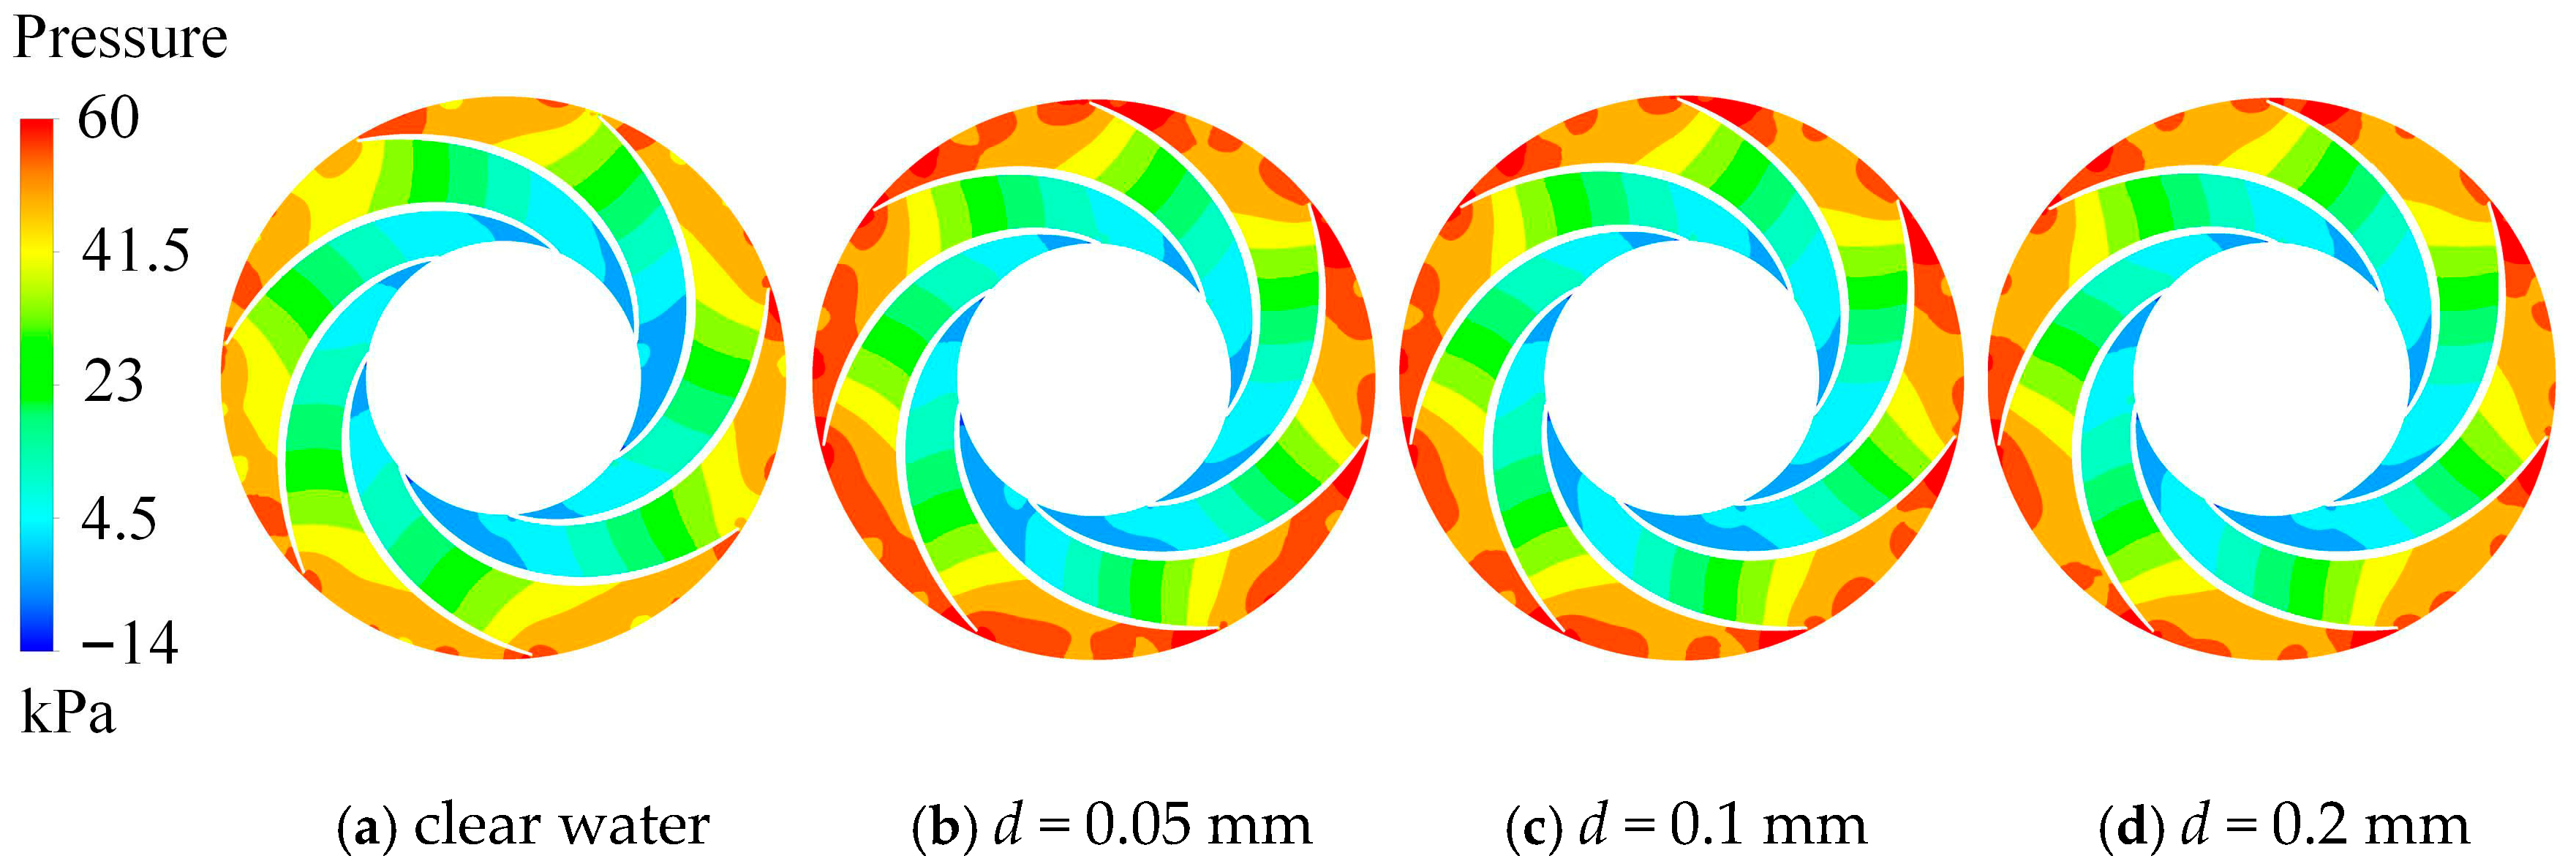
Figure 9 shows the pressure contours at the mid-span section of the impeller under different particle sizes. A comparison between the clear-water and sand-laden conditions indicates that the overall pressure distributions are largely similar. The lowest pressure occurs at the impeller inlet, and the pressure gradually increases as the fluid moves along the impeller passage. This increase is primarily caused by the high rotational speed of the impeller, which accelerates the fluid and generates a centrifugal force that drives the flow along the blade surface, resulting in a gradual pressure rise. A low-pressure region forms near the impeller inlet due to the radial motion of the fluid under the centrifugal effect, where cavitation may occur.
Figure 9.
Pressure distribution on the middle section of the impeller with different sand sizes.
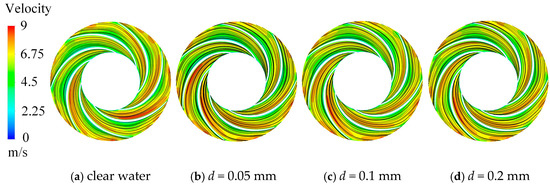
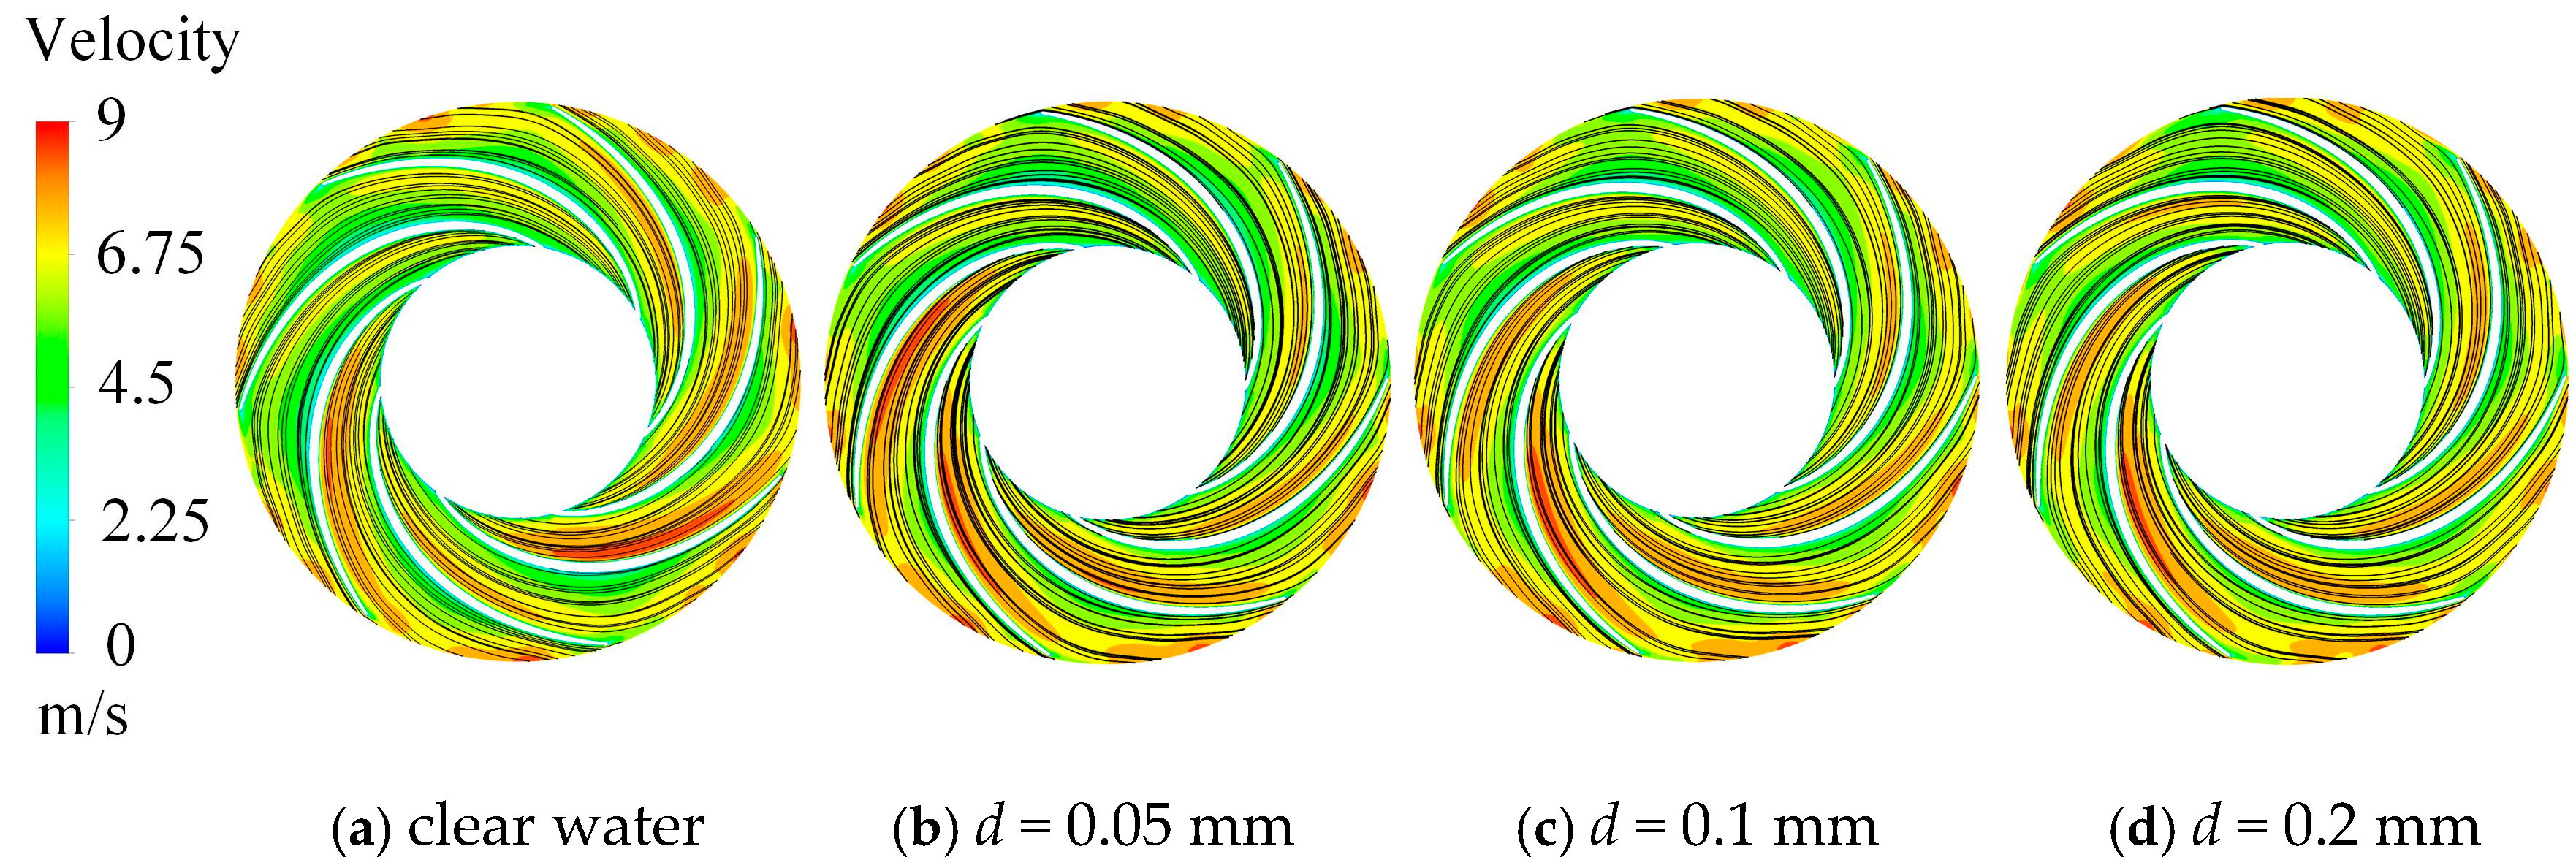
Figure 10 presents the velocity streamlines at the same cross-section under different particle sizes. Influenced by centrifugal force and the pressure gradient, high-velocity regions are mainly distributed along the suction surface and at the impeller outlet. Since both inlet velocity and rotational speed remain constant across conditions, the velocity distribution differences are minor. Under clear-water conditions, the streamlines are relatively uniform. After adding sand particles, streamline clustering appears near the blade pressure side, where denser color regions indicate intensified flow concentration. This phenomenon is attributed to the increased frictional interaction between the particles and the liquid, leading to a slight non-uniformity in the flow. Overall, the presence of sand particles exerts only a limited influence on the impeller flow pattern and does not cause strong turbulence or severe distortion.
Figure 10.
Velocity distribution on the middle section of the impeller with different sand sizes.
- (2)
- Effect of Sand Size on the Flow in the Guide Vane
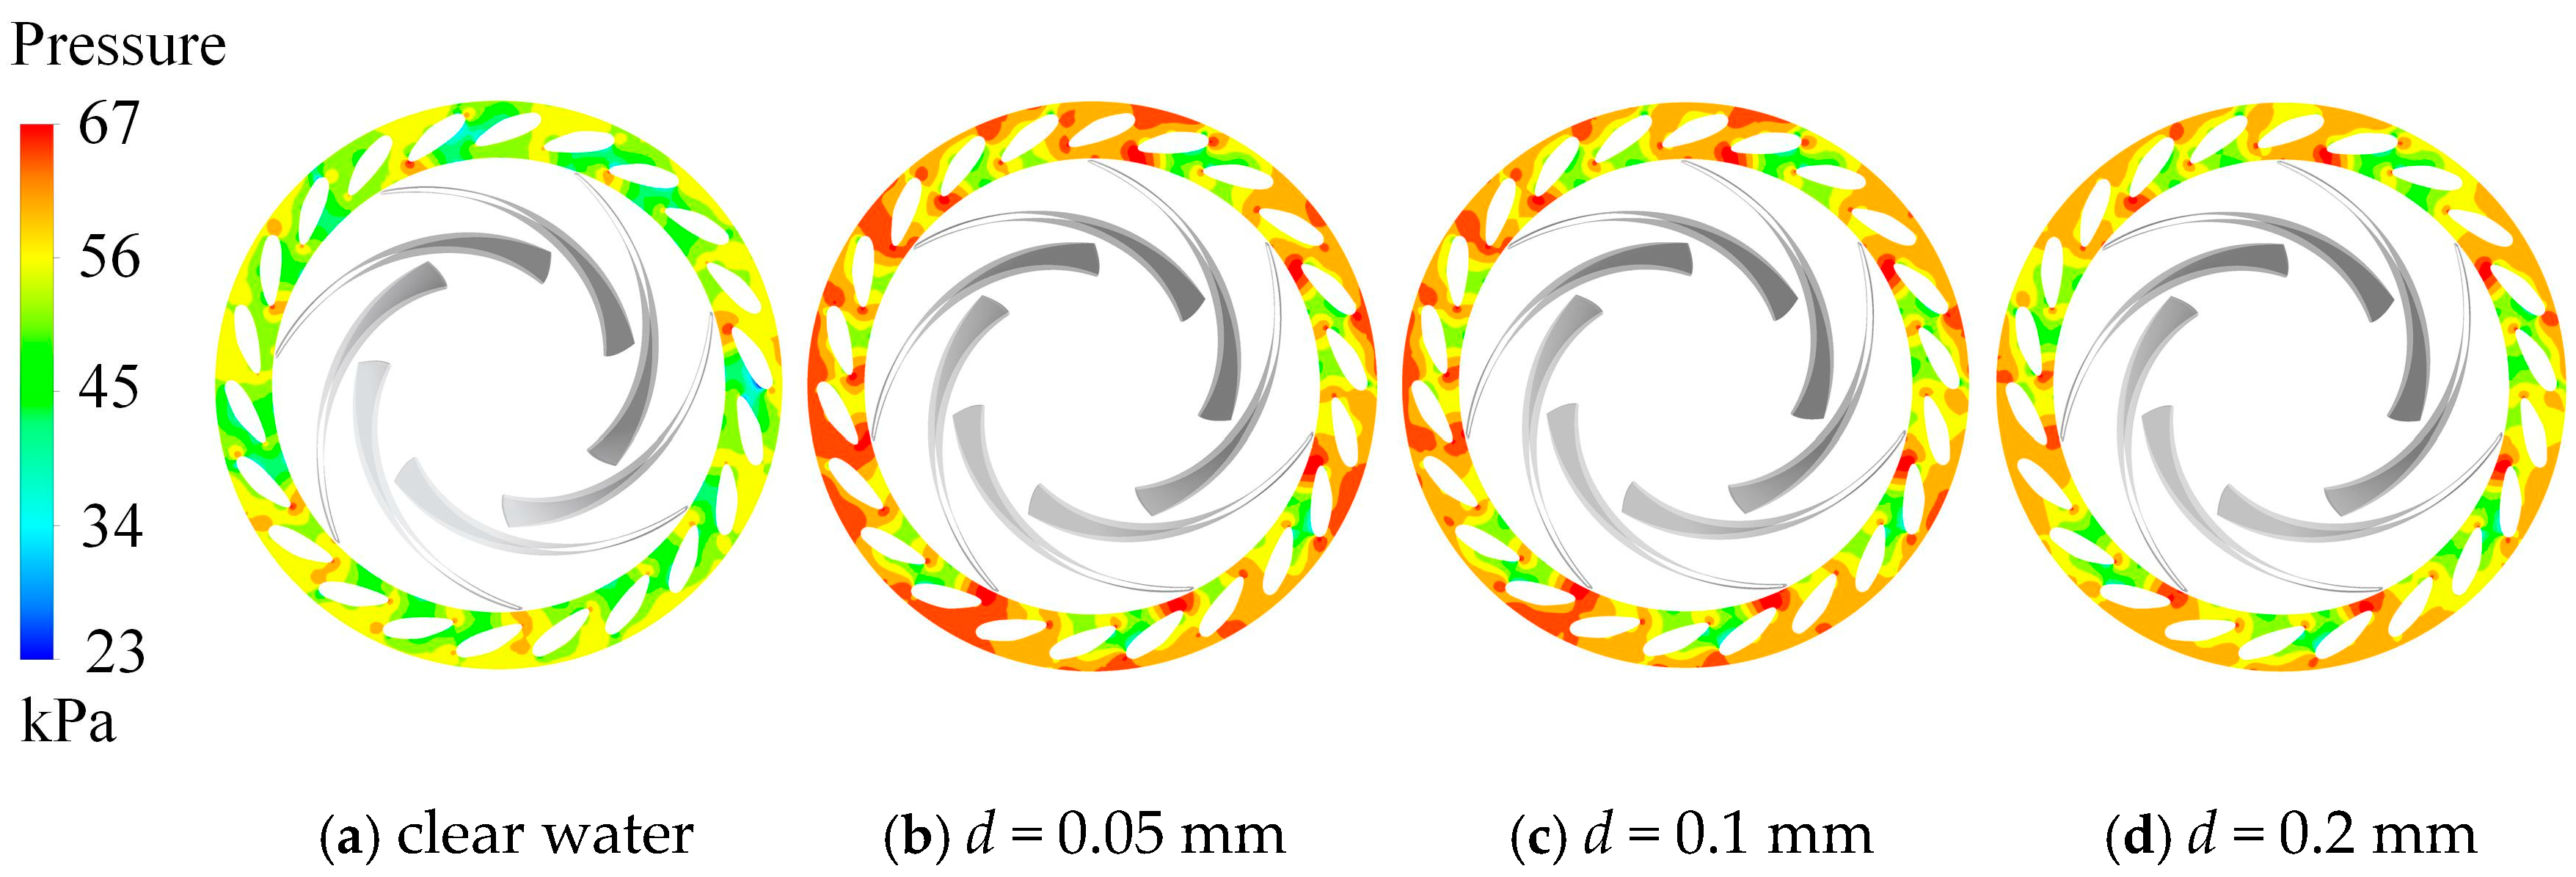
Figure 11 shows the pressure contours at the mid-span section of the guide vanes under different particle sizes. For both clear-water and sand-laden conditions, the pressure increases gradually from the inlet to the outlet. This is because the guide vanes convert part of the kinetic energy of the incoming flow from the impeller into pressure energy by redirecting and decelerating the fluid. A noticeable high-pressure region appears at the leading edge of the guide vane blades, where the high-speed flow exiting the impeller impinges directly on the vane surface, causing a sudden velocity drop and a local pressure rise.
Figure 11.
Pressure distribution on the middle section of the guide vane with different sand sizes.
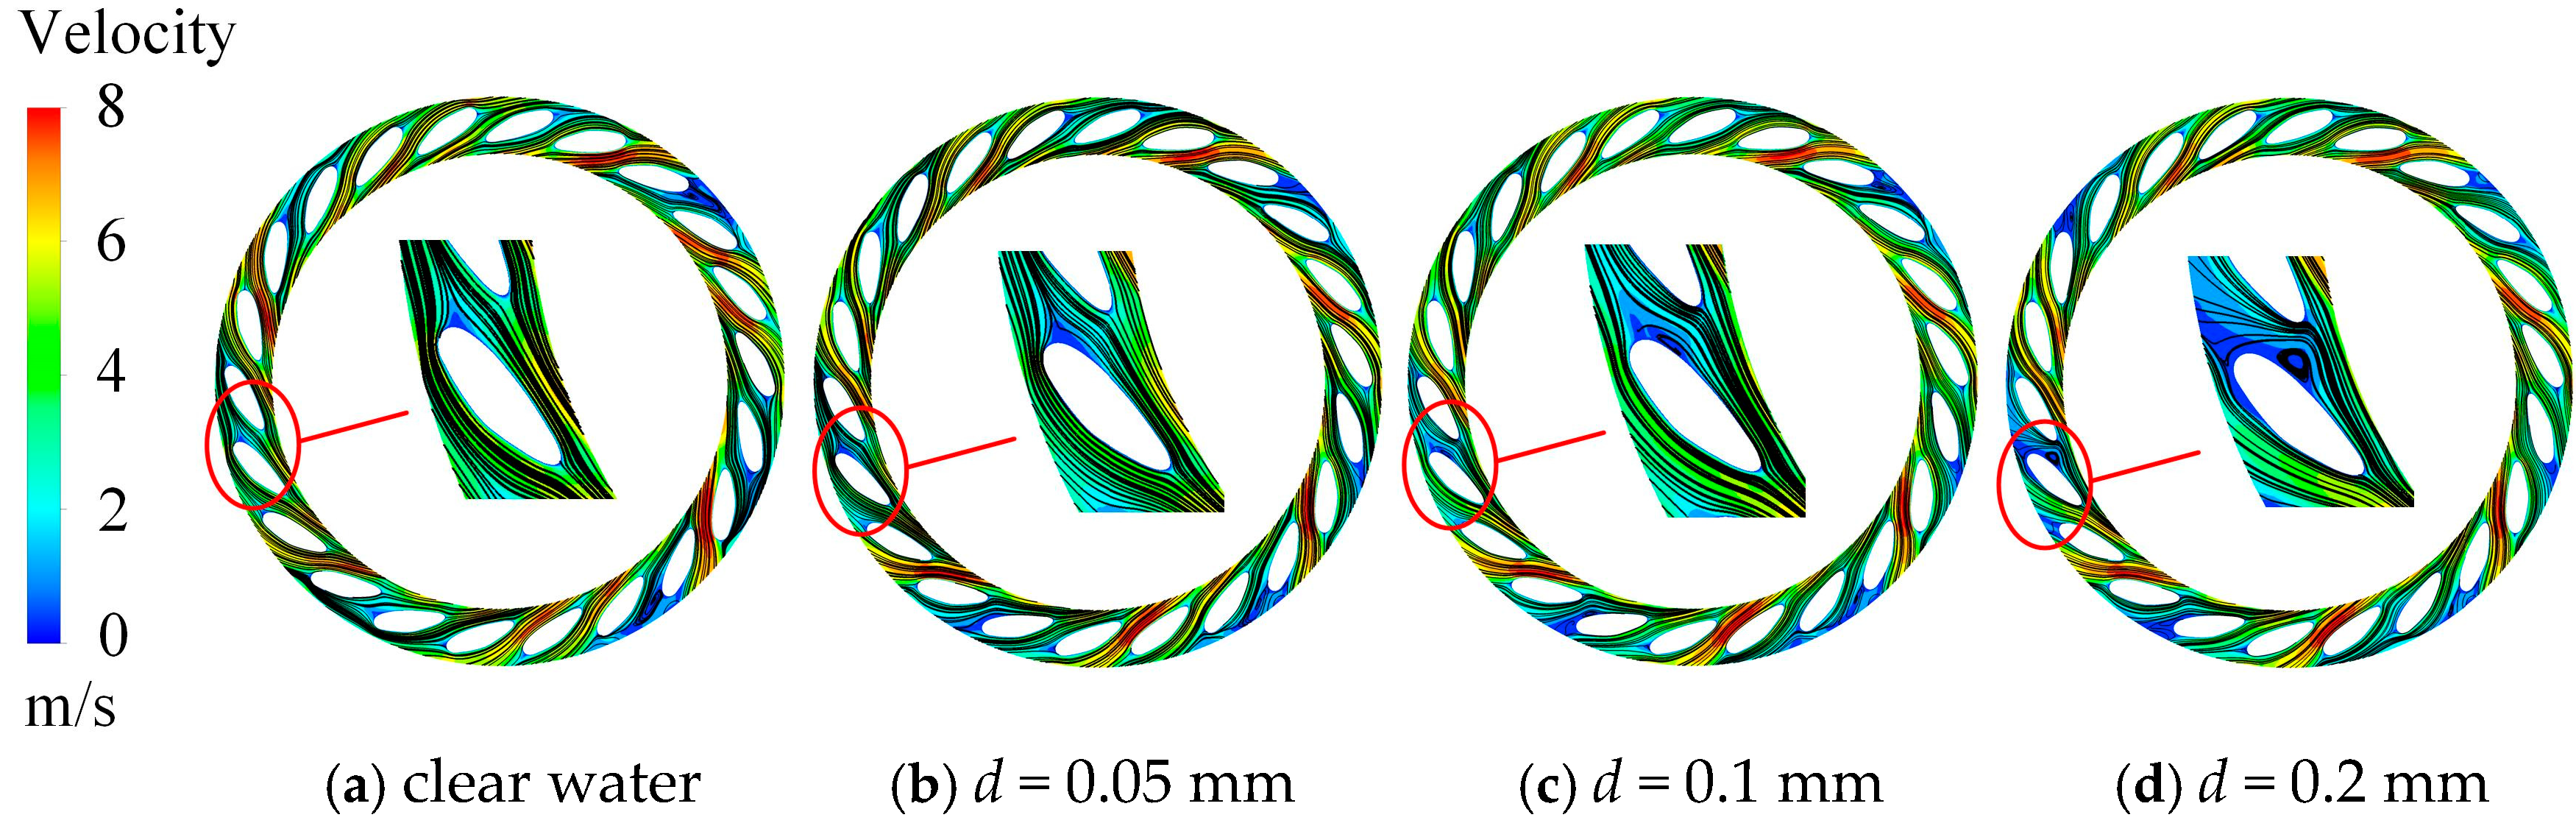
Figure 12 illustrates the velocity streamlines at the same section. The high-velocity regions in the guide vanes are strongly affected by the impeller outflow. With the addition of sand particles, the flow structure within the guide vanes changes significantly. Under clear-water conditions and small particle sizes, the streamlines remain smooth and continuous. However, as particle size increases, vortices gradually appear and become larger. The increased particle size alters the effective viscosity and rheological behavior of the flow. Larger sand particles may increase flow resistance, cause local blockage, and promote vortex formation within the guide vane passages.
Figure 12.
Velocity distribution on the middle section of the guide vane with different sand sizes.
- (3)
- Effect of Sand Size on the Flow in the Return Channel
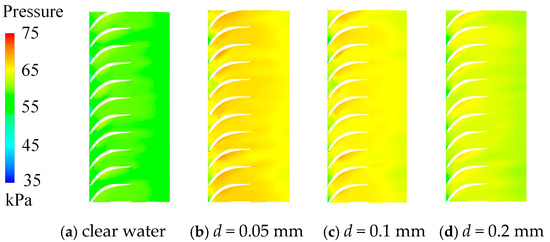
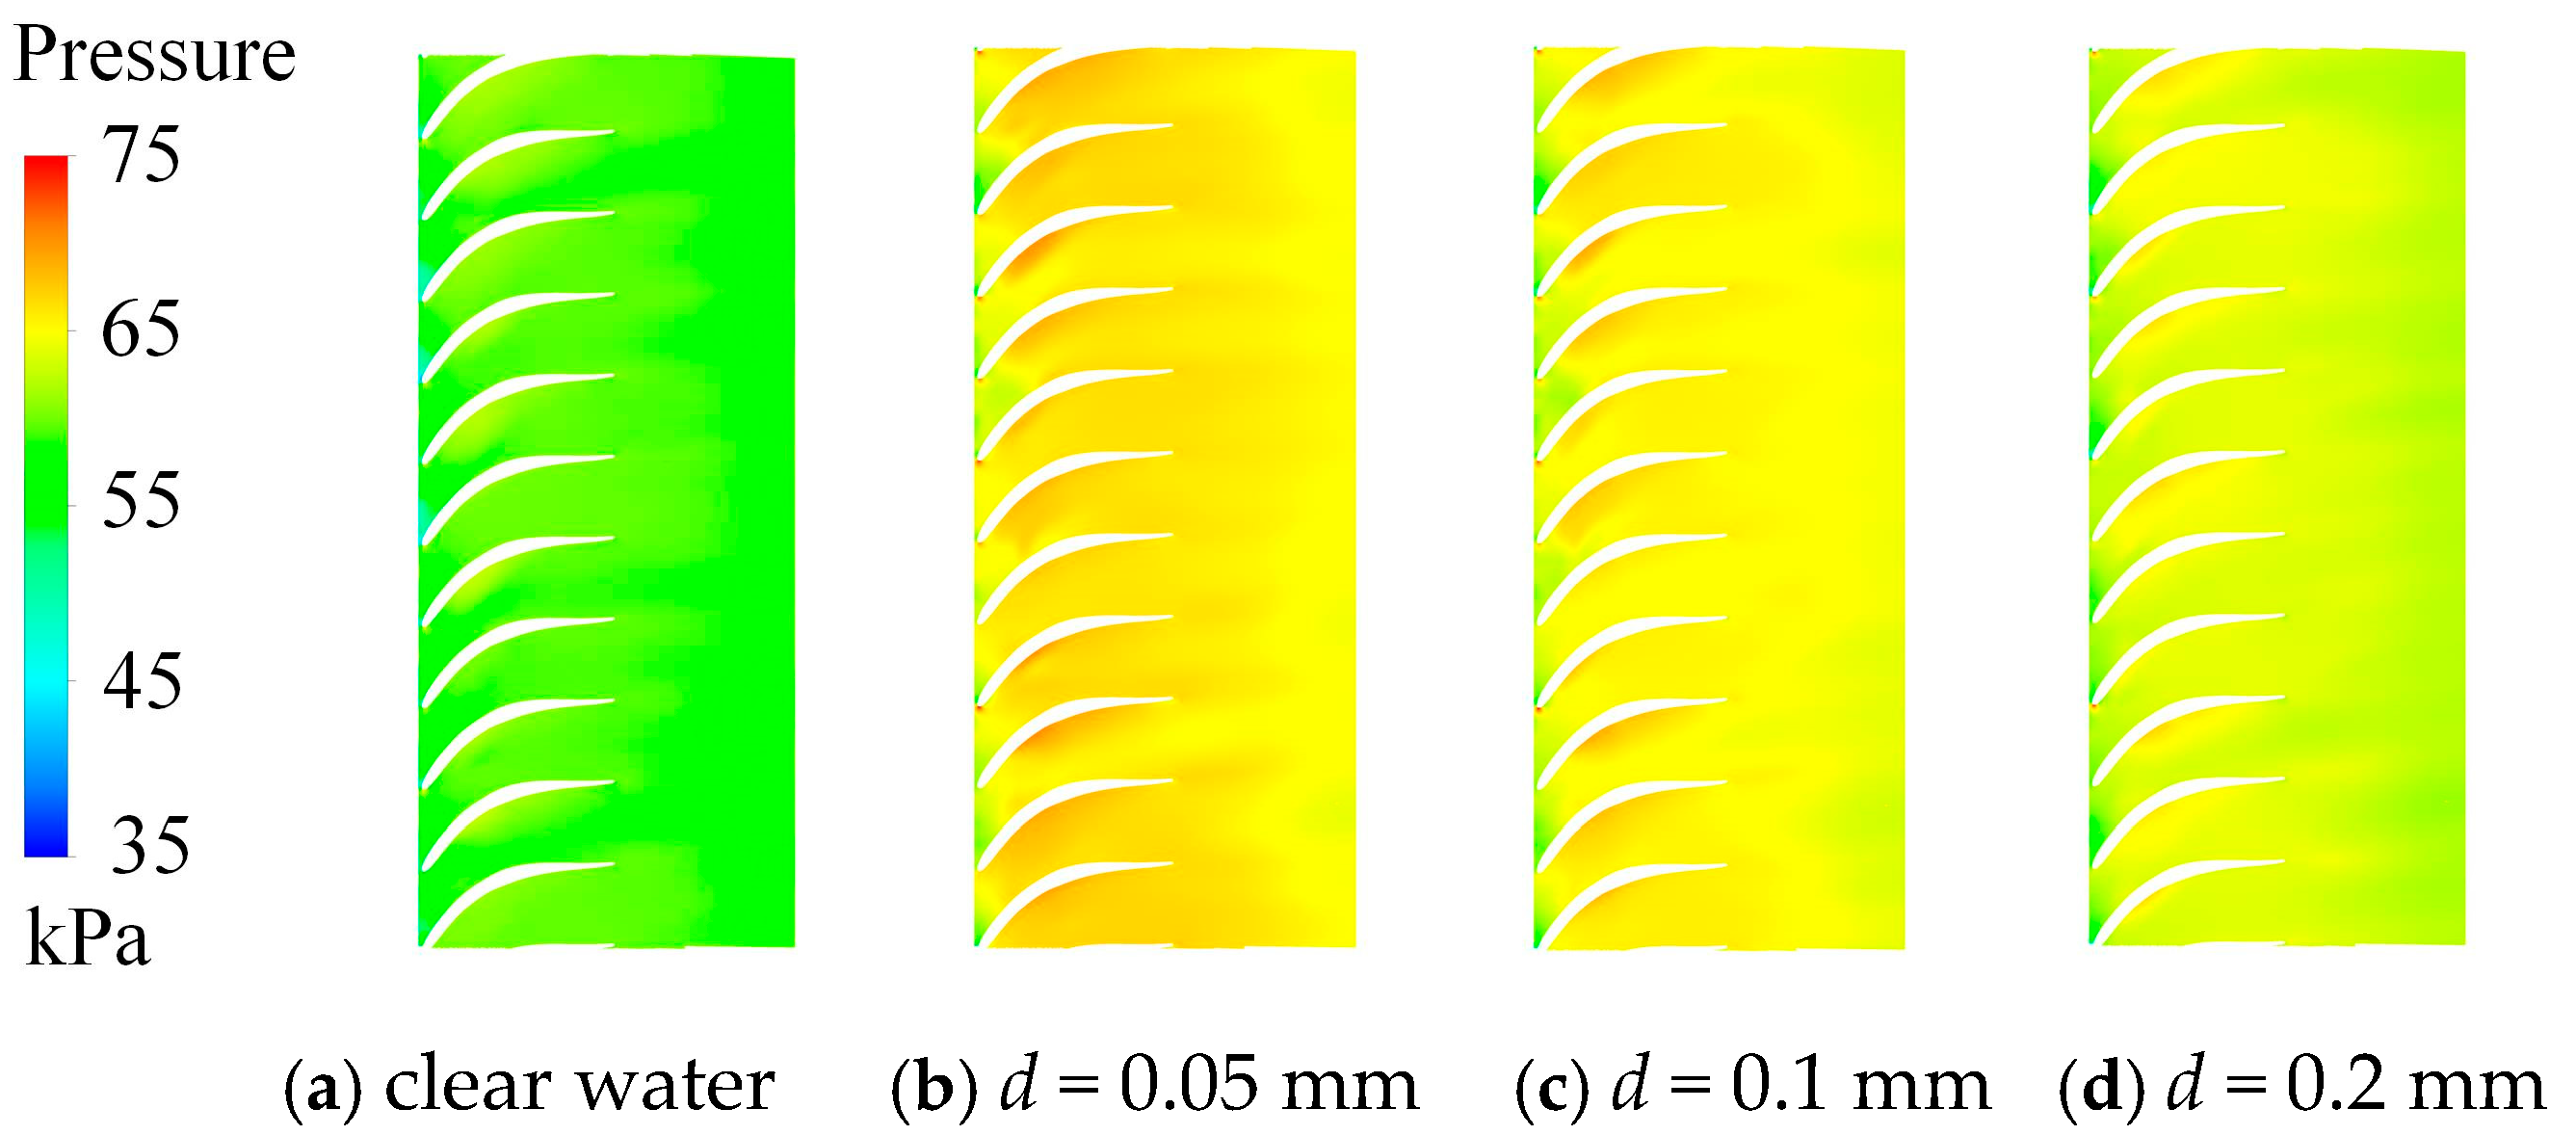
Due to the structural complexity of the return vane, the mid-span section cannot fully capture the internal flow variations. Therefore, an unfolded view of the return vane passage is analyzed. Figure 13 shows the corresponding pressure contours. It can be observed that the pressure increases along the flow direction and reaches its maximum on the blade surface, where it is significantly higher than that in the inlet and outlet regions. This is because the return vane decelerates the fluid while redirecting its flow path, thereby converting kinetic energy into pressure energy. The overall pressure under sand-laden conditions is higher than that under clear-water conditions. In the clear-water case, the pressure transition is relatively smooth, whereas in the sand-laden case, a high-pressure zone appears near the leading edge of the return vane blades due to direct particle impact on the vane surface.
Figure 13.
Pressure distribution in the return channel with different sand sizes (span = 0.5).
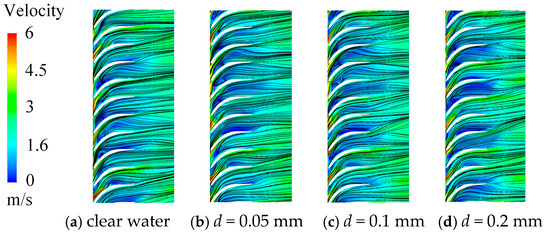
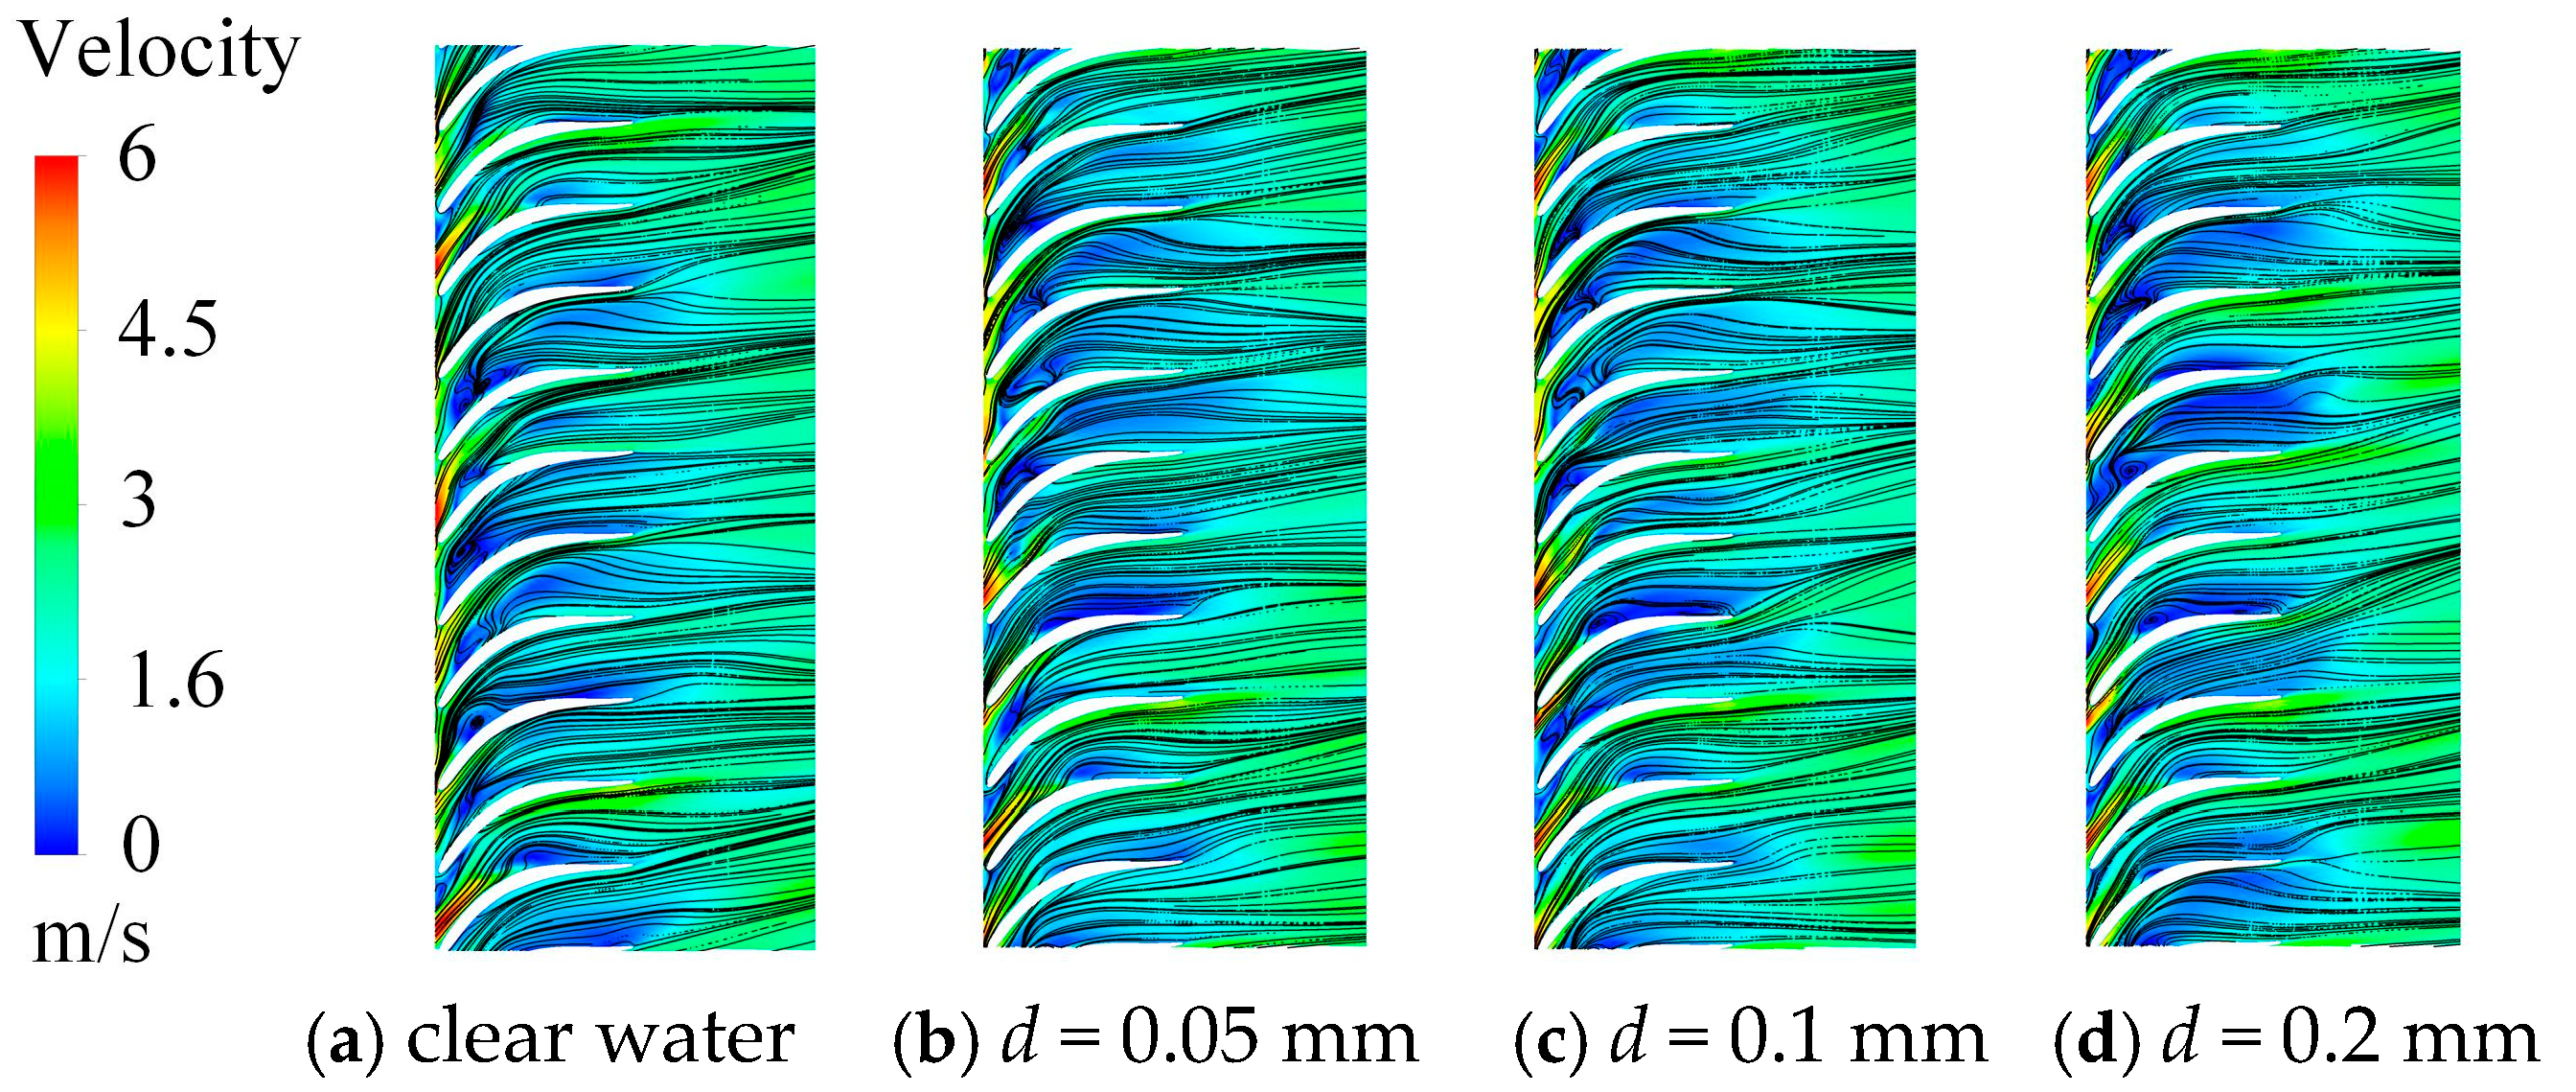
Figure 14 displays the velocity streamlines in the unfolded return vane channel. The flow enters the return vane from the guide vane with a relatively high velocity. As the flow passes through the return vane blades, its kinetic energy is gradually dissipated, resulting in a lower velocity at the outlet. Downstream of the blades, the velocity increases slightly due to gravitational acceleration. A comparison of the streamline patterns reveals that the presence of particles increases flow resistance, enlarges the low-velocity zones, and enhances the occurrence of recirculation and vortex structures.
Figure 14.
Velocity distribution in the return channel with different sand sizes (span = 0.5).
4.2.2. Effect of Sand Concentration on the Flow Characteristics
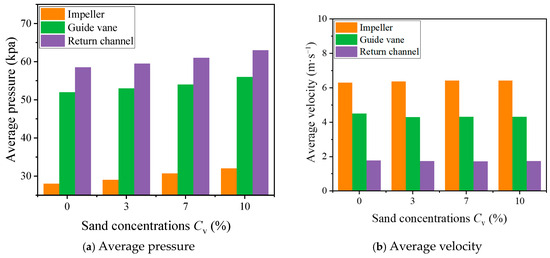
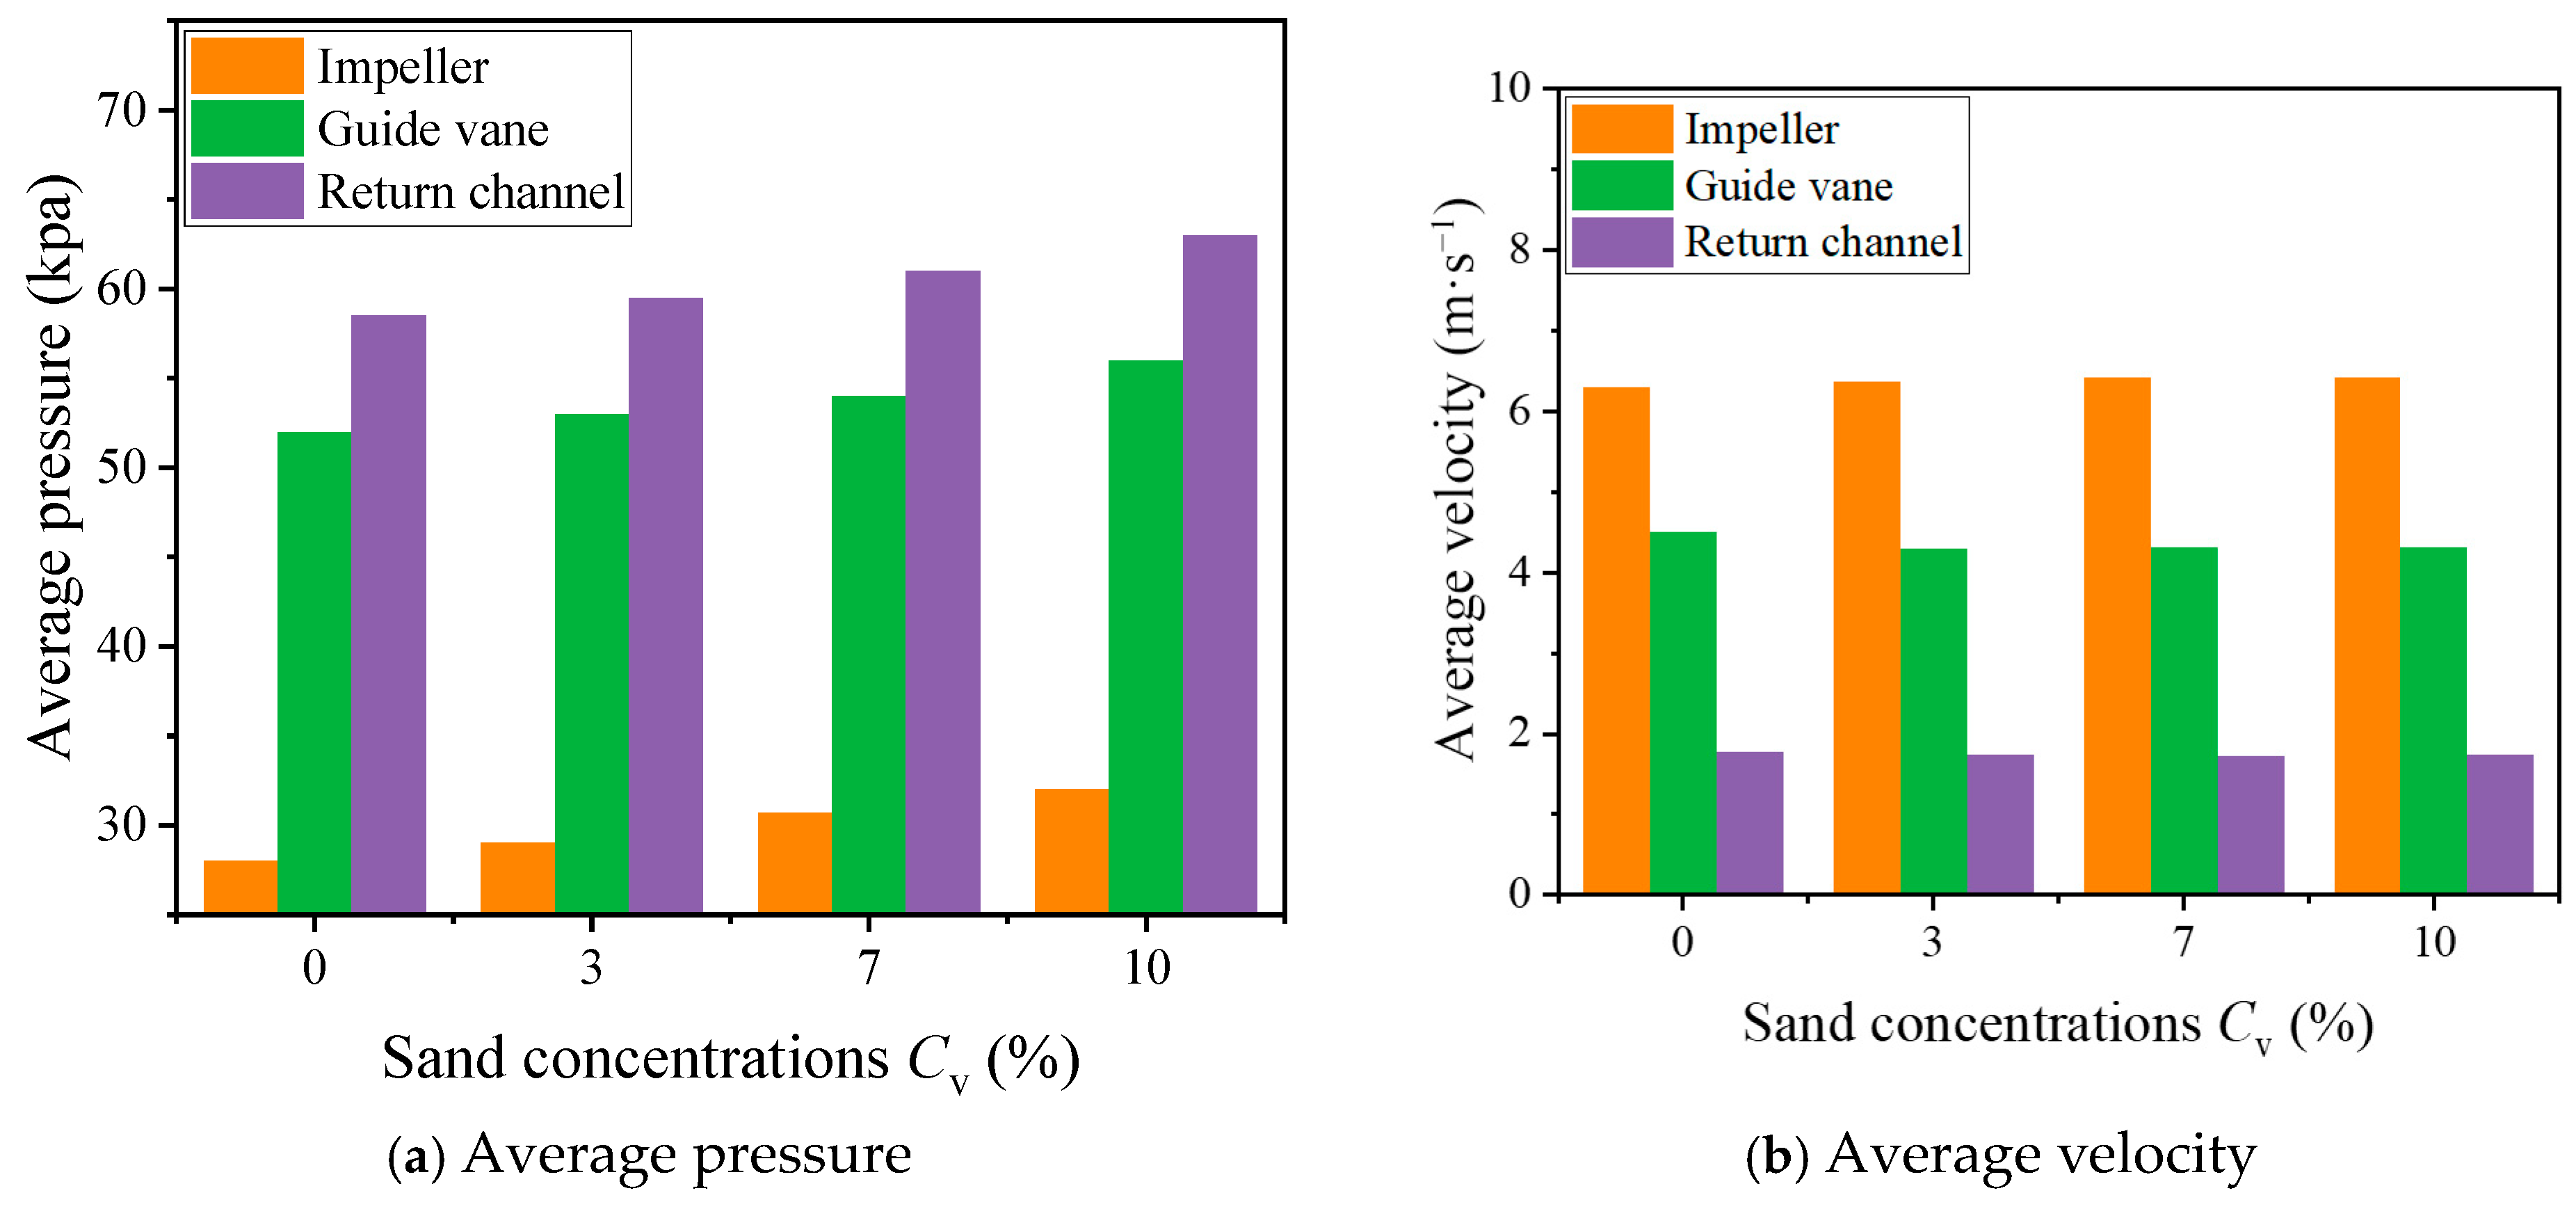
Figure 15a illustrates the variation in the average pressure in each flow-passage component under different sand concentrations. It can be seen that the average pressure increases progressively from the impeller to the return vanes. Compared with the clear-water condition, the average pressure under sand-laden flow is noticeably higher, and it exhibits a steady upward trend with increasing sand concentration. This is attributed to the larger number of sand particles, which increases the mixture density and consequently enhances the overall pressure within the passage.
Figure 15.
Average pressure and velocity of different flow components under different sand concentrations.
Figure 15b shows the corresponding average velocity distributions of the main hydraulic components. The mean velocity decreases gradually from the impeller to the guide and return vanes. Variations in velocity with changing sand concentration are relatively minor, except for a slight increase observed in the impeller region. Overall, the results indicate that the influence of sand concentration on flow velocity is limited, whereas its impact on the overall pressure field of the pump is significantly more pronounced.
- (1)
- Effect of Sand Concentration on the Flow in the Impeller
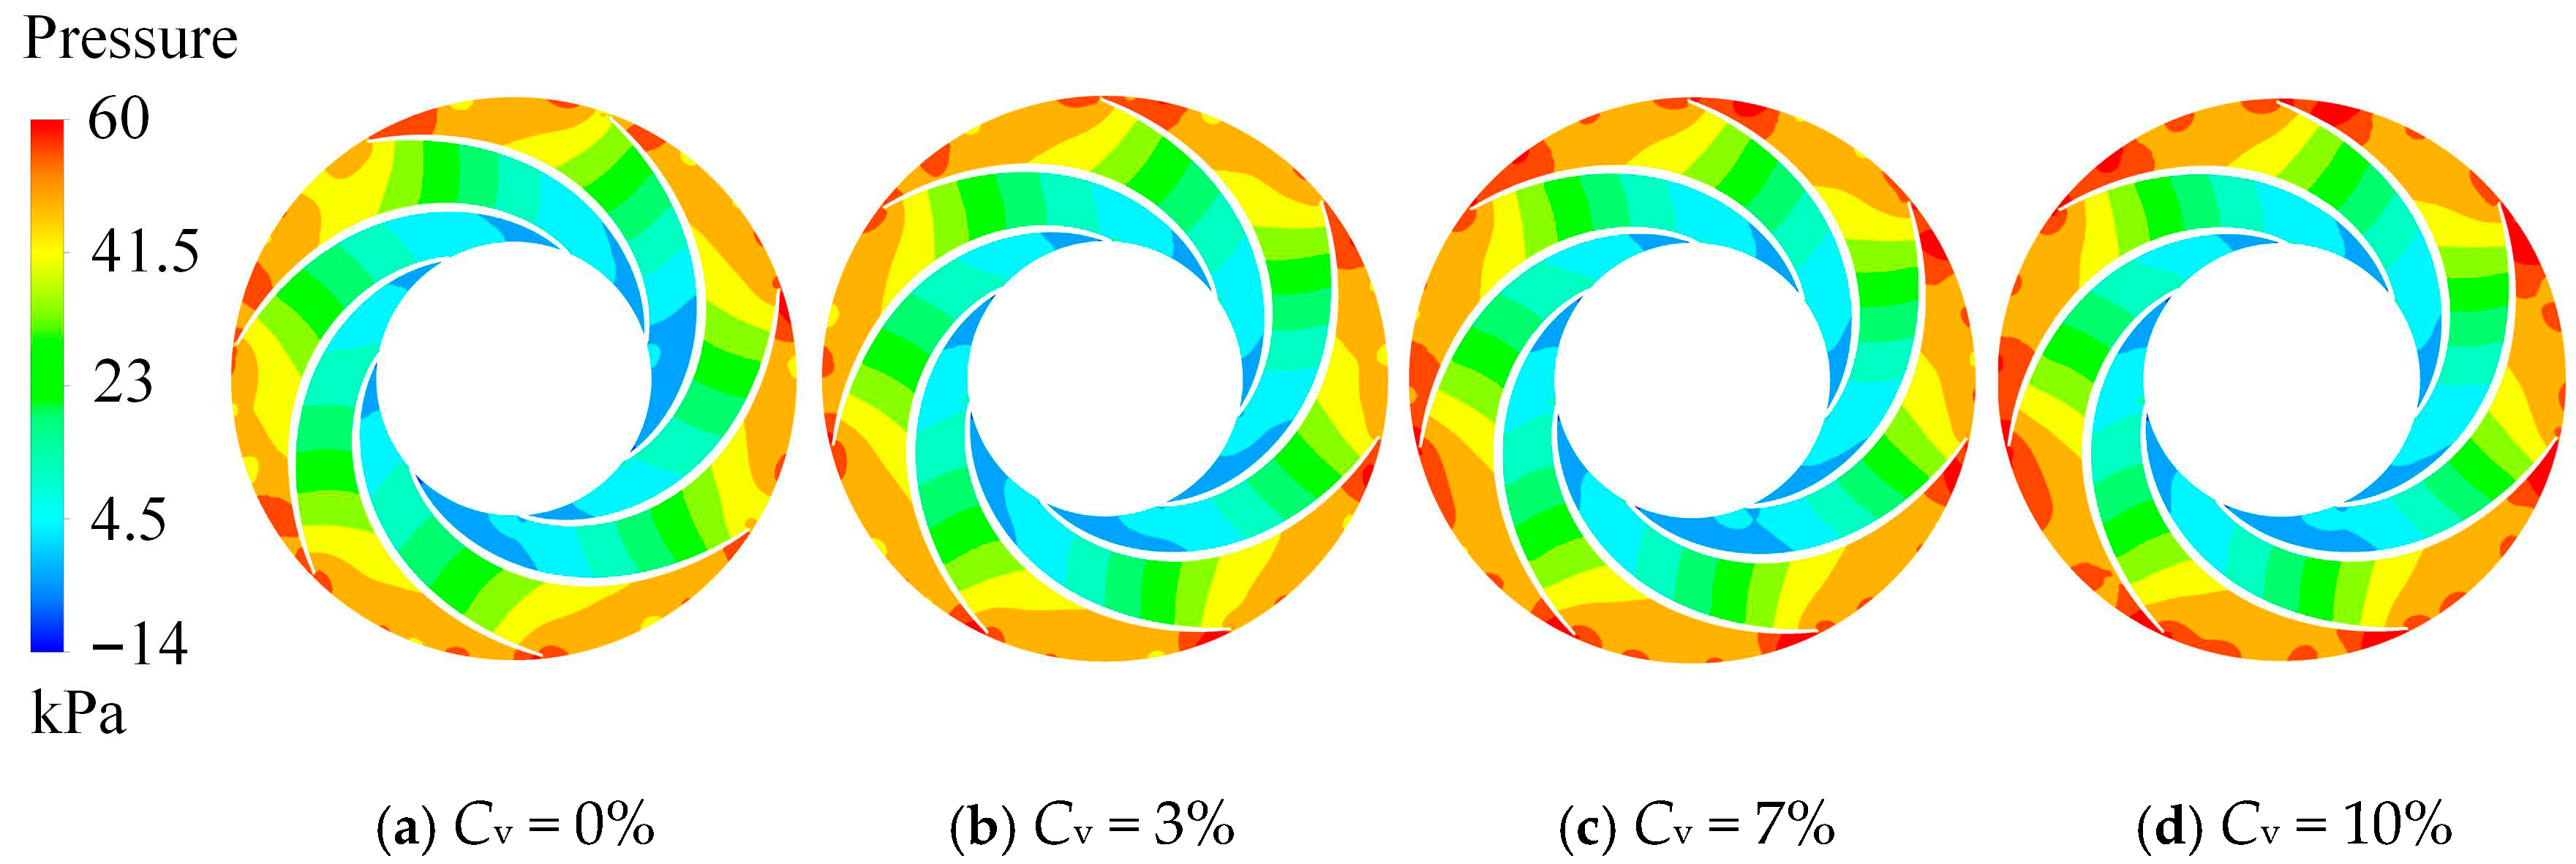
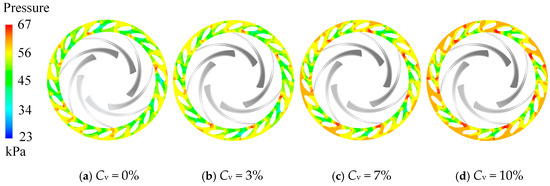
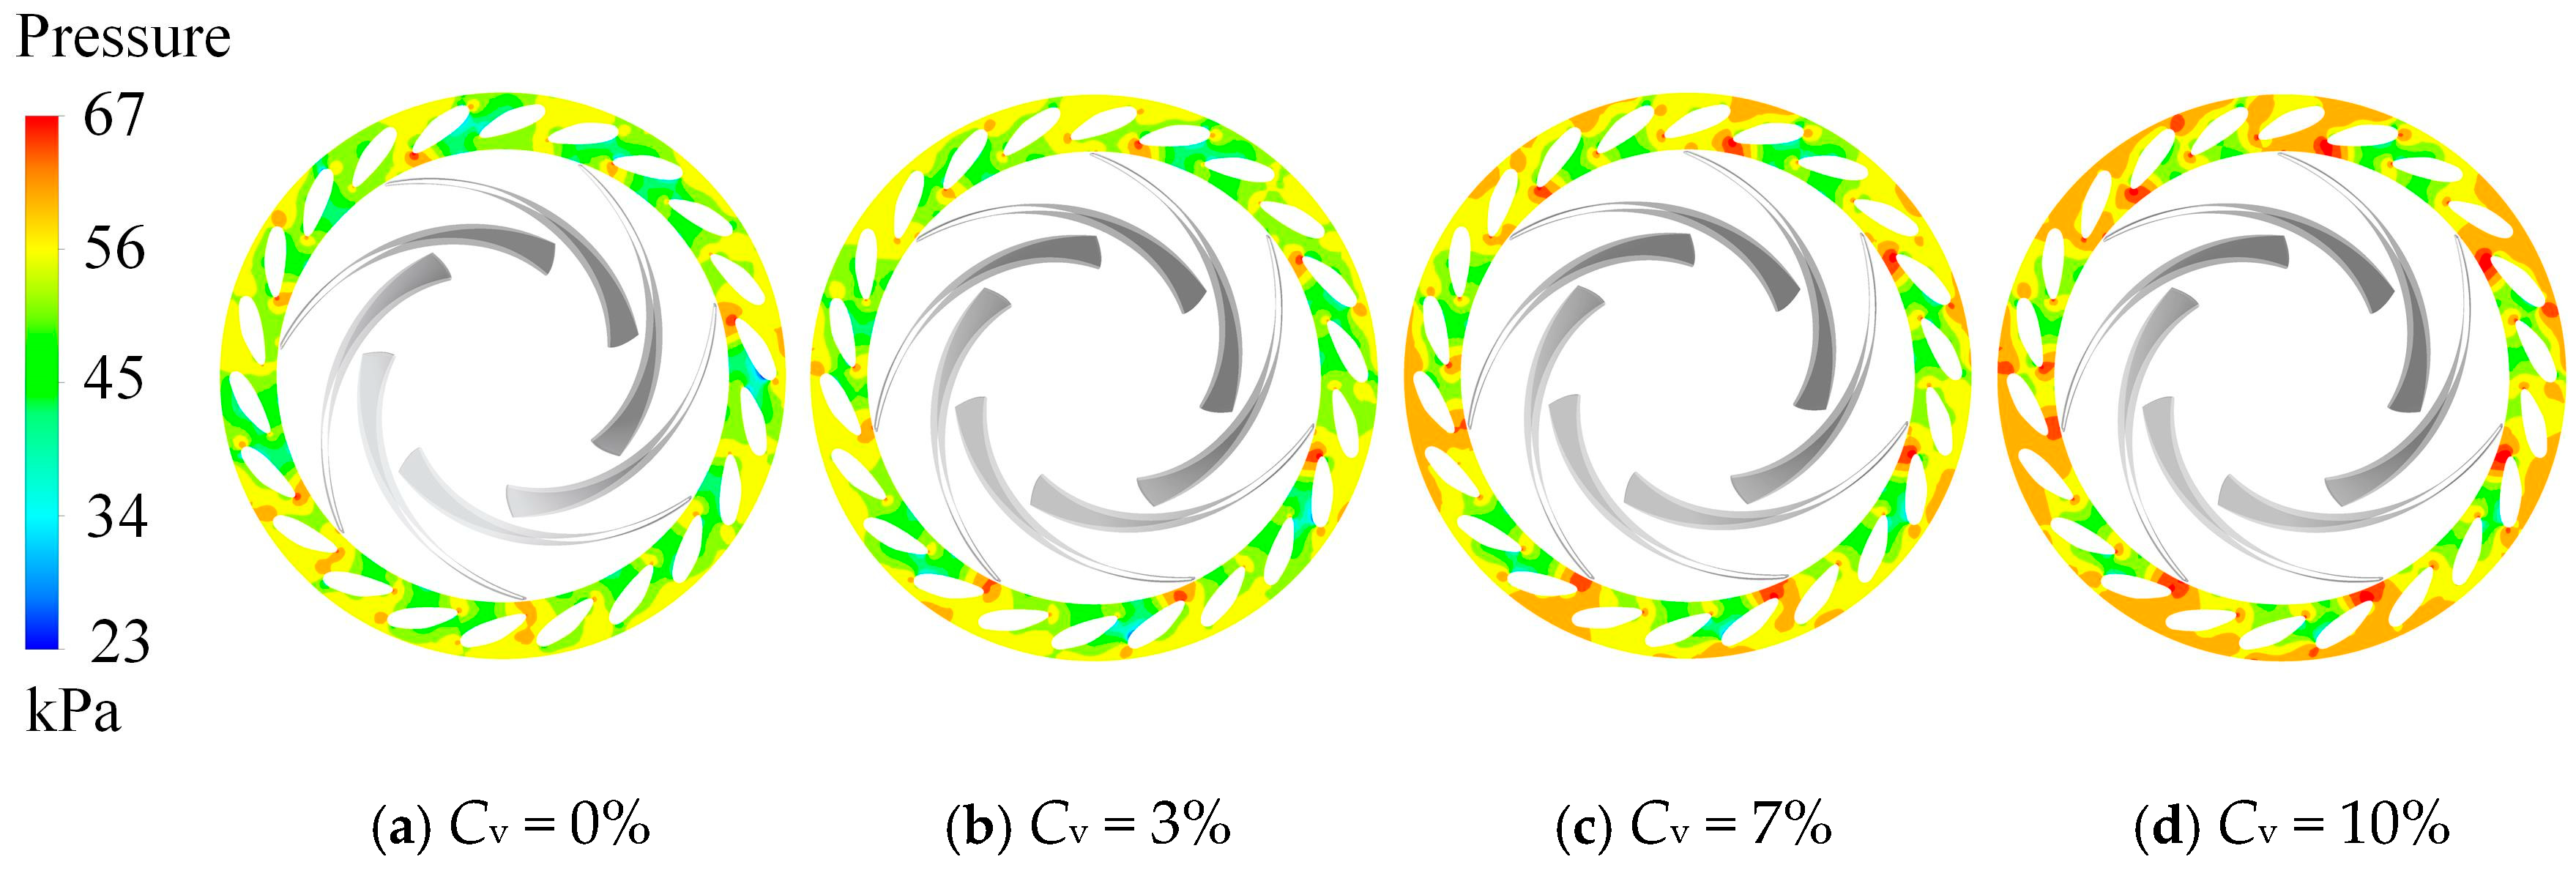
Figure 16 shows the pressure contours at the mid-span section of the impeller under different sand concentrations. It can be observed that the pressure within the impeller gradually increases from the inlet to the outlet, and the pressure on the pressure side of the blades is consistently higher than that on the suction side. After the fluid enters the impeller, the pressure rises progressively along the flow path. Compared with the clear-water condition, the impeller exhibits significantly higher pressure when sand particles are present. At the impeller inlet, the negative pressure region shows little variation, indicating that sand concentration has a limited effect on the inlet flow field. However, at the outlet, as the sand-laden fluid moves with the impeller rotation, the outlet pressure increases noticeably.
Figure 16.
Pressure distribution on the middle section of the impeller with different sand concentrations.
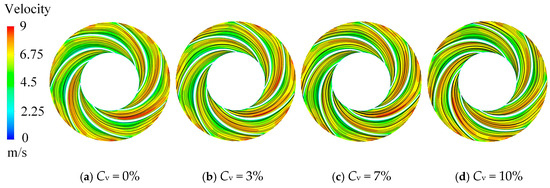
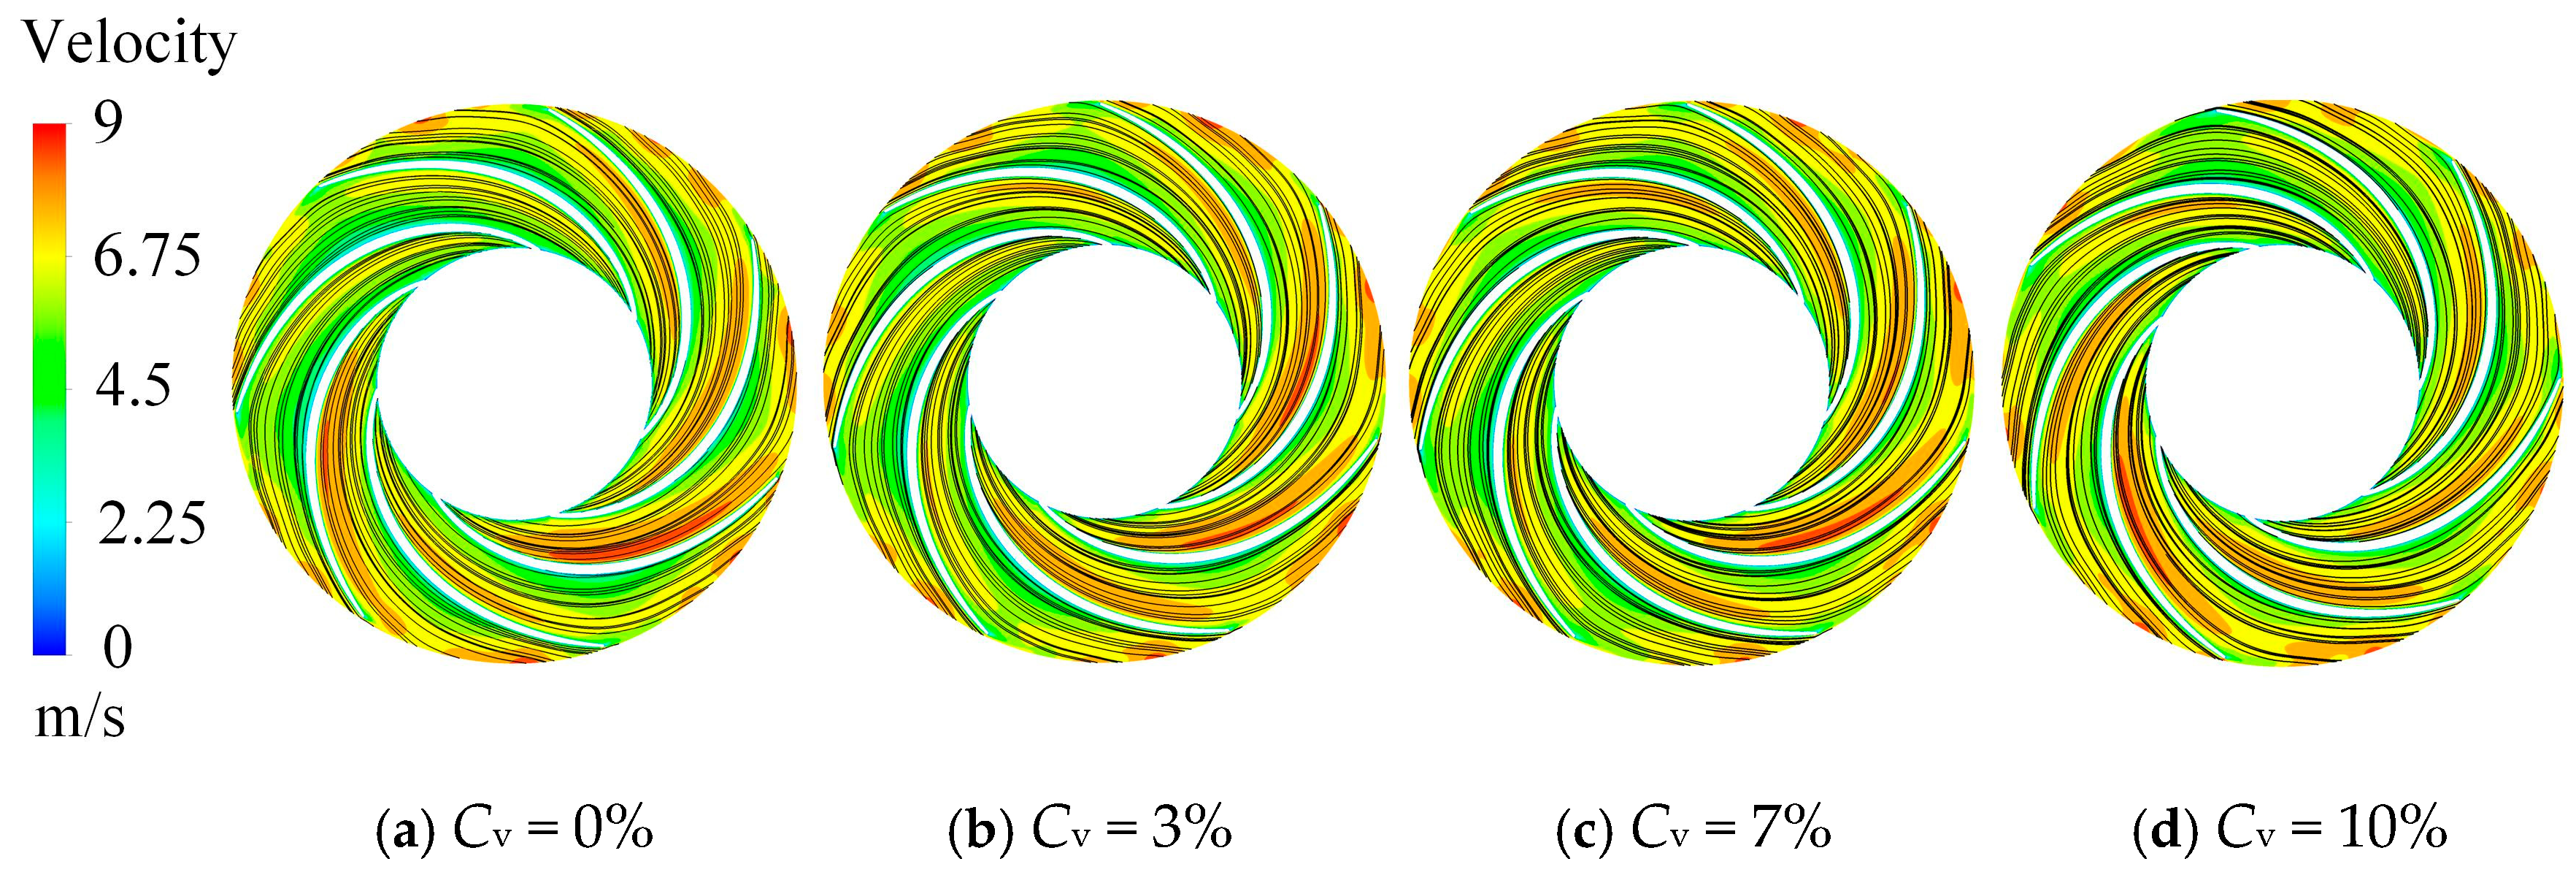
Figure 17 presents the velocity streamlines at the same section. The high-velocity regions remain located near the suction surface and outlet edges of the impeller blades, driven by centrifugal force and pressure gradients. Since the inlet velocity and impeller speed are consistent among all cases, the overall velocity distribution shows little variation. Compared with clear-water conditions, the streamlines in the sand-laden cases become slightly more concentrated, and the regions with sparse streamlines expand. As sand concentration increases, the overall change in flow structure remains limited.
Figure 17.
Velocity distribution on the middle section of the impeller with different sand concentrations.
- (2)
- Effect of Sand Concentration on the Flow in the Guide Vane
Figure 18 shows the pressure contours at the mid-span section of the guide vanes under different sand concentrations. The pressure increases progressively from the inlet to the outlet, exhibiting a distinct gradient. This is because the high-speed flow discharged from the impeller directly impacts the leading edge of the guide vane blades, while rotor–stator interaction further enhances local pressure variation. High-pressure regions appear at both the leading edge—where the impeller outflow strikes the vane surface—and the trailing edge, while relatively low-pressure zones form around the blade surfaces. The latter occurs because the flow meets the blade at an incidence angle, leading to partial flow separation and the formation of local low-pressure regions.
Figure 18.
Pressure distribution on the middle section of the guide vane with different sand concentrations.
Figure 19 displays the velocity streamlines at the same section. The velocity decreases gradually from the inlet to the outlet of the guide vanes. Influenced by the impeller outflow, the velocity field near the inlet shows more pronounced changes. Under the clear-water condition, the streamlines remain smooth and continuous. When a small number of sand particles are introduced, slight flow irregularities appear, and as the concentration increases, vortical structures emerge within the passages. These vortices induce low-pressure regions around the blades. The results indicate that low concentrations of sand have little influence on the guide vane flow, while higher concentrations cause partial flow blockage and vortex formation, thereby deteriorating the internal flow stability and reducing the overall hydraulic efficiency of the pump.
Figure 19.
Velocity distribution on the middle section of the guide vane with different sand concentrations.
- (3)
- Effect of Sand Concentration on the Flow in the Return Channel
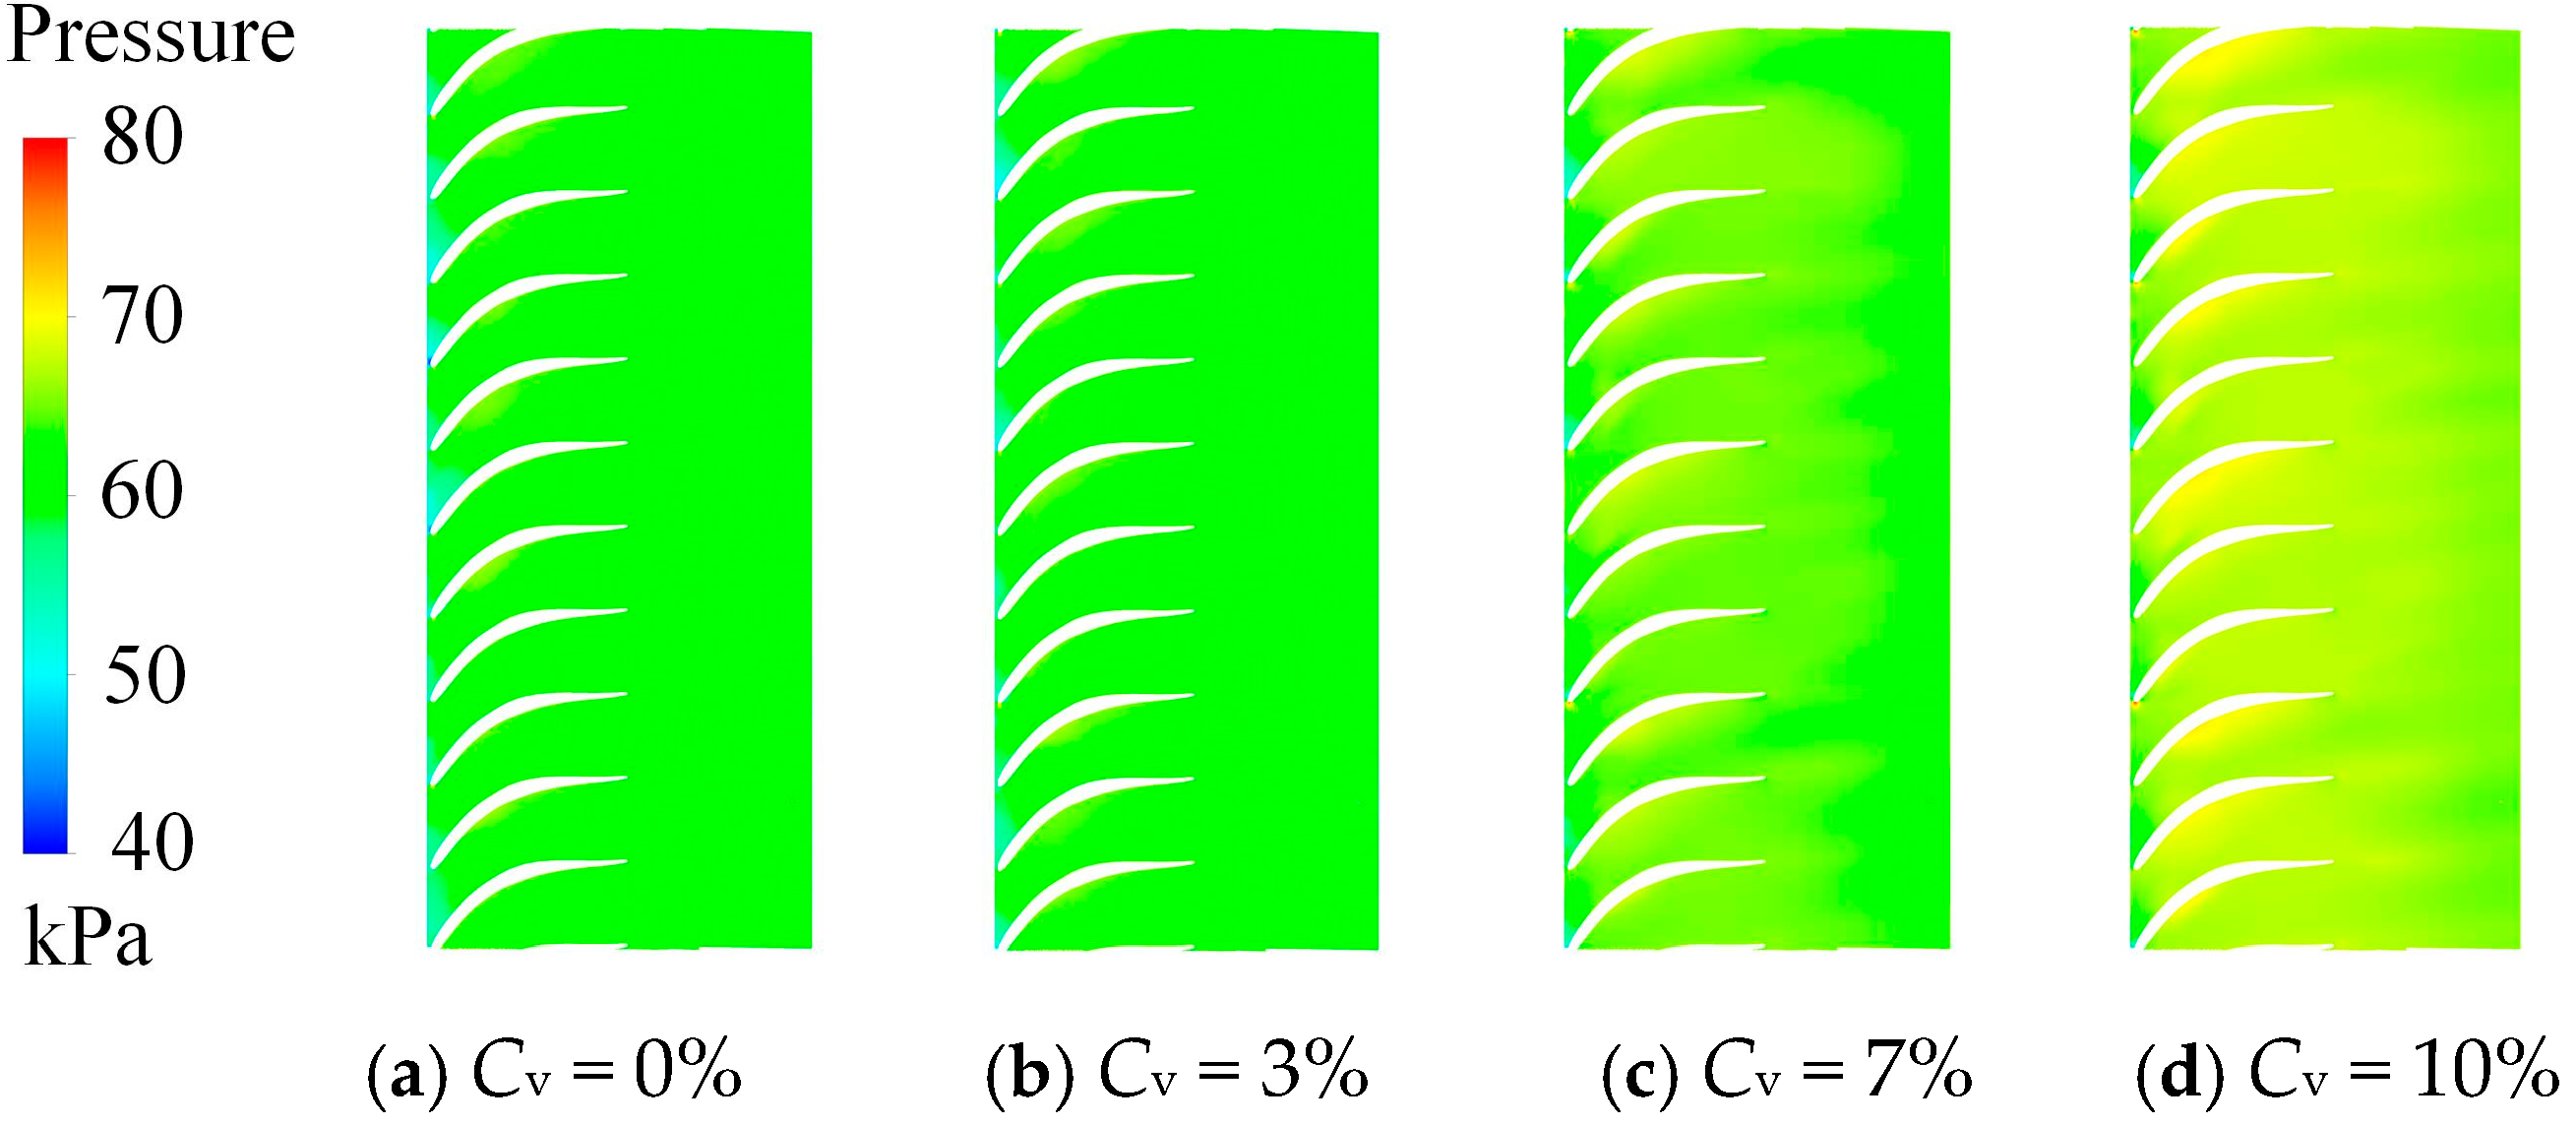
Figure 20 presents the pressure contours of the unfolded return vane channel under different sand concentrations. It can be observed that the pressure first increases and then decreases along the flow direction. The highest pressure occurs on the blade surfaces, where the fluid decelerates and converts kinetic energy into pressure energy. As the fluid enters the return vane, it collides with the leading edge of the blade, generating a high-pressure region.
Figure 20.
Pressure distribution in the return channel with different sand concentrations (span = 0.5).
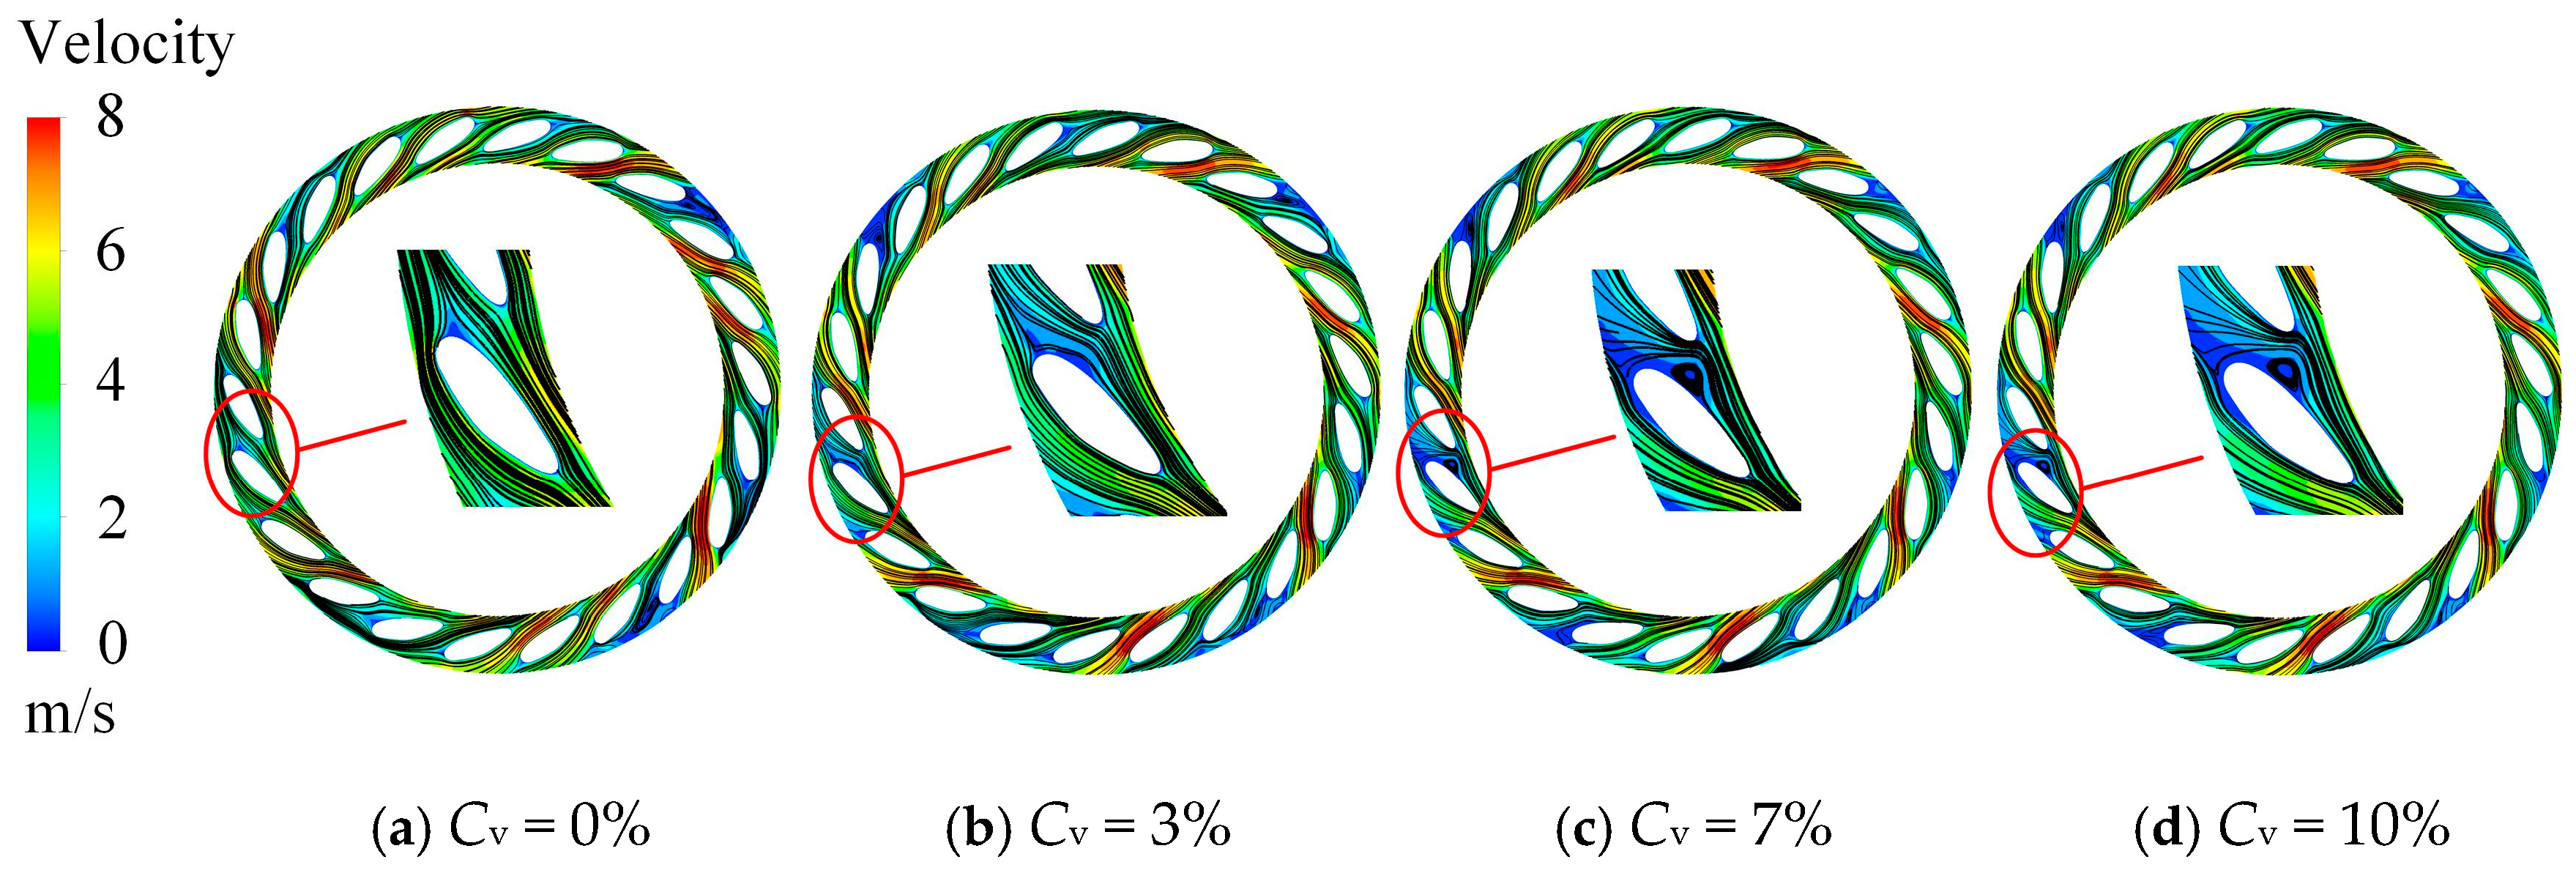
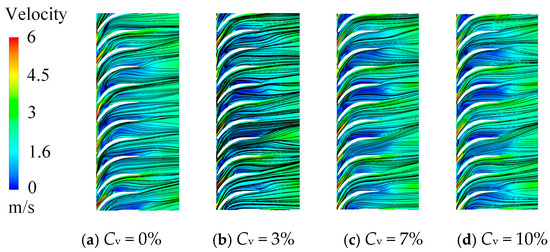
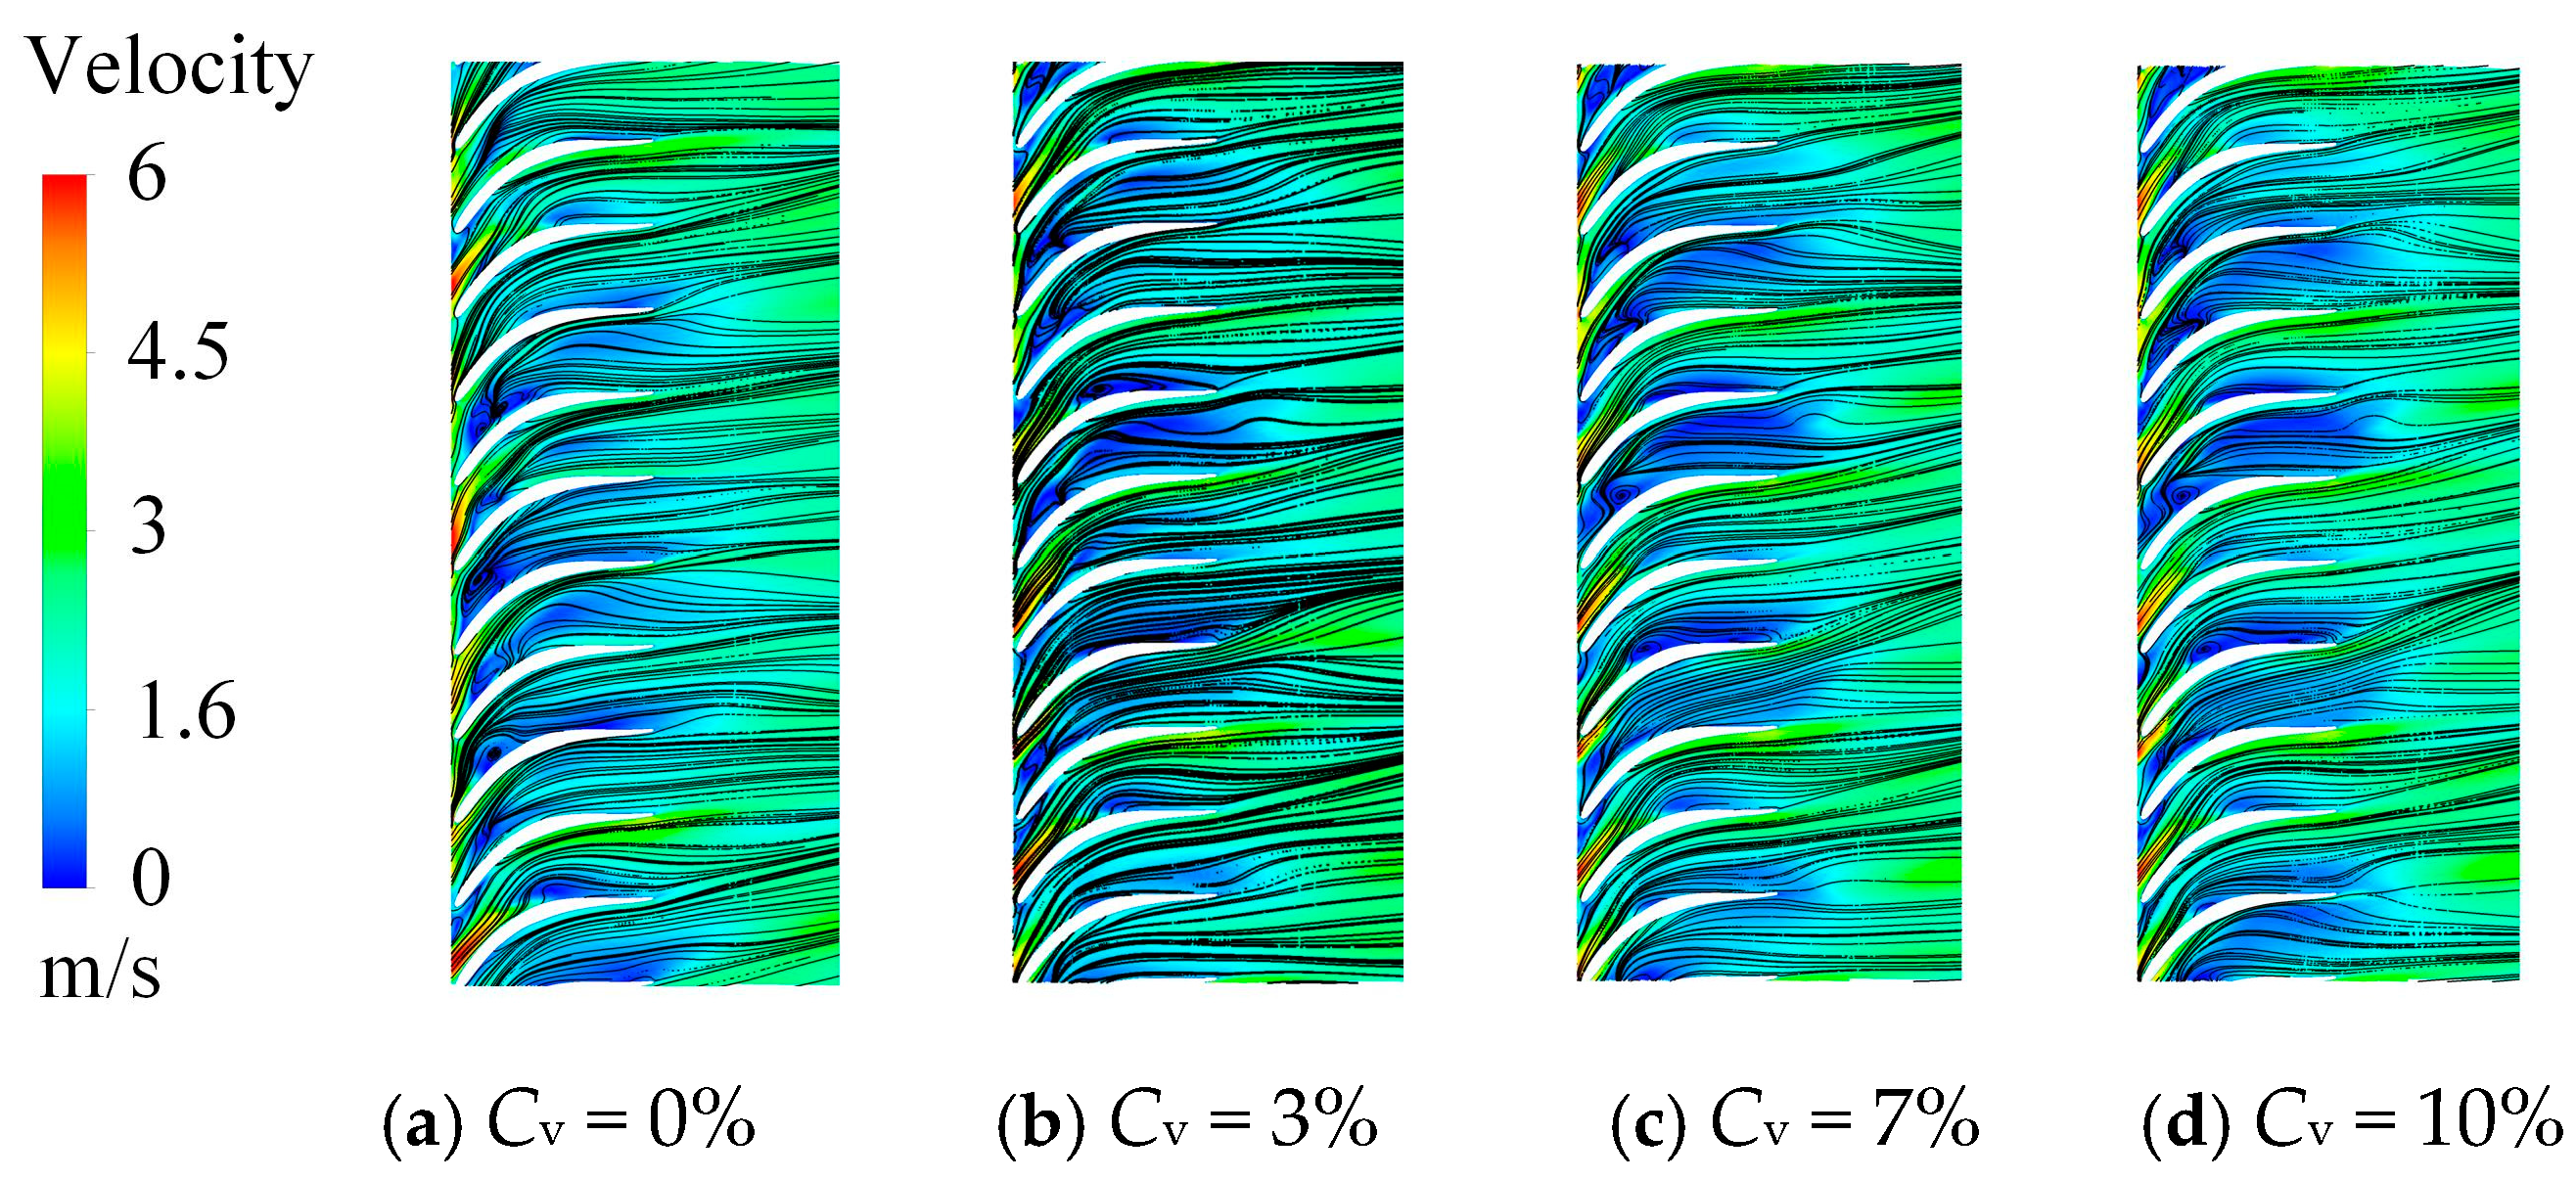
Figure 21 shows the corresponding velocity streamlines. The flow enters the return vane from the guide vane with a relatively high velocity at the inlet. As it passes through the return vane blades, kinetic energy is dissipated, and the flow velocity decreases. After passing the blades, the velocity increases slightly under the influence of gravity. Compared with the clear-water condition, the low-velocity regions in the return vane expand progressively with increasing sand concentration, accompanied by the development of larger recirculation zones.
Figure 21.
Velocity distribution in the return channel with different sand concentrations (span = 0.5).
4.3. Effect of Sand Parameters on Energy Losses in the Pump
4.3.1. Effect of Sand Sizes on Energy Losses in the Pump
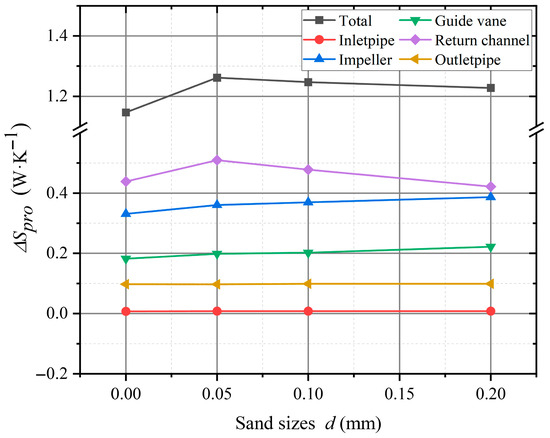
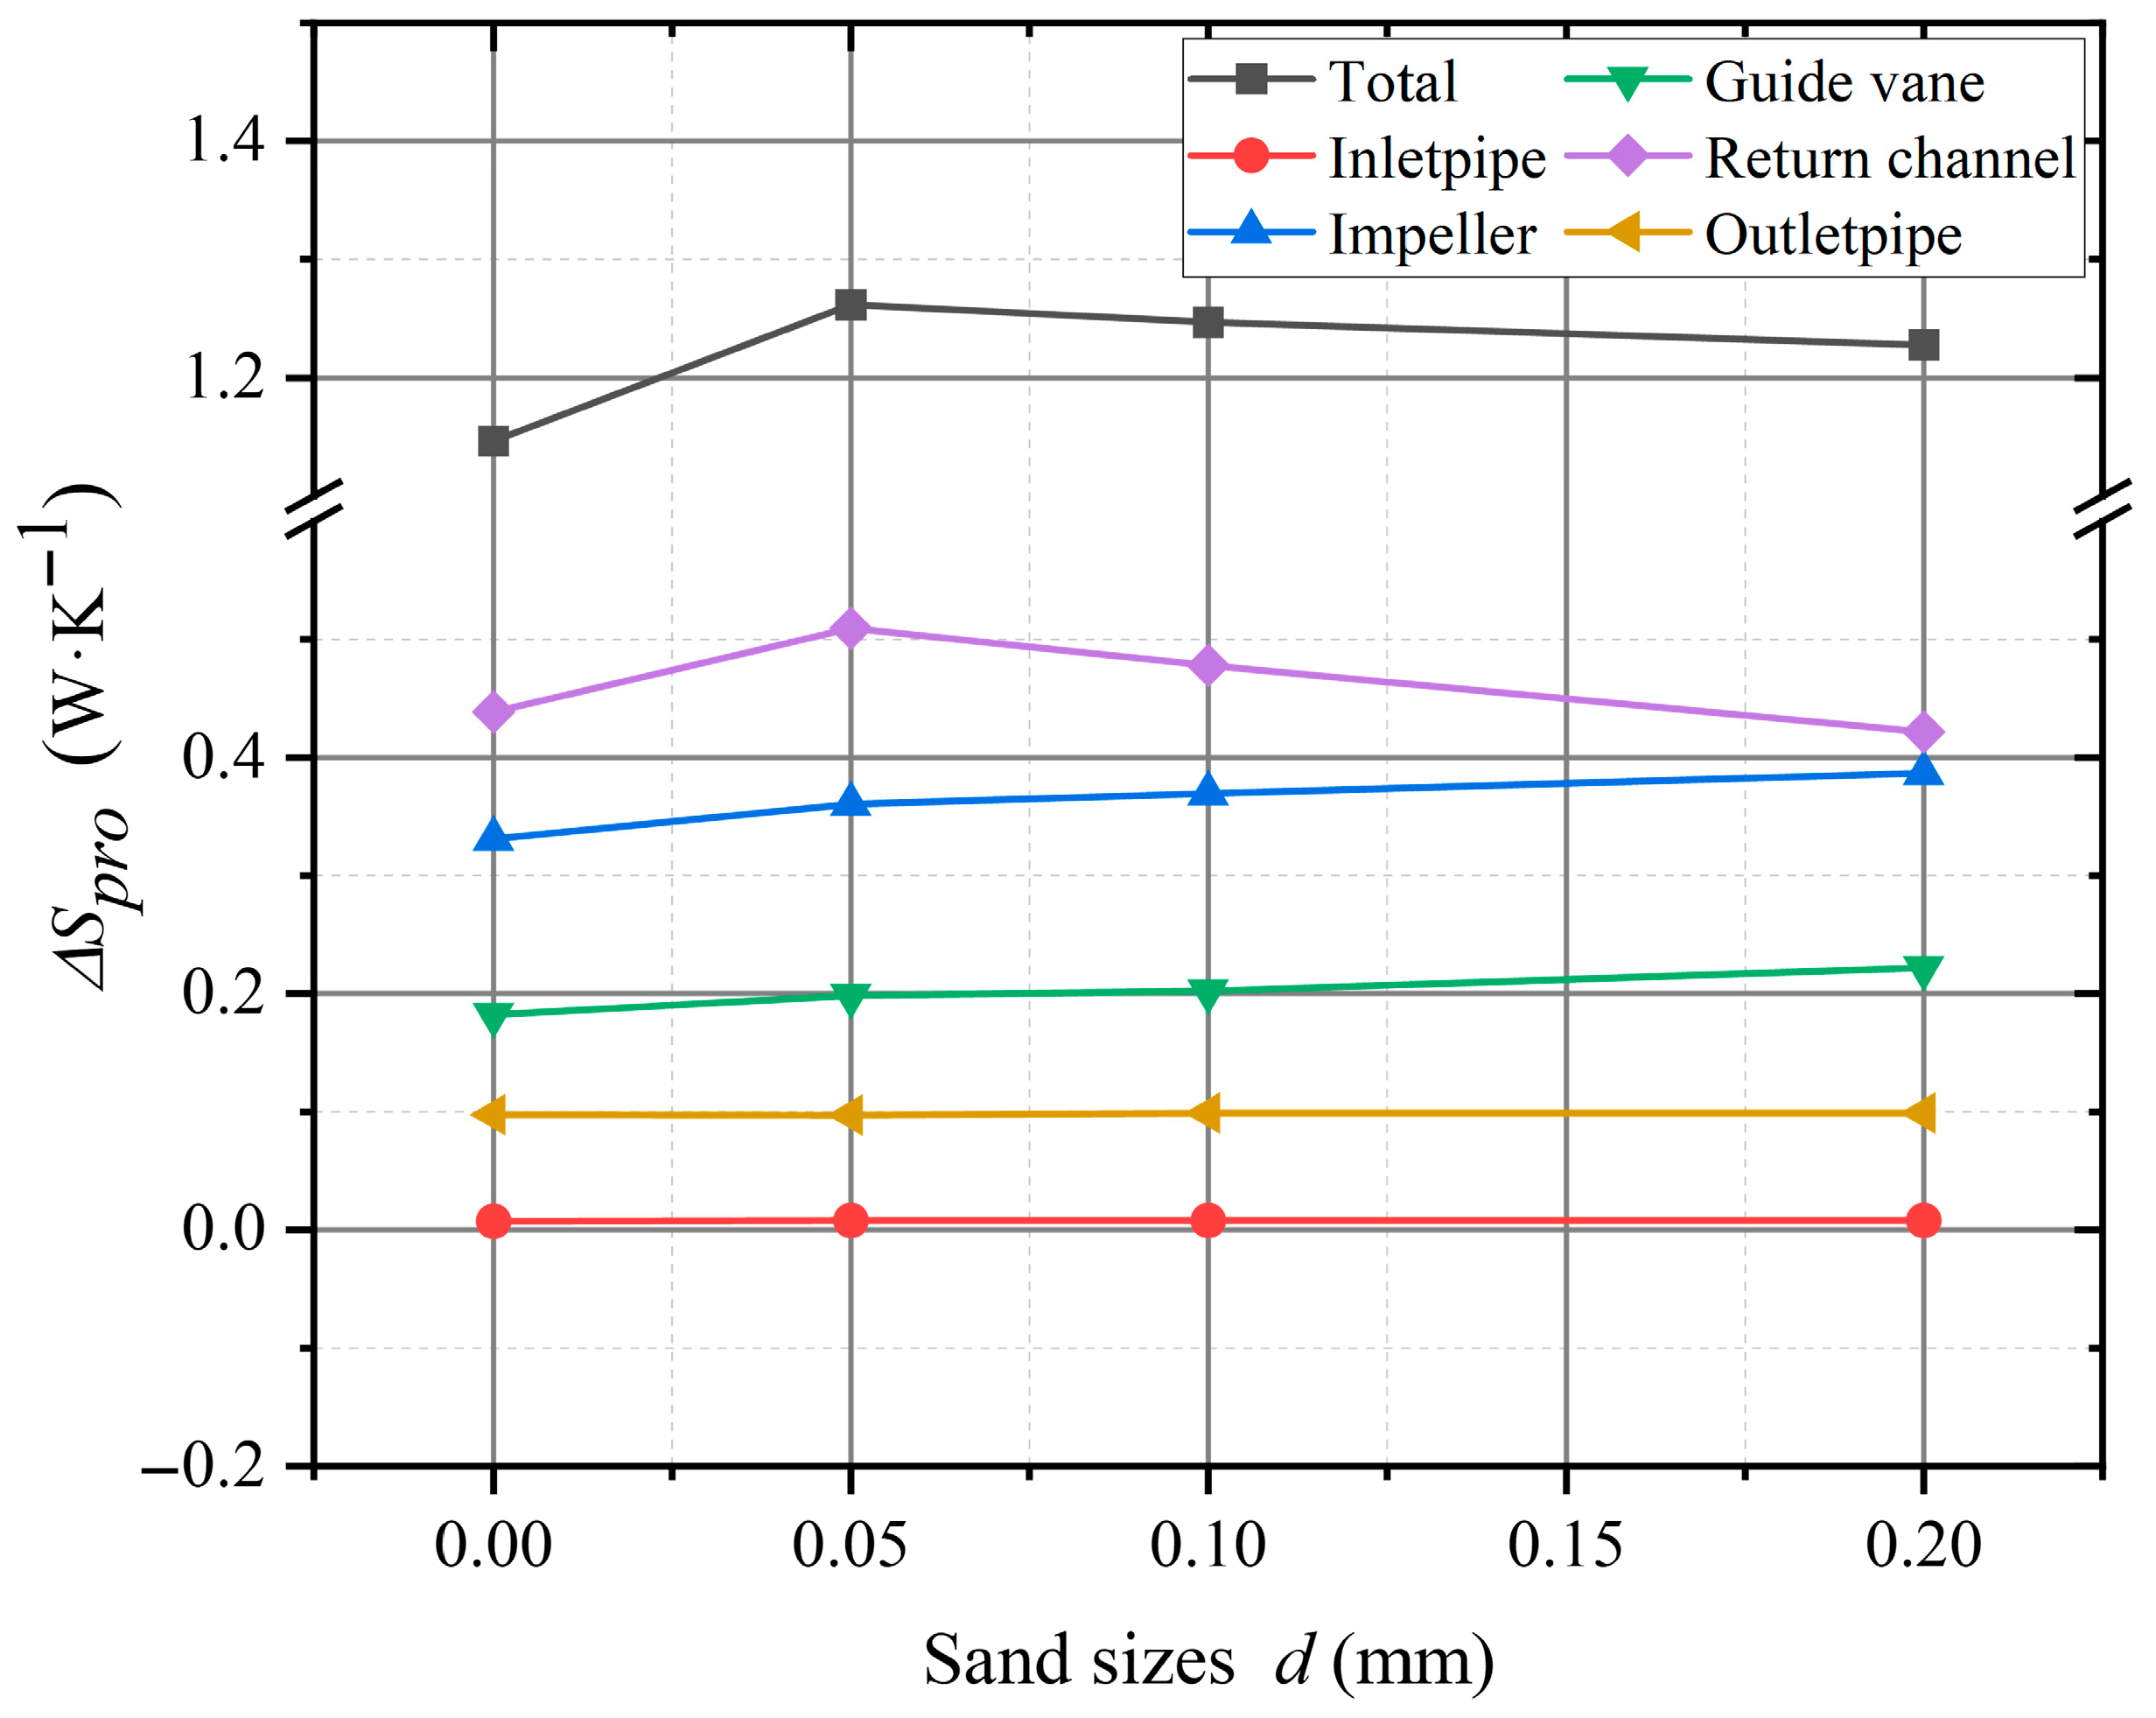
To investigate the influence of sand particle size on entropy generation in the pump flow passages, Figure 22 presents the distribution of total entropy generation under different particle sizes. It can be observed that the total entropy loss under sand-laden conditions is greater than that under the clear-water condition. The presence of sand particles intensifies turbulent instability, increases flow non-uniformity and flow resistance, and consequently enhances irreversible energy dissipation. Among the flow-passage components, the return vanes exhibit the highest contribution to total entropy generation, followed by the impeller. As the particle size increases, the entropy generation in the return vanes gradually decreases, leading to a downward trend in total entropy generation. In contrast, the entropy generation in the inlet and outlet pipes, impeller, and guide vanes increases progressively. This is because larger sand particles possess higher mass and kinetic energy, resulting in more severe impact on the impeller and guide vane surfaces and greater turbulent wall losses. However, after passing through the return vanes, their velocity decreases and the interaction with the fluid weakens. When the particle diameter increases from 0.05 mm to 0.2 mm, the total entropy generation rises by approximately 10%, 8%, and 7%, respectively, compared to the clear-water case. These findings indicate that the overall entropy generation of the pump decreases slightly with increasing particle size, and the particle diameter has a dominant effect on entropy generation in the return vanes, exceeding that of other flow components.
Figure 22.
Total entropy productions of the flow components with different sand sizes.
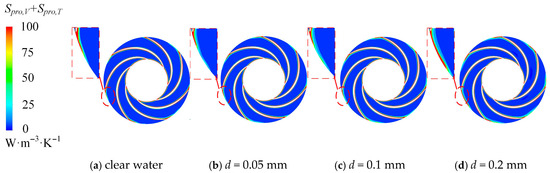
Figure 23 shows the entropy generation distribution at the mid-span section of the impeller for different particle sizes. Under both clear-water and sand-laden conditions, high-entropy regions are mainly concentrated on the suction surface, pressure surface, and trailing edges of the blades. Due to the impeller geometry, the entropy generation on the suction surface is greater than that on the pressure surface. The high-entropy regions expand progressively with increasing particle size, indicating enhanced energy dissipation. As particle size increases, particles carry greater kinetic energy within the impeller channels, and the high-entropy regions on the pressure side extend upstream. Notably, the entropy generation near the blade trailing edges increases significantly, as the flow velocity changes sharply when fluid exits the impeller and enters the guide vanes, intensifying irreversible losses and enlarging the high-entropy zones.
Figure 23.
Entropy production distributions in the impeller with different sand sizes.
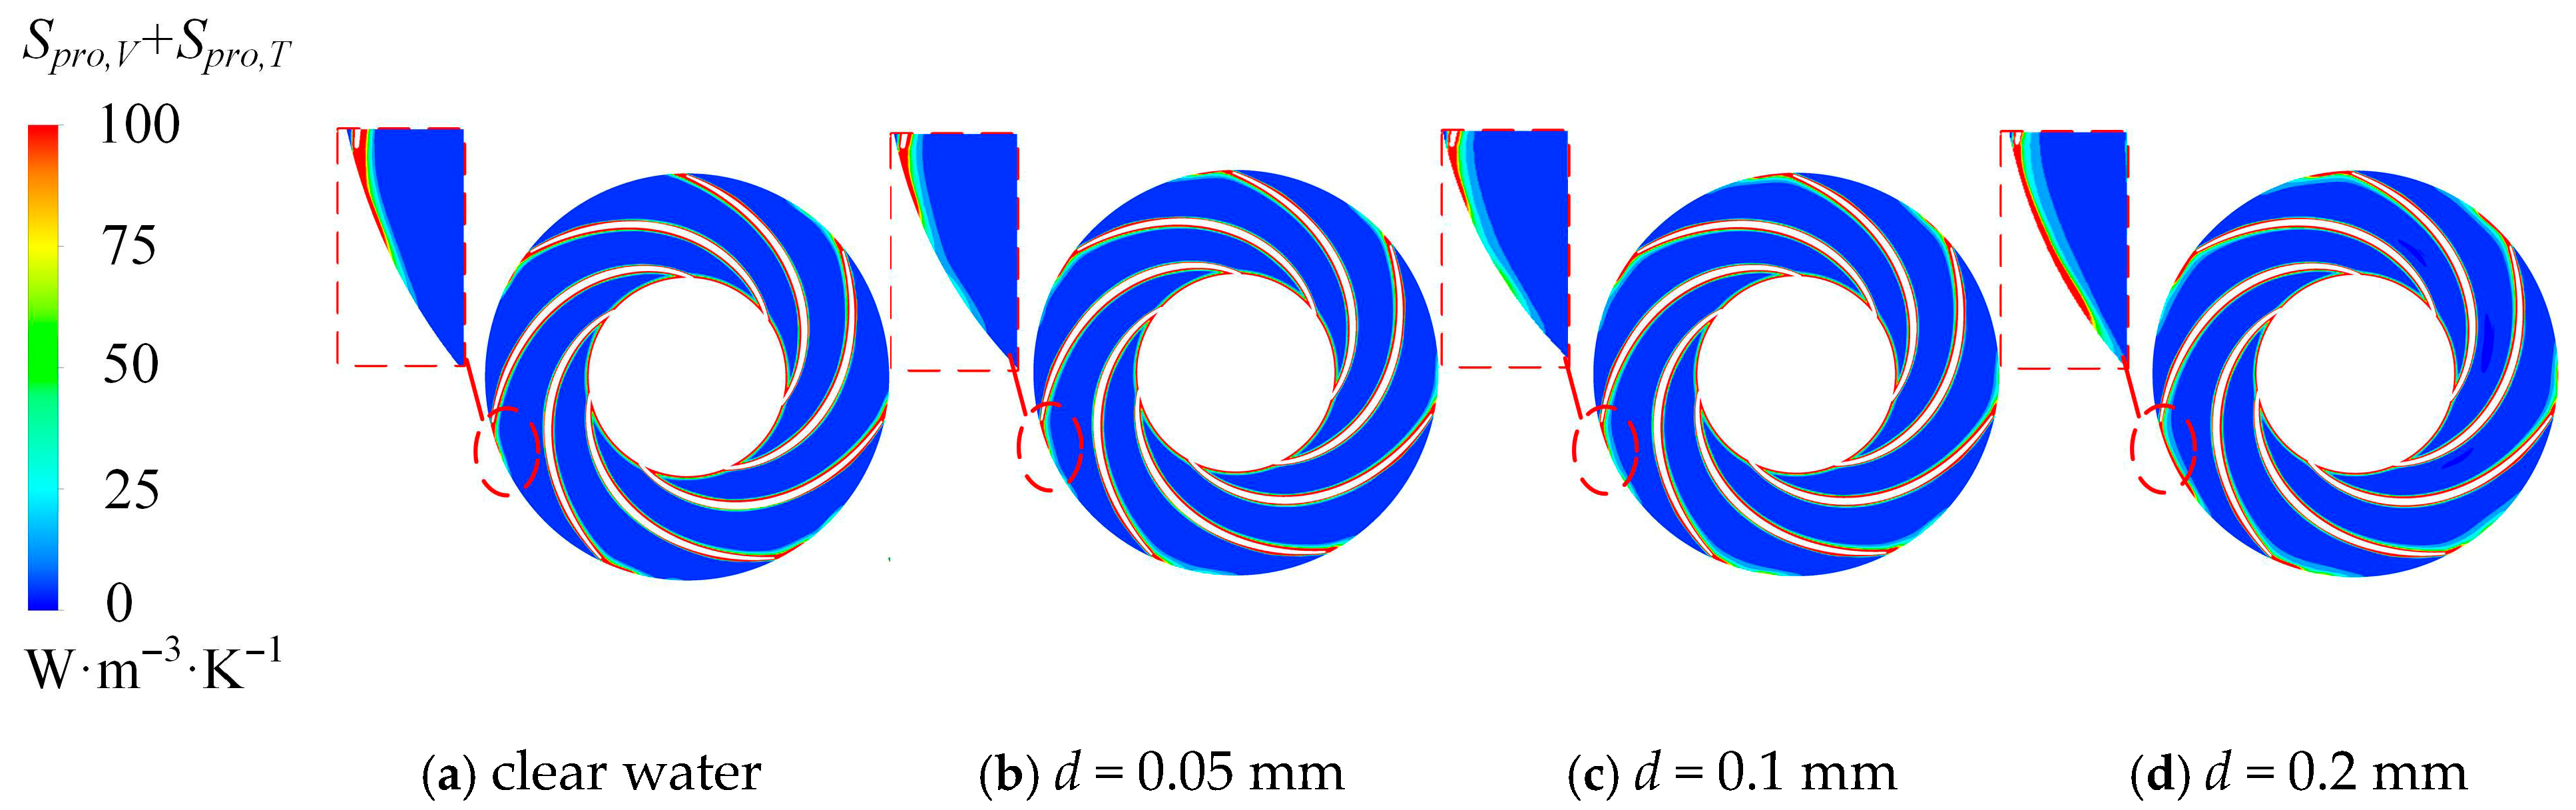
Figure 24 depicts the entropy generation distribution at the mid-span section of the guide vanes under different particle sizes. The high-entropy regions are concentrated near the inlet and outlet zones and on the blade surfaces. As the fluid from the impeller impacts the guide vane inlet, local unsteady flow occurs, causing energy loss and forming large high-entropy regions. The trailing edge of the impeller also induces flow disturbances that expand these regions. As the fluid passes along the guide vane blades, separation vortices develop, leading to additional energy dissipation along the surfaces. Compared to the clear-water condition, the overall entropy generation area of the guide vanes increases under sand-laden flow. Larger particles carry higher kinetic energy upon entering the guide vanes, producing stronger impacts and greater losses. Consequently, the high-entropy regions at the inlet expand progressively with increasing particle size.
Figure 24.
Entropy production distributions in the guide vane with different sand sizes.
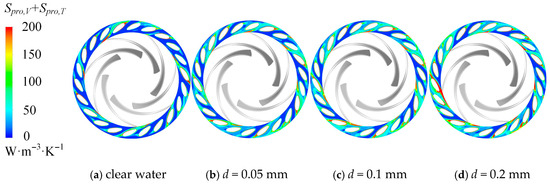
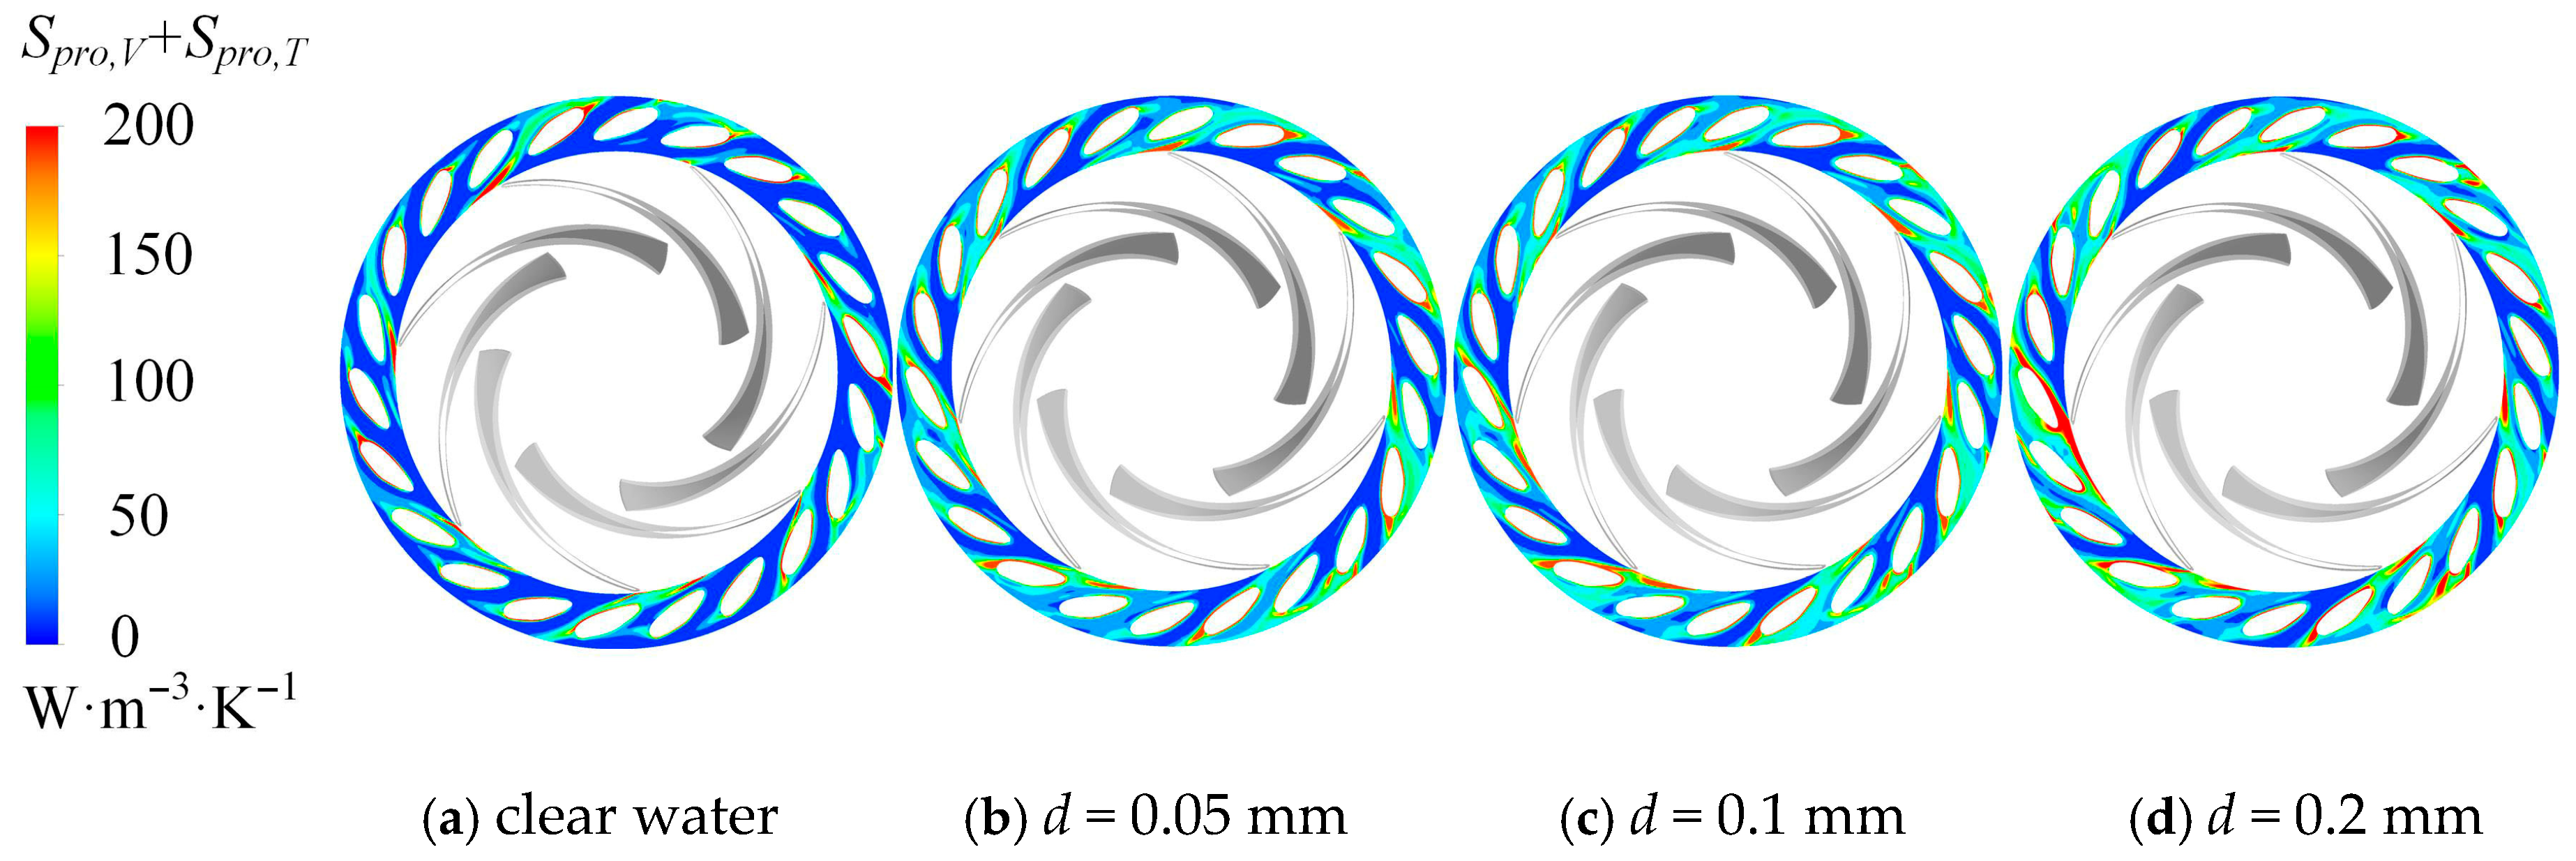
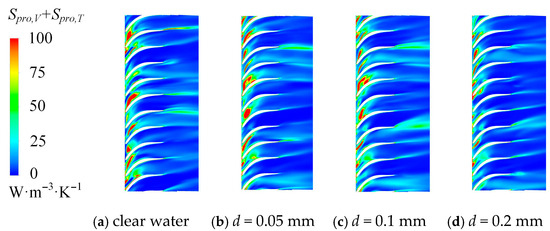
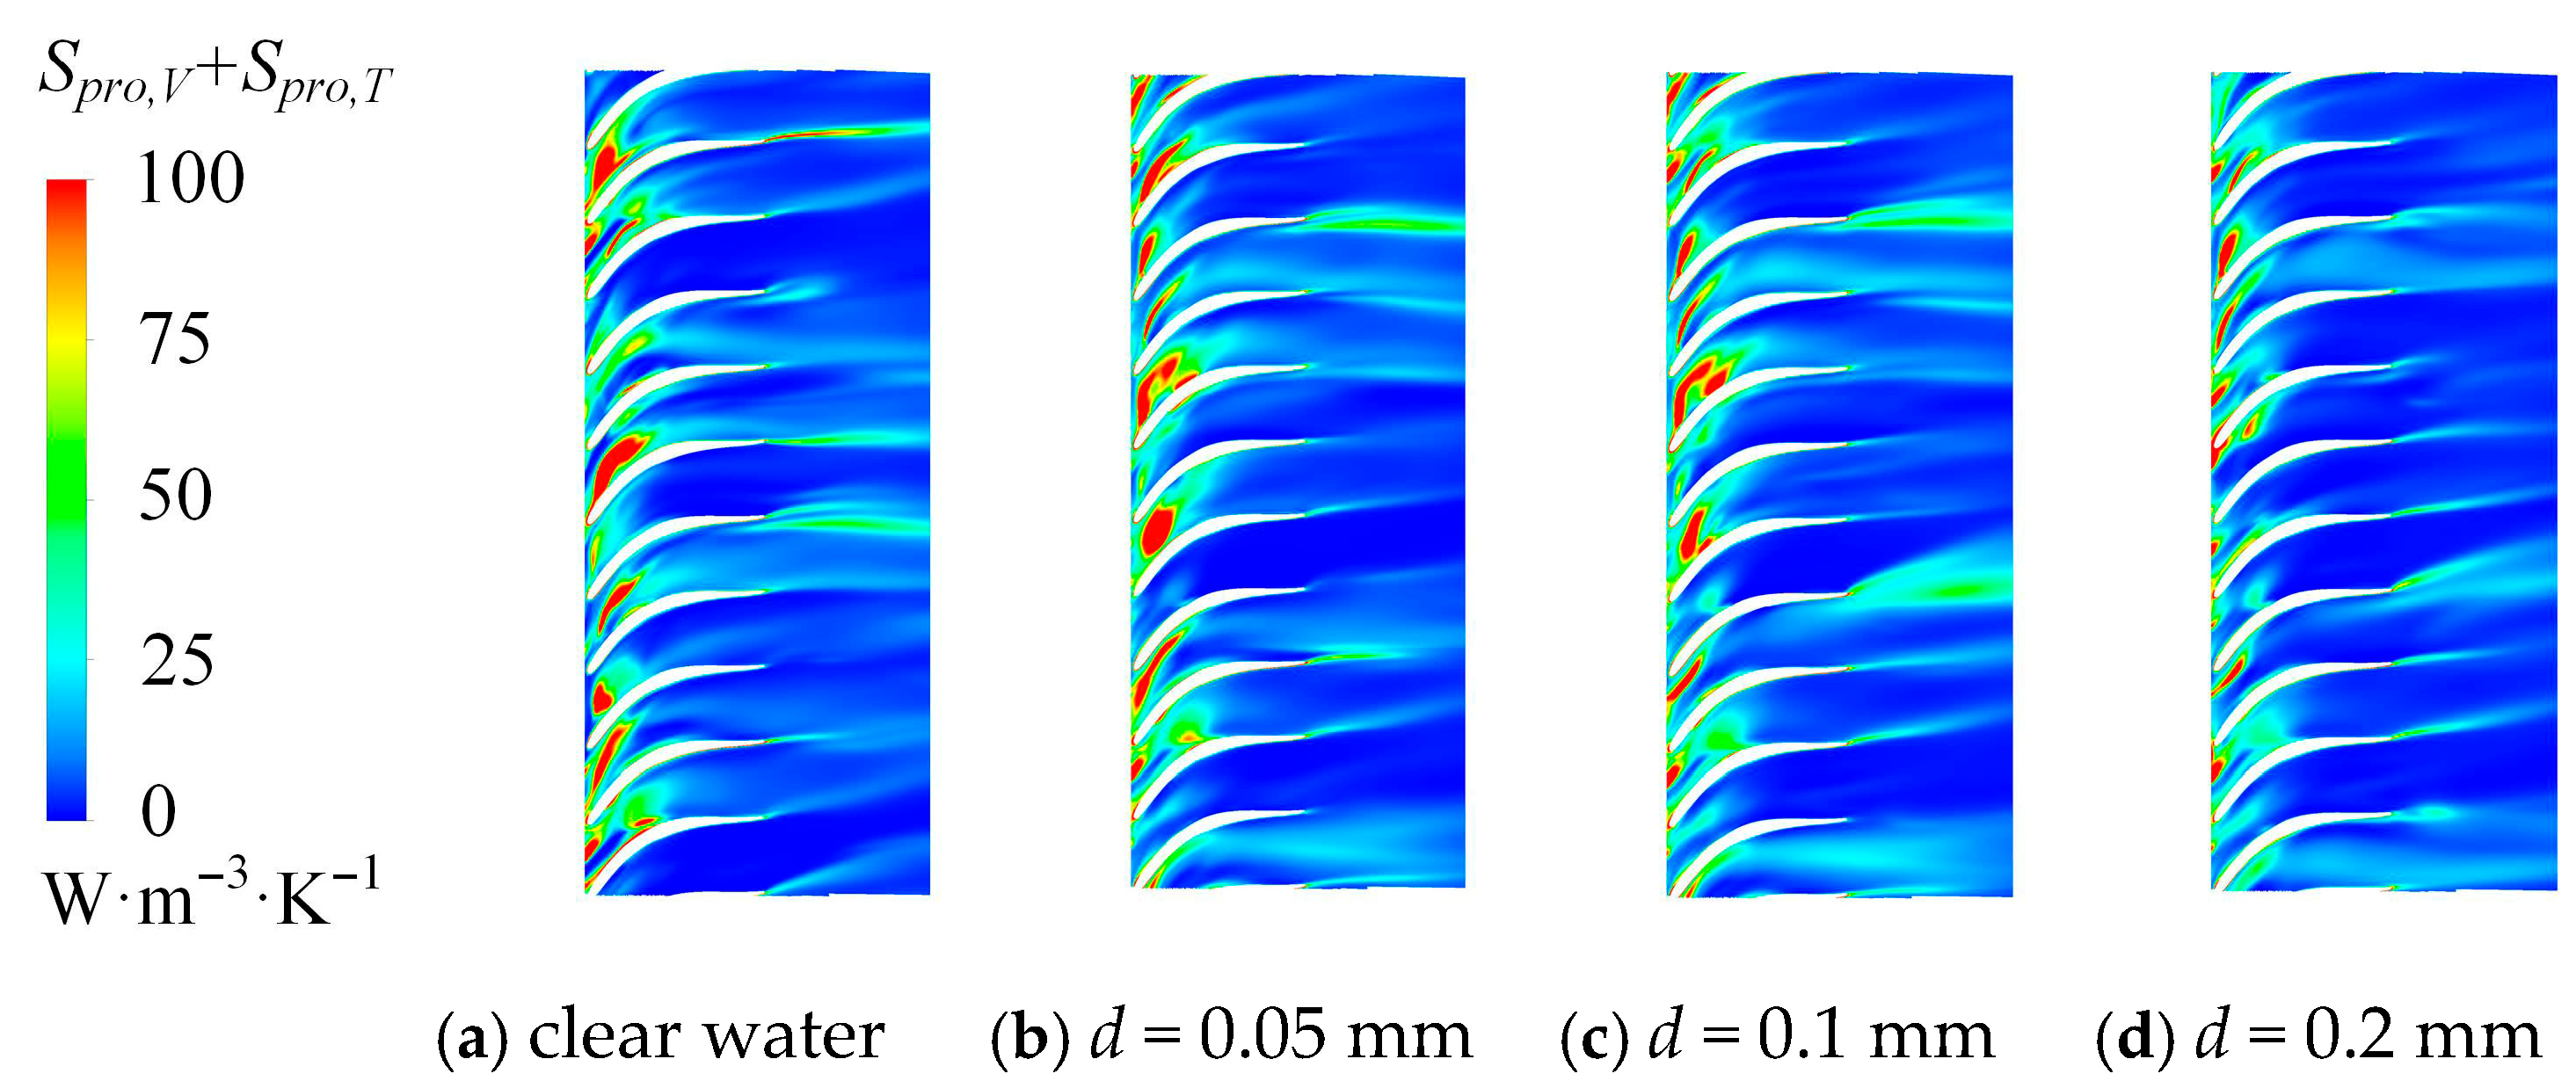
Figure 25 illustrates the entropy generation distribution in the return vanes. The high-entropy regions are mainly located near the inlet and trailing edges of the blades. The local unsteadiness in the guide vane outlet flow directly affects the inlet of the return vanes, where fluid collisions with the vane leading edges cause energy loss. At the trailing edges, the high-entropy zones shrink gradually as the particle size increases. This indicates that larger particles with greater inertia tend to move more uniformly with the flow, reducing local velocity fluctuations. Meanwhile, the turbulence intensity and flow unsteadiness decrease, leading to reduced energy dissipation.
Figure 25.
Entropy production distributions in the return channel with different sand sizes.
4.3.2. Effect of Sand Concentrations on Energy Losses in the Pump
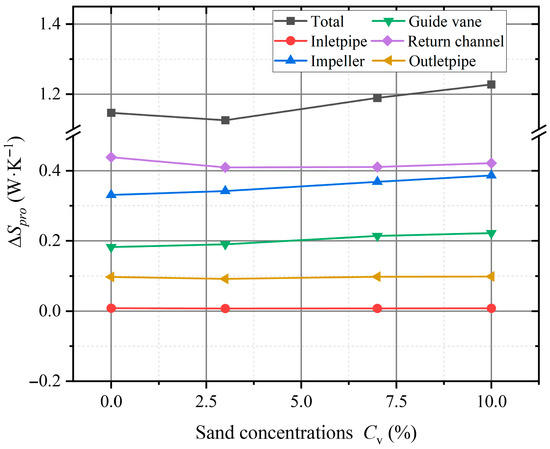
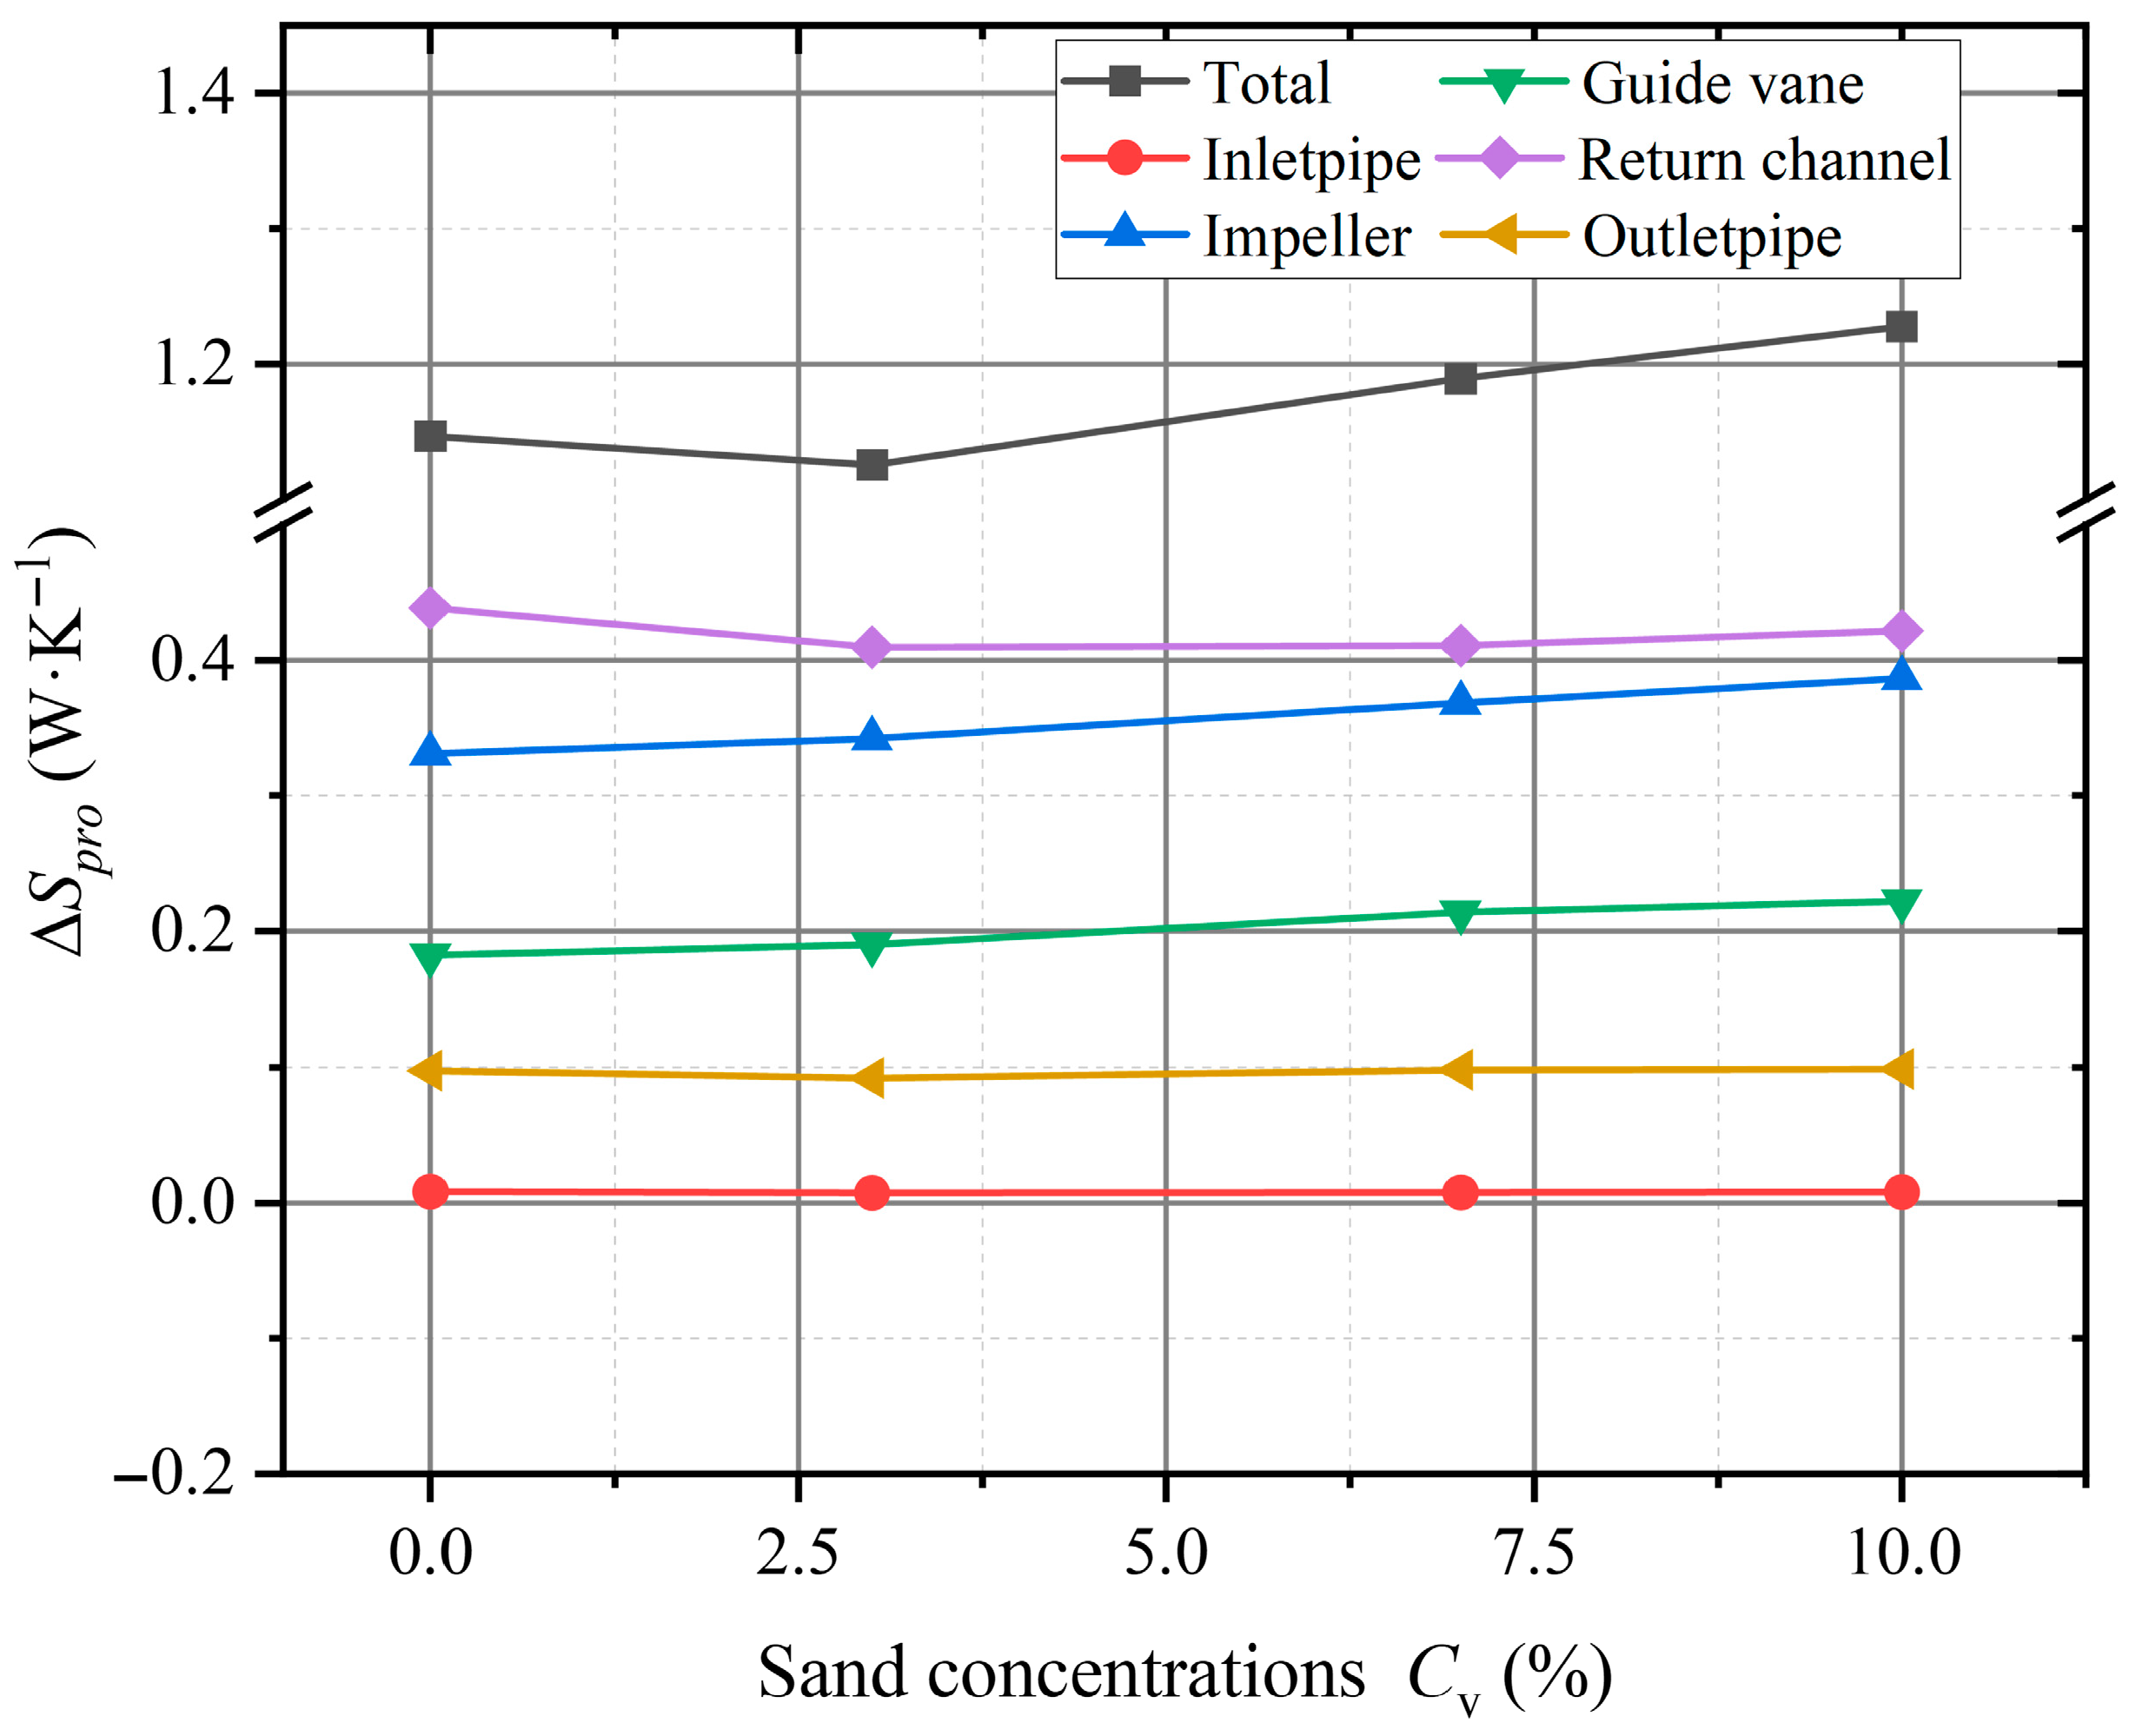
Figure 26 presents the total entropy generation of each flow-passage component under different sand concentrations. Compared with the clear-water condition, the total entropy generation exhibits distinct variation trends with increasing sand concentration. At a concentration of 3%, the total entropy generation decreases slightly compared with clear water; however, as the concentration continues to rise, the total entropy generation gradually increases and exceeds that of the clear-water case. Among all flow-passage components, the return vanes contribute the most to the overall entropy generation, followed by the impeller, guide vanes, and inlet/outlet pipes.
Figure 26.
Total entropy productions of the flow components with different sand concentrations.
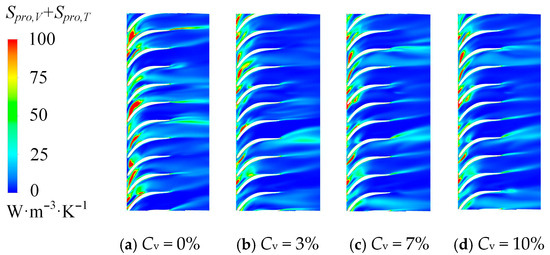
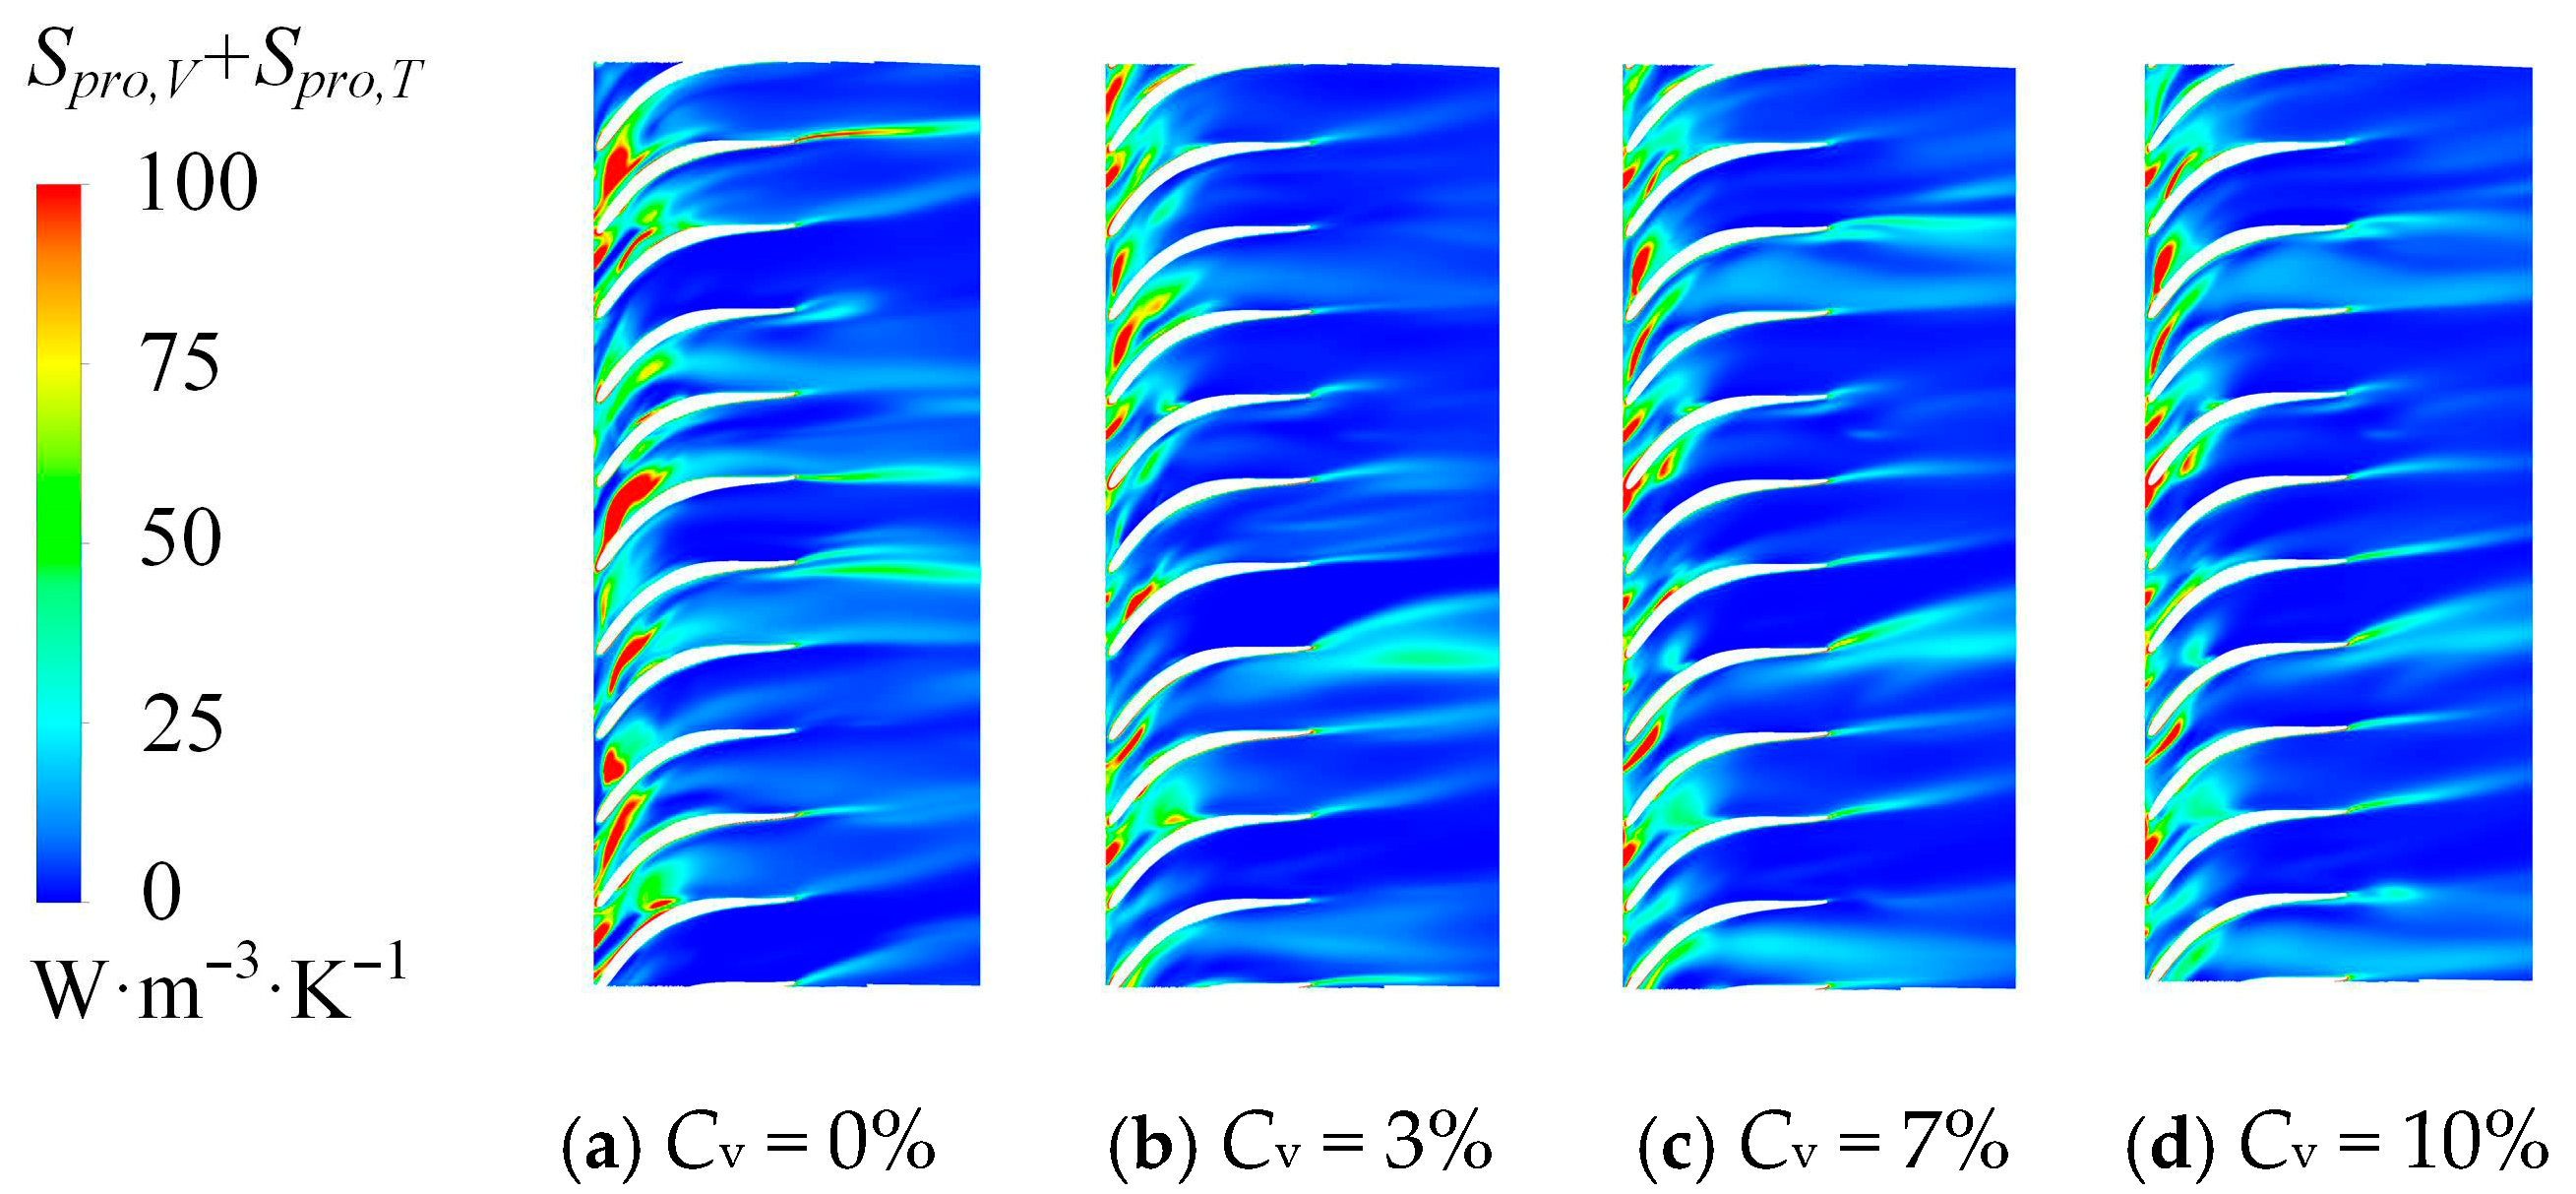
In the return vanes and outlet pipe, the total entropy generation decreases at a concentration of 3%, suggesting that the small number of sand particles at this concentration maintains good flow-following behavior, thereby reducing their interaction with the near-wall region. In contrast, in other components, entropy generation increases with higher sand concentrations because the growing number of particles intensifies collisions with the solid surfaces and promotes unstable flow structures. As the sand concentration increases from 3% to 10%, the total entropy generation first decreases by 2%, then increases by 3% and 5.5%, respectively. Specifically, the entropy generation in the return vanes decreases by 6.6%, 6.3%, and 3.8%, whereas that in the impeller increases by 3%, 11%, and 17%. These results indicate that at low concentrations, sand particles mainly affect the flow within the return vanes, while at higher concentrations, their influence on the impeller becomes more significant.
Figure 27 shows the entropy generation distribution in the impeller under varying sand concentrations. The high-entropy regions are mainly concentrated on the suction surface, pressure surface, and trailing edges of the blades. With the addition of sand particles, the high-entropy regions gradually expand compared with the clear-water condition. At a sand concentration of 3%, the change is minor, but as concentration increases, the high-entropy zones become more prominent—particularly near the trailing edge—due to the impeller’s high-speed rotation and the rotor–stator interaction with the guide vanes. This interaction induces strong velocity fluctuations and momentum exchange, leading to local irreversible losses. As the number of particles increases, the internal flow becomes more unstable, and the irreversible energy dissipation in the impeller intensifies.
Figure 27.
Entropy production distributions in the impeller with different sand concentrations.
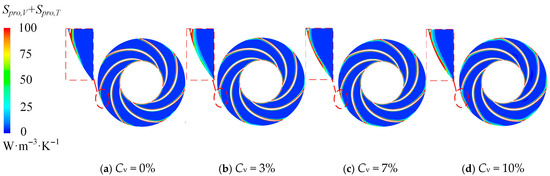
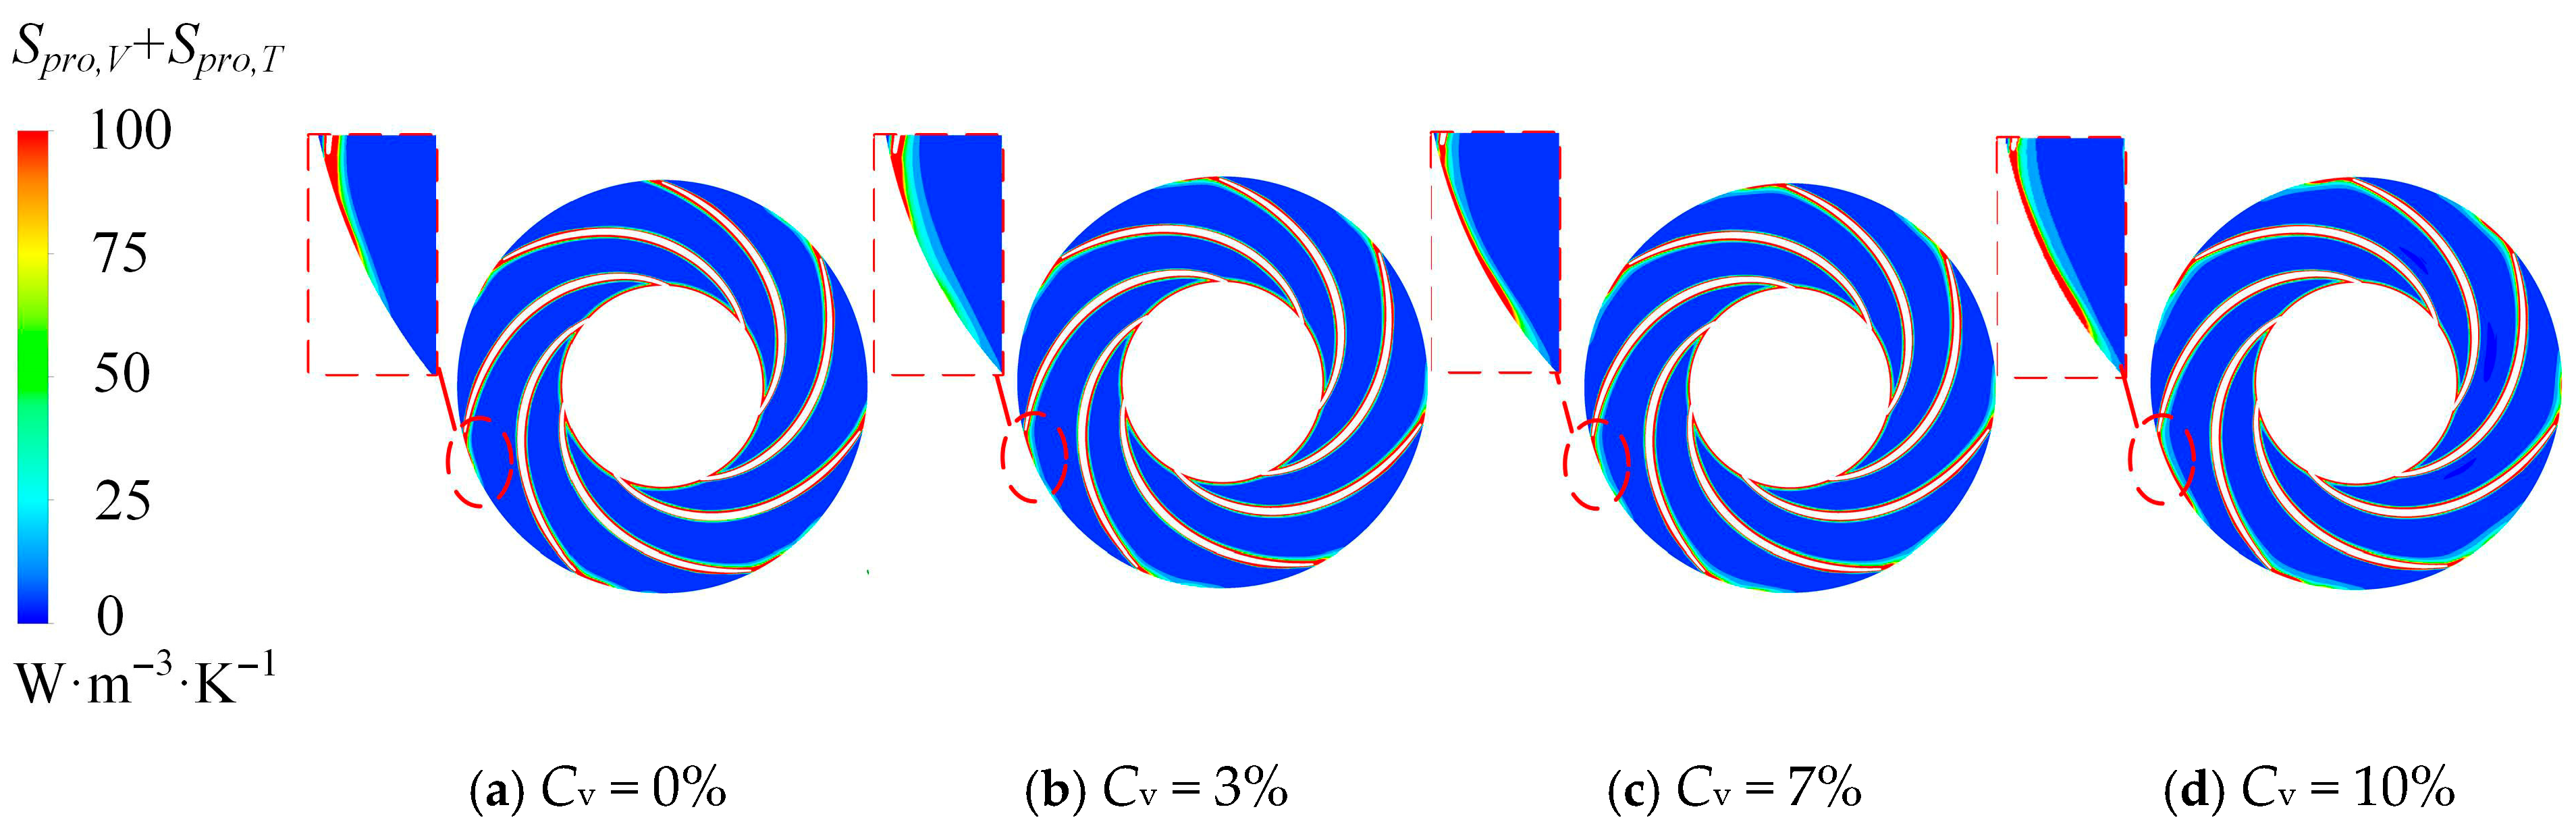
Figure 28 illustrates the entropy generation distribution in the guide vanes under various sand concentrations. The high-entropy regions are mainly located at the inlet, blade surfaces, and outlet of the guide vanes. As the fluid from the impeller enters the guide vane, the unsteady wake of the impeller enhances flow instability, leading to a larger high-entropy region near the inlet and significant hydraulic losses. Additionally, flow separation along the vane surfaces produces additional energy losses, further increasing the overall entropy generation. With the rise in particle concentration, the disturbance induced by the particles strengthens flow unsteadiness and intensifies friction and impact on the blade surfaces, thereby amplifying the energy loss within the guide vanes.
Figure 28.
Entropy production distributions in the guide vane with different sand concentrations.
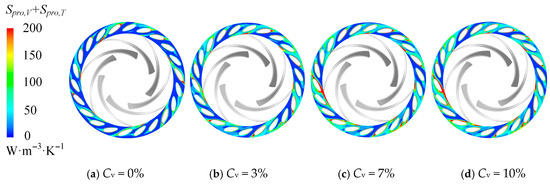
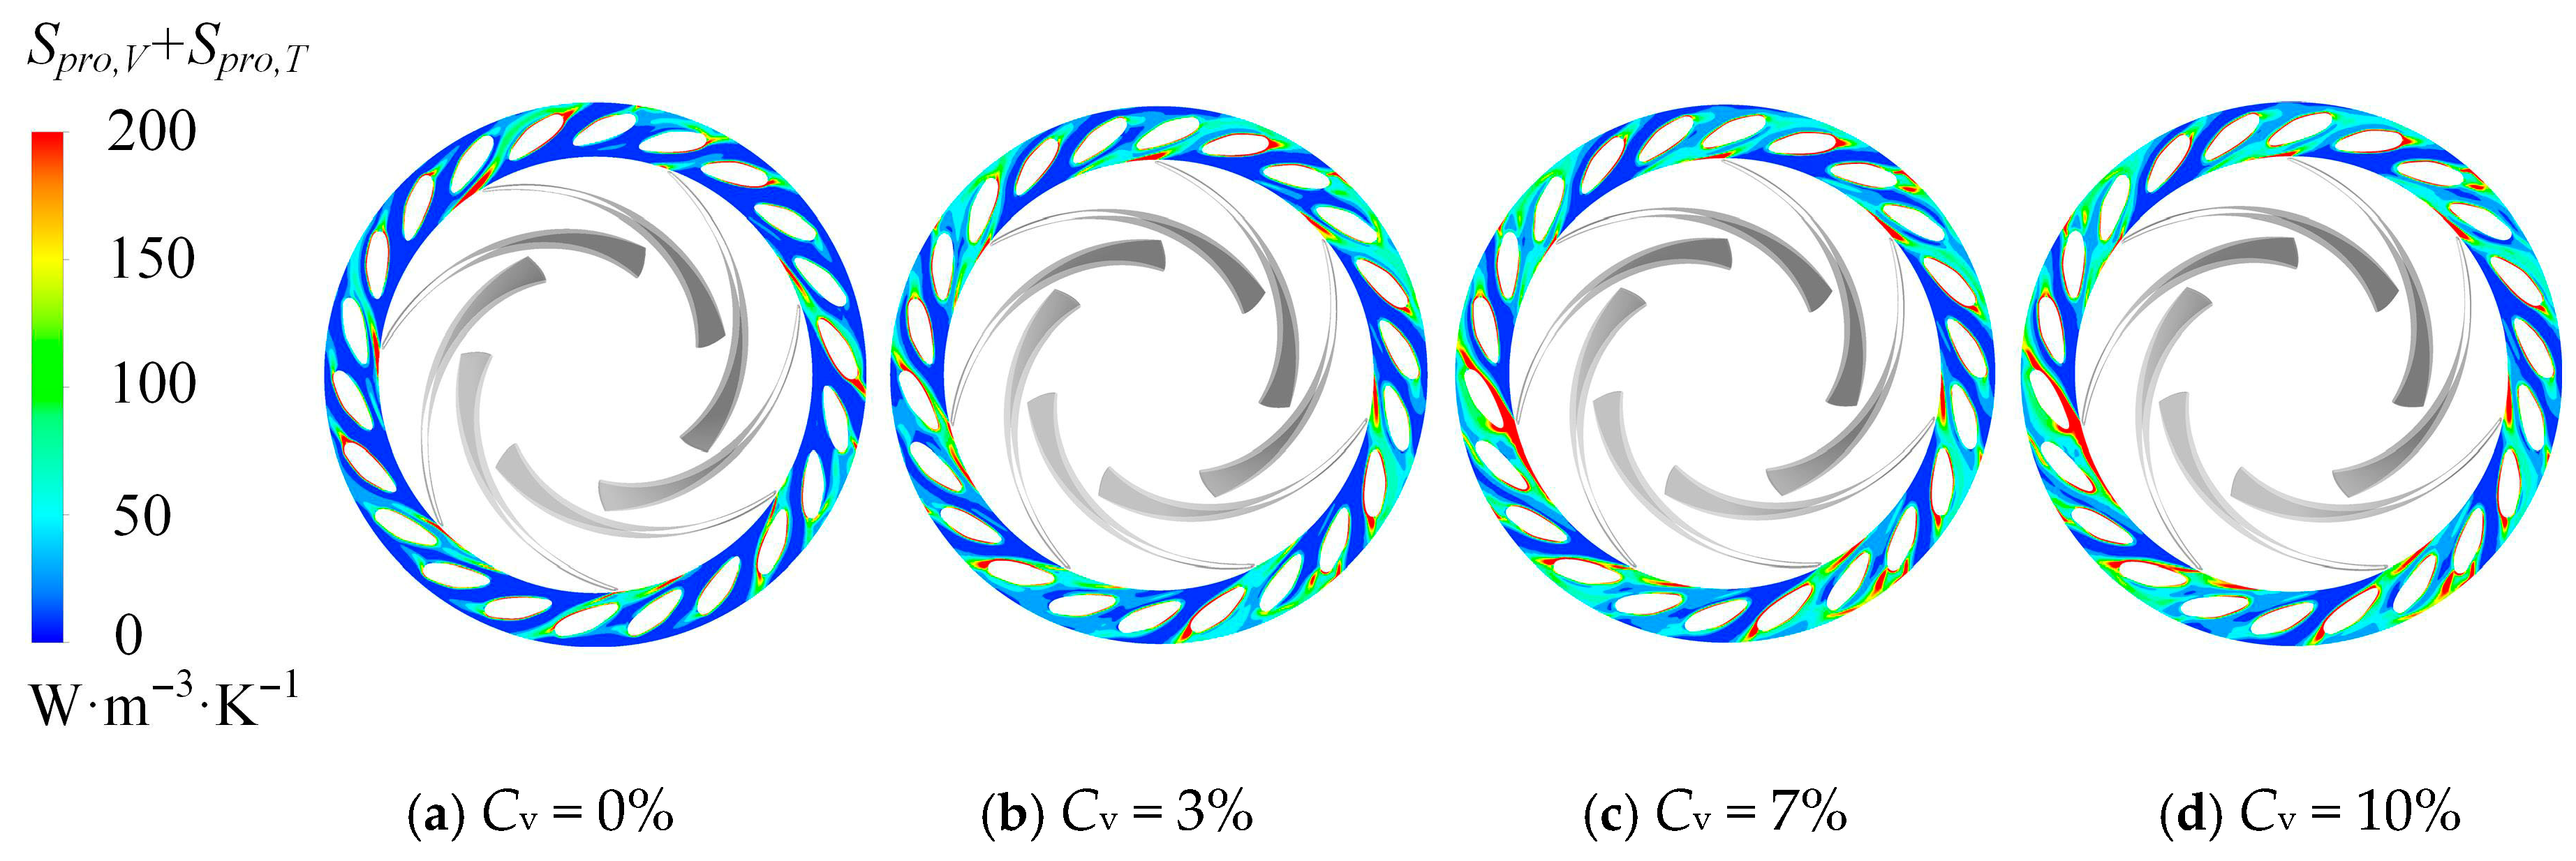
Figure 29 depicts the entropy generation distribution of the return vanes under different sand concentrations. The high-entropy regions are primarily concentrated at the inlet and trailing edges of the blades. When the sand concentration is 3%, the high-entropy area becomes smaller compared with the clear-water condition, indicating that the lower particle count reduces interparticle collisions and improves the flow stability within the return vane passage. As the concentration continues to increase, the high-entropy regions expand again because the larger number of particles enhances the turbulent intensity of the flow, leading to greater entropy generation.
Figure 29.
Entropy production distributions in the return channel with different sand concentrations.
4.4. Effect of Sand Parameters on Pressure Pulsation in the Pump
The above analysis indicates that during pump operation, phenomena such as flow separation, backflow, and energy loss inevitably occur. The introduction of sand particles intensifies these effects, making the internal flow field more complex and unsteady. Based on previous research [15], severe rotor–stator interactions occur in the vaneless region, the guide vane–return vane interaction region, and near the leading edge of the return vane, leading to local recirculation zones and blade-impact phenomena. Further analysis of the front shroud, mid-plane, and rear shroud revealed that the pressure pulsation is strongest at the rear shroud.
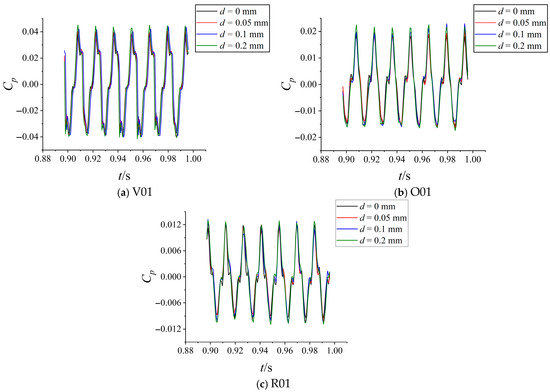
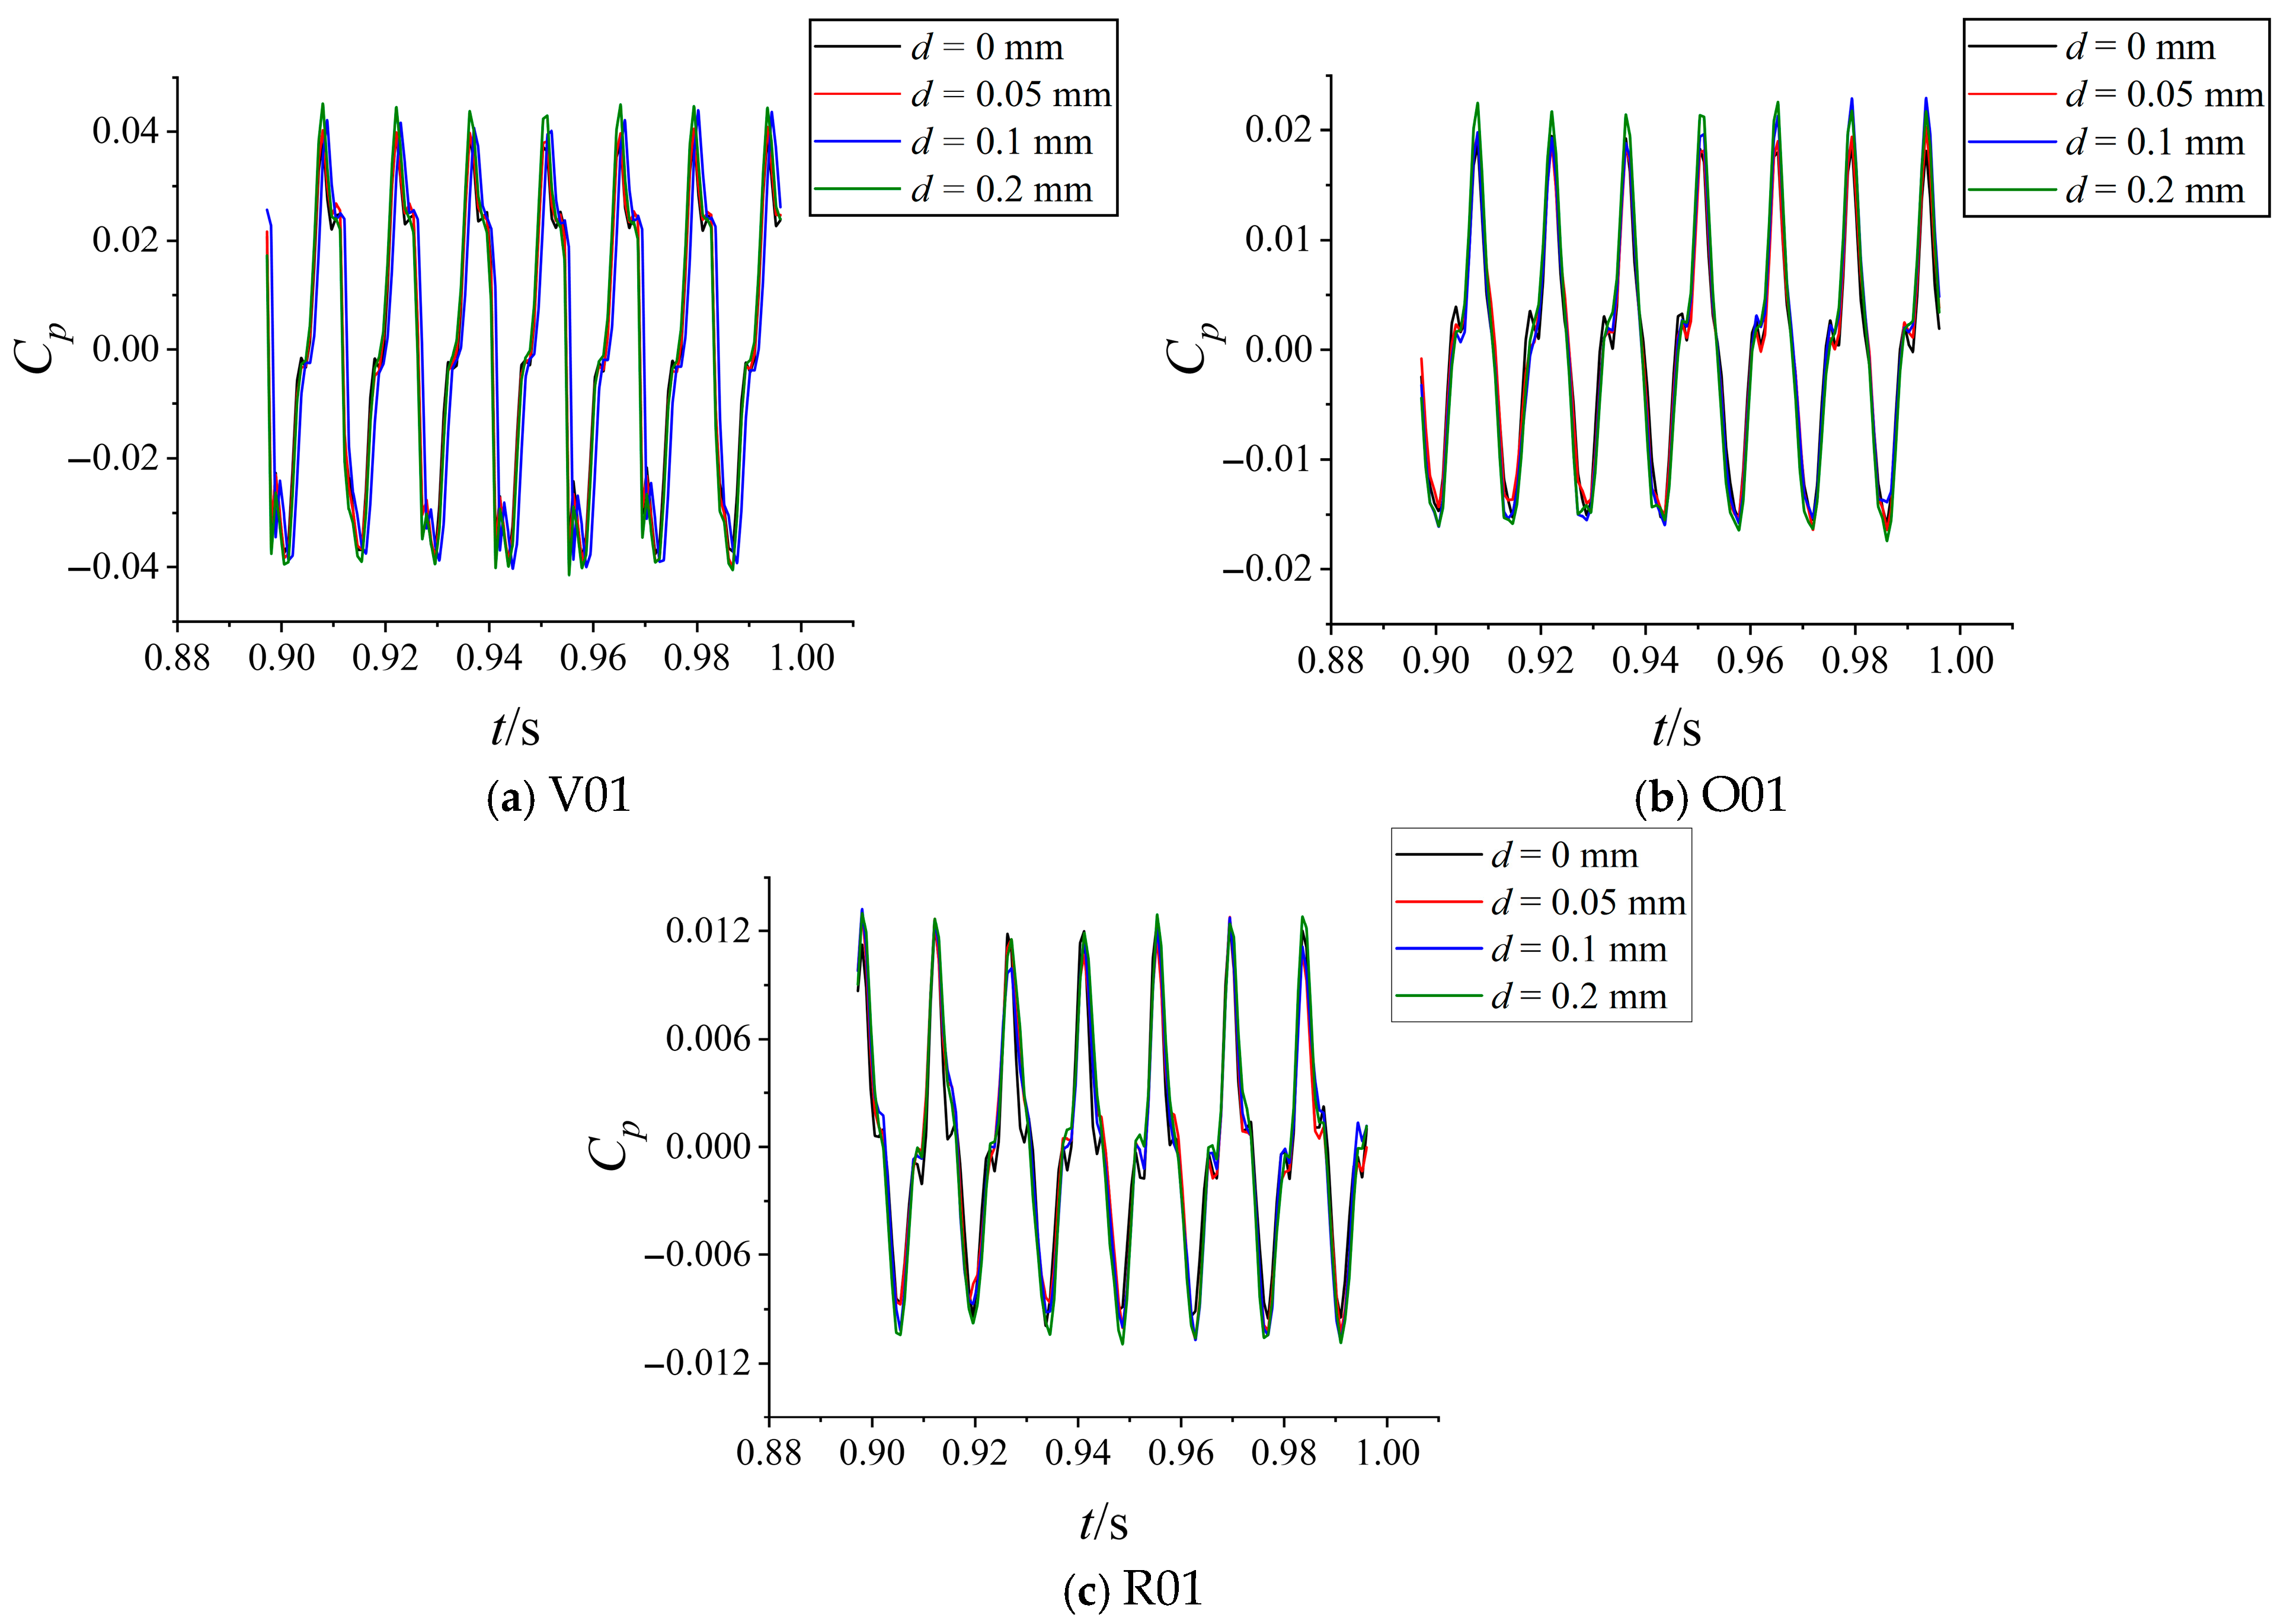
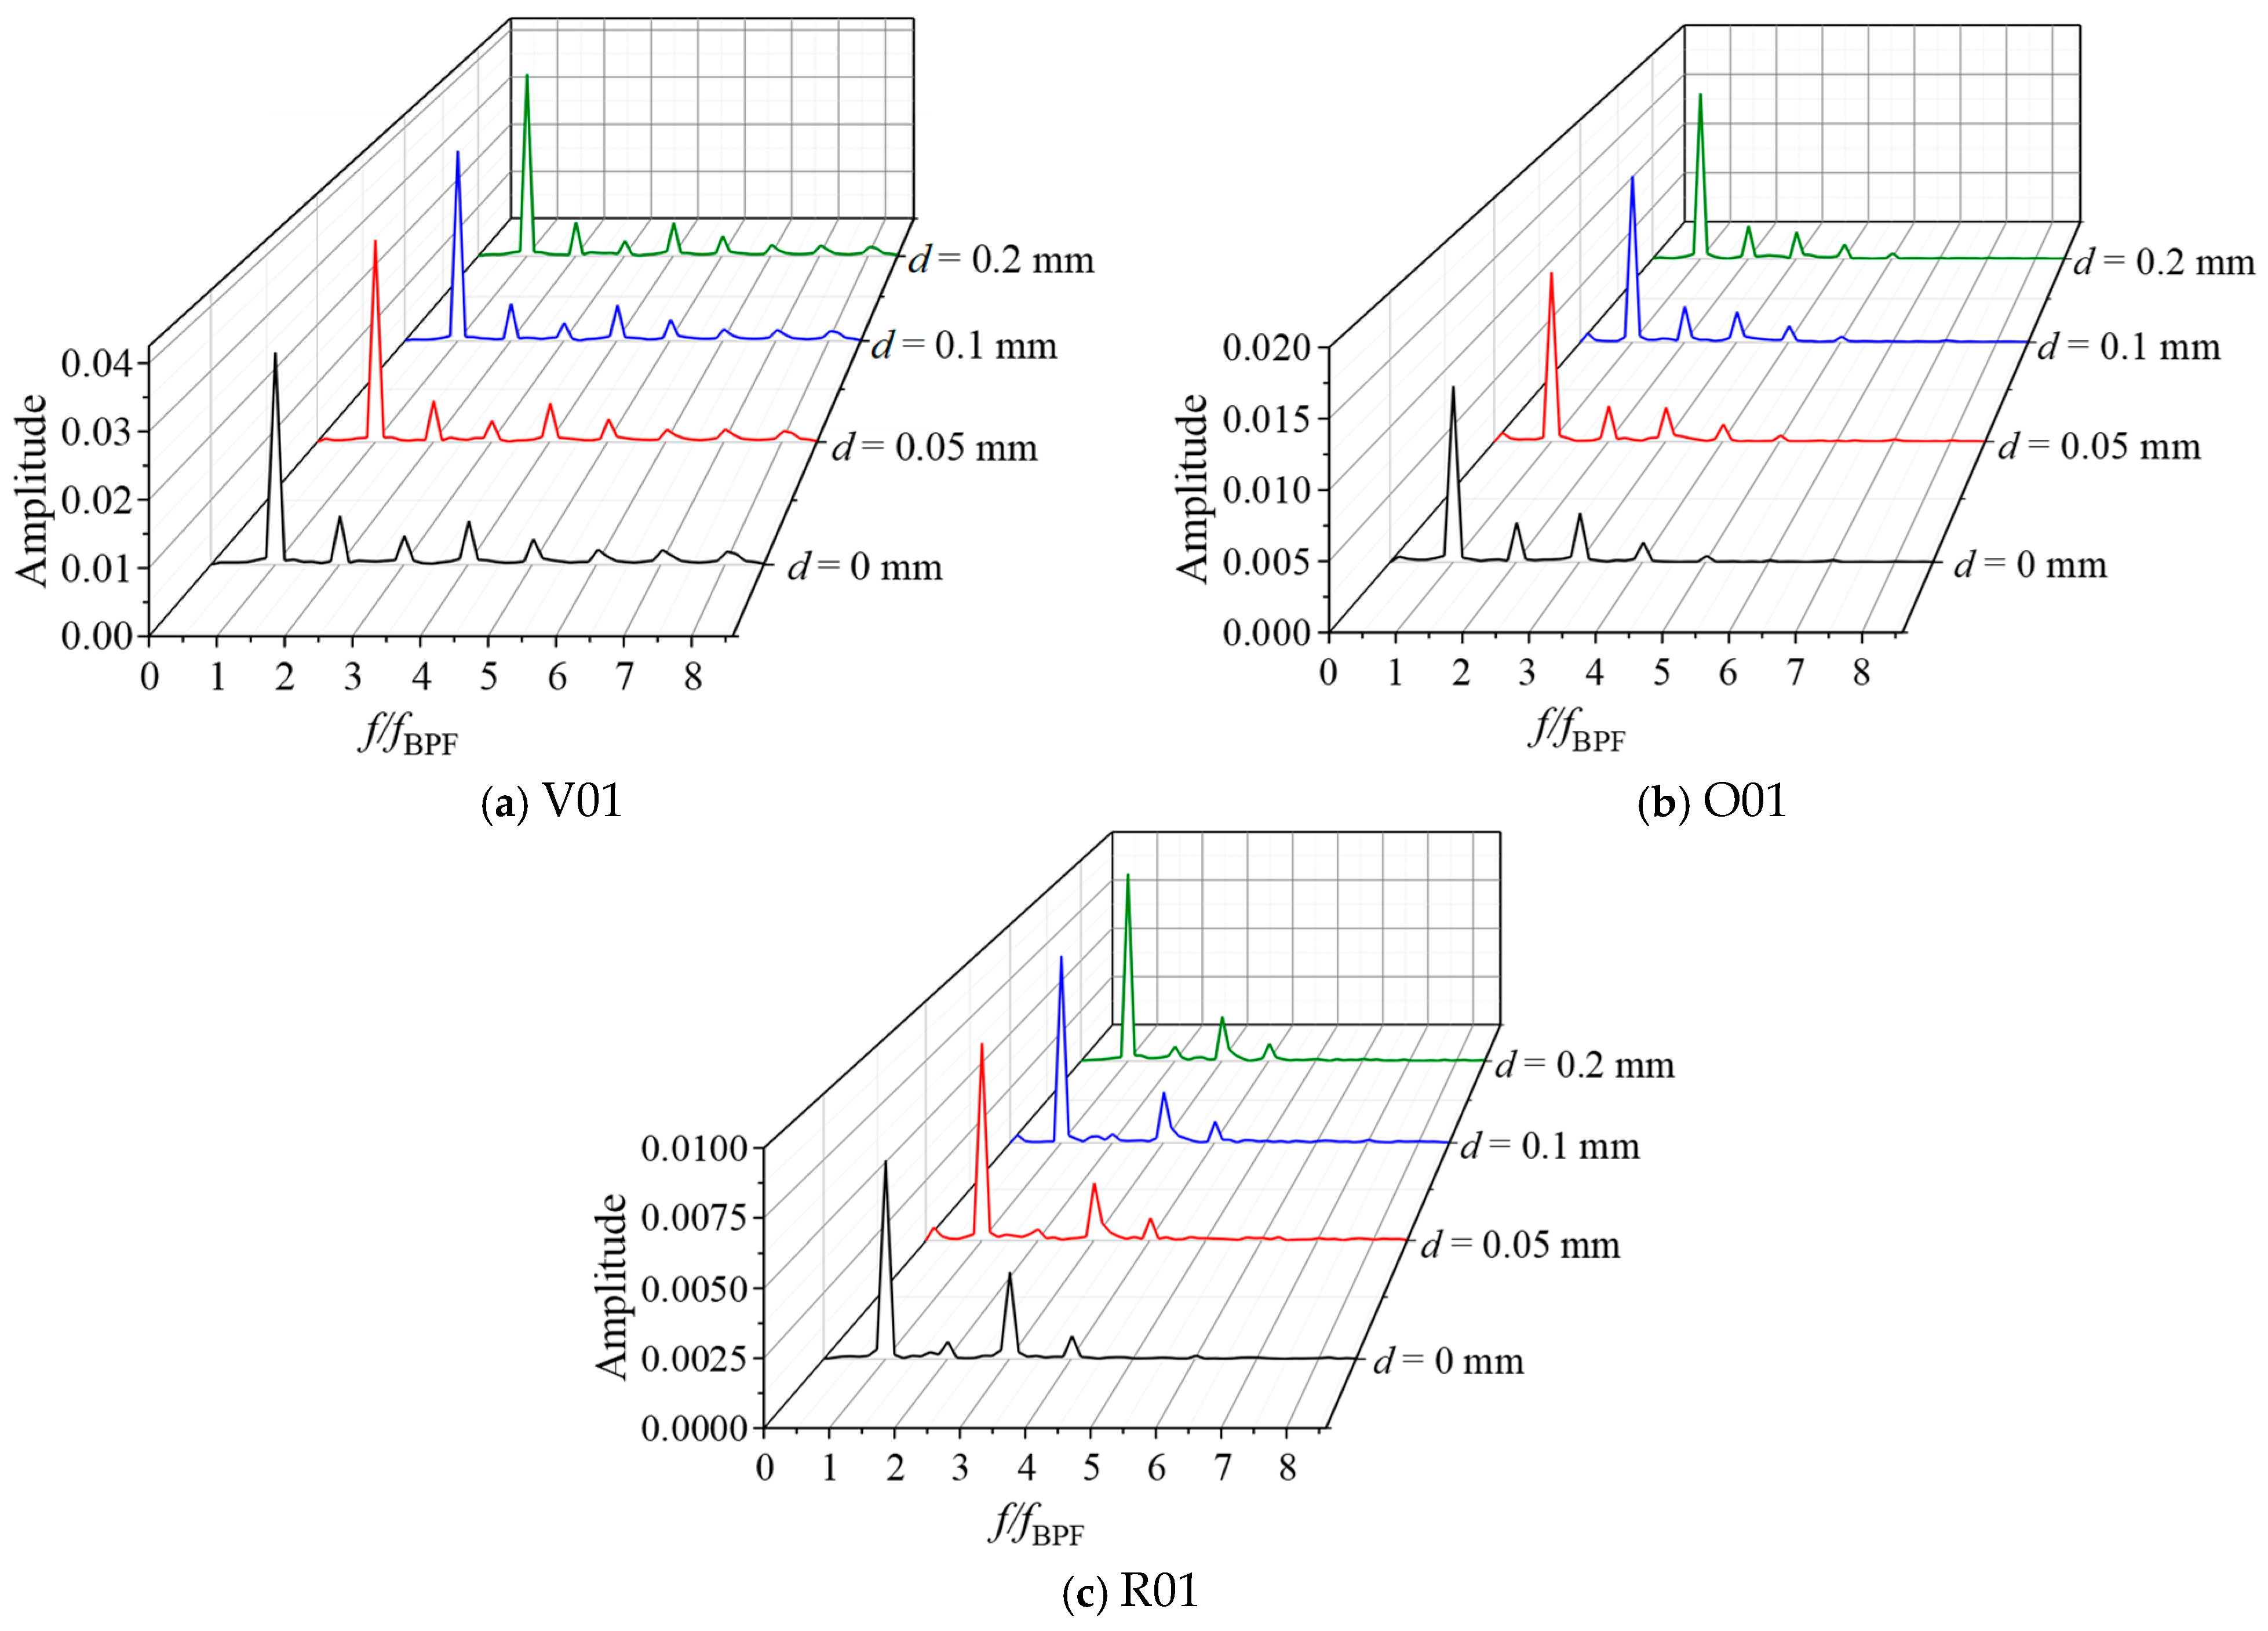
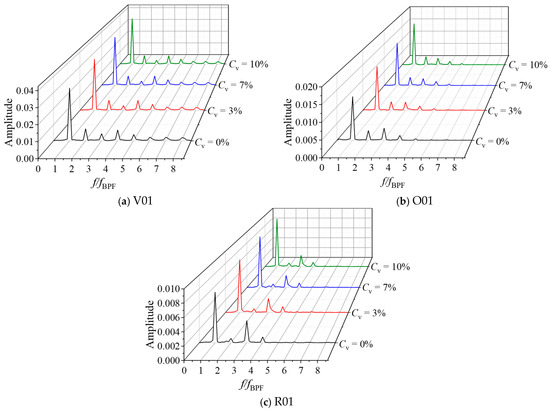
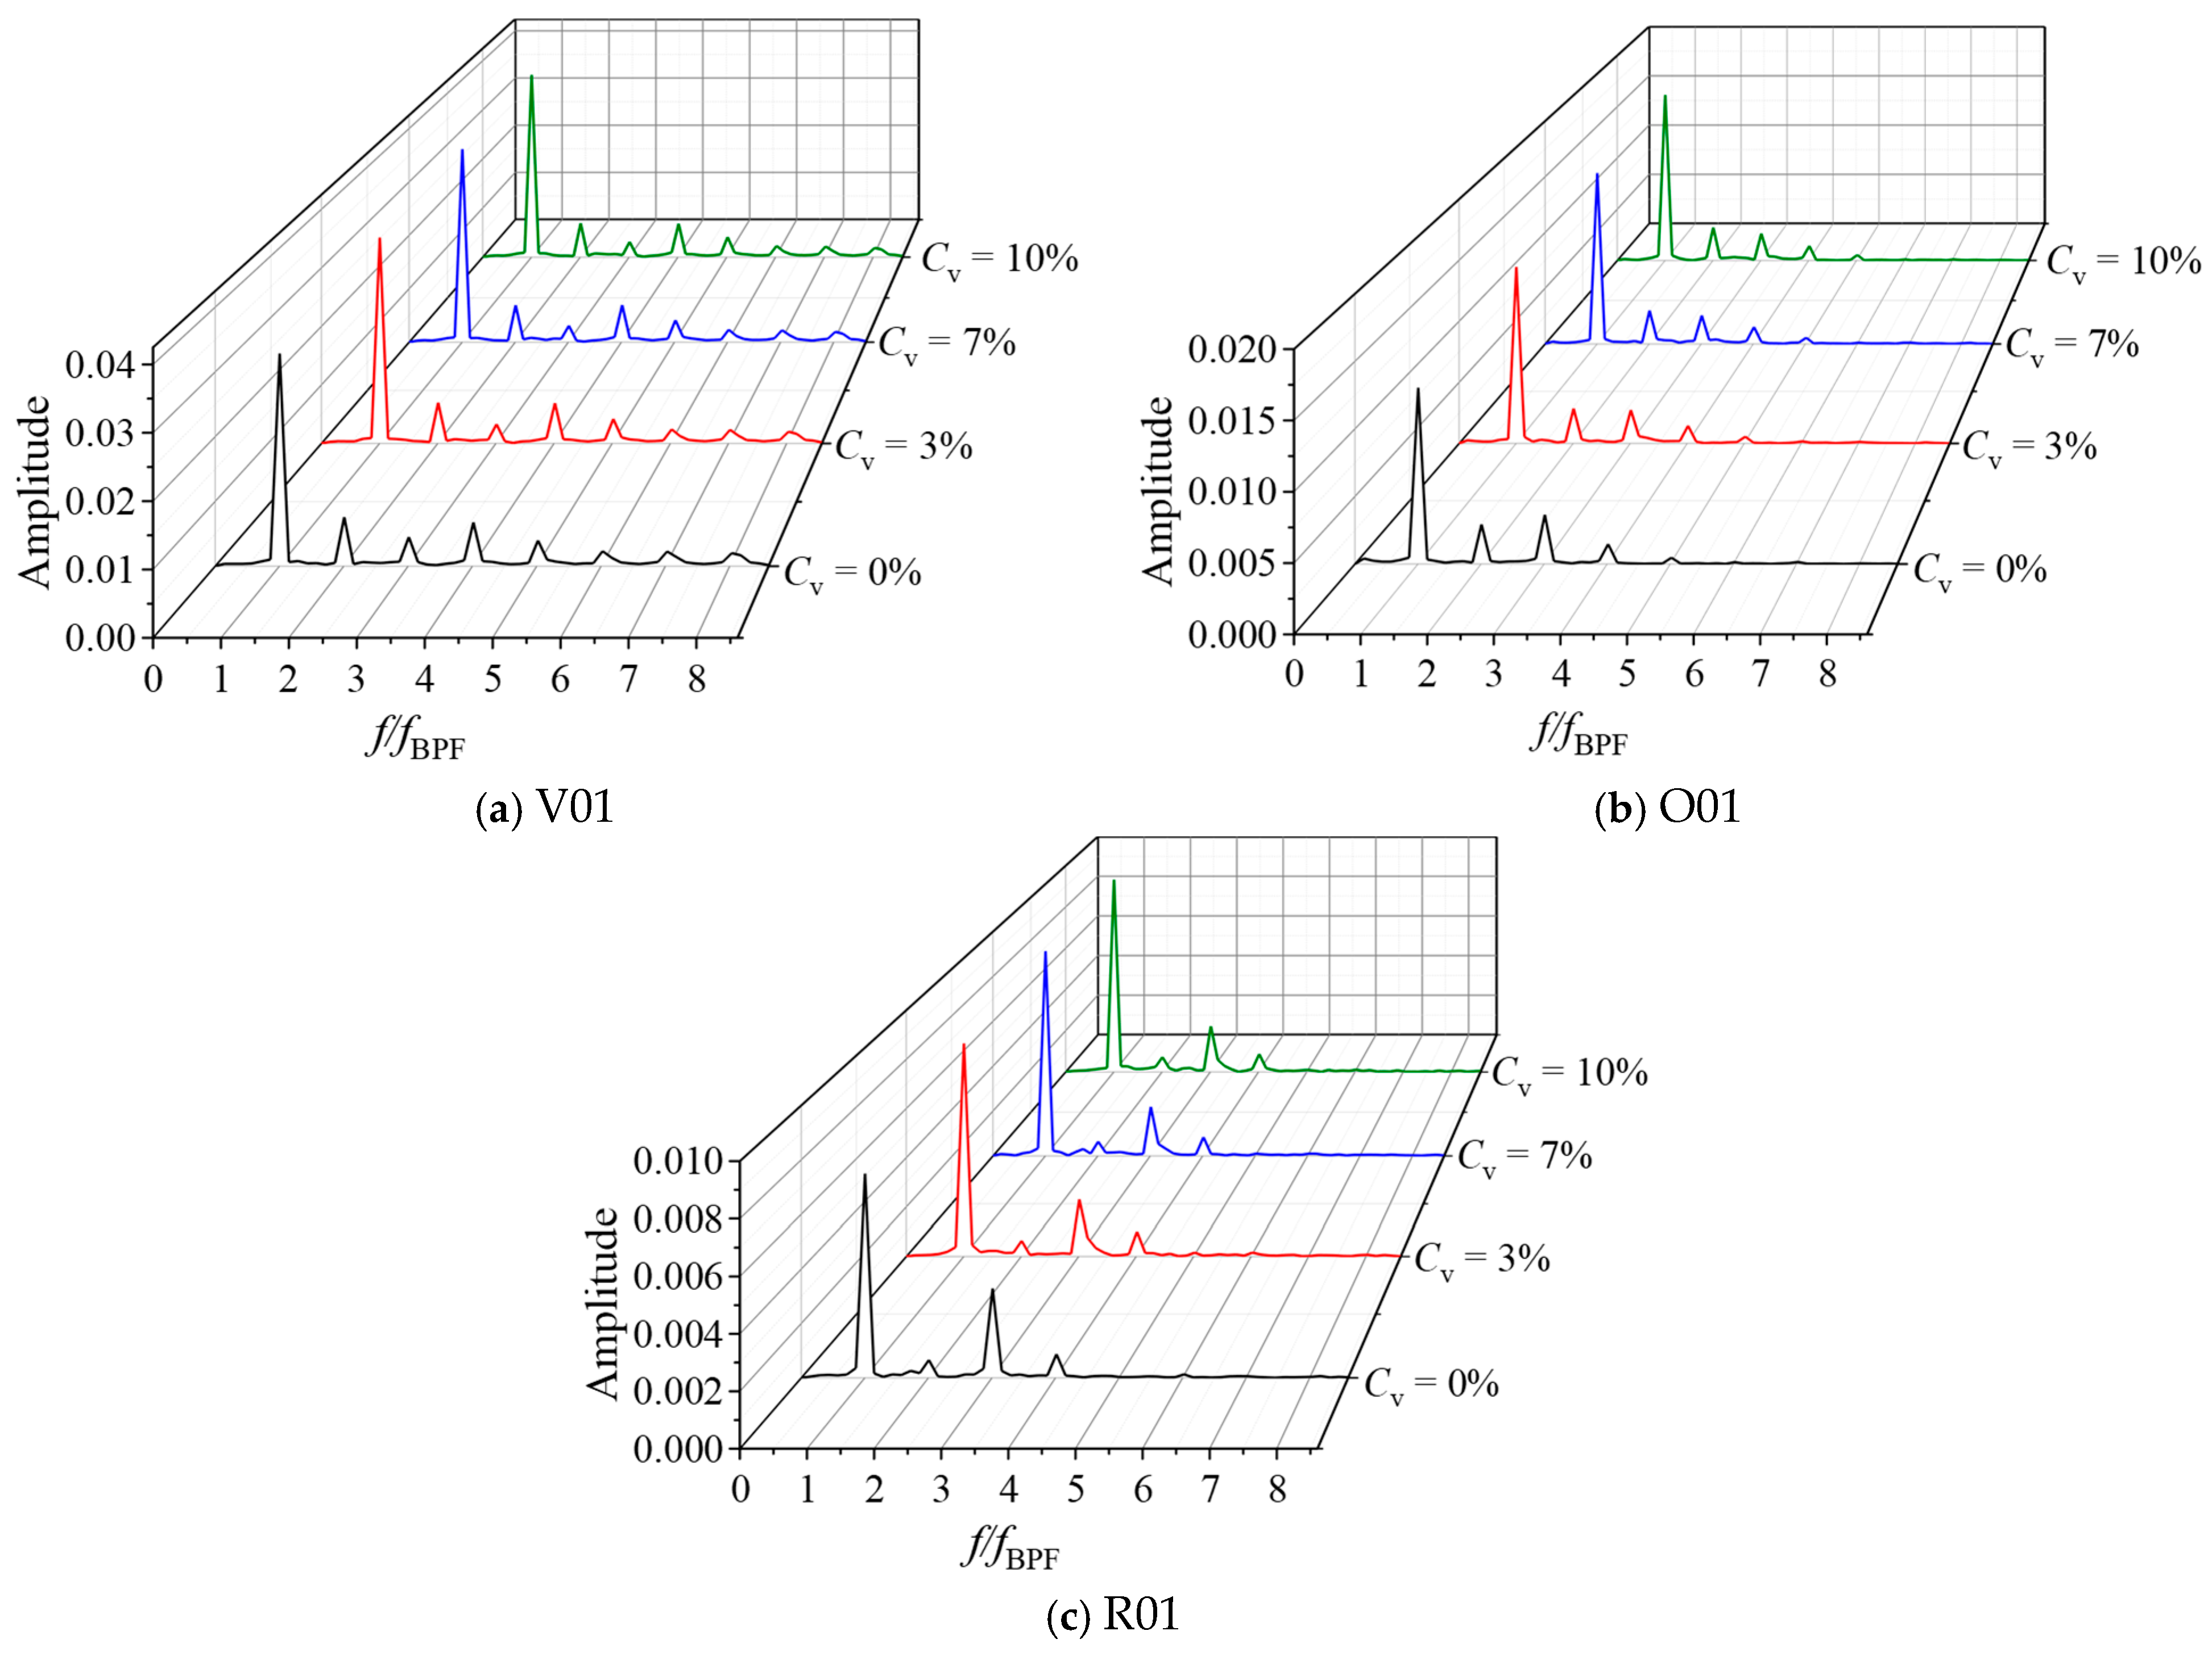
To capture the unsteady characteristics of the solid–liquid two-phase flow, pressure pulsations in the vaneless region, the guide vane–return vane interaction region, and the leading edge of the return vane were investigated. The Fast Fourier Transform (FFT) was employed to analyze the frequency-domain characteristics, focusing on the three monitoring points V01, O01, and R01 located on the rear shroud.
4.4.1. Effect of Sand Size on Pressure Pulsation
Figure 30 shows the time-domain pressure pulsations at the vaneless region, the guide vane–return vane interaction region, and the leading edge of the return vane for different sand particle sizes. By comparing the pressure variations at each monitoring point under various conditions and expressing them in terms of the pressure coefficient, it can be observed that all three regions exhibit regular pulsation patterns. Compared with the clear-water condition, the pressure pulsation coefficients under sand-laden conditions are noticeably higher, indicating that the presence of sand disturbs the internal flow field and enhances pressure fluctuations.
Figure 30.
Time-domain pressure pulsations at different sand particle sizes.
Larger sand particles, having greater inertia and kinetic energy imparted by the rotating impeller, further intensify flow disturbances and lead to more chaotic flow structures, which in turn increase the peak pressure amplitude. A comparison of the three monitoring points reveals that the distance from the rotation axis affects the pulsation intensity: as the distance increases, the amplitude of pressure fluctuations gradually decreases.
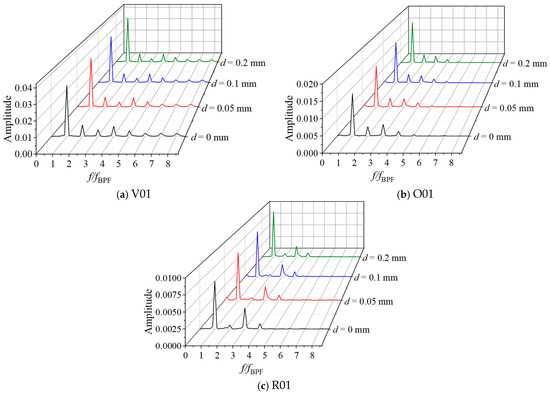
Figure 31 presents the corresponding frequency-domain spectra at the same monitoring points. At the vaneless region point V01, the dominant and secondary frequencies correspond to the blade-passing frequency (BPF) and its harmonics, confirming that the pulsations are primarily induced by rotor–stator interaction. At point O01, located in the guide vane–return vane interaction region, the dominant frequencies are also the BPF and its harmonics, but small fluctuations appear in the low-frequency range, suggesting that internal flow unsteadiness also contributes to pressure oscillations in this region.
Figure 31.
Frequency-domain pressure pulsations under different sand particle sizes.
At the leading edge of the return vane (R01), the dominant frequencies remain the BPF and its harmonics; however, small-amplitude oscillations appear between the BPF and its second harmonic, indicating that local unsteady vortices interact with the periodic pressure field. As the particle size increases, the pressure pulsation amplitudes at all monitoring points show a clear upward trend. Compared with the clear-water condition, the dominant amplitudes at points V01, O01, and R01 increase by 5.3%, 8.4%, and 13%; 6.5%, 14%, and 24%; and 10%, 14%, and 25%, respectively. This demonstrates that larger particles, due to higher inertia, induce stronger flow disturbances and more intense pressure fluctuations.
4.4.2. Effect of Sand Concentration on Pressure Pulsation
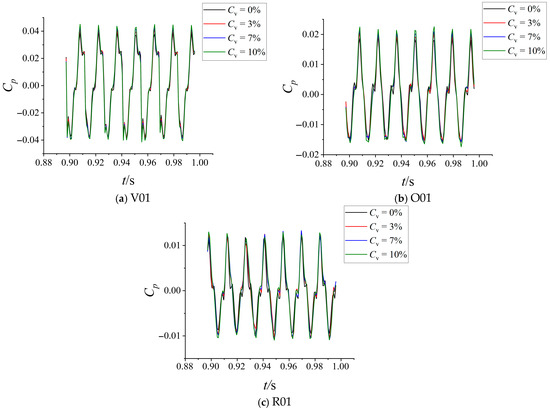
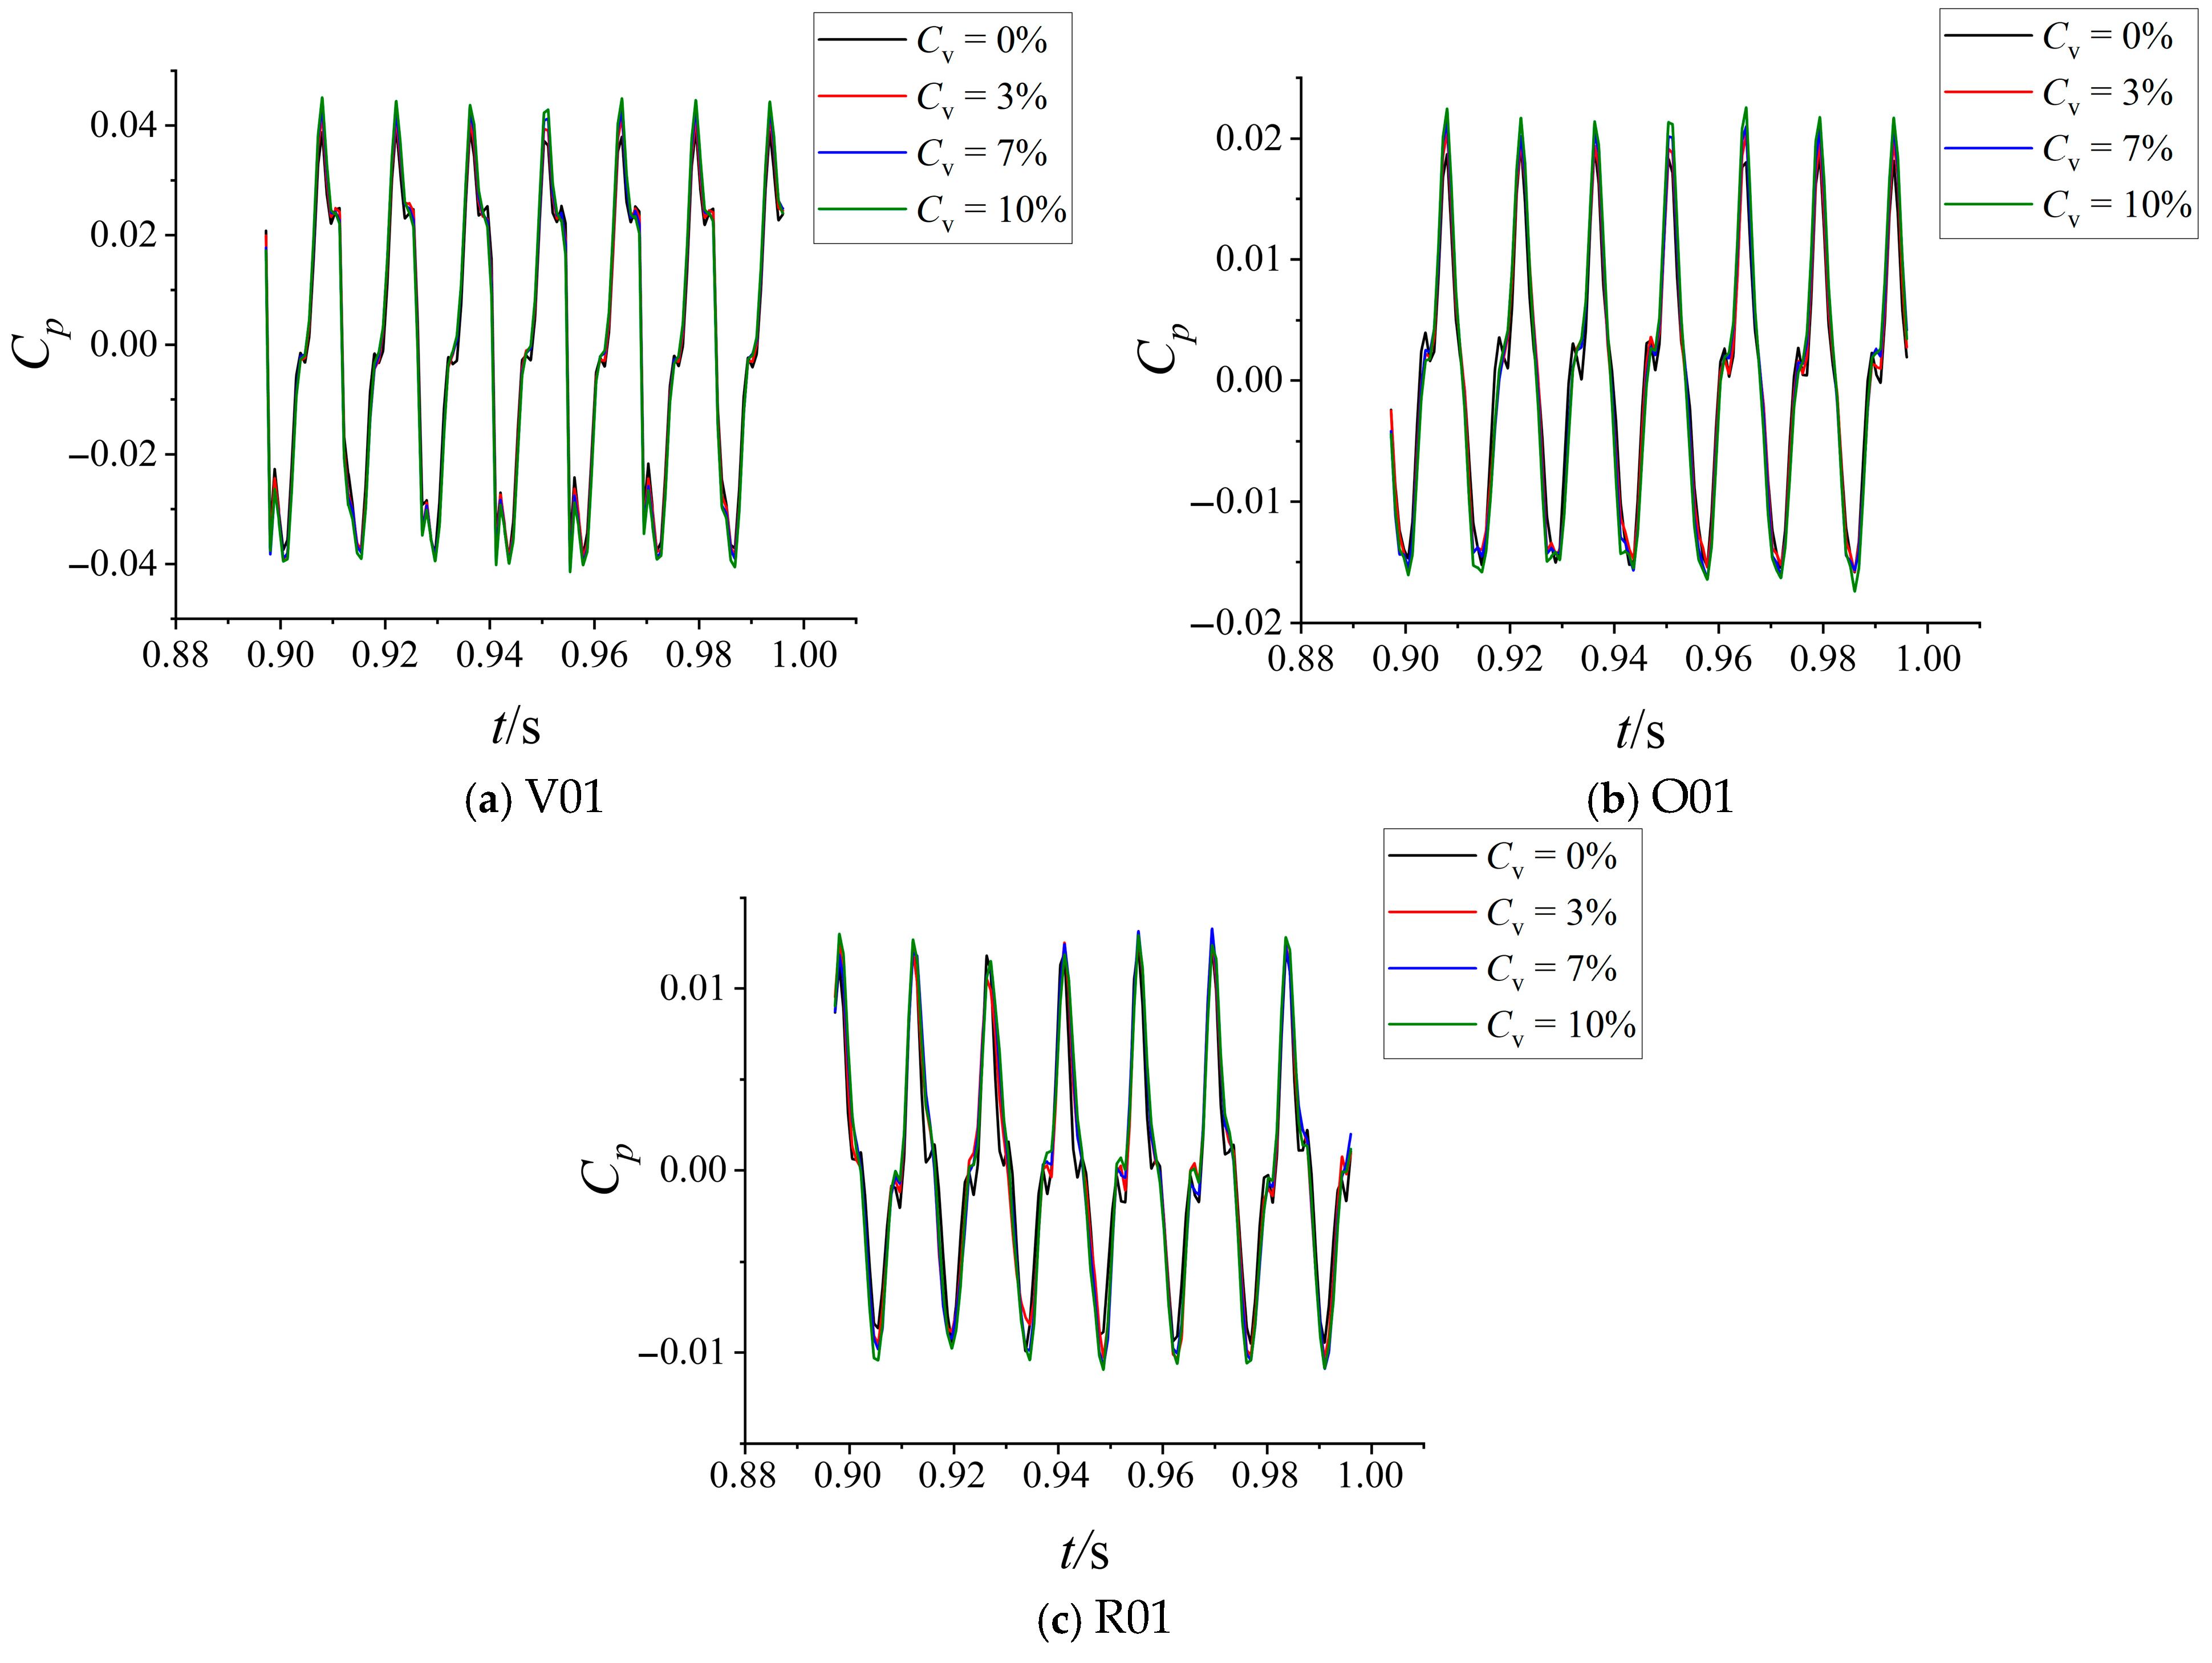
Figure 32 shows the time-domain pressure pulsations at the monitoring points V01, O01, and R01 under different sand concentrations. The results clearly indicate that the pressure coefficient amplitude increases consistently with rising sand concentration. Compared with the clear-water condition, the sand-laden flow exhibits more complex structures and higher local turbulence intensity, which enhance flow instability and amplify the pulsation peaks.
Figure 32.
Time-domain pressure pulsations at different sand concentrations.
At high concentrations, the motion of sand particles between the impeller and guide vanes strengthens the rotor–stator interaction, producing more frequent and intense vortical structures that exacerbate the pressure fluctuations. Moreover, the location of each monitoring point within the pump leads to distinct pulsation characteristics:
V01 (vaneless region): Closest to the impeller axis and strongly influenced by rotor–stator interaction; the pressure pulsations are most pronounced, especially under high sand concentrations.
O01 (interaction region): Located farther from the axis, the pulsation amplitude is smaller.
R01 (leading edge of the return vane): Farthest from the rotation axis; although the average pulsation amplitude is lowest, structural effects and local particle accumulation at this location enhance localized fluctuations.
Figure 33 shows the corresponding frequency-domain spectra for the same monitoring points. Compared with the clear-water condition, the addition of sand particles increases the dominant amplitude of pressure pulsations in all three regions, and the amplitude continues to rise with higher sand concentrations.
Figure 33.
Frequency-domain pressure pulsations under different sand concentrations.
At V01, the dominant and secondary frequencies correspond to the blade-passing frequency and its harmonics, confirming that rotor–stator interaction remains the primary source of pulsation. At O01, similar frequency characteristics are observed; however, the low-frequency fluctuations decrease with increasing sand concentration, implying that higher particle concentrations can suppress small-scale unsteady motions and stabilize the interaction flow field. At R01, the dominant frequencies remain the BPF and its harmonics, indicating that the interaction mechanism is still the main driver of pulsations.
As sand concentration increases from 3% to 10%, the dominant amplitudes at V01, O01, and R01 rise by 7%, 10%, and 13%; 10%, 17.5%, and 24%; and 15%, 22%, and 25%, respectively, compared with the clear-water case. These results demonstrate that the increase in particle number and interaction intensity amplifies the effects of rotor–stator interference, thereby causing a continuous rise in pressure pulsation amplitude throughout the pump.
5. Conclusions
Based on the Euler–Euler method, numerical simulations were conducted to analyze the pump operating conditions of the pump turbine, focusing on the variations in external characteristics, internal flow field, energy loss, and pressure pulsation under different sand particle sizes and concentrations. The main conclusions are summarized as follows:
(1) Experimental validation of the pump operating condition was performed, with the deviation within 3%. When sand particles were added under clear-water conditions, both the head and efficiency decreased progressively with increasing particle size—the head dropped by 4%, 5.2%, and 7.9%, while the efficiency decreased by 12.7%, 14%, and 15%, respectively. Similarly, as sand concentration increased, the head decreased by 5.7%, 7.4%, and 7.9%, while the efficiency decreased by 5.6%, 11.5%, and 15%. These results indicate that both particle size and concentration have significant impacts on the pump’s hydraulic performance.
(2) During pump operation, the addition of sand particles increased the average pressure in the impeller, guide vanes, and return vanes compared to the clear-water condition, while the average velocity in the impeller slightly increased and that in other components decreased. With increasing particle size, the average pressure gradually decreased, whereas increasing concentration led to higher average pressure. The introduction of sand particles caused non-uniform streamline distributions, along with the formation of vortices and backflow near the guide and return vanes, resulting in disturbed and unstable flow patterns.
(3) Under sand-laden conditions, the total entropy production was higher than that under clear-water operation, with the return vanes contributing the most to the total entropy generation. As the particle size increased, the entropy production in the return vanes decreased, leading to a reduction in total entropy production, while other components exhibited an increasing trend. At different concentrations, when , the total entropy production was slightly lower than that of clear water, but it exceeded the clear-water case as concentration increased further. The high-entropy regions were mainly concentrated near the impeller blade surfaces and trailing edges, the guide vane inlets and surfaces, and the leading and trailing edges of the return vanes.
(4) During pump operation, pressure pulsation analyses were conducted at monitoring points V01 (vaneless region), O01 (guide vane–return vane interaction region), and R01 (leading edge of the return vane). Compared to the clear-water condition, the presence of sand particles significantly increased the pressure fluctuations, and the peak pressure coefficient rose with increasing particle size and concentration. The dominant frequency at all monitoring points corresponded to the blade-passing frequency, indicating that rotor–stator interaction was the primary source of pressure fluctuations. As particle size increased, the main amplitude at V01 rose by 5.3%, 8.4%, and 13%; at O01 by 6.5%, 14%, and 24%; and at R01 by 10%, 14%, and 25%. Similarly, with increasing concentration, the main amplitude at V01 increased by 7%, 10%, and 13%; at O01 by 10%, 17.5%, and 24%; and at R01 by 15%, 22%, and 25%.
Author Contributions
Conceptualization: Q.F.; Data curation: Q.F. and W.W.; Formal analysis: Q.F.; Funding acquisition: X.G.; Investigation: W.W.; Methodology: Q.F.; Project administration: W.W.; Resources: X.G.; Software: X.G.; Supervision: W.W.; Validation: X.G.; Visualization: Q.F.; Roles/Writing—original draft: Q.F.; Writing—review & editing: X.G. and W.W. All authors have read and agreed to the published version of the manuscript.
Funding
This research was funded by Natural Science Foundation of Jiangsu Province (Grant No. BK20250846), and China Post-doctoral Science Foundation (Grant No. 2024M751178).
Data Availability Statement
The raw data supporting the conclusions of this article will be made available by the authors on request.
Conflicts of Interest
The authors declare no conflicts of interest.
References
- Arun Shankar, V.K.; Umashankar, S.; Paramasivam, S.; Hanigovszki, N. A Comprehensive Review on Energy Efficiency Enhancement Initiatives in Centrifugal Pumping System. Appl. Energy 2016, 181, 495–513. [Google Scholar] [CrossRef] [Scilit]
- Pimenov, D.Y.; Mia, M.; Gupta, M.K.; Machado, Á.R.; Pintaude, G.; Unune, D.R.; Khanna, N.; Khan, A.M.; Tomaz, Í.; Wojciechowski, S.; et al. Resource Saving by Optimization and Machining Environments for Sustainable Manufacturing: A Review and Future Prospects. Renew. Sustain. Energy Rev. 2022, 166, 112660. [Google Scholar] [CrossRef] [Scilit]
- Pérez-Díaz, J.I.; Chazarra, M.; García-González, J.; Cavazzini, G.; Stoppato, A. Trends and Challenges in the Operation of Pumped-Storage Hydropower Plants. Renew. Sustain. Energy Rev. 2015, 44, 767–784. [Google Scholar] [CrossRef] [Scilit]
- Shang, L.; Zhu, J.; Huang, X.; Gao, S.; Wang, Z.; Liu, J. Fluid–Structure Interactions in Pump-Turbines: A Comprehensive Review. Processes 2025, 13, 2321. [Google Scholar] [CrossRef] [Scilit]
- Chandel, S.; Singh, S.N.; Seshadri, V. A Comparative Study on the Performance Characteristics of Centrifugal and Progressive Cavity Slurry Pumps with High Concentration Fly Ash Slurries. Part. Sci. Technol. 2011, 29, 378–396. [Google Scholar] [CrossRef] [Scilit]
- Huang, S.; Su, X.; Qiu, G. Transient Numerical Simulation for Solid-Liquid Flow in a Centrifugal Pump by DEM-CFD Coupling. Eng. Appl. Comput. Fluid Mech. 2015, 9, 411–418. [Google Scholar] [CrossRef] [Scilit]
- Liu, S.; Tang, X.; Wu, Y.; Nishi, M. Simulation of Dense Solid-Liquid Two-Phase Flow in a Pump Impeller. In Proceedings of the ASME 2004 Heat Transfer/Fluids Engineering Summer Conference, Charlotte, NC, USA, 11–15 July 2004; American Society of Mechanical Engineers Digital Collection: New York, NY, USA; pp. 461–467. [Google Scholar]
- Choi, Y.-D.; Son, S.-W. CFD Analysis on the Performance and Internal Flow of a Micro Cross-Flow Hydro Turbine in the Range of Very Low Specific Speed. KSFM J. Fluid Mach. 2012, 15, 25–30. [Google Scholar] [CrossRef] [Scilit]
- Sentyabov, A.V.; Platonov, D.V.; Minakov, A.V.; Lobasov, A.S. Numerical Study of the Vortex Breakdown and Vortex Reconnection in the Flow Path of High-Pressure Water Turbine. J. Phys. Conf. Ser. 2021, 2088, 012040. [Google Scholar] [CrossRef] [Scilit]
- Qian, J.; Zeng, Y.; Guo, Y.; Zhang, L. Reconstruction of the Complete Characteristics of the Hydro Turbine Based on Inner Energy Loss. Nonlinear Dyn. 2016, 86, 963–974. [Google Scholar] [CrossRef] [Scilit]
- Wang, L.; Li, B.; Zhao, W. Dynamics and Wear Analysis of Hydraulic Turbines in Solid-Liquid Two-Phase Flow. Open Phys. 2019, 17, 790–796. [Google Scholar] [CrossRef] [Scilit]
- Wang, H.; Liu, X. Numerical Analysis of Solid-Liquid Turbulent Flow in Francis Turbine Spiral Case. MMC_B 2017, 86, 126–140. [Google Scholar] [CrossRef] [Scilit]
- Kock, F.; Herwig, H. Entropy Production Calculation for Turbulent Shear Flows and Their Implementation in Cfd Codes. Int. J. Heat Fluid Flow 2005, 26, 672–680. [Google Scholar] [CrossRef] [Scilit]
- Wang, W.; Pavesi, G.; Pei, J.; Yuan, S. Transient Simulation on Closure of Wicket Gates in a High-Head Francis-Type Reversible Turbine Operating in Pump Mode. Renew. Energy 2020, 145, 1817–1830. [Google Scholar] [CrossRef] [Scilit]
- Zhang, N.; Dong, H.; Zheng, F.; Gad, M.; Li, D.; Gao, B. Investigation of the Impact of Rotor- Stator Matching Modes on the Pressure Pulsations of the Guide Vane Centrifugal Pump. Ann. Nucl. Energy 2025, 214, 111189. [Google Scholar] [CrossRef] [Scilit]

Disclaimer/Publisher’s Note: The statements, opinions and data contained in all publications are solely those of the individual author(s) and contributor(s) and not of MDPI and/or the editor(s). MDPI and/or the editor(s) disclaim responsibility for any injury to people or property resulting from any ideas, methods, instructions or products referred to in the content. |
© 2025 by the authors. Licensee MDPI, Basel, Switzerland. This article is an open access article distributed under the terms and conditions of the Creative Commons Attribution (CC BY) license (https://creativecommons.org/licenses/by/4.0/).