


Abstract
Pharmaceutical residues in aquatic environments represent a significant pollution concern, particularly in regions experiencing rapid healthcare and industrial growth. This study presents a sensitive and environmentally sustainable analytical method for monitoring paracetamol (PAR), ibuprofen (IBU), and diclofenac sodium (DIC) in pharmaceutical wastewater from Al-Kharj Governorate, Saudi Arabia. The method integrates off-line solid-phase extraction (SPE) with field-amplified sample stacking (FASS) prior to capillary electrophoresis (CE), enabling effective dual preconcentration and enhanced detection sensitivity. Key parameters affecting separation and enrichment, including background electrolyte composition, pH, injection conditions, stacking efficiency, and SPE sorbent selection, were systematically optimized. Under optimal conditions, the SPE–CE–FASS method demonstrated excellent linearity (r2 ≥ 0.997) over the concentration range of 10–1000 ng L−1, with strong precision (intra- and inter-day RSD ≤ 6%) and high recoveries (91.8–98.5%) in pharmaceutical wastewater samples. Matrix-based limits of detection were 4.0 ng L−1 for PAR, 3.5 ng L−1 for IBU, and 3.0 ng L−1 for DIC. The method was successfully applied to real wastewater samples, where all target analytes were detected at environmentally relevant concentrations. Owing to its low solvent consumption, reduced waste generation, and high sensitivity, the proposed SPE–CE–FASS method offers a reliable, cost-effective, and environmentally friendly approach for routine monitoring of pharmaceutical residues in complex wastewater matrices.
1. Introduction
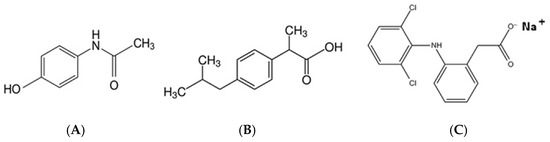
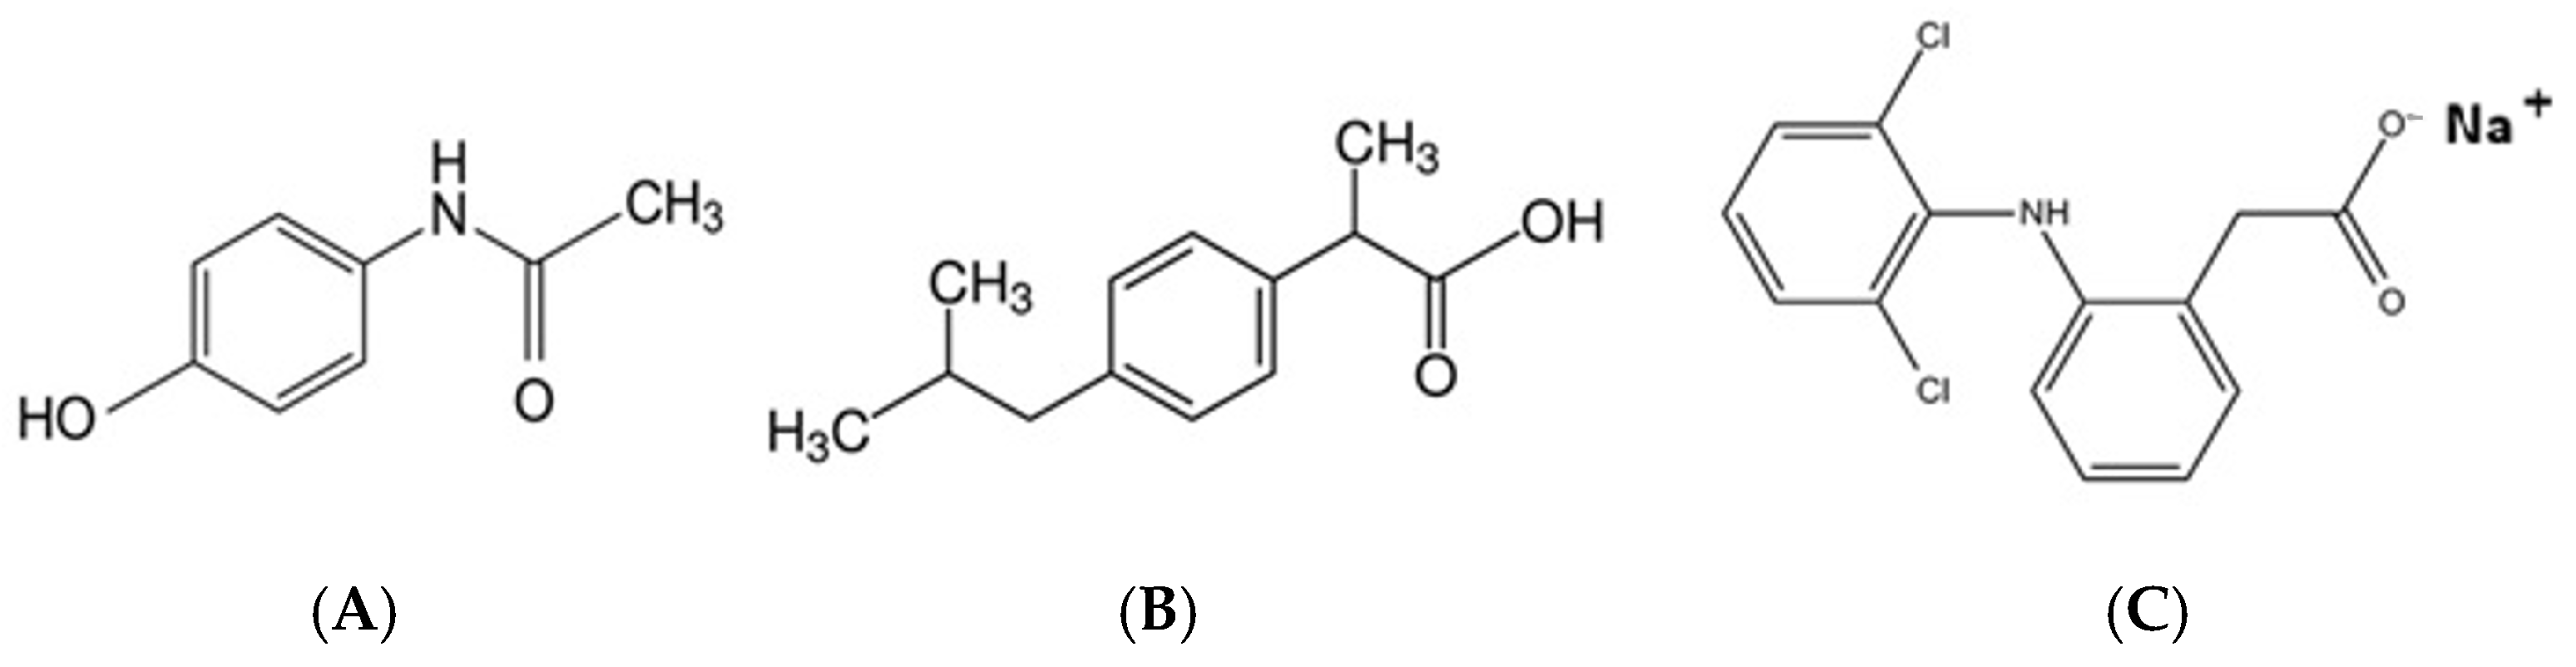
The ongoing release of pharmaceutical residues into aquatic ecosystems has emerged as a significant concern for environmental sustainability and public health. Among these contaminants, non-steroidal anti-inflammatory drugs (NSAIDs) and commonly used analgesics are frequently detected due to their extensive consumption, incomplete metabolism, and insufficient removal during conventional wastewater treatment processes [1]. Paracetamol (PAR), ibuprofen (IBU), and diclofenac sodium (DIC) are among the most widely used pharmaceuticals, primarily acting through inhibition of prostaglandin synthesis via cyclooxygenase enzymes [2,3]. The chemical structures of the studied drugs are demonstrated in Figure 1.
Figure 1.
Chemical structure of paracetamol (A), ibuprofen (B), and diclofenac sodium (C).
These compounds enter aquatic environments through multiple pathways, including domestic sewage, hospital effluents, and discharges from pharmaceutical manufacturing processes [4]. Their continuous release and persistence have been associated with adverse ecological effects, including toxicity to aquatic organisms and potential risks related to long-term human exposure through environmental cycling and water reuse. Pharmaceutical wastewater, in particular, represents a significant point source of contamination and is often inadequately monitored in many developing and rapidly industrializing regions [5].
PAR, IBU, and DIC are frequently detected in environmental waters at trace levels ranging from ng L−1 to low µg L−1 concentrations, necessitating the development of highly sensitive and selective analytical methods [1]. The determination of these compounds in complex environmental matrices remains analytically challenging due to their low concentrations, matrix interferences, and the need for efficient sample preparation and preconcentration strategies.
A variety of analytical techniques have been reported for the determination of these pharmaceuticals in pharmaceutical formulations [6,7,8,9], biological fluids [10,11,12,13], and environmental samples [14,15,16]. High-performance liquid chromatography (HPLC) and ultra-performance liquid chromatography (UPLC) coupled with UV or diode-array detection are widely used for routine analysis [17]. More recently, liquid chromatography–tandem mass spectrometry (LC–MS/MS) has become the preferred technique for trace-level determination in environmental matrices due to its high sensitivity and selectivity. However, LC–MS/MS requires expensive instrumentation, skilled operation, and significant solvent consumption, which may limit its routine application in many monitoring laboratories [18].
Capillary electrophoresis (CE) has emerged as an attractive alternative due to its high separation efficiency, low reagent and solvent consumption, short analysis time, and environmentally friendly nature. CE has been successfully applied for the determination of NSAIDs and analgesics in pharmaceutical and biological samples; however, its application to environmental analysis is often limited by insufficient sensitivity when using conventional UV detection. To address this limitation, online preconcentration techniques such as field-amplified sample stacking (FASS) have been developed and integrated with CE, enabling significant enhancement of detection sensitivity by exploiting conductivity differences between the sample and background electrolyte [19].
In addition, off-line solid-phase extraction (SPE) remains one of the most effective sample preparation techniques for environmental matrices, allowing efficient analyte enrichment, matrix clean-up, and improved analytical performance. The combination of SPE with FASS-enhanced CE represents a powerful hybrid approach that significantly improves sensitivity while preserving the inherent advantages of CE [20].
Although capillary electrophoresis coupled with stacking techniques has previously been explored for trace analysis of environmental contaminants, further improvements in sensitivity and applicability to complex environmental matrices remain necessary. In the present study, a combined SPE–FASS–CE approach was developed and systematically optimized for the simultaneous determination of the selected drugs in wastewater samples. The method integrates off-line SPE enrichment with on-line field-amplified sample stacking, allowing significant sensitivity enhancement while maintaining the inherent advantages of capillary electrophoresis, such as low solvent consumption, rapid analysis, and cost-effective instrumentation. The proposed strategy demonstrates reliable performance for trace-level monitoring of these pharmaceuticals in environmental waters.
The present study aims to develop and validate a sensitive and sustainable analytical method for pollution monitoring of PAR, IBU, and DIC in pharmaceutical wastewater from Al-Kharj Governorate using SPE coupled with FASS-assisted CE.
2. Materials and Methods
2.1. Chemicals, Reagents, and Standard Solutions
Reference standards of paracetamol (PAR), ibuprofen (IBU), diclofenac sodium (DIC), and naproxen sodium (NAP) (purity ≥ 99%) were obtained from Cymit Química S.L. (Barcelona, Spain). NAP was selected as the internal standard (IS) due to its structural similarity, comparable electrophoretic behavior, and absence in the analyzed wastewater samples. Sodium borate, hydrochloric acid (HCl), and sodium hydroxide (NaOH) were purchased from Prolabo (Briare, France) and used for the preparation of the background electrolyte (BGE). HPLC-grade methanol and acetonitrile were obtained from Sigma (Taufkirchen, Germany). Ultrapure water was used throughout the study.
The BGE consisted of 25 mM sodium borate buffer adjusted to pH 9.2 using 1.0 M NaOH, corresponding to an estimated ionic strength of approximately 75 mM. This ensured sufficient conductivity contrast between the sample and BGE for efficient field-amplified sample stacking (FASS). The buffer was filtered through a 0.45 µm membrane and degassed prior to use.
Individual stock solutions of PAR, IBU, and DIC (1000 mg L−1) were prepared by dissolving 100.0 mg of each compound in 100 mL volumetric flasks. PAR was dissolved in ultrapure water, whereas IBU and DIC were dissolved in methanol. Solutions were sonicated for 5 min and diluted to volume. Working solutions were prepared daily by serial dilution with ultrapure water or BGE to obtain concentrations in the range of 10–1000 ng L−1.
The IS solution was prepared at 500 ng L−1 and added to all calibration standards, quality control samples, and wastewater samples prior to SPE. Mixed standard solutions containing the analytes and IS (200 ng L−1) were used for method optimization. All solutions were stored in amber glass bottles at 4 °C and remained stable for at least two weeks. Before CE analysis, solutions were filtered through 0.22 µm PTFE membrane filters.
2.2. Collection of Real Wastewater Samples
Pharmaceutical wastewater samples were collected from final effluent discharge points in Al-Kharj Governorate during normal operating conditions. Samples (500 mL) were collected in pre-cleaned amber glass bottles to minimize photodegradation. Bottles were rinsed three times with sample water prior to collection.
Samples were transported to the laboratory in a temperature-controlled container and stored at 4 °C until analysis. Upon arrival, samples were filtered through 0.45 µm membrane filters to remove suspended particles. The pH was adjusted to 2.0 using hydrochloric acid to maintain IBU and DIC in their non-ionized forms, thereby enhancing retention during SPE.
2.3. Instrumentation
Analyses were performed using an Agilent 7100 capillary electrophoresis system (Agilent Technologies, Waldbronn, Germany) equipped with a diode array detector (DAD; G1315C/D) and a multiple wavelength detector (G1365C/D), controlled by Agilent ChemStation software (version B.04.03, Agilent Technologies, Waldbronn, Germany). Separations were carried out using an uncoated fused-silica capillary (50 µm i.d., 60 cm total length, 50 cm effective length) from Polymicro Technologies (Phoenix, AZ, USA). A pH meter from Mettler-Toledo (Greifensee, Switzerland) was used for pH measurements.
2.4. Capillary Electrophoresis Conditions
Separations were conducted using an uncoated fused-silica capillary (50 µm i.d., 60 cm total length, 50 cm effective length). Prior to first use, the capillary was conditioned with 1.0 M NaOH (30 min), water (15 min), and BGE (15 min). Between runs, it was rinsed sequentially with 0.1 M NaOH (2 min), water (2 min), and BGE (3 min). The capillary temperature was maintained at 25 °C, and a voltage of +25 kV was applied. Detection was performed at 214 nm. Hydrodynamic injection was carried out at 50 mbar for 10 s (conventional CE) and up to 60 s for FASS experiments.
2.5. Solid-Phase Extraction Procedure
SPE was performed using Oasis HLB cartridges (200 mg, 6 mL) (Waters Corporation, Milford, MA, USA) suitable for both neutral and acidic compounds. Cartridges were conditioned with 5 mL of methanol, followed by 5 mL of ultrapure water. Filtered wastewater samples (500 mL), adjusted to pH 2.0, were loaded onto the cartridges at approximately 5 mL min−1 under vacuum. The cartridges were washed with 5 mL ultrapure water and dried under vacuum for 10 min. Analytes were eluted with 5 mL of methanol at a low flow rate. Eluates were evaporated to dryness under a gentle nitrogen stream at 40 °C and reconstituted in 1.0 mL of ultrapure water. Samples were vortex-mixed for 30 s and filtered through 0.22 µm PTFE filters prior to analysis.
2.6. Procedure for Field-Amplified Sample Stacking (FASS)
Samples and standards were prepared in ultrapure water to ensure low conductivity relative to the BGE. After SPE, extracts were reconstituted in ultrapure water to maintain this conductivity difference. Hydrodynamic injection was performed at 50 mbar for 60 s, followed by immediate voltage application. Under these conditions, analytes migrated rapidly in the low-conductivity zone and were concentrated at the interface with the higher-conductivity BGE, resulting in effective stacking.
2.7. Validation of the Method
The SPE–CE–FASS method was validated according to internationally accepted guidelines [21]. Validation parameters included linearity, limits of detection (LOD) and quantification (LOQ), precision, accuracy, recovery, matrix effects, robustness, and ruggedness. NAP was used as the internal standard.
2.7.1. Internal Standard
NAP was selected due to its suitable electrophoretic mobility, chemical stability, and efficient retention during SPE. It was added at 200 ng L−1 to all samples prior to extraction. Quantification was based on analyte-to-IS peak area ratios.
2.7.2. Linearity
Linearity was evaluated using solvent-based and matrix-matched calibration curves over the range of 10–1000 ng L−1. Matrix-matched standards were prepared by spiking blank wastewater samples prior to SPE. The analyte/internal standard peak area ratios were plotted against the nominal analyte concentrations to plot calibration curves, which were based on triple analyses of each concentration level.
2.7.3. Detection and Quantification Limits
LOD and LOQ were determined based on signal-to-noise ratios of 3 and 10, respectively. Values were calculated using both solvent-based and matrix-matched samples processed through the full SPE–CE–FASS procedure.
2.7.4. Precision
Precision was evaluated at three concentration levels (low, medium, high) in spiked wastewater samples. Intra-day precision was assessed using six replicates, while inter-day precision was determined over three consecutive days.
2.7.5. Accuracy and Recovery
Accuracy was evaluated through recovery experiments using spiked wastewater samples. NAP was added prior to extraction to account for analyte losses. Recoveries were calculated by comparing measured and nominal concentrations.
2.7.6. Evaluation of Matrix Effects
Matrix effects were assessed by comparing the slopes of solvent-based and matrix-matched calibration curves. Results are expressed as percentage ratios to evaluate signal suppression or enhancement.
2.7.7. Robustness
Robustness was evaluated by introducing small variations in BGE pH (±0.2), voltage (±1 kV), and SPE methanol elution volume (±0.5 mL). Each variation was analyzed utilizing spiked pharmaceutical wastewater samples at a moderate concentration level. The impact on migration time, peak area ratios, and resolution was assessed.
2.7.8. Ruggedness
Ruggedness was evaluated under typical laboratory variations, including different analysts, days, SPE cartridge batches, and BGE preparations. Pharmaceutical wastewater samples with a medium concentration level were analyzed under these specified conditions. The assessment of ruggedness was conducted by analyzing variations in analyte-to-internal-standard peak-area ratios, migration times, and calculated concentrations.
3. Results and Discussion
3.1. Optimization of CE-FASS
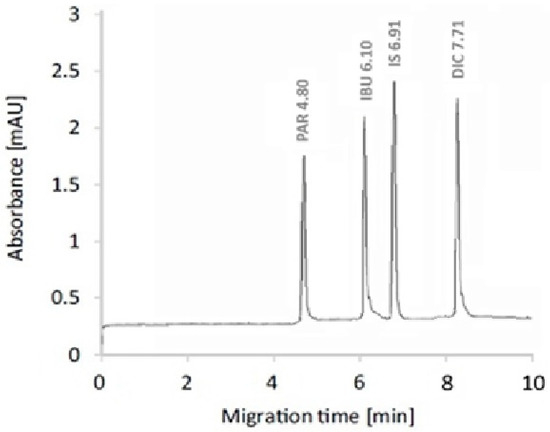
The separation of PAR, IBU, DIC, and the internal standard (NAP) was successfully accomplished utilizing a borate BGE at an alkaline pH. A 25 mM sodium borate buffer adjusted to pH 9.2 achieved an optimal balance among separation efficiency, analysis time, and peak symmetry (Figure 2). At this pH, IBU, DIC, and NAP were primarily found in their anionic forms, whereas PAR predominantly migrated as a neutral species, facilitating effective separation.
Figure 2.
Representative electropherogram obtained for equal concentrations (200 ng L−1) of the studied drugs and the IS analyzed using the proposed SPE–CE–FASS method. Peaks: (1) paracetamol (PAR, 4.80 min), (2) ibuprofen (IBU, 6.10 min), (3) naproxen (IS, 6.91 min), and (4) diclofenac (DIC, 7.71 min). Specifications for the separation process include an uncoated fused-silica capillary with an inner diameter of 50 µm, a total length of 60 cm, and an effective length of 50 cm, a background electrolyte of 25 mM sodium borate buffer with a pH of 9.2, an applied voltage of +25 kV, a temperature of 25 °C for the capillary, UV detection at 214 nm, and hydrodynamic injection at 50 mbar for 60 s.
Slight peak tailing was observed in the electropherogram. This can be attributed to the gradual relaxation of the stacked zones during migration, which can influence peak shape under high-sensitivity stacking conditions.
The application of a separation voltage of +25 kV achieved effective separation within a reasonable analysis timeframe while minimizing Joule heating. The diode array detection at 214 nm provided sufficient sensitivity for all analytes. Under the optimized conditions, a complete baseline separation of PAR, IBU, DIC, and NAP was successfully achieved.
3.2. Performance of Solid-Phase Extraction
Oasis HLB cartridges exhibited effective retention and purification of PAR, IBU, and DIC from pharmaceutical wastewater samples under acidic loading conditions (pH 2.0). The process of acidification facilitated the predominance of IBU and DIC in their non-ionized states, thus optimizing their retention on the sorbent. Despite PAR’s higher polarity, satisfactory retention was attained owing to the balanced hydrophilic and lipophilic characteristics of the HLB sorbent.
The SPE step was applied mainly for sample cleanup and analyte enrichment before electrophoretic analysis. Comparison with standard solutions indicated that SPE treatment did not significantly influence migration times or peak resolution, while it substantially improved signal intensity and signal-to-noise ratio due to analyte preconcentration.
The SPE procedure demonstrated its effectiveness through high and reproducible recoveries (Section 3.3.3) and minimal matrix effects (Section 3.3.4). The recoveries surpassed 85% for all analytes, and matrix effects remained below ±15%, confirming the suitability of Oasis HLB cartridges for the analysis of pharmaceutical wastewater.
3.3. Method Validation
3.3.1. Linearity
Exceptional linearity was achieved for all analytes utilizing both solvent-based and matrix-matched calibration methods across the concentration range of 10 to 1000 ng L−1. All solutions are processed through the entire SPE–CE–FASS procedure. Calibration curves were developed utilizing the ratios of analyte to internal standard peak areas (Table 1). Minor variations in slope were noted between solvent-based and matrix-matched calibration curves, underscoring the impact of the wastewater matrix and justifying the application of matrix-matched calibration for quantitative analysis.
Table 1.
Linearity data for PAR, IBU, and DIC using solvent-based and matrix-matched calibration.
3.3.2. Limits of Detection and Quantification
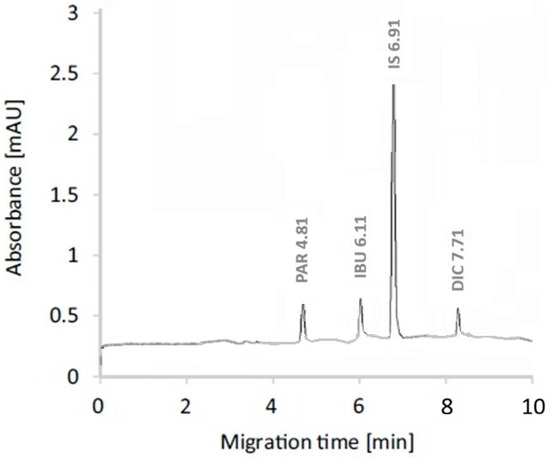
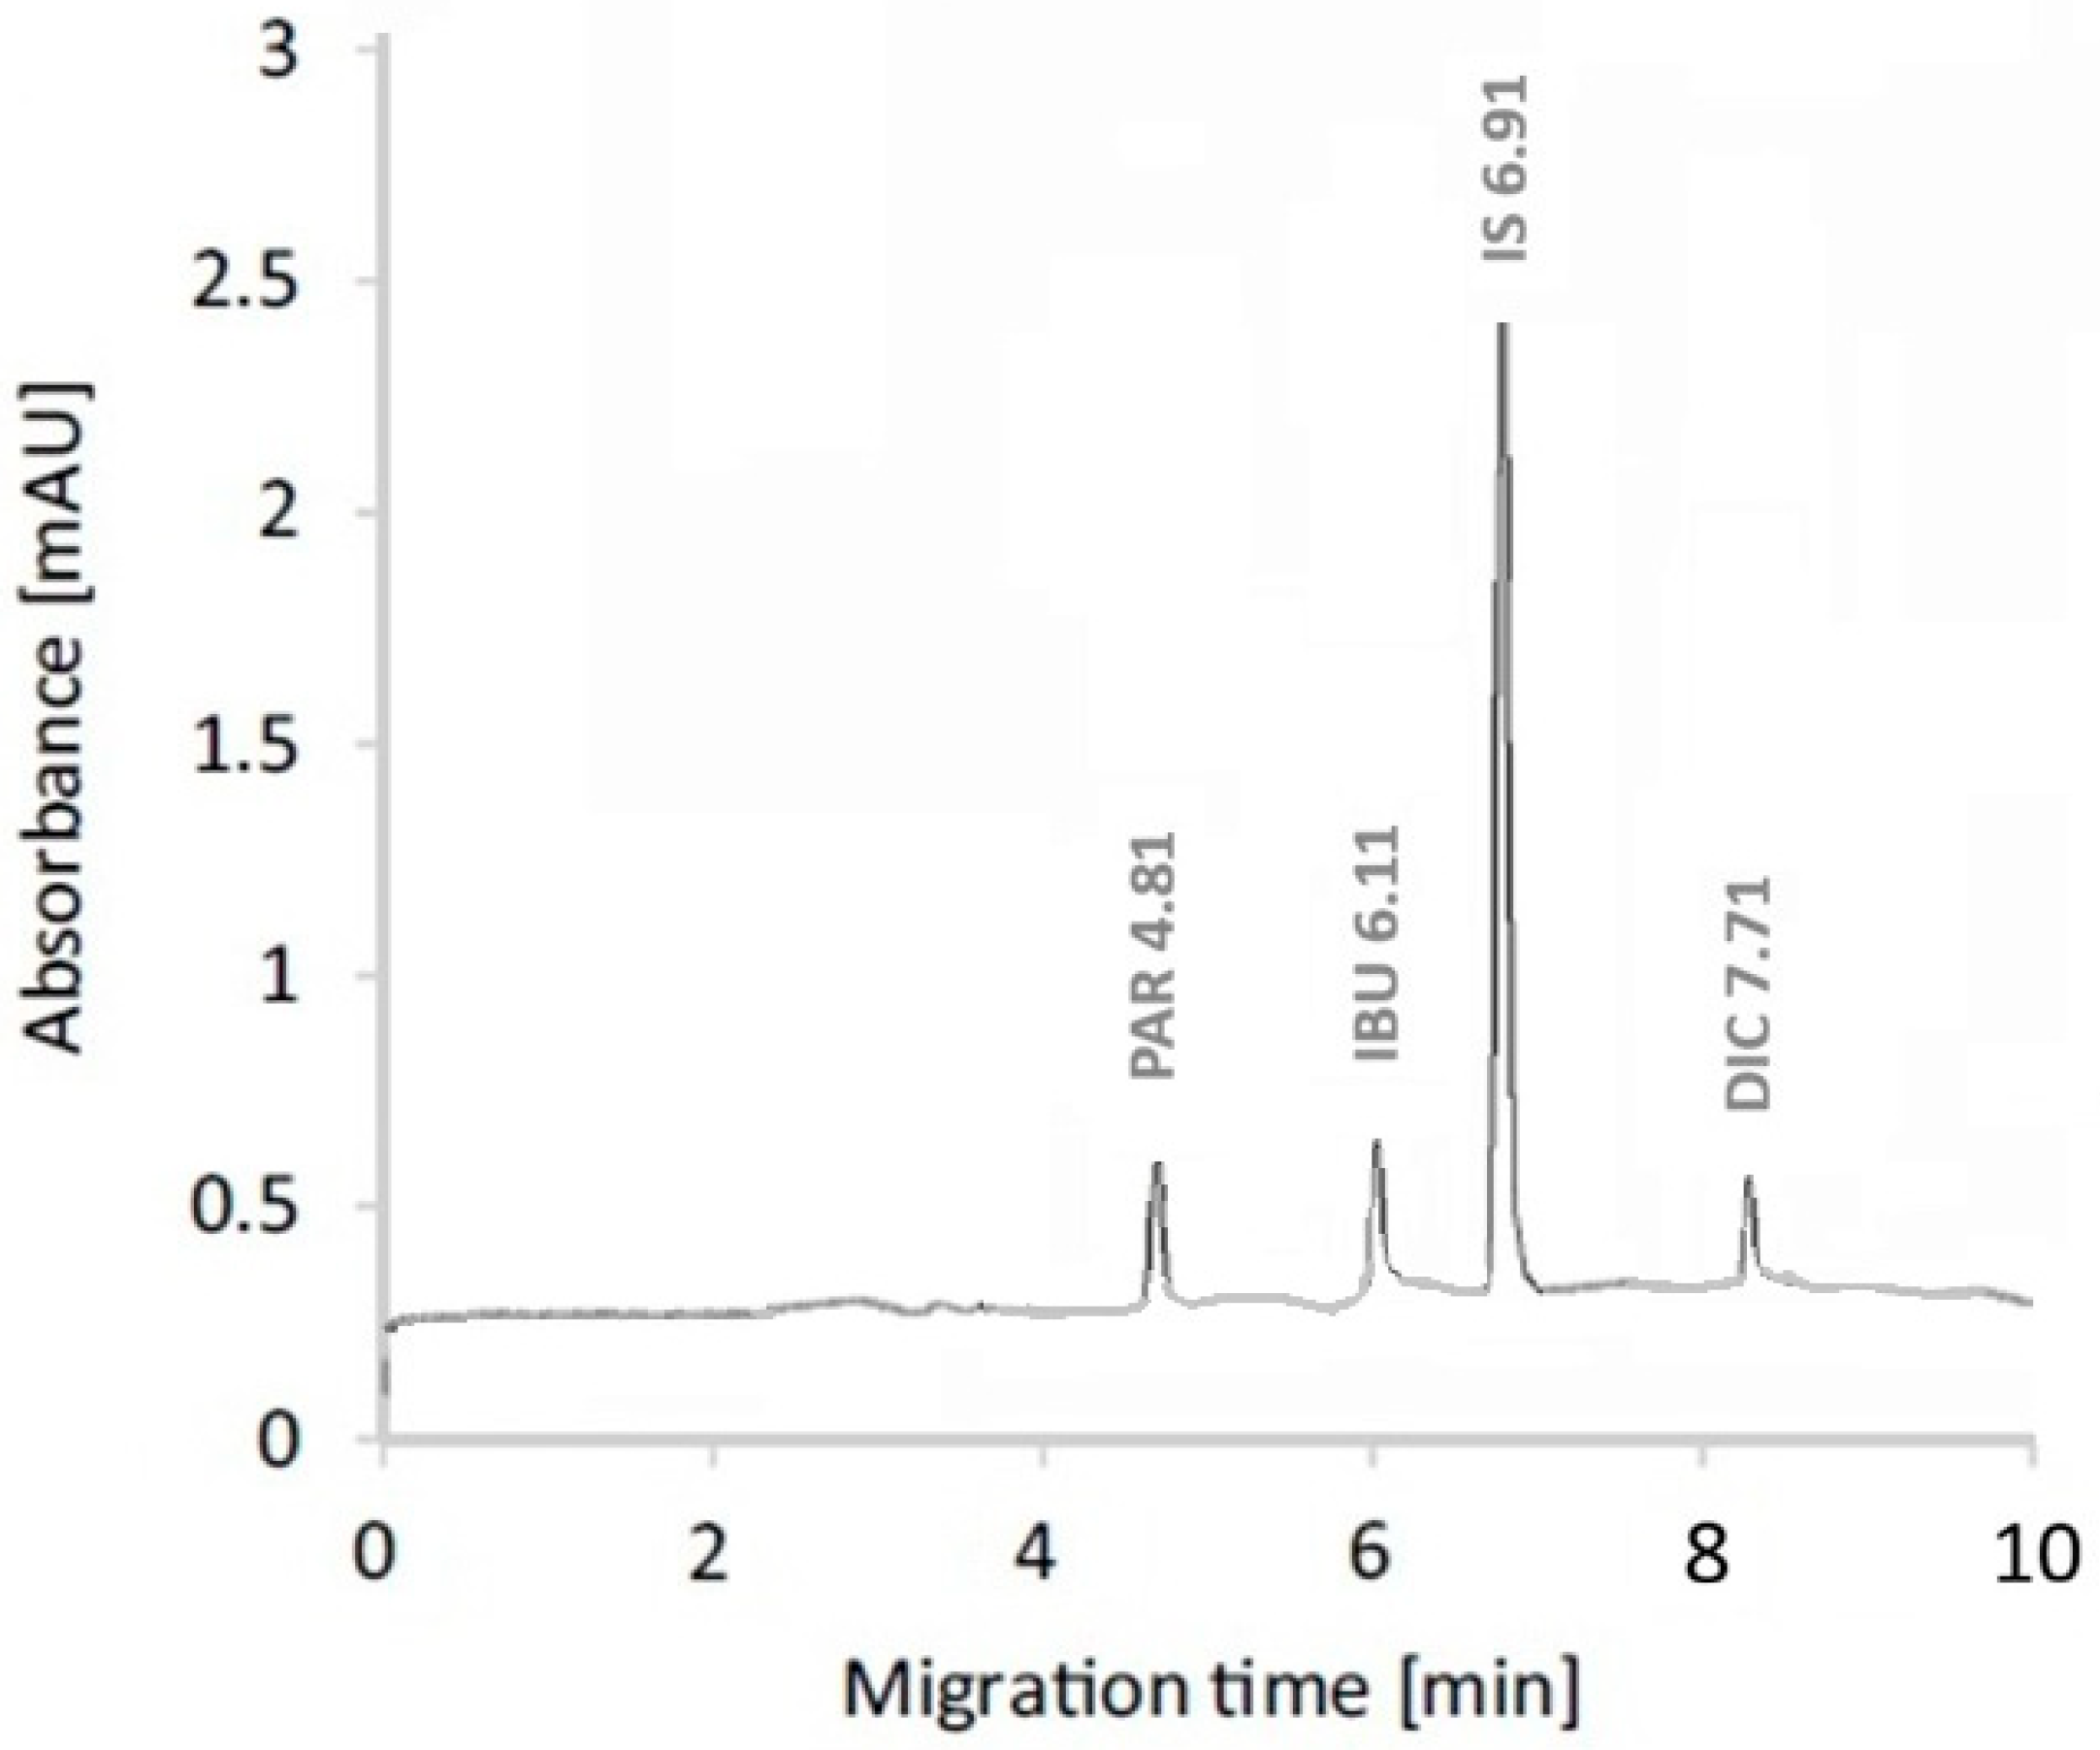
The obtained limits of detection (LOD) and limits of quantification (LOQ) are compatible with the concentration levels typically reported for these pharmaceuticals in environmental waters, where the studied drugs are commonly detected at trace levels ranging from ng L−1 to low µg L−1, depending on environmental conditions and wastewater treatment efficiency. The satisfactory sensitivity achieved in this study can be attributed to the combined effect of solid-phase extraction (SPE) preconcentration and field-amplified sample stacking (FASS). The SPE step enables enrichment of the target analytes and removal of potential matrix interferences, while FASS provides additional online concentration of the analytes during electrophoretic injection. The synergistic action of these two preconcentration strategies significantly enhances signal intensity and improves the signal-to-noise ratio. Consequently, even at concentration levels close to the LOD and LOQ, the analyte peaks remain clearly distinguishable from the baseline, confirming the suitability of the proposed method for the determination of these pharmaceuticals at environmentally relevant trace concentrations (Figure 3 and Figure 4).
Figure 3.
Representative electropherogram obtained for the LOQ of the studied drugs and the IS in the matrix. Specifications for the separation process include an uncoated fused-silica capillary with an inner diameter of 50 µm, a total length of 60 cm, and an effective length of 50 cm, a background electrolyte of 25 mM sodium borate buffer with a pH of 9.2, an applied voltage of +25 kV, a temperature of 25 °C for the capillary, UV detection at 214 nm, and hydrodynamic injection at 50 mbar for 60 s.
Figure 4.
Representative electropherogram obtained for the LOD of the studied drugs and the IS in the matrix. Specifications for the separation process include an uncoated fused-silica capillary with an inner diameter of 50 µm, a total length of 60 cm, and an effective length of 50 cm, a background electrolyte of 25 mM sodium borate buffer with a pH of 9.2, an applied voltage of +25 kV, a temperature of 25 °C for the capillary, UV detection at 214 nm, and hydrodynamic injection at 50 mbar for 60 s.
For method comparison, matrix-based LOD values were taken into account, as they more accurately represent analytical performance in actual pharmaceutical wastewater samples (Table 2).
Table 2.
LOD and LOQ values in solvent and matrix (ng L−1).
3.3.3. Precision, Accuracy, and Recovery
The method demonstrated strong repeatability and intermediate precision across all analytes. The intra-day and inter-day RSD values were recorded at below 4% and 5%, respectively (Table 3). The recovery studies indicated a high level of accuracy at all tested concentration levels, validating the efficacy of SPE and affirming the appropriateness of NAP as an internal standard.
Table 3.
Precision and recovery results for spiked wastewater samples.
3.3.4. Influence of the Matrix
The evaluation of matrix effects was conducted quantitatively by comparing the slopes of calibration curves that were matrix-matched with those based on solvent, and the results are presented as percentage ratios (Table 4). Slight signal suppression was noted for all analyzed compounds, with matrix-effect values recorded at 89.5 ± 2.1% for PAR, 91.7 ± 1.8% for IBU, and 92.9 ± 2.4% for DIC. The low standard deviation values (<3%) demonstrate excellent reproducibility of the calibration slopes and affirm the reliability of the SPE–CE–FASS procedure. Despite the modest nature of matrix-induced suppression, the implementation of matrix-matched calibration alongside NAP as an internal standard was utilized to guarantee precise and dependable quantification in actual pharmaceutical wastewater samples.
Table 4.
Matrix effects (%) for paracetamol (PAR), ibuprofen (IBU), and diclofenac (DIC), assessed through a comparison of matrix-matched and solvent-based calibration slopes (n = 3).
3.3.5. Robustness and Ruggedness
The robustness of the proposed SPE–CE–FASS method was assessed by introducing minor, intentional variations in key experimental parameters, including background electrolyte pH, separation voltage, and SPE elution volume. Table 5 summarizes that these variations did not lead to significant changes in migration times, analyte-to-internal-standard peak-area ratios, or separation resolution, with relative standard deviation (RSD) values consistently remaining below 5% for all analytes.
Table 5.
Robustness and ruggedness evaluation of the SPE–CE–FASS method (n = 3).
The method’s ruggedness was evaluated under standard laboratory variations, including the involvement of different analytes and various batches of SPE cartridges. The results obtained showed strong reproducibility, with RSD values under 6%, thereby confirming the reliability and appropriateness of the proposed method for the routine analysis of pharmaceutical wastewater samples.
3.4. Application to Actual Wastewater Samples
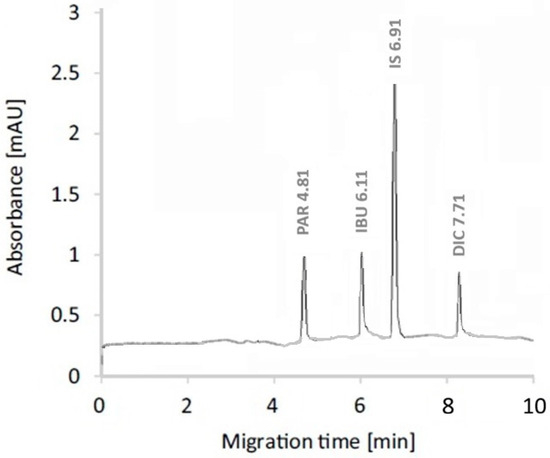
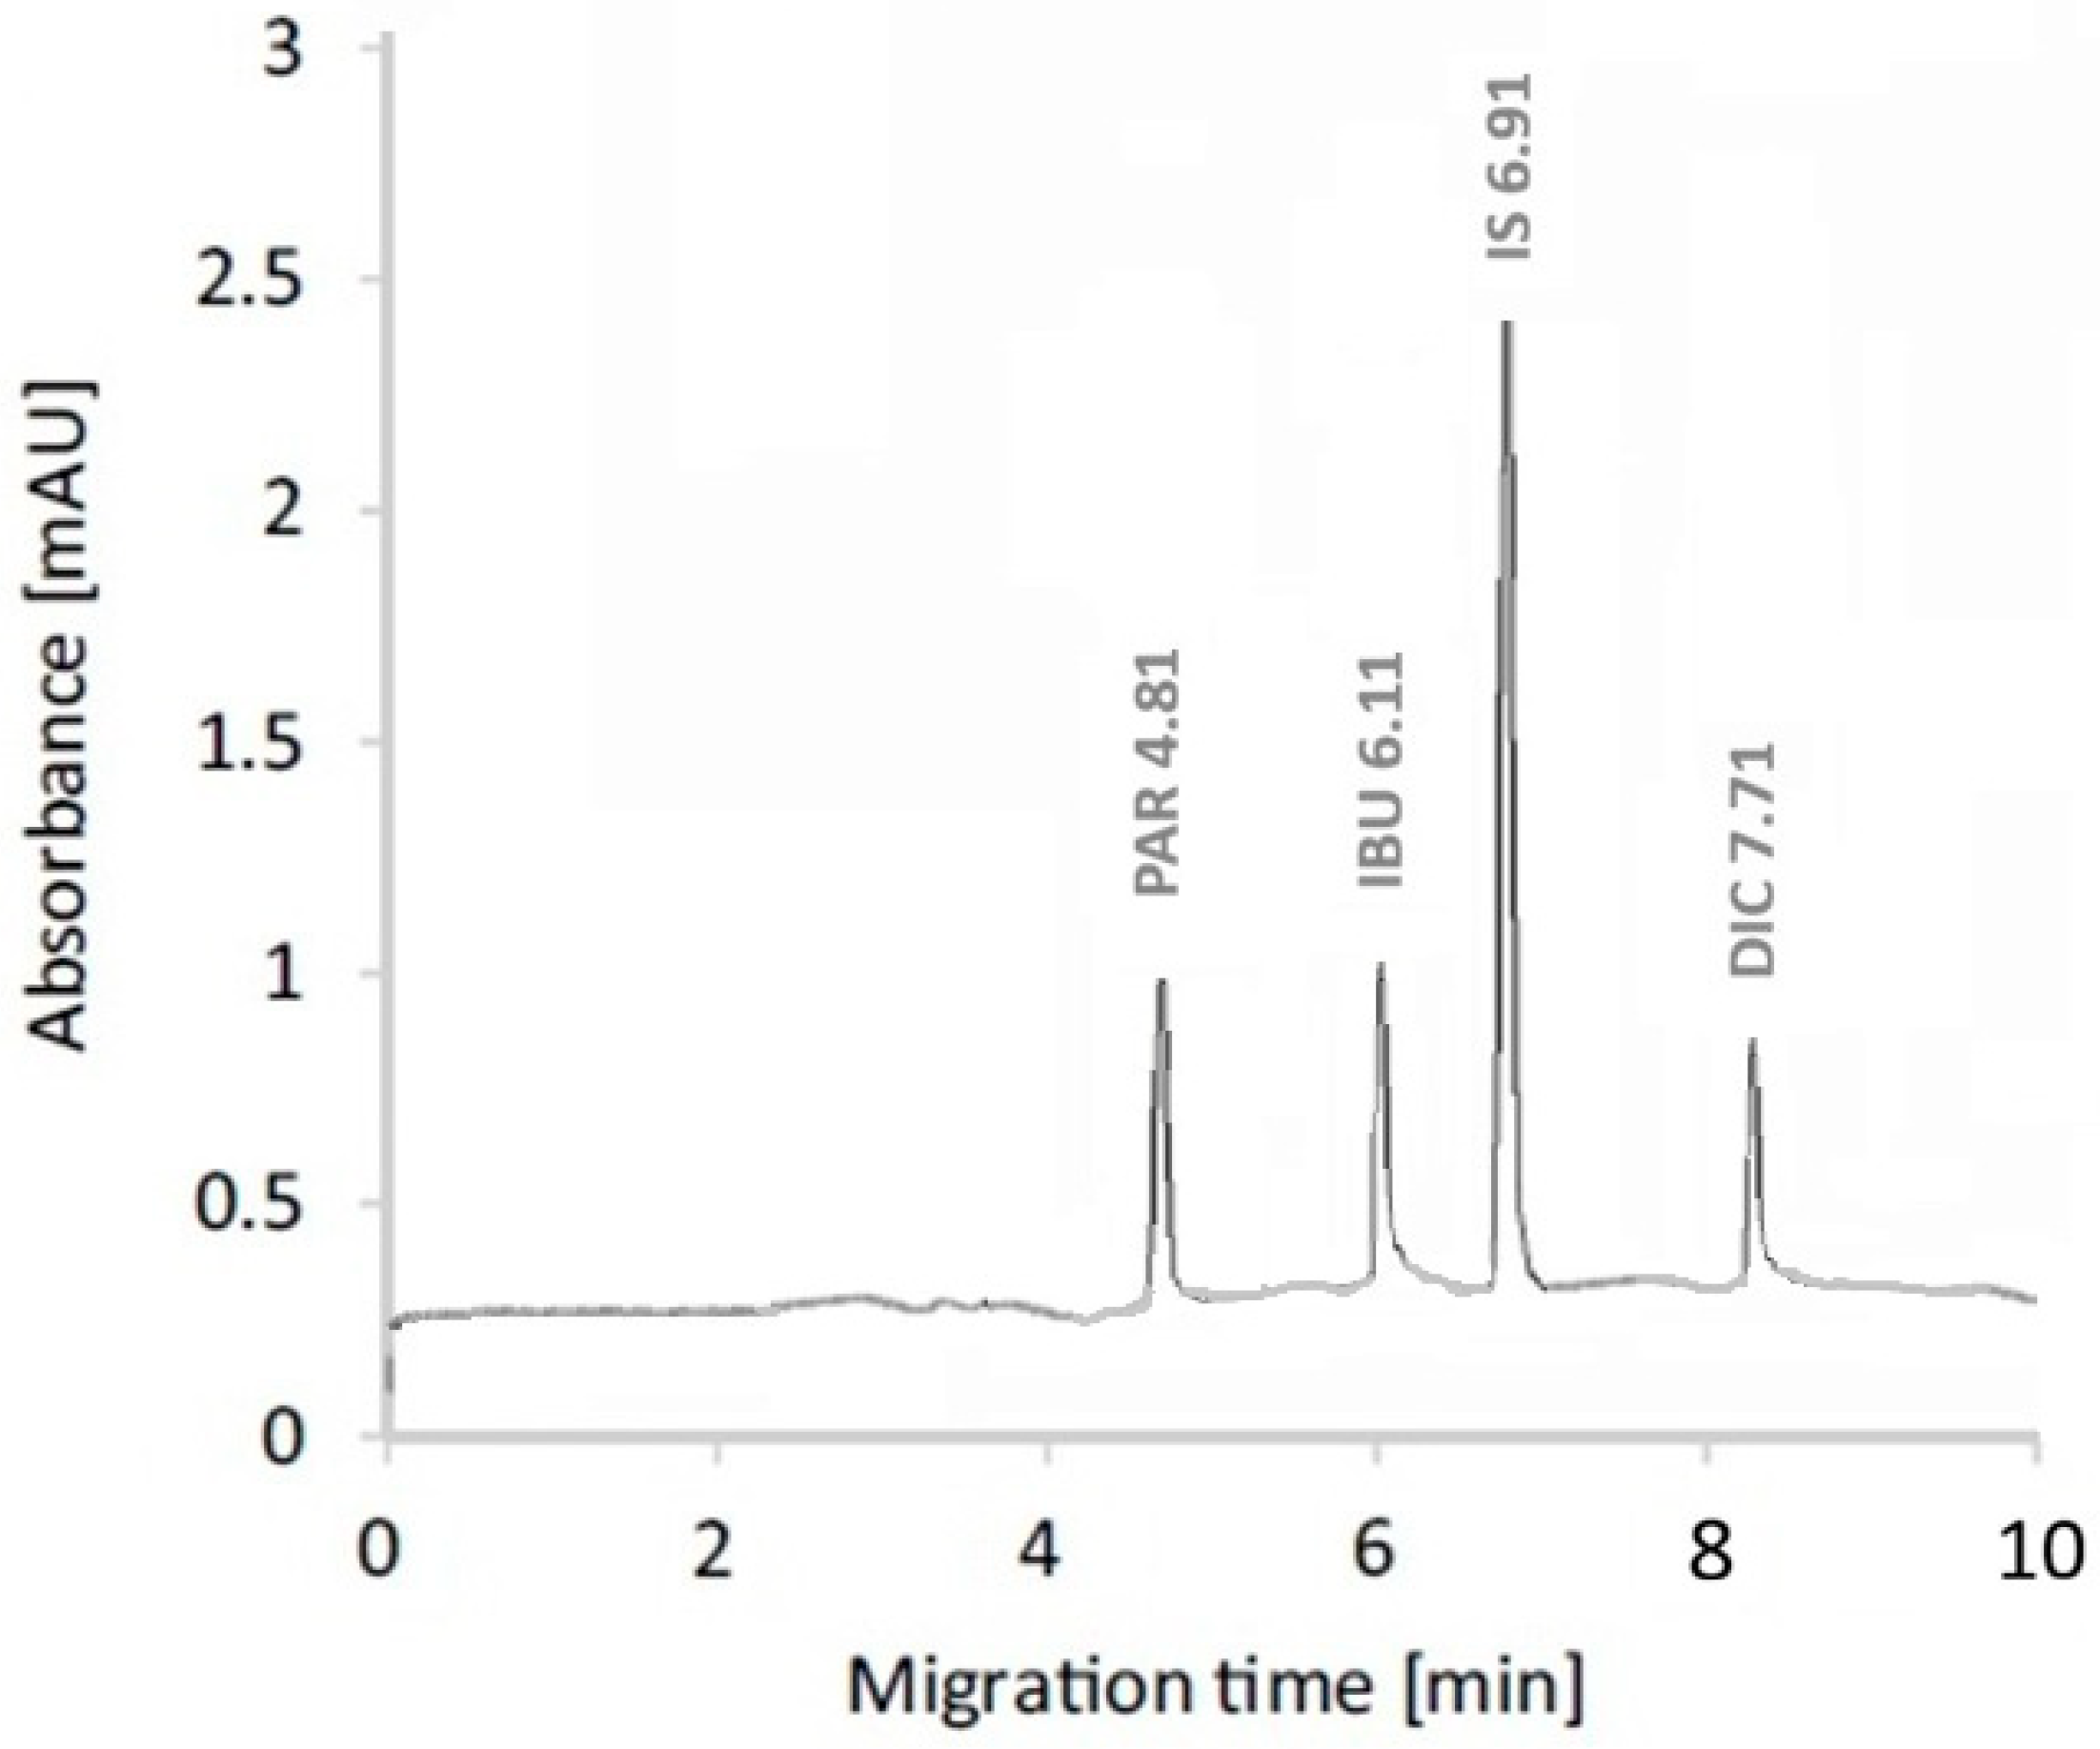
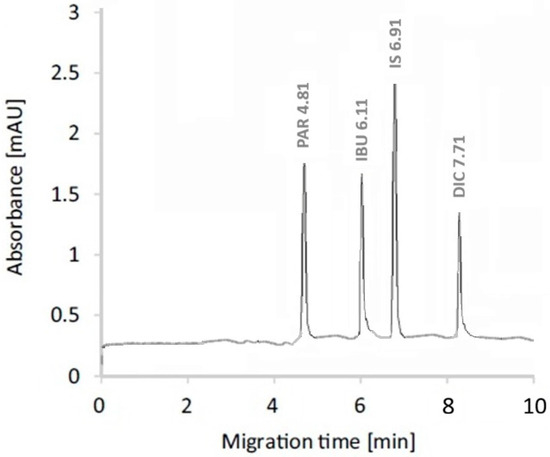
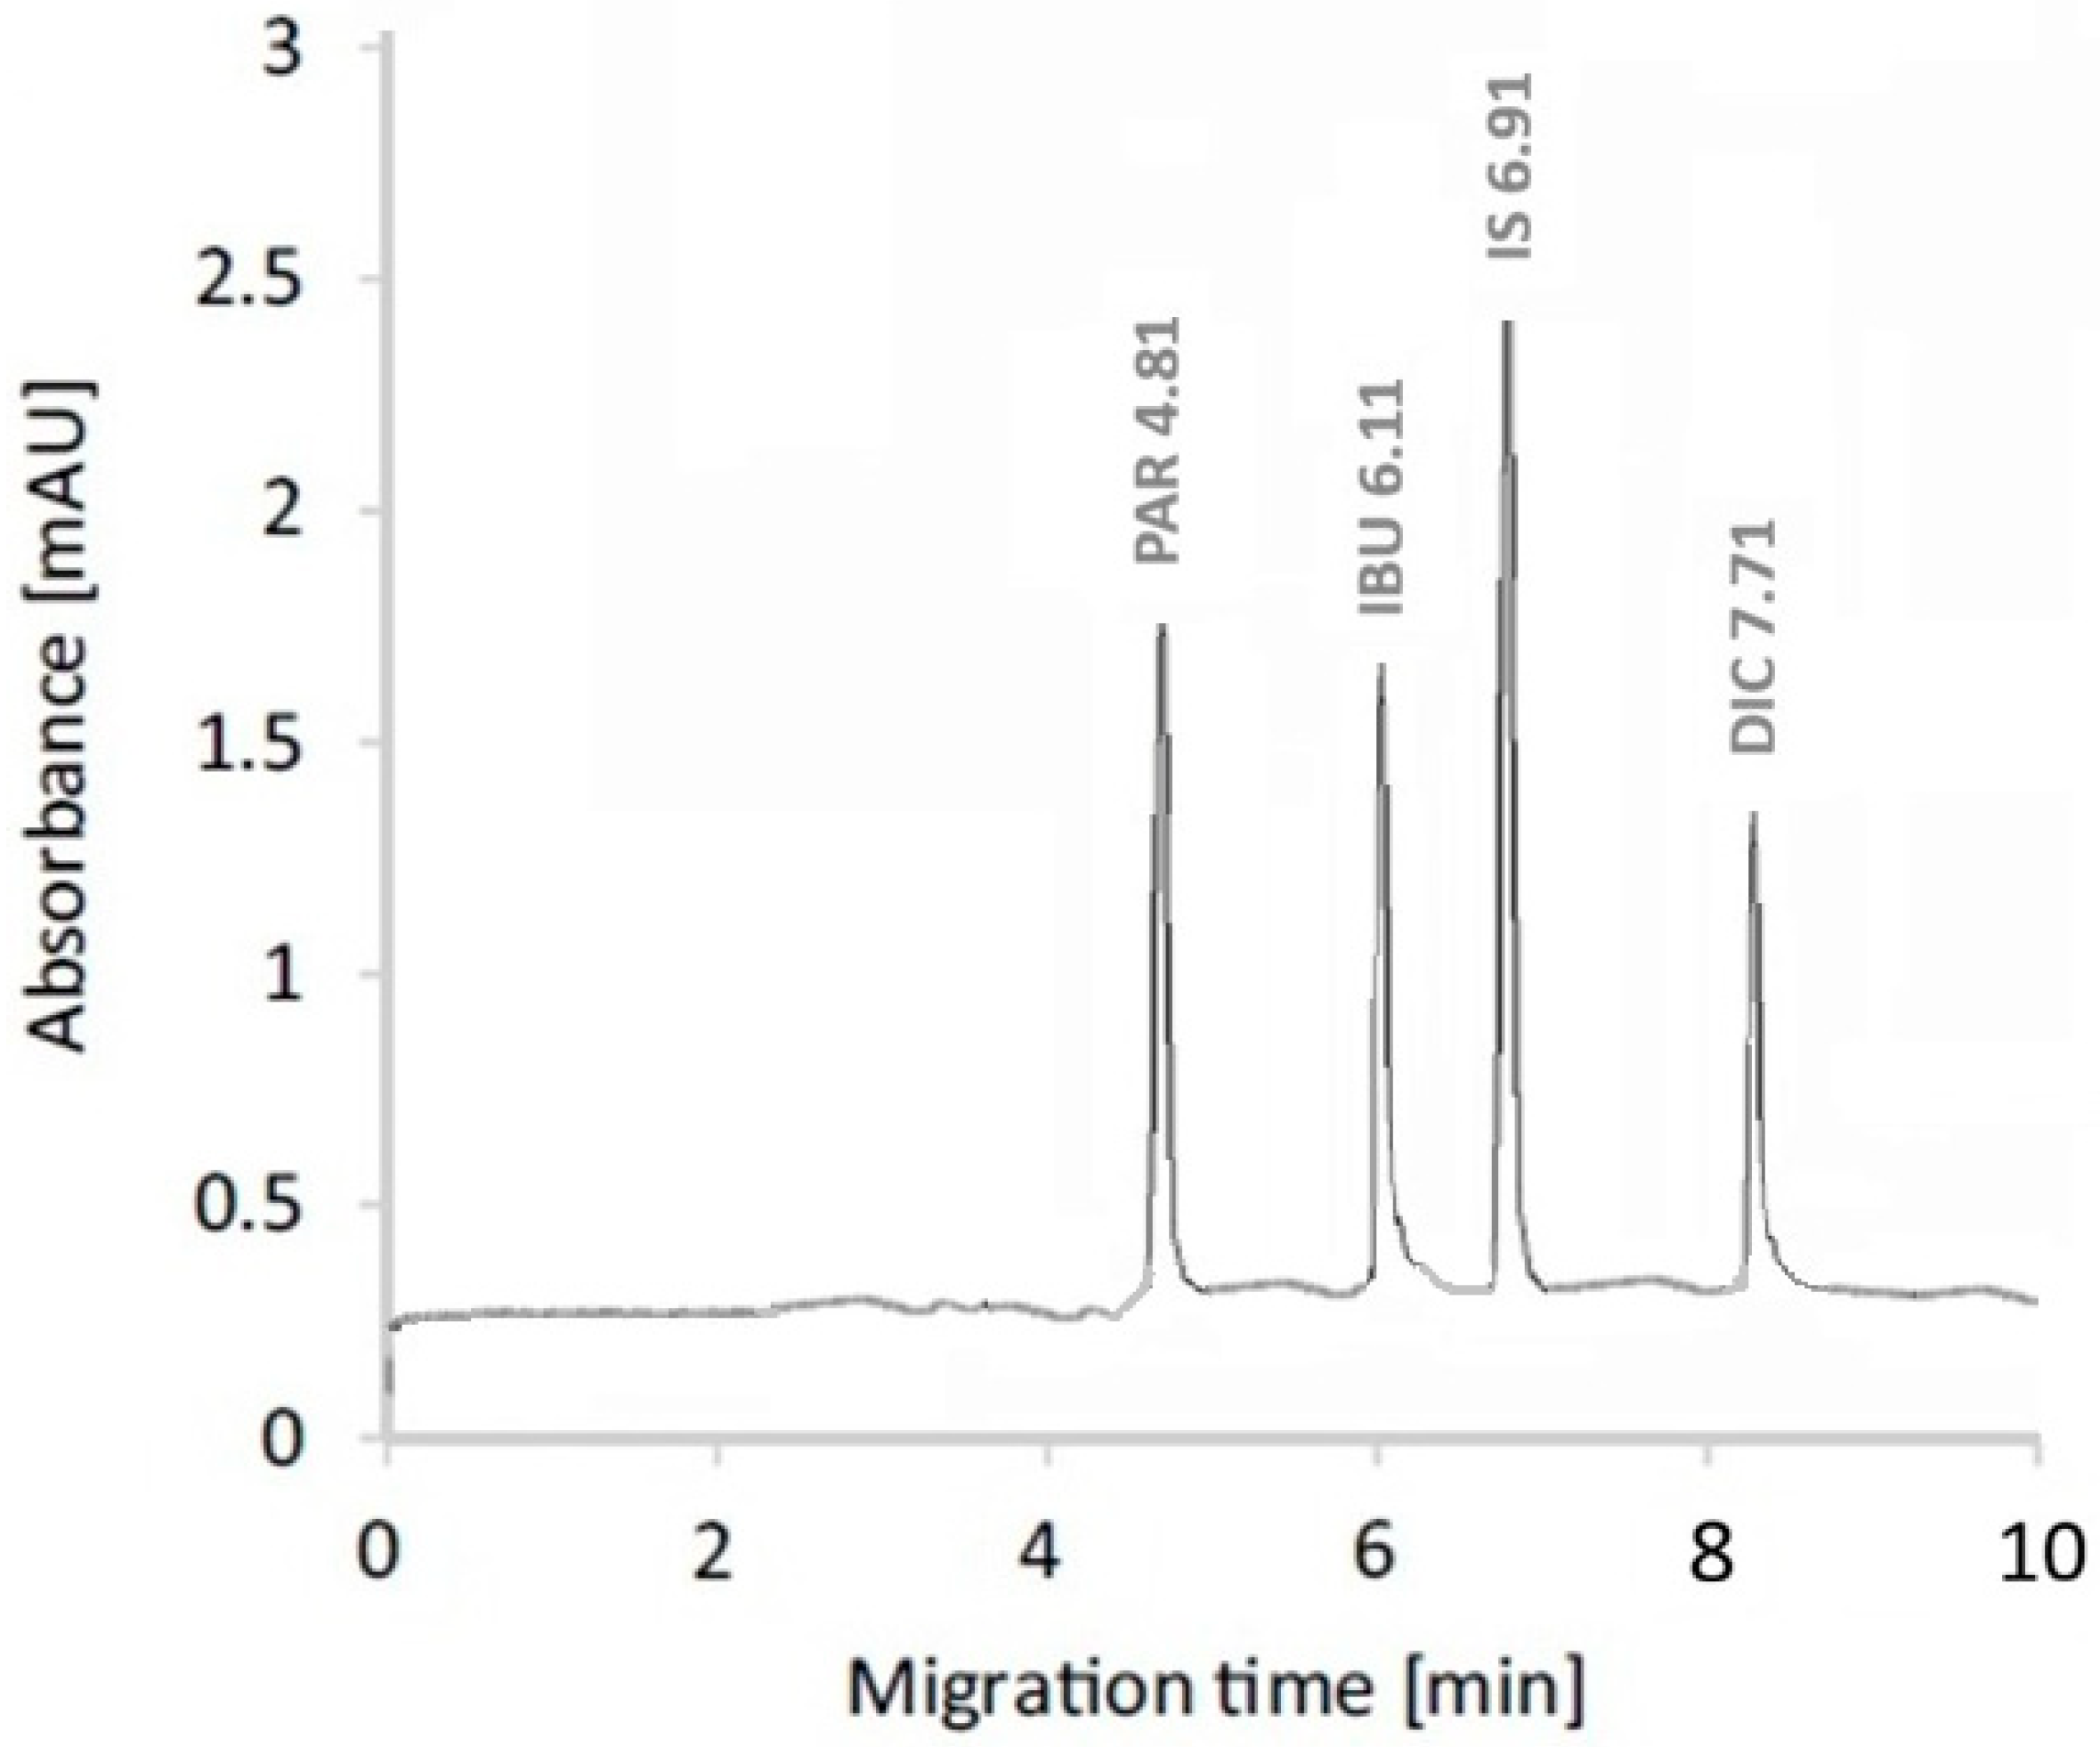
The validated SPE–CE–FASS method was effectively applied to the determination of the studied pharmaceuticals in real pharmaceutical wastewater samples collected from Al-Kharj Governorate (Figure 5).
Figure 5.
Representative electropherogram obtained for a real pharmaceutical wastewater sample analyzed using the proposed SPE–CE–FASS method after SPE preconcentration. Detected concentrations: PAR (189 ng L−1), IBU (151 ng L−1), and DIC (117 ng L−1). Peaks: (1) paracetamol (PAR, 4.81 min), (2) ibuprofen (IBU, 6.11 min), (3) naproxen (IS, 6.91 min), and (4) diclofenac (DIC, 7.71 min).
All target analytes were consistently detected in the analyzed samples at ng L−1 concentration levels, confirming their widespread occurrence in pharmaceutical effluents. Quantification was performed using matrix-matched calibration with NAP as an internal standard to compensate for matrix effects.
As summarized in Table 6, paracetamol (PAR) was detected at the highest concentrations (189–205 ng L−1), followed by ibuprofen (IBU) (142–151 ng L−1) and diclofenac (DIC) (108–117 ng L−1). The relatively higher concentration of PAR can be attributed to its extensive consumption and high discharge rates, while the presence of IBU and DIC reflects their widespread use and persistence in wastewater systems.
Table 6.
Concentrations of paracetamol (PAR), ibuprofen (IBU), and diclofenac (DIC) in actual pharmaceutical wastewater samples (mean ± SD, n = 3).
These concentration levels are consistent with previously reported values for pharmaceutical wastewater and effluent samples, where NSAIDs are commonly detected in the ng L−1 to low µg L−1 range. The continuous detection of these compounds highlights their incomplete removal during wastewater treatment processes and their potential to enter receiving water bodies.
From an environmental perspective, the presence of DIC at detectable levels is of particular concern due to its well-documented ecotoxicological effects, even at low concentrations. Similarly, the frequent occurrence of IBU and PAR may contribute to chronic exposure scenarios in aquatic environments, potentially affecting aquatic organisms and ecosystem health.
The low standard deviation values (≤7 ng L−1) demonstrate the reliability and reproducibility of the proposed method in complex wastewater matrices. Overall, the obtained results confirm that the developed SPE–CE–FASS method is not only analytically robust but also suitable for routine environmental monitoring and assessment of pharmaceutical contamination in wastewater systems.
3.5. Comparative Analysis with Documented LC–MS/MS Methods
LC–MS/MS is recognized as the standard method for determining pharmaceutical residues in environmental waters, owing to its outstanding sensitivity and selectivity. Nonetheless, LC–MS/MS instrumentation entails significant costs, necessitates proficient operation, and generally involves considerable solvent usage. The proposed SPE–CE–FASS method, as detailed in Table 7, demonstrates detection limits in the low ng L−1 range, comparable to those observed in various LC–MS/MS methods utilized for wastewater matrices. While LC–MS/MS typically provides lower absolute limits of detection, the SPE–CE–FASS method presents notable benefits, including operational simplicity, decreased use of organic solvents, reduced analysis costs, and enhanced environmental sustainability. The current method facilitates accurate quantification of paracetamol, ibuprofen, and diclofenac at environmentally relevant concentrations in complex pharmaceutical wastewater. This demonstrates that SPE–CE–FASS serves as a practical and cost-effective alternative for routine monitoring in situations where access to advanced mass spectrometric instrumentation is restricted.
Table 7.
Comparison of the proposed SPE–CE–FASS method with reported LC–MS/MS methods for the determination of PAR, IBU, and DIC.
The proposed SPE–CE–FASS method not only excels in analytical performance but also offers significant benefits from a green chemistry standpoint, all while maintaining high sensitivity in complex wastewater matrices. The method facilitated matrix-based limits of detection of 4.0 ng L−1 for PAR, 3.5 ng L−1 for IBU, and 3.0 ng L−1 for DIC, values that align with those documented for various LC–MS/MS methods. Capillary electrophoresis necessitates minimal volumes of aqueous background electrolyte and eliminates the need for the continuous use of organic mobile phases commonly associated with liquid chromatographic separations. In this study, the use of organic solvents was restricted to 5 mL of methanol per sample during the solid-phase extraction elution step, while analyte separation was conducted solely in an aqueous borate buffer. Additionally, sensitivity enhancement was accomplished via field-amplified sample stacking, all while maintaining low solvent consumption, sample volume, and analysis time. The integration of minimal organic solvent usage, decreased waste production, and moderate energy demands linked to CE instrumentation highlights the environmental sustainability of the proposed SPE–CE–FASS method, positioning it as a cost-effective and eco-friendly option for the routine monitoring of pharmaceutical residues in wastewater matrices.
In addition to analytical performance, the proposed method provides a practical tool for environmental surveillance, particularly in regions where access to advanced mass spectrometric instrumentation is limited. The ability to reliably quantify pharmaceuticals at environmentally relevant concentrations using a cost-effective and low-solvent approach supports its application in long-term monitoring programs and pollution assessment studies. This is especially important for tracking temporal variations in pharmaceutical discharge and evaluating the efficiency of wastewater treatment processes.
4. Conclusions
A sensitive and environmentally sustainable SPE–CE–FASS method was successfully developed and validated for the determination of paracetamol, ibuprofen, and diclofenac in pharmaceutical wastewater. The combination of Oasis HLB solid-phase extraction with field-amplified sample stacking effectively overcame the inherent sensitivity limitations of capillary electrophoresis, enabling reliable detection of the target analytes at low ng L−1 levels.
The method demonstrated excellent linearity, good precision, satisfactory recovery, and minimal matrix effects, confirming its suitability for complex wastewater matrices. The use of matrix-matched calibration and matrix-based detection limits provided a realistic assessment of analytical performance in real samples.
Compared with conventional LC–MS/MS methods, the proposed approach offers comparable sensitivity while providing important advantages, including simpler instrumentation, reduced solvent consumption, lower operational cost, and improved environmental sustainability.
Application of the method to real wastewater samples from Al-Kharj Governorate confirmed its effectiveness for detecting pharmaceutical residues at environmentally relevant concentrations. Overall, the proposed SPE–CE–FASS method represents a reliable, cost-effective, and eco-friendly alternative for routine monitoring of pharmaceutical contaminants, particularly in laboratories with limited access to advanced mass spectrometric instrumentation.
Author Contributions
Conceptualization, S.A.A.-G. and A.B.A.; Data Curation, S.A.A.-G. and A.B.A.; Formal Analysis, S.A.A.-G.; Investigation, S.A.A.-G. and A.B.A.; Methodology, S.A.A.-G.; Resources, S.A.A.-G. and A.B.A.; Software, S.A.A.-G. and A.B.A.; Supervision, S.A.A.-G.; Validation, S.A.A.-G.; Visualization, S.A.A.-G.; Writing—Original Draft, S.A.A.-G.; Writing—Review and Editing, S.A.A.-G. and A.B.A. All authors have read and agreed to the published version of the manuscript.
Funding
The authors extend their appreciation to Prince Sattam bin Abdulaziz University for funding this research work through the project number (PSAU/2025/03/35732).
Institutional Review Board Statement
Not applicable.
Informed Consent Statement
Not applicable.
Data Availability Statement
The datasets used and/or analyzed during the current study are available upon reasonable request from the corresponding author.
Conflicts of Interest
The authors declare that they have no competing interests in this manuscript.
References
- Holland, G.J.; Schwartz, L.T.; Tan, C.M.; Hassan, A.E. Occurrence of 97 Pharmaceuticals in Wastewater and Receiving Waters: Analytical Validation and Treatment Influence. Sci. Total Environ. 2008, 397, 122–133. [Google Scholar]
- Ayoub, S.S. Paracetamol (acetaminophen): A familiar drug with an unexplained mechanism of action. Temperature 2021, 8, 351–371. [Google Scholar] [CrossRef] [Scilit]
- Khalil, N.A.; Ahmed, E.M.; Tharwat, T.; Mahmoud, Z. NSAIDs between past and present: A long journey towards an ideal COX-2 inhibitor lead. RSC Adv. 2024, 14, 30647–30661. [Google Scholar] [CrossRef] [Scilit]
- Li, X.; Zhang, Y.; Wang, J.; Chen, L. Non-steroidal anti-inflammatory drugs (NSAIDs) in the environment: Occurrence, fate, hazards and removal technologies. Sci. Total Environ. 2023, 904, 166897. [Google Scholar]
- Mheidli, N.; Malli, A.; Mansour, F.; Al-Hindi, M. Occurrence and Risk Assessment of Pharmaceuticals in Surface Waters of the Middle East and North Africa: Ecotoxicological and Human Health Implications. Sci. Total Environ. 2022, 851, 158302. [Google Scholar] [CrossRef] [Scilit] [PubMed]
- Wahba, I.A.; Hassan, S.A.; Fayed, A.S.; El-Desoky, G.E.; El-Sayed, G.O.; El-Shahawi, M.S. Impurity Profiling of Paracetamol Toxic Impurities in Pharmaceutical Combination with Ibuprofen and Chlorzoxazone Using HPLC and TLC Densitometric Methods. BMC Chem. 2025, 19, 110. [Google Scholar] [CrossRef] [Scilit] [PubMed]
- AlNahwa, L.H.M.; Ali, H.M.; Hasanin, T.H.A.; Shalaby, K.; Alshammari, M.S.; Alsirhani, A.M.; Mohamed, S.H. Development of an RP-HPLC Method for Quantifying Diclofenac Diethylamine, Methyl Salicylate, and Capsaicin in Pharmaceutical Formulation and Skin Samples. Molecules 2024, 29, 2732. [Google Scholar] [CrossRef] [Scilit]
- Palled, P.J.; Reddy, V.D.; Mannor, V.S.; Chowdary, B. Validated Isocratic/Gradient RP-HPLC for Simultaneous Estimation of Paracetamol, Ibuprofen, and Caffeine in Marketed Formulations Using Diclofenac as Internal Standard. Anal. Chem. Ind. J. 2017, 17, 116. [Google Scholar]
- Siddiqui, F.A.; Arayne, M.S.; Sultana, N.; Qureshi, F. Development and Validation of Stability-Indicating HPLC Method for the Simultaneous Determination of Paracetamol, Tizanidine, and Diclofenac in Pharmaceuticals and Human Serum. J. AOAC Int. 2011, 94, 150–158. [Google Scholar] [CrossRef] [Scilit]
- Anwar, A.A.; Mohamed, M.A.; Farghali, A.A.; Mahmoud, R.; Hassouna, M.E.M. Green UPLC method for estimation of ciprofloxacin, diclofenac sodium, and ibuprofen with application to pharmacokinetic study of human plasma. Sci. Rep. 2023, 13, 17613. [Google Scholar] [CrossRef] [Scilit]
- Helmy, S.A.; ElBedaiwy, H.M.; Helmy, S.A.M.; Alamri, R.A.; Alhusayni, R.M.; Almashhadi, I.A.; Alharbi, A.S.; Alharbi, S.A.; Ahmed-Anwar, A.A.; Mohamed, A.M. Green HPLC method for determination of paracetamol and ibuprofen in human plasma: Applications to pharmacokinetics. Bioanalysis 2024, 16, 1249–1260. [Google Scholar] [CrossRef] [Scilit]
- Lou, H.-G.; Yuan, H.; Ruan, Z.-R.; Jiang, B. Simultaneous determination of paracetamol, pseudoephedrine, dextrophan and chlorpheniramine in human plasma by liquid chromatography–tandem mass spectrometry. J. Chromatogr. B 2010, 878, 682–688. [Google Scholar] [CrossRef] [Scilit]
- Choi, S.; Shim, W.-S.; Yoon, J.; Choi, D.; Lee, J.; Paik, S.-H.; Chung, E.-K.; Lee, K.-T. A validated chiral LC–MS/MS method for the enantioselective determination of (S)-(+)- and (R)-(−)-ibuprofen in dog plasma: Its application to a pharmacokinetic study. Pharmaceutics 2023, 15, 824. [Google Scholar] [CrossRef] [Scilit]
- Nguyen, T.T.; Nguyen, T.T.; Nguyen, V.H.; Pham, T.L.; Pham, T.Y. Simultaneous Determination of Paracetamol and Diclofenac in Wastewater by High-Performance Liquid Chromatography. Viet. J. Sci. Technol. 2023, 61, 599–608. [Google Scholar] [CrossRef] [Scilit]
- Madikizela, L.M.; Chimuka, L. Simultaneous Determination of Naproxen, Ibuprofen, and Diclofenac in Wastewater Using Solid-Phase Extraction with High Performance Liquid Chromatography. Water SA 2017, 43, 234–243. [Google Scholar] [CrossRef] [Scilit]
- Márta, Z.; Bobály, B.; Fekete, J.; Magda, B.; Imre, T.; Szabó, P.T. Simultaneous Determination of Ten Nonsteroidal Anti-Inflammatory Drugs from Drinking Water, Surface Water and Wastewater Using Micro UHPLC-MS/MS with On-Line SPE System. J. Pharm. Biomed. Anal. 2018, 160, 99–108. [Google Scholar] [CrossRef] [Scilit] [PubMed]
- Kachhawaha, A.S.; Nagarnaik, P.M.; Labhasetwar, P.; Banerjee, K. A Review of Recently Developed LC-MS/MS Methods for the Analysis of Pharmaceuticals and Personal Care Products in Water. J. AOAC Int. 2020, 103, 9–22. [Google Scholar] [CrossRef] [Scilit]
- Petrović, M.; Hernando, M.D.; Díaz-Cruz, M.S.; Barceló, D. Liquid Chromatography–Tandem Mass Spectrometry for the Analysis of Pharmaceutical Residues in Environmental Samples: A Review. J. Chromatogr. A 2005, 1067, 1–14. [Google Scholar] [CrossRef] [Scilit] [PubMed]
- Breadmore, M.C.; Thabano, J.R.E.; Dawod, M.; Kazarian, A.A.; Quirino, J.P.; Guijt, R.M. Recent Advances in Enhancing the Sensitivity of Electrophoresis and Electrochromatography in Capillaries and Microchips (2008–2010). Electrophoresis 2011, 32, 127–148. [Google Scholar] [CrossRef] [Scilit]
- Malak, M.; Ebrahim, H.; Sonbol, H.; Ali, A.; Aboulella, Y.; Hadad, G.; Emara, S. Highly sensitive in-capillary derivatization and field-amplified sample stacking to analyze narcotic drugs in human serum by capillary zone electrophoresis. Separations 2023, 10, 58. [Google Scholar] [CrossRef] [Scilit]
- ICHHT Guideline. International Conference on Harmonisation of Technical Requirements for Registration of Pharmaceuticals for Human Use. Validation of Analytical Procedures: Text and Methodology Q2 (B); ICH Harmonized Tripartite Guideline; ICH: Geneva, Switzerland, 2005. [Google Scholar]
- Hilton, M.J.; Thomas, K.V. Determination of selected human pharmaceutical compounds in effluent and surface water samples by high-performance liquid chromatography–electrospray tandem mass spectrometry. J. Chromatogr. A 2003, 1015, 129–142. [Google Scholar] [CrossRef] [Scilit]
- Piaga, P.; Santos, L.H.M.L.M.; Delerue-Matos, C. Development of a multi-residue method for the determination of human and veterinary pharmaceuticals and some of their metabolites in aqueous environmental matrices by SPE-UHPLC–MS/MS. J. Pharm. Anal. 2017, 135, 75–86. [Google Scholar] [CrossRef] [Scilit]
- Gómez, M.J.; Petrović, M.; Fernández-Alba, A.R.; Barceló, D. Determination of pharmaceuticals of various therapeutic classes by solid-phase extraction and liquid chromatography-tandem mass spectrometry analysis in hospital effluent wastewaters. J. Chromatogr. A 2006, 1114, 224–233. [Google Scholar] [CrossRef] [Scilit]

Disclaimer/Publisher’s Note: The statements, opinions and data contained in all publications are solely those of the individual author(s) and contributor(s) and not of MDPI and/or the editor(s). MDPI and/or the editor(s) disclaim responsibility for any injury to people or property resulting from any ideas, methods, instructions or products referred to in the content. |
© 2026 by the authors. Licensee MDPI, Basel, Switzerland. This article is an open access article distributed under the terms and conditions of the Creative Commons Attribution (CC BY) license.