


Abstract
Background: Northern coastal communities surrounding MacKay Medical University have experienced substantial population aging, yet regional data on chronic disease prevalence, healthcare utilization, and associated medical expenditure remain limited. Methods: We conducted a population-based descriptive study using Taiwan’s National Health Insurance Research Database from 2018 to 2024. Sanzhi was the primary study area, Wan-Jin-Shi represented the neighboring coastal region, and other nonremote areas of New Taipei City served as the reference. We assessed population aging, annual claims-derived Charlson Comorbidity Index (CCI), disease prevalence, healthcare utilization, and diagnosis-associated encounter expenditure. All 17 CCI disease categories were evaluated for prevalence, with six conditions selected post hoc for detailed exploratory presentation. Age-standardized prevalence ratios were calculated to account for regional differences in age structure. Results: From 2018 to 2024, the proportion of residents aged ≥70 years increased from 18.5% to 25.7% in Sanzhi and from 19.9% to 26.9% in Wan-Jin-Shi, compared with 12.2% to 18.2% in the reference area. Annual mean claims-derived CCI showed different temporal patterns, with an overall increase in Wan-Jin-Shi and the reference area but an initial decline followed by an increase in Sanzhi. A sensitivity analysis restricted to beneficiaries with at least one healthcare encounter during the corresponding year showed broadly similar patterns. Disease prevalence varied across CCI categories, and age standardization attenuated several crude regional differences. Exploratory analyses of six post hoc selected conditions showed varying patterns of healthcare utilization and diagnosis-associated encounter expenditure. Conclusions: Substantial population aging was accompanied by regional differences in claims-recorded comorbidity, disease prevalence, and healthcare utilization. Age standardization affected the interpretation of regional prevalence differences. However, residual confounding and unadjusted utilization and expenditure comparisons limit the ability to attribute these differences to geographic location or underlying healthcare needs. These descriptive findings warrant further individual-level investigation.
1. Introduction
Population aging is placing increasing demands on healthcare systems, particularly in communities with a high and growing proportion of older residents. Older adults often experience multiple chronic conditions, functional limitations, and long-term care needs, which may contribute to greater utilization of outpatient and inpatient healthcare services [1,2,3,4,5,6]. The Charlson Comorbidity Index (CCI) is widely used to summarize comorbidity burden using administrative healthcare data [7,8,9]. However, the claims-derived CCI alone does not capture the full spectrum of population health characteristics or healthcare needs within a community. Assessments of population age structure, disease-specific prevalence, healthcare utilization, and medical expenditure may therefore provide complementary descriptive information for understanding regional health patterns and identifying areas for further investigation.
Taiwan has experienced rapid population aging, although demographic characteristics and access to healthcare resources vary considerably across regions. These differences may be particularly relevant in rural and less urbanized communities, where residents may face longer travel distances and more limited access to certain healthcare services [10,11,12,13]. Sanzhi District, located along the northern coast of New Taipei City, is home to MacKay Medical University. The neighboring Wan-Jin-Shi area, comprising Wanli, Jinshan, and Shimen districts, shares similar geographic and demographic characteristics. Both Sanzhi and Wan-Jin-Shi have higher proportions of older residents than the more urbanized areas of New Taipei City, potentially contributing to differences in observed chronic disease prevalence and healthcare utilization patterns.
Previous studies in Taiwan have reported urban–rural differences in chronic disease outcomes and healthcare delivery, including diabetes-related complications, chronic kidney disease, and family physician practice patterns [12,13,14]. However, relatively little is known about the population health characteristics and healthcare utilization patterns of the northern coastal communities of New Taipei City, particularly how population aging is accompanied by changes in claims-recorded comorbidity, chronic disease prevalence, healthcare utilization, and medical expenditure. Considering these measures together may provide a more comprehensive descriptive assessment of regional health patterns than demographic characteristics or a summary measure of comorbidity alone.
The health needs of the surrounding population are also relevant to the role of a regional medical university. Medical schools are increasingly encouraged to align education and community engagement with the health priorities of the populations they serve [15,16,17].
For MacKay Medical University, a better understanding of disease patterns and healthcare utilization in Sanzhi and neighboring communities could help inform community-based teaching and service activities, while also providing descriptive information relevant to regional healthcare planning.
In this study, we used Taiwan’s National Health Insurance Research Database (NHIRD) to describe population health and healthcare utilization patterns of Sanzhi and surrounding communities from 2018 to 2024. We examined population aging, annual mean claims-derived CCI, CCI disease-specific prevalence and temporal trends, healthcare utilization, and diagnosis-associated encounter expenditure. Sanzhi was the primary study area, Wan-Jin-Shi was included as a neighboring coastal comparison, and other nonremote areas of New Taipei City were used as the reference population.
2. Materials and Methods
2.1. Data Source
This study used Taiwan’s National Health Insurance Research Database (NHIRD), which covers approximately 23 million beneficiaries [10,11]. For each calendar year from 2018 to 2024, annual population denominators included all eligible National Health Insurance beneficiaries assigned to the corresponding study regions, regardless of whether they had outpatient or inpatient encounters during that year. Beneficiaries without healthcare encounters were therefore retained in the denominators for calculating annual disease prevalence. Beneficiaries who died during a calendar year were also included in the population denominator for that year. NHIRD records from 2018 to 2024 were used to identify beneficiaries residing in Sanzhi District and the comparison regions and to retrieve their healthcare claims during the study period. Relevant claims datasets were linked using each beneficiary’s unique identifier. The study protocol was approved by the Institutional Review Board of MacKay Memorial Hospital, Taiwan (Protocol No. 24MMHIS150e; approval date: 7 May 2024). Access to the NHIRD was obtained through a formal application to the Health and Welfare Data Science Center, Ministry of Health and Welfare, Taiwan.
2.2. Study Regions
Three geographic groups were defined within New Taipei City. Sanzhi District served as the primary study area. Wan-Jin-Shi, a neighboring northern coastal region, comprised Wanli, Jinshan, and Shimen districts. The reference area consisted of the remaining nonremote districts of New Taipei City, excluding Sanzhi, Wanli, Jinshan, Shimen, Sanxia, Pinglin, Shuangxi, Shiding, Pingxi, Gongliao, and Wulai districts (Supplementary Table S2). The nonremote districts of New Taipei City were selected as the reference population to provide a comparator within the same municipality while limiting heterogeneity related to geographic remoteness. Accordingly, remote districts were excluded from the reference population rather than combined with more accessible areas of New Taipei City. Residence was determined using information recorded in the NHIRD enrollment files. For each calendar year, beneficiaries were assigned to a study region based on their recorded residence in December. Beneficiaries who moved during the year were classified according to their year-end residence, whereas those who died before December were assigned according to their last recorded residence before death. Regional populations were reconstructed annually; therefore, beneficiaries whose recorded residence changed between 2018 and 2024 could contribute to different geographic groups in different years. Consequently, the geographic analyses represent annual population-level comparisons rather than follow-up of a fixed residential cohort.
2.3. Variables and Analytical Framework
The analysis examined six dimensions of regional population health and healthcare use: population aging, overall comorbidity burden, disease-specific prevalence, temporal trends in disease prevalence, healthcare utilization, and medical expenditure. Population aging was assessed using the annual proportion of residents aged ≥70 years. Annual claims-recorded comorbidity was summarized using the mean Charlson Comorbidity Index (CCI) for each region and calendar year. CCI scores were derived from qualifying ICD-10-CM diagnoses recorded in inpatient and outpatient claims during the corresponding calendar year. Diagnoses from previous years were not carried forward. Beneficiaries without qualifying diagnoses recorded during a given year contributed a claims-derived CCI score of zero for that year, including those without healthcare encounters. Accordingly, annual mean CCI was interpreted as a descriptive measure of claims-recorded comorbidity rather than a direct estimate of underlying population comorbidity burden. The diagnostic codes used to define each condition are provided in Supplementary Table S1.
Disease ascertainment was performed separately for each calendar year from 2018 to 2024 using the first five diagnosis fields of inpatient and outpatient claims. Beneficiaries were classified as having a specific CCI condition if at least one qualifying diagnosis code was recorded in either setting during the corresponding year. The same diagnostic criteria were applied to inpatient and outpatient claims, without requiring repeated outpatient diagnoses. Disease ascertainment was restricted to diagnoses recorded within each calendar year, without carrying forward diagnoses from previous years. This annual ascertainment approach was adopted to characterize comorbid conditions documented in healthcare claims during each calendar year, rather than to estimate the lifetime prevalence or longitudinal persistence of chronic diseases. Accordingly, the resulting estimates represent annual claims-recorded disease prevalence. The absence of a qualifying diagnosis in a subsequent year indicates that the condition was not recorded during that year and should not be interpreted as resolution of the underlying disease.
Because CCI disease categories were not mutually exclusive, beneficiaries could be classified into multiple categories within the same year. Annual disease-specific prevalence was calculated as the number of beneficiaries with at least one qualifying diagnosis divided by the total number of eligible beneficiaries assigned to the corresponding region, including those without healthcare encounters. The total eligible NHI population was retained as the denominator to preserve a consistent population-based framework across regions and calendar years. Restricting the denominator to beneficiaries with healthcare encounters would instead estimate disease prevalence among healthcare users, representing a different target population and potentially introducing selection bias related to healthcare-seeking behavior. Nevertheless, beneficiaries without healthcare encounters could not be identified as having a condition through claims during the corresponding year.
All 17 CCI disease categories were included in the initial descriptive assessment of disease prevalence. Following examination of these results, six conditions—diabetes with chronic complications, cerebrovascular disease, dementia, renal disease, chronic pulmonary disease, and metastatic carcinoma—were selected post hoc for more detailed exploratory presentation. These conditions were chosen to illustrate contrasting observed patterns in prevalence, temporal trends, healthcare utilization, and diagnosis-associated encounter expenditure. The selection was not prespecified and was not based on formal statistical significance testing. Accordingly, the six conditions were treated as illustrative examples rather than primary outcomes or a representative sample of all CCI disease categories. The complete disease-specific results are provided in the Supplementary Materials and should be considered when interpreting the selected-condition findings.
Crude prevalence ratios (PRs) were calculated by dividing the prevalence in Sanzhi by the corresponding prevalence in the reference area (other nonremote districts of New Taipei City). Annual crude PRs from 2018 to 2024 were used to describe temporal trends, and 95% confidence intervals (CIs) were calculated for the 2024 comparisons. Age-standardized PRs for 2024 were also calculated to account for differences in population age structure, as described in Section 2.4.
Disease-associated healthcare utilization in 2024 was assessed using outpatient visits, inpatient admissions, and the number of patients identified with each condition. Outpatient visits per patient and inpatient admissions per patient were calculated separately for Sanzhi and the reference area. For each measure, a relative utilization ratio was calculated by dividing the value in Sanzhi by the corresponding value in the reference area. Ratios greater than 1 indicated higher outpatient visit or inpatient admission frequencies per patient in Sanzhi. Because disease ascertainment and healthcare utilization were based on claims recorded during the same calendar year, these measures were not statistically independent. Healthcare utilization was therefore summarized descriptively among beneficiaries with claims-recorded diagnoses and was not intended to represent utilization independent of the disease ascertainment process. Results for the six selected conditions are presented in the main analysis, with relative outpatient utilization ratios for all 17 CCI disease categories and relative inpatient utilization ratios for 16 evaluable categories provided in Supplementary Table S3. The relative inpatient utilization ratio for AIDS/HIV could not be estimated because the inpatient count in Sanzhi was subject to small-cell suppression; however, its relative outpatient utilization ratio was retained.
Diagnosis-associated encounter expenditure was calculated by summing the recorded expenditure for inpatient and outpatient encounters containing at least one qualifying diagnosis code for the corresponding CCI disease category. The entire expenditure of each qualifying encounter was included, regardless of whether the condition was recorded as the primary or a secondary diagnosis. When an encounter contained qualifying diagnoses for multiple CCI disease categories, its full expenditure could be counted in more than one category. Accordingly, these expenditure measures were not mutually exclusive and should not be summed across disease categories. Importantly, they represent total healthcare expenditure recorded during encounters involving the specified conditions, rather than expenditure causally attributable to the individual diseases. No attempt was made to allocate encounter expenditure among coexisting diagnoses or to estimate the incremental cost attributable to a particular condition.
Expenditure per patient was calculated by dividing diagnosis-associated encounter expenditure by the number of patients identified with the corresponding condition. Population-based expenditure was calculated by dividing diagnosis-associated encounter expenditure by the total number of eligible beneficiaries in the corresponding region. Relative expenditure ratios were calculated by dividing the corresponding Sanzhi expenditure measure by that of the reference area. Healthcare utilization and expenditure comparisons were descriptive; no confidence intervals or formal hypothesis tests were performed for these measures. Individual-level expenditure distributions were unavailable for estimating uncertainty in the expenditure comparisons. Accordingly, utilization and expenditure ratios were interpreted as descriptive measures of relative magnitude rather than evidence of statistically significant regional differences. For presentation purposes, expenditures were approximately converted from New Taiwan dollars (NTD) to US dollars (USD) using NTD 32 = USD 1, based on the 2024 annual average exchange rate of NTD 32.108 per USD reported by the Central Bank of the Republic of China (Taiwan).
2.4. Statistical Approach
All analyses were performed using SAS version 9.4 (SAS Institute Inc., Cary, NC, USA). Categorical variables were summarized as frequencies and percentages, and continuous variables were summarized as means, as appropriate. Population aging was assessed using annual age distributions derived from NHIRD enrollment data, including the proportion of beneficiaries aged ≥70 years in each region. To account for differences in population age structure, direct age standardization of annual claims-recorded disease prevalence was performed across nine age groups (<20, 20–29, 30–39, 40–49, 50–59, 60–69, 70–79, 80–89, and ≥90 years). Age-specific disease prevalence was calculated using the corresponding age-specific NHIRD enrollment denominators for each region and calendar year. The 2024 New Taipei City NHIRD population was used as the standard population. Age-standardized prevalence ratios (PRs) were calculated by dividing the age-standardized prevalence in Sanzhi by that in other nonremote areas of New Taipei City. For temporal comparisons, direct age standardization was performed separately for each calendar year from 2018 to 2024 using the same 2024 New Taipei City NHIRD standard population. Annual age-standardized prevalence ratios were then calculated by comparing the age-standardized prevalence in Sanzhi with that in other nonremote areas of New Taipei City. Using a fixed standard population across all years allowed temporal comparisons to account for differences in population age composition. Age standardization was applied to disease prevalence comparisons only. Annual mean claims-derived CCI, healthcare utilization, and diagnosis-associated encounter expenditure were analyzed descriptively without multivariable adjustment for sex, socioeconomic characteristics, disease severity, healthcare accessibility, or other potential confounders. Accordingly, regional comparisons were intended to characterize observed differences rather than estimate independent geographic effects.
Crude PRs were retained to describe the observed population-level differences in disease prevalence, whereas age-standardized PRs facilitated comparisons after accounting for differences in age structure. Temporal trends from 2018 to 2024 were examined descriptively using annual crude and age-standardized PRs. The six conditions selected post hoc for detailed presentation are described in Section 2.3, and the complete disease-specific prevalence comparisons are provided in the Supplementary Materials.
Healthcare utilization and diagnosis-associated encounter expenditure comparisons were descriptive, with the other nonremote districts of New Taipei City serving as the reference area. No confidence intervals or formal hypothesis tests were performed for these comparisons. Individual-level expenditure distributions were unavailable for estimating uncertainty in expenditure measures. Accordingly, utilization and expenditure ratios were interpreted descriptively rather than as evidence of statistically significant regional differences.
To assess the influence of including beneficiaries without healthcare encounters on annual mean CCI estimates, a sensitivity analysis was performed by restricting the calculation to beneficiaries with at least one inpatient or outpatient encounter during the corresponding calendar year. Annual mean claims-derived CCI values from this restricted population were compared descriptively with those from the primary analysis, which included all eligible beneficiaries regardless of healthcare utilization.
3. Results
3.1. Population Aging Across Study Regions
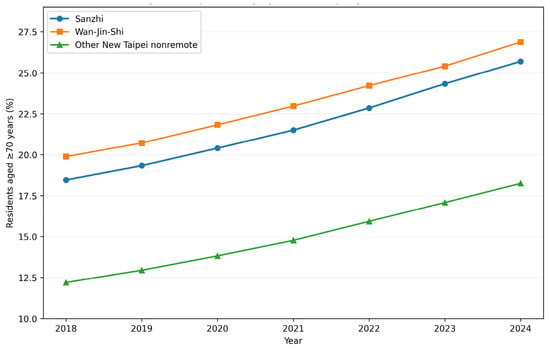
As shown in Figure 1, the proportion of beneficiaries aged ≥70 years increased in all three study regions from 2018 to 2024. In Sanzhi, this proportion increased from 18.5% to 25.7%, compared with an increase from 19.9% to 26.9% in Wan-Jin-Shi and from 12.2% to 18.2% in the reference area. Throughout the study period, both Sanzhi and Wan-Jin-Shi consistently had higher proportions of beneficiaries aged ≥70 years than the reference area, highlighting differences in population age structure across the study regions.
Figure 1.
Population aging across study regions, 2018–2024. Percentage of National Health Insurance beneficiaries aged ≥70 years in Sanzhi, Wan-Jin-Shi, and other nonremote areas of New Taipei City.
3.2. Annual Claims-Derived Comorbidity
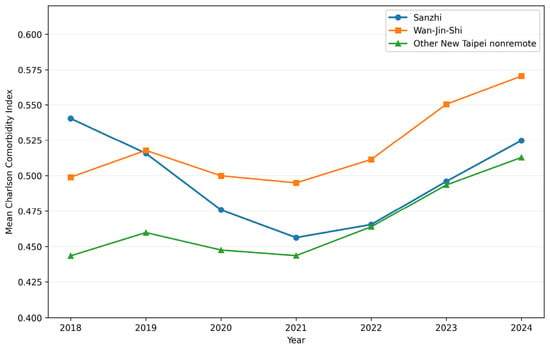
Annual mean claims-derived Charlson Comorbidity Index (CCI) values showed different temporal patterns across the three study regions (Figure 2). In Sanzhi, mean CCI decreased from 0.540 in 2018 to 0.456 in 2021, followed by an increase to 0.525 in 2024. In Wan-Jin-Shi, mean CCI increased from 0.499 in 2018 to 0.570 in 2024, with a more pronounced increase after 2021. The reference area showed an overall increase from 0.444 in 2018 to 0.513 in 2024. By 2024, the highest annual mean claims-derived CCI was observed in Wan-Jin-Shi (0.570), followed by Sanzhi (0.525) and the reference area (0.513). These values describe annual differences in claims-recorded comorbidity and do not necessarily represent equivalent differences in underlying morbidity. A sensitivity analysis was conducted by restricting the calculation of annual mean claims-derived CCI to beneficiaries with at least one healthcare encounter during the corresponding calendar year (Supplementary Figure S2). Mean CCI values were consistently higher among healthcare users than in the entire enrolled population across all three regions. In Sanzhi, mean CCI among healthcare users decreased from 0.709 in 2018 to its lowest value of 0.631 in 2022, followed by an increase to 0.725 in 2024. This pattern was broadly consistent with the primary analysis, although the lowest mean CCI in the entire enrolled population occurred in 2021 (0.456). In Wan-Jin-Shi, mean CCI among healthcare users increased overall from 0.650 in 2018 to 0.783 in 2024, compared with an increase from 0.499 to 0.570 in the primary analysis. Similarly, the reference area showed an overall increase from 0.548 to 0.646 among healthcare users, compared with 0.444 to 0.513 in the entire enrolled population. Despite differences in absolute CCI values and the timing of the lowest value in Sanzhi, the overall temporal patterns were broadly similar between the two analytical populations.
Figure 2.
Annual mean claims-derived Charlson Comorbidity Index (CCI) across study regions, 2018–2024. Mean CCI was calculated separately for each calendar year using diagnoses recorded in inpatient and outpatient claims. The primary analysis included all eligible National Health Insurance beneficiaries, including those without healthcare encounters during the corresponding year.
3.3. Selected Disease-Associated Prevalence Ratios in Sanzhi
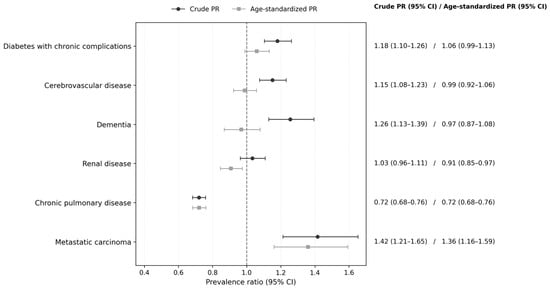
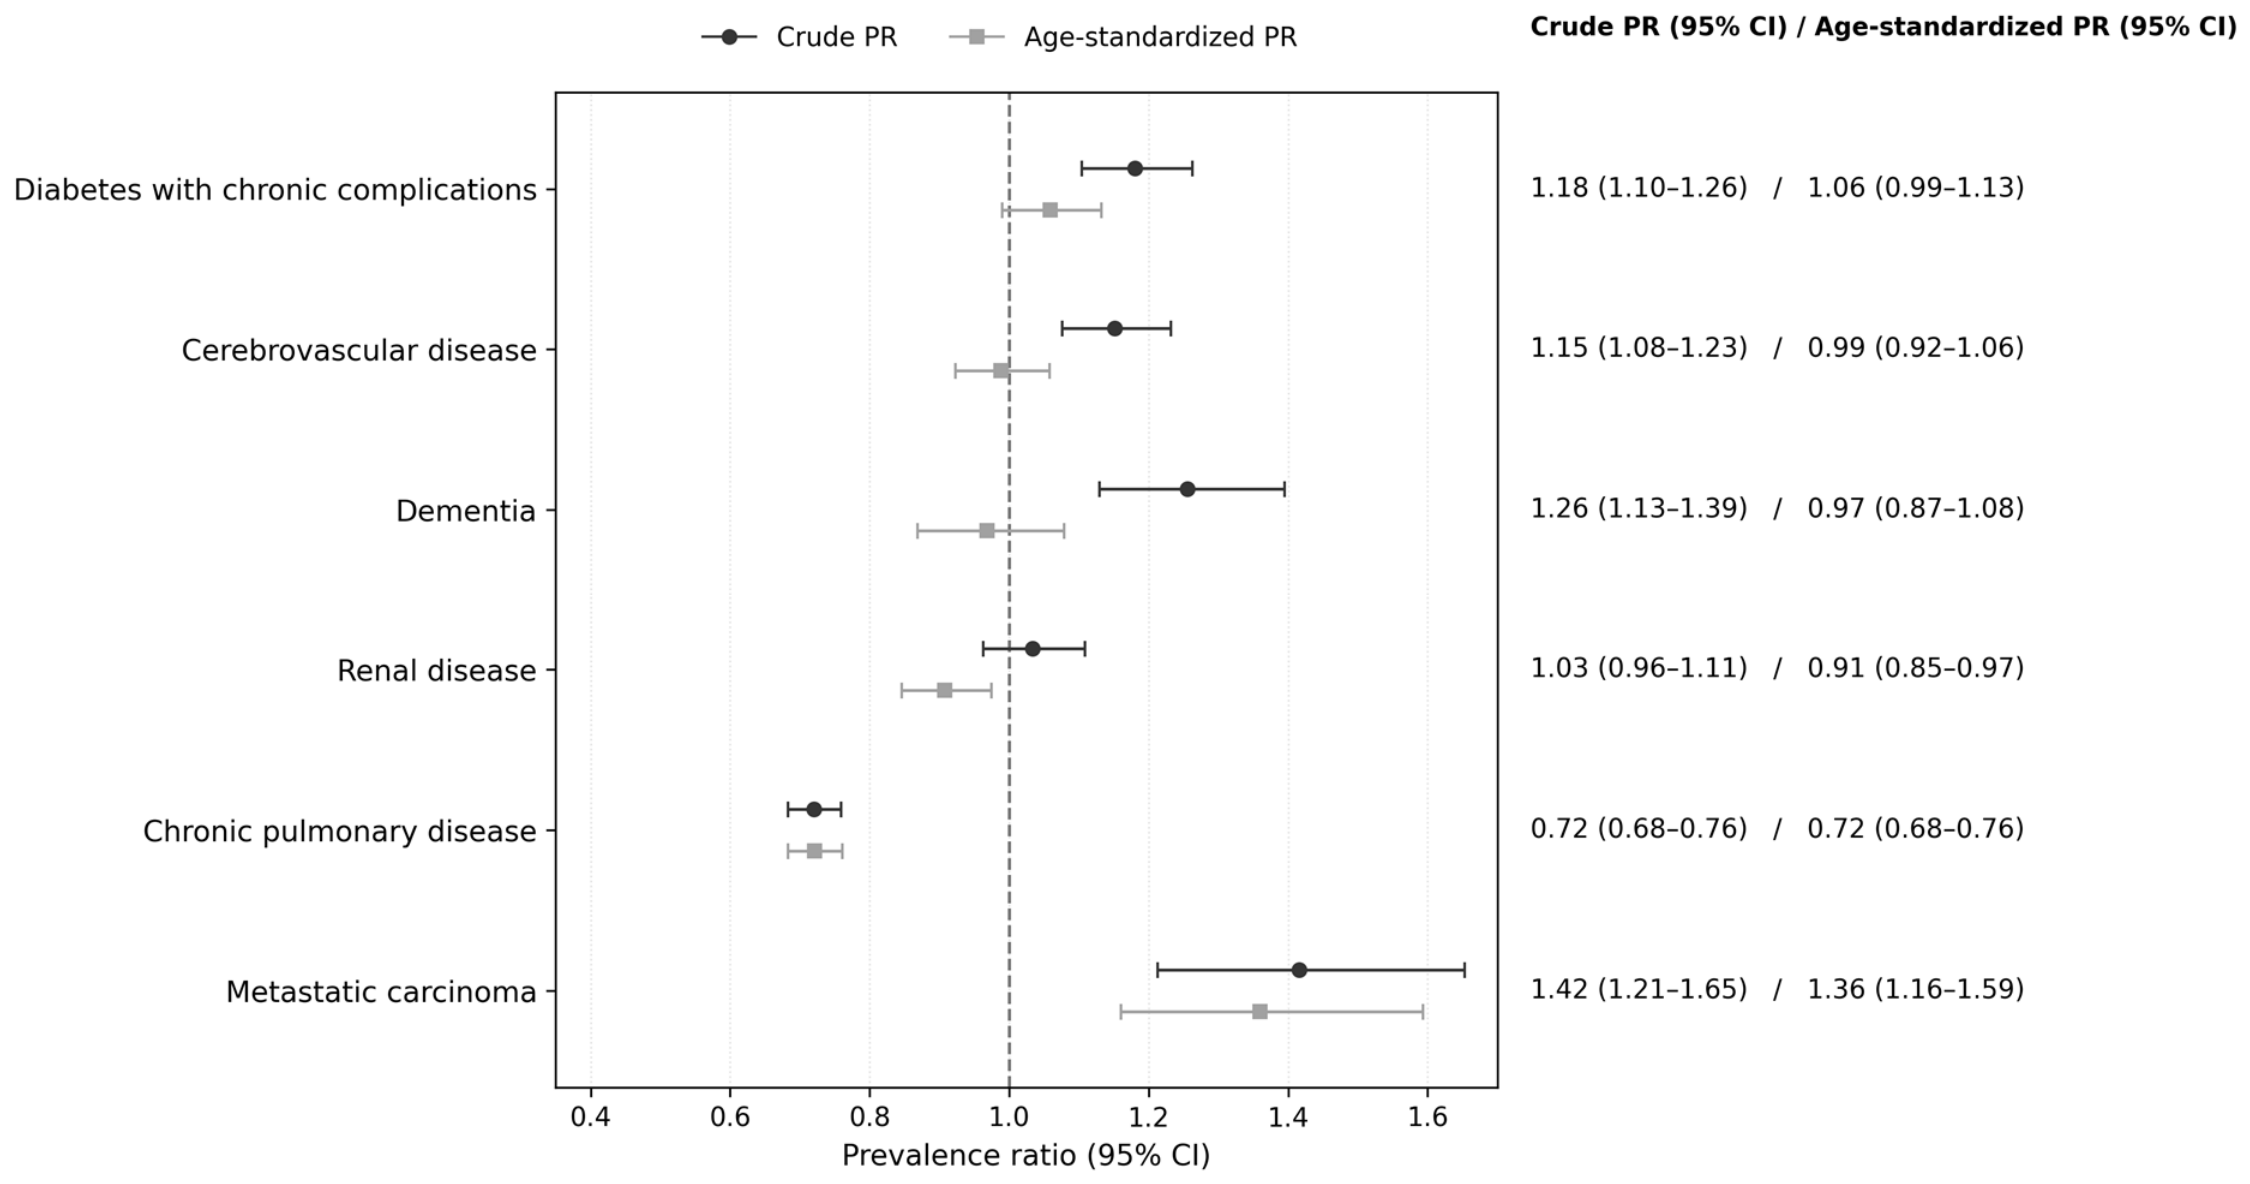
Figure 3 presents the crude and age-standardized prevalence ratios (PRs) for six post hoc selected Charlson Comorbidity Index (CCI) disease categories in Sanzhi in 2024, using other nonremote districts of New Taipei City as the reference area. These conditions were selected to illustrate contrasting descriptive patterns and should not be considered representative of all CCI disease categories. Corresponding results for all 17 evaluated categories are provided in Supplementary Figure S1.
Figure 3.
Crude and age-standardized prevalence ratios for six selected Charlson Comorbidity Index disease categories in Sanzhi, 2024. Prevalence ratios (PRs) were calculated by comparing annual claims-recorded disease prevalence in Sanzhi with that in other nonremote areas of New Taipei City. Direct age standardization was performed across nine age groups using the 2024 New Taipei City National Health Insurance population as the standard. Circles represent crude PRs, and squares represent age-standardized PRs; horizontal bars indicate 95% confidence intervals (CIs). The dashed vertical line indicates a PR of 1.0.
Before age standardization, Sanzhi had higher prevalence of diabetes with chronic complications (PR 1.18, 95% CI 1.10–1.26), cerebrovascular disease (PR 1.15, 95% CI 1.07–1.23), dementia (PR 1.26, 95% CI 1.13–1.39), and metastatic carcinoma (PR 1.42, 95% CI 1.21–1.65) than the reference area. The prevalence of renal disease was comparable between regions (PR 1.03, 95% CI 0.96–1.11), whereas chronic pulmonary disease was less prevalent in Sanzhi (PR 0.72, 95% CI 0.68–0.76).
After direct age standardization across nine age groups, several crude regional differences were attenuated. The age-standardized PRs were 1.06 (95% CI: 0.99–1.13) for diabetes with chronic complications, 0.99 (95% CI: 0.92–1.06) for cerebrovascular disease, and 0.97 (95% CI: 0.87–1.08) for dementia. Renal disease showed a lower age-standardized prevalence in Sanzhi (PR: 0.91, 95% CI: 0.85–0.97), as did chronic pulmonary disease (PR: 0.72, 95% CI: 0.68–0.76). In contrast, metastatic carcinoma remained more prevalent in Sanzhi after age standardization (PR: 1.36, 95% CI: 1.16–1.59) (Figure 3).
3.4. Temporal Trends in Selected Disease-Associated Prevalence Ratios
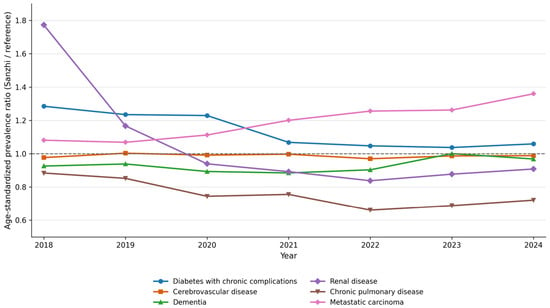
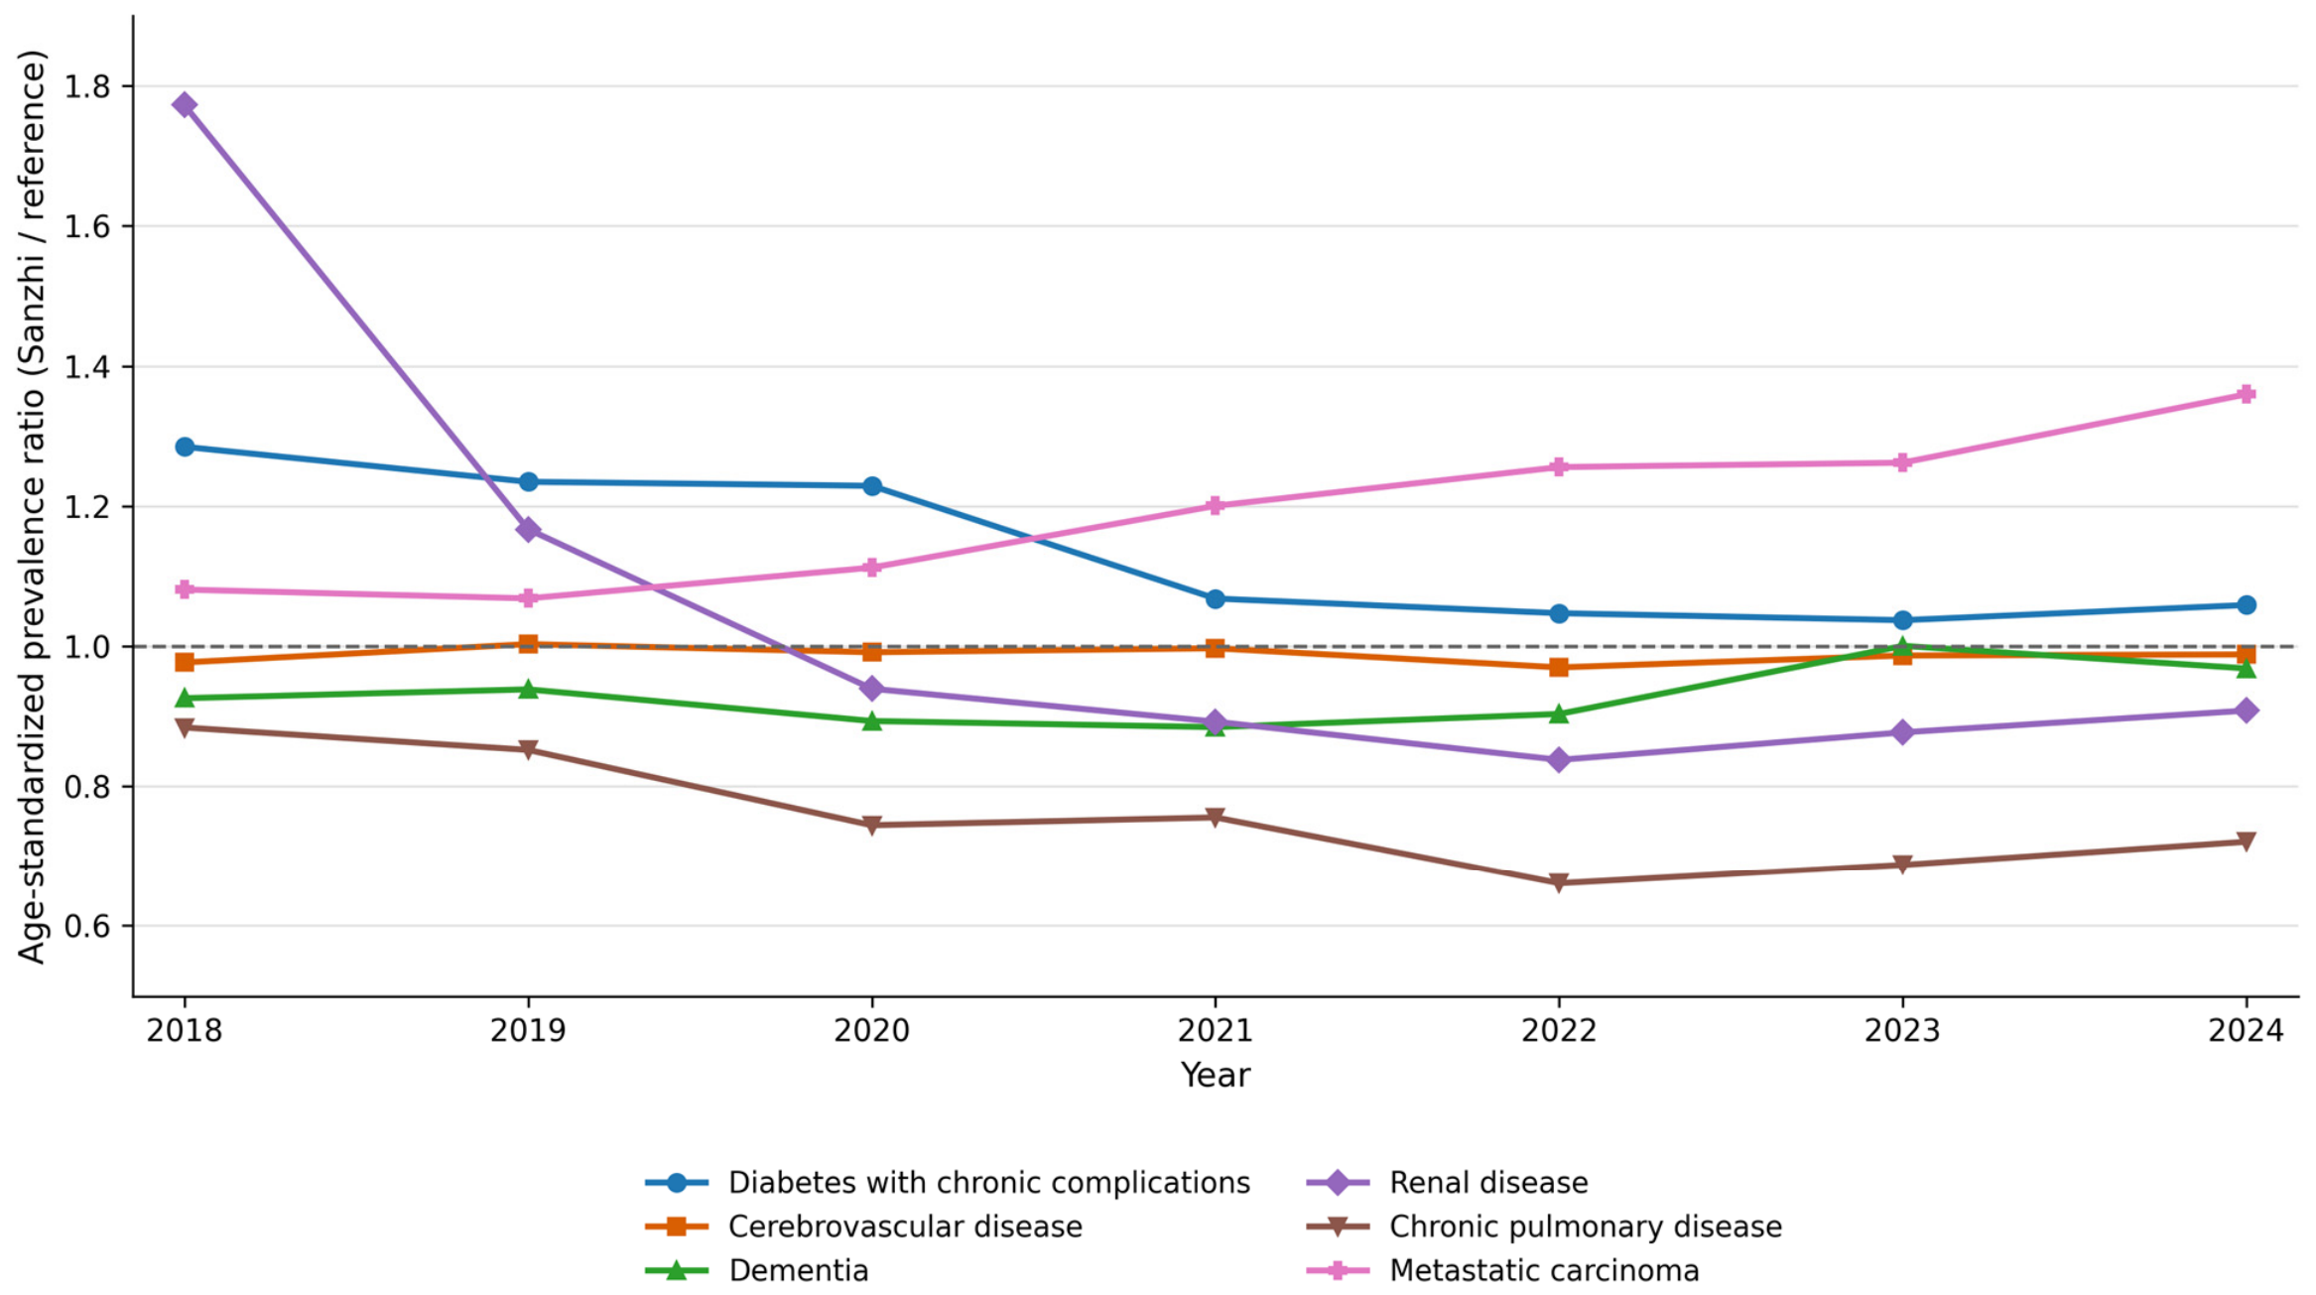
Figure 4 presents temporal trends in age-standardized prevalence ratios (PRs) for six selected Charlson Comorbidity Index disease categories in Sanzhi relative to other nonremote areas of New Taipei City from 2018 to 2024. The age-standardized PR for diabetes with chronic complications decreased from 1.29 in 2018 to 1.06 in 2024, indicating a narrowing regional difference. Cerebrovascular disease and dementia showed relatively stable age-standardized PRs near 1.0 throughout the study period. Renal disease exhibited a substantial decline in its age-standardized PR, from 1.77 in 2018 to 0.91 in 2024. Chronic pulmonary disease consistently showed age-standardized PRs below 1.0, decreasing from 0.88 to 0.72. In contrast, the age-standardized PR for metastatic carcinoma increased from 1.08 in 2018 to 1.36 in 2024, although year-to-year fluctuations were observed.
Figure 4.
Temporal trends in age-standardized prevalence ratios for six selected Charlson Comorbidity Index disease categories in Sanzhi, 2018–2024. Annual age-standardized prevalence ratios (PRs) were calculated using direct standardization across nine age groups, with the 2024 New Taipei City National Health Insurance population serving as the common standard population for all study years. Other nonremote areas of New Taipei City served as the reference population. The dashed horizontal line indicates a PR of 1.0.
3.5. Disease-Associated Healthcare Utilization Patterns
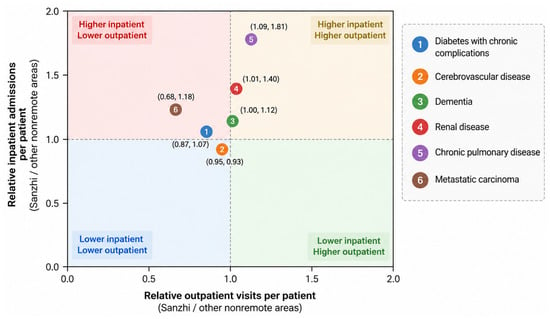
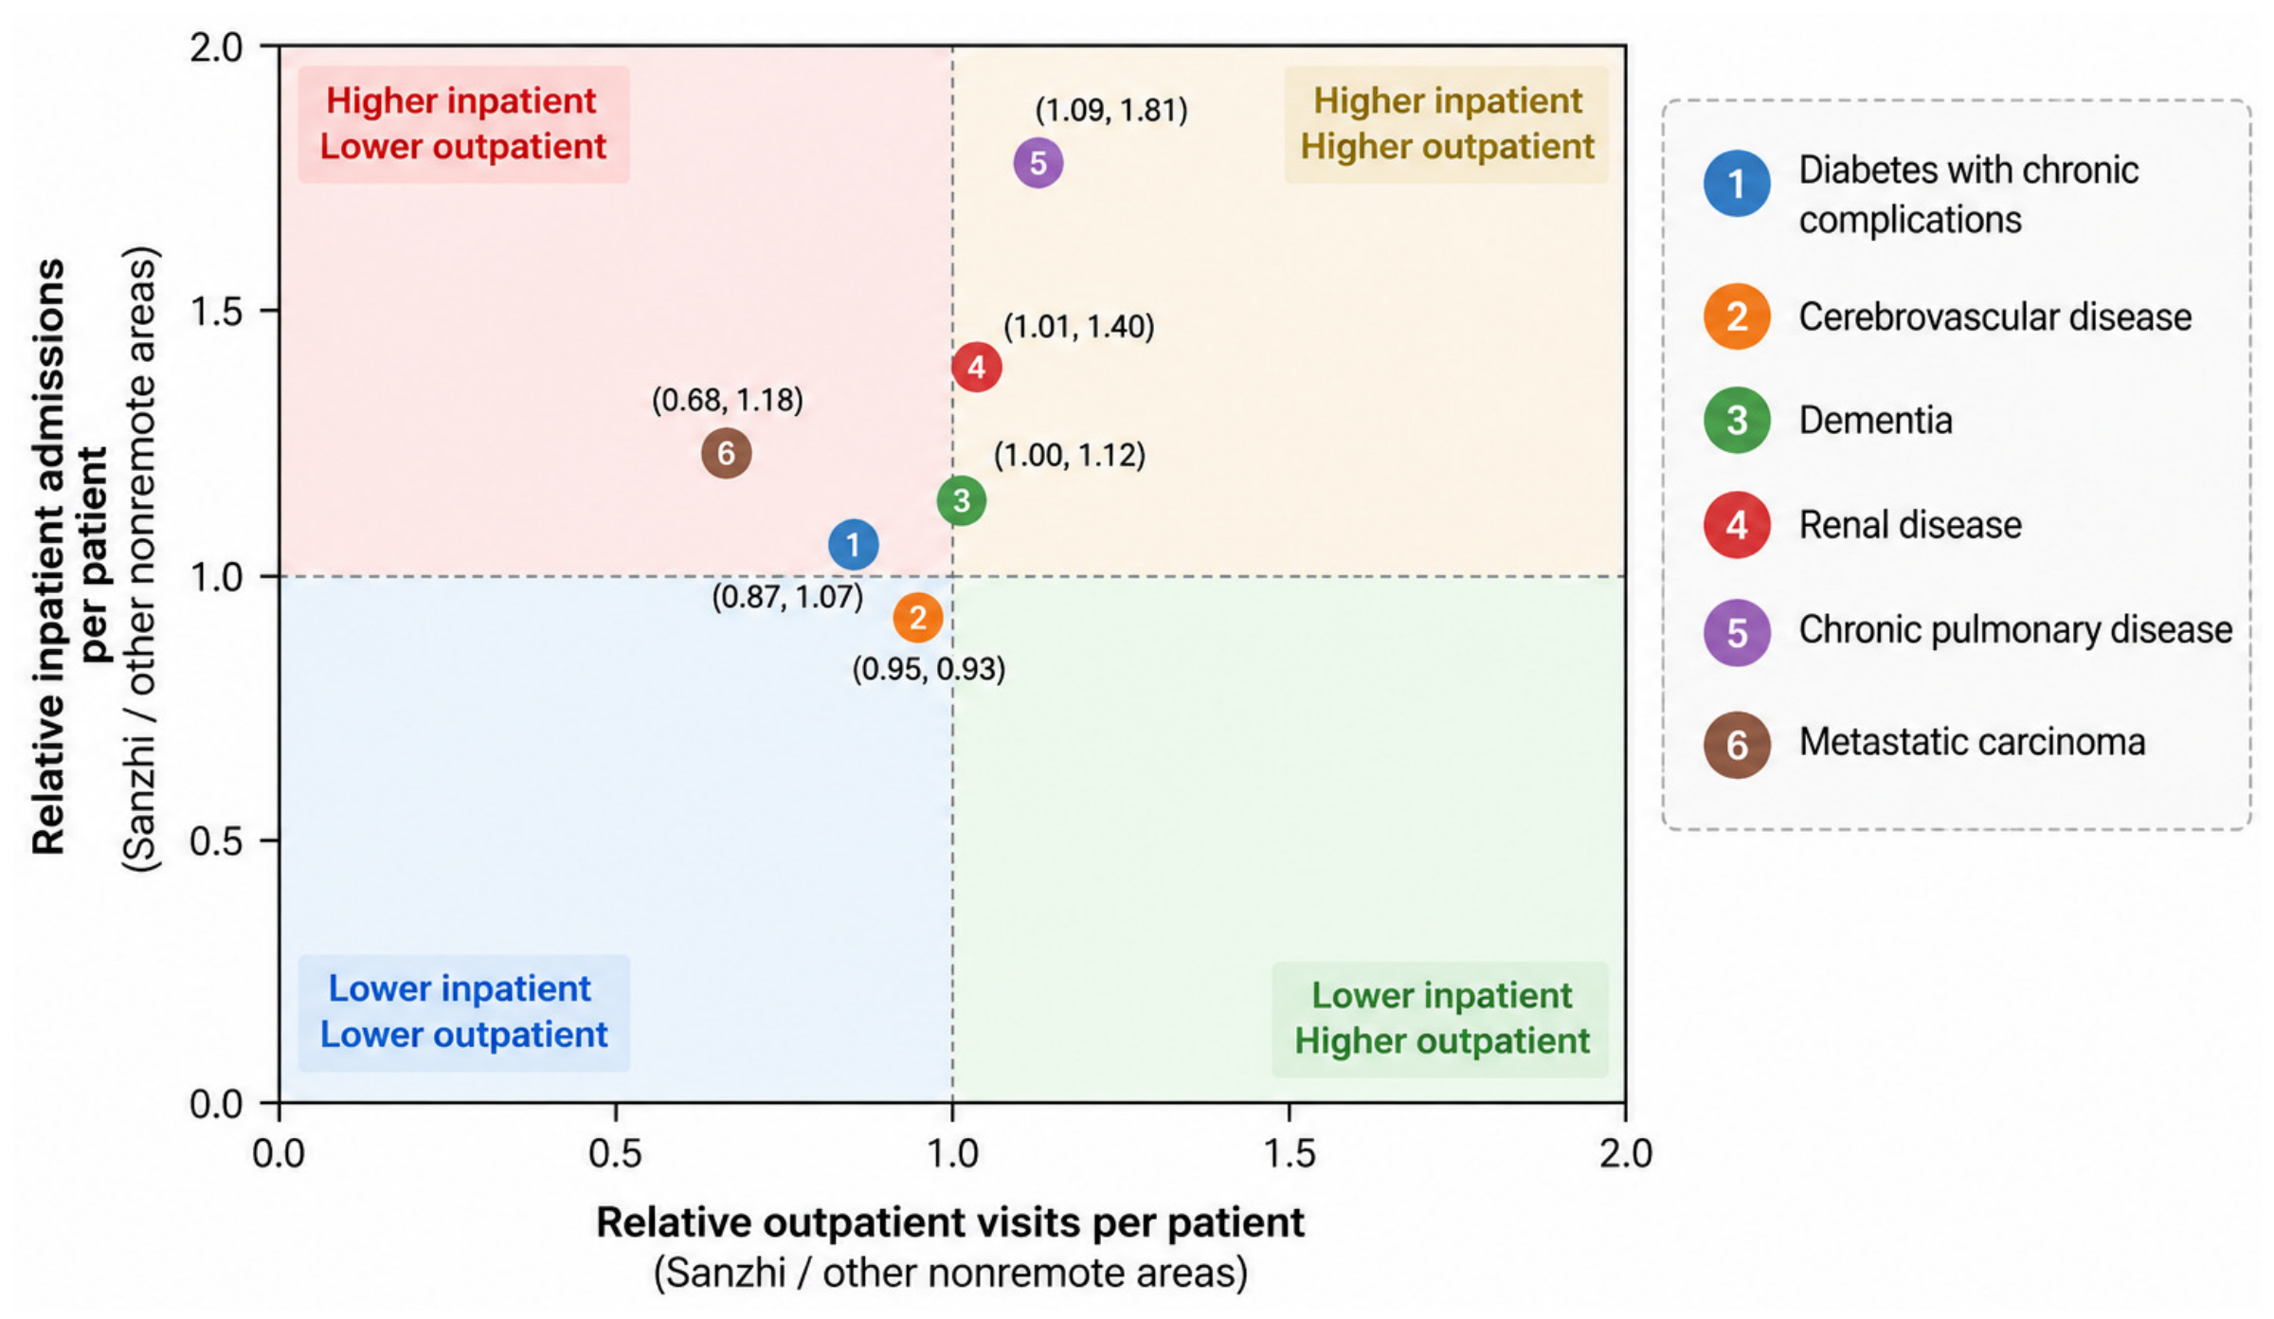
Figure 5 presents the relative outpatient visits per patient and inpatient admissions per patient for six selected Charlson Comorbidity Index (CCI) disease categories in 2024, comparing Sanzhi with the reference area. Supplementary Table S3 presents relative outpatient utilization ratios for all 17 CCI disease categories and relative inpatient utilization ratios for 16 categories; the inpatient ratio for AIDS/HIV was not estimable because of small-cell suppression.
Figure 5.
Relative outpatient visits and inpatient admissions per patient in Sanzhi compared with other nonremote areas of New Taipei City in 2024: six selected CCI disease categories. The horizontal axis represents the ratio of outpatient visits per patient in Sanzhi to that in other nonremote areas of New Taipei City, whereas the vertical axis represents the corresponding ratio for inpatient admissions per patient. Dashed reference lines at 1.0 indicate equal utilization between the two regions. Values greater than 1.0 indicate higher utilization per patient in Sanzhi. Corresponding results for all CCI disease categories are provided in Supplementary Table S3, with the inpatient utilization ratio for AIDS/HIV reported as not estimable.
Healthcare utilization patterns varied across the six conditions. Chronic pulmonary disease showed higher relative outpatient visits per patient (1.09) and substantially higher relative inpatient admissions per patient (1.81) in Sanzhi. Renal disease showed a similar pattern, with relative outpatient visits per patient of 1.01 and inpatient admissions per patient of 1.40. In contrast, metastatic carcinoma was associated with fewer outpatient visits per patient in Sanzhi (relative ratio 0.68), while inpatient admissions per patient were higher (1.18). For diabetes with chronic complications, the relative outpatient and inpatient utilization ratios were 0.87 and 1.07, respectively. Cerebrovascular disease showed ratios below 1.0 for both outpatient visits (0.95) and inpatient admissions (0.93), whereas dementia showed comparable outpatient visits per patient (1.00) but higher inpatient admissions per patient (1.12). Notably, the higher relative inpatient utilization observed for chronic pulmonary disease occurred despite its lower disease prevalence in Sanzhi.
3.6. Diagnosis-Associated Encounter Expenditure per Patient and per Eligible Beneficiary
Table 1 presents diagnosis-associated encounter expenditure for six selected CCI disease categories in 2024, comparing Sanzhi with other nonremote areas of New Taipei City. These measures represent total expenditure recorded during encounters containing the corresponding diagnoses and should not be interpreted as costs attributable exclusively to individual diseases. On a per-patient basis, relative expenditure ratios were higher in Sanzhi for chronic pulmonary disease (1.52), metastatic carcinoma (1.32), and renal disease (1.17). The ratio for dementia was close to unity (1.02), whereas slightly lower ratios were observed for diabetes with chronic complications (0.96) and cerebrovascular disease (0.93). When expenditure was calculated per eligible beneficiary in the regional population, the relative expenditure ratios exceeded 1.0 for all six conditions. Metastatic carcinoma had the highest population-based relative expenditure ratio (1.87), followed by dementia (1.28), renal disease (1.21), diabetes with chronic complications (1.13), chronic pulmonary disease (1.09), and cerebrovascular disease (1.07).
Table 1.
Diagnosis-associated encounter expenditure per patient and per eligible beneficiary for six selected Charlson Comorbidity Index disease categories in Sanzhi and other nonremote areas of New Taipei City, 2024. Expenditure is presented in US dollars (USD), approximately converted from New Taiwan dollars (NTD) at NTD 32 = USD 1. Per-patient expenditure was calculated by dividing diagnosis-associated encounter expenditure by the number of patients identified with the corresponding condition, whereas expenditure per eligible beneficiary was calculated using the total eligible National Health Insurance population in each region. Relative expenditure ratios were calculated by dividing the corresponding Sanzhi value by that of other nonremote areas of New Taipei City. Expenditure represents the total recorded cost of encounters containing the relevant diagnosis and is not necessarily attributable to that disease.
4. Discussion
This study examined population aging, annual claims-recorded comorbidity burden, disease-specific prevalence, healthcare utilization, and diagnosis-associated encounter expenditure in Sanzhi and neighboring northern coastal communities from 2018 to 2024. Throughout the study period, Sanzhi and Wan-Jin-Shi had higher proportions of older beneficiaries than the reference area, with approximately one-quarter of beneficiaries in both coastal regions aged ≥70 years by 2024. In Sanzhi, the crude prevalence of diabetes with chronic complications, cerebrovascular disease, dementia, and metastatic carcinoma was higher than in the reference area. However, age standardization substantially attenuated the differences for several conditions, particularly diabetes with chronic complications and cerebrovascular disease, while the higher prevalence of metastatic carcinoma persisted. Regional patterns also varied according to the disease examined and whether healthcare utilization and diagnosis-associated encounter expenditure were assessed on a per-patient or population basis. These findings should be considered in the context of population aging, which is associated with increasing chronic disease burden, multimorbidity, functional impairment, and ongoing healthcare needs [2,3,6,18,19,20].
Annual mean claims-derived CCI showed heterogeneous temporal patterns across the study regions despite substantial population aging. Sanzhi exhibited an initial decline followed by an increase, whereas Wan-Jin-Shi and the reference area showed overall increases. Importantly, the sensitivity analysis restricted to beneficiaries with healthcare encounters demonstrated broadly similar temporal patterns, although mean CCI values were consistently higher than those in the full enrolled population. This finding suggests that the observed regional trends were not solely explained by the inclusion of beneficiaries without healthcare encounters. Nevertheless, annual CCI estimates remain dependent on healthcare contact and diagnostic recording, particularly because previously documented chronic conditions were not carried forward across calendar years. Therefore, these results should be interpreted as descriptive patterns of claims-recorded comorbidity rather than direct evidence of changes in underlying population morbidity [7,8,9].
The age-standardized analyses, using nine age groups and directly observed NHIRD enrollment denominators, provided a more detailed assessment of the potential contribution of population age structure to regional differences in claims-recorded disease prevalence. The higher crude prevalence of diabetes with chronic complications, cerebrovascular disease, and dementia in Sanzhi was substantially attenuated after age standardization, with age-standardized prevalence ratios approaching unity. In contrast, the lower prevalence of chronic pulmonary disease and the higher prevalence of metastatic carcinoma persisted after age standardization. Renal disease also showed a lower age-standardized prevalence in Sanzhi despite a crude prevalence ratio close to unity. These findings suggest that differences in age structure may partly explain some, but not all, observed regional differences. Residual variation may reflect differences in underlying risk factors, healthcare contact, diagnostic practices, or other unmeasured characteristics.
Crude and age-standardized prevalence estimates provide complementary information. Crude prevalence reflects the observed frequency of claims-identified conditions in the regional population and may help inform healthcare service planning in aging communities. In contrast, age-standardized estimates facilitate epidemiological comparisons between populations with different age structures. Therefore, attenuation of prevalence ratios after age standardization does not diminish the relevance of the observed claims-identified conditions for local healthcare planning. Rather, it underscores the importance of considering population age structure when interpreting regional differences in claims-identified disease prevalence.
Temporal trends in age-standardized prevalence ratios further demonstrated heterogeneous patterns across disease categories. The regional difference in diabetes with chronic complications narrowed between 2018 and 2024, while cerebrovascular disease and dementia showed age-standardized PRs close to 1.0 after accounting for differences in population age structure. Renal disease showed a substantial decline in its age-standardized PR, suggesting that the observed temporal change could not be attributed solely to differences in population age composition under the applied standardization approach. In contrast, chronic pulmonary disease consistently showed lower age-standardized prevalence in Sanzhi, whereas metastatic carcinoma exhibited an increasing age-standardized PR over the study period. These findings suggest that temporal changes in relative claims-recorded disease prevalence may differ across conditions even after age standardization. However, changes in diagnostic practices, healthcare contact, coding patterns, and other unmeasured factors may also have contributed to the observed trends [12,13,14,21,22,23].
Healthcare utilization patterns did not necessarily correspond to differences in disease prevalence. Among the six selected conditions, chronic pulmonary disease showed the highest relative inpatient admissions per patient in Sanzhi compared with the reference area (1.81), followed by renal disease (1.40) and metastatic carcinoma (1.18). For chronic pulmonary disease, this higher relative inpatient utilization was observed despite its lower prevalence in Sanzhi. In contrast, cerebrovascular disease had a higher crude prevalence in Sanzhi, but its relative outpatient visits per patient (0.95) and inpatient admissions per patient (0.93) were both below 1.0. Metastatic carcinoma also showed contrasting utilization patterns, with fewer outpatient visits per patient (relative ratio 0.68) but more inpatient admissions per patient (1.18) in Sanzhi. Although disease prevalence and healthcare utilization describe different aspects of the observed claims data, they are not independent in the present analytical framework. Beneficiaries with more frequent healthcare encounters have more opportunities for qualifying diagnoses to be recorded, potentially influencing both disease ascertainment and the composition of the claims-identified patient groups. Consequently, regional differences in utilization among these patients may partly reflect variation in healthcare contact, diagnostic intensity, or coding practices rather than differences in disease severity or healthcare requirements alone. Other potential explanations include differences in disease severity, healthcare-seeking behavior, referral practices, and access to outpatient services, which could not be directly assessed using the available data [12,13,14,21,24,25].
The expenditure analysis revealed regional differences in diagnosis-associated encounter expenditure for the six selected CCI disease categories. However, these findings require careful interpretation because the full expenditure of each qualifying encounter was included regardless of the contribution of individual diagnoses. Encounters involving multiple conditions could contribute to several expenditure categories, and the observed differences may therefore reflect multimorbidity, disease severity, treatment complexity, accompanying diagnoses, or coding practices. Consequently, the relative expenditure ratios should be regarded as descriptive indicators of diagnosis-associated encounter expenditure rather than estimates of the economic burden attributable to individual diseases. Although these findings may provide context for regional healthcare service planning, they cannot establish which diseases independently account for higher healthcare expenditure.
The findings provide descriptive information on population aging, claims-recorded comorbidity, claims-recorded disease prevalence, healthcare utilization, and diagnosis-associated encounter expenditure in northern coastal communities of New Taipei City. However, the observed regional differences should not be interpreted as independent effects of geographic location or direct indicators of unmet healthcare needs. Although age standardization improved comparability of disease prevalence estimates, other demographic, socioeconomic, clinical, and healthcare-system characteristics were not accounted for. In particular, differences in healthcare accessibility, referral patterns, disease severity, healthcare-seeking behavior, and diagnostic intensity may contribute to the observed utilization and expenditure patterns. Therefore, the findings are best viewed as identifying regional patterns that warrant further investigation rather than providing definitive evidence for specific healthcare resource allocation decisions. More detailed individual-level analyses, together with assessments of local healthcare services and population needs, would be necessary to inform specific healthcare planning decisions.
These findings are also relevant to MacKay Medical University, which is located in Sanzhi and serves as an academic institution within the northern coastal region. A better understanding of local population characteristics, claims-recorded disease prevalence, and healthcare utilization patterns may help inform community-oriented medical education, service-learning initiatives, and future population health research. Such efforts align with the principle of social accountability in medical education, which emphasizes the responsibility of medical schools to identify and respond to the priority health concerns of the communities they serve [15,18]. Future individual-level studies could also incorporate standardized care-related measures, such as nursing complexity, to better characterize patient care needs and healthcare resource utilization that may not be fully captured by conventional administrative claims data [26].
Several limitations should be considered when interpreting these findings. First, although direct age standardization was performed using nine age groups and a common NHIRD-derived standard population, the disease prevalence comparisons were not additionally adjusted for sex, socioeconomic status, disease severity, institutional residence, healthcare accessibility, healthcare-seeking behavior, diagnostic intensity, or other demographic and regional characteristics. Consequently, residual confounding and differences in claims-based disease ascertainment may remain. The observed prevalence differences therefore cannot be interpreted as independent effects of geographic location. Second, the healthcare utilization and diagnosis-associated encounter expenditure comparisons were descriptive and were not adjusted for age, sex, disease severity, socioeconomic characteristics, referral patterns, or other healthcare-system factors. Differences in healthcare utilization may reflect variations in underlying health status, healthcare accessibility, healthcare-seeking behavior, diagnostic opportunities, and local referral practices. Similarly, expenditure differences may be influenced by multimorbidity, treatment complexity, and accompanying diagnoses. These comparisons therefore do not establish differences in healthcare need attributable to geographic location and should not be used independently to determine healthcare resource allocation priorities. Third, the available data did not permit a detailed examination of within-region variation or direct assessment of factors underlying regional differences in healthcare utilization. Consequently, potentially important heterogeneity within each study region could not be evaluated. Fourth, healthcare utilization and expenditure comparisons were descriptive and were not accompanied by confidence intervals or formal hypothesis testing. The expenditure analysis relied on aggregated expenditure and patient counts, and individual-level expenditure distributions were unavailable for estimating statistical uncertainty. Consequently, the observed relative ratios, particularly those close to 1.0, should not be interpreted as evidence of statistically significant regional differences. Fifth, the annual ascertainment of comorbidities used to calculate the Charlson Comorbidity Index may have influenced the estimated comorbidity burden. Because CCI conditions were identified using diagnoses recorded within each calendar year, without carrying forward previously documented chronic conditions, annual mean CCI values may underestimate underlying comorbidity burden. Beneficiaries with fewer healthcare encounters had fewer opportunities for relevant diagnoses to be recorded, and those without healthcare encounters could contribute no claims-detected comorbidities. Consequently, temporal changes and regional differences in mean CCI may partly reflect variation in healthcare utilization and diagnostic coding rather than changes in underlying morbidity alone. Longitudinal disease ascertainment incorporating prior-year diagnoses would provide a more robust assessment of chronic comorbidity burden. Sixth, the six CCI disease categories emphasized in the main manuscript were selected post hoc after examination of the descriptive results. This approach introduces a risk of selective emphasis because conditions showing more pronounced or distinctive patterns may be preferentially highlighted. Although complete disease-specific results are provided in the Supplementary Materials, their availability does not fully eliminate the potential influence of post hoc selection on the main narrative. The selected conditions should therefore be regarded as illustrative examples rather than prespecified primary outcomes or a representative summary of all CCI disease categories. These exploratory findings should be interpreted cautiously and considered alongside the full set of descriptive results. Finally, the ecological and descriptive nature of the study does not allow causal inferences to be made from the observed regional differences. Despite these limitations, the study describes seven years of demographic change, claims-recorded chronic disease burden, healthcare utilization, and diagnosis-associated encounter expenditure in northern coastal communities for which such regional information has been limited. The comparison with both neighboring Wan-Jin-Shi and other nonremote areas of New Taipei City provides context for interpreting the patterns observed in Sanzhi.
5. Conclusions
Between 2018 and 2024, Sanzhi and neighboring Wan-Jin-Shi experienced substantial population aging, while patterns of claims-recorded comorbidity, claims-recorded disease prevalence, healthcare utilization, and diagnosis-associated encounter expenditure varied across regions and disease categories. Annual mean claims-derived CCI showed different temporal patterns across the study regions, with broadly similar overall patterns observed in the sensitivity analysis restricted to healthcare users. Age standardization attenuated several crude regional differences in disease prevalence, highlighting the importance of population age structure in geographic comparisons.
The detailed analyses of six post hoc selected CCI disease categories illustrated heterogeneous patterns but should not be considered representative of all evaluated conditions. Although healthcare utilization and diagnosis-associated encounter expenditure also varied across regions, these comparisons were not adjusted for important demographic, clinical, and healthcare-system factors and cannot establish independent geographic effects, unmet healthcare needs, or disease-attributable economic burden. Taken together, these findings identify regional patterns that may inform further investigation and healthcare planning, but they do not provide definitive evidence of disease-specific healthcare needs. Further individual-level studies incorporating longitudinal disease ascertainment and adjustment for demographic, socioeconomic, clinical, and healthcare-access characteristics are needed to clarify the observed differences and their implications for healthcare planning.
Supplementary Materials
The following supporting information can be downloaded at: https://www.mdpi.com/article/10.3390/healthcare14223924/s1, Table S1: Coding Detail; Table S2. Geographic composition of the study regions; Table S3. Relative outpatient visits and inpatient admissions per patient in Sanzhi compared with other nonremote areas of New Taipei City in 2024; Figure S1. 17 diseases’ crude and age-standardized PRs; Figure S2. Sensitivity analysis of annual mean claims-derived Charlson Comorbidity Index among all beneficiaries and healthcare users, 2018–2024.
Author Contributions
Data curation, formal analysis, investigation, methodology, and writing: M.-M.C. and C.-H.C. Formal analysis and investigation: M.-M.C., C.-H.C. and C.-S.L. All authors have read and agreed to the published version of the manuscript.
Funding
This work was supported by the Mackay Medical University (Sanzhi, Taiwan; grant nos. MMU-RD-115-1E-P001) to Ching-Hu Chung.
Institutional Review Board Statement
The study protocol was approved by the Institutional Review Board of MacKay Memorial Hospital, Taiwan (Protocol No. 24MMHIS150e; approval date: 7 May 2024).
Informed Consent Statement
Not applicable. This study used secondary data from Taiwan’s National Health Insurance Research Database (NHIRD), which contain no personally identifiable information.
Data Availability Statement
The data underlying this study belong to the National Health Insurance Research Database (NHIRD) of Taiwan and cannot be made publicly available due to legal restrictions. However, the data are available through a formal application to the Health and Welfare Data Science Centre at the Ministry of Health and Welfare, Taiwan (https://dep.mohw.gov.tw/DOS/np-2500-113.html (accessed on 10 December 2024)), and require a signed affirmation regarding data confidentiality. The authors have no special privilege of access to the database.
Conflicts of Interest
The authors declare no conflicts of interest.
Abbreviations
The following abbreviations are used in this manuscript:
| CCI | Charlson Comorbidity Index |
| NHIRD | National Health Insurance Research Database |
References
- Marengoni, A.; Angleman, S.; Melis, R.; Mangialasche, F.; Karp, A.; Garmen, A.; Meinow, B.; Fratiglioni, L. Aging with multimorbidity: A systematic review of the literature. Ageing Res. Rev. 2011, 10, 430–439. [Google Scholar] [CrossRef] [Scilit] [PubMed]
- Barnett, K.; Mercer, S.W.; Norbury, M.; Watt, G.; Wyke, S.; Guthrie, B. Epidemiology of multimorbidity and implications for health care, research, and medical education: A cross-sectional study. Lancet 2012, 380, 37–43. [Google Scholar] [CrossRef] [Scilit] [PubMed]
- Violan, C.; Foguet-Boreu, Q.; Flores-Mateo, G.; Salisbury, C.; Blom, J.; Freitag, M.; Glynn, L.; Muth, C.; Valderas, J.M. Prevalence, determinants and patterns of multimorbidity in primary care: A systematic review of observational studies. PLoS ONE 2014, 9, e102149. [Google Scholar] [CrossRef] [Scilit] [PubMed]
- Chatzopoulos, G.S.; Wolff, L.F. The Independent and Combined Associations of Multimorbidity and Polypharmacy on Periodontal Disease Severity and Progression in Older Adults. J. Clin. Exp. Dent. 2026, 18, e982–e989. [Google Scholar] [CrossRef] [Scilit] [PubMed]
- Subashi, B.; Kamberi, F.; Kokalla, E. Multiple Chronic Conditions and Multimorbidity Among Older Adults in Southern Albania: Distribution and Impact on Care Needs, Medication Adherence, and Quality of Life. Healthcare 2026, 14, 2058. [Google Scholar] [CrossRef] [Scilit] [PubMed]
- Weng, Y.; Wang, D.; Ma, Q.; Ye, W.; Wang, P.; Wang, X.; Zhang, Y.; Zhang, P.; Xu, Y. The association between treatment burden and quality of life in older adults with multimorbidity: The mediating role of personal mastery and the moderating role of social support-a cross-sectional study in China. Front. Public Health 2026, 14, 1859774. [Google Scholar] [CrossRef] [Scilit] [PubMed]
- Sundararajan, V.; Henderson, T.; Perry, C.; Muggivan, A.; Quan, H.; Ghali, W.A. New ICD-10 version of the Charlson comorbidity index predicted in-hospital mortality. J. Clin. Epidemiol. 2004, 57, 1288–1294. [Google Scholar] [CrossRef] [Scilit] [PubMed]
- Quan, H.; Sundararajan, V.; Halfon, P.; Fong, A.; Burnand, B.; Luthi, J.C.; Saunders, L.D.; Beck, C.A.; Feasby, T.E.; Ghali, W.A. Coding algorithms for defining comorbidities in ICD-9-CM and ICD-10 administrative data. Med. Care 2005, 43, 1130–1139. [Google Scholar] [CrossRef] [Scilit] [PubMed]
- Quan, H.; Li, B.; Couris, C.M.; Fushimi, K.; Graham, P.; Hider, P.; Januel, J.M.; Sundararajan, V. Updating and validating the Charlson comorbidity index and score for risk adjustment in hospital discharge abstracts using data from 6 countries. Am. J. Epidemiol. 2011, 173, 676–682. [Google Scholar] [CrossRef] [Scilit] [PubMed]
- Lin, L.Y.; Warren-Gash, C.; Smeeth, L.; Chen, P.C. Data resource profile: The National Health Insurance Research Database (NHIRD). Epidemiol. Health 2018, 40, e2018062. [Google Scholar] [CrossRef] [Scilit] [PubMed]
- Hsieh, C.Y.; Su, C.C.; Shao, S.C.; Sung, S.F.; Lin, S.J.; Kao Yang, Y.H.; Lai, E.C. Taiwan’s National Health Insurance Research Database: Past and future. Clin. Epidemiol. 2019, 11, 349–358. [Google Scholar] [CrossRef] [Scilit] [PubMed]
- Tai, S.Y.; He, J.S.; Kuo, C.T.; Kawachi, I. Urban-Rural Disparities in the Incidence of Diabetes-Related Complications in Taiwan: A Propensity Score Matching Analysis. J. Clin. Med. 2020, 9, 3012. [Google Scholar] [CrossRef] [Scilit] [PubMed]
- Wu, Y.L.; Wu, Y.C.; Akhmetzhanov, A.R.; Wu, M.Y.; Lin, Y.F.; Lin, C.C. Urban-rural health disparity among patients with chronic kidney disease: A cross-sectional community-based study from 2012 to 2019. BMJ Open 2024, 14, e082959. [Google Scholar] [CrossRef] [Scilit] [PubMed]
- Cheng, B.R.; Chang, H.T.; Lin, M.H.; Chen, T.J.; Chou, L.F.; Hwang, S.J. Rural-urban disparities in family physician practice patterns: A nationwide survey in Taiwan. Int. J. Health Plan. Manag. 2019, 34, e464–e473. [Google Scholar] [CrossRef] [Scilit] [PubMed]
- Rourke, J. Social Accountability: A Framework for Medical Schools to Improve the Health of the Populations They Serve. Acad. Med. 2018, 93, 1120–1124. [Google Scholar] [CrossRef] [Scilit] [PubMed]
- Stokes, J.; Bower, P.; Guthrie, B.; Mercer, S.W.; Rice, N.; Ryan, A.M.; Sutton, M. Cuts to local government spending, multimorbidity and health-related quality of life: A longitudinal ecological study in England. Lancet Reg. Health Eur. 2022, 19, 100436. [Google Scholar] [CrossRef] [Scilit] [PubMed]
- Zheng, C.; MacRae, C.; Rowley-Abel, L.; Arakelyan, S.; Abubakar, E.; Dibben, C.; Guthrie, B.; Marshall, A.; Pearce, J. The impact of place on multimorbidity: A systematic scoping review. Soc. Sci. Med. 2024, 361, 117379. [Google Scholar] [CrossRef] [Scilit] [PubMed]
- Boelen, C.; Pearson, D.; Kaufman, A.; Rourke, J.; Woollard, R.; Marsh, D.C.; Gibbs, T. Producing a socially accountable medical school: AMEE Guide No. 109. Med. Teach. 2016, 38, 1078–1091. [Google Scholar] [CrossRef] [Scilit] [PubMed]
- Seo, M.J.; Nam, J.Y. Association between park accessibility and multimorbidity in Korean older adults: A cross-sectional study. Osong Public Health Res. Perspect. 2026; Epub ahead of print. [CrossRef] [Scilit] [PubMed]
- Simoyan, O.M.; Townsend, J.M.; Tarafder, M.R.; DeJoseph, D.; Stark, R.J.; White, M.V. Public health and medical education: A natural alliance for a new regional medical school. Am. J. Prev. Med. 2011, 41, S220–S227. [Google Scholar] [CrossRef] [Scilit] [PubMed]
- GBD 2019 Diseases and Injuries Collaborators. Global burden of 369 diseases and injuries in 204 countries and territories, 1990-2019: A systematic analysis for the Global Burden of Disease Study 2019. Lancet 2020, 396, 1204–1222. [Google Scholar] [CrossRef] [PubMed]
- Kuo, R.N.; Lai, M.S. The influence of socio-economic status and multimorbidity patterns on healthcare costs: A six-year follow-up under a universal healthcare system. Int. J. Equity Health 2013, 12, 69. [Google Scholar] [CrossRef] [Scilit] [PubMed]
- Wallace, E.; Salisbury, C.; Guthrie, B.; Lewis, C.; Fahey, T.; Smith, S.M. Managing patients with multimorbidity in primary care. BMJ 2015, 350, h176. [Google Scholar] [CrossRef] [Scilit] [PubMed]
- Bahler, C.; Huber, C.A.; Brungger, B.; Reich, O. Multimorbidity, health care utilization and costs in an elderly community-dwelling population: A claims data based observational study. BMC Health Serv. Res. 2015, 15, 23. [Google Scholar] [CrossRef] [Scilit] [PubMed]
- Xu, X.; Mishra, G.D.; Jones, M. Evidence on multimorbidity from definition to intervention: An overview of systematic reviews. Ageing Res. Rev. 2017, 37, 53–68. [Google Scholar] [CrossRef] [Scilit] [PubMed]
- Cesare, M.; Gray, R.; Cocchieri, A. Stop Silencing Nursing Complexity: Why Standardized Nursing Terminologies Must Be Heard. Nurs. Rep. 2026, 16, 28. [Google Scholar] [CrossRef] [Scilit] [PubMed]

Disclaimer/Publisher’s Note: The statements, opinions and data contained in all publications are solely those of the individual author(s) and contributor(s) and not of MDPI and/or the editor(s). MDPI and/or the editor(s) disclaim responsibility for any injury to people or property resulting from any ideas, methods, instructions or products referred to in the content. |
© 2026 by the authors. Licensee MDPI, Basel, Switzerland. This article is an open access article distributed under the terms and conditions of the Creative Commons Attribution (CC BY) license.