1. Introduction
Massive open online courses (MOOCs) have greatly increased access to higher education and provide flexible learning opportunities for different groups of learners (
Brahimi & Sarirete, 2015). Previous studies have shown that learners’ clickstream behaviors, such as video interactions, can be effectively used to predict learning outcomes and identify at-risk students in MOOCs (
C.-H. Yu et al., 2019). However, dropout rates are still high (
Hone & El Said, 2016;
Xing et al., 2019), making it difficult to achieve inclusive and long-term online learning. In recent years, learning analytics research has focused more on predicting dropout risk by using large amounts of behavioral data from online platforms.
Most existing studies treat dropout mainly as a classification problem (
Ajibade et al., 2019;
Wehrhahn et al., 2025). Learner behaviors are usually combined within fixed time periods or over the whole course, and models are mostly evaluated using accuracy-based measures. While such approaches support early warning systems, they offer limited insight into how and why disengagement unfolds over time. High predictive accuracy does not necessarily translate into a meaningful understanding of the mechanisms underlying dropout.
Learning in MOOCs is inherently dynamic. The meaning and function of specific behaviors may shift as learners move from the initial orientation to sustained engagement and eventual course completion. However, relatively little research has systematically examined whether the behavioral signatures of dropout remain stable across learning stages or instead evolve over time. Without a stage-sensitive perspective, early warning systems risk treating dropout as a static outcome rather than a developing behavioral process.
To address this gap, the present study reconceptualizes MOOC dropout as a stage-dependent behavioral mechanism. We posit that dropout risk is shaped not only by engagement intensity but also by the evolving configuration of learner behaviors across distinct stages of participation. Specifically, we investigate how behavioral indicators of dropout risk differ across the early, middle, and late phases of a course and how explainable learning analytics can illuminate the mechanisms driving these shifts.
Based on the KDDCUP2015 MOOC dataset, we constructed phased behavioral characteristics at three key time points (Week 1, Week 3, and Week 5) and utilized interpretable models and techniques to identify stable and dynamic patterns related to continuous learning and dropout behaviors. The aim of this study is to examine how dropout-related learning behaviors change across different stages of MOOC learning and to explain the behavioral mechanisms underlying these changes through interpretable learning analytics. Specifically, this study seeks to identify the key behavioral predictors of dropout at different stages, analyze how the effects and interactions of these behaviors evolve over time, and provide evidence for the design of more stage-sensitive and practically meaningful early warning methods. To achieve this aim, the study focuses mainly on the following three research questions:
At different stages, which learning behaviors are the main predictors of dropout?
How do the effects and interrelationships of these behaviors evolve over time?
How can the findings on phased behavioral patterns support the design of more precise and practically meaningful early warning methods?
This study views dropout as a dynamic evolution process of learning participation patterns rather than merely a simple decline in activity levels. This perspective helps to construct a clearer, more interpretable, and practically valuable learning analysis framework.
The structure of this paper is as follows:
Section 2 reviews related research work,
Section 3 introduces the research methods,
Section 4 presents the empirical results,
Section 5 discusses the theoretical and practical significance, and
Section 6 concludes the study.
2. Literature Review
2.1. Prediction Modeling for MOOC Dropout
Over the past decade, massive open online courses (MOOCs) have evolved from experimental online learning platforms to a widely adopted educational model, attracting millions of learners worldwide (
Goshtasbpour et al., 2024). Early research on MOOCs was often concerned with openness, scalability, and learner participation, focusing on how large-scale online learning environments could broaden access to education and how learners engaged with course resources, activities, and peer interaction (
Liyanagunawardena et al., 2013;
Ahn et al., 2013). Subsequent studies have increasingly examined learner engagement, persistence, retention, and completion patterns, shifting attention from the broad promise of MOOCs to how learners actually participate, continue, or disengage over time (
Ferguson & Clow, 2016;
Jung & Lee, 2018).
However, low completion and high dropout rates have become among the most critical challenges in online education. Dropout often exceeds 80%, and in some cases, it approaches or surpasses 90% (
Zhang et al., 2021). Such high attrition not only limits the effectiveness of online learning initiatives but also raises concerns about learner engagement, resource allocation, and educational equity. These challenges have prompted a growing body of research dedicated to understanding and predicting learner attrition (
J. Chen et al., 2024;
Huang et al., 2023). Accordingly, understanding and predicting dropout is not merely a technical task but also a critical issue for improving the quality and sustainability of online education.
MOOC platforms can generate abundant behavioral data through learner interactions with online environments, providing a foundation for building models to identify students who may drop out (
Romero & Ventura, 2010). Educational data mining techniques have been widely used to predict student performance and identify key factors affecting learning outcomes, enabling early support for at-risk learners (
A. S. Alghamdi & Rahman, 2023). Over the past decade, research in the field of learning analytics has widely adopted various machine learning methods, such as logistic regression, random forests, gradient boosting, and neural networks, to increase the effectiveness of early warning systems (
Asselman et al., 2023;
Badal & Sungkur, 2023). Previous studies have shown that behavioral characteristics such as resource access, video usage, discussion participation, and assignment submission can help distinguish students who complete the course from those who drop out midway (
Liang et al., 2023;
Shou et al., 2024). As predictive performance continues to improve, identifying the risk of dropout has become an important part of early warning systems and personalized support (
R. Yu et al., 2021).
Although many models achieve strong predictive performance, several limitations remain. First, many studies rely on aggregated behavioral features calculated over fixed time windows or the entire course, which makes it difficult to capture how disengagement develops across different learning stages. Second, complex algorithms such as ensemble models and neural networks often function as black-box predictors, providing limited explanations of why particular learners are identified as at risk. Third, model evaluation is frequently centered on overall predictive performance, while less attention is given to whether the results can inform concrete educational interventions (
Afzaal et al., 2021;
S. Alghamdi et al., 2025;
Vecchi, 2026). As a result, existing prediction approaches can identify potential dropouts but often provide insufficient insight into the behavioral mechanisms underlying dropout. This highlights the need for more interpretable and stage-sensitive approaches to understanding dropout.
2.2. Temporal Dynamics of Learner Behaviors
Learning in MOOCs is a gradual process that typically involves different stages, such as initial adaptation, continuous participation, and eventual completion or withdrawal. In recent years, learning analytics research has shifted from static outcome prediction to focusing on the dynamic analysis of the learning process. By examining the evolution of learners’ behaviors over time, the dynamic characteristics of participation status can be captured (
Dai et al., 2025).
Multiple time model studies have shown that learners’ behaviors are not fixed but change in response to changes in course requirements (
Peach et al., 2021;
Boufaida et al., 2025). The early decline in participation may be related to difficulties in forming regular participation habits, whereas later dropout may be associated with changes in motivation, learning strategies, or academic burden.
Even with these advancements, there is still a limited amount of in-depth research on whether the behaviors related to dropping out remain stable or undergo structural changes at various stages. Most modeling studies focus on predicting dropout at earlier time points rather than exploring how different behaviors combine and interact within the course of education (
Alhazbi, 2026). Therefore, the research field of stage-based dropout mechanisms has not been fully explored.
2.3. Engagement Configuration and Behavioral Balance
Engagement is not only related to time but also widely regarded as a multidimensional concept that encompasses behavioral, cognitive, and social aspects (
Reeve et al., 2025). In the online learning environment, engagement involves various types of activities, such as content usage, navigation browsing, problem-solving, and interactions with others (
Kwan et al., 2025). Behavioral patterns refer to the coordinated structure and distribution of multiple learning behaviors rather than isolated behavioral frequencies. In this study, we also use the term “behavioral configuration” to describe how these patterns are organized across learning stages.
Previous studies often regarded a higher level of activity as a sign of greater engagement and lower dropout risk (
Althibyani, 2024). Recent research on self-regulated learning and learning strategies indicates that the quality and balance of participation are equally important (
Hu et al., 2025). Effective learning typically relies on coordinated participation in different types of activities rather than merely a high frequency of investment in a single activity form. From this perspective, dropping out of the course is caused not only by reduced activity levels but also by unbalanced participation patterns that are unable to support continuous learning. Current empirical studies that examine how the structure of behaviors and their interactions are related to dropout risk across learning stages are still limited (
Rizwan et al., 2025).
Building on this multidimensional view of engagement, online learning participation can be further understood as a behavioral configuration rather than as a collection of isolated activity counts. In self-regulated learning, learners are expected to monitor, regulate, and coordinate different learning actions in relation to task demands and course progression (
Xu et al., 2023). This implies that effective participation in MOOCs depends not only on whether learners are active but also on whether their activities are distributed and coordinated across key learning functions such as accessing resources, watching instructional videos, completing tasks, and maintaining interaction with the learning environment. When participation becomes concentrated in only one or a few activity types while others remain weak, learners may appear active at the surface level but still lack the behavioral support needed for sustained course participation. From this perspective, engagement should be interpreted as the structural organization of learning behaviors, not merely as cumulative activity intensity.
This configuration-oriented view is especially relevant for understanding MOOC dropout because attrition is not always preceded by uniformly low activity. Prior research suggests that learners may continue certain visible forms of participation—such as video watching or limited navigation—while showing declining coordination across other behaviors that support progression through the course (
Kizilcec et al., 2013). In such cases, dropout risk may be associated with misaligned or imbalanced behavioral patterns rather than with the absence of activity alone. Examining interactions among behavioral indicators therefore has theoretical value: it allows dropout to be interpreted as a change in how learning behaviors are combined across stages, instead of being reduced to a single threshold of activity level. This also provides a conceptual basis for stage-sensitive analysis, since the behavioral combinations required for continued participation may differ across early orientation, mid-course task engagement, and late-stage completion pressures (
Peach et al., 2021). Accordingly, modeling behavioral interactions is not only a technical extension of prediction research but also a theoretically grounded way to examine how engagement, as reflected in behavioral patterns, evolves across stages and when such patterns become dropout-related.
2.4. Research Gaps and Study Motivation
Despite substantial progress in MOOC dropout prediction (
Wen & Juan, 2024), existing research still does not fully explain dropout from the engagement-configuration perspective outlined above. A large body of work has demonstrated that behavioral logs can support accurate dropout prediction and that temporal variation in learner participation is being increasingly recognized (
J. Chen et al., 2024;
Huang et al., 2023). However, much of this literature still treats dropout mainly as a prediction outcome and evaluates models primarily in terms of overall classification performance. As a result, the theoretical question of why particular behavioral combinations become risky at specific points in the learning process remains insufficiently addressed.
Two interrelated gaps are especially important. First, although MOOC learning is inherently processual, many studies continue to rely on aggregated behavioral features calculated over fixed time windows or across entire courses. This limits the understanding of whether the behavioral indicators associated with dropout remain stable or change systematically across learning stages. Without stage-sensitive analysis, early warning research risks assuming that the same behavioral signals carry the same meaning throughout the course, even though the engagement-configuration perspective suggests that the functional role of behaviors may shift over time.
Second, even when multiple behavioral features are included in prediction models, they are often entered as independent predictors. Relatively less attention has been given to how the coordination, balance, and interaction among behaviors jointly shape dropout risk (
Rizwan et al., 2025). This is theoretically consequential because, as discussed in
Section 2.3, dropout may reflect not only lower participation intensity but also imbalanced or misaligned participation patterns. Models that do not examine behavioral interactions may achieve high predictive accuracy but offer limited insight into the mechanisms through which disengagement unfolds.
These gaps have direct implications for early warning research. If dropout is associated with changing behavioral configurations, then effective identification of at-risk learners requires methods that are both stage sensitive and interpretable. Stage-sensitive modeling is needed to determine when particular behaviors become most informative, whereas interpretable analysis is needed to clarify how combinations of behaviors—not just their individual frequencies—contribute to risk. The present study is motivated by these limitations. Rather than treating dropout as a static classification target, it examines MOOC dropout as a stage-dependent behavioral process in which engagement is reflected in the evolving coordination of multiple learning behaviors. By integrating stage-based behavioral construction with interpretable learning analytics, the study aims to move from predicting who may drop out to explaining how dropout-related behavioral patterns emerge, change, and interact across the early, middle, and late phases of course participation.
2.5. Research Focus
On the basis of the identified research gaps, this study focuses on explaining MOOC dropout as a stage-sensitive behavioral process rather than as a static prediction outcome. Unlike prior studies that primarily emphasize predictive performance based on aggregated behavioral data, this research shifts the focus toward explaining how and why dropout risk evolves across different learning stages. Specifically, the study examines the interaction and coordination of multiple behavioral indicators rather than treating them as independent predictors.
To further clarify the research objectives, the following hypotheses are proposed:
H1. The importance ranking of learning behaviors related to dropping out varies at different learning stages.
H2. From the early stage to the middle and later stages of learning, the learning behaviors that serve as the main predictors of dropping out are different. The relative importance of behavioral predictors changes systematically from the early to the middle and late stages.
The main contributions of this study are threefold. First, it provides a stage-sensitive perspective on MOOC dropout by examining whether the predictive role of learning behaviors changes across different learning stages. Second, it introduces a behavioral configuration perspective, emphasizing that dropout risk may be associated not only with activity intensity but also with the balance and coordination among different forms of participation. Third, it integrates interpretable learning analytics techniques to examine the behavioral mechanisms underlying dropout prediction, thereby offering insights that may support more targeted early warning and intervention strategies.
With respect to this research focus, this study aims to bridge the gap between predictive modeling and theoretical understanding, offering a more comprehensive explanation of dropout in MOOCs.
3. Methodology
3.1. Dataset and Behavior Construction Based on Stages
This study utilized the publicly available KDDCUP2015 MOOC dataset, which was released for the task of dropout prediction in online courses. The dataset was collected from XuetangX, a large-scale MOOC platform, and contains fine-grained behavioral logs from 39 anonymized online courses. According to the course date file, each course in the dataset lasted approximately one month, with a 30-day course period. The original dataset includes several files, such as enrollment_train.csv, log_train.csv, truth_train.csv, object.csv, and date.csv. These files provide information about learner-course enrollment records, timestamped learning activities, dropout labels, course objects, and course time spans.
The dataset was selected for three main reasons. First, it is a publicly available and widely used benchmark dataset for MOOC dropout prediction, which supports the reproducibility and comparability of the study. Second, it contains timestamped behavioral logs across multiple online courses, making it suitable for constructing stage-based behavioral representations. Third, it provides both behavioral event records and dropout labels, which allows this study to examine not only whether learners are likely to drop out but also how different behavioral indicators contribute to dropout risk across different observation windows. Therefore, the KDDCUP2015 MOOC dataset is well aligned with the purpose of this study, which is to investigate stage-sensitive and interpretable behavioral patterns related to MOOC dropout.
After preprocessing and stage-based behavior construction, 96,408 learner-course enrollment records were retained for analysis. Among them, 76,477 records were labeled as dropout cases, and 19,931 records were labeled as nondropout cases. The dataset was then divided into a training set and a test set using an 8:2 ratio, resulting in 77,126 training records and 19,282 test records. The same enrollment records were used across the three observation windows to ensure that the comparisons among stages were not caused by changes in sample composition. In this study, Week 1, Week 3, and Week 5 refer to cumulative behavioral observation windows, in which learners’ behavioral activities were aggregated up to the corresponding observation point. These observation windows were used to predict final course-level dropout status rather than to indicate dropout events occurring exactly during Week 1, Week 3, or Week 5.
To investigate the changes in learning participation patterns at different stages, this study aggregated the behavioral data at three key time points: the first week (early stage), the third week (middle stage), and the fifth week (late stage). These three time points correspond to different stages of learning participation—the initial adaptation period, the continuous participation period, and the learning stage before the end of the course—facilitating the comparative analysis of behavioral patterns at different stages. At each stage, the frequency of occurrence of seven types of behaviors (problem, video, access, wiki, discussion, navigate, and page_close) by the learners was separately determined. Missing behavior types are assigned a value of 0; thus, the behavior data of each learner at each stage are represented as a 1 × 7 frequency vector. Specifically, assuming that there are a total of
N learners, the behavior frequency vector of the
n-th learner in the
m-th week is expressed as
, where
m ∈ {1, 3, 5} and
n ∈ {1, 2,…,
N}. The behavior data of all the learners at a certain time node can be organized as
.
Table 1 lists the specific attribute information of these seven behaviors.
By constructing stage-specific behavioral representations, the study enables direct comparison of how dropout-related signals evolve across different phases of learning.
3.2. Robust Feature Identification Strategy
Instead of using a single feature selection method, several filter-based methods are used to improve robustness and reduce bias from a specific method. These methods reflect different selection principles, including information gain (IG) (
Reddy & Chittineni, 2025), the Fisher score (FS) (
Bijoy et al., 2025), correlation attribute evaluation (CAE) (
Hall, 1999), relief attribute evaluation (RAE) (
Sharif et al., 2025), and variable importance in projection (VIP) (
Wold et al., 1984).
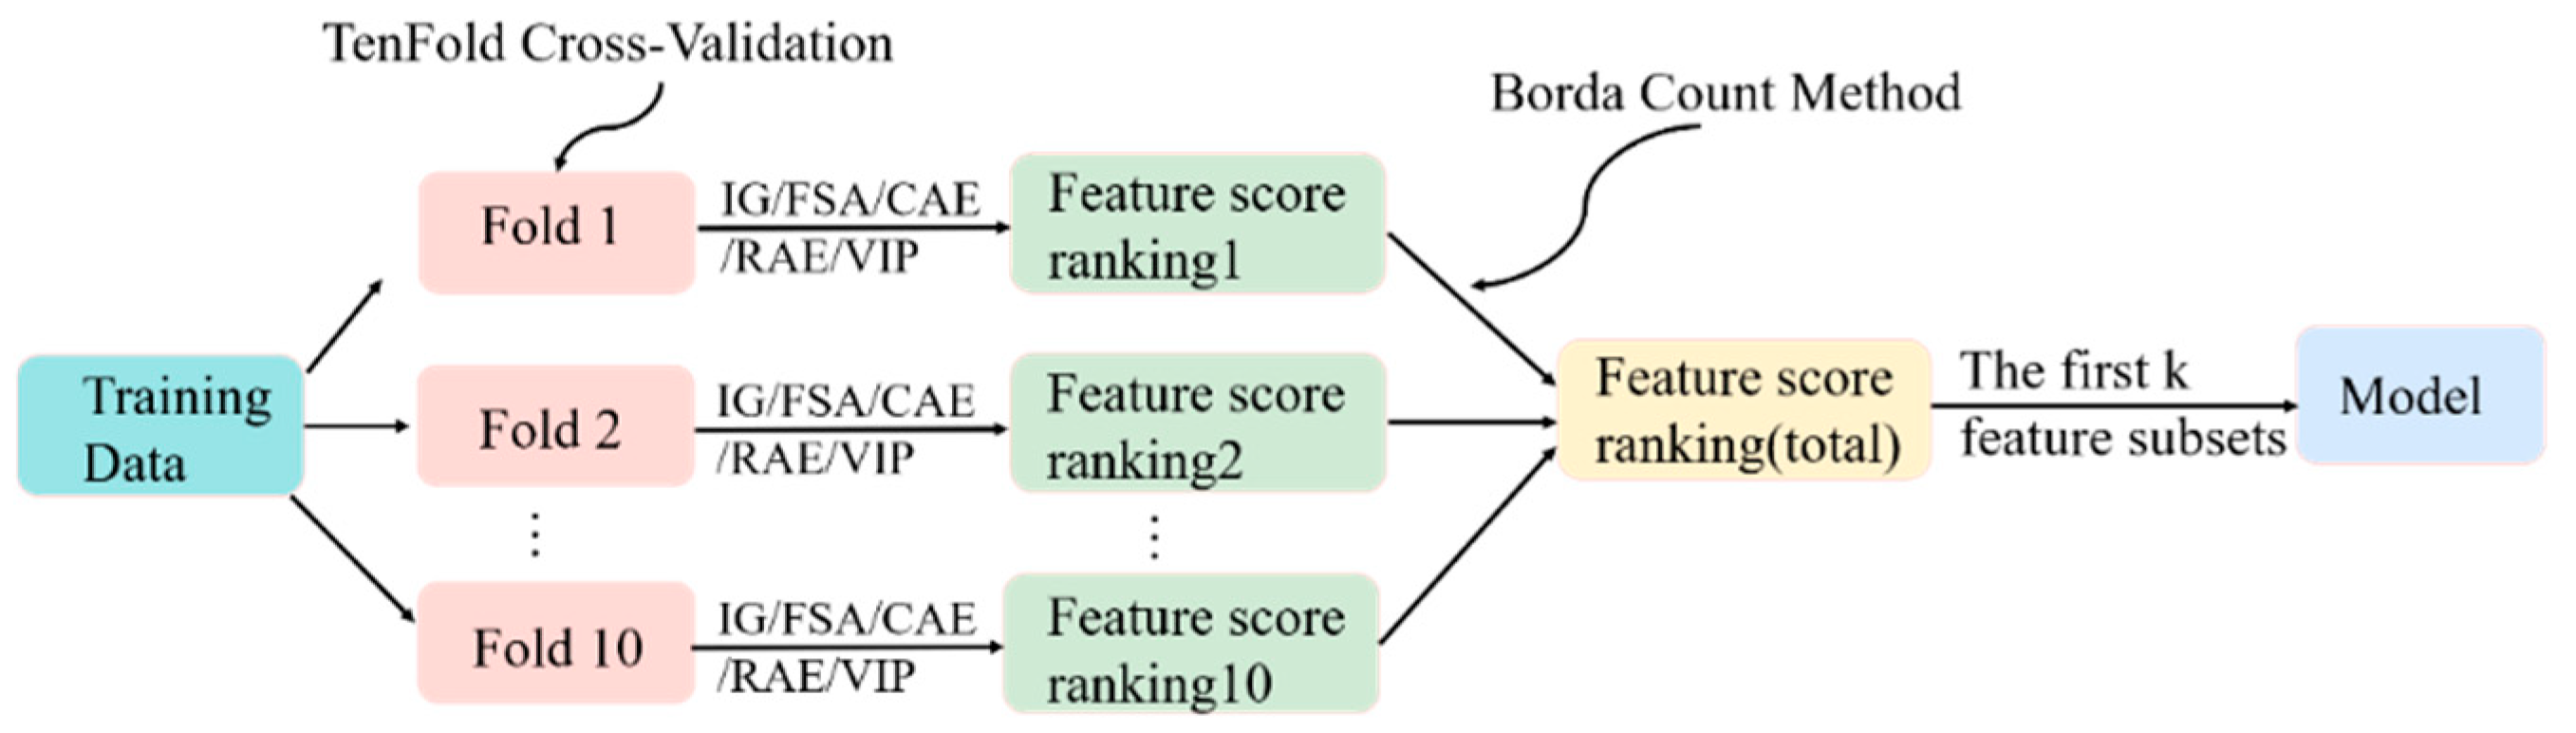
To ensure stability, feature selection was embedded within a tenfold cross-validation framework, and rankings from different folds were aggregated using the Borda count (
Bertolini et al., 2021) method. This strategy aims to identify consistently informative behavioral features rather than optimizing performance for a single data split. The overall process is illustrated in
Figure 1.
As shown in
Figure 1. First, in each fold of the training set of tenfold cross-validation, the feature selection algorithm is used to score the importance of all the features and generate a feature ranking list accordingly. The ranking of each fold is considered a “vote”, reflecting the importance of each feature of the compromise. Second, the ten compromised rankings are aggregated, the ranking scores for each feature are summed, and the global consensus ranking is obtained via the Borda counting method. Finally, we selected the top 1–7 features to form the feature subset, which was used as the input of the subsequent modeling evaluation.
3.3. Modeling and Interpretability Framework
Four supervised classifiers were used as benchmark models in this study: logistic regression (LR) (
Ahmed & Sorour, 2024), elastic net regularized generalized linear model (GLMNET) (
Zou & Hastie, 2005), random forest (RF) (
Iranzad & Liu, 2025), and XGBoost (
T. Chen & Guestrin, 2016). These models represent different modeling characteristics. LR provides a simple and interpretable linear baseline. The GLMNET extends the LR by introducing elastic net regularization, which helps reduce overfitting and handle correlated predictors. RF represents an ensemble tree-based model that can capture nonlinear relationships among behavioral features. XGBoost is a gradient boosting model that is widely used for tabular prediction tasks and often provides strong predictive performance. LR demonstrated consistently stable performance and was selected for interpretability analysis.
The performance of the model is measured by accuracy, precision, recall, and F1 score, which are widely used in machine learning and can comprehensively reflect the classification effect from multiple dimensions (
Cui et al., 2006). In this study, the F1 score was used as the primary metric for model comparison because it balances precision and recall. Recall was also given particular attention because dropout prediction is closely related to early warning, where failing to identify at-risk learners may lead to missed opportunities for intervention. The dataset was randomly divided into training and testing sets at an 8:2 ratio. To address class imbalance and avoid information leakage, the synthetic minority oversampling technique (SMOTE) (
Chawla et al., 2002) was applied only to the training set.
To elucidate the behavioral mechanisms underlying dropout predictions, multiple explainable artificial intelligence (XAI) techniques were applied, including feature importance (FI) (
Chandrashekar & Sahin, 2014), permutation importance (PI) (
Fisher et al., 2019), partial dependence plots (PDPs) (
Greenwell et al., 2018), and SHAP value analysis (
Lundberg & Lee, 2017). FI was used to estimate the relative contribution of each selected behavioral feature in the classification model. PI was used to examine the change in model performance after each feature was randomly permutated, thereby assessing the dependence of the model on that feature. PDPs were used to visualize how changes in a pair of features influence the predicted probability of dropout. SHAP values were used to examine the direction and magnitude of feature contributions at both the global and individual prediction levels. These techniques can complement each other at both the global and local levels, explaining how behavioral characteristics affect the risk of dropping out.
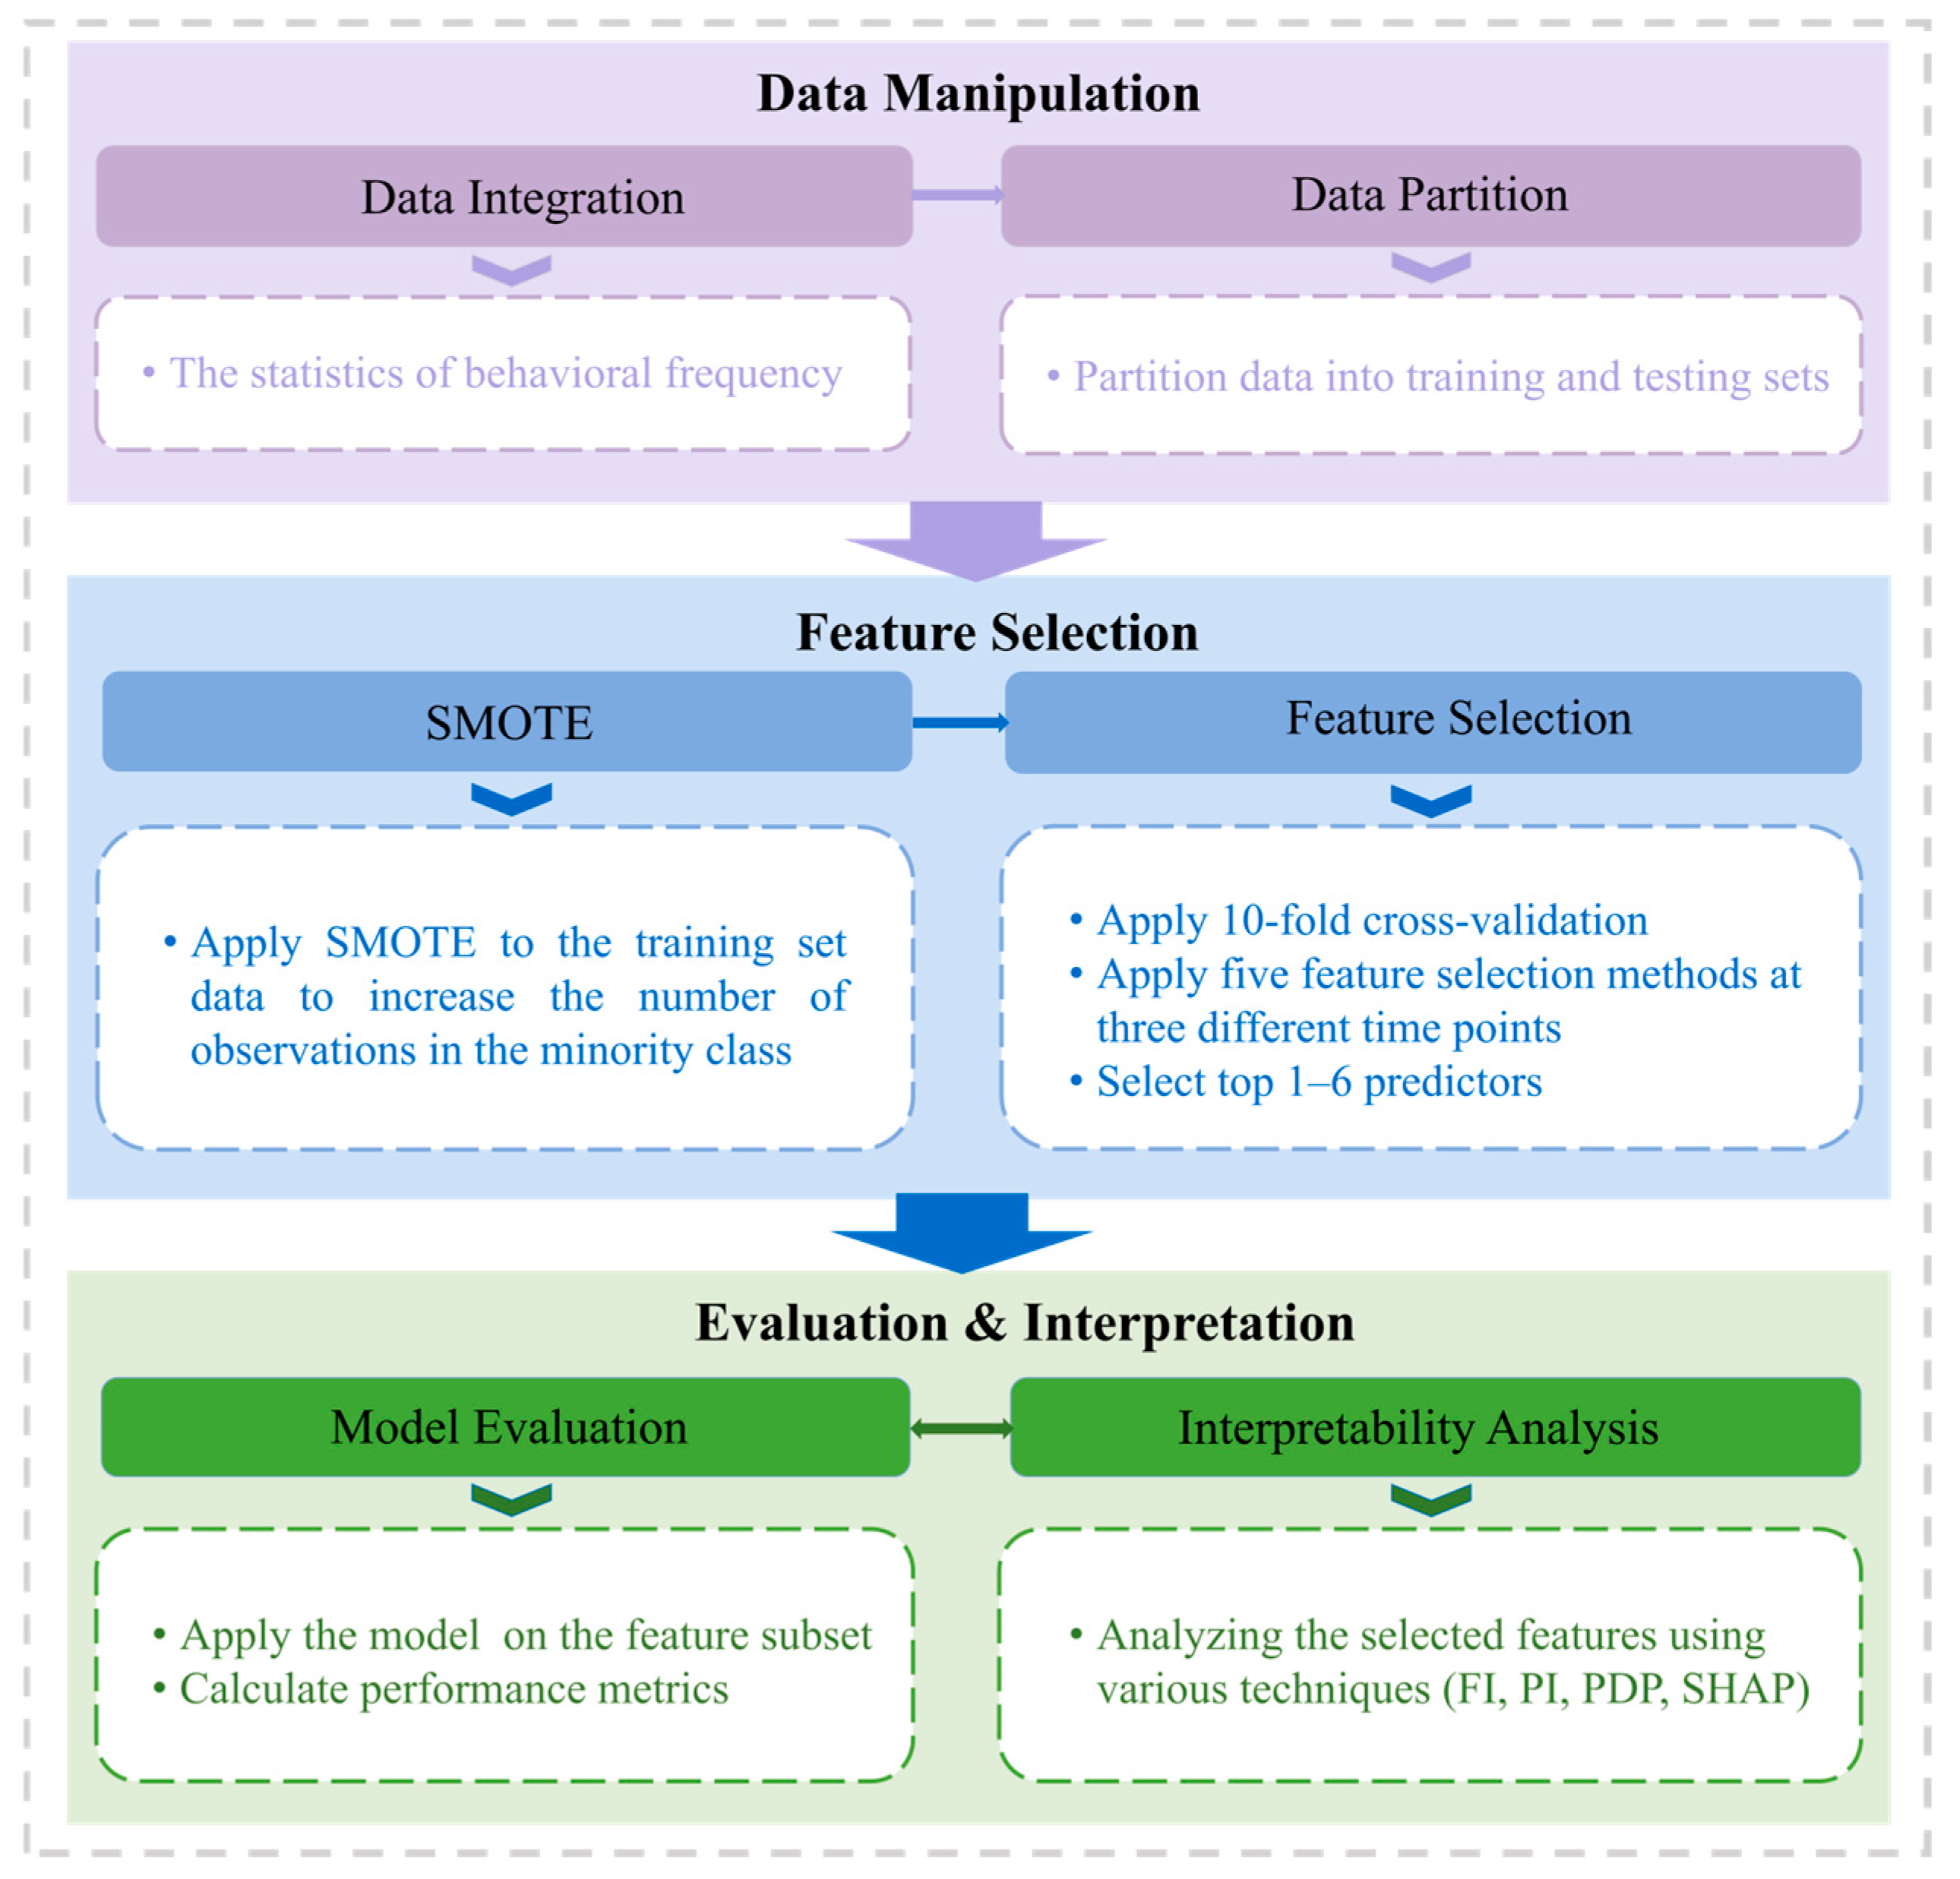
The overall analysis process is shown in
Figure 2 and includes three main stages.
The first stage is stage-based behavioral construction. Raw MOOC learning logs are combined to calculate the frequency of different learner activities and to construct behavioral feature representations for each student. To represent changes in engagement over time, behavioral data are arranged at three key learning stages (Weeks 1, 3, and 5). These stages were used to represent the early, middle, and late phases of course participation.
The second stage is robust feature identification. At each learning stage, five feature selection methods are used to measure the importance of the behavioral indicators. To improve the stability of the results, these methods are used within a tenfold cross-validation framework, and the rankings are combined using the Borda count method. This process selects behavioral features that are consistently informative and reduces the effect of sampling variation. At each stage, the top-ranked feature subsets are used for subsequent modeling and analysis.
The third stage involves model evaluation and interpretation of behavioral mechanisms. Using the selected feature subset, multiple classification models are trained and compared. After the primary model and feature selection method were determined, FI, PI, PDPs, and SHAP analysis were applied to examine the importance, direction, and interaction effects of the selected behavioral features. This step links the predictive results with the behavioral interpretation by showing which behaviors are associated with dropout risk and how their effects differ across Weeks 1, 3, and 5.
This framework integrates model evaluation with interpretability analysis: On the one hand, it extracts stable behavioral signals through the prediction model; on the other hand, it clarifies the behavioral mechanisms related to the risk of dropping out through interpretability methods. The two complement each other, forming a complete analysis process covering feature selection, model construction, and mechanism interpretation, which helps to more clearly understand the evolutionary trajectory of learners’ participation status in the course process.
4. Results
4.1. Selection of the Primary Classification Model
To determine the most suitable classification model for MOOC dropout prediction, this study first compared four commonly used classification models, namely, LR, GLMNET, RF, and XGBoost, using the complete set of seven behavioral features at three learning stages. This benchmark comparison was conducted before feature selection to provide a clear basis for selecting the primary classifier. In this study, the F1-score was used as the primary metric for model comparison, as it provides a balanced measure of precision and recall.
As shown in
Table 2, LR achieved the highest F1 score at all three learning stages when the complete set of seven behavioral features was used. Specifically, the F1 scores of the LRs were 85.22%, 88.02%, and 89.07% at weeks 1, 3, and 5, respectively. Although the difference between LR and GLMNET was not large, LR consistently outperformed the other classifiers across all three stages. RF and XGBoost yielded relatively low F1 scores. These results suggest that LR provides stable and competitive predictive performance across different learning stages.
In addition to predictive performance, model interpretability was also an important consideration in this study. Since the purpose of this research is not only to predict dropout but also to explain how behavioral indicators are associated with dropout risk across learning stages, LR provides a suitable balance between predictive performance, simplicity, and interpretability. Therefore, on the basis of the benchmark comparison and the interpretability requirements of this study, LR was selected as the primary classification model for the subsequent feature selection and interpretability analyses.
4.2. Comparison of Feature Selection Under the LR Model
After determining the LR as the primary classification model, different feature selection methods were compared under the LR framework to identify simple and effective behavioral feature subsets. Five feature selection techniques, namely, IG, FS, CAE, RAE, and VIP, were evaluated across the three learning stages. For each feature selection method, feature subsets with different numbers of features were tested, and the subset that achieved the highest F1-score was reported.
Table 3,
Table 4 and
Table 5 summarize the best-performing LR configurations under each feature selection method at Weeks 1, 3, and 5, respectively. Specifically, each table reports the feature subset that yielded the highest F1-score for each feature selection method, together with the corresponding accuracy, recall, precision, and F1-score.
During Week 1 (
Table 3), the performance differences across feature selection methods were relatively small. RAE and VIP achieved the highest observed F1-score of 85.17%, both when the two key features, page_close and access, were selected. These results suggest that a simple feature subset can achieve comparable or slightly better performance than larger feature combinations at the early stage can achieve.
A similar pattern is observed in Week 3 (
Table 4). Compared with Week 1, the overall predictive performance of the LR configurations improves. When the RAE method selects the three-feature combination of page_close, access, and video, LR achieves the highest F1 score of 88.16%. These results suggest that video engagement begins to provide additional predictive information in the middle stage of learning.
The Week 5 results (
Table 5) further show that different feature selection methods produce largely comparable predictive performance. The F1-scores of all the methods fall within a narrow range. The RAE method achieves the highest observed F1-score of 89.26% when page_close, access, and video are selected.
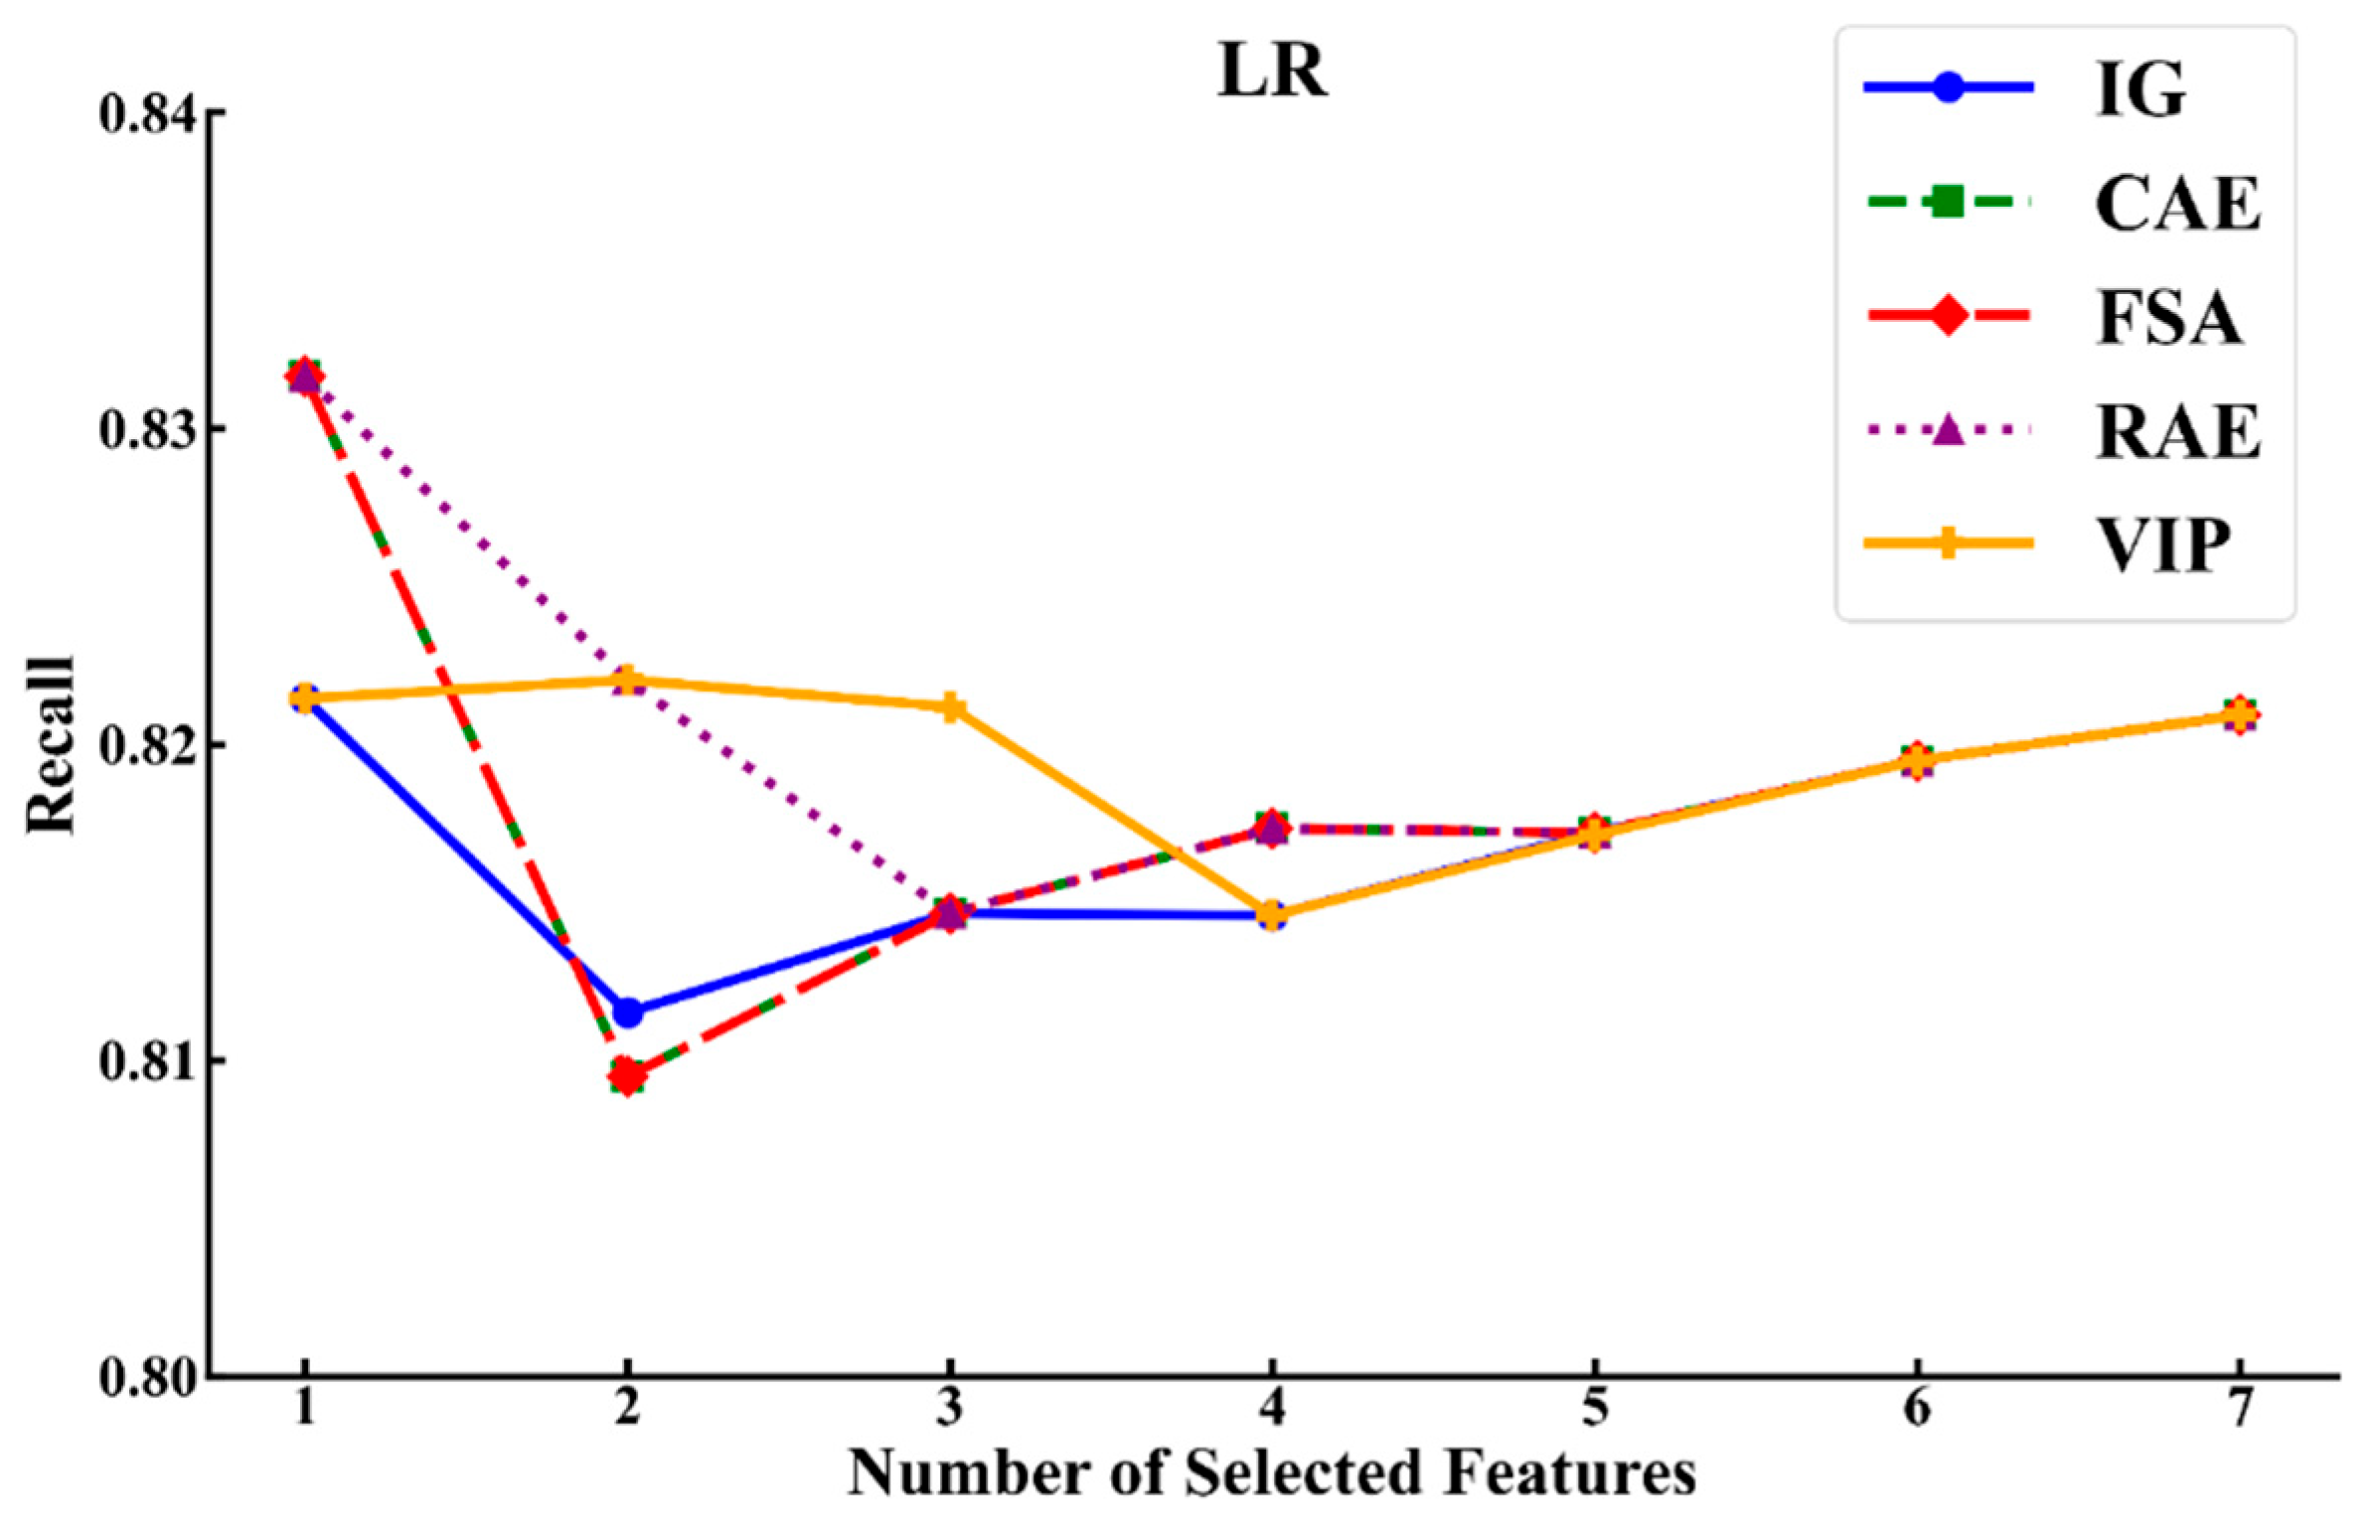
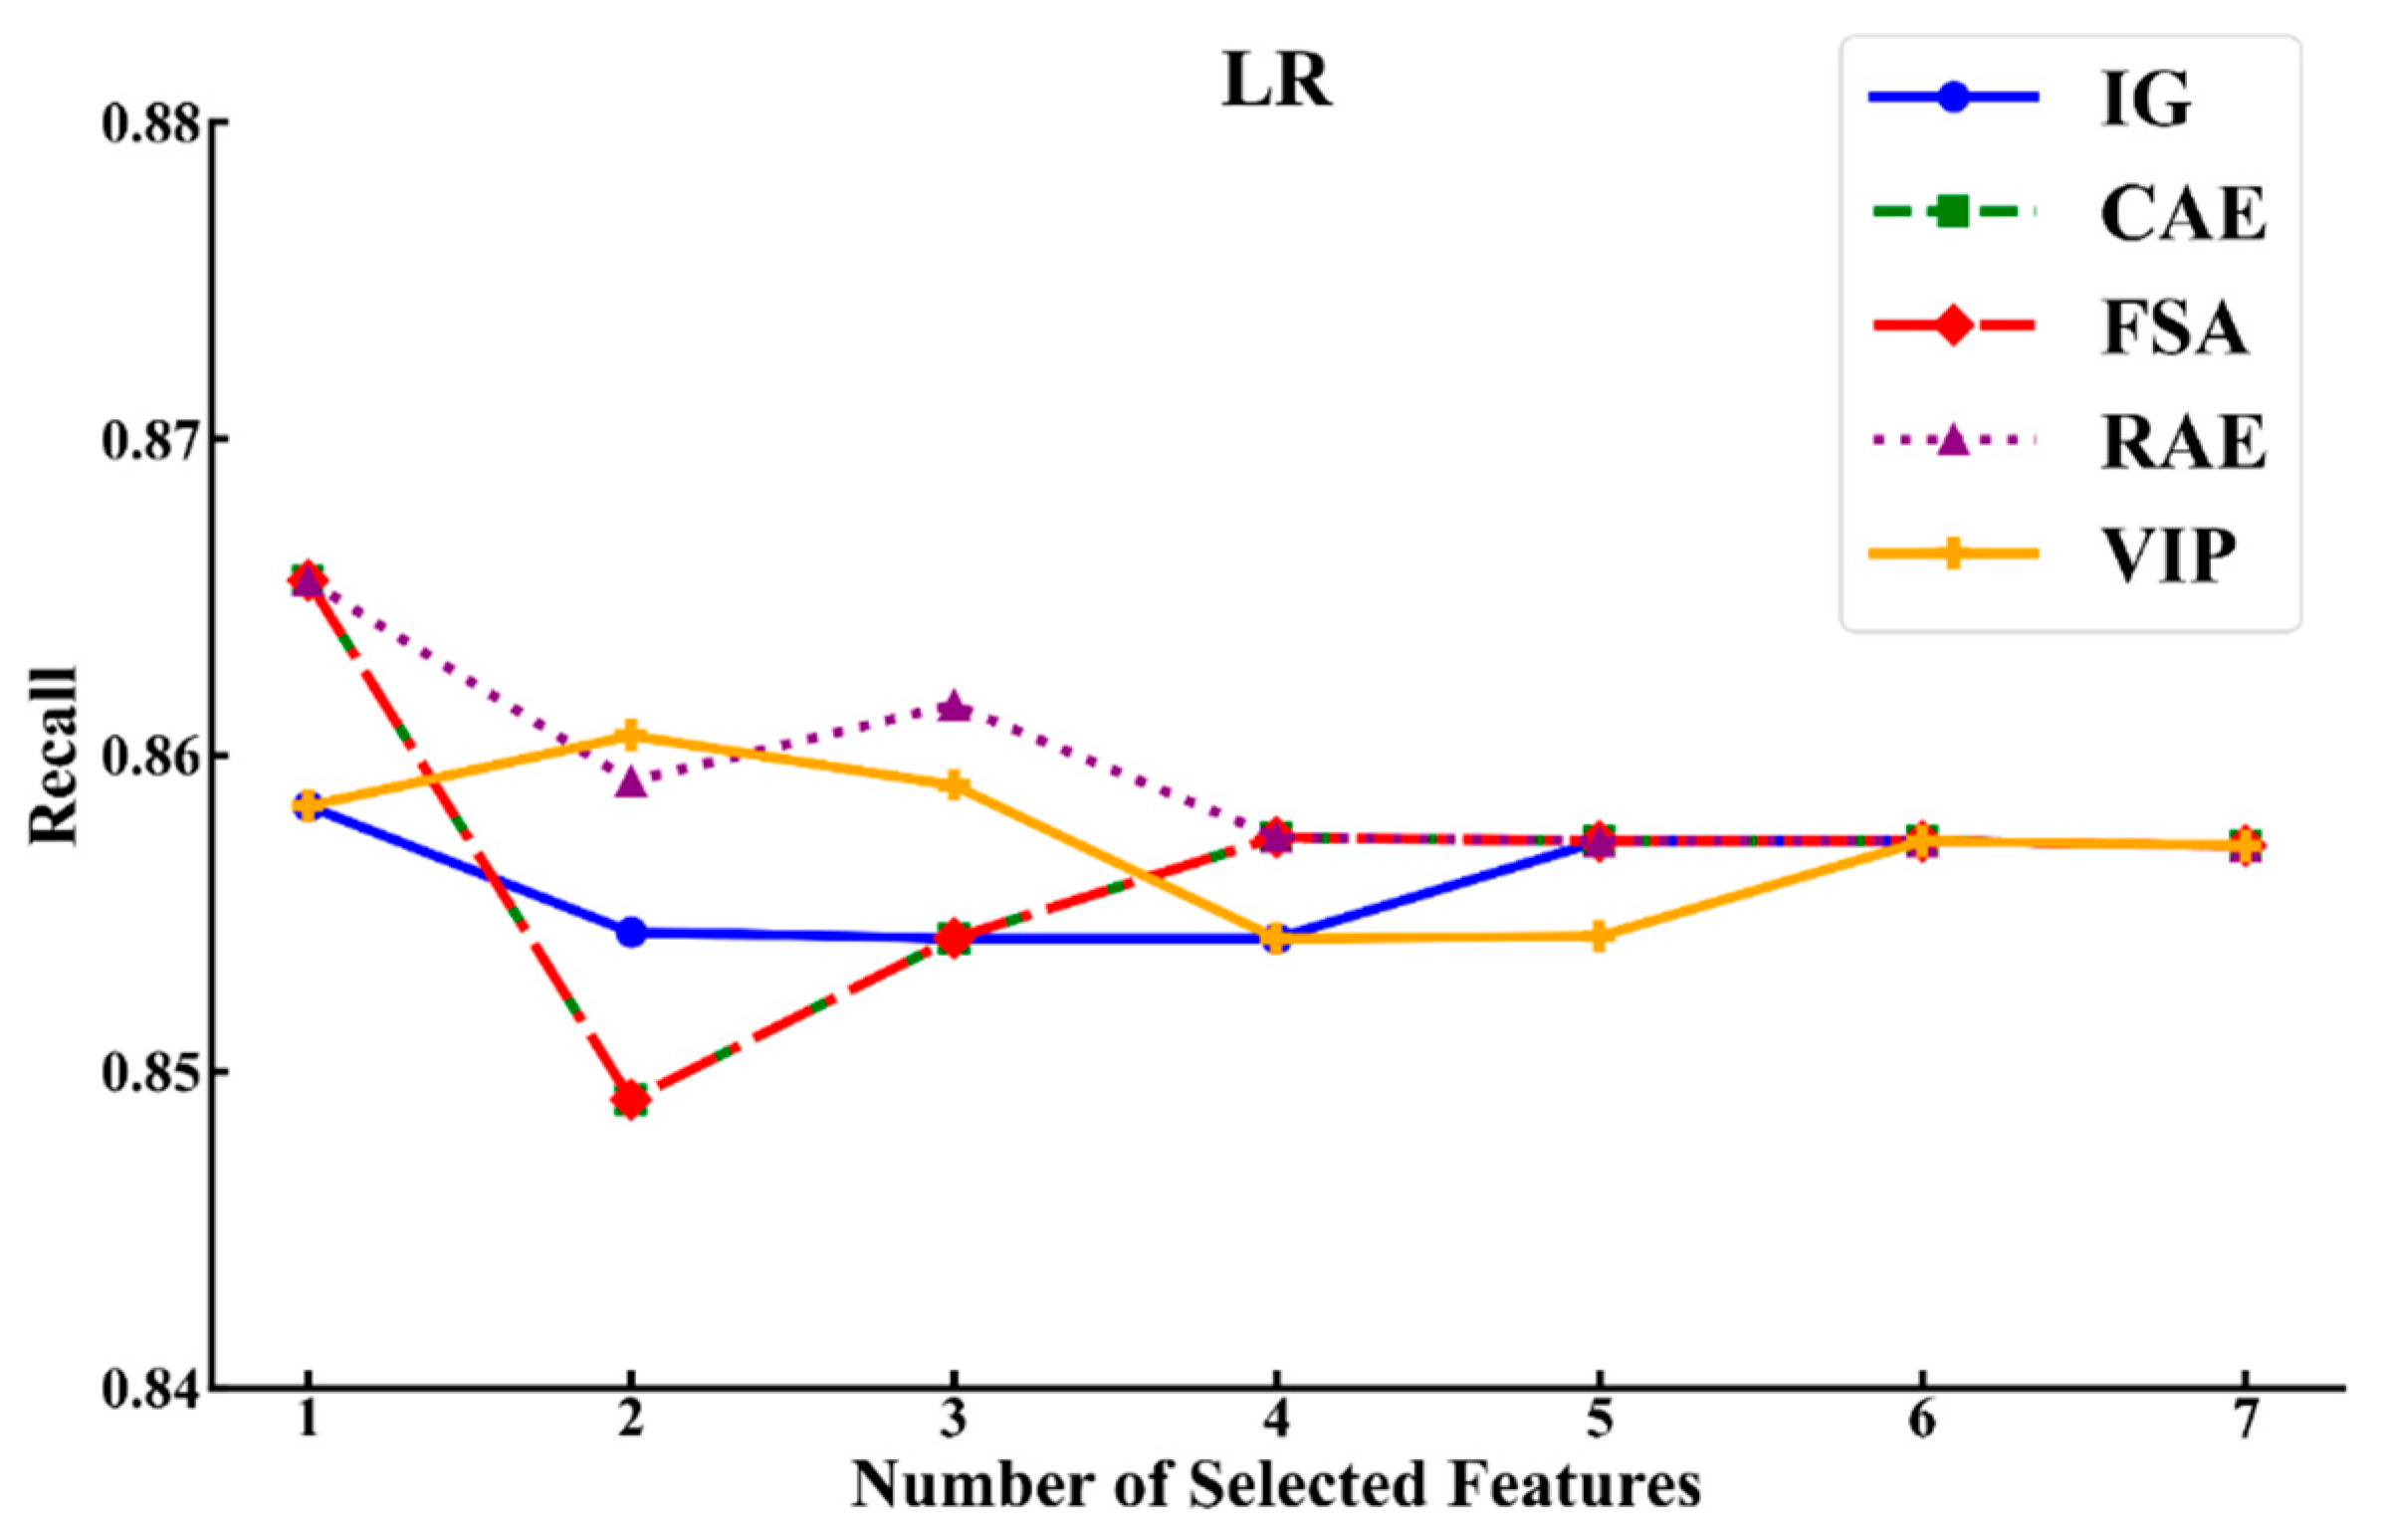
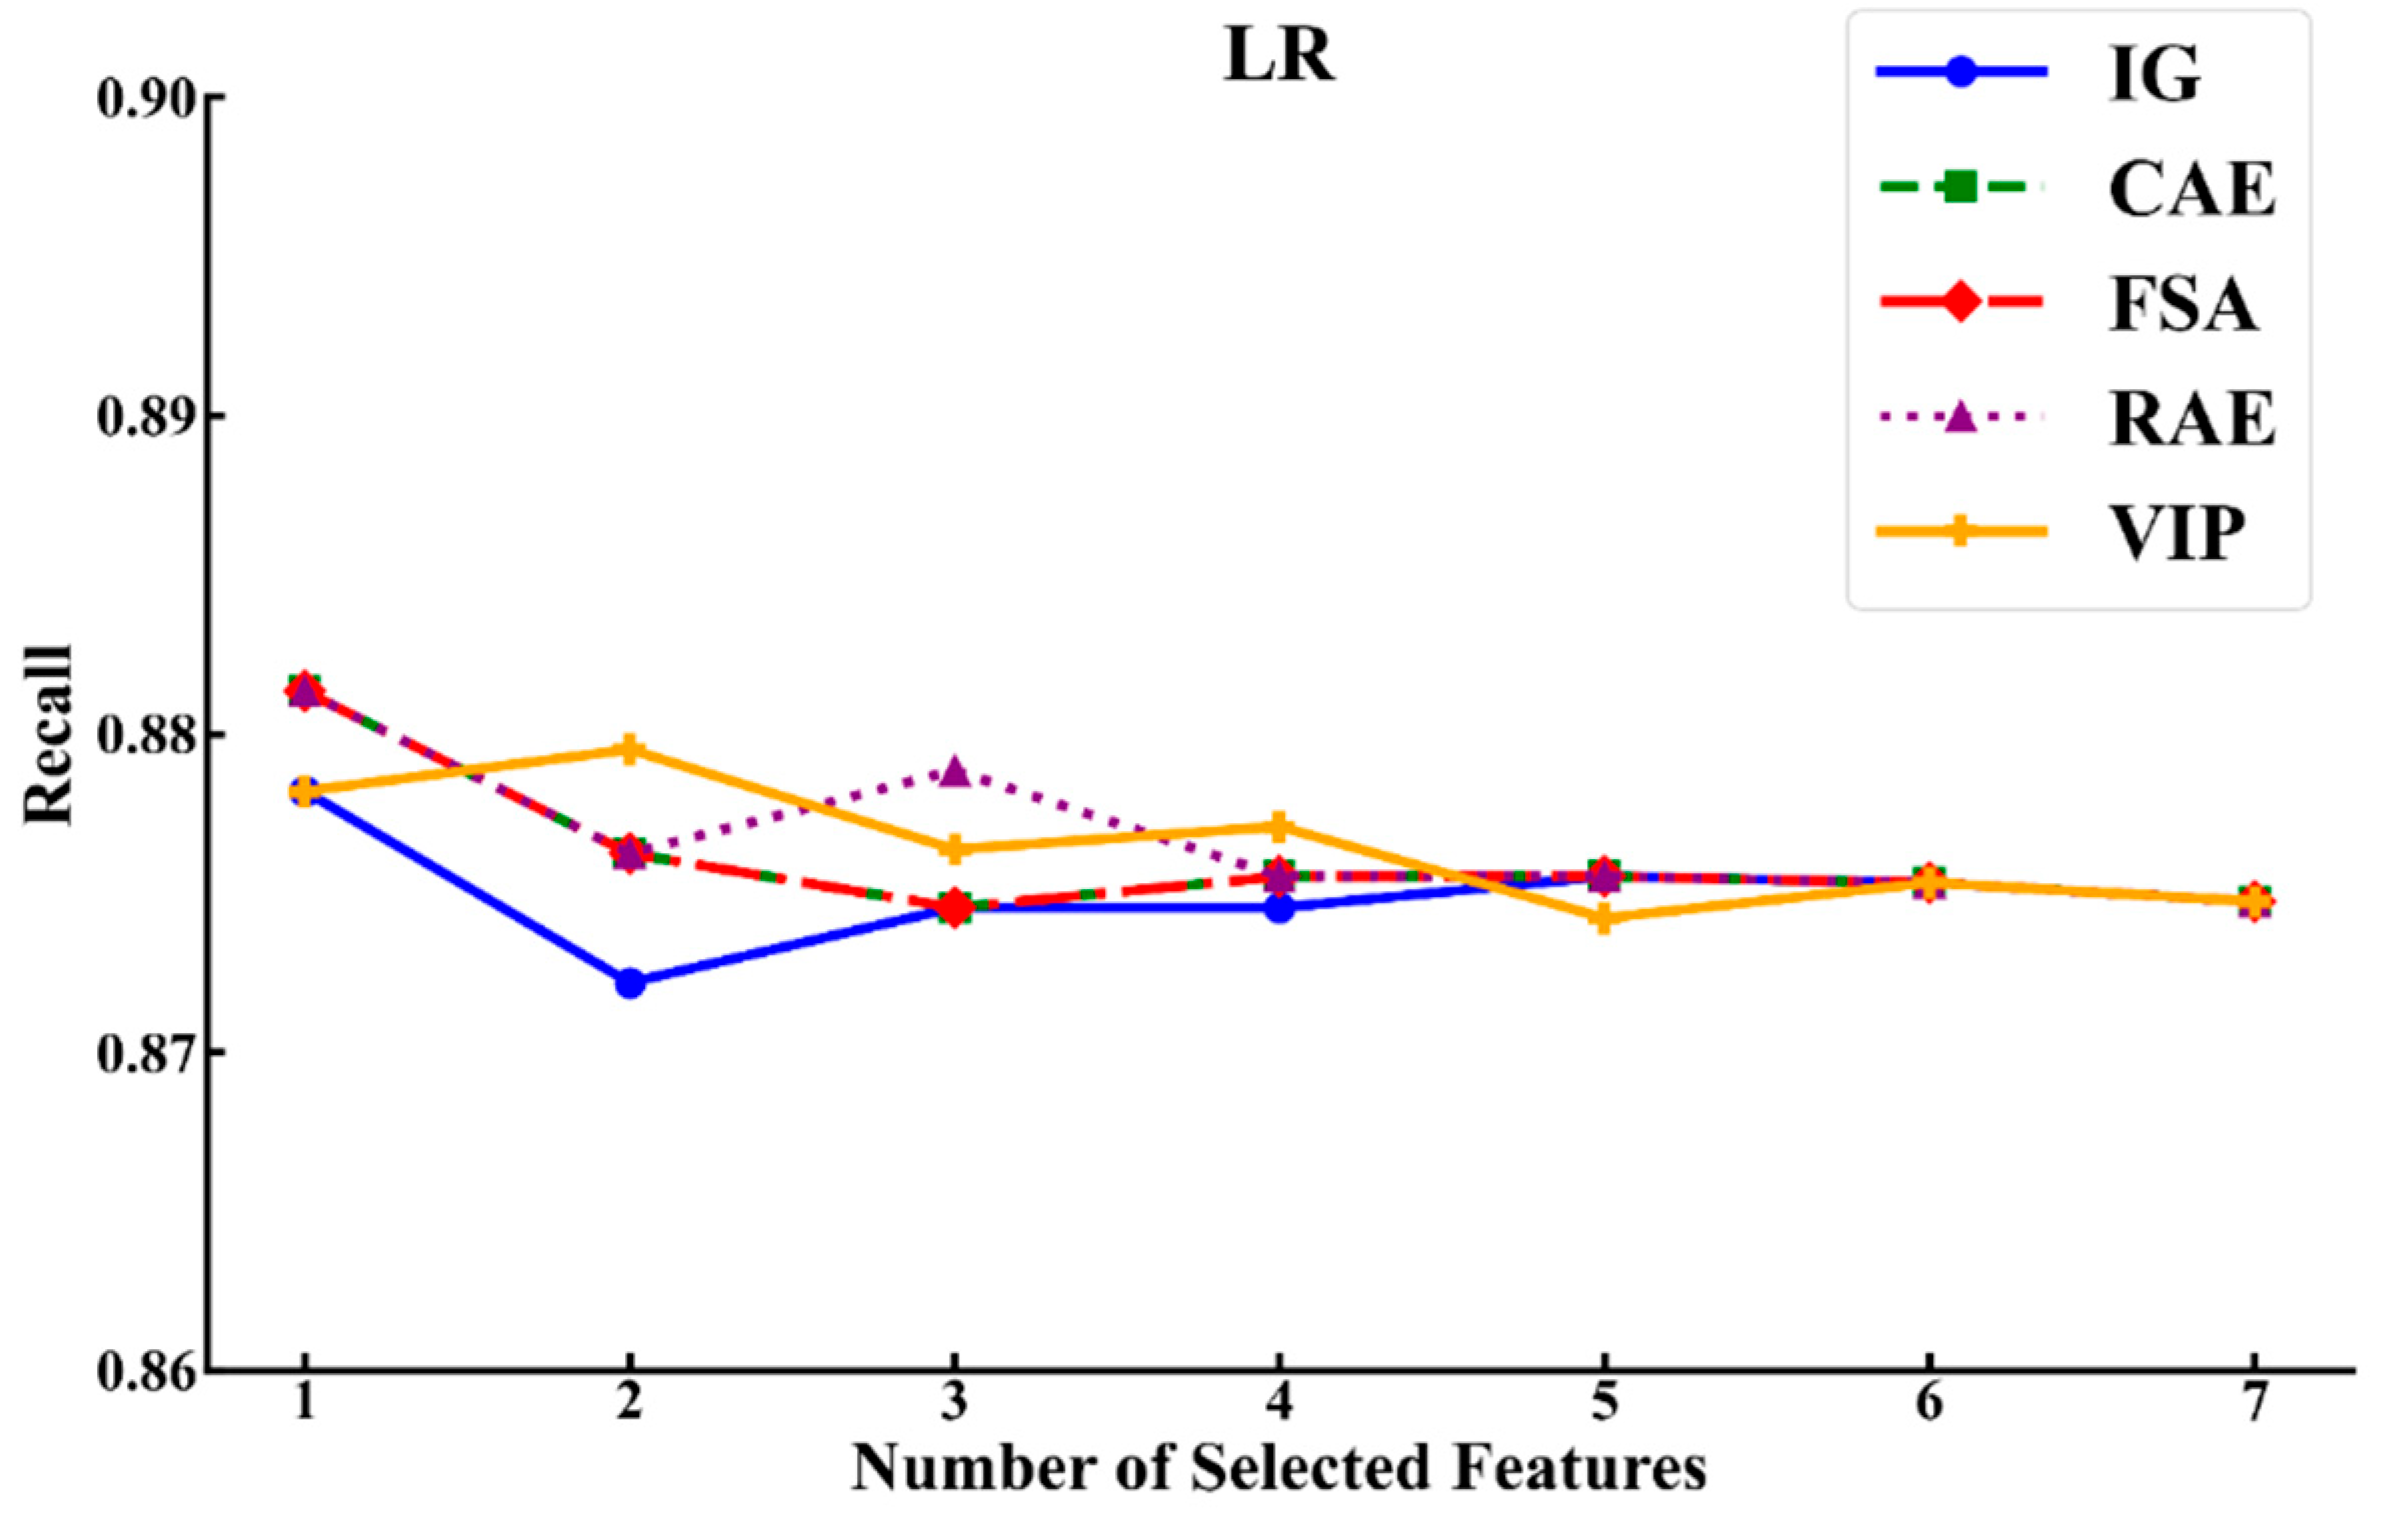
In addition to the F1-based comparison, recall was further examined because it directly reflects the model’s ability to identify genuinely at-risk students. In educational early warning contexts, false negatives may cause at-risk learners to miss timely support, whereas false positives mainly lead to additional intervention costs. Therefore, recall was used as an additional criterion for comparing feature selection methods under the LR framework. The recall curves of the different feature selection methods across the three learning stages are shown in
Figure 3,
Figure 4 and
Figure 5.
The results show that the RAE method generally achieves high recall values when a relatively small number of features are selected. In Week 1, the recall value peaks when two features, page_close and access, are selected using the RAE method. In Weeks 3 and 5, higher recall values are obtained when the three-feature combination of page_close, access, and video is selected. This pattern suggests that video engagement gradually becomes an important behavioral indicator in the middle and late stages.
Overall, the performance differences among the feature selection methods were relatively small, especially at Week 5. However, the RAE consistently identified simple feature subsets that maintained strong predictive performance and high recall across the three learning stages. Specifically, RAE selected page_close and access in Week 1 and page_close, access, and video in Weeks 3 and 5. Considering both performance consistency and feature subset simplicity, the RAE method was adopted for subsequent behavioral analysis.
4.3. Cross-Stage Evolution of Dropout-Related Behaviors
Table 6 summarizes the optimal feature subsets and model performance across the three learning stages. Compared with emphasizing the marginal differences among classifiers, the results point to a consistent pattern of behavioral evolution.
In the first week, dropout risk is characterized primarily by two engagement-related indicators: access and page_close. By the third and fifth weeks, the video also became a key feature, together with page_close and access, forming a stable three-feature combination. This change indicates that the behavior patterns related to dropping out are not fixed but gradually evolve from the basic continuity of interaction to a more differentiated participation structure. The results at each stage show that the LR model using robust feature selection performed stably, indicating that these patterns are derived more from the dynamic changes in the learning process than from the influence of specific models.
To illustrate the cross-stage changes in feature importance,
Table 7 presents the RAE-based rankings of the seven behavioral features in Weeks 1, 3, and 5, ordered from highest to lowest importance (left to right).
As shown in
Table 7, page_close and access are consistently ranked as the two most important features across all three learning stages. In Week 1, the optimal feature subset consists of page_close and access, suggesting that early dropout risk is primarily associated with interaction continuity and resource access. In Weeks 3 and 5, the video rises to the third position and becomes part of the optimal feature subset, forming a stable three-feature combination of page_close, access, and video. This pattern indicates that task-oriented engagement, particularly video interaction, becomes increasingly relevant in the middle and late stages of learning. Overall, the RAE-based rankings reveal a stage-dependent shift in dropout-related behaviors: early dropout risk is associated mainly with basic participation and withdrawal-related behaviors, whereas middle- and late-stage dropout risk increasingly involves engagement with core learning content.
In the early stage, the model relied mainly on exit behaviors (page_close) and exploratory behaviors (access) to identify students at risk of dropping out. These findings suggest that attention retention and initial participation were the most direct predictive indicators. In the middle stage, video learning (video) became a key factor, indicating that the level of participation in core learning tasks is increasingly important for predicting the risk of dropping out. In the late stage, the optimal feature combination still consisted of page_close, access, and video, reflecting that successfully completing the course requires not only continuous resource access and interaction but also a stable investment in core learning tasks.
Overall, the results of feature selection reveal a phased evolution in learning behavior. In the early stage, the focus is primarily on identifying basic participation and withdrawal behaviors. In the middle stage, video learning gains prominence as a key motivational indicator. In the late stage, a pattern emerges that emphasizes continuous access alongside sustained engagement with core learning tasks. These findings lay a solid foundation for subsequent interpretability analysis and visualization research while also helping to identify key time points for instructional intervention.
4.4. Early-Stage Dropout: Interaction Fragility
During the early stage of the course (Week 1), dropout risk was primarily associated with unstable learning interaction behaviors, reflecting whether the learners had established a stable pattern of engagement with the learning environment. In the results of Week 1, the optimal feature selection methods were RAE and VIP, and the optimal feature combination was page_close and access. To explain why this combination performed well, this study conducted an interpretability analysis within the framework of the LR model, covering FI, PI, and SHAP summary plots.
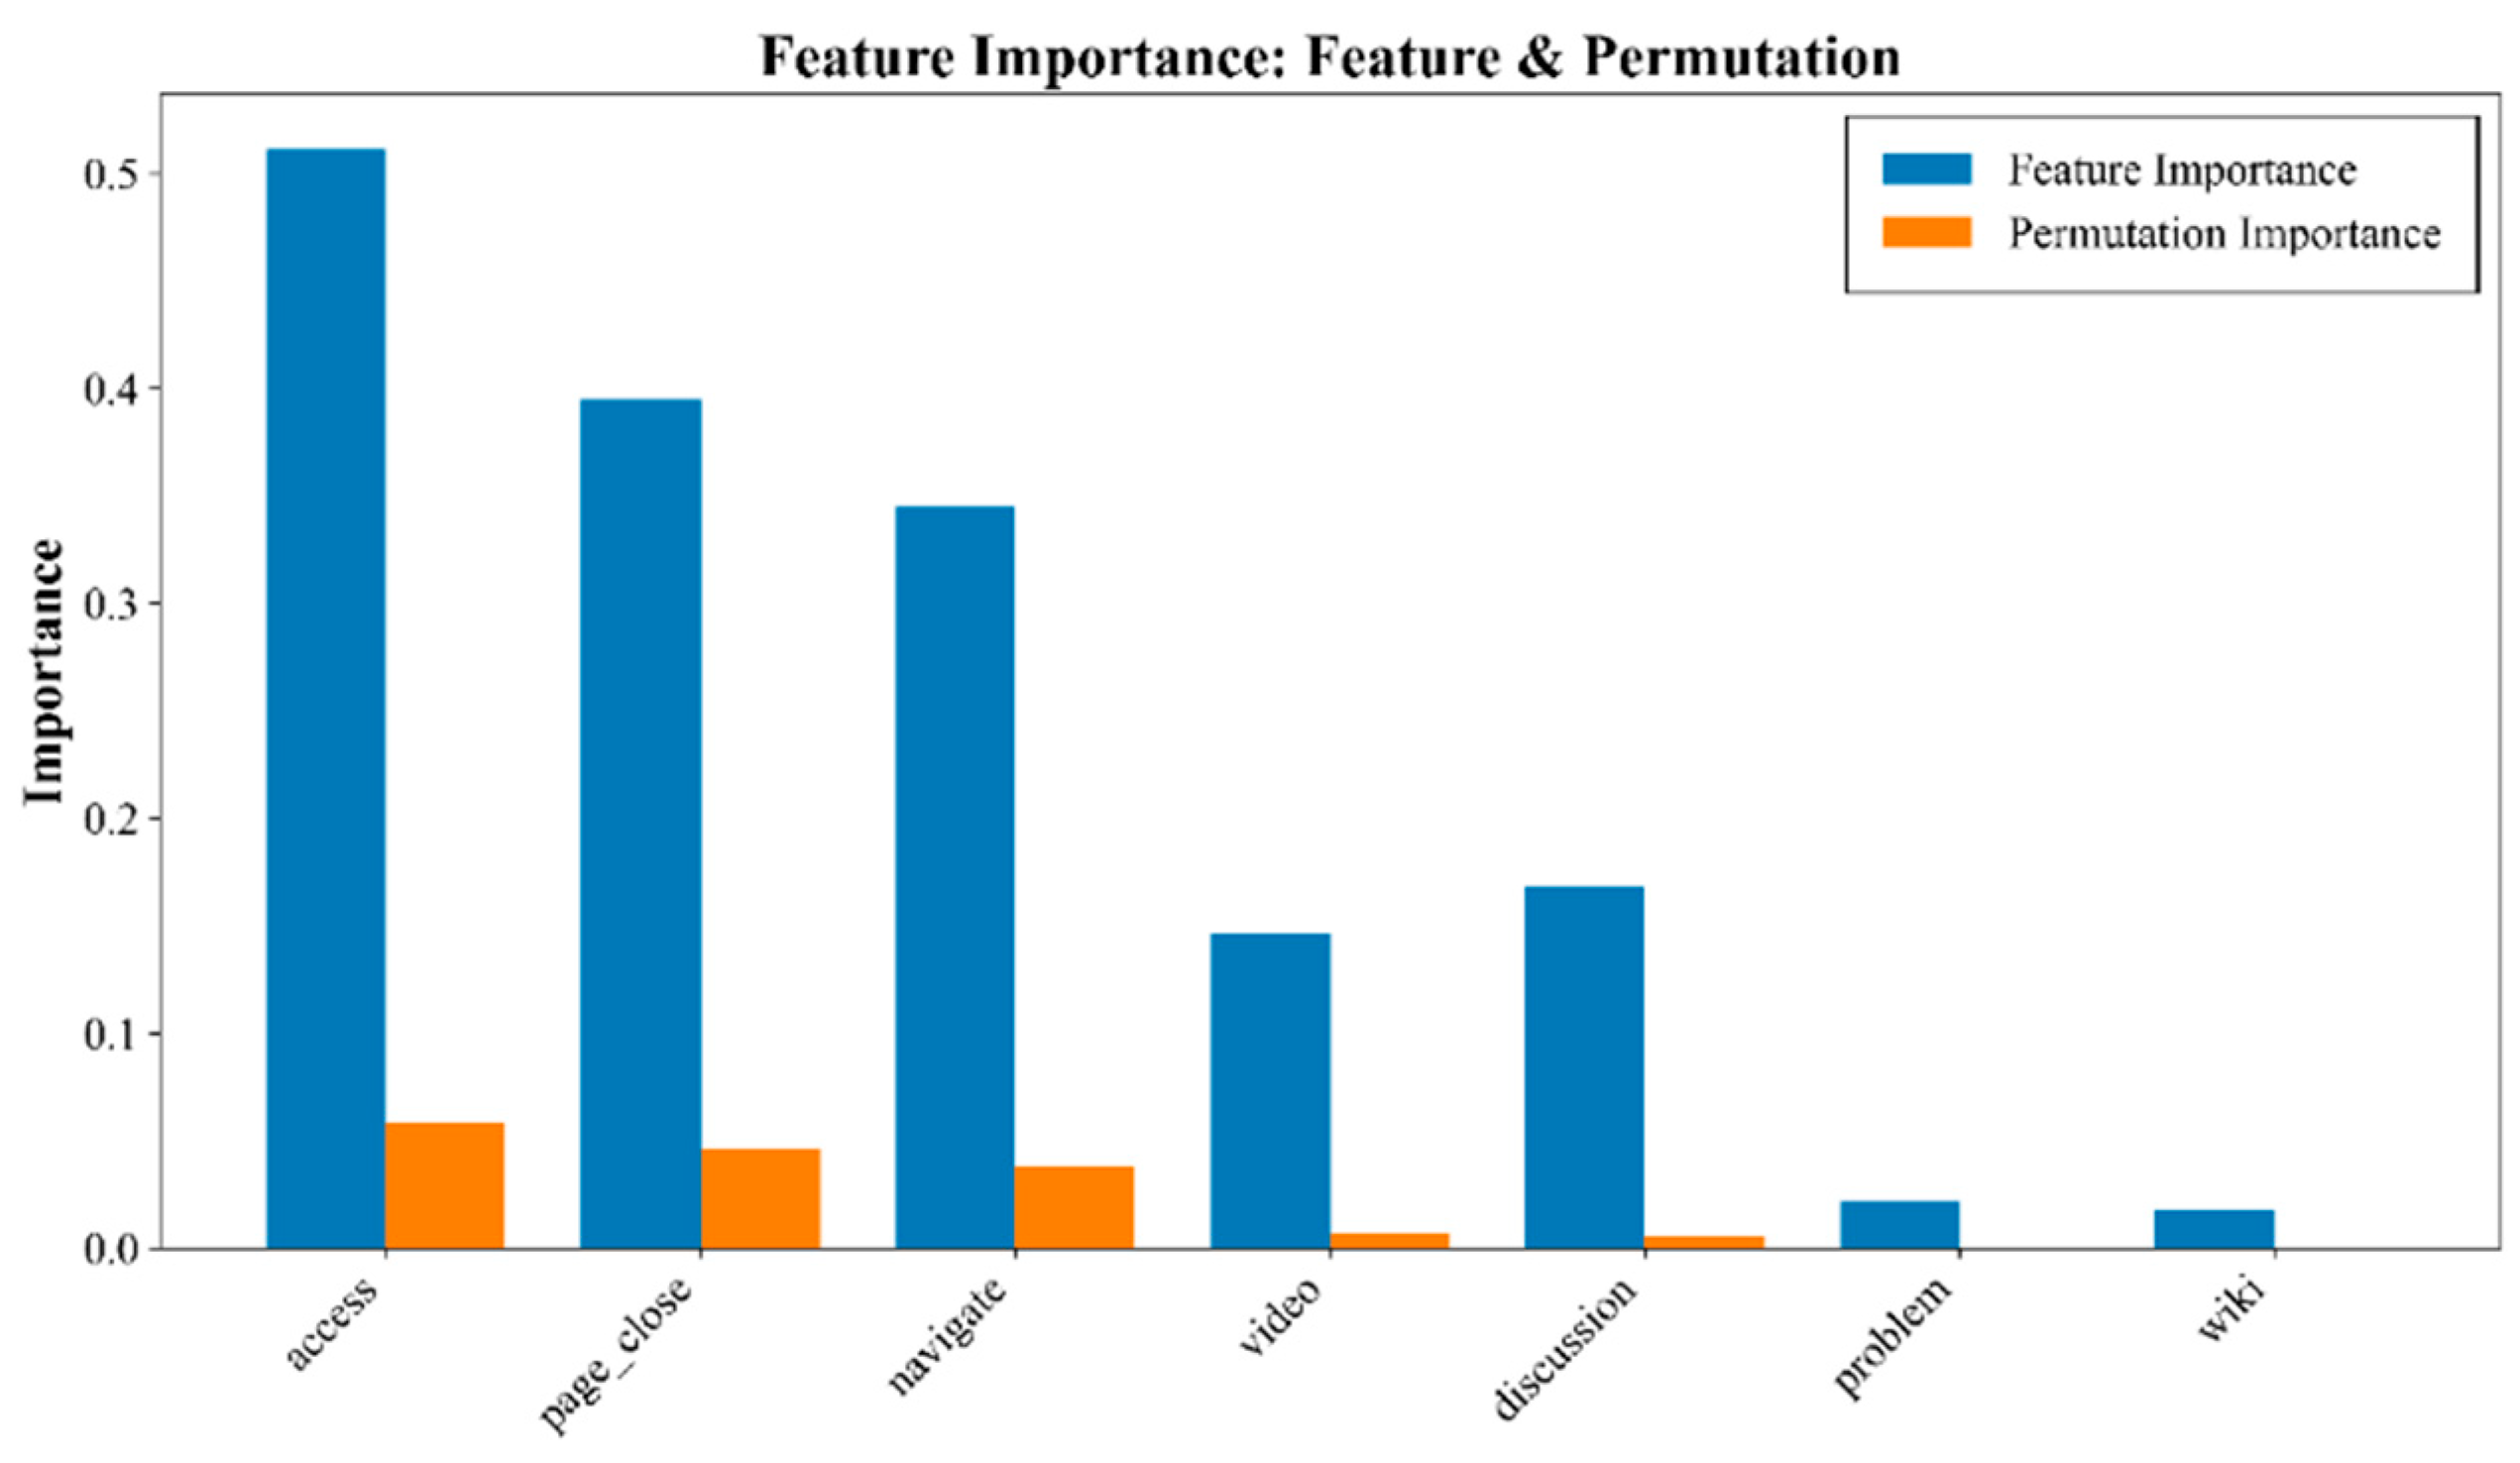
As shown in
Figure 6, the features are sorted by their PI (indicated in orange). Both metrics indicate that access and page_close are the most crucial features, which is consistent with the feature selection results. In the FI ranking, access ranks first, followed by page_close, confirming that both play a central role in prediction. The ranking of the PI reveals a similar pattern: perturbing the values of either access or page_close leads to a notable decline in model performance, further underscoring the significant influence of these two features on model stability. Although features such as navigation and videos also contribute somewhat, their importance is significantly lower, indicating that they are not key predictive factors in the early stages of the course.
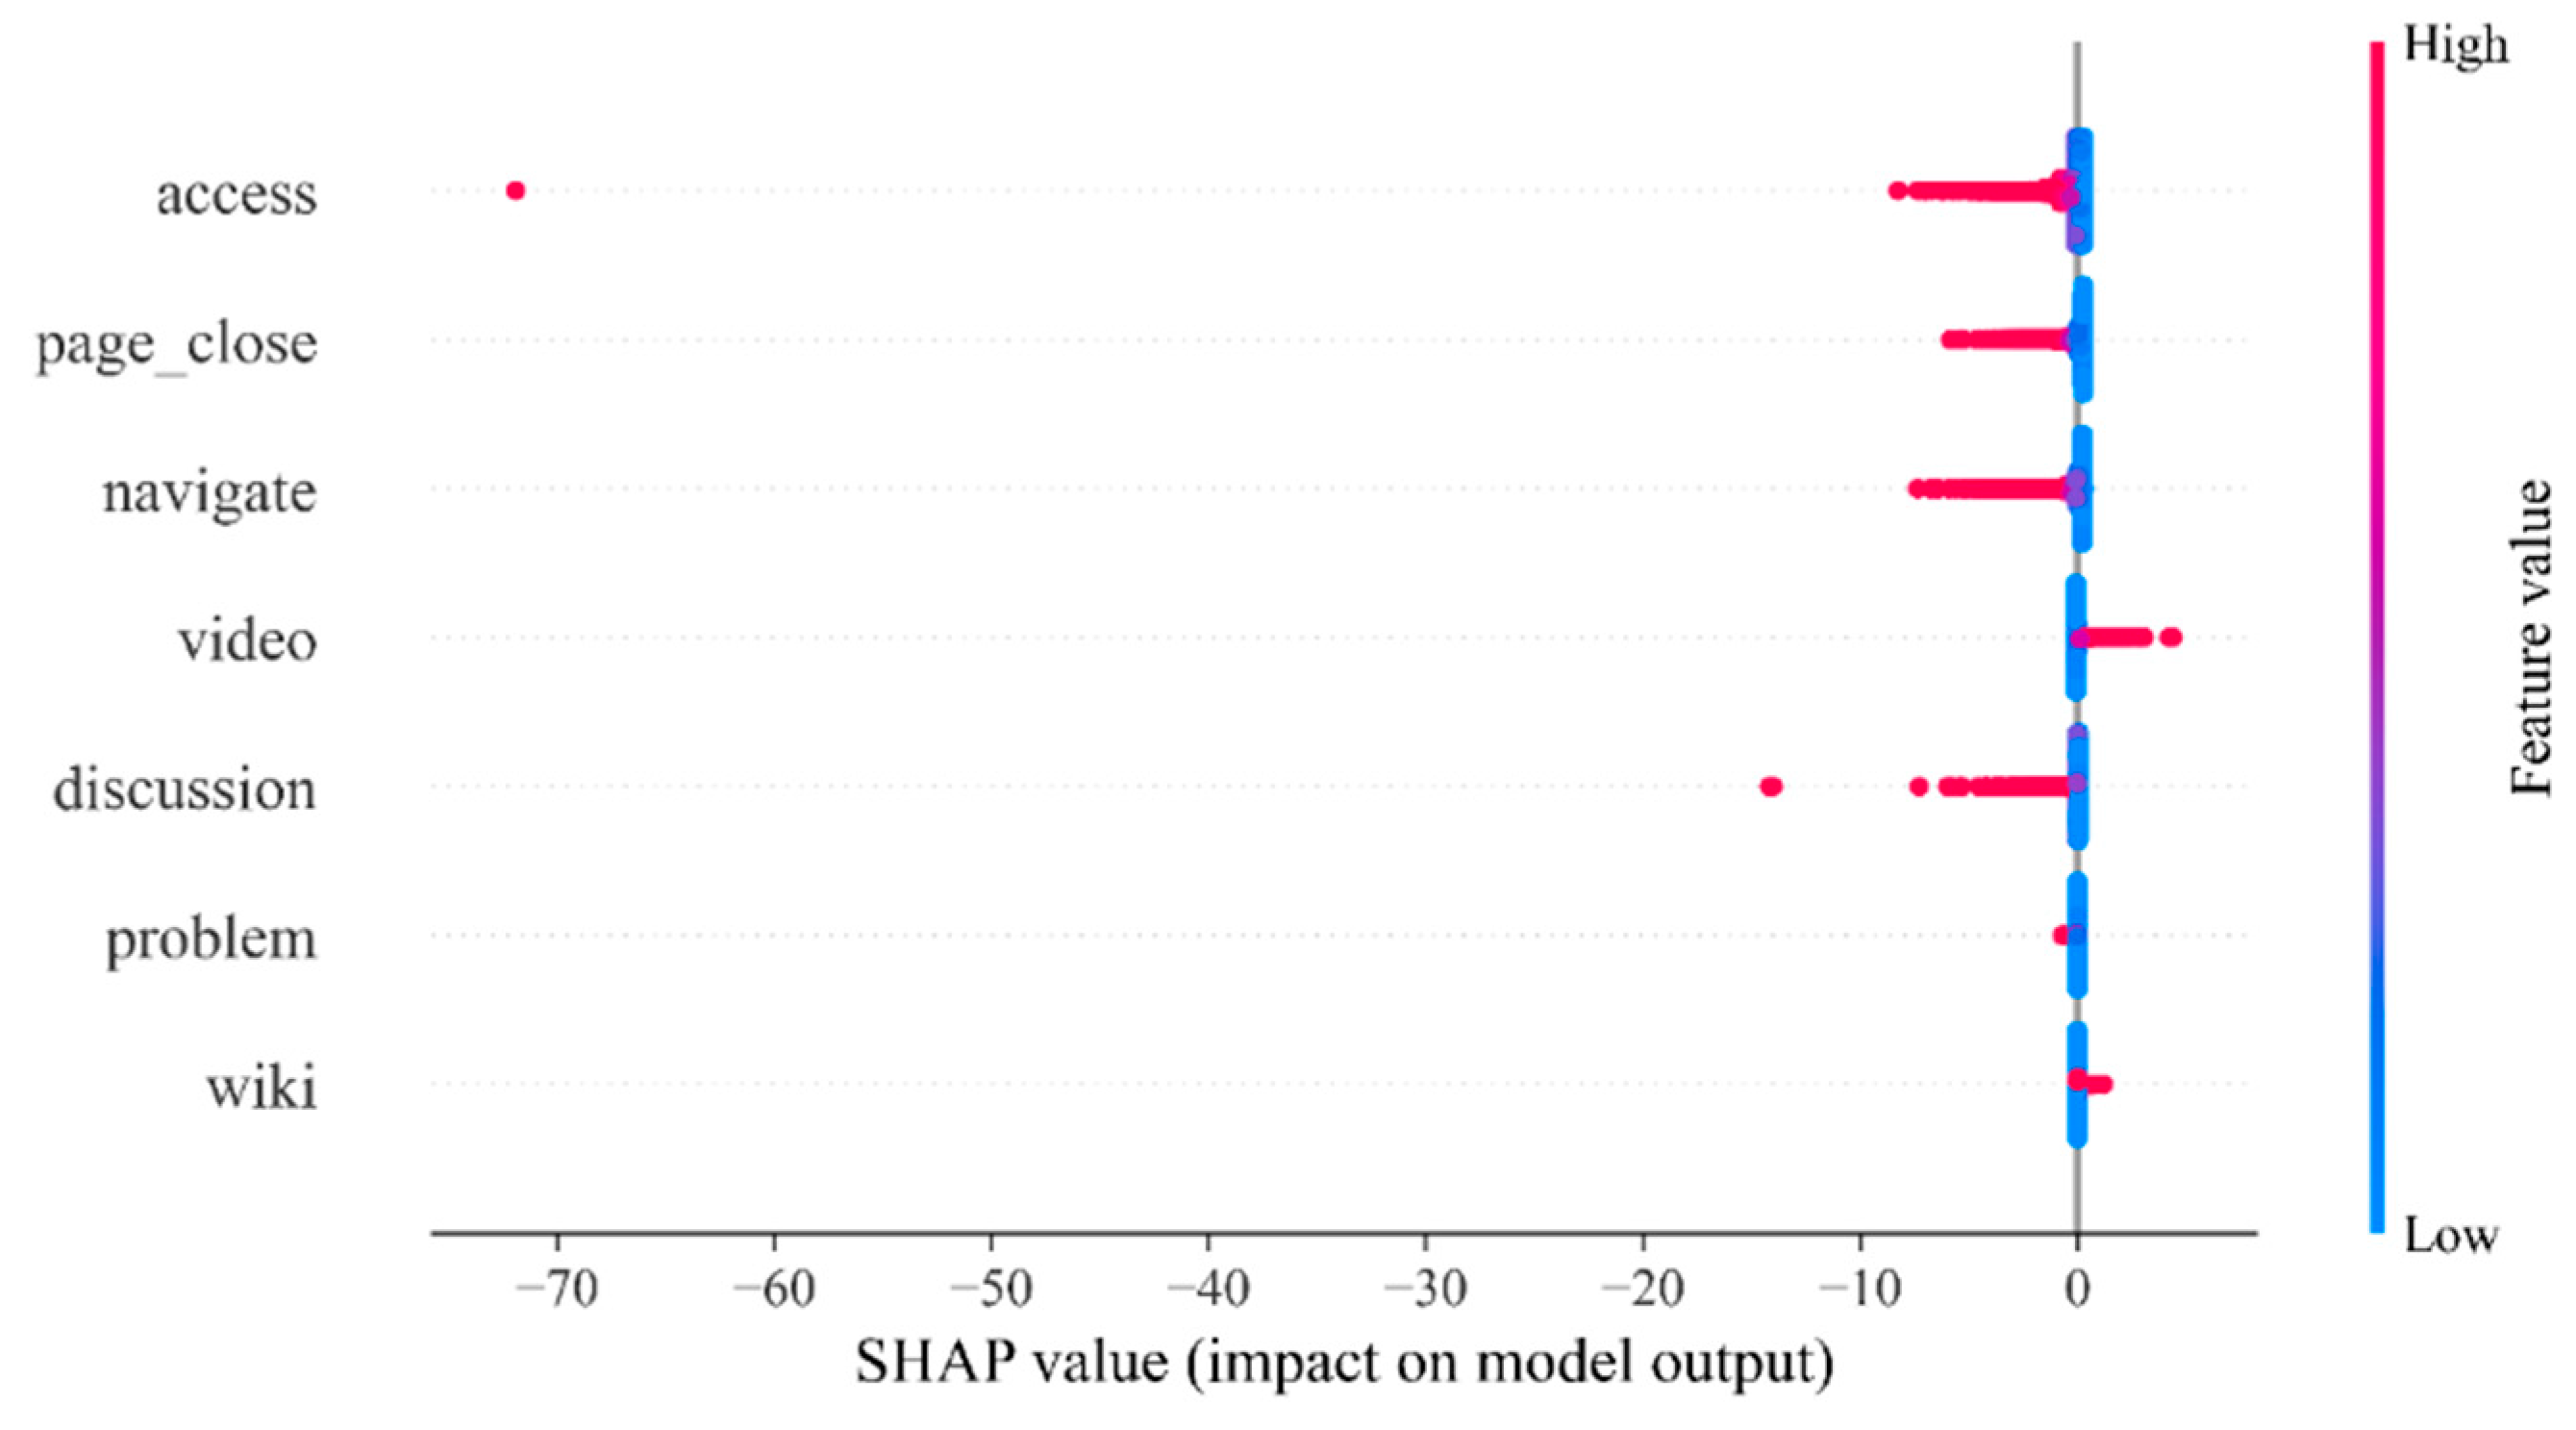
The SHAP summary plot is shown in
Figure 7, which visually presents the degree of influence of the features and the distribution of student characteristics. The figure indicates that access and page_close have a significant effect on the model output, which is consistent with the results of feature importance and permutation importance in
Figure 6. High values of access usually correspond to a negative contribution, meaning that the dropout risk is significantly reduced; high values of page_close also show a similar negative contribution. This finding indicates that in the early stage of learning, frequent page_close is more likely to reflect the learners’ switching between different resources rather than a lack of attention.
In summary, the prediction results for the first week depend mainly on two types of behaviors: active access to learning resources and maintaining a certain level of interaction. Together, these features form the main basis for identifying students at risk of early dropout.
The behavioral patterns in the 1st week clearly reveal the important role of initial engagement and the formation of learning habits. The high frequency of access indicates that students are actively exploring course resources, which is a key sign of establishing an initial connection with the learning environment and conducting ‘learning space navigation’. They successfully passed the initial adaptation period. The complexity shown by page_close precisely reflects the characteristics of online learning: frequent page closures are not necessarily all signs of negative distraction; they may also mean that students are actively and exploratively jumping between different modules of the course. When it coexists with high access, it depicts an active and curious learner. Conversely, the combination of low access and high page_close strongly suggests a lack of attention and failure in initial participation. These findings suggest that at the beginning of the course, the core goal of teaching support should be to lower the entry threshold, enhance the course’s appeal, and provide clear navigation to help students establish their initial learning engagement smoothly, avoiding their ‘confusion and withdrawal’.
Taken together, these results indicate that early dropout is less dependent on task-related learning behaviors and more closely related to whether learners establish a stable interaction pattern with the learning environment. In this stage, vulnerability is characterized primarily by fragile participation structures rather than insufficient task engagement.
4.5. Emergence of Behavioral Imbalance in Mid-Course Learning
During the third week, the RAE method identified page_close, access, and video as the optimal features. As shown in
Figure 8, the FI and PI results indicate that access has the greatest importance, followed by page_close and navigation. Although the video ranks lower in global importance, it was still retained in the optimal subset. The PI results further show that permuting the values of access or page_close leads to the greatest decrease in performance, confirming that these two features remain the most critical predictors in the middle stage of learning. Interestingly, while the FI values of the navigate method were relatively high, it was excluded from the optimal subset. This finding shows that navigation is strongly related to access; thus, it is useful at the global level but not necessary in the optimal feature set. Both navigation and access describe students’ browsing depth and engagement, but access is a more representative indicator; thus, it is maintained when navigation is removed.
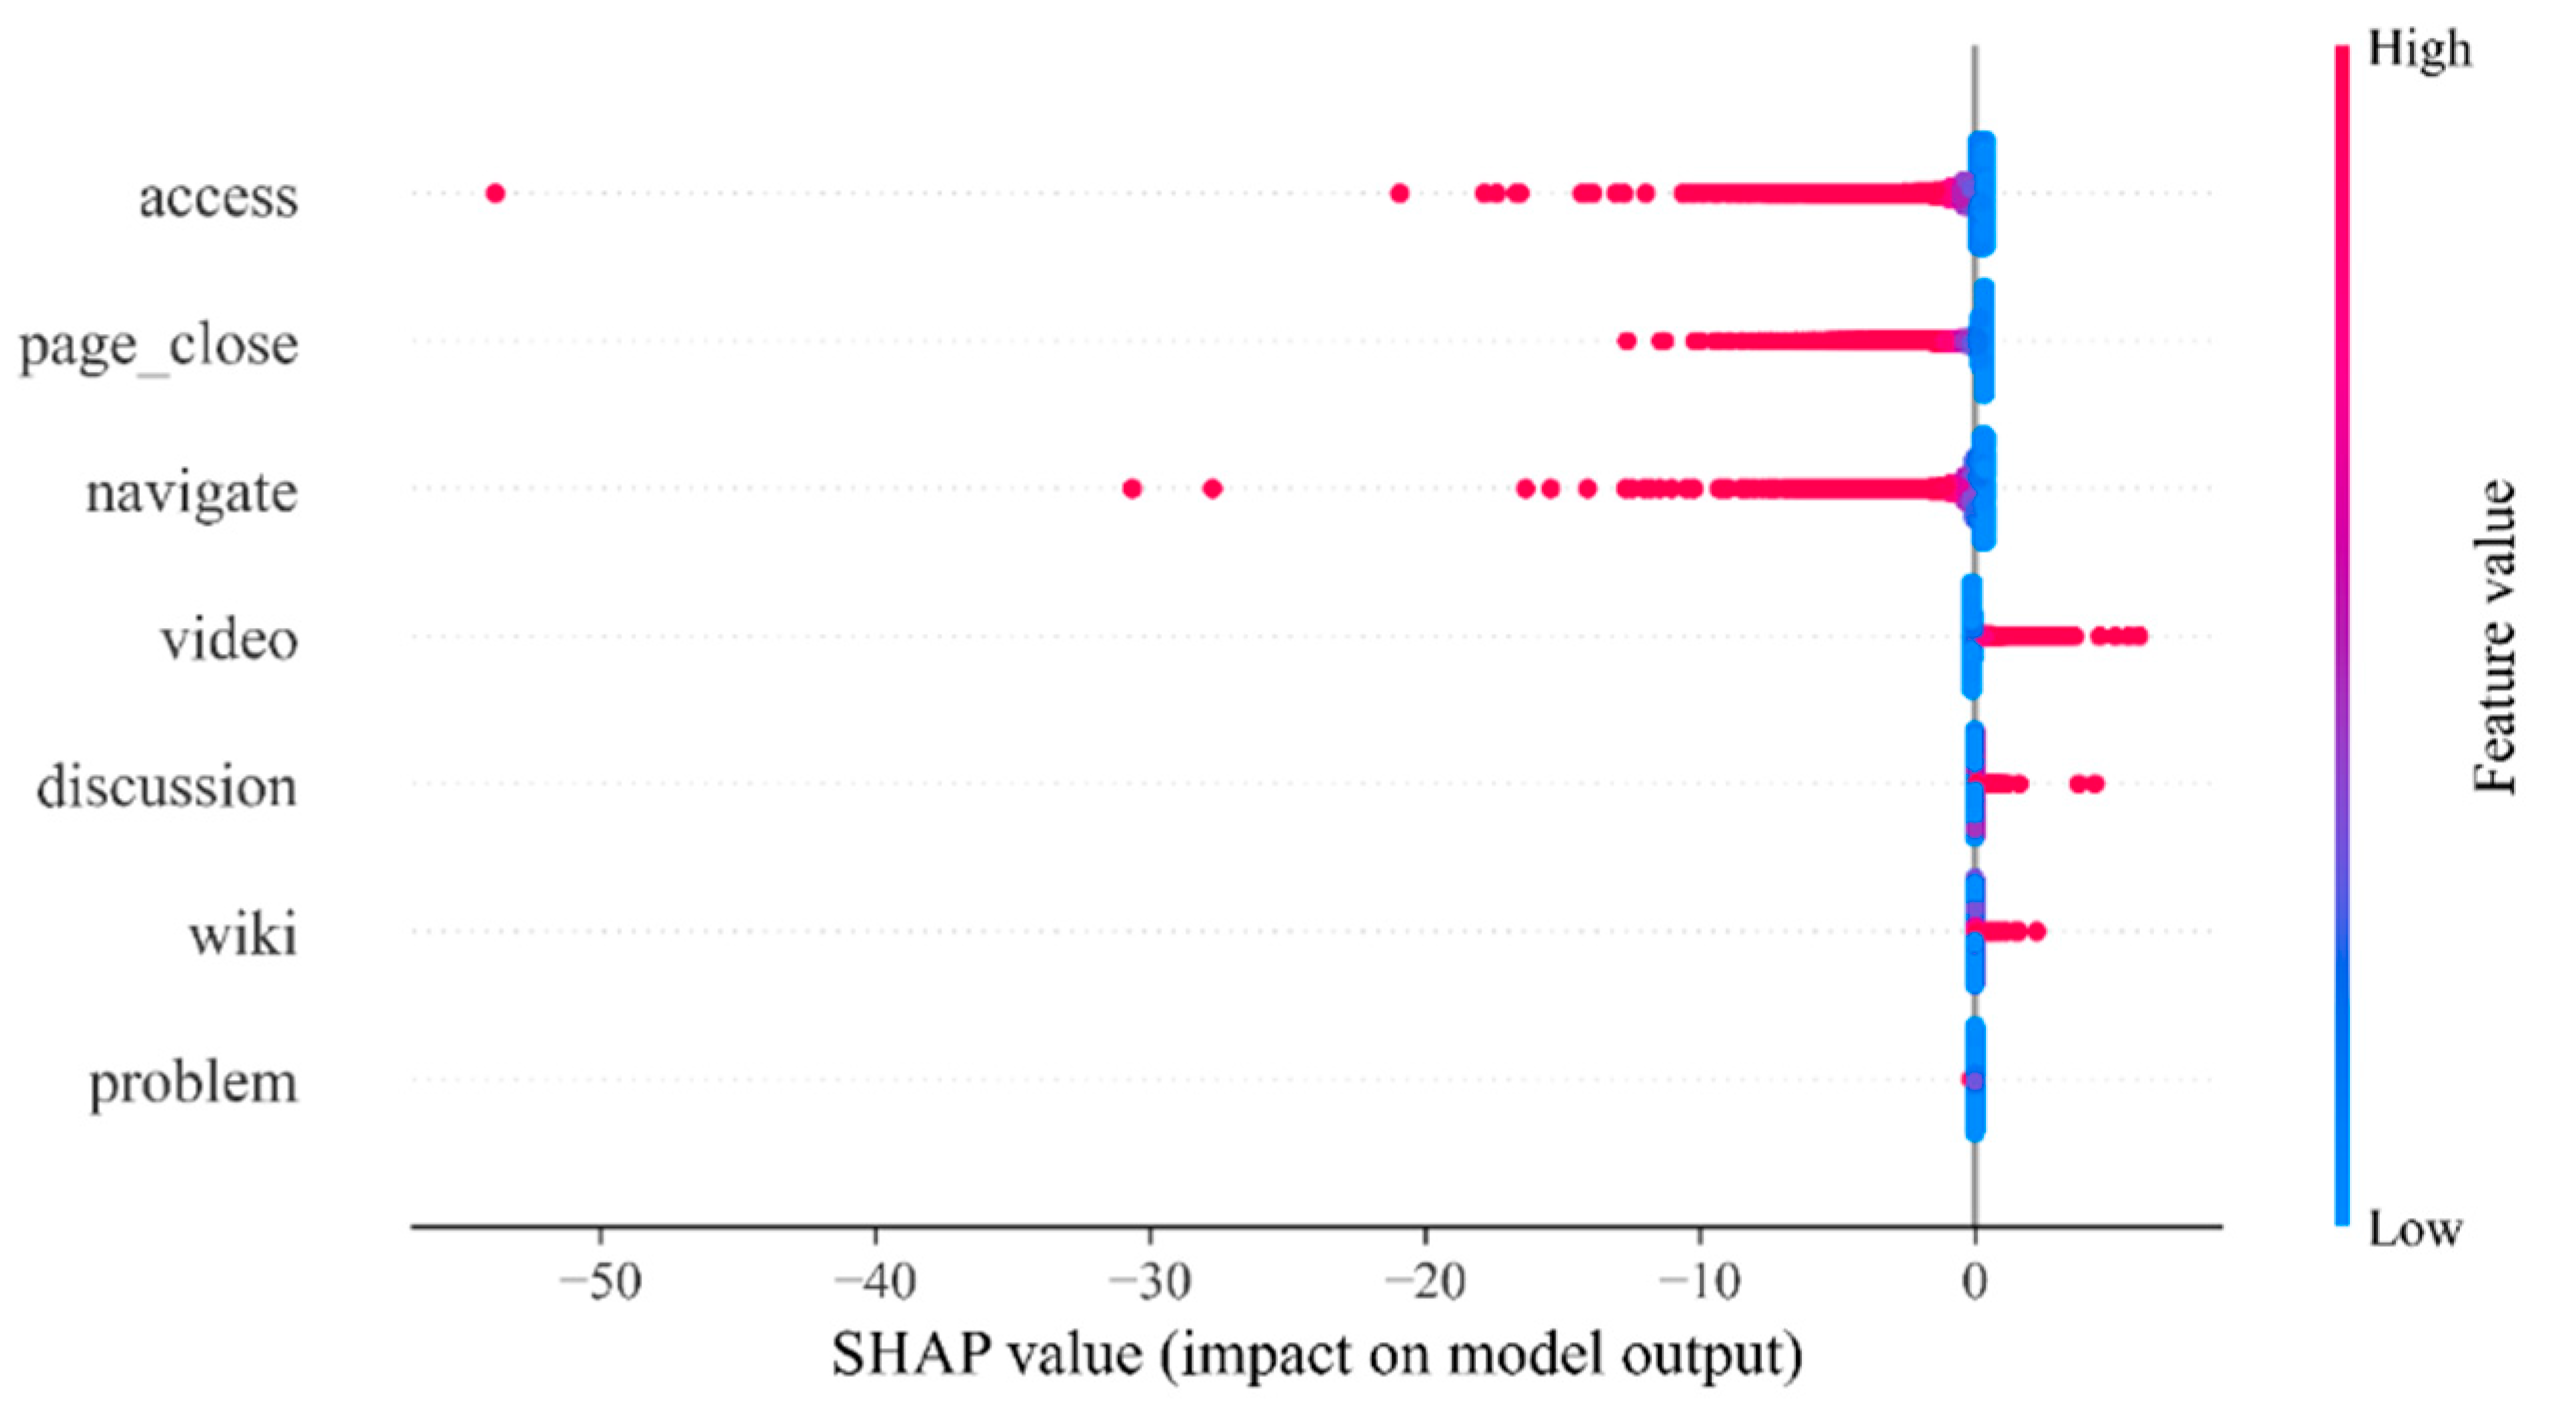
As shown in the SHAP analysis in
Figure 9, access remains the most important protective feature. High values always correspond to a stronger negative contribution, indicating that frequent access to course resources helps reduce the risk of dropping out. In the third week, the overall contribution of page_close was negative, and its high value was also associated with a lower dropout probability. This suggests that at this stage, frequent page_close reflects more the learners’ active switching and exploration of resources than simple distraction does and thus still has a protective effect. A high value for the video indicates a positive contribution, suggesting that frequent viewing of the video during this stage may increase the risk of dropping out. The reason for this might be that some learners, although they watch the video frequently, do not invest enough in other learning activities (such as resource access or assignment completion), resulting in an imbalance in their learning behavior structure and thus facing a higher risk of dropping out. Navigation also holds a certain position in the importance ranking of SHAP. Its contribution overlaps partially with that of access in terms of direction and degree. This finding indicates that although navigation can reflect learning participation, it has a relatively high level of information redundancy. Therefore, it was not included in the final selected feature set. These results further demonstrate the complementary relationship between feature selection and interpretability analysis: feature selection focuses on screening out the most representative feature subsets, whereas interpretability analysis can reveal other features that were not selected but still have an impact.
The third week marked a crucial turning point in students’ learning patterns, reflecting a shift from “initial exploration” to “deep engagement”. During this stage, video behavior emerges as an important predictor of dropout risk. Its role as a potential risk factor suggests that students may fall into a “passive learning trap” (
Rich & Gureckis, 2018) or experience “cognitive overload” (
Sari et al., 2024). Students who exhibit a pattern of “watching many videos but accessing few resources” tend to adopt a single and shallow learning strategy: they passively watch the videos but rarely engage with other course resources—such as text materials, assignments, or wikis—to internalize and transfer knowledge. This pattern aligns closely with the “lack of cognitive and metacognitive strategies” described in self-regulated learning theory. At this stage, video viewing shifts from being a means of knowledge acquisition to being a form of self-confirmation in which “I am learning”. Consequently, the focus of instructional intervention should move beyond encouraging participation, as emphasized in the first week, to guide students toward the development of diverse learning strategies. Educators should identify such students during the middle stage and support them in transforming them from passive video viewers into active knowledge constructors through structured prompts, guided assignments, or peer interaction.
Compared with the early stage, student vulnerability is no longer defined solely by continuity of interaction; instead, it becomes more closely tied to the structural characteristics of learning activities. This shift indicates that behavioral imbalance has emerged as a key perspective for understanding dropout risk in the middle stage.
4.6. Stability of Imbalance Patterns in the Late Learning Stage
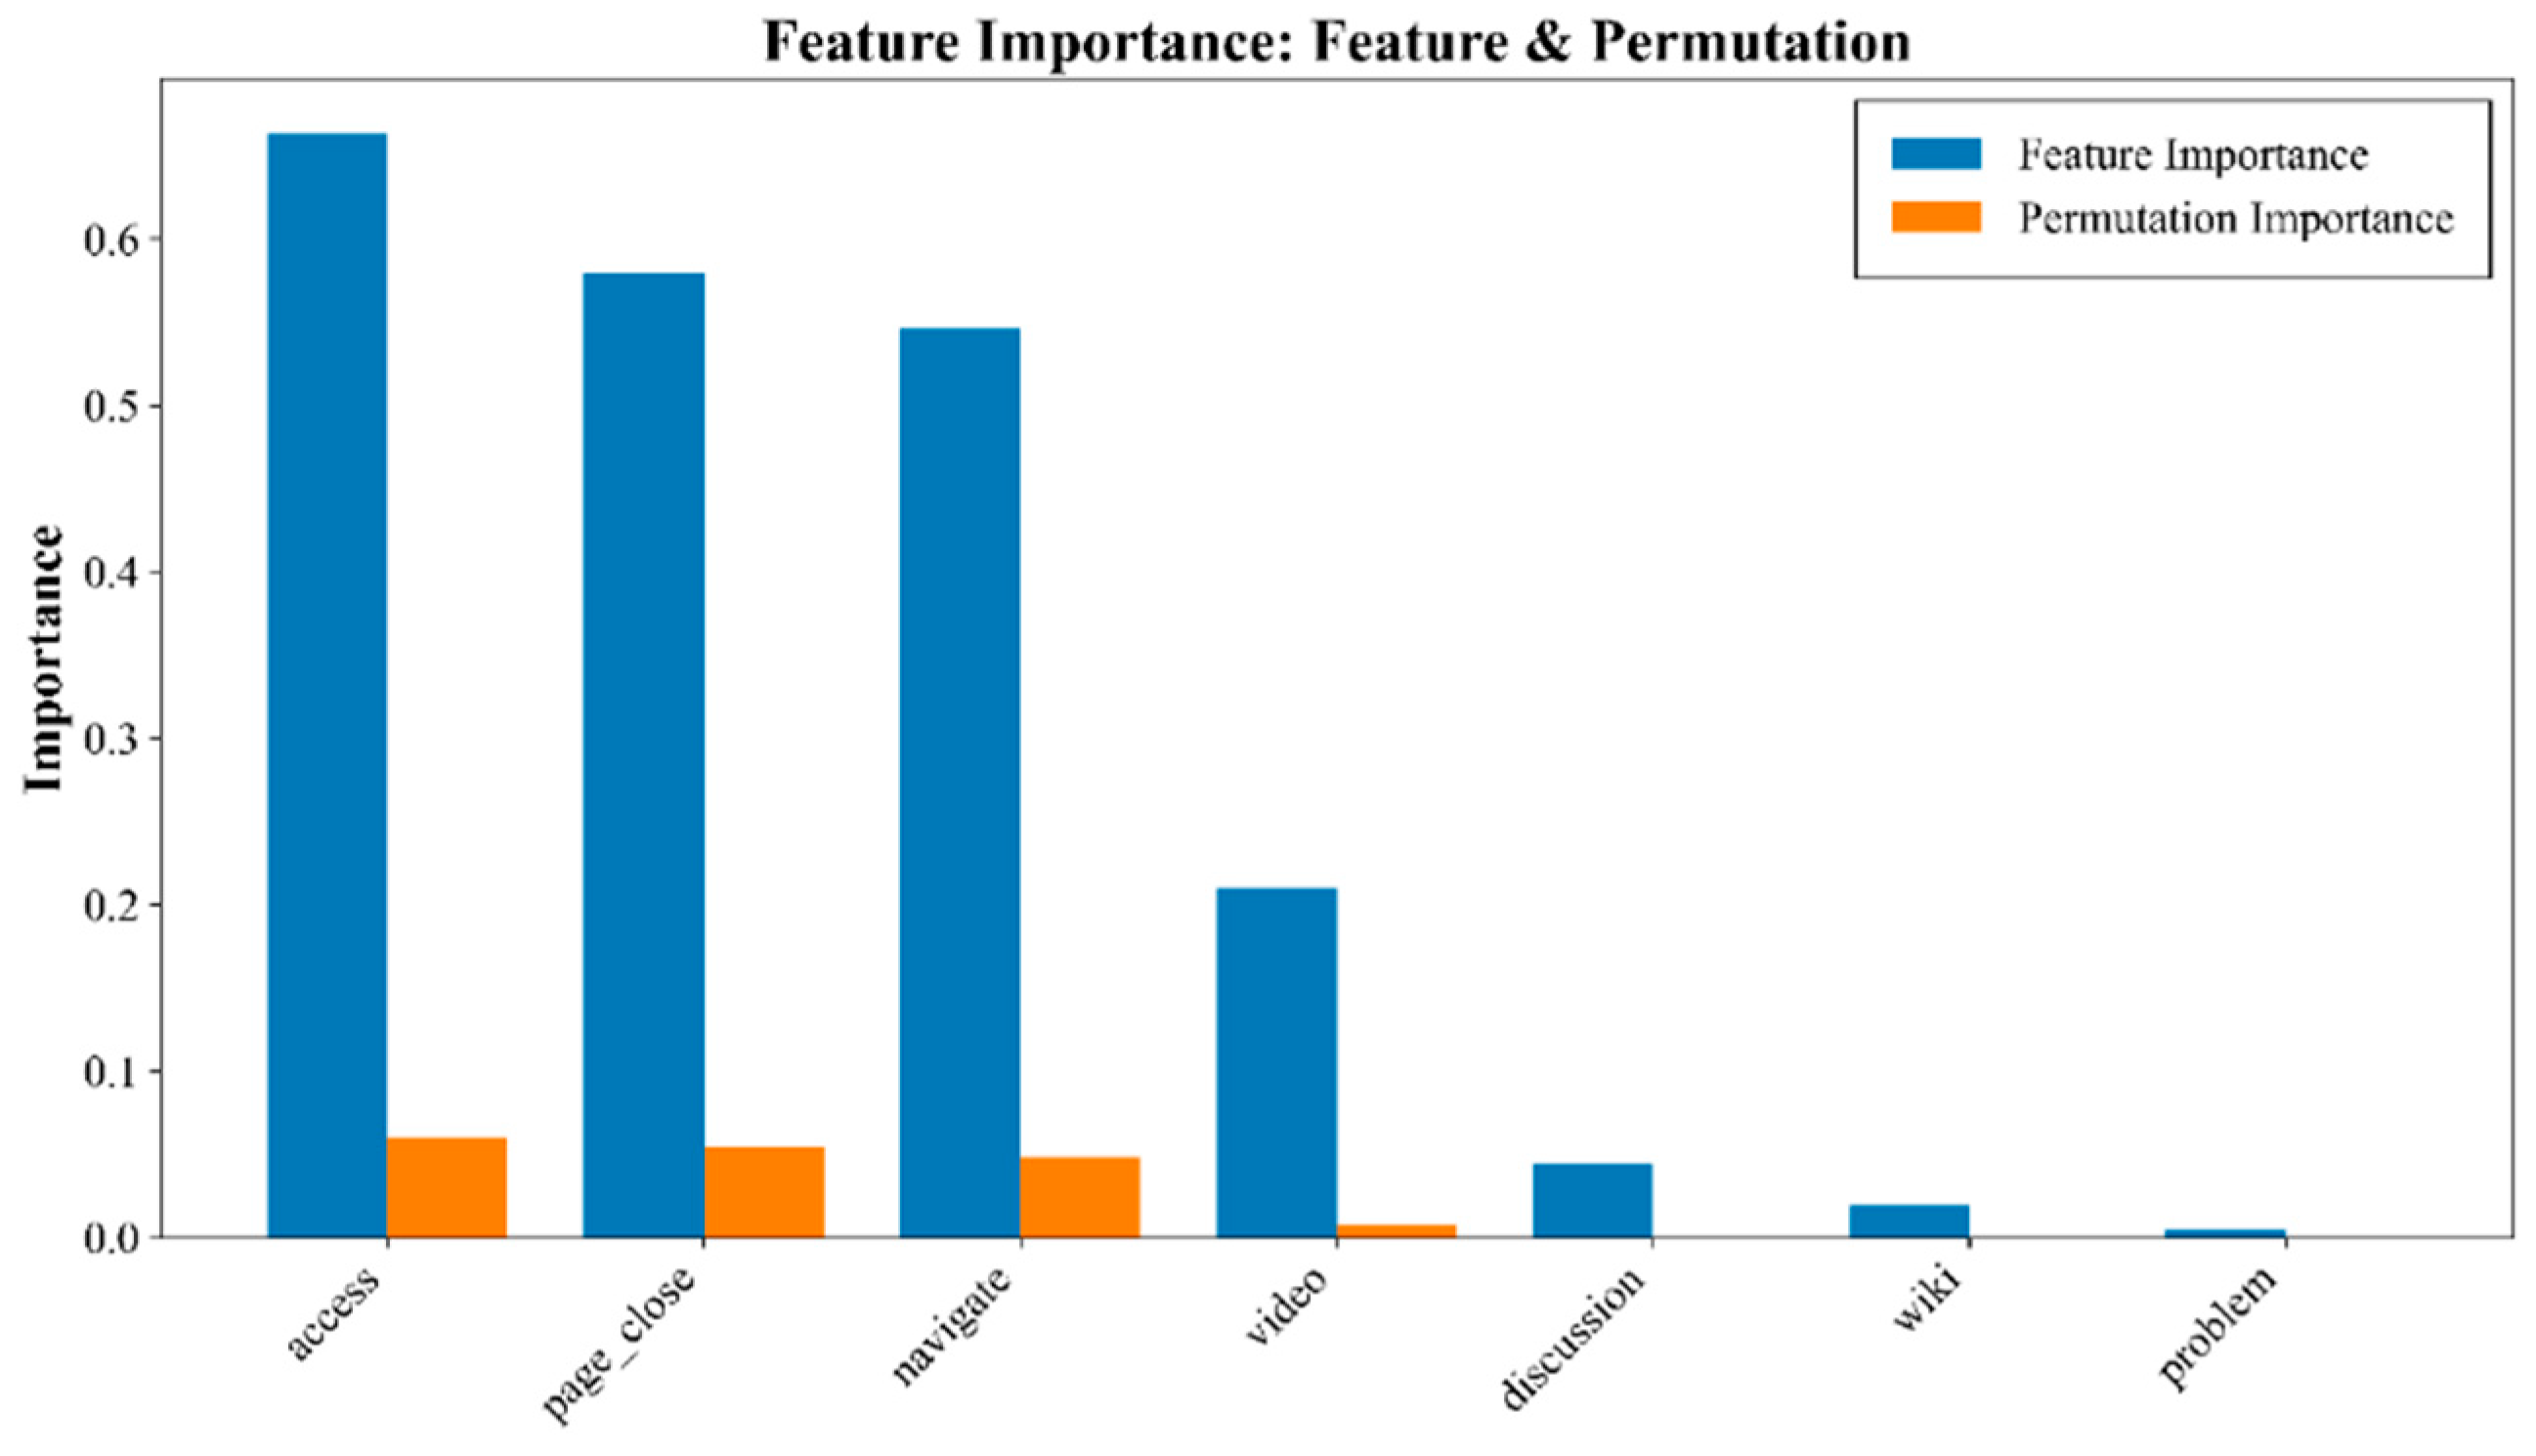
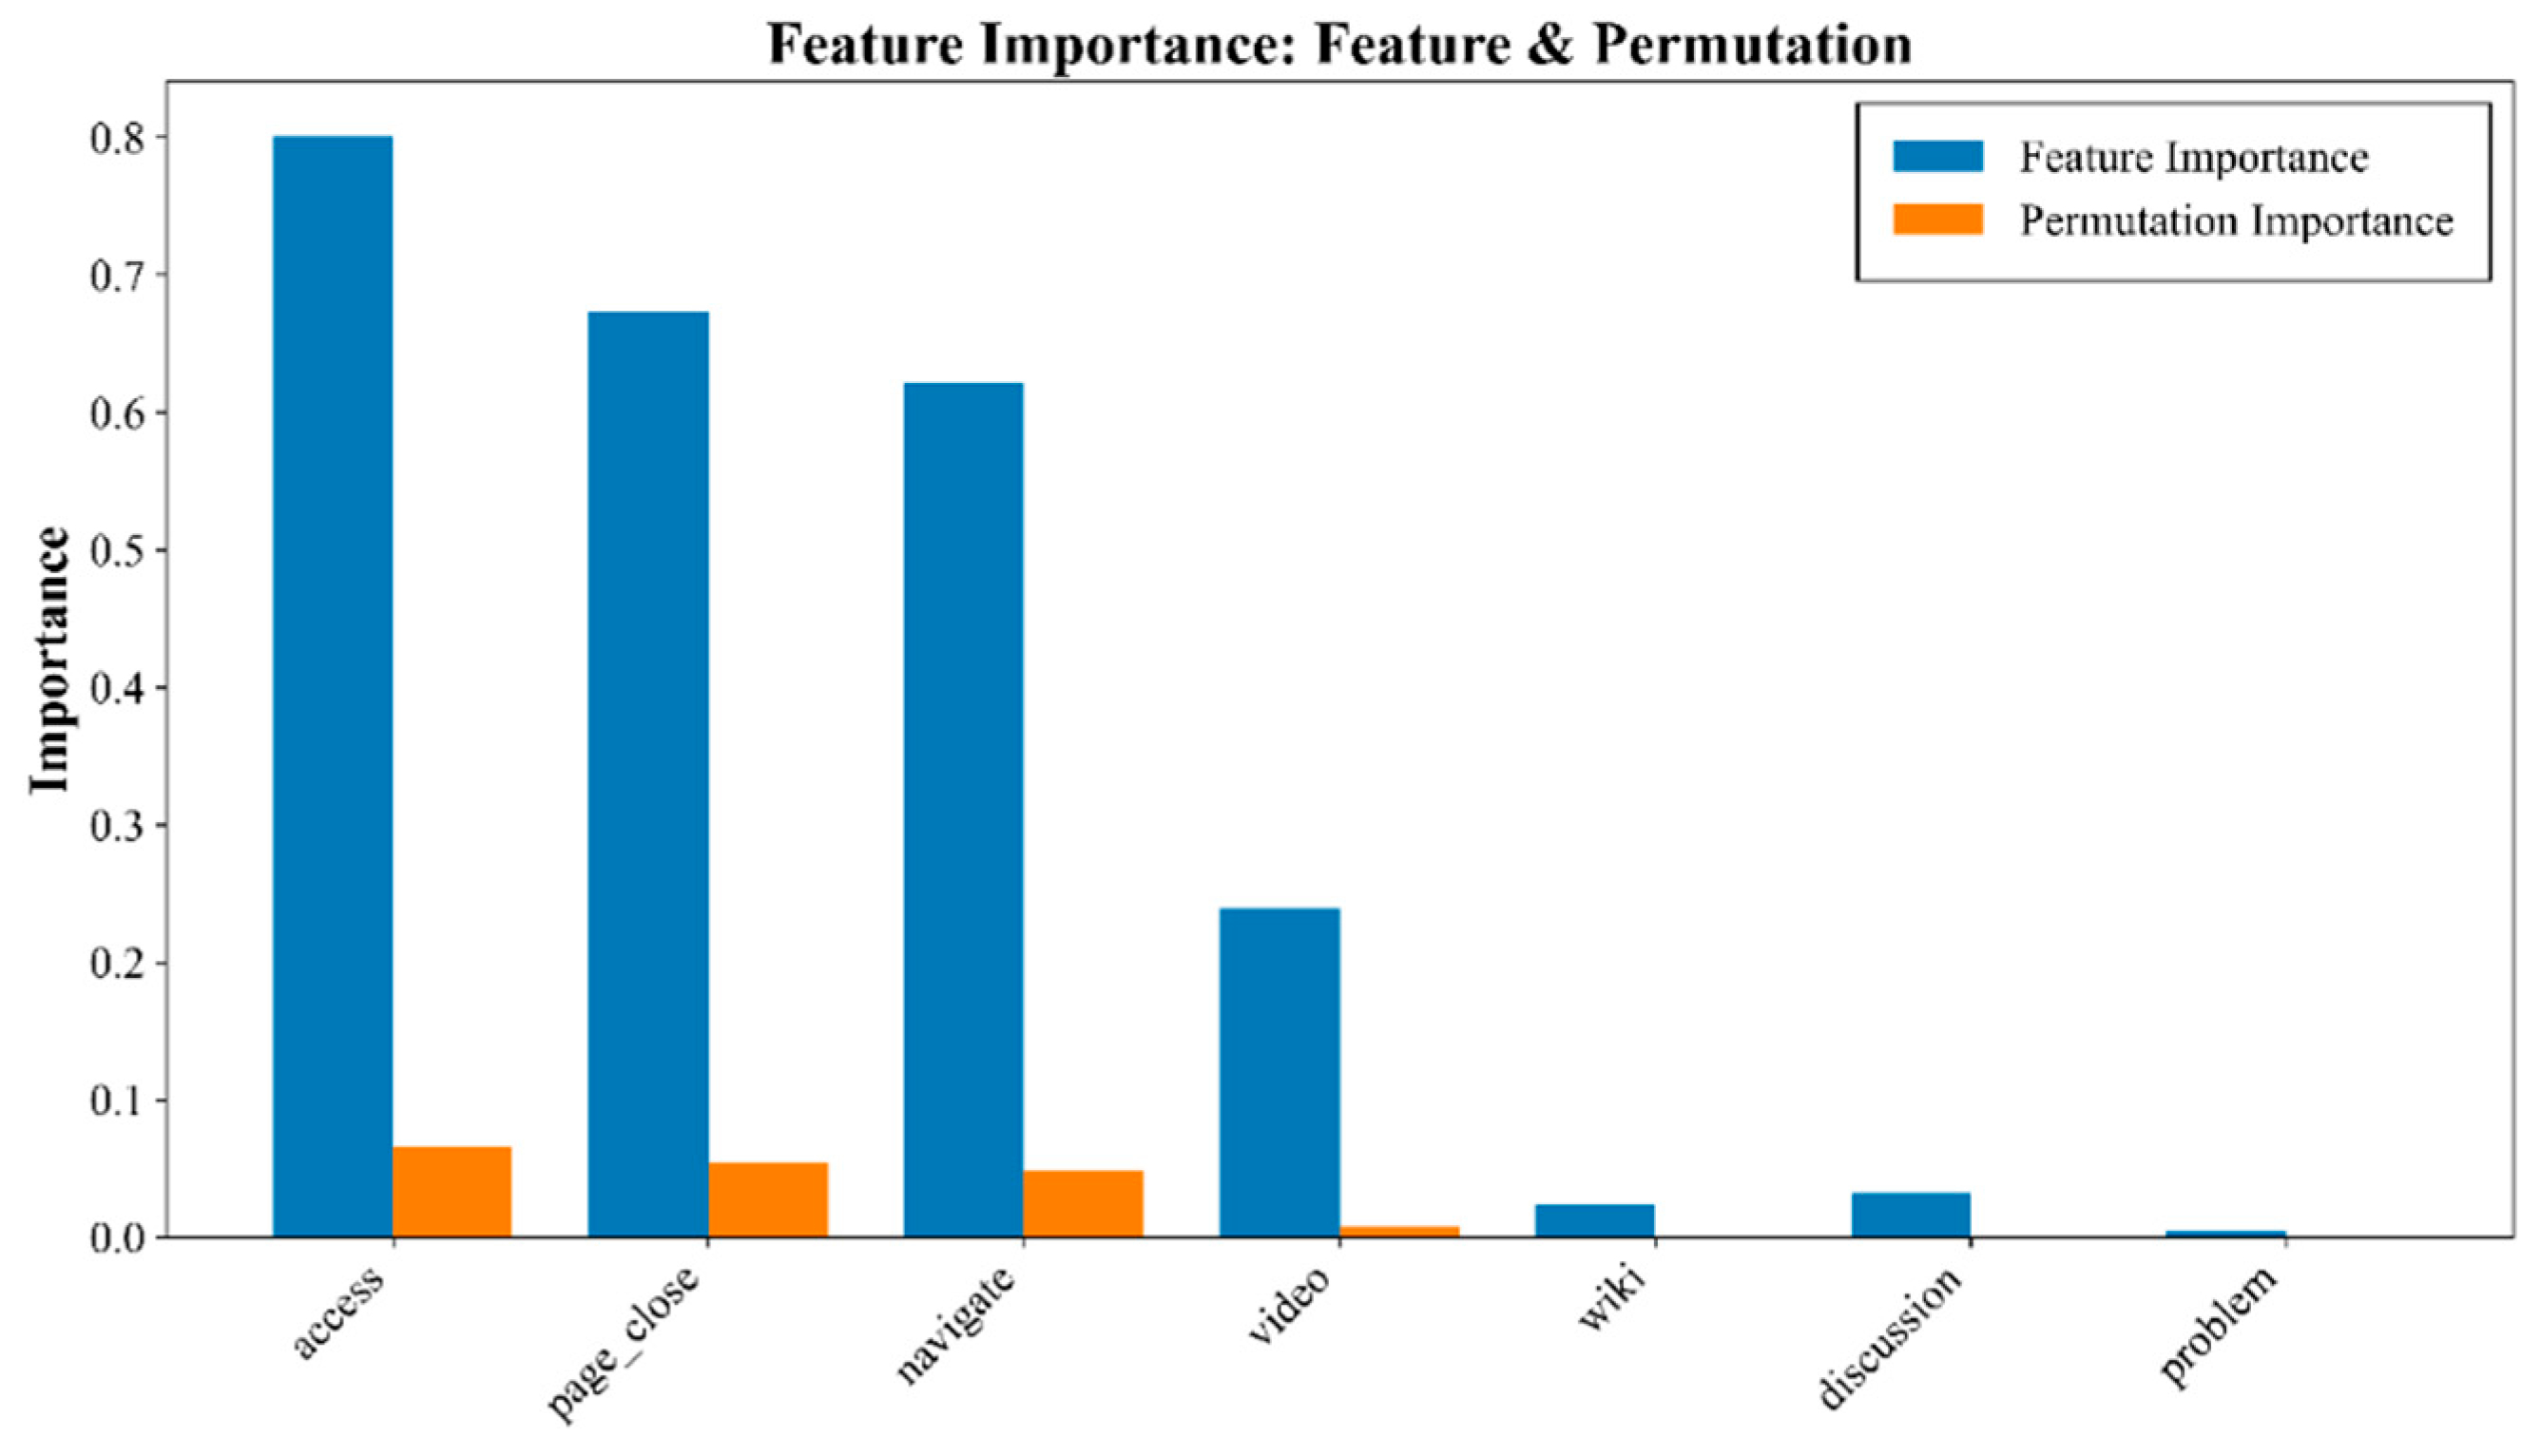
In the analysis of the fifth week, the RAE method once again identified page_close, access, and video as the optimal feature combination. The results of FI and PI (see
Figure 10) show that access ranks highest in importance, followed by page_close and navigate, while video is also retained as a significant feature. This finding indicates that in the late stage of the course, resource access and page_close behavior remain the primary indicators for predicting dropout risk. Although navigation performs well in terms of the overall importance ranking, it does not enter the final feature subset because of information overlap with access. The PI results further show that shuffling the values of access or page_close leads to the most substantial decline in model performance, underscoring the critical role of these two behaviors in maintaining predictive accuracy.
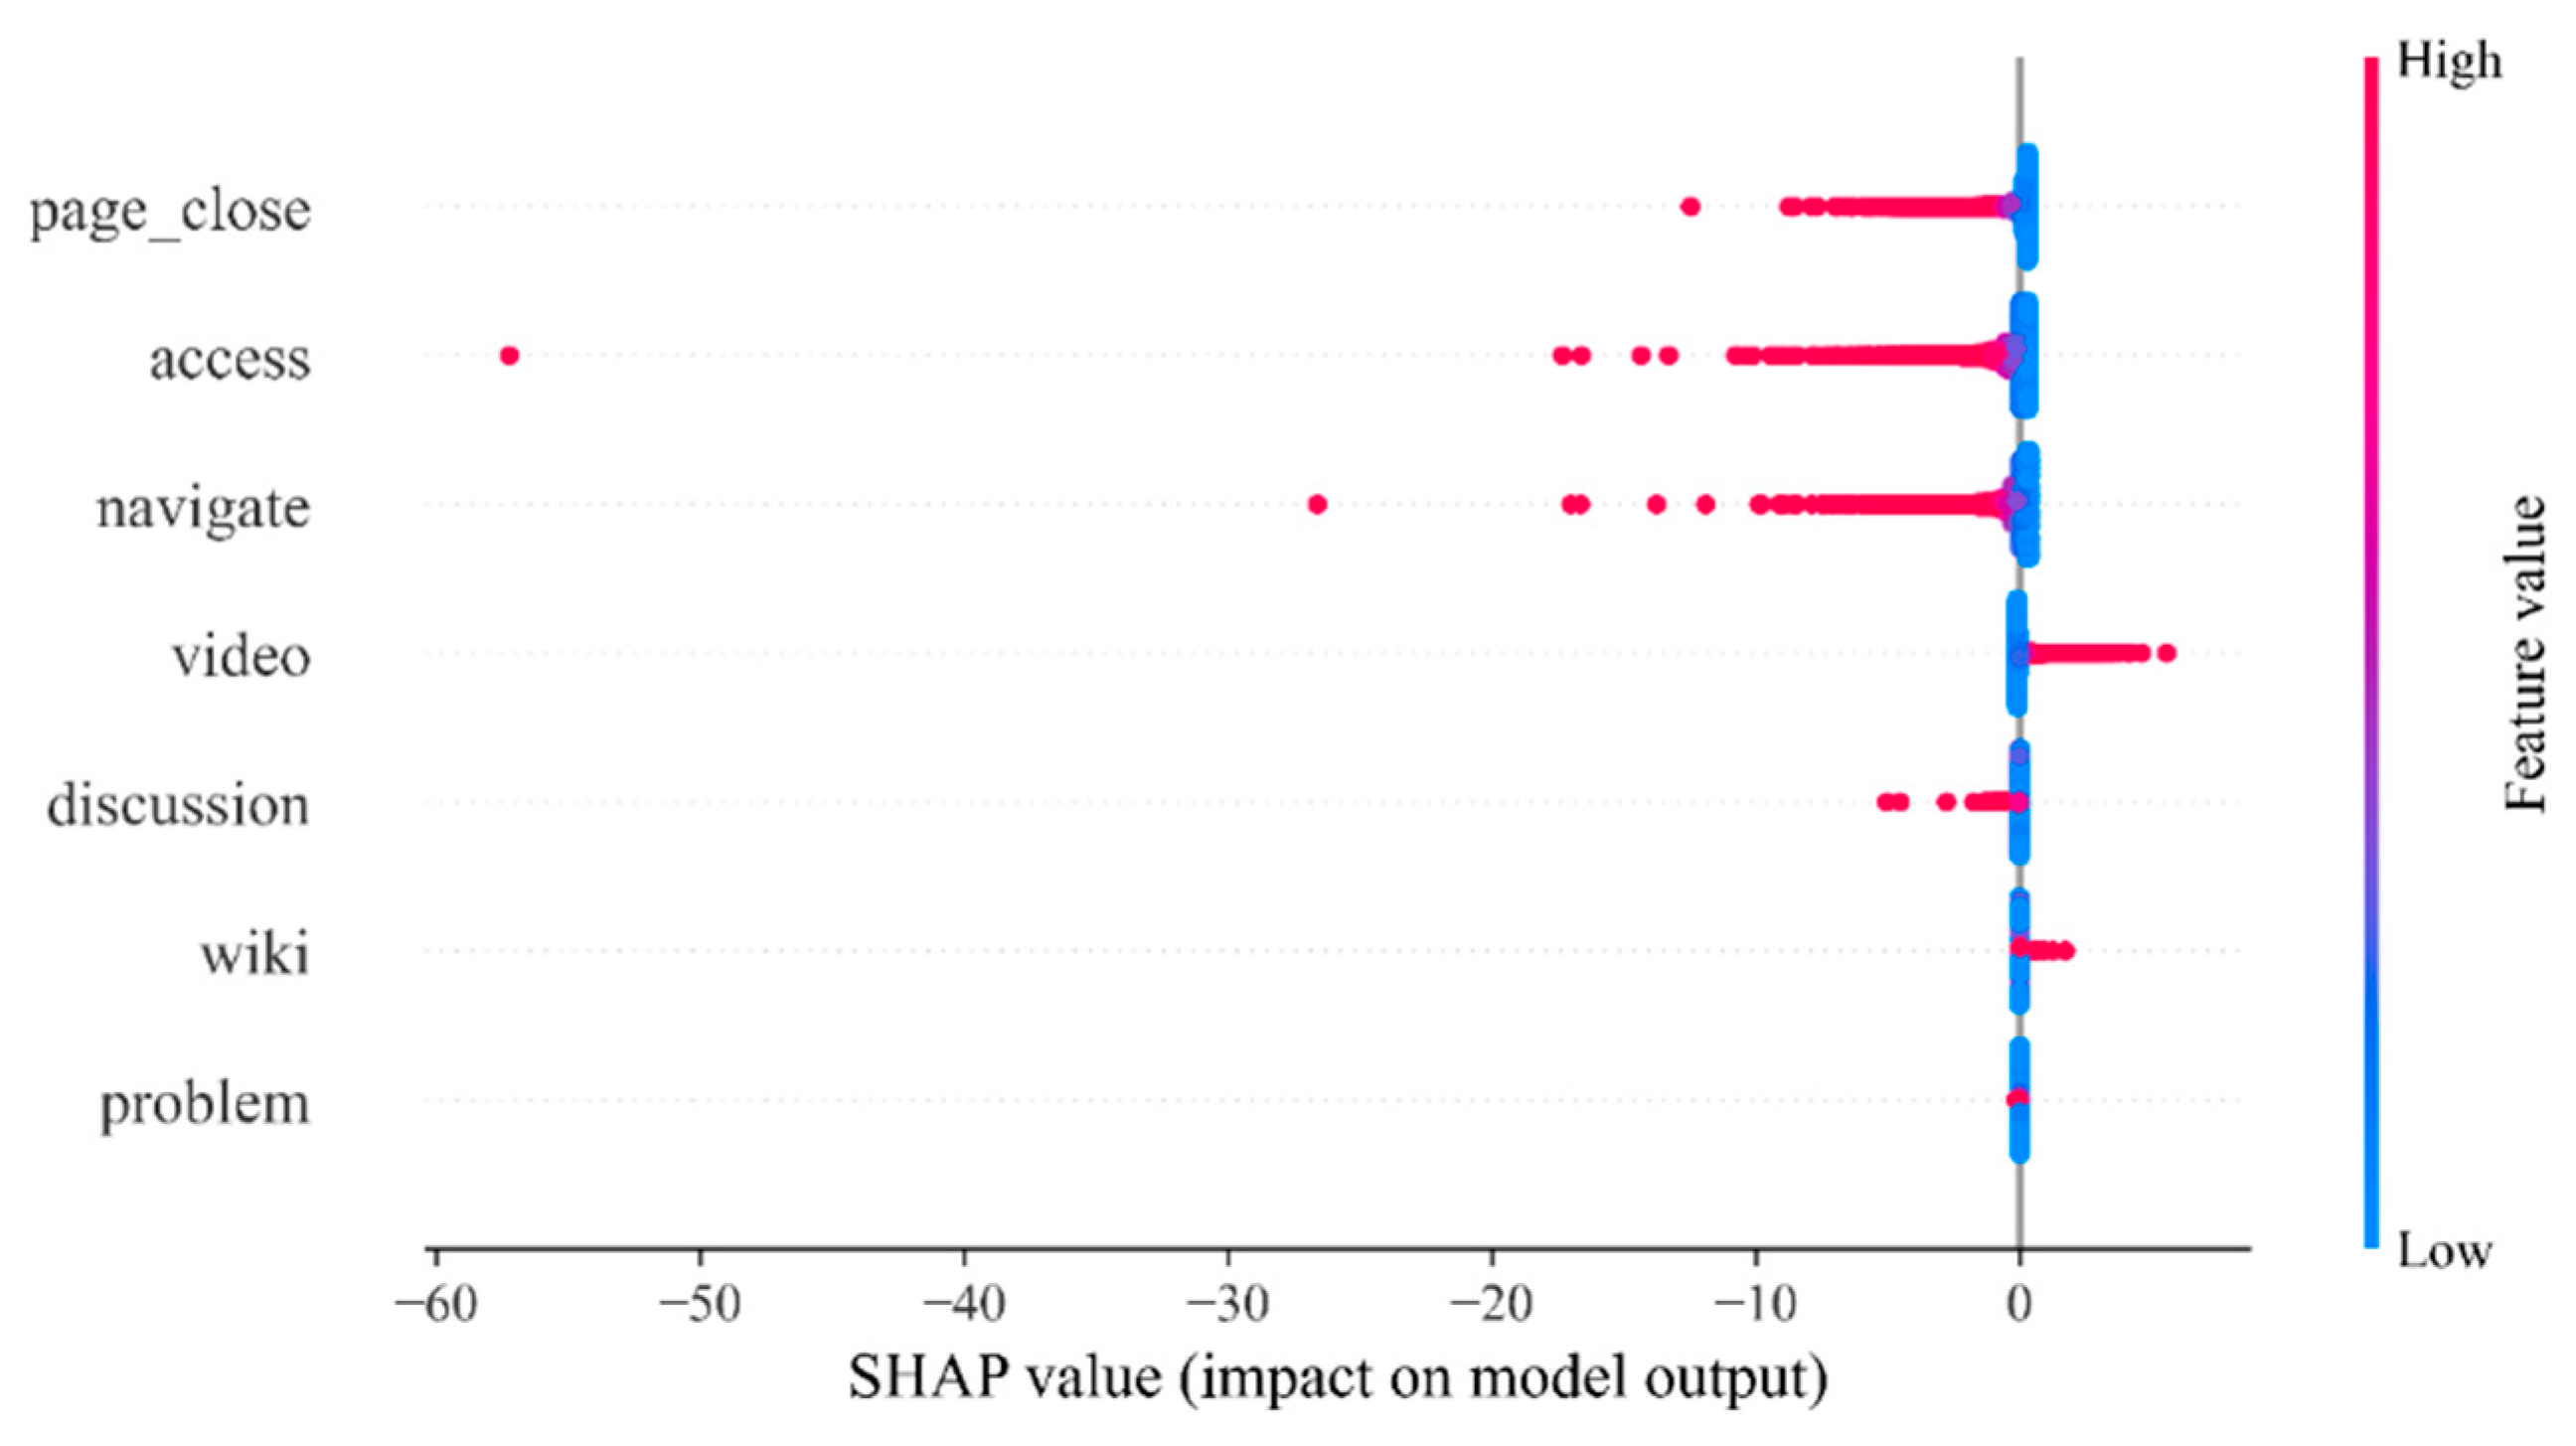
The SHAP value analysis provides further explanations at the individual level.
Figure 11 shows that high values of access still correspond to strong negative contributions, and it remains the most important protective factor. Page_close also shows an overall negative contribution in Week 5, which means that frequent page switching or closing at this stage still reflects learning activity rather than disengagement. High video values correspond to positive contributions, which means that frequent video learning alone in the late stage of the course may be related to unbalanced study behavior or limited task completion and can increase dropout risk. Navigate also shows some importance in the SHAP results, but its effect overlaps with that of access, which explains why it is not included in the optimal feature subset.
Discussion is not selected in the optimal feature subset for Week 5, but the SHAP values show a change in its contribution direction across stages. In Weeks 1 and 3, higher values of discussion contribute negatively, which means that active participation in discussions helps reduce dropout risk. In Week 5, high values of discussion have positive effects, which means that frequent discussion activity is linked to higher dropout risk. This change may indicate that, in the later stage of the course, some students remain active in discussions but do not connect this activity with core learning tasks. This leads to more formalized or marginal learning behavior and disengagement. These results show that the role of discussion in maintaining persistence changes across stages and should be interpreted on the basis of the learning process.
As the course progresses, whether one persists depends on whether the student can maintain a balanced and strategic level of learning engagement. At this stage, the high-frequency videos indicate a more serious risk, as they often suggest that students have adopted fixed learning strategies that are ineffective when dealing with complex and comprehensive problems at the end of the course. They might despairingly repeatedly watch the videos but be unable to complete assignments or assessments that require deep thinking. Moreover, the reversal of the contribution direction of discussion behavior is a highly revealing signal: At the end of the course, the unusually high frequency of posting may no longer be ‘active participation’ but more likely be a ‘last-ditch’ plea for help or anxious behavior because of falling behind. These findings indicate that at the end of the academic journey, any single-dimensional, uncoordinated high-intensity behavior could be a precursor to instability and impending giving up. The differentiated pattern identified in Week 3 continues into Week 5, indicating stabilization of the imbalance mechanism. For educational practitioners, the early warning system at this stage must be intelligent enough to identify these ‘unbalanced’ behavioral patterns. Intervention measures should focus on providing integrated review support, clarifying the final achievement goals, and offering emotional encouragement to help students overcome the final obstacles and complete the sprint.
4.7. Cross-Stage Comparison of PDP Interaction Patterns
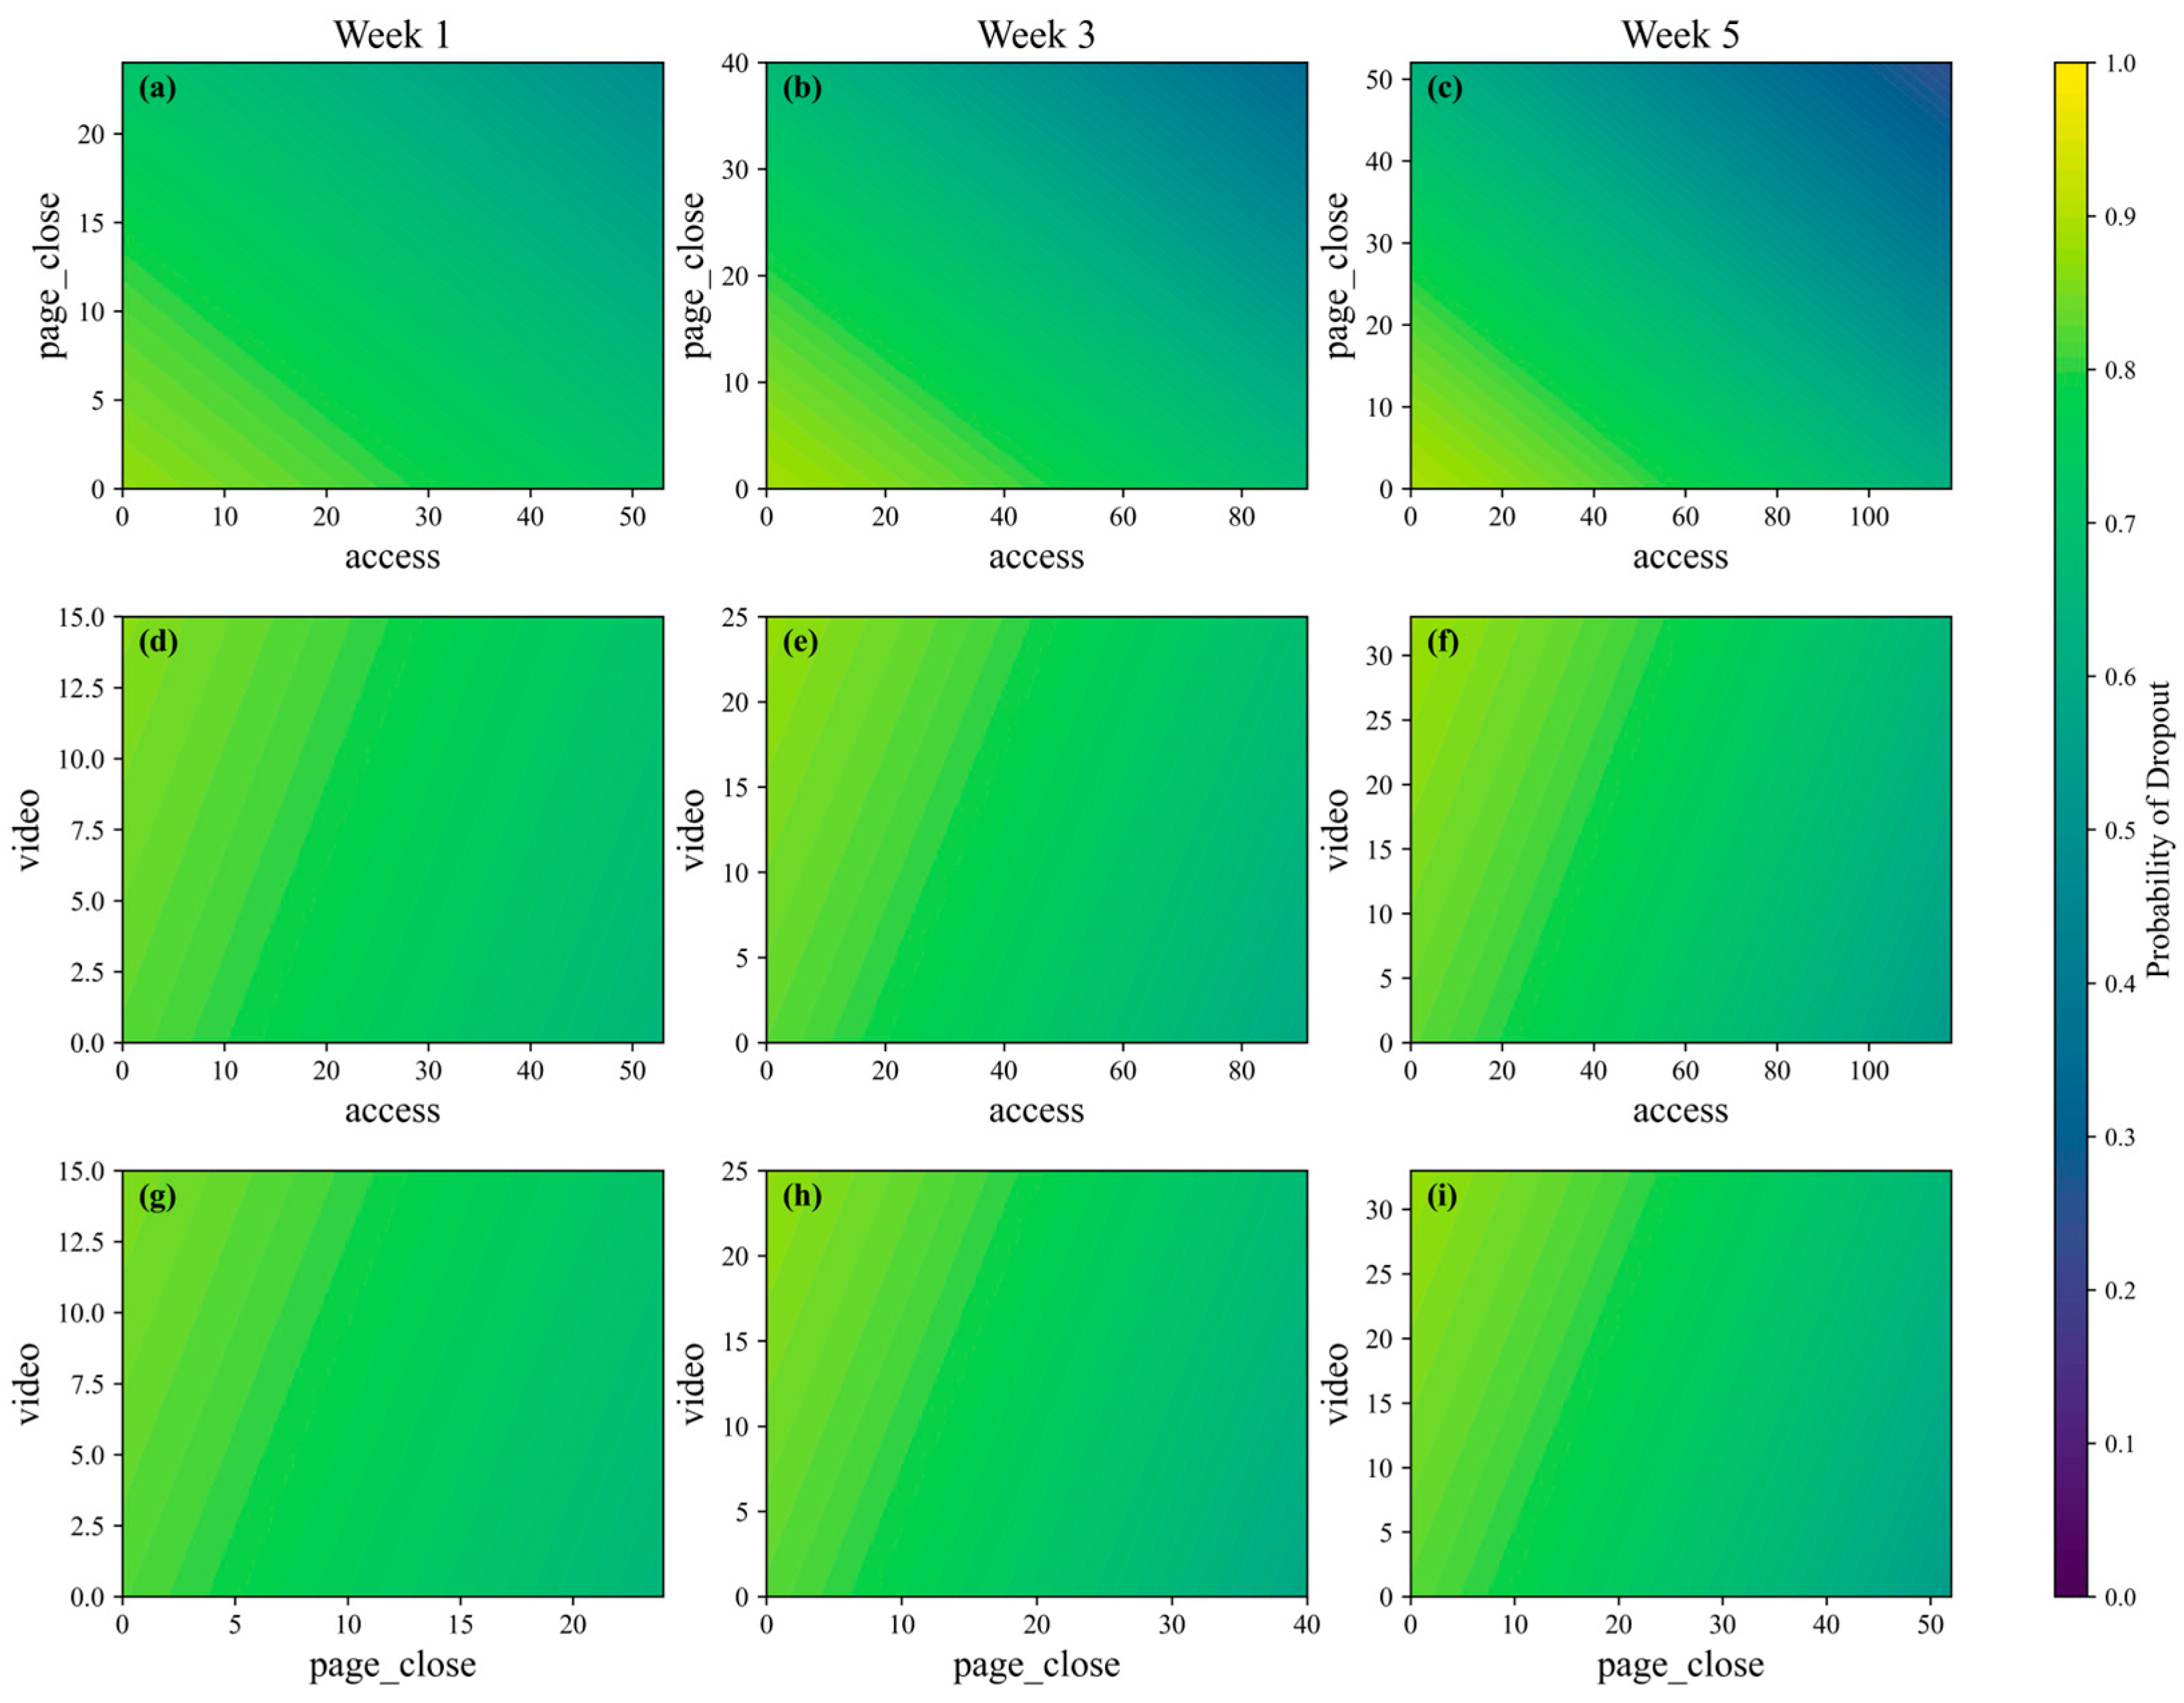
To avoid repetition and to better compare the interaction patterns across learning stages, the two-dimensional PDP heatmaps for Weeks 1, 3, and 5 were integrated into a single figure. As shown in
Figure 12, the columns represent the three learning stages, while the rows correspond to the three pairwise feature interactions: access–page_close, access–video, and page_close–video.
The interaction between access and page_close shows a relatively consistent pattern across the three stages. In
Figure 12a–c, students with low levels of access and page_close tend to have a higher predicted probability of dropout, whereas those with higher levels of both behaviors generally have a lower dropout probability. This suggests that sustained access to learning resources, together with continued interaction with the learning environment, is closely associated with learner persistence. The stability of this pattern across Weeks 1, 3, and 5 further indicates that access-related engagement remains a fundamental behavioral signal throughout the learning process.
However, the role of video engagement varies across learning stages. In Week 1, video is not included in the optimal feature subset, suggesting that task-oriented video learning is not yet a central predictor of dropout risk at the beginning of the course. In Weeks 3 and 5, the video becomes part of the selected feature subset and shows clearer interaction effects with both access and page_close. As shown in
Figure 12e,f, high video activity combined with low access is associated with a higher predicted probability of dropout, indicating that frequent video viewing alone does not necessarily represent effective engagement. Similarly,
Figure 12h,i show that the effect of video engagement also depends on its relationship with page_close. These results suggest that video engagement appears to be more meaningful when it is accompanied by broader resource access and active interaction with the learning environment.
Overall, the PDP results suggest a gradual change in dropout-related behavioral patterns. In the early stage, dropout risk is related mainly to whether learners establish basic and continuous interactions with the online learning environment. In the middle and late stages, the risk becomes more closely associated with the coordination among multiple behaviors, especially the relationships among video engagement, resource access, and interaction continuity. These findings suggest that dropout risk cannot be fully explained by low activity levels alone. It may also be associated with how different learning behaviors are coordinated across stages.
4.8. Summary of Interpretability Results
Taken together, the interpretability results suggest that the behavioral indicators associated with MOOC dropout vary across learning stages. In the early stage, the dropout risk is related mainly to basic interaction patterns, especially page_close and access. These features indicate whether learners maintain initial contact with the learning environment and learning resources. In the middle stage, the video becomes part of the selected feature subset, suggesting that engagement with core learning materials provides additional predictive information beyond general access and withdrawal-related behaviors. These findings indicate that the behavioral signals associated with dropout risk become more task-oriented as the course progresses. In the late stage, the same feature combination of page_close, access, and video remains relevant. These findings suggest that the relationship between dropout risk and learning behavior is related not only to overall activity level but also to the coordination among resource access, continued interaction, and engagement with learning materials.
Overall, these findings indicate stage-related changes in the behavioral features associated with dropout prediction. Rather than treating dropout as a purely static outcome, the results suggest stage-dependent differences in the behavioral features associated with dropout prediction.
4.9. Hypothesis Evaluation
H1 proposed that the relative importance of learning behaviors associated with dropout prediction exhibits stage-dependent variation. As shown in
Table 7, the overall ranking structure remained relatively stable across stages, with page_close and access consistently occupying the top two positions. However, video increased from fourth place in Week 1 to third place in Weeks 3 and 5, while navigate decreased from third to fourth place. These changes indicate that the relative contribution of certain learning behaviors evolves as learners progress through the course. Therefore, H1 is supported.
H2 proposed that from the early stage to the middle and later stages of learning, the learning behaviors that serve as the main predictors of dropping out are different. As shown in
Table 6, the optimal feature subset in Week 1 consisted of page_close and access, whereas Weeks 3 and 5 were characterized by a three-feature combination of page_close, access, and video. These results indicate that the most informative behavioral configuration changes as learning progresses. Therefore, H2 is supported.
Overall, the hypothesis verification results reinforce the view that MOOC dropout should be understood as a stage-dependent behavioral process characterized by evolving behavioral importance and interaction patterns.
5. Discussion
5.1. Stage-Dependent Patterns of MOOC Dropout
The findings suggest that the behavioral indicators associated with MOOC dropout differ across learning stages rather than remaining fixed throughout the course. Across Weeks 1, 3, and 5, the relative importance of behavioral features changed, indicating that dropout prediction should not rely only on a single static behavioral profile. Previous MOOC dropout studies have shown that behavioral traces such as resource access, video viewing, discussion participation, and assignment-related activities can be used to identify learners at risk of dropout (
Liang et al., 2023;
Shou et al., 2024;
C.-H. Yu et al., 2019). However, many studies still rely on aggregated behavioral indicators or overall activity measures (
S. Alghamdi et al., 2025;
Vecchi, 2026). The present study extends this line of work by showing that the predictive role of specific behaviors changes across learning stages.
In the early stage, dropout risk was associated mainly with fragile interaction continuity, reflected in limited resource access and frequent page proximity. One possible explanation is that learners at the beginning of a course are still becoming familiar with the course structure, platform environment, and learning requirements. Therefore, weak access and unstable interactions may indicate difficulty in establishing initial learning routines. In the middle and late stages, the predictive structure became more differentiated, and task-related behaviors, especially video engagement, became more relevant. This suggests that as the course progresses, dropout risk may be shaped not only by whether learners participate but also by how their participation is organized across different learning activities.
The Week 5 results indicate that visible engagement and disengagement-related risk may coexist at the late stage of learning. Some learners may still show activity, such as video watching or discussion participation, but these behaviors do not necessarily indicate stable persistence if they are not accompanied by broader resource access and task-related engagement. This pattern provides a basis for further discussion of behavioral imbalance in the following section.
5.2. Behavioral Imbalance and Its Role in Dropout Risk
This study highlights the role of behavioral imbalance in dropout during the middle and late stages. Video participation is often regarded as a positive signal of learning persistence, but research findings suggest that its actual effect depends on coordination with other behaviors. If intense video learning activity lacks extensive interaction, it will instead increase the risk of dropping out. This is consistent with engagement research that views learning engagement as a multidimensional construct rather than a single measure of activity frequency (
Maldonado-Mahauad et al., 2018). In this study, behavioral imbalance refers to a pattern in which learners rely heavily on one type of activity while showing limited participation in other learning behaviors. For example, frequent video watching may indicate continued exposure to course content, but if it is not accompanied by resource exploration, problem solving, or other forms of course interaction, it may represent a narrow form of engagement. One possible reason is that video watching alone can remain relatively passive, whereas successful course completion often requires learners to coordinate multiple activities, including accessing resources, completing tasks, and regulating their learning progress (
Li & Baker, 2016).
The week 5 results further illustrate why this imbalance is important in the late stage of learning. At this stage, visible learning activity does not necessarily indicate stable persistence. For example, video engagement may still be present, but when it is weakly connected with broader resource access or task-related engagement, it may reflect a narrow or poorly coordinated form of participation. This suggests that late-stage dropout risk may not simply reflect inactivity but may also emerge when learners remain active in limited ways without maintaining a balanced pattern of engagement.
5.3. Rethinking Dropout: From Activity Level to Engagement Patterns
These findings also challenge the common assumption that higher activity intensity necessarily indicates lower dropout risk. Although activity-count features are useful and easy to implement in early warning systems, they may oversimplify the learning process if they treat all activities as equally meaningful. This study revealed that merely relying on activity intensity alone cannot fully explain the phenomenon of dropping out of course. Previous studies on learning analytics and early warning systems have emphasized that predictive models should provide interpretable and actionable information rather than only risk scores (
Alalawi et al., 2025).
The present results suggest that dropout risk should be interpreted not only through the quantity of learner activity but also through the configuration of behavioral patterns. Maintaining participation across multiple behavioral dimensions may indicate a more stable learning pattern, whereas excessive reliance on a single type of behavior may signal potential risk when other forms of engagement remain weak. This perspective extends previous dropout prediction studies by shifting attention from whether learners are active to how learners are active. It is also consistent with research on explainable learning analytics, which emphasizes that predictive models should help educators understand the behavioral basis of risk rather than only provide classification outcomes (
Boujmiraz et al., 2026). For MOOC platforms and instructors, this means that a learner with high video activity should not automatically be classified as low risk. Instead, the system should examine whether video learning is accompanied by access to other resources, problem-solving behavior, and sustained interaction with course materials.
5.4. Implications for Stage-Specific Early Warning Systems
The phased behavioral patterns proposed in this study can provide practical references for the design of online learning early warning systems. Rather than applying the same warning indicators throughout the course, MOOC platforms may adjust monitoring and intervention strategies according to different learning stages.
In the early stage, interventions should focus on helping learners establish stable access and interaction habits. For learners with limited access or frequent page_close behavior, platforms may provide orientation reminders, course navigation guidance, weekly learning checklists, or prompts learners to return to key learning resources.
In the middle stage, the focus should shift from basic access to the balance among learning behaviors. For learners who frequently watch videos but show limited participation in other activities, instructors may provide guided learning paths that connect videos with quizzes, assignments, or supplementary resources. This can help learners transform content exposure into more active learning engagement.
In the late stage, early warning systems should not simply treat high activity as a positive signal. They should identify whether learners’ activities are balanced across multiple behavioral dimensions. For example, learners who frequently watch videos but show limited access to other resources, limited problem-solving behavior, or weak interactions with course materials may need targeted support. Practical interventions may include providing structured review plans, linking videos with specific assignments or quizzes, recommending supplementary resources, and offering guidance on how to integrate video learning with problem-solving and course completion tasks. For learners who remain active in discussions but show weak task-related engagement, instructors may provide more direct academic guidance or final-stage learning support.
5.5. Limitations and Future Work
Several limitations should be considered when interpreting the findings of this study. First, the KDDCUP2015 MOOC dataset provides final course-level dropout labels for learner-course enrollment records rather than week-specific dropout labels or exact dropout dates. Therefore, the Week 1, Week 3, and Week 5 variables should be interpreted as cumulative behavioral observation windows used to predict final dropout status rather than as direct records of dropout events occurring during those specific weeks. The same learner-course records were used across all three observation windows, which helps ensure that the cross-stage comparisons were not caused by changes in sample composition. However, the absence of an exact dropout timing prevents this study from determining precisely when learner disengagement occurred.
Second, because the courses in the KDDCUP2015 MOOC dataset lasted approximately one month, the Week 5 window represents a late-course cumulative observation window in this dataset. Some learners who eventually dropped out may have already shown very low activity in the later observation windows, which may influence the distribution of behavioral features at Weeks 3 and 5. Therefore, the observed later-stage stability should be interpreted as stability in the predictive behavioral patterns captured by the available log data rather than as direct evidence that all learners’ actual engagement trajectories became stable. Future studies with more fine-grained temporal labels could further examine how disengagement develops over time.
Third, the 39 courses in the dataset are anonymized, and detailed information about course discipline, instructional design, assessment structure, and learner background is limited. These course-level and learner-level factors may influence the relative importance of behaviors such as page_close, access, and video. Future research could use datasets with richer course metadata or apply multilevel modeling to examine whether the observed patterns differ across course types and learner groups.
Fourth, the proposed framework is more complex than simple activity-frequency models because it combines stage-based behavior construction, feature selection, predictive modeling, and interpretability analysis. However, its main contribution lies not only in improving prediction but also in providing a more interpretable account of how dropout-related behavioral indicators differ across learning stages. Future work could further compare this framework with simpler quantity-driven baselines in terms of predictive performance, interpretability, computational cost, and practical usability in real early warning systems.
Finally, because the KDDCUP2015 courses are relatively short, the stage division used in this study may not be directly generalizable to longer MOOCs or semester-long online courses. Future studies could extend the framework to longer time spans, use continuous-time models, and further investigate how behavioral patterns interact with learner motivation, course design, and instructional context.
6. Conclusions
This study regards MOOC dropout as a dynamically evolving process during each learning stage and proposes that the risk of dropout essentially reflects the transformation of learners’ participation patterns rather than merely the decline in activity levels. Through the analysis of behavioral patterns at different time points, the research revealed that learner disengagement mechanisms undergo systematic changes as the participation stage changes.
Specifically, in the early stage of the course, dropping out is related mainly to unstable interactive behaviors, manifested as restricted access to resources and irregular participation rhythms. After entering the middle stage, the prediction model shows stronger differentiation characteristics, and the importance of task-oriented behavior (especially video viewing) significantly increases. However, high video activity does not always play a protective role; if there is a lack of broader interactive support, it may instead reflect behavioral imbalance. This imbalance appears to persist into the late stage of the course, indicating that dropping out of course is more due to the persistent unbalanced participation pattern rather than a simple decline in activity levels.
This study offers a phased analytical perspective for understanding dropout phenomena in MOOCs, emphasizing the need to focus on the structure of participation rather than the sheer intensity of learning activities. Moreover, the results demonstrate the significant value of XAI techniques, which help uncover the underlying dynamics of learner behavior and enhance the interpretability of learning analytics. These findings suggest that early warning systems should incorporate phased indicators that prioritize the balance of learner engagement over simply tracking the frequency of activities. Future research may extend this framework in several directions: by employing continuous-time models for more granular analysis, the robustness of the findings across different platforms can be validated, and the relationships between phased behavioral patterns and learner motivations as well as contextual factors can be further investigated.