


Abstract
The International Civil Aviation Organization (ICAO) sets strict limits for aircraft ramp noise, a key source of which is Auxiliary Power Unit (APU) inlet noise. This paper presents a systematic and computationally efficient design methodology for APU inlet mufflers. The high-frequency noise necessitates validating a single-degree-of-freedom liner impedance model up to 10,000 Hz. The core innovation overcomes prohibitive full-passage simulation costs (days) by optimally selecting attenuation center frequencies from the source spectrum and implementing an axially segmented design. This approach enables efficient, targeted optimization (minutes per case) and leverages acoustic mode scattering at segment interfaces to enhance overall attenuation. The design is verified via high-fidelity, full-flow-path simulation. Experimental validation under various operating conditions shows good agreement with predictions, achieving approximately 9 dB reduction in overall A-weighted Sound Power Level (OASPL) with consistent performance. The results demonstrate the feasibility and effectiveness of the proposed rapid, precise, and efficient design framework.
1. Introduction
The International Civil Aviation Organization (ICAO) has established stringent noise limits for aircraft during ground operations to address community noise concerns. Ramp noise, in particular, has been a persistent focus, with regulations recommending levels not exceeding 85 dBA in maintenance areas and 90 dBA within 20-m of the aircraft. A significant contributor to this ramp noise is the Auxiliary Power Unit (APU), a gas turbine system that provides electrical and pneumatic power when the main engines are off. The primary noise sources of an APU include the compressor (generating inlet noise) and the combustion chamber/turbine (generating exhaust noise). Effective noise reduction, therefore, necessitates a dual approach: minimizing source noise through turbomachinery design and attenuating propagation path noise using inlet and exhaust mufflers.
While extensive research exists on primary engine noise, literature specific to APU noise and muffler design is comparatively limited. Existing studies have primarily focused on characterizing APU noise sources [1,2,3] or on the design and testing of exhaust mufflers [4,5]. For inlet mufflers, brief case studies exist [6,7], but a systematic, efficient design methodology tailored to the unique challenges of APU inlets has not been fully established. The design of APU inlet mufflers faces a distinct computational challenge: the required noise reduction frequency range is broad (from 20 Hz to over 10,000 Hz), with the dominant tone often located at a high frequency (e.g., the first blade-passing frequency near 9000 Hz). Performing high-fidelity acoustic propagation simulations across this full frequency range using conventional methods, such as the finite element method, imposes prohibitive computational costs. As indicated in this study, a single-frequency calculation can require hundreds of gigabytes of memory and several hours. A full-band analysis spanning the blade-passing and shock-noise frequencies can extend to several days, rendering iterative, simulation-based optimization of the muffler’s complex structure entirely impractical.
To overcome this barrier, this paper proposes a novel, efficient design methodology for APU inlet mufflers. The core innovation lies in decomposing the computationally intractable full-scale optimization problem through a strategy of optimal noise-reduction frequency selection coupled with axial segmentation of the inlet duct. This approach offers a dual advantage: it drastically reduces the computational domain for each sub-problem, enabling efficient optimization, and it actively exploits the acoustic modal scattering induced by impedance steps between segments to enhance overall attenuation.
The central hypothesis of this work is that this strategy of optimal frequency selection and axial segmentation can yield an inlet muffler design whose overall noise reduction performance is comparable to that achievable by a full-passage, broadband optimization, but at a fraction of the computational cost and time. Furthermore, the impedance discontinuities at segment interfaces are hypothesized to constructively scatter acoustic energy, thereby providing additional attenuation beyond what is predicted by considering the segments in isolation.
The validity of this approach and the above hypothesis is underpinned by two parallel foundational steps: (1) detailed experimental characterization of the APU inlet noise source spectrum, and (2) experimental validation of a single-degree-of-freedom liner impedance model up to 10,000 Hz, ensuring its reliability for high-frequency design.
The remainder of this paper is organized as follows. Section 2 details the experimental characterization of the APU inlet noise source and validates the acoustic propagation prediction method and the high-frequency impedance model. Section 3 presents the proposed efficient design methodology, including the optimal frequency selection and axial segmentation process, and reports the optimization design results. Section 4 describes the experimental validation of the optimized muffler’s performance, which serves to test the central hypothesis. Finally, Section 5 concludes the paper.
2. Experimental Characterization and Method Validation
2.1. Noise Source Measurement and Analysis
This study focuses on the inlet muffler of an Auxiliary Power Unit (APU). In this APU, the core compressor and the load compressor are mounted on opposite sides of the inlet volute. Both compressors have 11 blades and operate at a rated rotational speed of 49,300 rpm.
To characterize the inlet noise, six microphones were arranged on the rectangular inlet cross-section: two were placed equidistantly along the long side, and one along the short side. All microphones were oriented perpendicular to the cross-section, facing the APU. The APU’s bleed air and exhaust were ducted outside the test chamber to prevent their noise from interfering with the inlet noise measurements. Tests were conducted under two operating conditions: “Shaft Only” and “Max ECS”. The “Shaft Only” mode refers to the APU providing only electrical power, without supplying bleed air. In contrast, the “MAX ECS” mode requires the APU to supply both electrical power and bleed air.
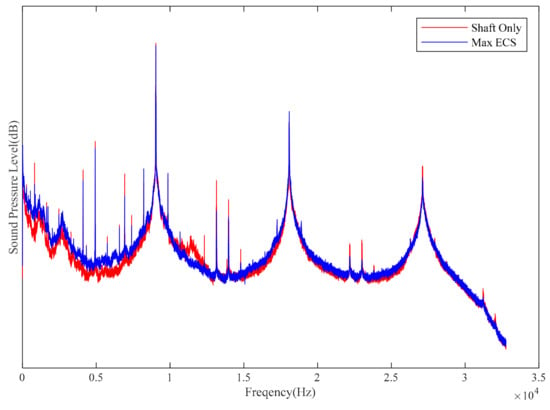
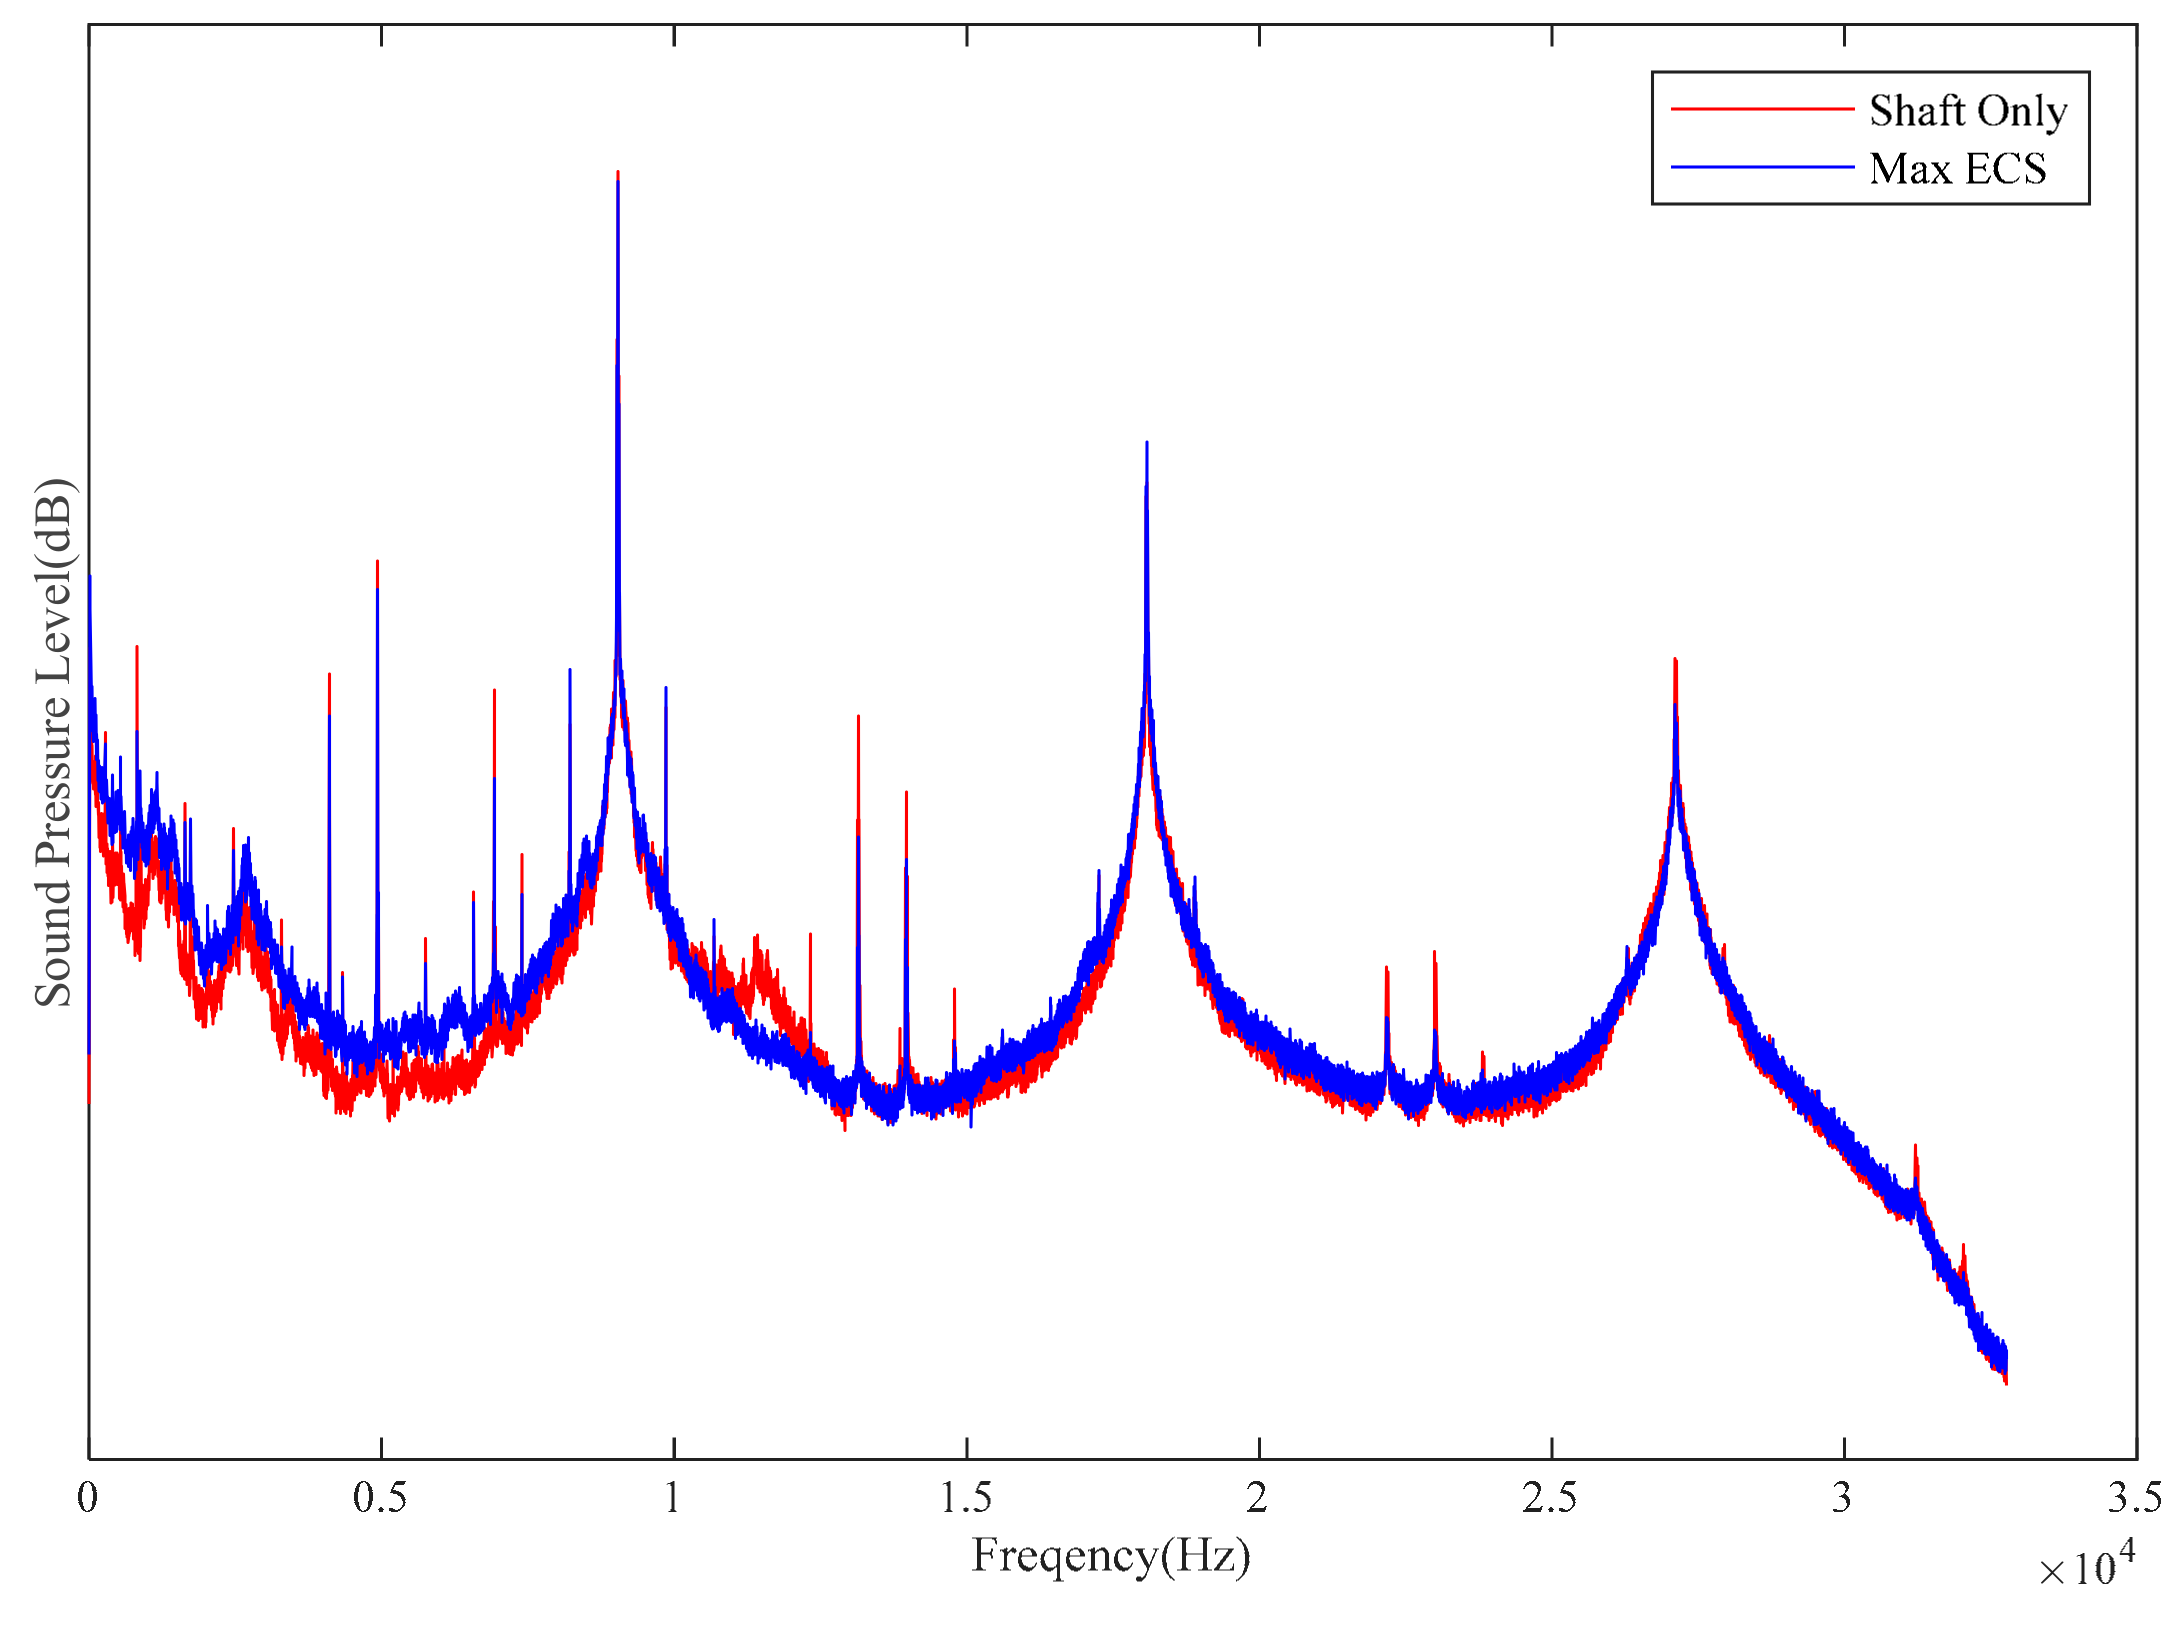
The spectra from the six microphones were averaged linearly. The resulting spectrum is shown in Figure 1. The inlet noise exhibits distinct pure-tone characteristics, with prominent peaks at 9038 Hz, 18,062 Hz, and 27,130 Hz. These frequencies correspond to the first, second, and third blade-passing frequencies (BPF) of the compressor, respectively. While the second (18,062 Hz) and third (27,130 Hz) harmonics exceed 18,000 Hz and are subject to significant attenuation both within the muffler and in air, the peak at the first blade-passing frequency (9038 Hz) is notably dominant—it is 19 dB higher than other pure tones and the broadband noise below 15,000 Hz. Apart from the peaks at the first three blade-passing frequencies, most remaining spectral peaks are attributed to shock noise generated by the supersonic tip speeds of the compressor blades.
Figure 1.
Spectrum of the inlet noise.
A comparison of the noise spectra from the six measurement points in the inlet duct confirms that the spectral characteristics recorded by all microphones are in close agreement, with no significant shift in peak frequencies. Among these, the sound pressure level at the first blade passing frequency varies by less than 1 dBA across the measurement positions, indicating a relatively uniform acoustic field distribution over the inlet cross-section at this characteristic frequency, with no pronounced evidence of acoustic modal nodes.
The spectral characteristics of the two operating conditions are very similar. The main differences are that under the MAX ECS condition, the sound pressure level at the first blade passing frequency is about 1 dB lower than under the Shaft Only condition, and at the second blade passing frequency, it is approximately 2 dB lower.
2.2. APU Inlet Acoustic Propagation Prediction and Validation
The linearized Euler equations are widely accepted as suitable for predicting acoustic propagation in the inlet ducts of power units [8]. In this study, these equations serve as the governing equations for the numerical prediction of acoustic propagation inside the APU inlet.
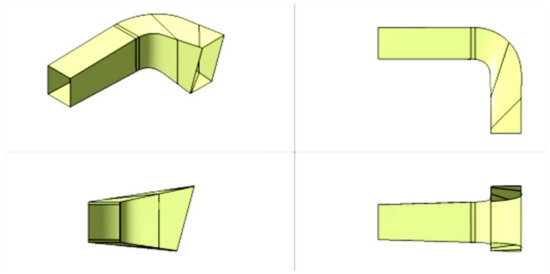
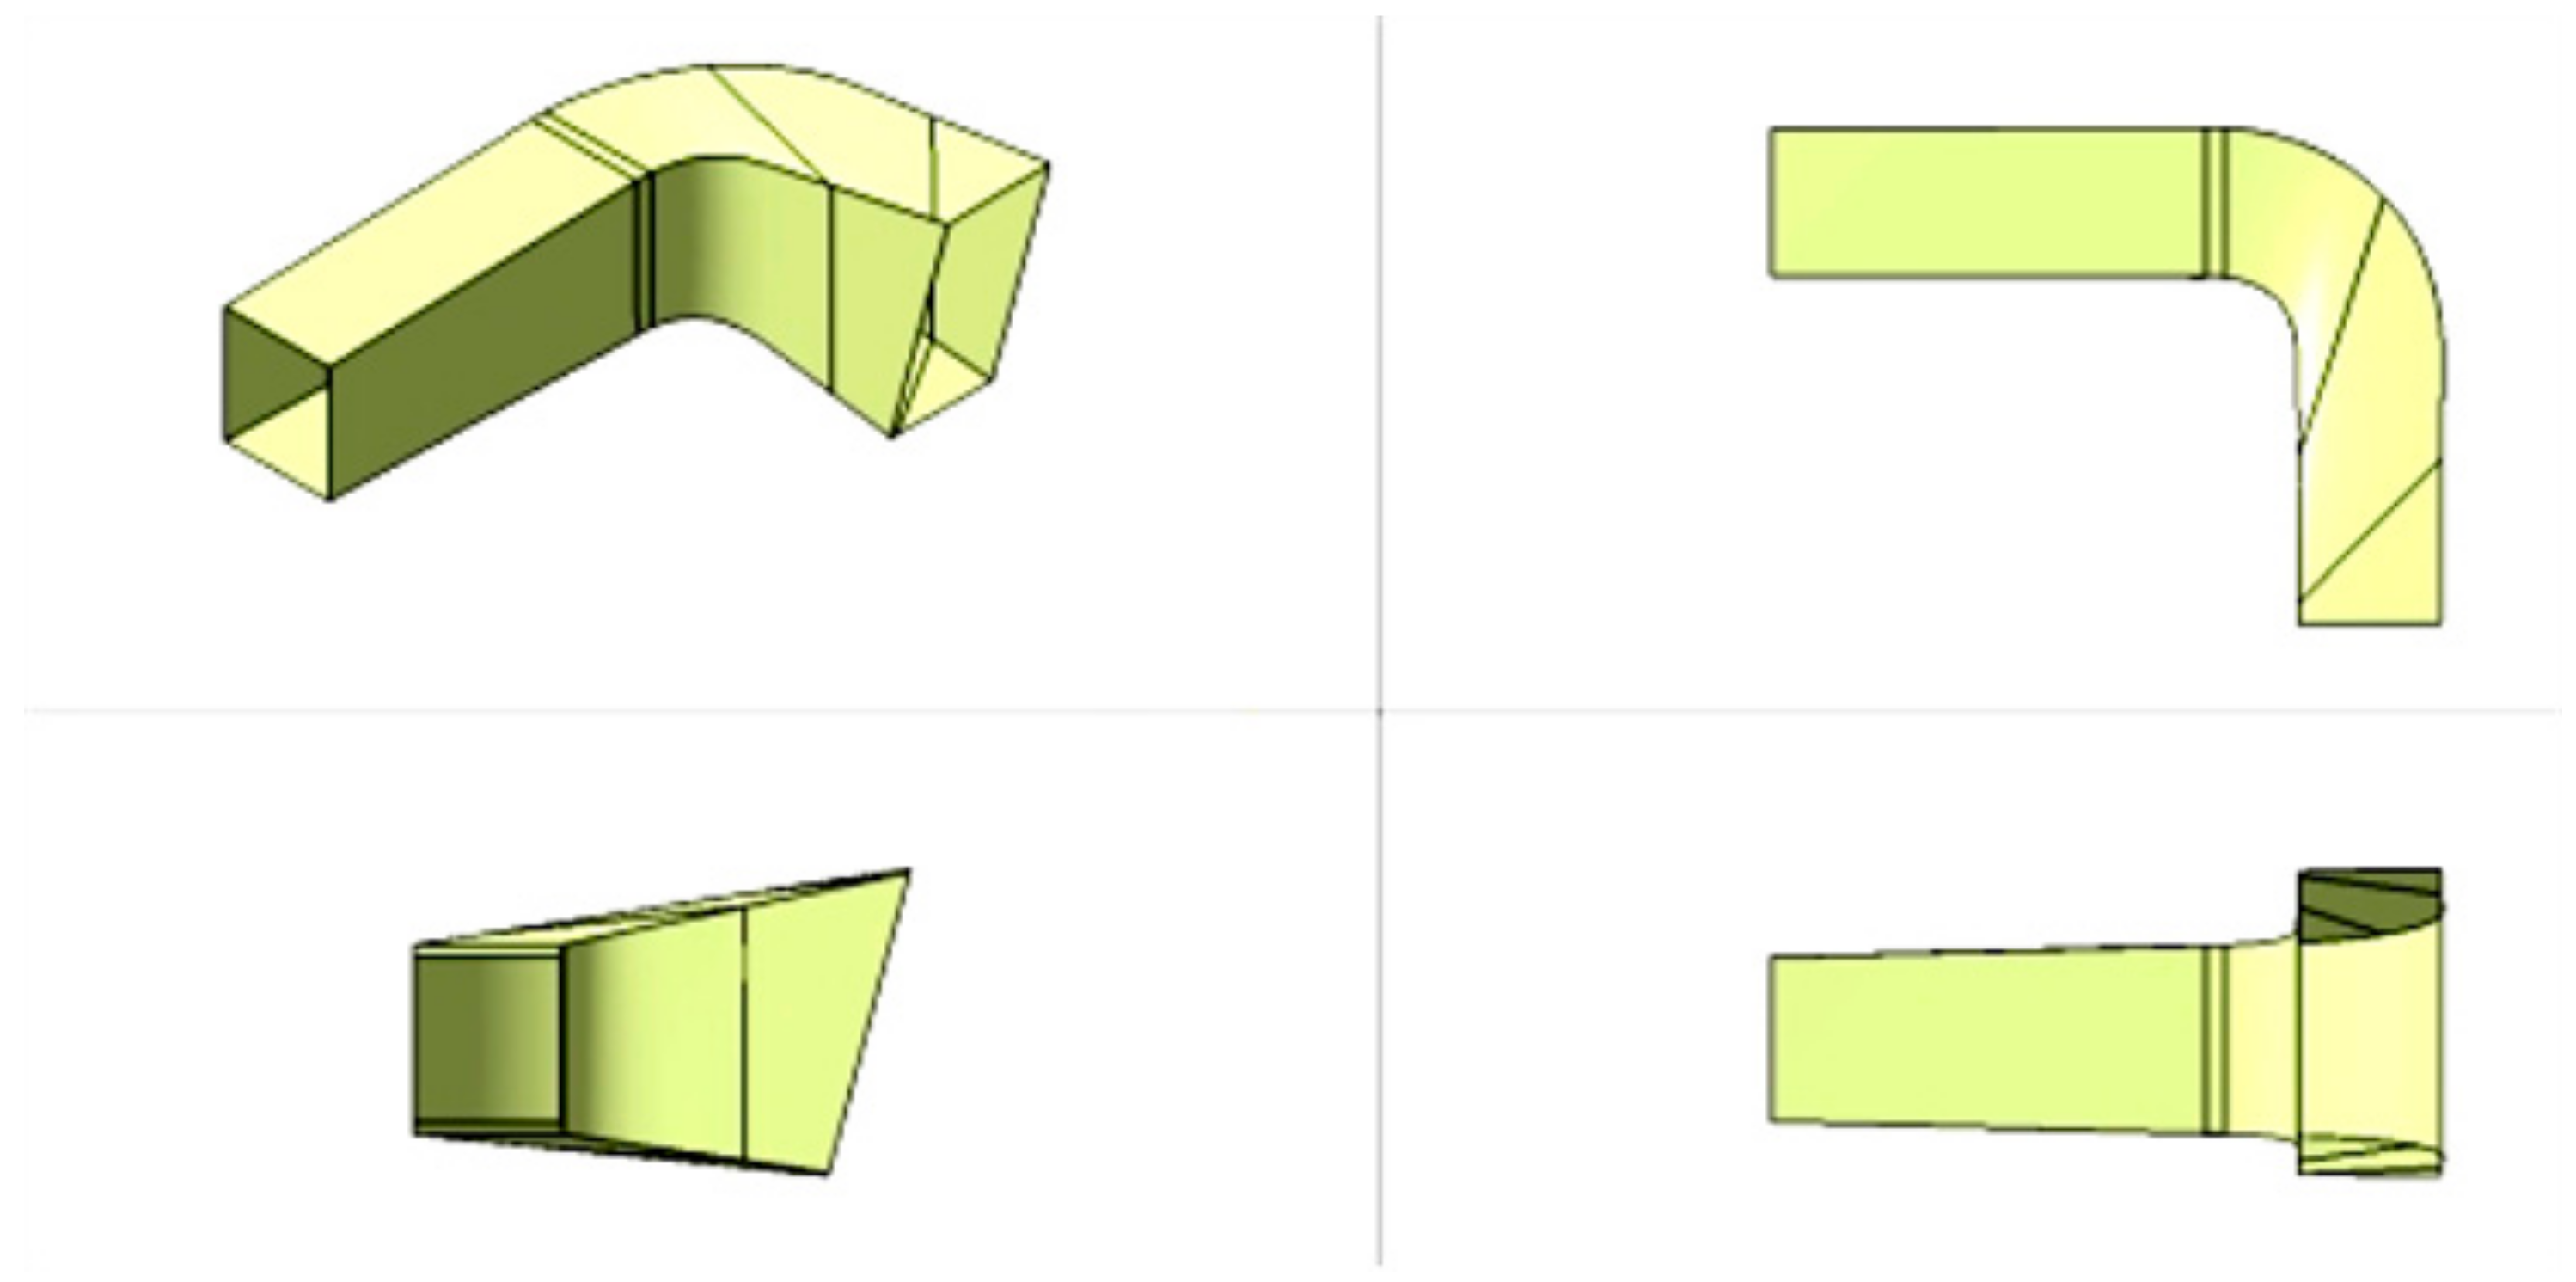
The three-dimensional computational domain encompasses the entire inlet flow path, extending from the measurement plane (defined in Section 2.1, analogous to the source location) to the noise radiating outward surface. The geometry, as partially shown in Figure 2, has an overall length of approximately 1.4 m and a height of about 1.0 m, featuring an irregular shape that transitions from a small rectangular inlet to a larger, gradually expanding cross-section. The numerical mesh consists of approximately 4.7 million hexahedron mesh. The maximum element size was constrained to ensure at least 10 elements per acoustic wavelength at the highest frequency of interest (10,000 Hz), guaranteeing adequate resolution for acoustic propagation. The background flow information calculated using RANS is added to the mean flow term of the linearized Euler equations.
Figure 2.
The flow passage of the inlet muffler.
The acoustic effect of the muffler liner is characterized by an acoustic impedance boundary condition. For a locally reacting liner, the corresponding expression for this boundary condition is given by Ingard [9].
The optimal design of the muffler requires delivering structural parameters suitable for engineering drawings. The acoustic impedance model provides the essential link between these structural parameters and the acoustic performance. This study employs a single-degree-of-freedom (SDOF) liner impedance model publicly released by Goodrich [10], which forms the foundation of the optimization approach when combined with the acoustic propagation prediction method. Similar to most empirical models, it decomposes the total acoustic impedance (Z) into several components:
where represents the combined effects of viscous resistance, viscous reactance, and thickness; is the acoustic resistance term under high sound pressure levels; denotes the acoustic resistance due to grazing flow; and accounts for the influence of high sound pressure levels on the acoustic reactance. Typically, the acoustic liner impedance model is validated as applicable below 3000 Hz. For the APU inlet, however, the dominant noise frequency reaches up to 9000 Hz. The applicability of this impedance model at such high frequencies will be validated in Section 3.3.
Regarding source modeling, a reasonable representation of the noise source is required. This is implemented by exciting all cut-on propagating acoustic modes with equal amplitude. The number of these cut-on modes is determined by the duct geometry and the properties of the air. For the noise radiation surface, non-reflecting boundary conditions were applied.
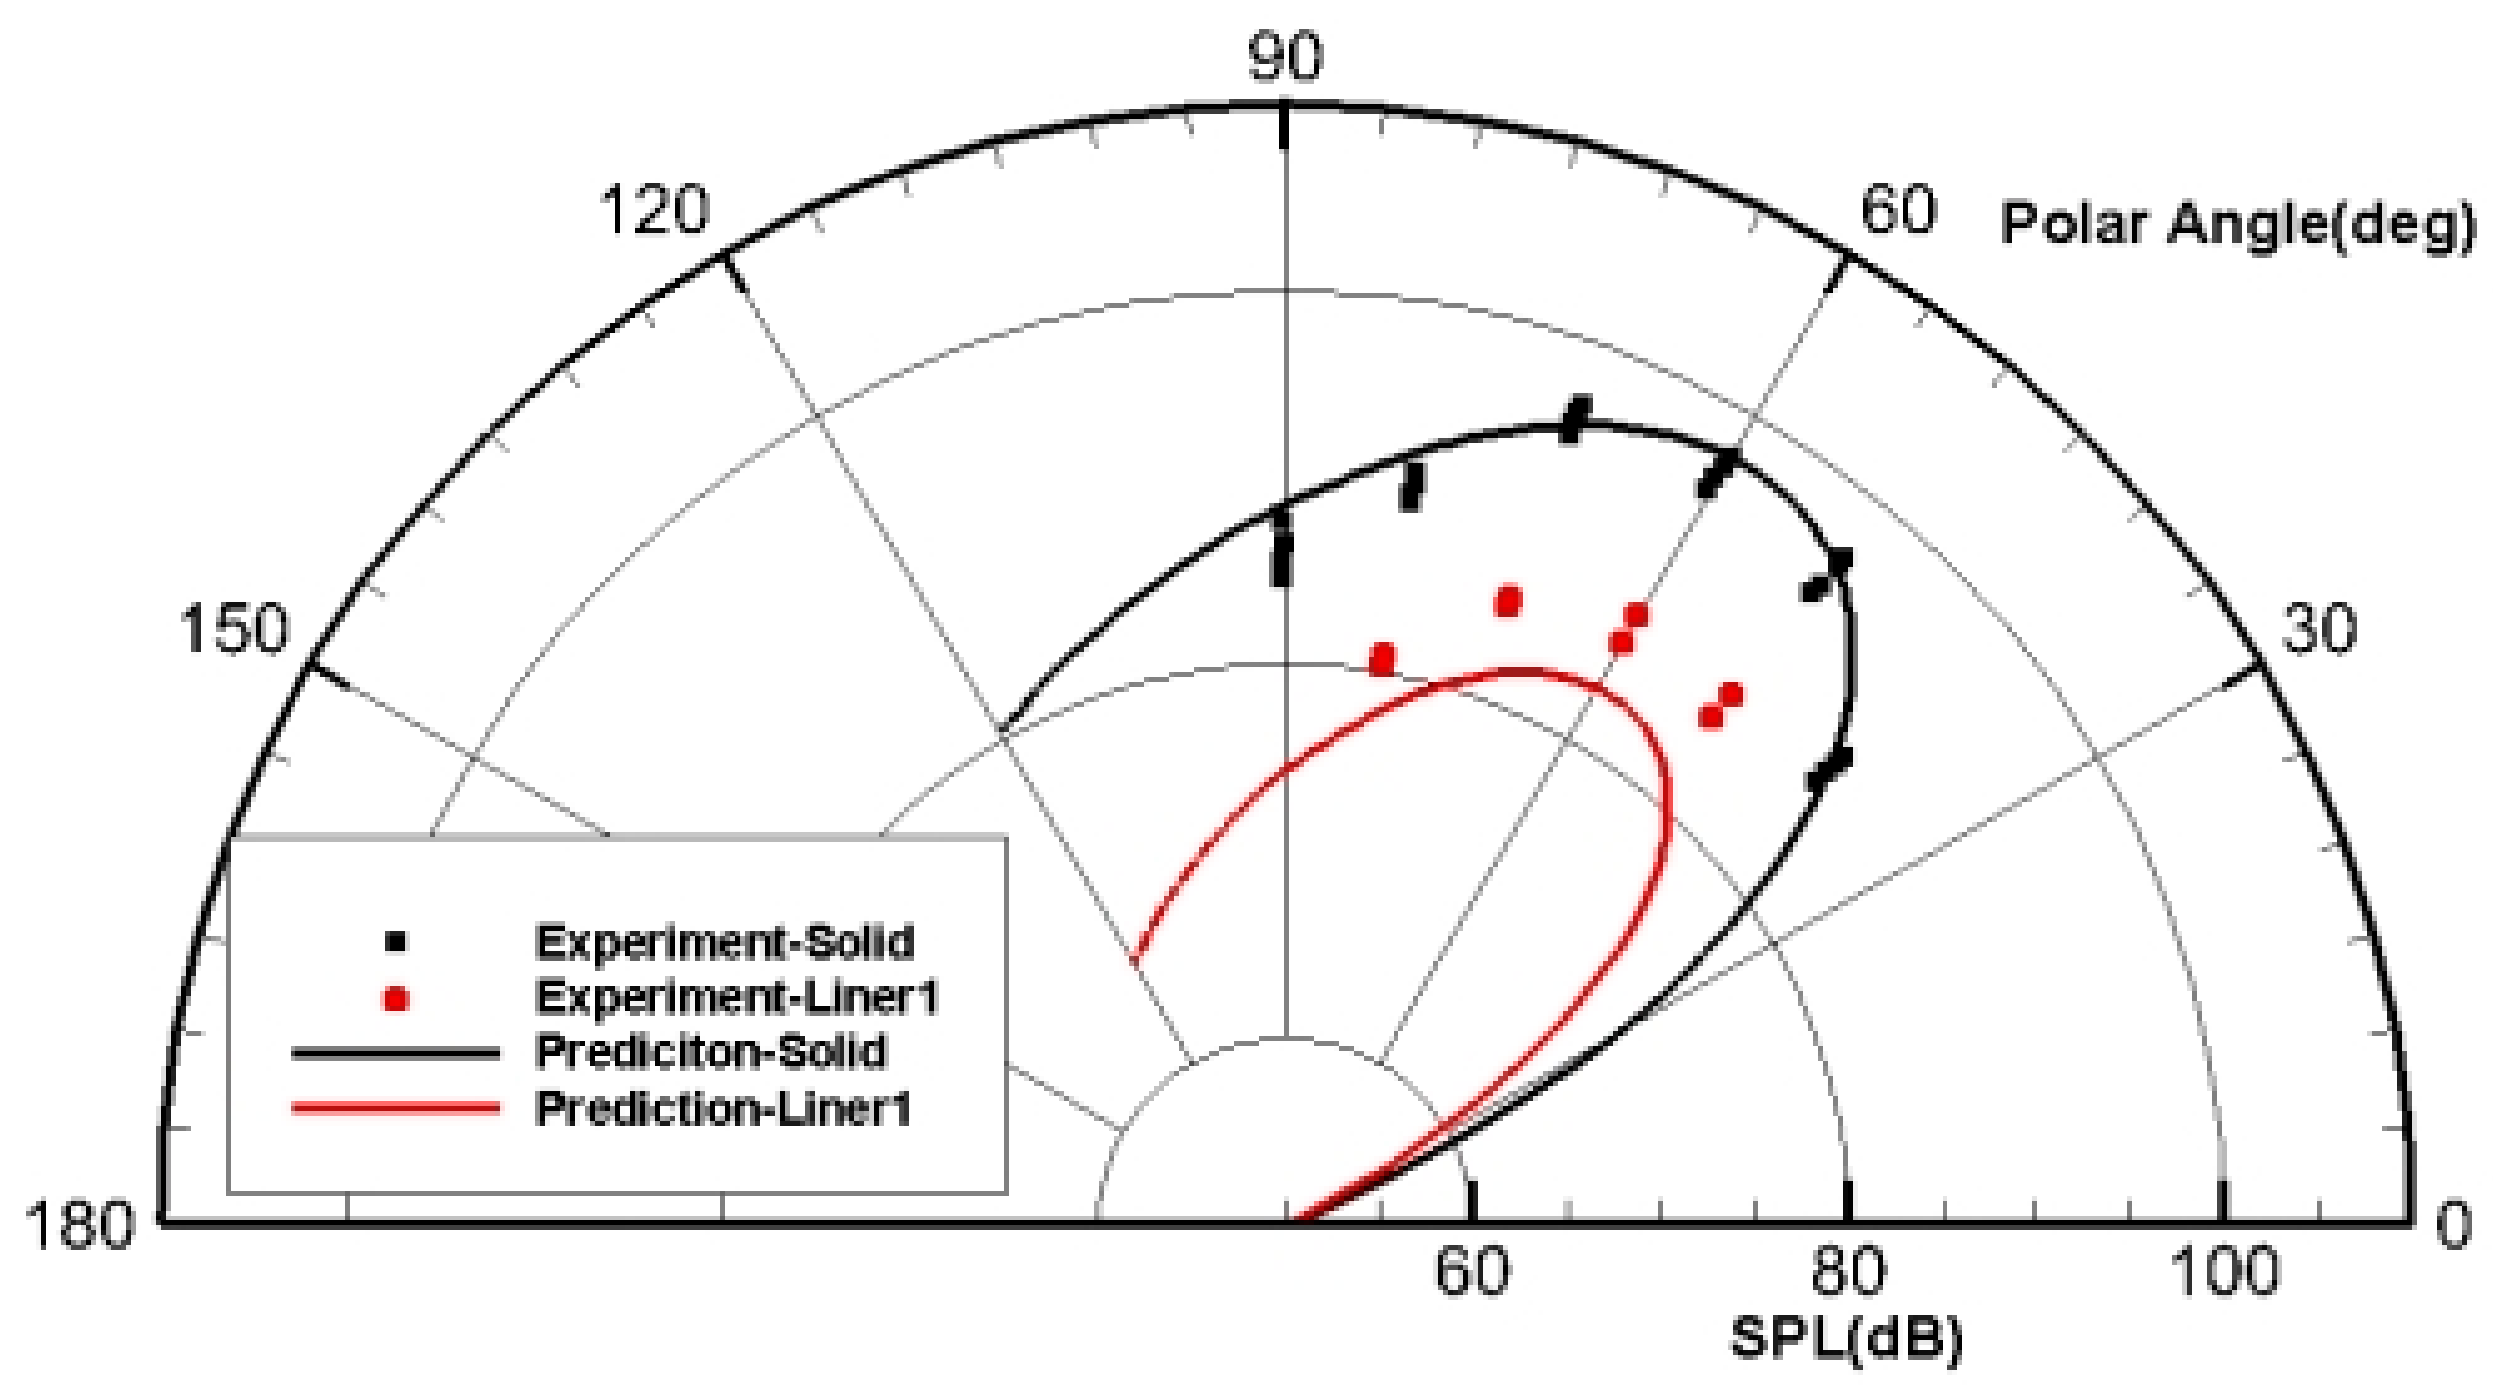
The JT15D series turbofan engine, developed by Pratt & Whitney, was used for validation. During the 1970s, NASA Lewis and Langley Research Centers conducted a series of experiments on the JT15D to study fan noise propagation characteristics [11]. Their experimental results provide reliable data for validating the present numerical simulations. In those experiments, the fan rotational speed was 6750 rpm, corresponding to a first blade-passing frequency (BPF) of 3150 Hz. The dominant propagating mode under this condition was mode (−13, 0). Far-field acoustic directivity measurements were performed for a hard-wall configuration and for three liners with different perforation rates.
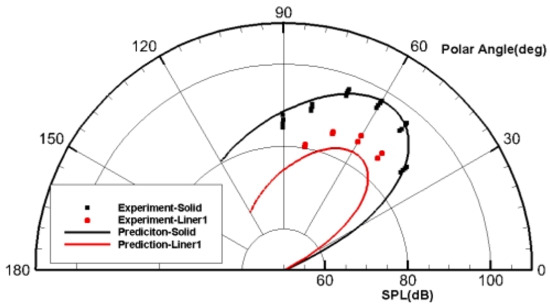
A comparison of numerical and experimental far-field directivity is shown in Figure 3. The simulation reproduces the overall trend of sound pressure distribution satisfactorily. Although the predicted levels under the liner boundary condition are slightly lower (within 3 dB) than the measured data, the discrepancy is acceptable for this frequency range considering the geometric complexity and modeling assumptions. The agreement demonstrates that the computational approach adopted here is applicable for inlet noise propagation with impedance boundaries, and justifies its use for the APU inlet at higher BPF. Some increase in uncertainty at 9000 Hz is anticipated owing to the shorter wavelength and more complex modal content.
Figure 3.
Comparison of directivity between numerical prediction and experimental test.
While the JT15D validation provides confidence in the propagation solver and boundary condition implementation, it is acknowledged that differences in geometry (axial fan vs. centrifugal compressor/volute) and flow conditions between the turbofan and the APU may introduce some extrapolation uncertainty, particularly for very high-order modes.
2.3. Acoustic Impedance Eduction and Model Validation
Early methods for educing the acoustic impedance of liners were limited by the requirement of plane waves within the flow duct, typically restricting the upper frequency to around 3000 Hz [12,13]. Consequently, the validation of liner impedance models at higher frequencies was insufficient. Since the dominant peak frequency of the APU inlet noise source is approximately 9000 Hz, it is necessary to assess the applicability of the Goodrich model used in this study across the entire frequency range of interest. Therefore, relevant experimental validation was conducted.
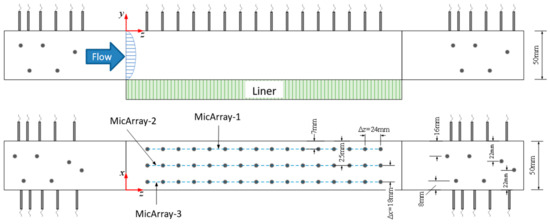
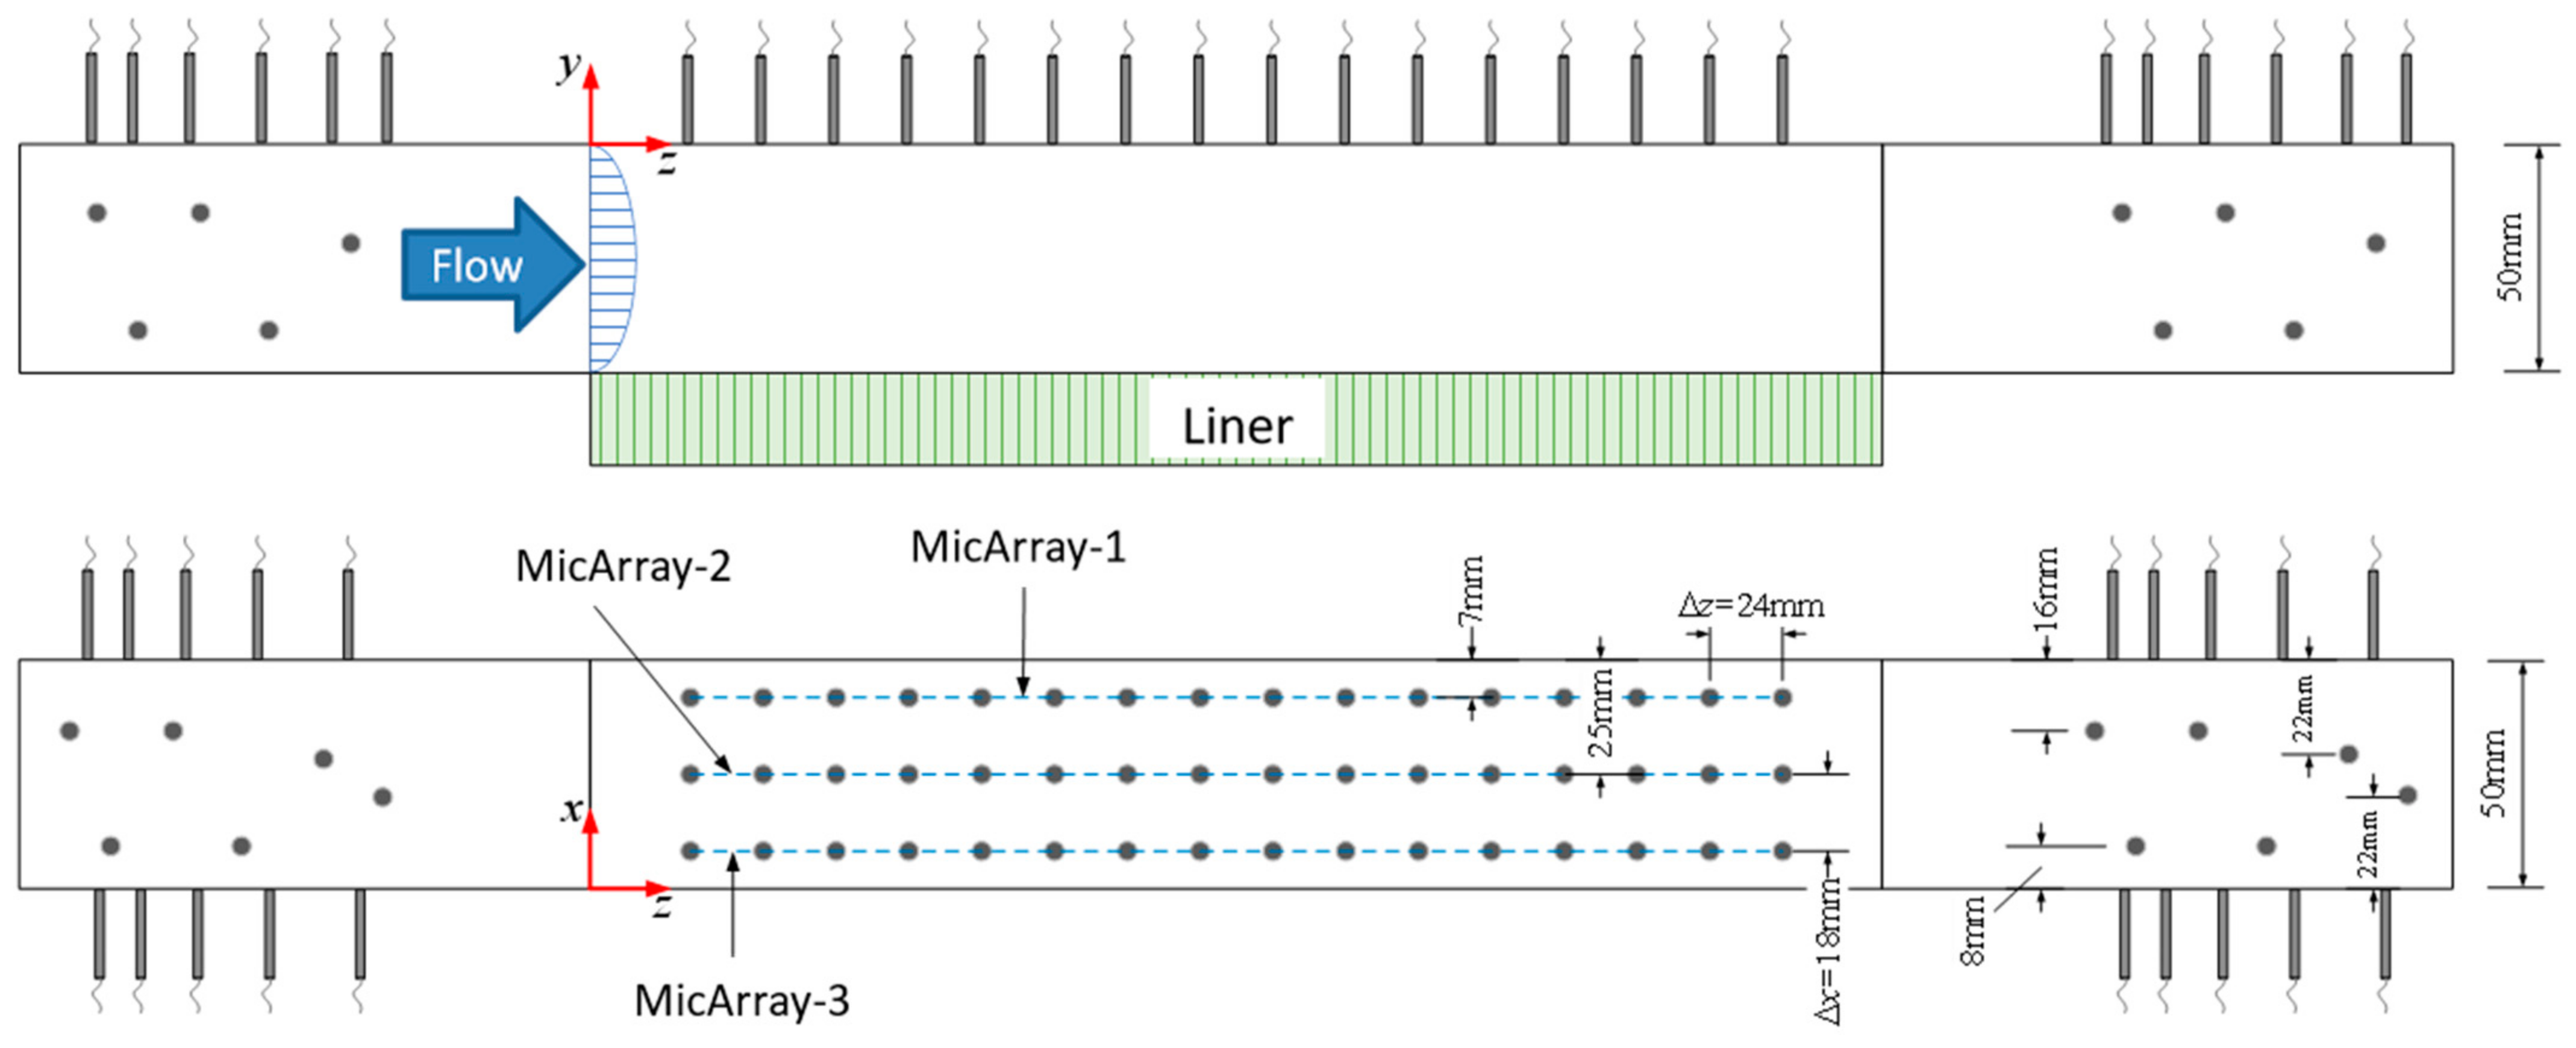
The acoustic impedance test platform is largely similar to a conventional acoustic flow duct [14]. The core section for liner installation, however, differs, as shown in Figure 4. This broadband acoustic impedance eduction method has been presented in recently published articles [15]. An array of microphones, arranged in 3 columns and 16 rows, is installed on the wall opposite the test liner.
Figure 4.
Schematic of microphone layout for high-frequency impedance eduction test.
The three-dimensional straightforward method was employed to measure the liner’s acoustic impedance. This method overcomes the plane-wave incidence limitation of the traditional straightforward method, thereby increasing the upper frequency limit for impedance testing in flow ducts and eliminating the need for modal control. For a square duct with a cross-sectional dimension of 50 mm × 50 mm, when the frequency of the incident sound wave is below the cut-on frequency of the spanwise mode m = 3, denoted as f(3,0) = 10,100 Hz (at Ma = 0.14), the sound pressure measured by the microphone array on the upper wall of the liner test section can be expressed as:
where M is the number of spanwise modes; r denotes the column index of the microphone; s is the row index of the microphone; Lx and Ly are the spanwise and vertical lengths of the duct cross-section, respectively; xr is the spanwise coordinate of the microphone. The three columns of microphones can decompose a maximum of 3 spanwise modes (m = 0, 1, 2) and 8 axial modes, with each mode containing forward and backward propagating components. Bms represents the component of each spanwise mode at the axial position s:
where N is the number of vertical modes; pms is the sound pressure of the m-th order spanwise mode at position s; kz,m,n is the axial wavenumber, which can be expressed as:
where k is the wavenumber; m and n are the modal indices in the two cross-sectional directions; kxy,m,n is the cross-sectional wavenumber for mode, i.e.,
The measured sound pressures at the microphone points can be written in matrix form:
where B is the matrix composed of Bms; p is the matrix of complex sound pressures measured by all microphones; T represents the mapping relationship between the measured sound pressures from the fixed-position microphone array and the cross-stream modal waves, expressed as:
where x0, x1 and x2 are the spanwise coordinate positions of the three microphone columns. Substituting into the equation yields the complex matrix B. Each column of B contains the amplitude and phase information of each cut-on spanwise mode at the 16 axial measurement positions:
Chen et al. [16] recommended using the complex sound pressure of the dominant spanwise mode (m = md) for Prony decomposition to obtain up to 8 axial modes kz,md,n scattered by the impedance boundary. The axial scattered mode with the largest amplitude, kz,md,nd, is then selected. The vertical wavenumber ky,md,nd in the liner section is calculated according to the dispersion relation:
Subsequently, the acoustic impedance of the liner is obtained using the Myers–Ingard boundary condition [17]:
In practice, however, the impedance of a liner in a duct is independent of the incident acoustic mode. Every cut-on cross-stream mode is scattered by the liner. Therefore, the complex sound pressure component of each cross-stream mode at the axial positions—that is, each column in the matrix—can be decomposed to obtain its respective axial scattered modes, which can then be used to educe the acoustic impedance value.
The test specimen was a single-degree-of-freedom (SDOF) liner with a perforated plate thickness of 0.25 mm, hole diameter of 1.2 mm, porosity of 7.6%, and honeycomb core depth of 32 mm.
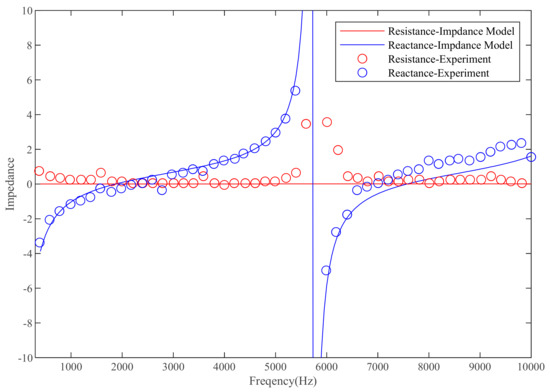
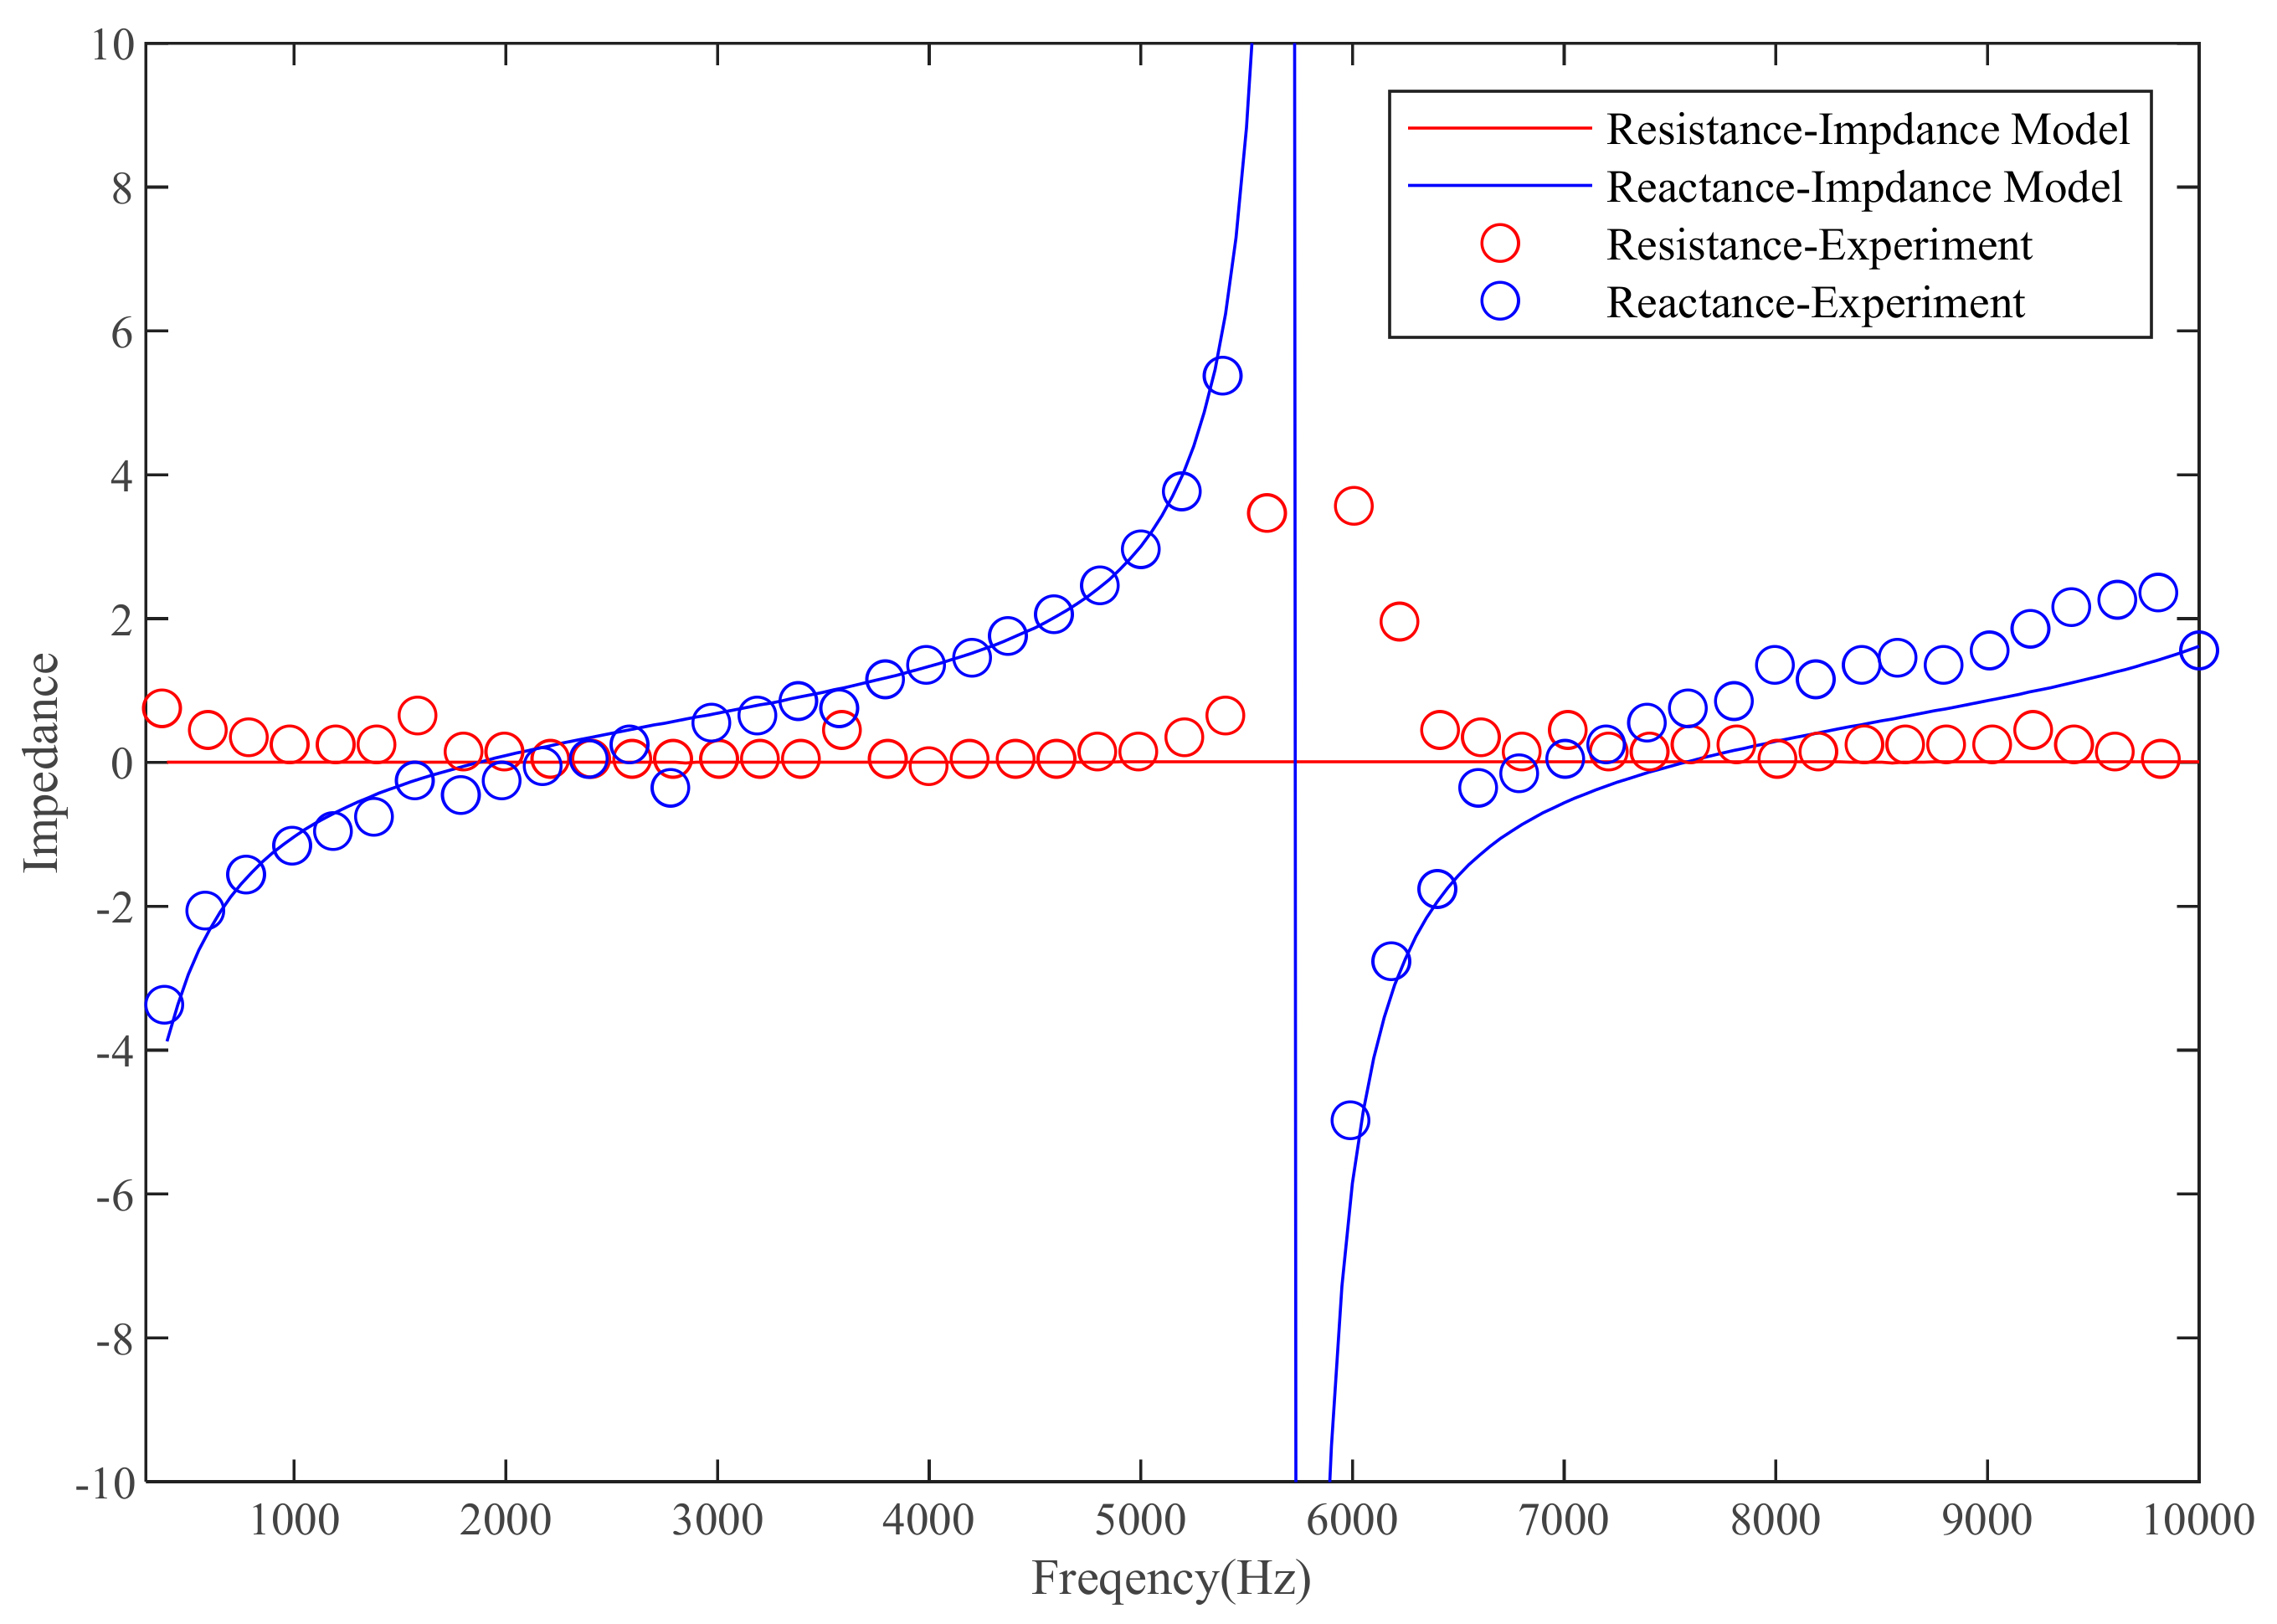
Here, only the test results at a flow velocity of 0.17 Ma are presented, as similar conclusions are observed at other flow velocities. Based on the multimodal extraction method described earlier, the distribution of incoming acoustic modes does not affect the acoustic impedance testing; therefore, it is unnecessary to control the distribution of incoming acoustic modes. These points have already been explained in the article. Figure 5 shows the measured acoustic impedance results of the liner specimen. Within the frequency range of 400 Hz to 10,000 Hz, the impedance model accurately predicts the liner’s acoustic impedance, demonstrating its applicability in the high-frequency region. From a full-frequency perspective, the acoustic resistance changes gradually with frequency, while the acoustic reactance exhibits a clear inverse cotangent relationship. Near 5800 Hz, oscillations are observed in the acoustic resistance educed from all cross-stream modes. This is an inherent limitation of the Myers–Ingard boundary condition when educing impedance from sound pressure information on the duct wall at anti-resonance frequencies.
Figure 5.
The validation of impedance model at high frequency.
3. Proposed Method and Its Application
The APU muffler is typically required to provide noise attenuation in the frequency range of 20 Hz to 10,000 Hz. Within this range, the inlet noise spectrum (Figure 1) exhibits a prominent peak at the first blade-passing frequency (9038 Hz), as well as shock noise at the rotor shaft frequency (821.7 Hz) and its harmonics.
Performing large-scale, high-frequency acoustic propagation simulations using the finite element method imposes extremely high demands on computational memory. The complete acoustic analysis of the inlet in this study requires hundreds of gigabytes of memory and several hours of computation time even for a single frequency. For simulations covering the full frequency range of 20 Hz to 10,000 Hz, which includes the blade-passing and shock-noise frequencies, the computation time extends to approximately five days, rendering subsequent optimization design impractical.
3.1. Efficient Design Method Based on Optimal Frequency Selection and Axial Segmentation
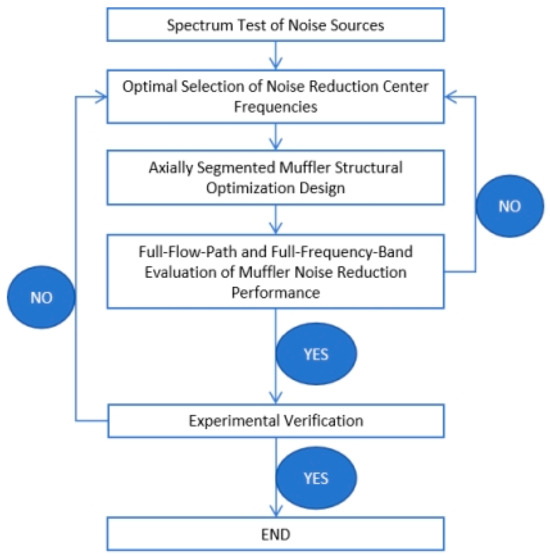
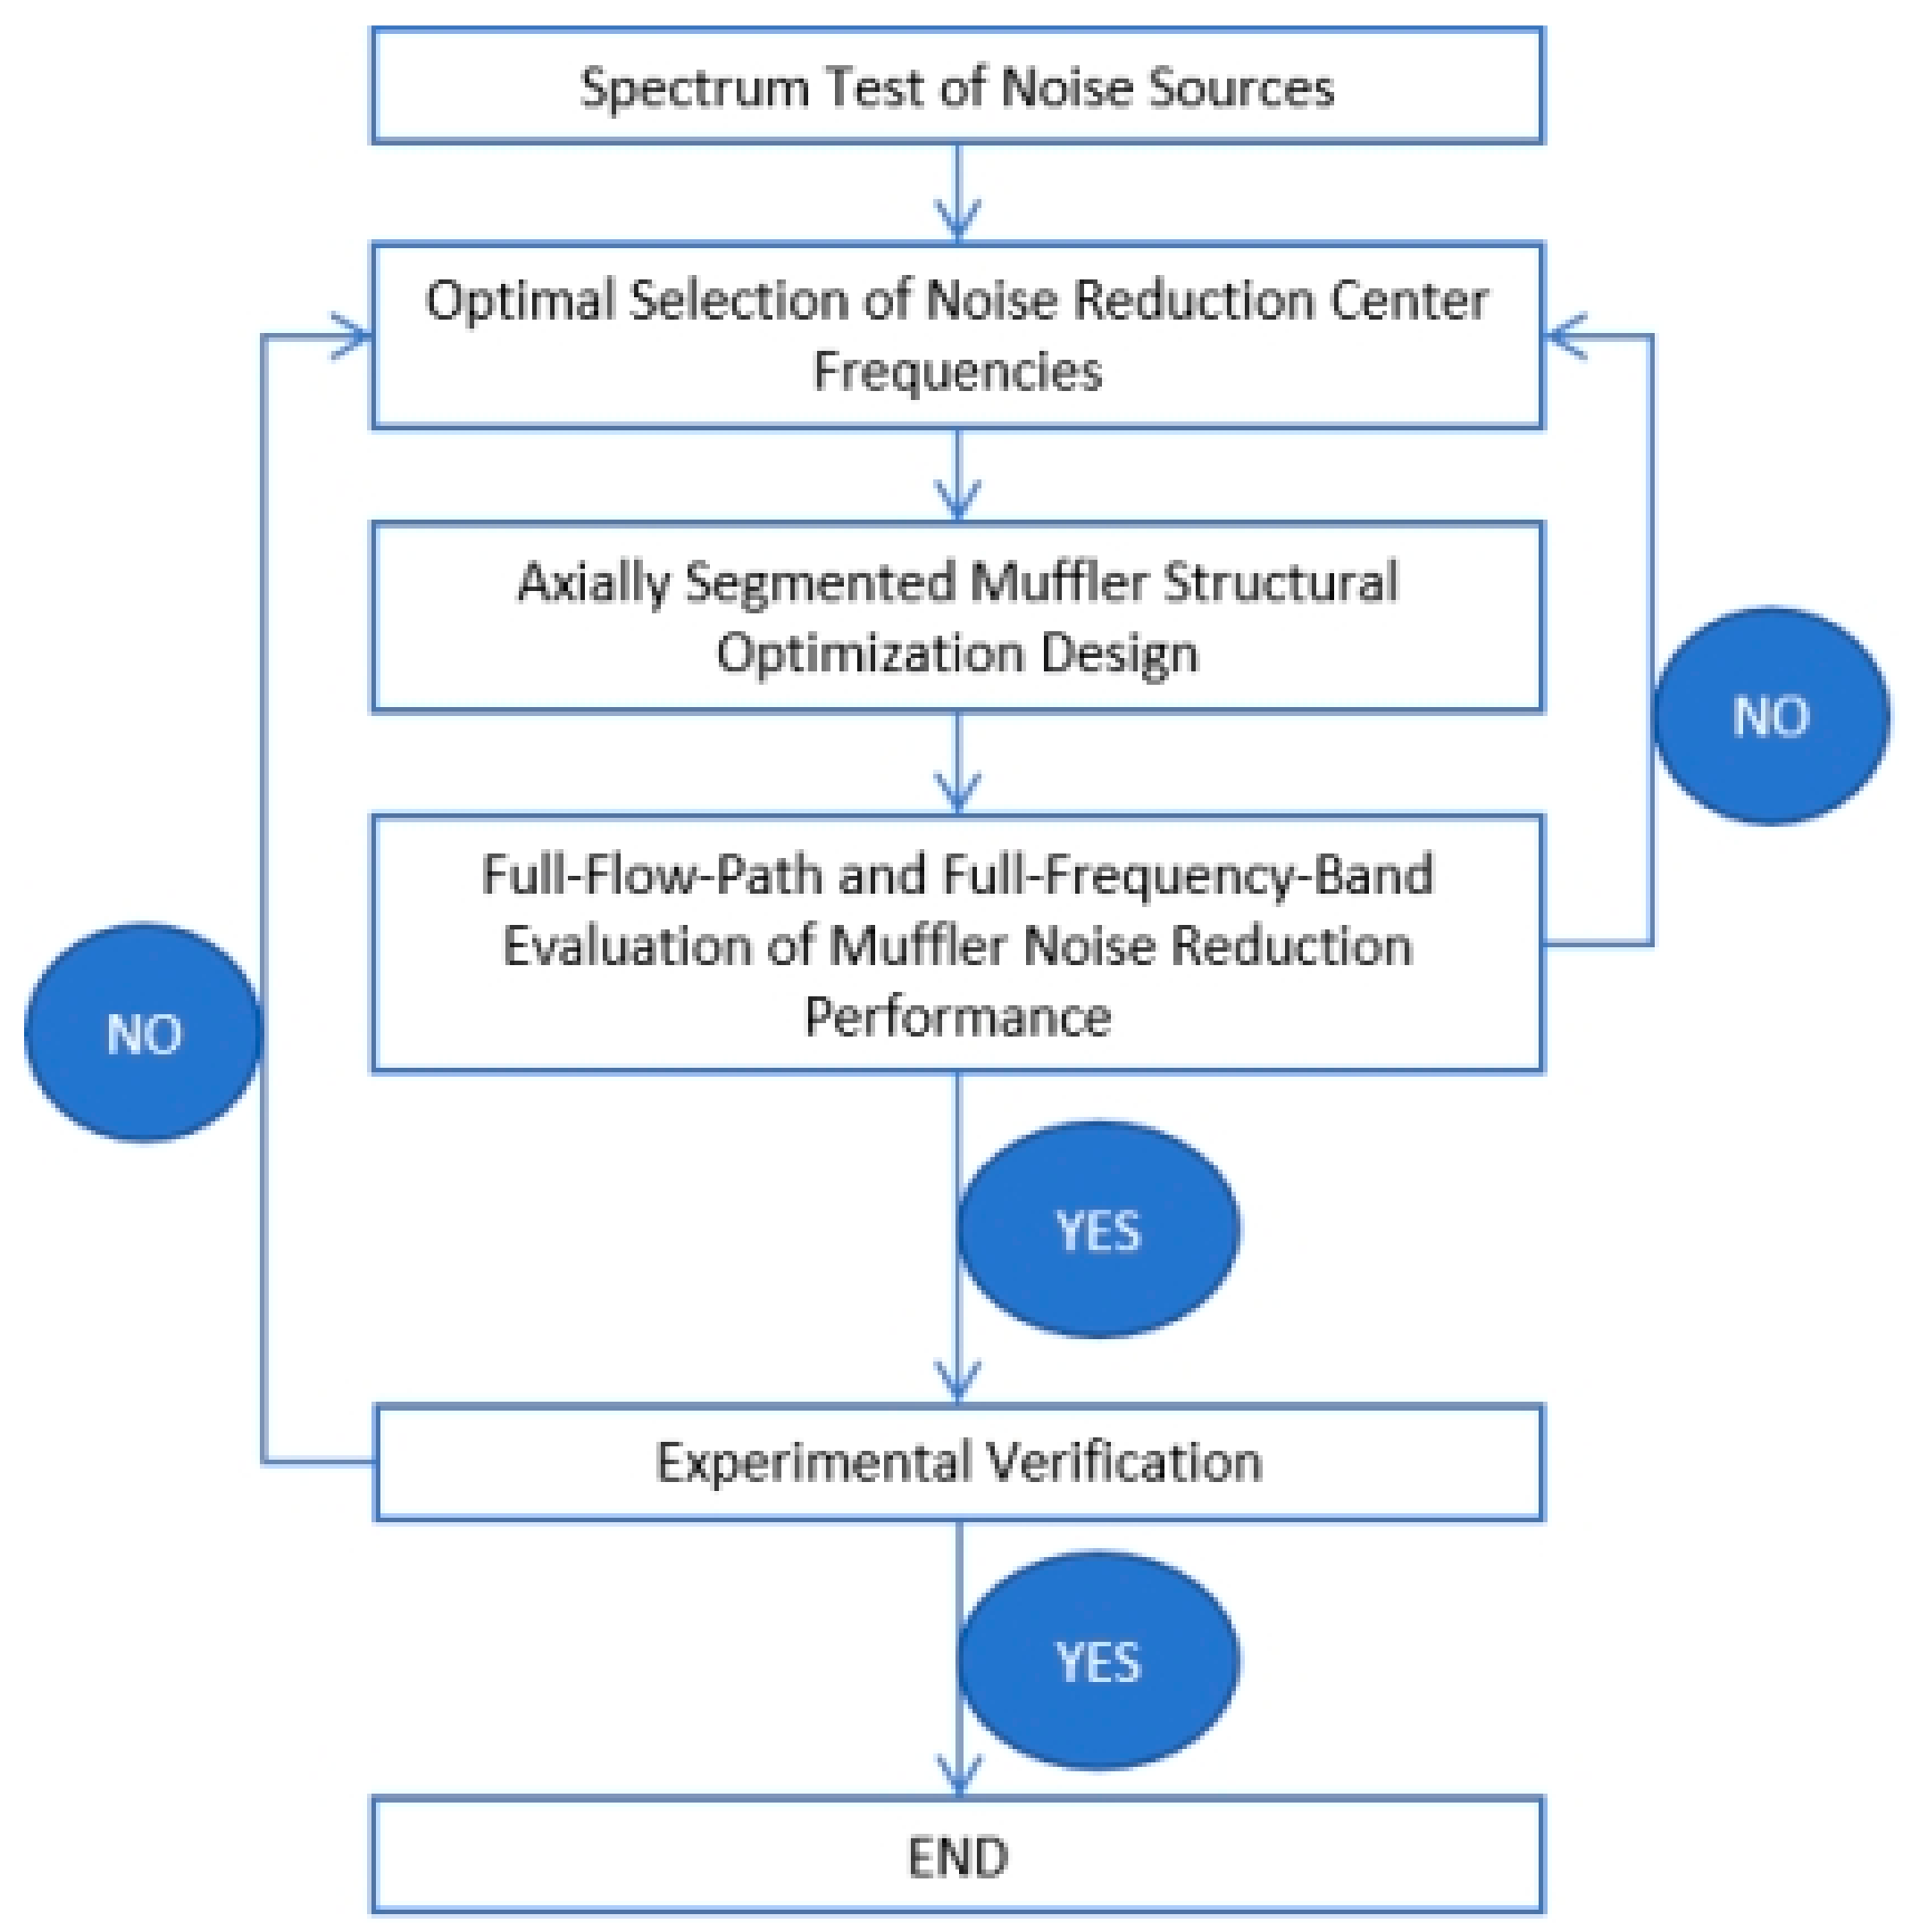
To address the high computational cost associated with full-flow-path optimization, this paper proposes an efficient design process based on optimal noise-reduction frequency selection and axial segmentation. Figure 6 illustrates the proposed systematic design method for the APU inlet muffler, which comprises the following steps. First, several key noise-reduction center frequencies are selected based on the inlet source spectrum, and the required maximum insertion loss along with its bandwidth is defined for each frequency range. Subsequently, based on these center frequencies and bandwidths, the inlet duct is divided axially into multiple segments, and the muffler’s structural parameters are optimized separately within each segment. Finally, a full-passage simulation covering the source frequency bands is conducted to evaluate the overall reduction in sound power level. A feedback loop is incorporated into this process; if the full-passage simulation indicates that the design targets are not met, the parameters for the frequency selection are adjusted.
Figure 6.
Overall design process of the inlet muffler.
With this method, each segment is responsible for only one target noise-reduction frequency. Moreover, thanks to the reduced computational domain and the fact that some segments are designed solely for low-frequency noise control—allowing for the use of coarser meshes—the overall mesh count is significantly decreased. Consequently, a single simulation case requires only about ten minutes of computation time and tens of gigabytes of memory, thereby substantially improving optimization efficiency. Furthermore, the acoustic impedance steps between segments are leveraged to induce modal scattering within the inlet duct, which enhances the overall noise-reduction performance.
3.2. Optimization Design
As mentioned, a single-degree-of-freedom (SDOF) liner structure is employed in this study. Its noise-reduction performance in the frequency spectrum primarily follows a Gaussian-like distribution curve. The assumed functional form is as follows:
where b is the center frequency, a is the peak noise reduction, and c defines the bandwidth.
To reduce computational time and memory usage, the computational domain is divided into seven segments. This number was chosen as a practical compromise between design granularity and computational efficiency. A preliminary study indicated that increasing the number of segments beyond seven yielded diminishing returns in optimization flexibility while linearly increasing the pre-optimization center frequency search dimension. The axial length of each segment (ranging from ~0.15 m to ~0.25 m) was initially set proportional to the acoustic wavelength at its target center frequency (λ = c/f, where c is the speed of sound) to ensure sufficient axial length for effective attenuation, and then adjusted slightly during the optimization of structural parameters to fit the physical geometry.
The noise-reduction spectrum of each segment is described by a Gaussian curve, and the overall spectrum of the inlet muffler is obtained by superimposing these seven curves. The total noise reduction is then calculated based on the source spectrum and the superimposed Gaussian curves. With the total noise reduction as the objective, a genetic algorithm (GA) is applied to search for the seven optimal noise-reduction center frequencies. The GA population size is set to 210, with a crossover probability of 0.8 and a mutation probability of 0.1. The optimization is run for 400 generations, and convergence is assumed when the change in the best fitness value (total OASPL reduction) is less than 0.01 dB over 20 consecutive generations. It should be noted that this selection method does not account for the acoustic modal scattering and reflection caused by impedance steps between segments. However, as such scattering generally enhances noise reduction, the present analysis can be considered a slightly conservative estimate of the overall performance. Based on empirical data, the bandwidth for each segment is set to 500 Hz, with a peak noise reduction of 5 dB~8 dB. The Gaussian bandwidth and peak attenuation range were chosen based on preliminary analyses of the SDOF liner’s typical attenuation characteristics and empirical data from similar applications. To assess the robustness of the optimization outcome to these assumed parameters, a limited sensitivity study was conducted. The center frequency optimization was repeated with bandwidths of 400 Hz and 600 Hz. The resulting optimal center frequencies shifted by less than 3%, and the predicted overall OASPL reduction varied by less than 0.2 dB, indicating that the design outcome is not critically sensitive to the exact choice of the assumed Gaussian parameters within a reasonable range.
The muffler’s structural parameters—namely, orifice diameter, faceplate thickness, perforated panel porosity, and honeycomb cavity depth—serve as the design variables. Within a segment, the liner on each of the four walls is treated as an independent structure, with its own set of these four variables, resulting in a total of 16 design variables per segment. A genetic algorithm (GA) is employed for this global search due to its robustness in handling non-linear, multi-modal problems. Constraints are applied based on manufacturability: d ∈ [0.8, 1.5] mm, t ∈ [0.2, 0.5] mm, σ ∈ [5%, 15%], D ∈ [20, 50] mm. The GA population size is set to 160, with a crossover probability of 0.8 and a mutation probability of 0.1. The optimization is run for 400 generations, and convergence is assumed when the change in the best fitness value (total OASPL reduction) is less than 0.01 dB over 20 consecutive generations. These settings differ from the settings for noise-reduction center frequencies selection mentioned in the previous text.
3.3. Design Results and Analysis
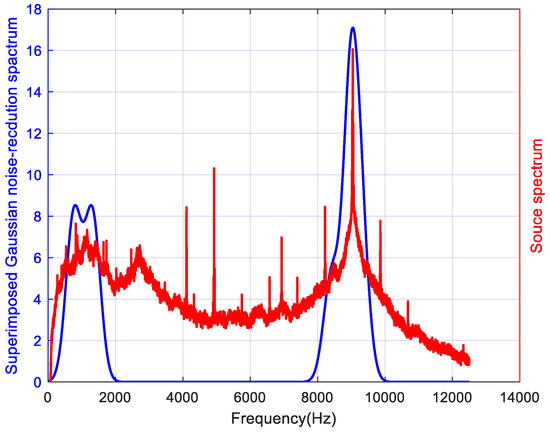
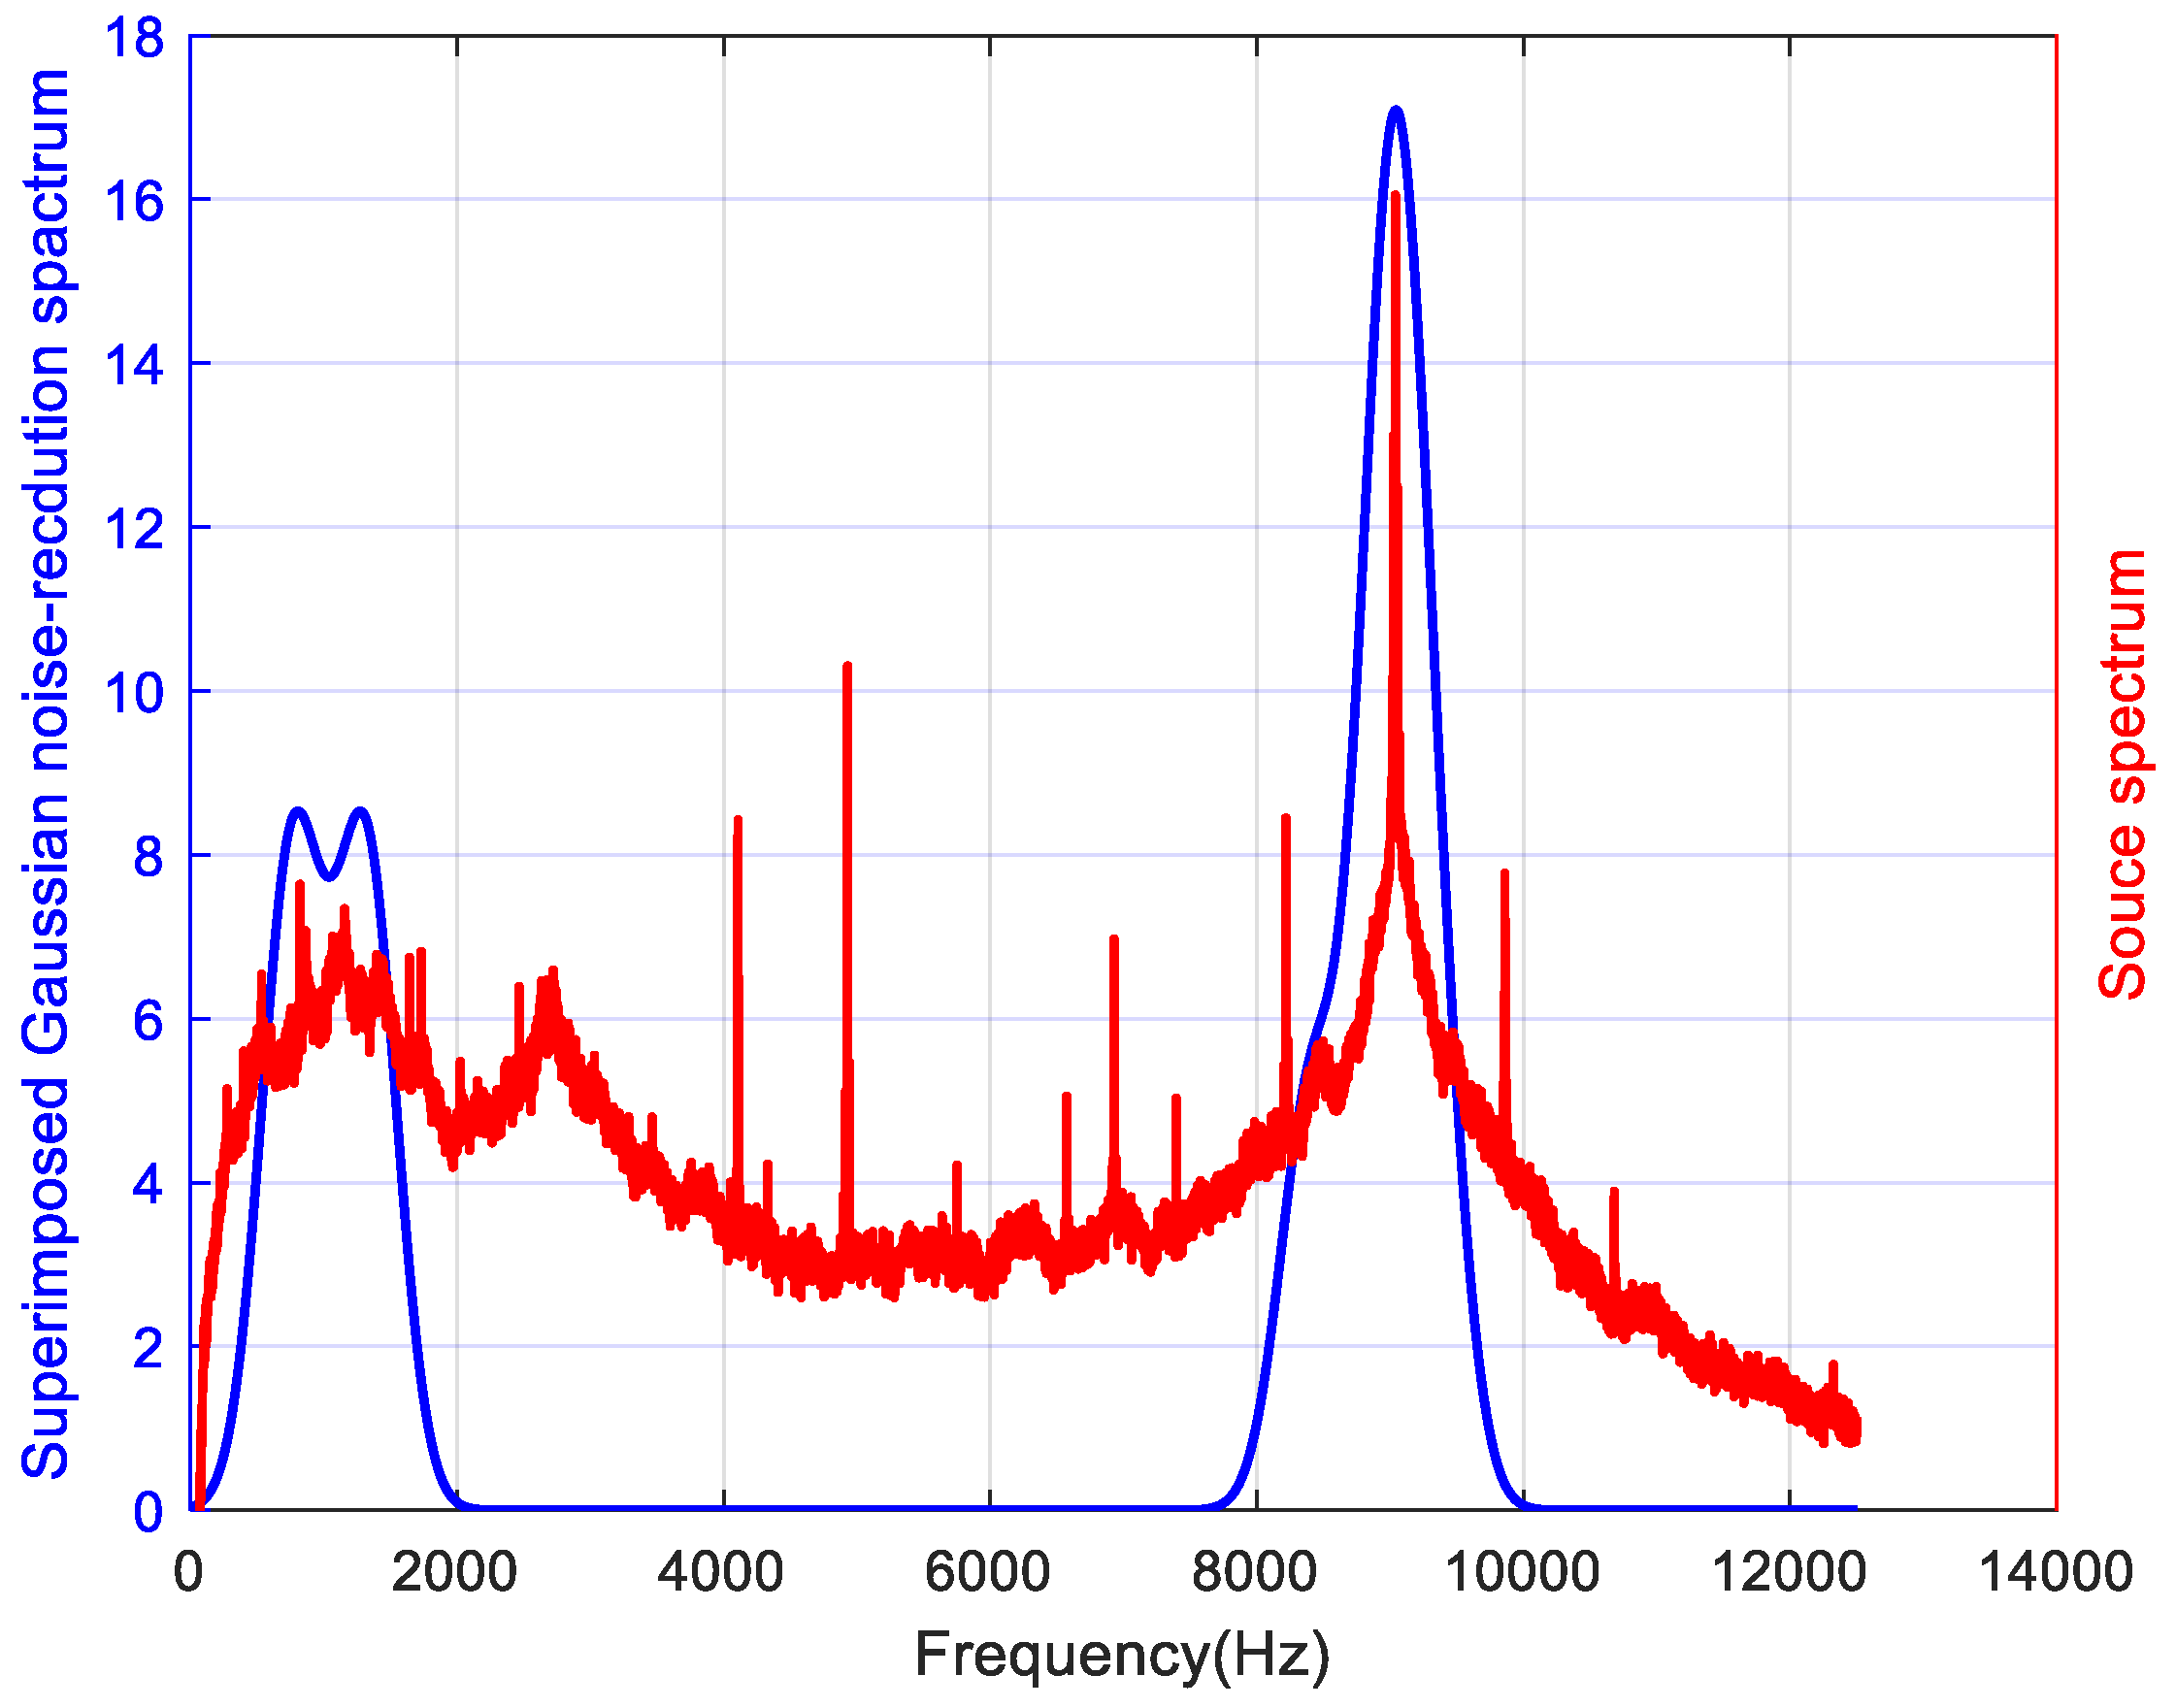
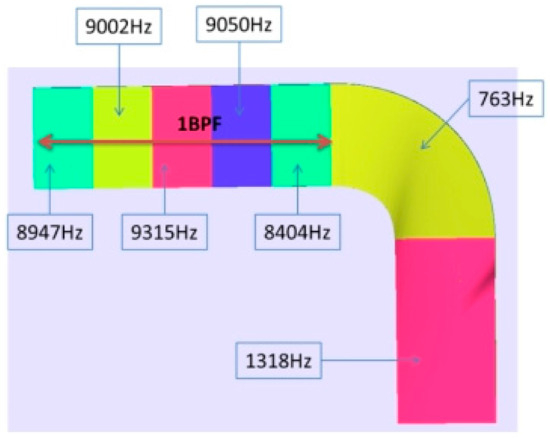
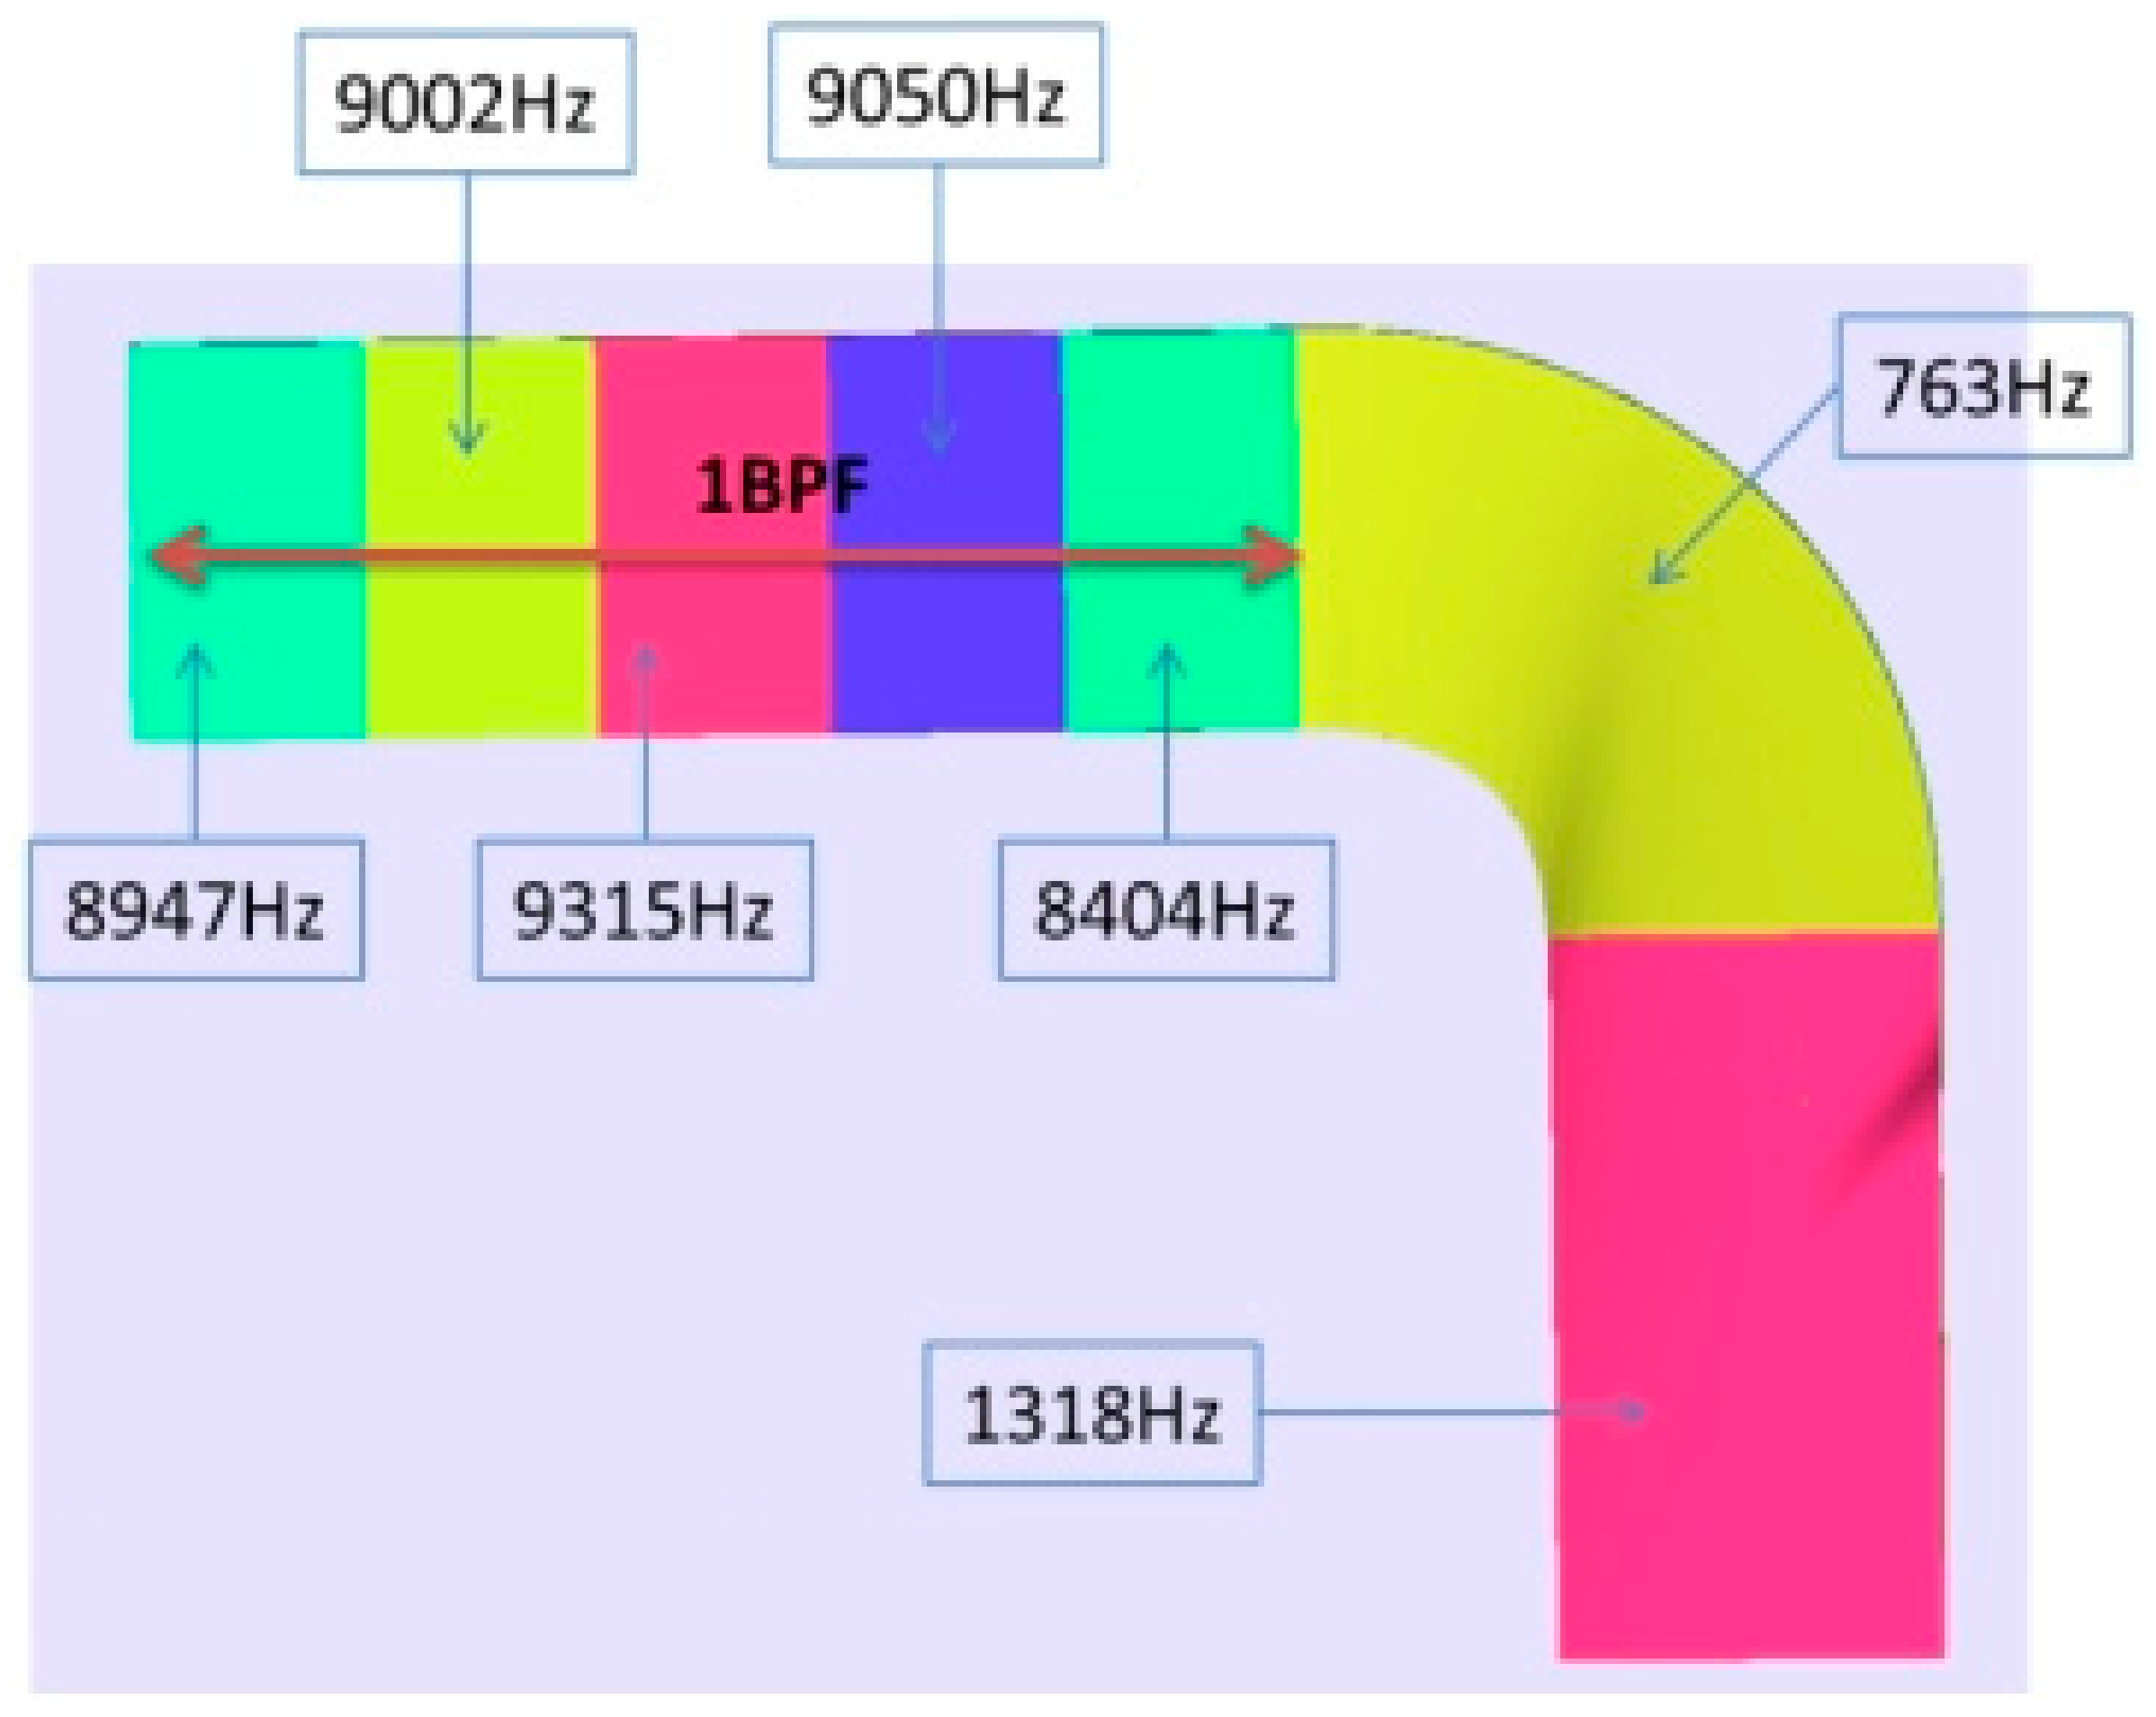
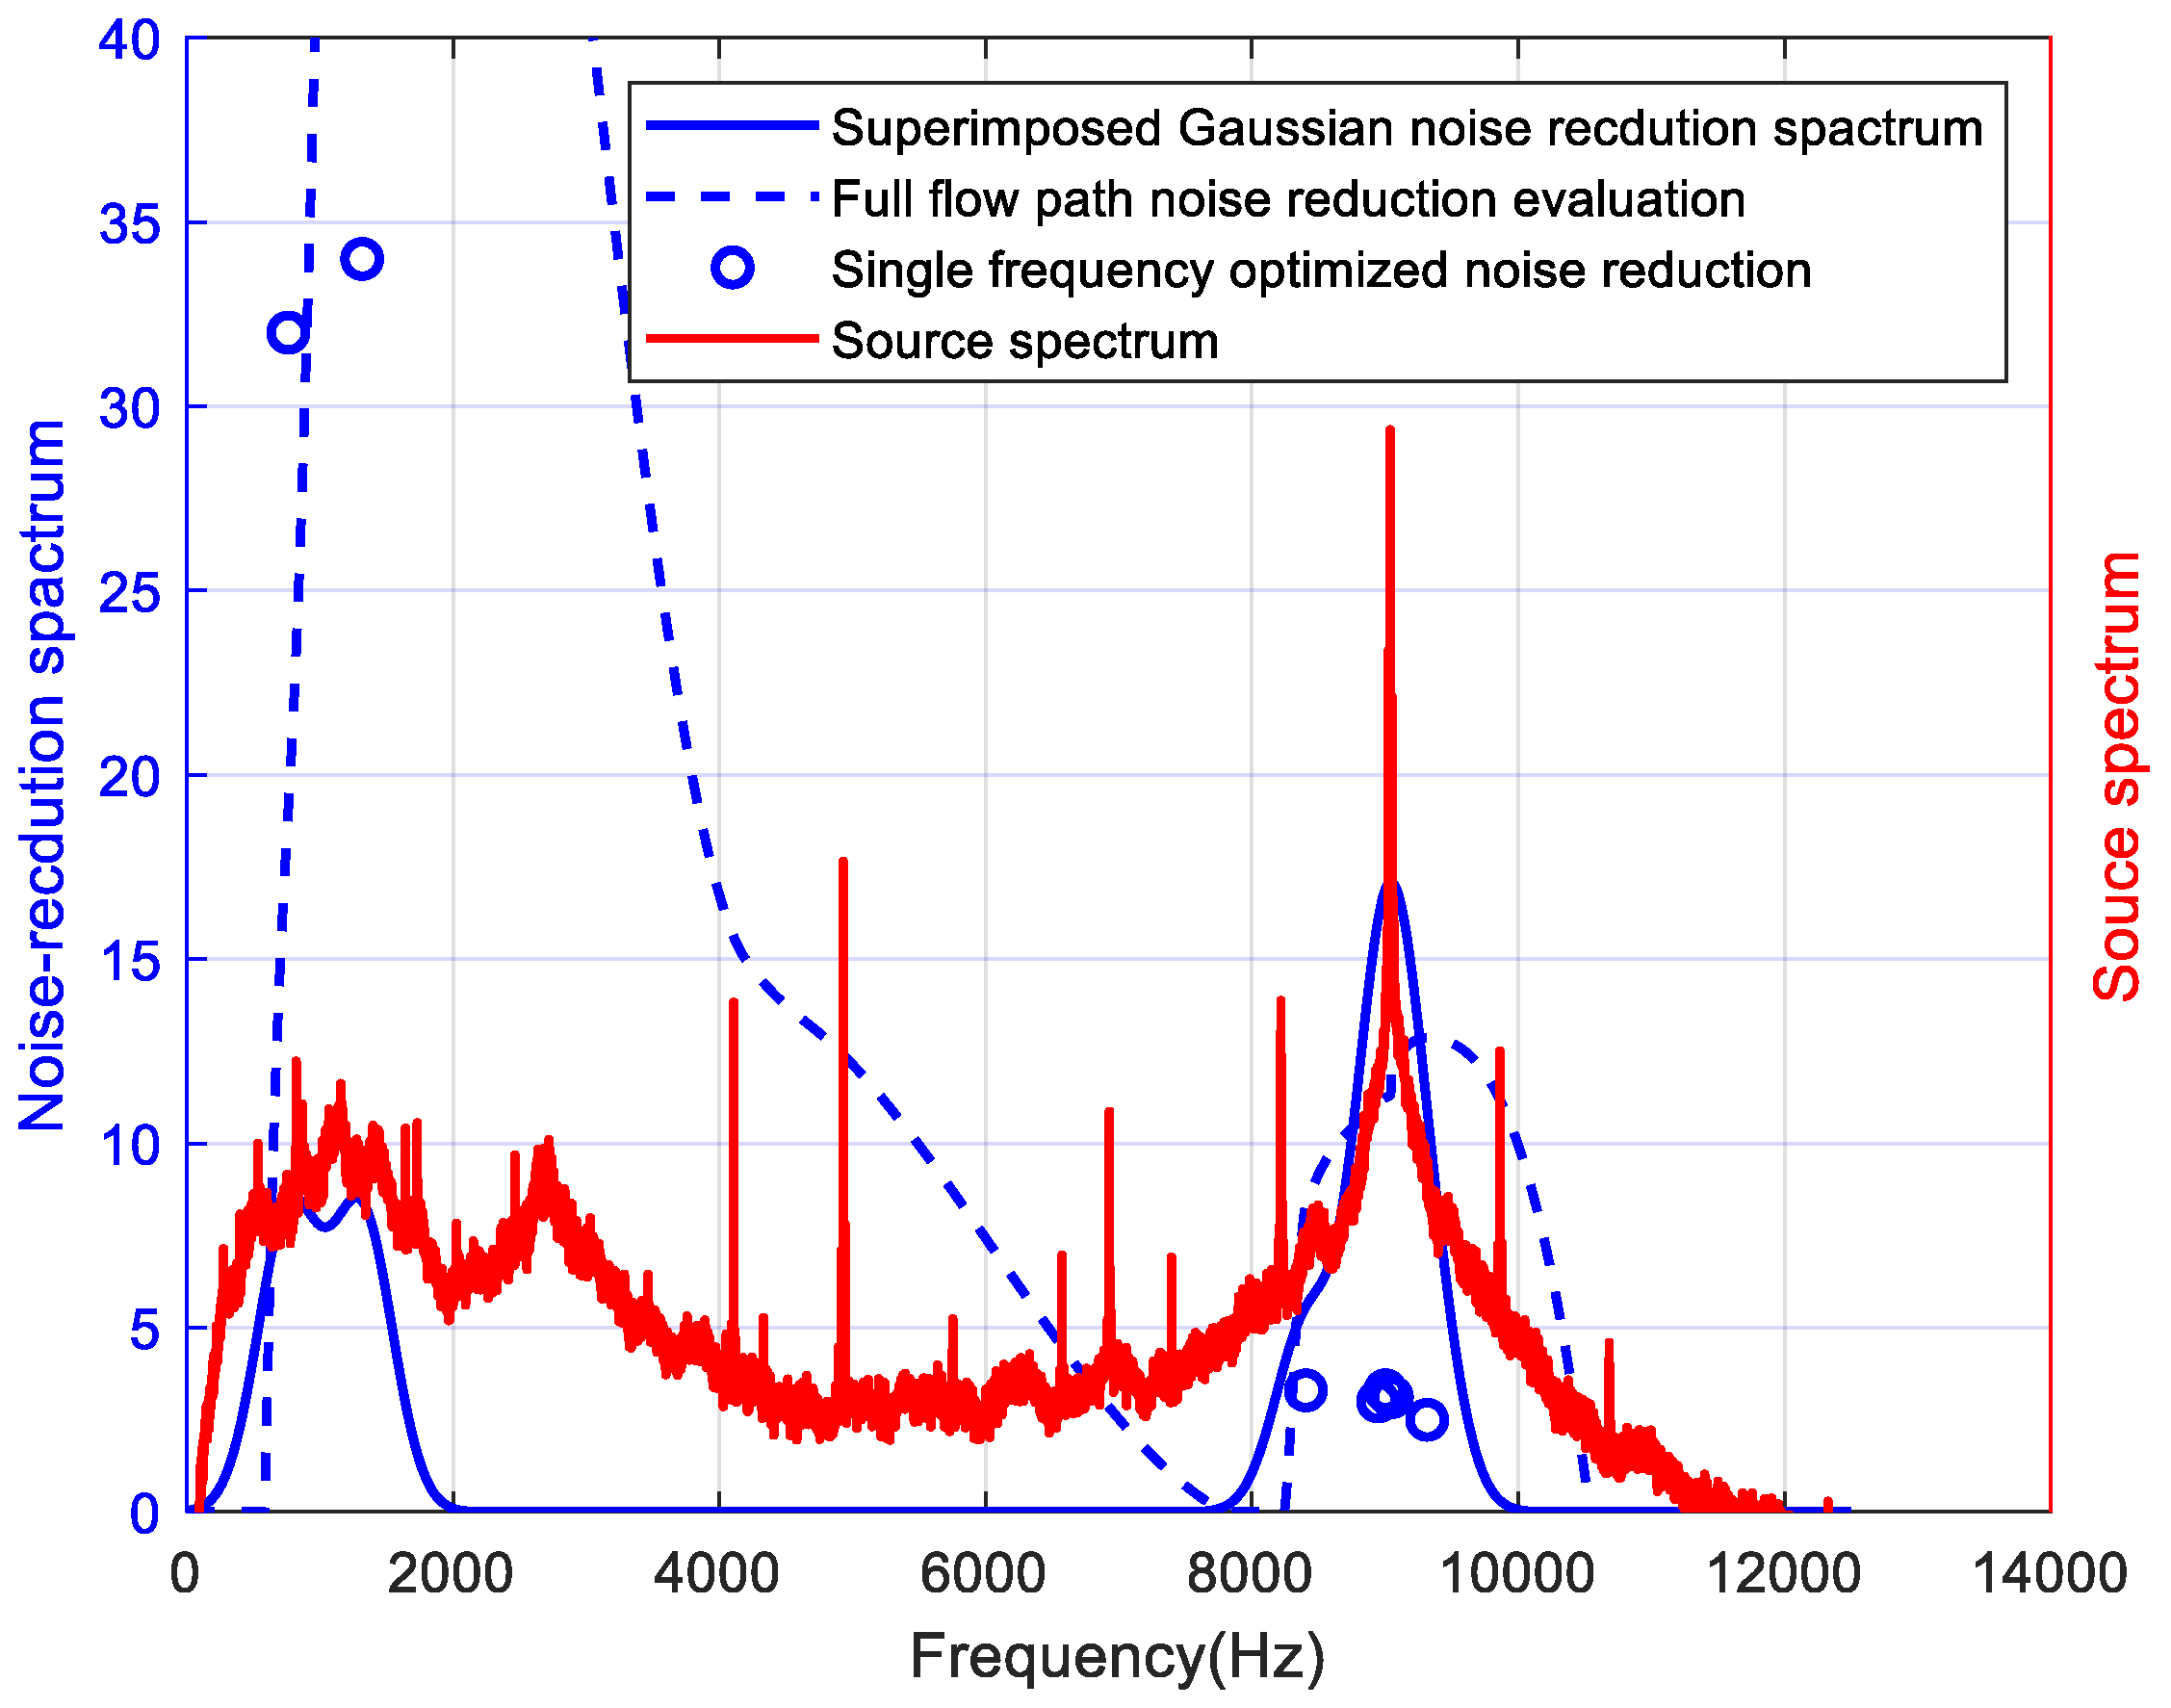
First, the noise-reduction center frequencies were optimized. Figure 7 presents the superimposed Gaussian noise-reduction spectra alongside the source spectrum. The optimized center frequencies are 8947 Hz, 9002 Hz, 9315 Hz, 9050 Hz, 8404 Hz, 763 Hz, and 1318 Hz. These frequencies do not exactly coincide with the first blade-passing frequency or the shock-noise frequencies. The primary reason is that the optimization objective is to maximize the reduction in the overall sound power level. Among them, five frequencies are located near the compressor’s first blade-passing frequency. The summation of their corresponding Gaussian functions ensures the attenuation of the tonal peak at that specific frequency while also effectively reducing the surrounding spectral hump. The remaining two noise-reduction frequencies are concentrated in the low-frequency range. The source spectrum exhibits a spectral hump around 1000 Hz; reducing the sound pressure level in this region contributes effectively to the overall noise reduction.
Figure 7.
The superimposed Gaussian noise-reduction spectra alongside the source spectrum.
Next, the structural parameters of the acoustic liner were optimized for each segment, with the objective of maximizing noise reduction at its assigned target frequency. The muffler was divided along with the flow direction into regions corresponding to these seven target frequencies, as shown in Figure 8. The regions responsible for attenuating high-frequency noise are located in the straight section of the muffler, while those for low-frequency noise are placed in the bent section. For sound-absorbing structures that do not contain any materials similar to acoustic foam, high-frequency noise reduction is a challenge. Here, the high-frequency sound-absorbing section is positioned downstream in the sound propagation path, with the aim of utilizing all the curved sections along the propagation path to induce scattering of high-frequency acoustic modes. This scatters lower-order acoustic modes into higher-order ones, thereby reducing high-frequency noise.
Figure 8.
Division of noise reduction frequencies corresponding to each muffler section.
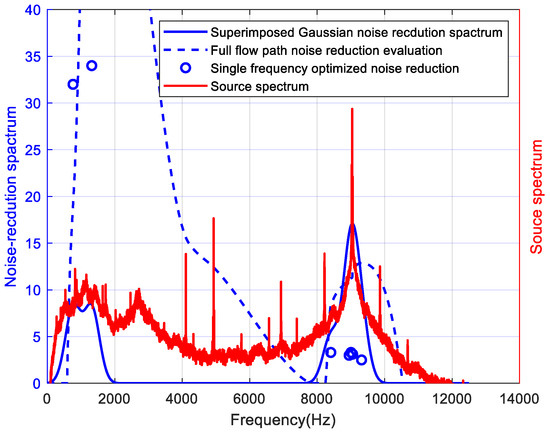
Finally, the overall silencing performance of the full-flow-path APU inlet was evaluated. The optimized structural parameters were applied to their corresponding regions within the inlet. Using the tested source spectrum as input, the radiated sound power of the muffler at each frequency was calculated and compared with that of a rigid-wall dummy under identical operating conditions. The resulting noise-reduction spectrum is shown in Figure 9. A pronounced reduction peak is observed at the first blade-passing frequency, with significant attenuation also achieved in the low-frequency range. The superior low-frequency reduction is likely attributable to sound wave reflection and modal scattering induced by the inlet bend, which favors lower-frequency attenuation. The design yields a total sound power level reduction of 9 dB. Figure 9 also displays the superimposed Gaussian noise-reduction curves obtained from the frequency optimization, along with the peak reduction achieved by each individually optimized segment.
Figure 9.
Designed noise reduction spectrum.
The noise reduction achieved for an individual segment at its target frequency is lower than the overall attenuation obtained from the full-flow-path assessment. This observation confirms the earlier prediction that acoustic modal scattering and reflection, caused by the impedance steps between adjacent segments, enhance the overall silencing performance. Furthermore, compared to the noise reduction assumed for each frequency band during the frequency optimization process, the full-flow-path results show a significant improvement in the low-frequency range (around 1000 Hz) but a notable reduction at high frequencies (around 9000 Hz). This discrepancy can be attributed to two main factors: first, inaccuracies in predicting the attenuation performance of each individual segment at its designated frequency; and second, the neglect of the specific spatial layout of the segments responsible for different frequencies along the flow path. Consequently, the actual interaction between the acoustic field and the segmented liner structure in the full-flow-path model yields a different net effect than the simple sum of the individual, isolated segment performances. This finding underscores the importance of the final full-passage validation in the proposed design workflow. We have proposed the hypothesis of acoustic mode scattering here, without conducting a quantitative analysis of the distribution and variation in acoustic modes within the inlet. This should be addressed in future research.
4. Experimental Validation
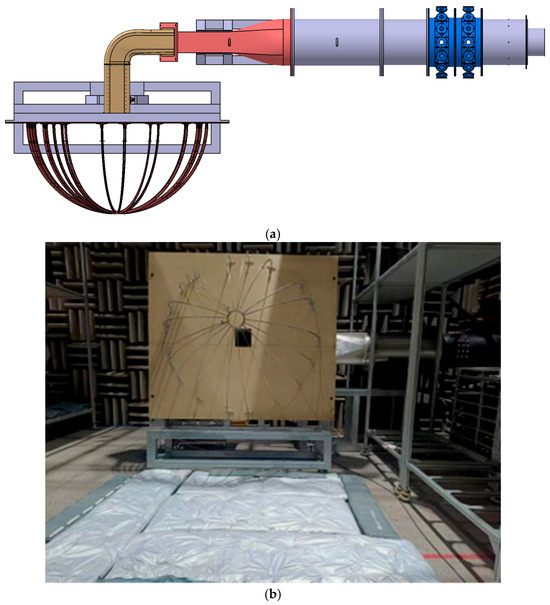
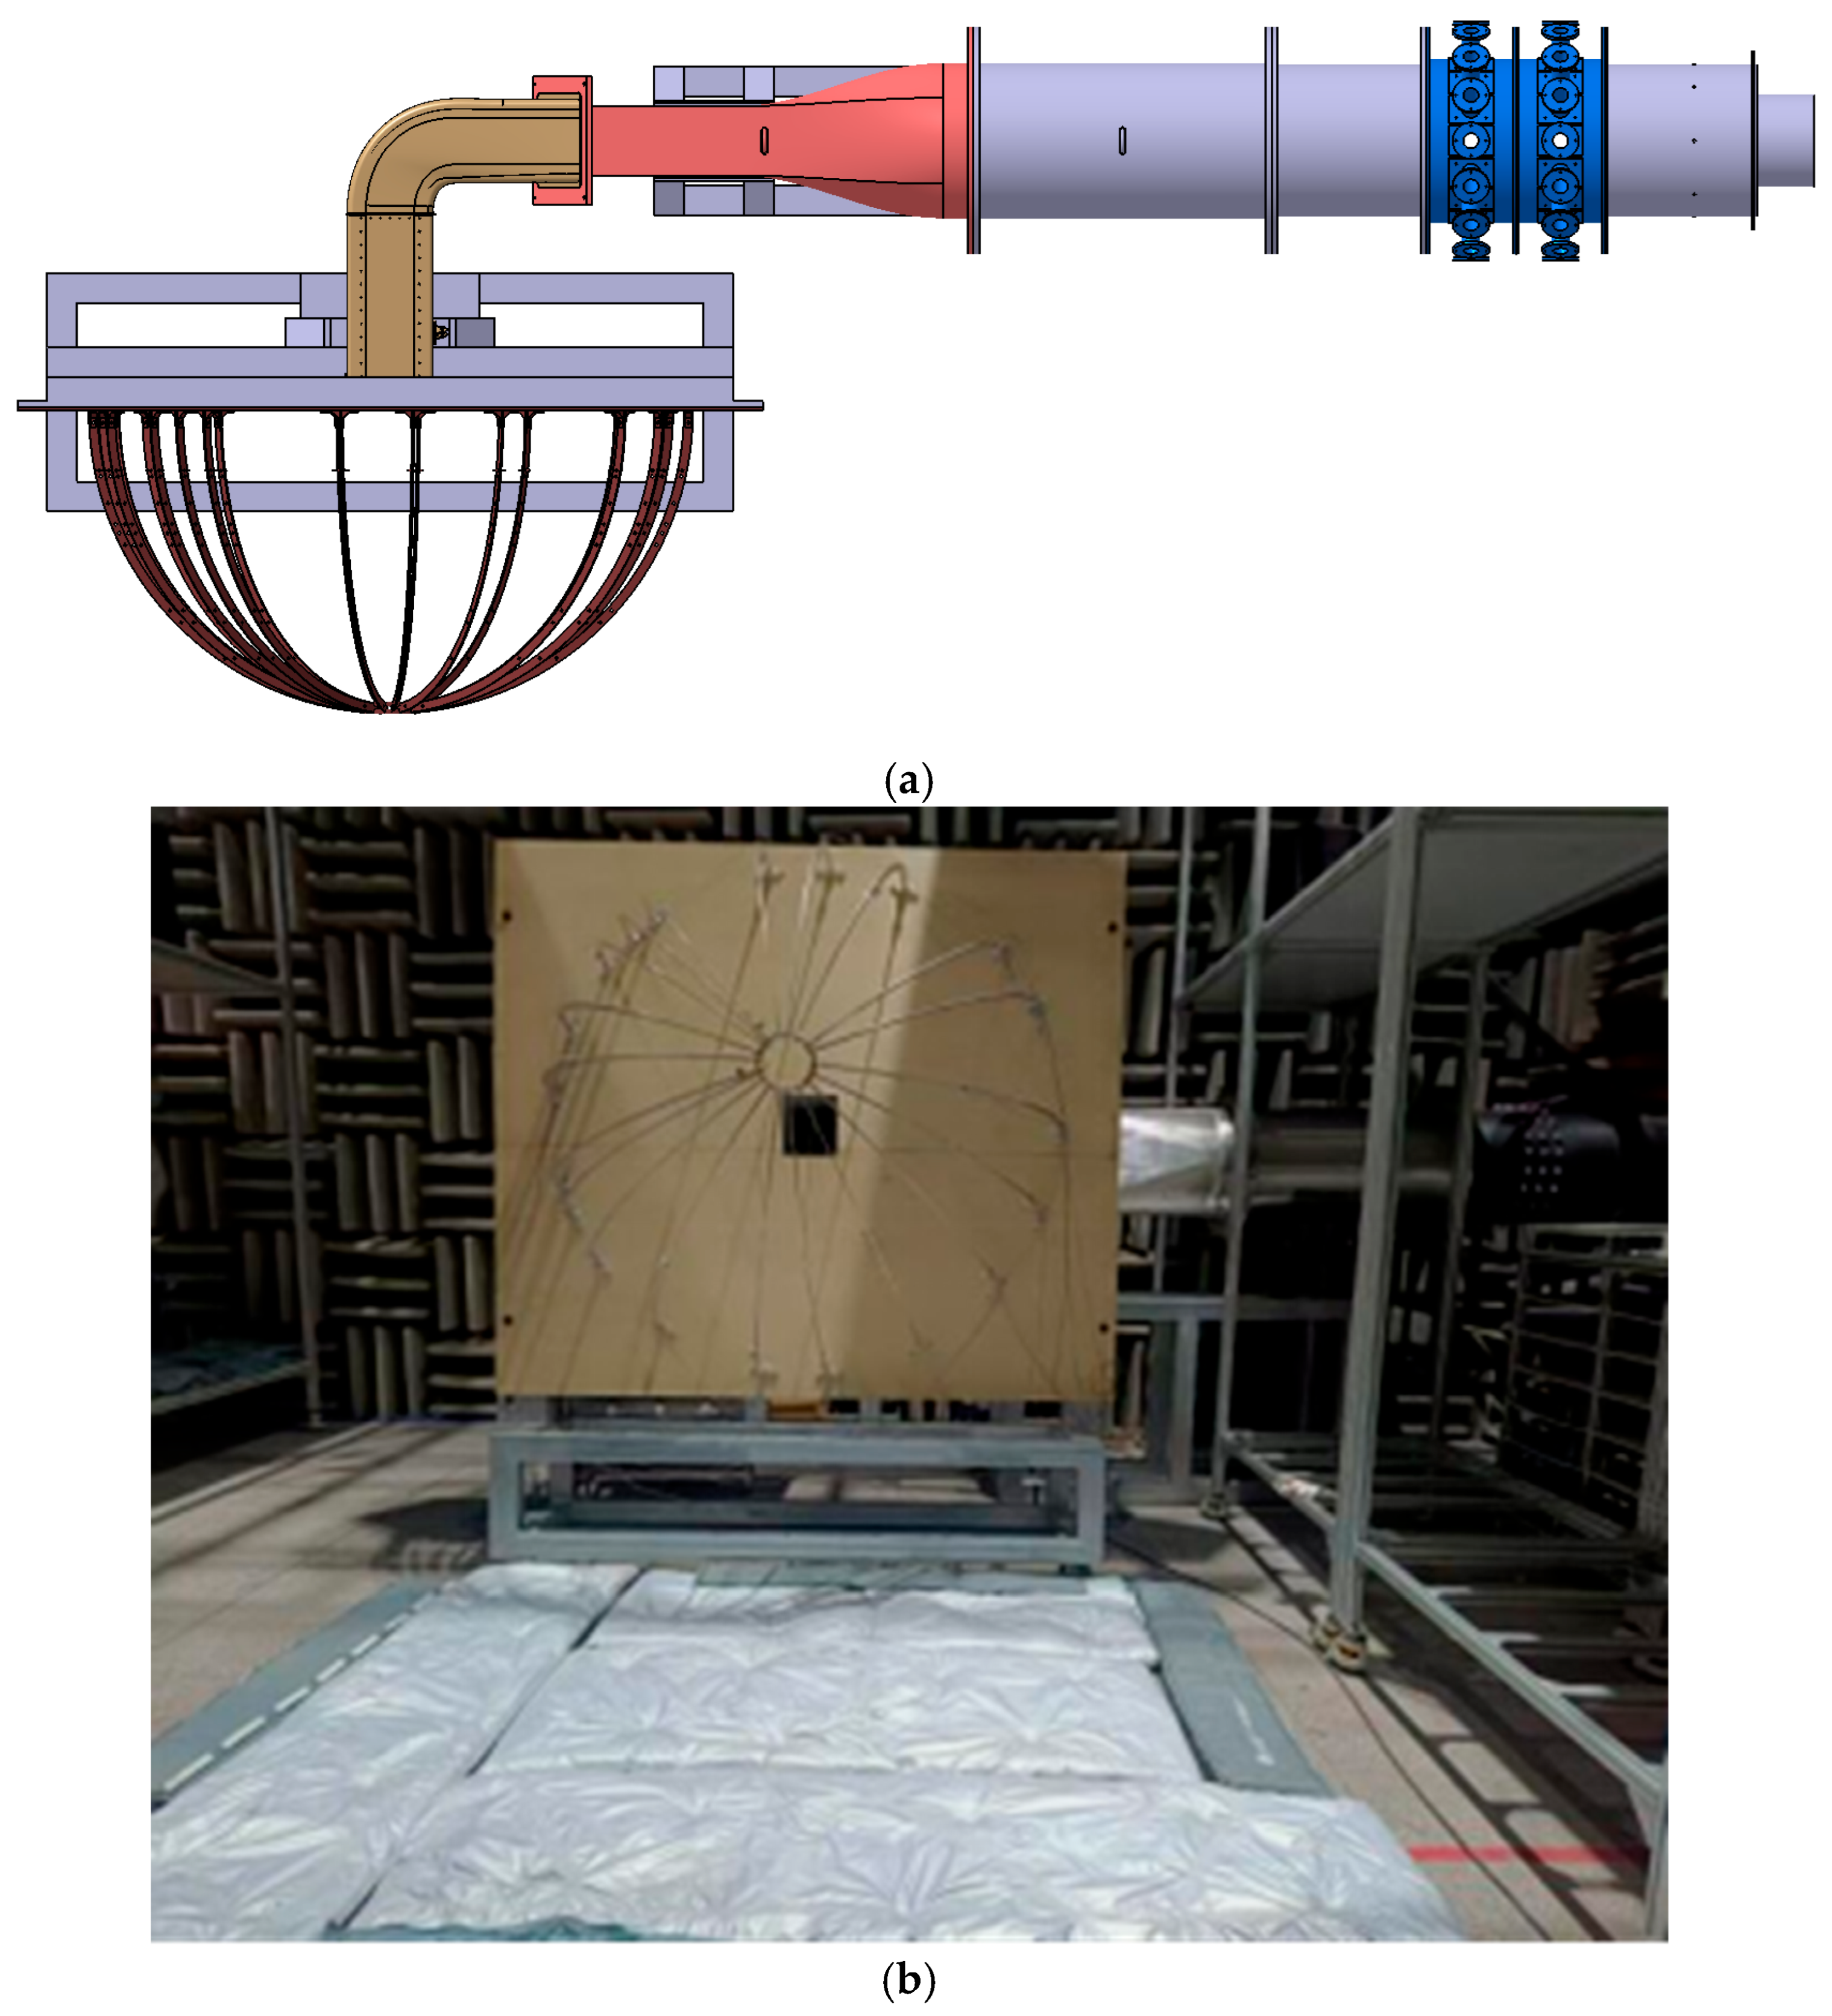
The noise reduction performance of the muffler was evaluated by comparing the radiated sound power measured at the muffler inlet with that measured when using a rigid-wall dummy element. The test setup, shown in Figure 10a, consisted of an aspirated Roots blower, a sound source section, a transition section, the test muffler (or its dummy counterpart), and a sound power measurement section. The sound power measurements were conducted in a semi-anechoic chamber, while the aspirated Roots blower was placed in a separate room to isolate its noise. Measurements followed the ISO 3741 semi-free-field method, utilizing 20 microphones arranged on a hemispherical measurement surface with a 1 m radius [18]. As shown in Figure 10b, acoustic absorptive material was placed over key areas of the floor to minimize the influence of floor reflections.
Figure 10.
Test setup for evaluating the noise reduction performance of the APU inlet muffler. (a) Test setup configuration and layout. (b) Photographs of the actual setup.
The sound source comprised multiple loudspeakers and signal generators positioned near the air supply. The sound in the inlet duct passed through a duct that transitions the flow path cross-section from circular to rectangular before entering the inlet muffler. Generating and characterizing the detailed acoustic field inside the duct was challenging, as noise up to 10,000 Hz excites over 100 cut-on acoustic modes. Therefore, in this test, only the frequency and amplitude of the input noise were controlled. Therefore, the loudspeaker-generated acoustic field does not precisely replicate the complex multi-modal composition of the actual APU source measured in Section 2.1. The test primarily validates the muffler’s insertion loss for a representative, high-amplitude incident field. The agreement between prediction and experiment for the dominant BPF tone suggests that the design method is effective for the target tonal noise, but performance for a fully representative modal distribution warrants further investigation.
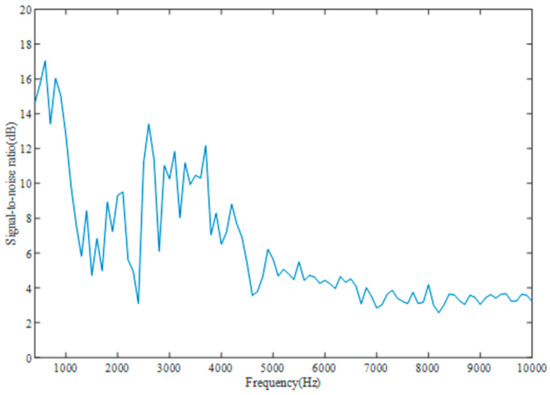
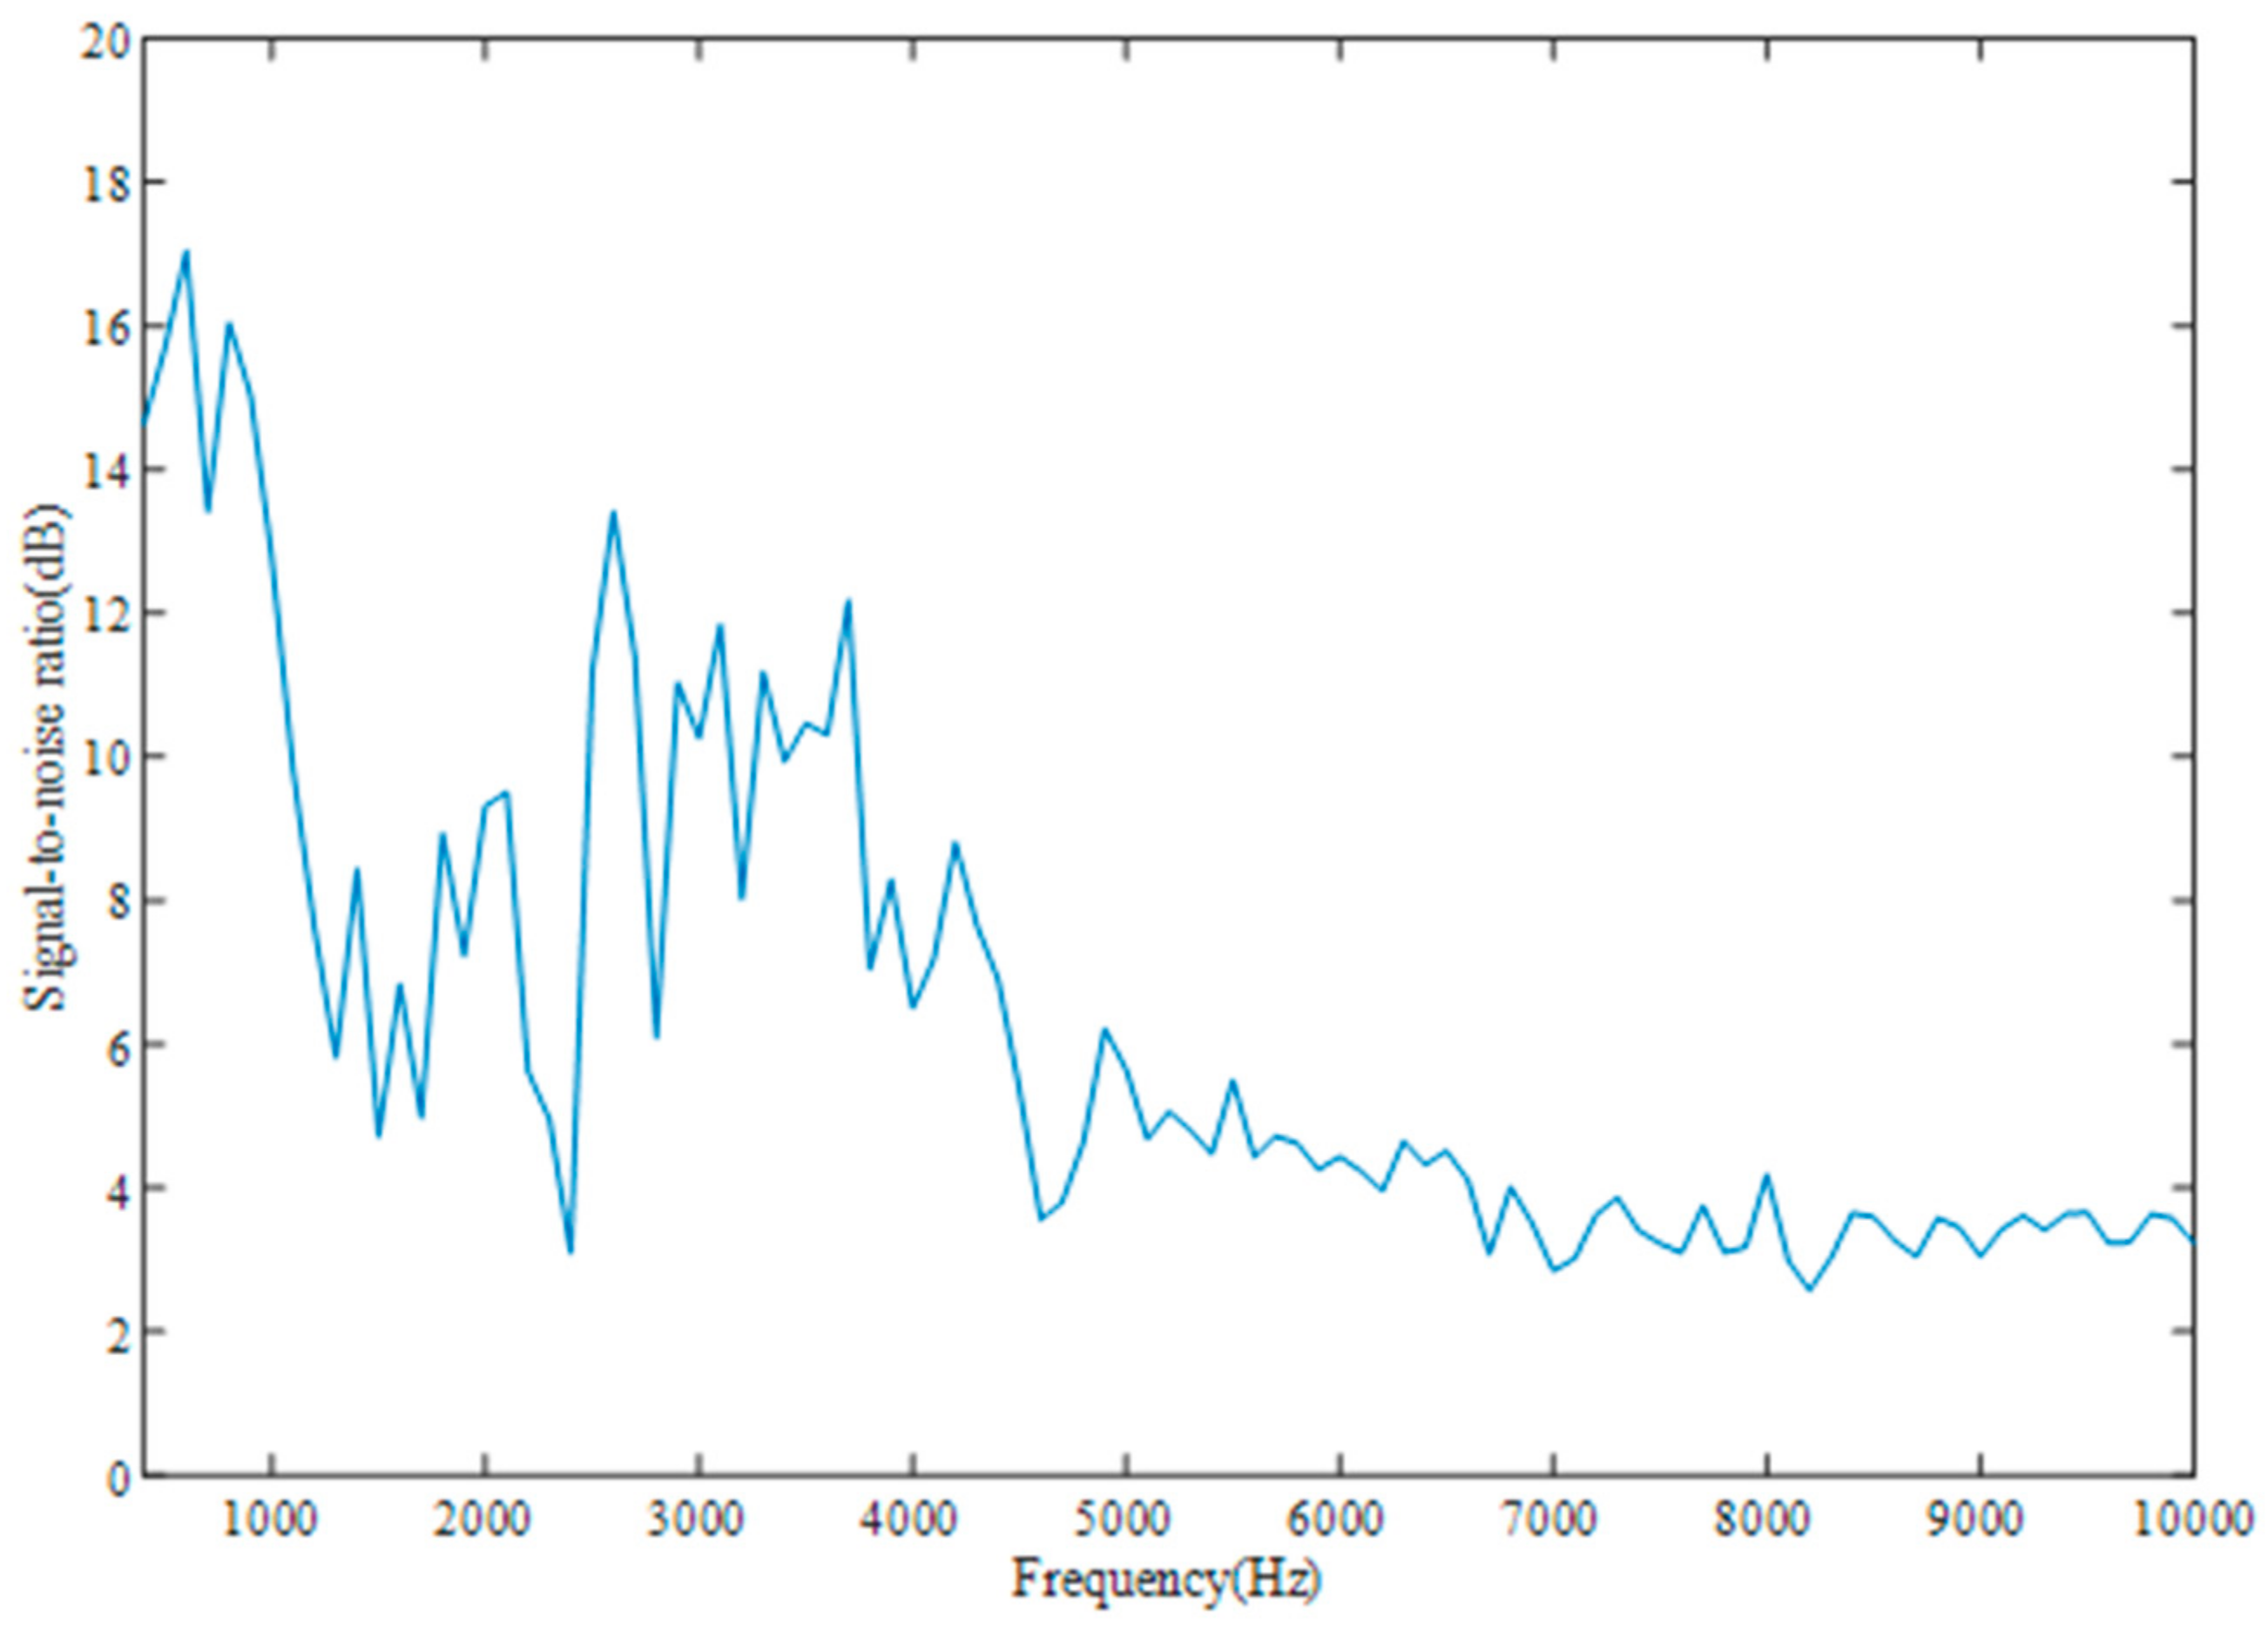
The radiated sound power at the inlet was measured sequentially via a frequency sweep for configurations both with the inlet muffler and with the dummy element. Since the aspirated Roots blower itself generates a certain level of background noise, the signal-to-noise ratio (SNR) of the source had to be sufficiently high. Figure 11 shows the frequency-resolved SNR spectrum of the test setup with the muffler installed. Evidently, even at the “Max ECS”, the SNR exceeds 3 dB across the frequency range, confirming that the source met the test requirements.
Figure 11.
The frequency-resolved SNR spectrum of the test setup with the muffler installed.
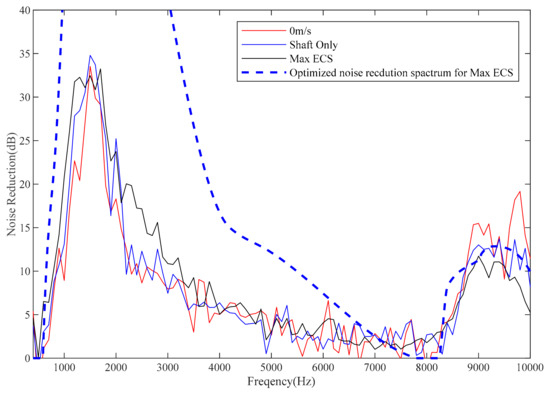
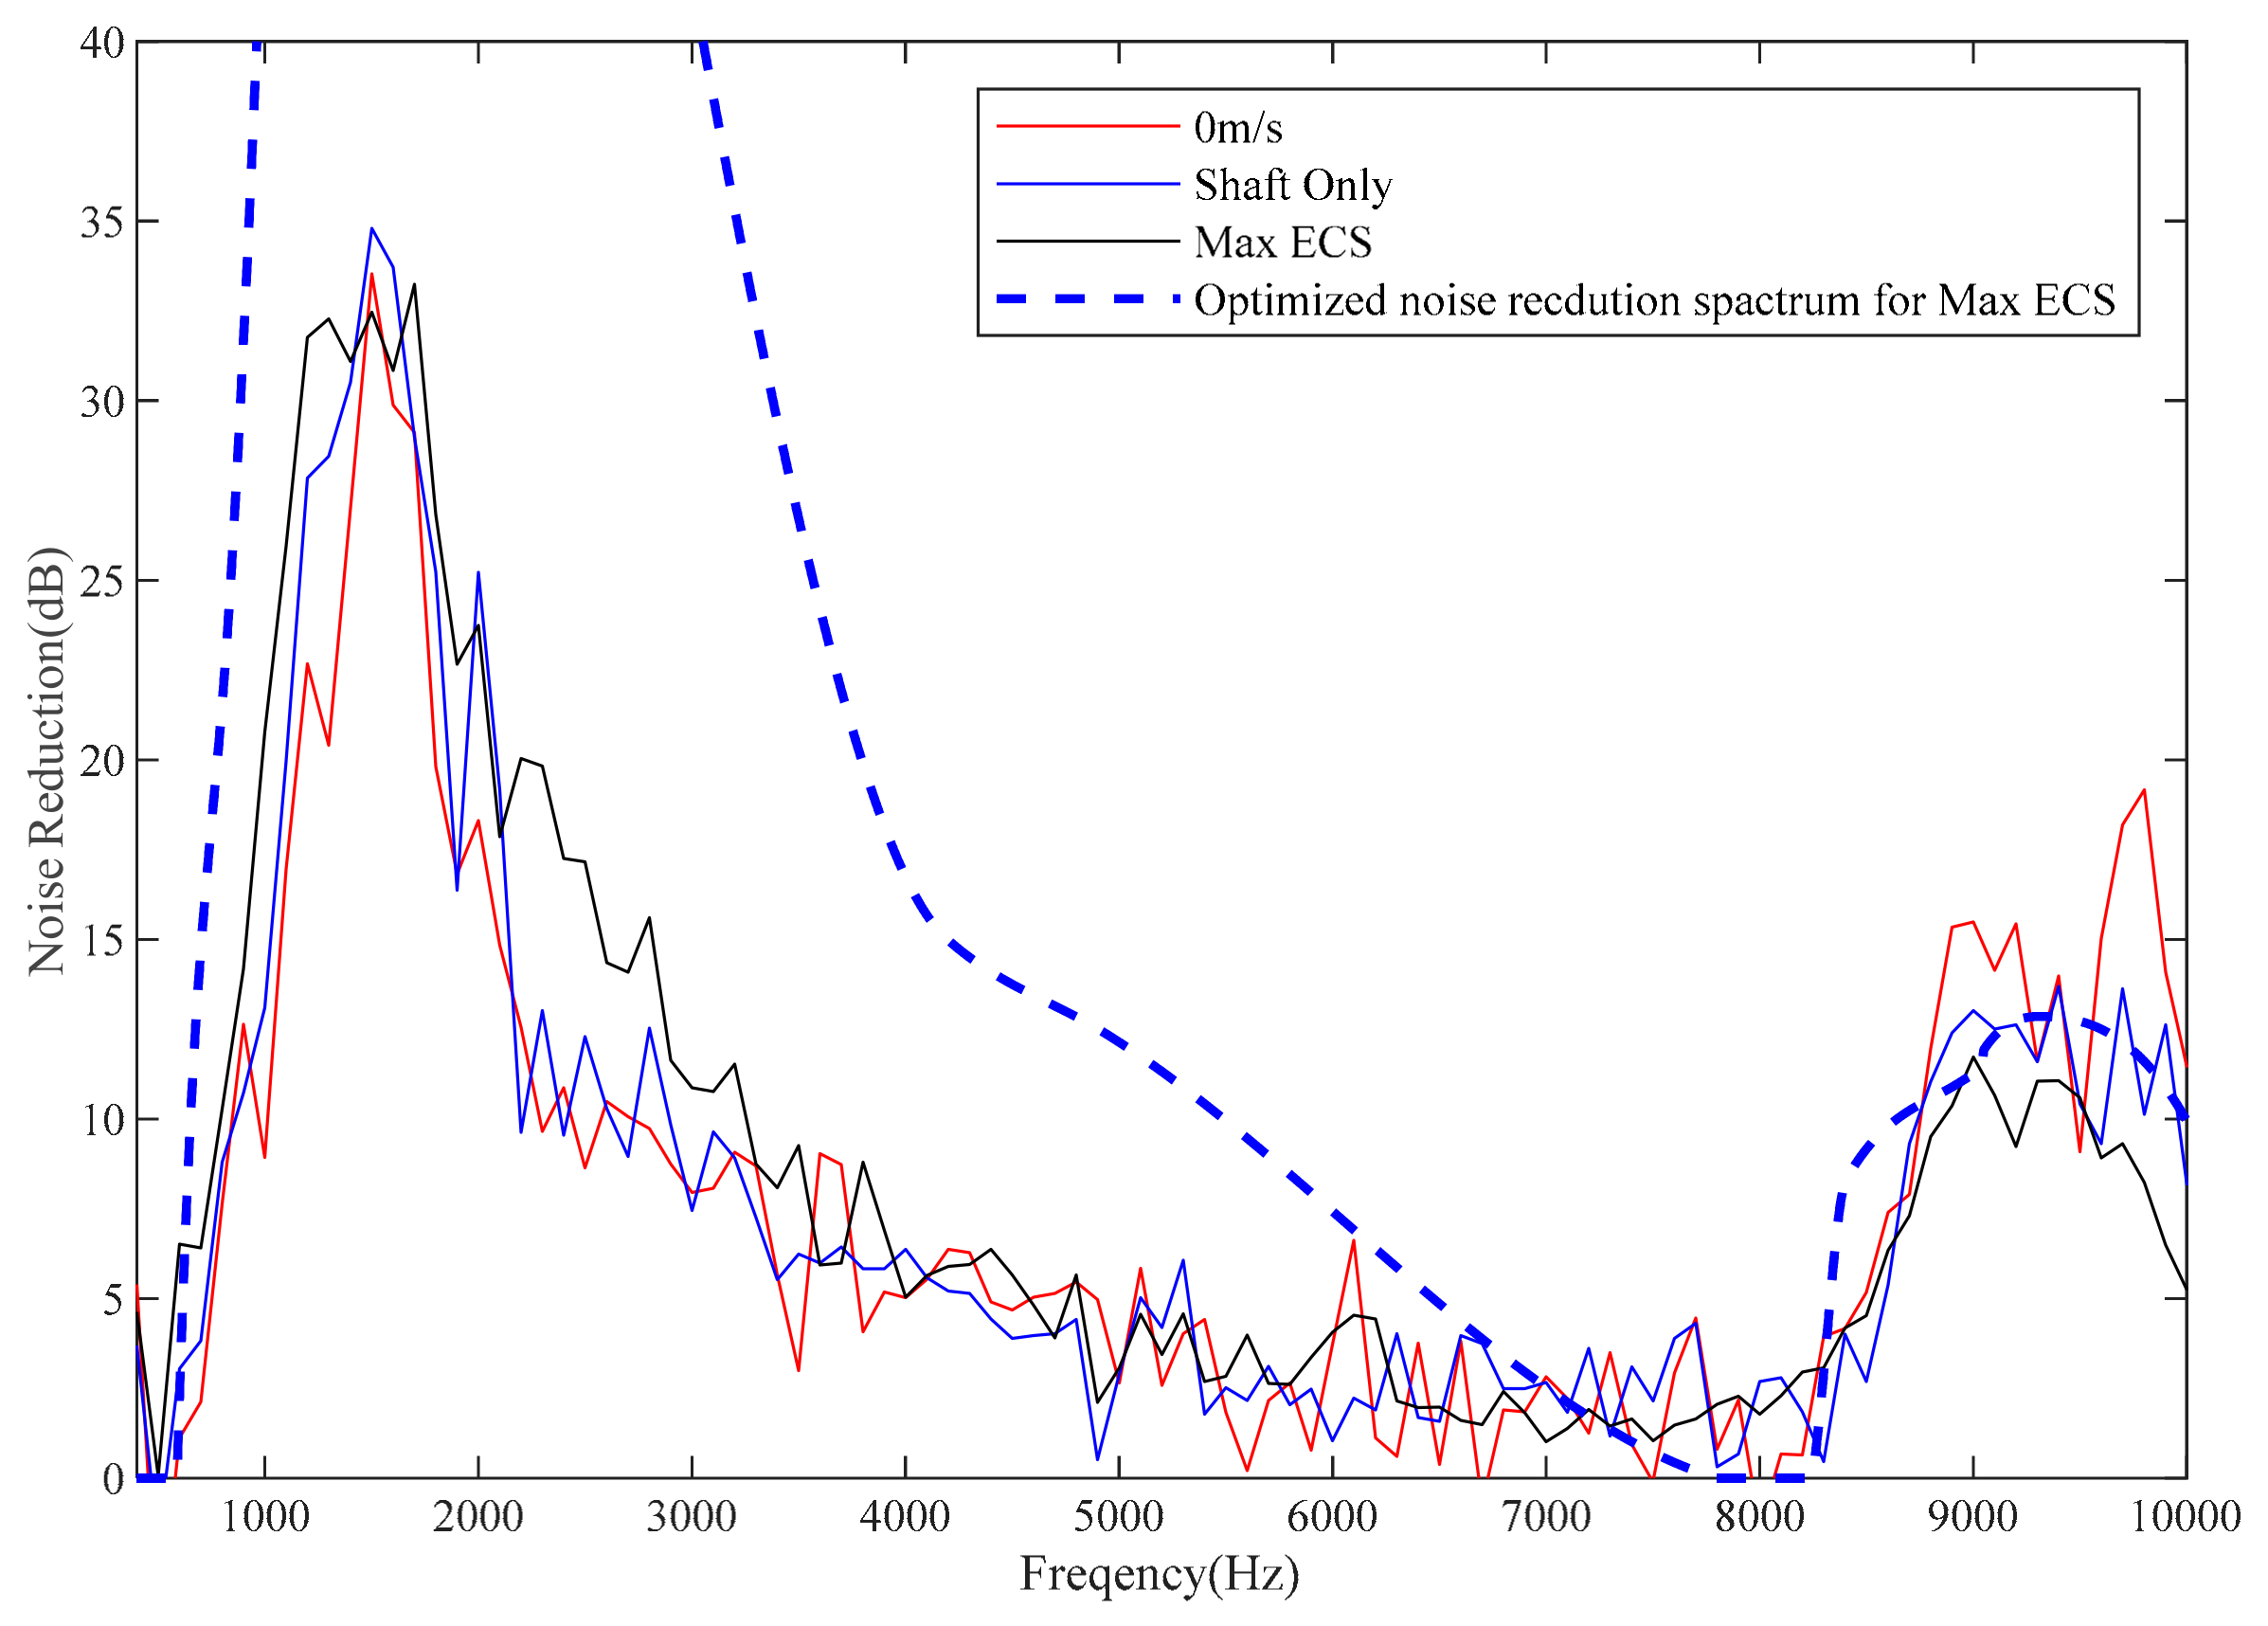
Figure 12 presents the experimentally measured noise reduction spectra of the inlet muffler under different flow velocities. The spectral trends are similar across all conditions. A primary noise reduction peak of approximately 35 dB occurs around 1600 Hz. A second, distinct peak appears near the first blade-passing frequency (around 9000 Hz), providing about 15 dB of attenuation. Under the no-flow condition, the muffler exhibits higher noise reduction at high frequencies. In the “Shaft Only” condition, the low-frequency reduction peak is more pronounced. The “Max ECS” condition results in a broader low-frequency attenuation band, showing better performance in the 2000–3000 Hz range. By combining these results with the source spectrum, the overall reduction in sound power level was calculated. The results for different flow velocities are summarized in Table 1. Although the noise reduction spectra vary with flow velocity, the overall sound power level reduction values are similar across conditions.
Figure 12.
Noise reduction spectrum of the inlet muffler under different flow velocities.
Table 1.
Overall sound power level reduction in the inlet muffler under different flow velocities.
Figure 12 also compares the predicted noise reduction spectrum from the optimal design with the experimentally measured curve. The predicted and measured noise reduction center frequencies are in excellent agreement. The prediction for the reduction at the first blade-passing frequency is accurate, while the reduction peak centered around 1600 Hz is overestimated. The predicted noise reduction shows a peak of 60 dB around 1600 Hz, which clearly overestimates the noise reduction effect at that frequency. The main reason may be that the assumption about the sound source in the prediction does not match the experimental conditions. The prediction assumed that all acoustic modes within the cut-on range are of equal intensity, while the actual sound source is likely dominated by lower-order acoustic modes. Lower-order acoustic modes are less easily absorbed compared to higher-order ones. Of course, this explanation is hypothetical and requires further investigation through testing of acoustic modes to confirm the cause. Regarding the overall sound power level reduction, the predicted value matches the measured data with a deviation of only 0.1 dB.
5. Conclusions
This paper has presented a systematic and efficient design methodology for the inlet muffler of aircraft Auxiliary Power Units (APUs), addressing the significant computational challenge associated with high-frequency, full-flow-path acoustic optimization.
The key impediment to conventional design is the prohibitive computational cost. A full-passage, high-fidelity acoustic simulation across the target frequency range (20–10,000 Hz) requires approximately five days, rendering iterative optimization impractical. To overcome this, the core of the proposed methodology decomposes the problem through optimal frequency selection and axial segmentation. First, several critical noise-reduction center frequencies are selected from the measured source spectrum, which is dominated by the first blade-passing frequency (~9038 Hz) and shock noise components. The inlet duct is then divided axially into corresponding segments. This strategy offers a dual advantage: (1) it drastically reduces the computational domain for each sub-problem, cutting single-case simulation time to about ten minutes; and (2) it actively leverages the acoustic modal scattering induced by impedance steps between segments to enhance the overall attenuation, turning a practical constraint into a performance benefit.
The validity of this approach rests on two foundational validations conducted in parallel. First, the single-degree-of-freedom (SDOF) liner impedance model (Goodrich model) was experimentally validated up to 10,000 Hz, confirming its applicability beyond the traditional plane-wave limit and establishing a reliable link between structural parameters and acoustic performance for optimization. Second, the segmented design process was rigorously verified. The optimization successfully identified seven center frequencies (e.g., ~8947, 9002, 763, 1318 Hz) that maximized overall sound power level reduction rather than merely targeting tonal peaks. The final design was evaluated via a full-passage simulation, yielding a predicted total sound power level reduction of 9 dB.
Experimental validation under various flow conditions (“Shaft Only”, “Max ECS”, and no flow) confirmed the design’s effectiveness. The measured noise reduction spectrum showed good agreement with predictions, featuring a pronounced attenuation peak at the first blade-passing frequency (~15 dB) and significant low-frequency reduction. The overall A-weighted Sound Power Level (OASPL) reduction was approximately 9 dB across conditions, aligning well with the numerical prediction (within 0.1 dB). This close agreement between simulation and experiment underscores the reliability of the integrated design and analysis workflow.
In summary, this work demonstrates a rapid and precise design framework for APU inlet mufflers. By transforming a computationally intractable full-scale optimization into a series of manageable, targeted segment designs while intelligently utilizing wave scattering effects, the method achieves substantial noise reduction with high computational efficiency. The successful experimental validation confirms the feasibility and robustness of the proposed approach. Future work may focus on conducting design based on detailed acoustic modal information of the source once it becomes reliably measurable and analyzing the propagation distribution of acoustic modes along the inlet.
Author Contributions
Conceptualization, D.X. and Q.Y.; methodology, D.X.; validation, Y.Z., J.Y. and D.X.; formal analysis, Y.C.; data curation, Y.Z.; writing—original draft preparation, D.X.; writing—review and editing, D.X.; visualization, D.X.; project administration, Y.C.; funding acquisition, Q.Y. All authors have read and agreed to the published version of the manuscript.
Funding
This research was funded by Shaanxi Province’s Two Chains Integration Project, grant number 2023-LL-QY-38.
Data Availability Statement
The experimental data presented in this study are available upon request from the corresponding author due to ongoing research.
Conflicts of Interest
The authors declare no conflicts of interest.
References
- Tam, C.; Pastouchenko, N.; Mendoza, J.; Brown, D. Combustion noise of auxiliary power units. In Proceedings of the 11th AIAA/CEAS Aeroacoustics Conference, Monterey, CA, USA, 23–25 May 2005; p. 2829. [Google Scholar]
- Tam, C.; Parrish, S.; Xu, J.; Schuster, B. Indirect combustion noise of auxiliary power units. J. Sound Vib. 2013, 332, 4004–4020. [Google Scholar] [CrossRef] [Scilit]
- Pott-Pollenske, M.; Dobrzynski, W.; Buchholz, H.; Almoneit, D. Characteristics of noise from aircraft ground operations. In Proceedings of the 13th AIAA/CEAS Aeroacoustics Conference, Rome Italy, 21–23 May 2007; p. 3560. [Google Scholar]
- Zlavog, G.; Breard, C.; Diamond, J. Nonlocally reacting liner modelling and validation. In Proceedings of the 15th AIAA/CEAS Aeroacoustics Conference, Miami, FL, USA, 11–13 May 2009; p. 3111. [Google Scholar]
- Lavieille, M.; Brown, D.; Vieuille, F. Numerical modeling and experimental validation of the acoustic efficiency of treated ducts on an aircraft auxiliary power system. In Proceedings of the 32th AIAA/CEAS Aeroacoustics Conference, Portland, OR, USA, 5–8 June 2011; p. 2810. [Google Scholar]
- Knobloch, K.; Fischer, A.; Bake, F.; Enghardt, L.; Busse-Gerstengarbe, S. Full-scale tests on APU noise reduction. In Proceedings of the ASME Turbo Expo 2014, Düsseldorf, Germany, 16–20 June 2014; p. 26803. [Google Scholar]
- Karsten, K.; Enghardt, L.; Friedrich, B. APU-Noise reduction by novel muffler concepts. In Proceedings of the ASME Turbo Expo 2018, Oslo, Norway, 11–15 June 2018; p. 76762. [Google Scholar]
- Li, X.Y.; Li, X.D.; Thiele, F. Frequency-domain prediction of sound propagation through axisymmetric flow ducts. In Proceedings of the 14th International Congress on Sound and Vibration, Cairns, Australia, 9–12 July 2007. [Google Scholar]
- Ingard, U. Influence of fluid motion past a plane boundary on sound reflection, absorption, and transmission. J. Acoust. Soc. Am. 1959, 31, 1035–1036. [Google Scholar] [CrossRef] [Scilit]
- Yu, J.; Ruiz, M.; Kwan, H.W. Validation of Goodrich perforate liner impedance model using NASA Langley test data. In Proceedings of the 29th AIAA Aeroacoustics Conference, Vancouver, BC, Canada, 5–7 May 2008; p. 2930. [Google Scholar]
- Lan, J.H.; Breard, C. Validation of 3D acoustic propagation code with analytical and experimental results. In Proceedings of the 11th AIAA/CEAS Aeroacoustics Conference, Monterey, CA, USA, 23–25 May 2005; p. 2901. [Google Scholar]
- Watson, W.R. A New Method for Determining Acousticliner Admittance in a Rectangular Duct with Grazing Flow from Experimental Data; NASA-TP-2310; NASA: Washington, DC, USA, 1984. [Google Scholar]
- Jing, X.D.; Peng, S.; Sun, X.F. A straightforward method for wall impedance eduction in a flow duct. J. Acoust. Soc. Am. 2008, 124, 227–234. [Google Scholar] [CrossRef] [Scilit] [PubMed]
- Yan, Q.; Xue, D.; Mu, Q.; Yang, J.; Gao, X.; Huang, W. Acoustic Experimental Technology for Aircraft Nacelle Liner. Aerospace 2023, 10, 56. [Google Scholar] [CrossRef] [Scilit]
- Yang, J.; Yan, Q.; Wei, K.; Xue, D.; Chen, Y. Experiment on broadband acoustic performance of aeronautical acoustic liners under grazing flow. Acta Aeronaut. Astronaut. Sin. 2025, 46, 132033. (In Chinese) [Google Scholar] [CrossRef]
- Chen, L.F.; Du, L.; Wang, X.Y.; Jing, X.; Sun, X. A threedimensional straightforward method for liner impedance eduction in uniform grazing flow. J. Sound Vib. 2020, 468, 115119. [Google Scholar] [CrossRef] [Scilit]
- Myers, M.K. On the acoustic boundary condition in the presence of flow. J. Sound Vib. 1980, 71, 429–434. [Google Scholar] [CrossRef] [Scilit]
- ISO 3741:2010; Acoustics—Determination of Sound Power Levels and Sound Energy Levels of Noise Sources Using Sound Pressure—Precision Methods for Reverberation Test Rooms. ISO: Geneva, Switzerland, 2010.

Disclaimer/Publisher’s Note: The statements, opinions and data contained in all publications are solely those of the individual author(s) and contributor(s) and not of MDPI and/or the editor(s). MDPI and/or the editor(s) disclaim responsibility for any injury to people or property resulting from any ideas, methods, instructions or products referred to in the content. |
© 2026 by the authors. Licensee MDPI, Basel, Switzerland. This article is an open access article distributed under the terms and conditions of the Creative Commons Attribution (CC BY) license.